Article

Differentiation of Six Grassland/Forage Types in Three Canadian Ecoregions Based on Spectral Characteristics

1
Department of Geography and Planning, University of Saskatchewan, Saskatoon, SK S7N 5C8, Canada
2
Agriculture and Agri-Food Canada, Lethbridge Research and Development Centre, Lethbridge, AB T1J 4B1, Canada
3
Agriculture and Agri-Food Canada, Regina, SK S4M 0M3, Canada
4
Department of Geography and Environmental Studies, Carleton University, Ottawa, ON K1S 5B6, Canada
*
Author to whom correspondence should be addressed.
Remote Sens. 2022, 14(9), 2121; https://doi.org/10.3390/rs14092121
Submission received: 25 March 2022 / Revised: 20 April 2022 / Accepted: 26 April 2022 / Published: 28 April 2022

Abstract

:
Differentiation of grassland/forage types and accurate estimates of their location and extent are important for understanding their ecological processes and for applying appropriate management practices. We are aiming to reveal the different spectral characteristics of six grassland/forage land covers in three ecoregions located in the Canadian Prairies, based on field data and satellite images. Three spectral indices representing productivity (Normalized Difference Vegetation Index (NDVI)), moisture content (Normalized Difference Moisture Index (NDMI)), and plant photosynthetic activity (Plant Senescence Reflectance Index (PSRI)) were used for comparison of means, comparison of coefficient of variation (CV), and analysis of variance (ANOVA). The results indicated that different grassland types show distinguishable spectral characteristics in the Moist-Mixed and Mixed Ecoregions, while it was not possible to differentiate the classes in the Fescue Ecoregion. To further investigate the within-sites and between-sites heterogeneity, we calculated the CV in a 3 × 3 window and placed them in comparative triangles to demonstrate their potential separability. Results indicated that the triangles based on the CV offered greater class separability in the Fescue Ecoregion and in the Mixed Ecoregion.

1. Introduction

Grasslands play a vital role in natural ecosystem services both ecologically and economically. Ecologically, grasslands are involved in water retention, carbon sequestration, habitat for wildlife, and containment of erosion processes [1,2]. Economically, grasslands are valuable to the meat and milk industries by providing a food source for domesticated herds [3]. The importance of grasslands has attracted researchers to investigate the use of remote sensing for monitoring grassland biophysical characteristics such as biomass [4,5], ground cover [6,7], heterogeneity [8], phenology [9,10], and many others [11,12,13]. The characterization of grasslands is complex. At a local scale, vegetation cover is highly dependent on the physiognomic characteristics, such as soil type, temperature, and precipitation, factors that influence productivity and define the predominant types of vegetation [14,15,16]. To understand different land cover and their distribution, Agriculture and Agri-Food Canada (AAFC) produces the annual crop inventory, derived from satellite-based remote sensing imagery, with an overall accuracy of 85% [17]. However, when investigating the dataset, confusion was observed in differentiating native grasslands from seeded forage. The confusion between different targets can be attributed to the wide variation in the phytophysiognomies of the Canadian ecoregions which are directly related to the climatic and soil characteristics of each ecoregion [18].
Several studies have focused on the ability to differentiate grassland types using both active and passive sensors, and single as opposed to multi-temporal remote sensing imagery with varying degrees of success [19,20,21,22,23,24]. Native and seeded grasslands can be discriminated from annual crops using Radarsat-2 imagery due to differences in their volume and surface backscatter parameters. However, the discrimination of native grassland from seeded grassland was inconsistent (Kappa value of 0.65) [19]. The use of Light Detection and Ranging (LIDAR) for identifying native from tame pastures in Saskatchewan also highlighted the limitation of this technology for discrimination of these two land cover types (Kappa value 0.57) [20]. Multispectral satellite imagery from a single date and the use of derived vegetation indices proved effective in mapping the conversion of native grasslands to cultivated agriculture in Alberta [21]. The use of the Shortwave Infrared Reflectance 3/2 Ratio and the Enhanced Vegetation Difference Index derived from the July imagery provided the best results with an overall accuracy of 95.2% and a Kappa value of 0.86. However, this study did not focus on separating native from tame grassland. The differentiation of native and non-native grasslands in Alberta using a multi-temporal Normalized Difference Vegetation Index (NDVI) profile as opposed to a single date classification was slightly, but not significantly, better (overall accuracy of 73 versus 71) [22] Another study combined radar data, multispectral bands, and vegetation indices in a multi-temporal approach to differentiate native grasslands and seeded forage in Manitoba and Alberta and concluded that the best overall accuracy was obtained using three dates of Landsat images combined with a mid-summer Radarsat-2 image, with an average overall accuracy of 89.49% between the two analyzed regions [23]. Finally, in their study, Olimb developed a method for differentiating C3 and C4 grasses from unsupervised classification of NDVI images for temperate grasslands in the United States and Canada and despite concluding that differentiating native and introduced grassland classes can be difficult, especially in areas that have undergone anthropogenic processes many years ago, they were able to predict grassland cover with an accuracy of 81% in an area of 200 km2 and 71% over a larger area of 5000 km2 [24].
It is challenging to further separate grassland/forage types in more detailed levels such as native grasslands from native invaded, or pasture from hay production areas (alfalfa, grass, or a mixture of both) based on satellite images [23]. Nevertheless, differentiating grassland/forage types at a second (more specific) level can provide base information for better management practices, and to assess the impact on plant and animal species in a specific region [23]. Therefore, the aim of this study was to provide a better understanding and differentiate grassland/forage types on a detailed level (native grassland, native grassland (modified/invaded), hay alfalfa, hay grass, hay mixture (alfalfa/grass), and pasture) based on satellite images and field information obtained during the peak of the growing season (late July) in southern Alberta, Canada. The specific objectives are to (1) evaluate spectral features of different grassland/forage types in different ecoregions from Sentinel-2 (Multispectral Instrument—MSI) imagery; (2) understand the nature of the grassland/forage types spectrally and identify suitable spectral variables for discriminating certain grassland types; and (3) assess the spectral variation within and between sites for different grassland/forage types in different ecoregions.

2. Materials and Methods
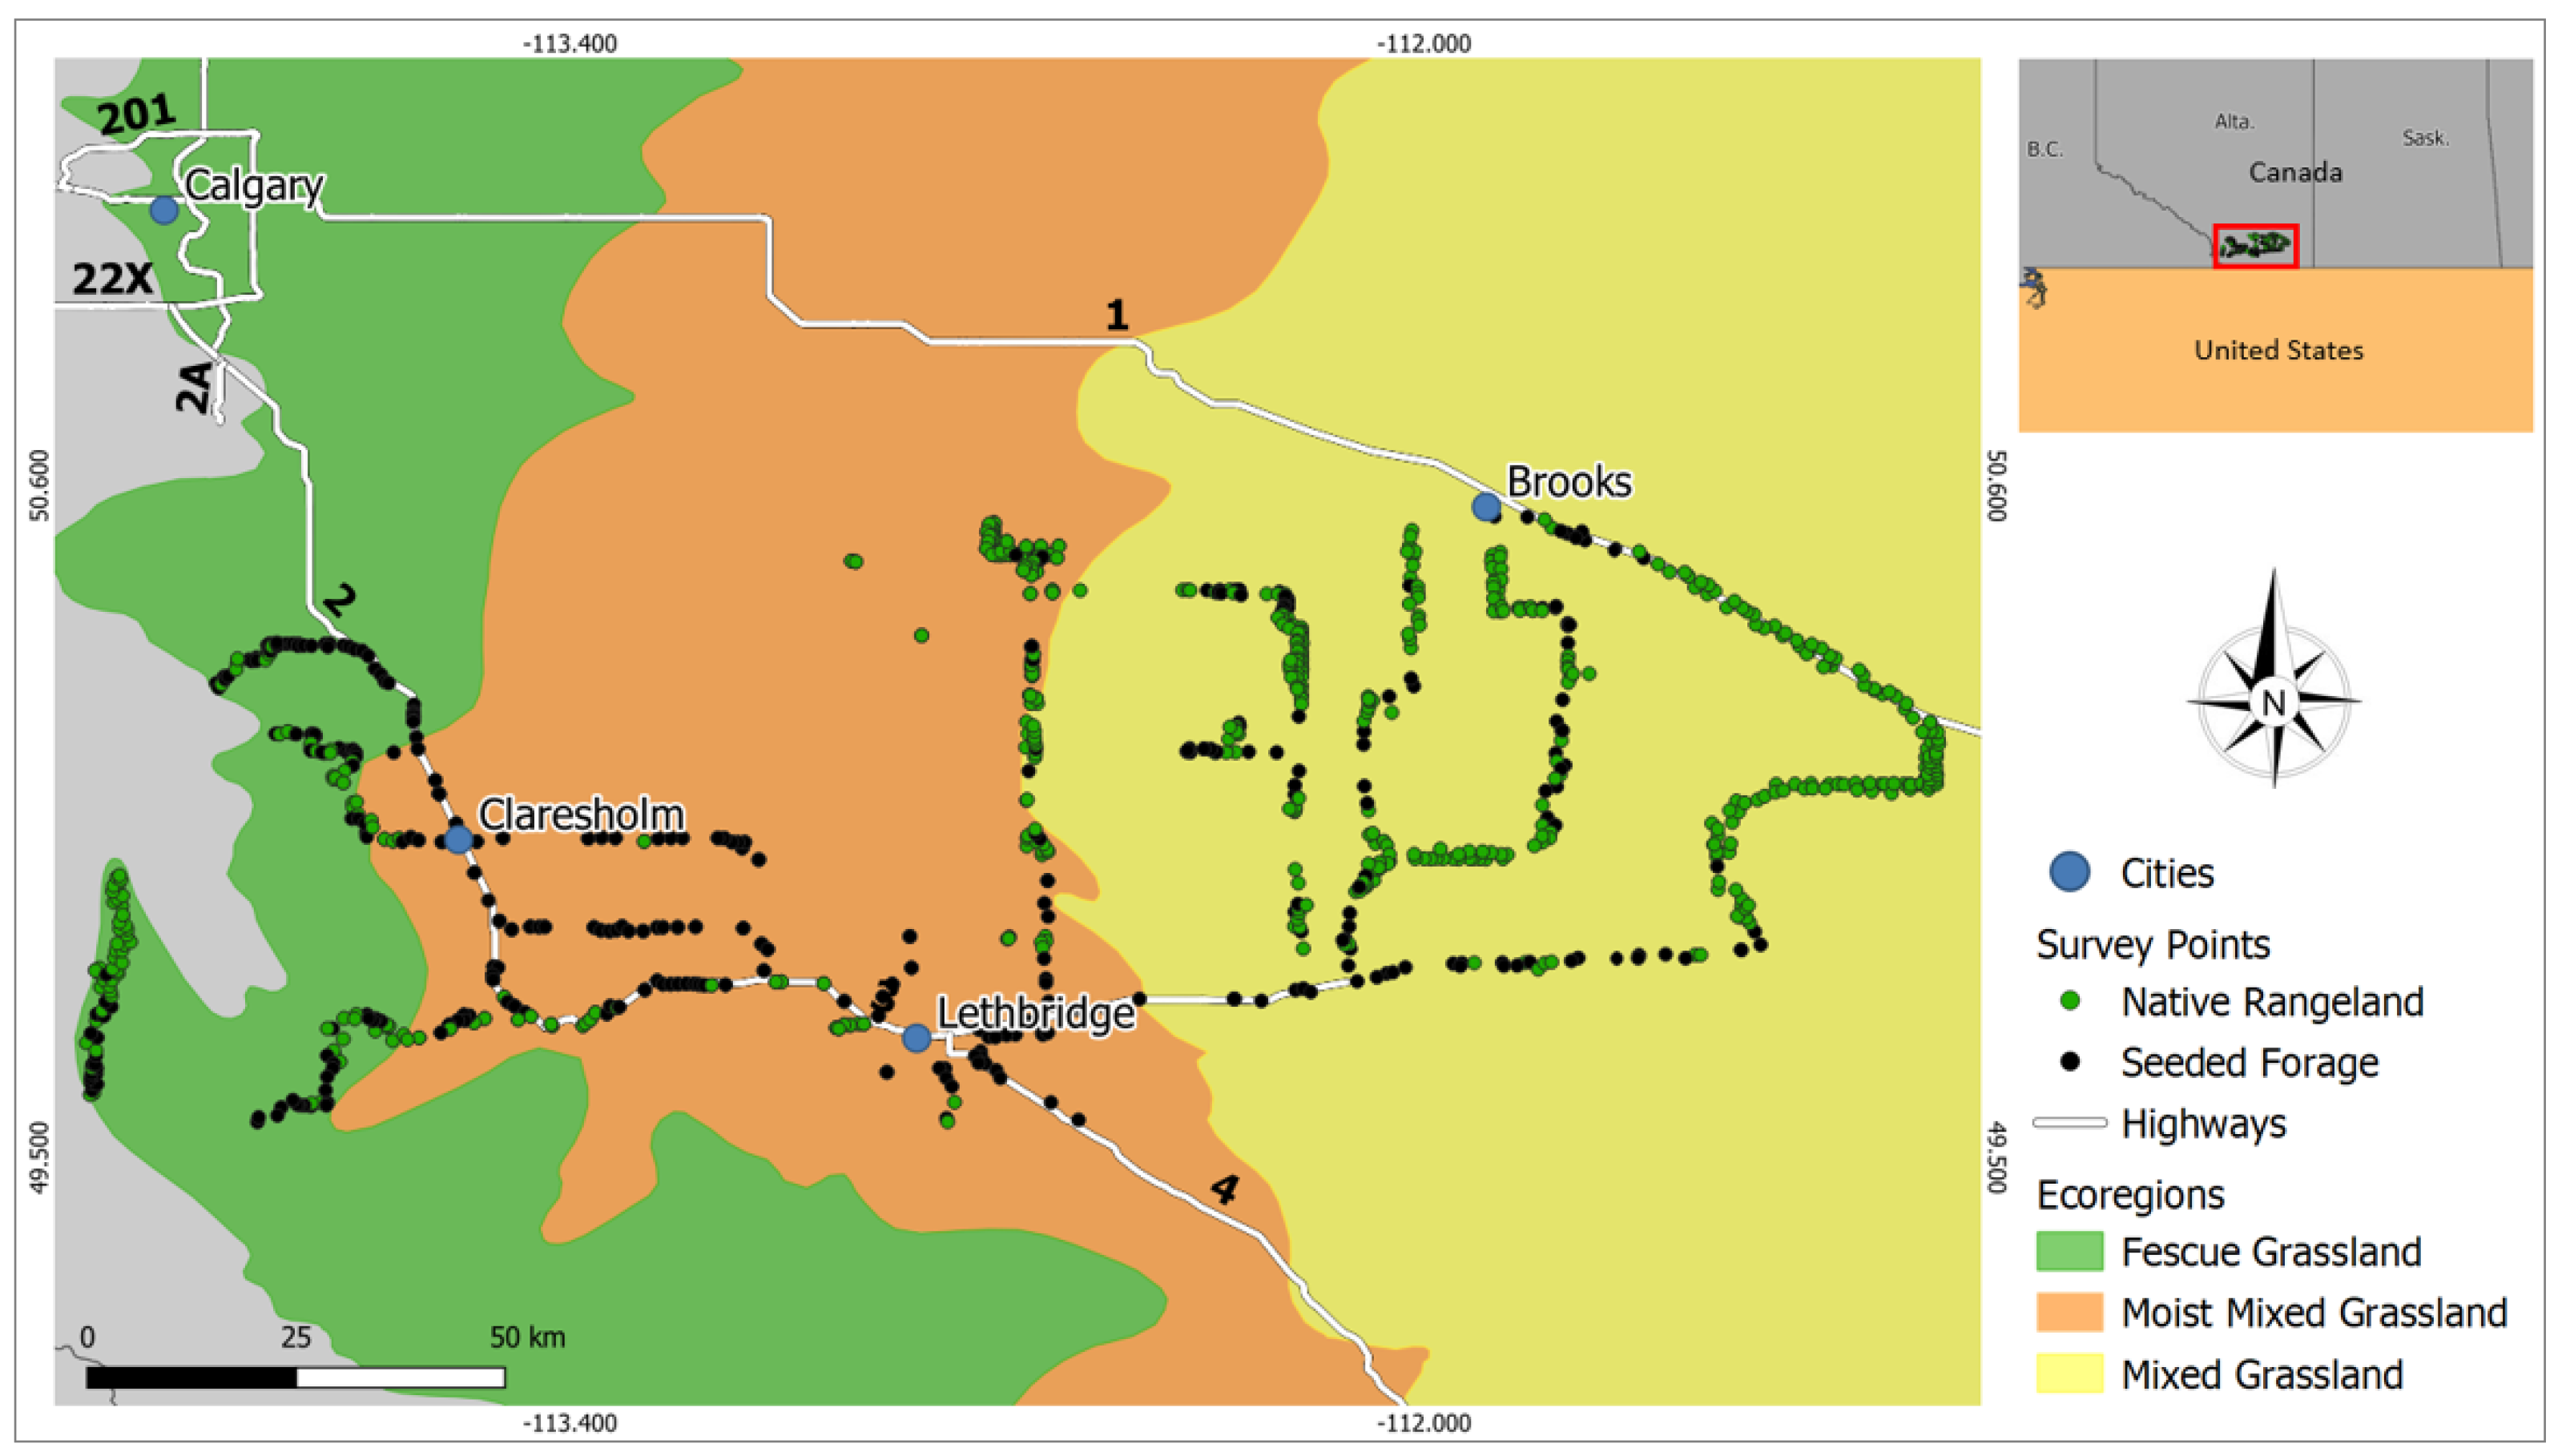
2.1. Study Area

The study sites (Figure 1) were selected to encompass different climatic conditions and soil types. Each ecoregion has specific ecological interactions, which have affected the plant community [25].
The Fescue Ecoregion has the highest annual average precipitation (400–500 mm) and Dark Brown and Black Chernozemic soils, and although the average annual temperature (annual average around 3.5 °C) is lower than in the Moist-Mixed Ecoregion, biomass production (the predominant species are foothills rough fescue—Festuca campestris Rydb and Parry oatgrass—Danthonia parryi Scribn.) is expected to be greater than in the other two ecoregions [26]. The Moist-Mixed Ecoregion is a transition area in the study context, with intermediary amounts of precipitation (350–450 mm), milder temperatures (annual average around 5 °C), and Dark Brown Chernozemic soils [25]. The predominant species in the Moist-Mixed Ecoregion are western porcupine (Stipa curtiseta) (A.S. Hitchc.) Barkworth), needle-and-thread (Stipa comata Trin. & Rupr), western wheatgrass (Agropyron smithii Rydb.), and northern wheatgrass (Agropyron dasystachyum (Hook.) Scribn) [27]. Finally, the Mixed Ecoregion is more arid (250–350 mm), has cooler temperatures (annual average around 3.5 °C), and the Brown Chernozemic soil tends to be less fertile in comparison with the other two ecoregions analyzed, the following species predominate: needle-and-thread (Stipa comata Trin. & Rupr), blue grama (Bouteloua gracilis (HBK) Lag.), June grass (Koeleria cirsata Pers.), western wheatgrass (Agropyron smithii Rydb.), and northern wheatgrass (Agropyron dasystachyum (Hook.) Scribn) [26]. All these factors contribute to less biomass production in the Mixed Ecoregion compared to the other two ecoregions.

2.2. Reference Data Collection from Surveys

Field information was obtained from vehicle surveys that were carried out from 23 July to 4 August 2019. The team that carried out the field survey consisted of four people, including a forage specialist. The main objective was to identify and generate sample points that represent the land cover classes of interest. The study divided the classes into two levels (Table 1). The first level includes native grassland and seeded forage classes [23]. There are six classes at the second level: native and modified/invaded for native grassland, and hay alfalfa, hay grass, hay mixture alfalfa/grass, and pasture for seeded forage category (Table 1). A total of 205, 251 and 449 reference points were collected for the Fescue, Moist-Mixed, and Mixed Ecoregions, respectively (Figure 1).

2.3. Image Acquisition and Preprocessing

Sentinel-2 T11UQR, T12UUA, and T12UVA tiles from 23 July 2019 were obtained and processed as the date is close to the timing of the fieldwork and is also close to peak biomass production. All the images were acquired via Earth Explorer (https://earthexplorer.usgs.gov (accessed on 15 June 2021)), at the L1C level, which represents the measurements made at the top of the atmosphere (TOA). The images were further processed for surface reflectance through the software Sentinels Application Platform—SNAP (made available by European Space Agency (ESA) (https://step.esa.int/main/download/snap-download/ (accessed on 13 June 2021))). The image preprocessing steps to obtain surface reflectance values included radiometric, geometric, and atmospheric corrections. Bands 5–7, 8A, 11, and 12 were resampled to 10 m using the nearest neighbor method to match the spatial resolution of bands 3, 4, and 8.
Three spectral indices, the Normalized Difference Vegetation Index (NDVI), the Normalized Difference Moisture Index (NDMI), and Plant Senescence Reflectance Index (PSRI) were calculated (Equations (1)–(3)). NDVI is widely used as an indicator of the photosynthetic activity of vegetation, plant health, and for monitoring the canopy phenological cycle [22,27,28,29]. NDMI, which includes the shortwave infrared band, is widely used to estimate vegetation water content [30,31]. PSRI indicates higher plant reflectance in specific wavelengths that suggest the loss of light absorption capacity and can be used as an indicator of water stress and plant senescence [32,33,34]. Since we used Sentinel-2 images in this study, the NDVI used bands 4 (red) and 8 (near infrared), the NDMI used bands 8 (near infrared) and 11 (short wave infrared) and, finally, the PSRI uses bands 2 (blue), 4 (red), and 6 (vegetation red edge). To consider a larger area and capture possible variations in land cover, average values and the standard deviation of each original band and the vegetation indices were extracted from 3 × 3 and 5 × 5 pixel window sizes for each reference point and prepared for further statistical analysis. A comparison test revealed that the mean values for the 3 × 3 and 5 × 5 window size were not significantly different from each other. To avoid edge effects, we used the 3 × 3 window in all further analyses.
NDVI = Near   Infrared Red Near   Infrared + Red
NDMI = Near   Infrared Short   wave   Infrared Near   Infrared + Short   wave   Infrared
PSRI = Red Blue Red   Edge

2.4. Statistical Analysis

Analysis of variance (ANOVA) was conducted using the Statistical Package for the Social Sciences (SPSS) on the various survey points to investigate whether the spectral properties differed significantly (significant level of 0.05) between the six grassland/forage types in the three ecoregions for original bands and the three spectral indices. To identify the data heterogeneity we calculated the coefficient of variation (CV) in two different levels: within sites and between sites. The within-sites level considers the CV average within the same 3 × 3 pixel window. The between-sites level represents the average CV between all pixel windows of the same class located in the same ecoregion. Based on what was observed in the field, we assume that native grassland has higher heterogeneity within each field; however, the variation across different fields is relatively small. Alternatively, tamed forage is normally more homogenous in one field, but it can be very different from one field to another. These analyses are an alternative to test another dimension for separating different grassland/forage types.
Workflows were built using Feature Manipulation Engine (FME) to perform the statistical analyses. To visualize the difference between the six grassland/forage land cover in each ecoregion, we plotted each class in a triangle based on mean and CV values of the three selected features: productivity (NDVI), moisture (NDMI), and plant senescence (PSRI). The purpose of the comparative triangles is to integrate the results of the three vegetation indices analyzed in the same diagram for each ecoregion.

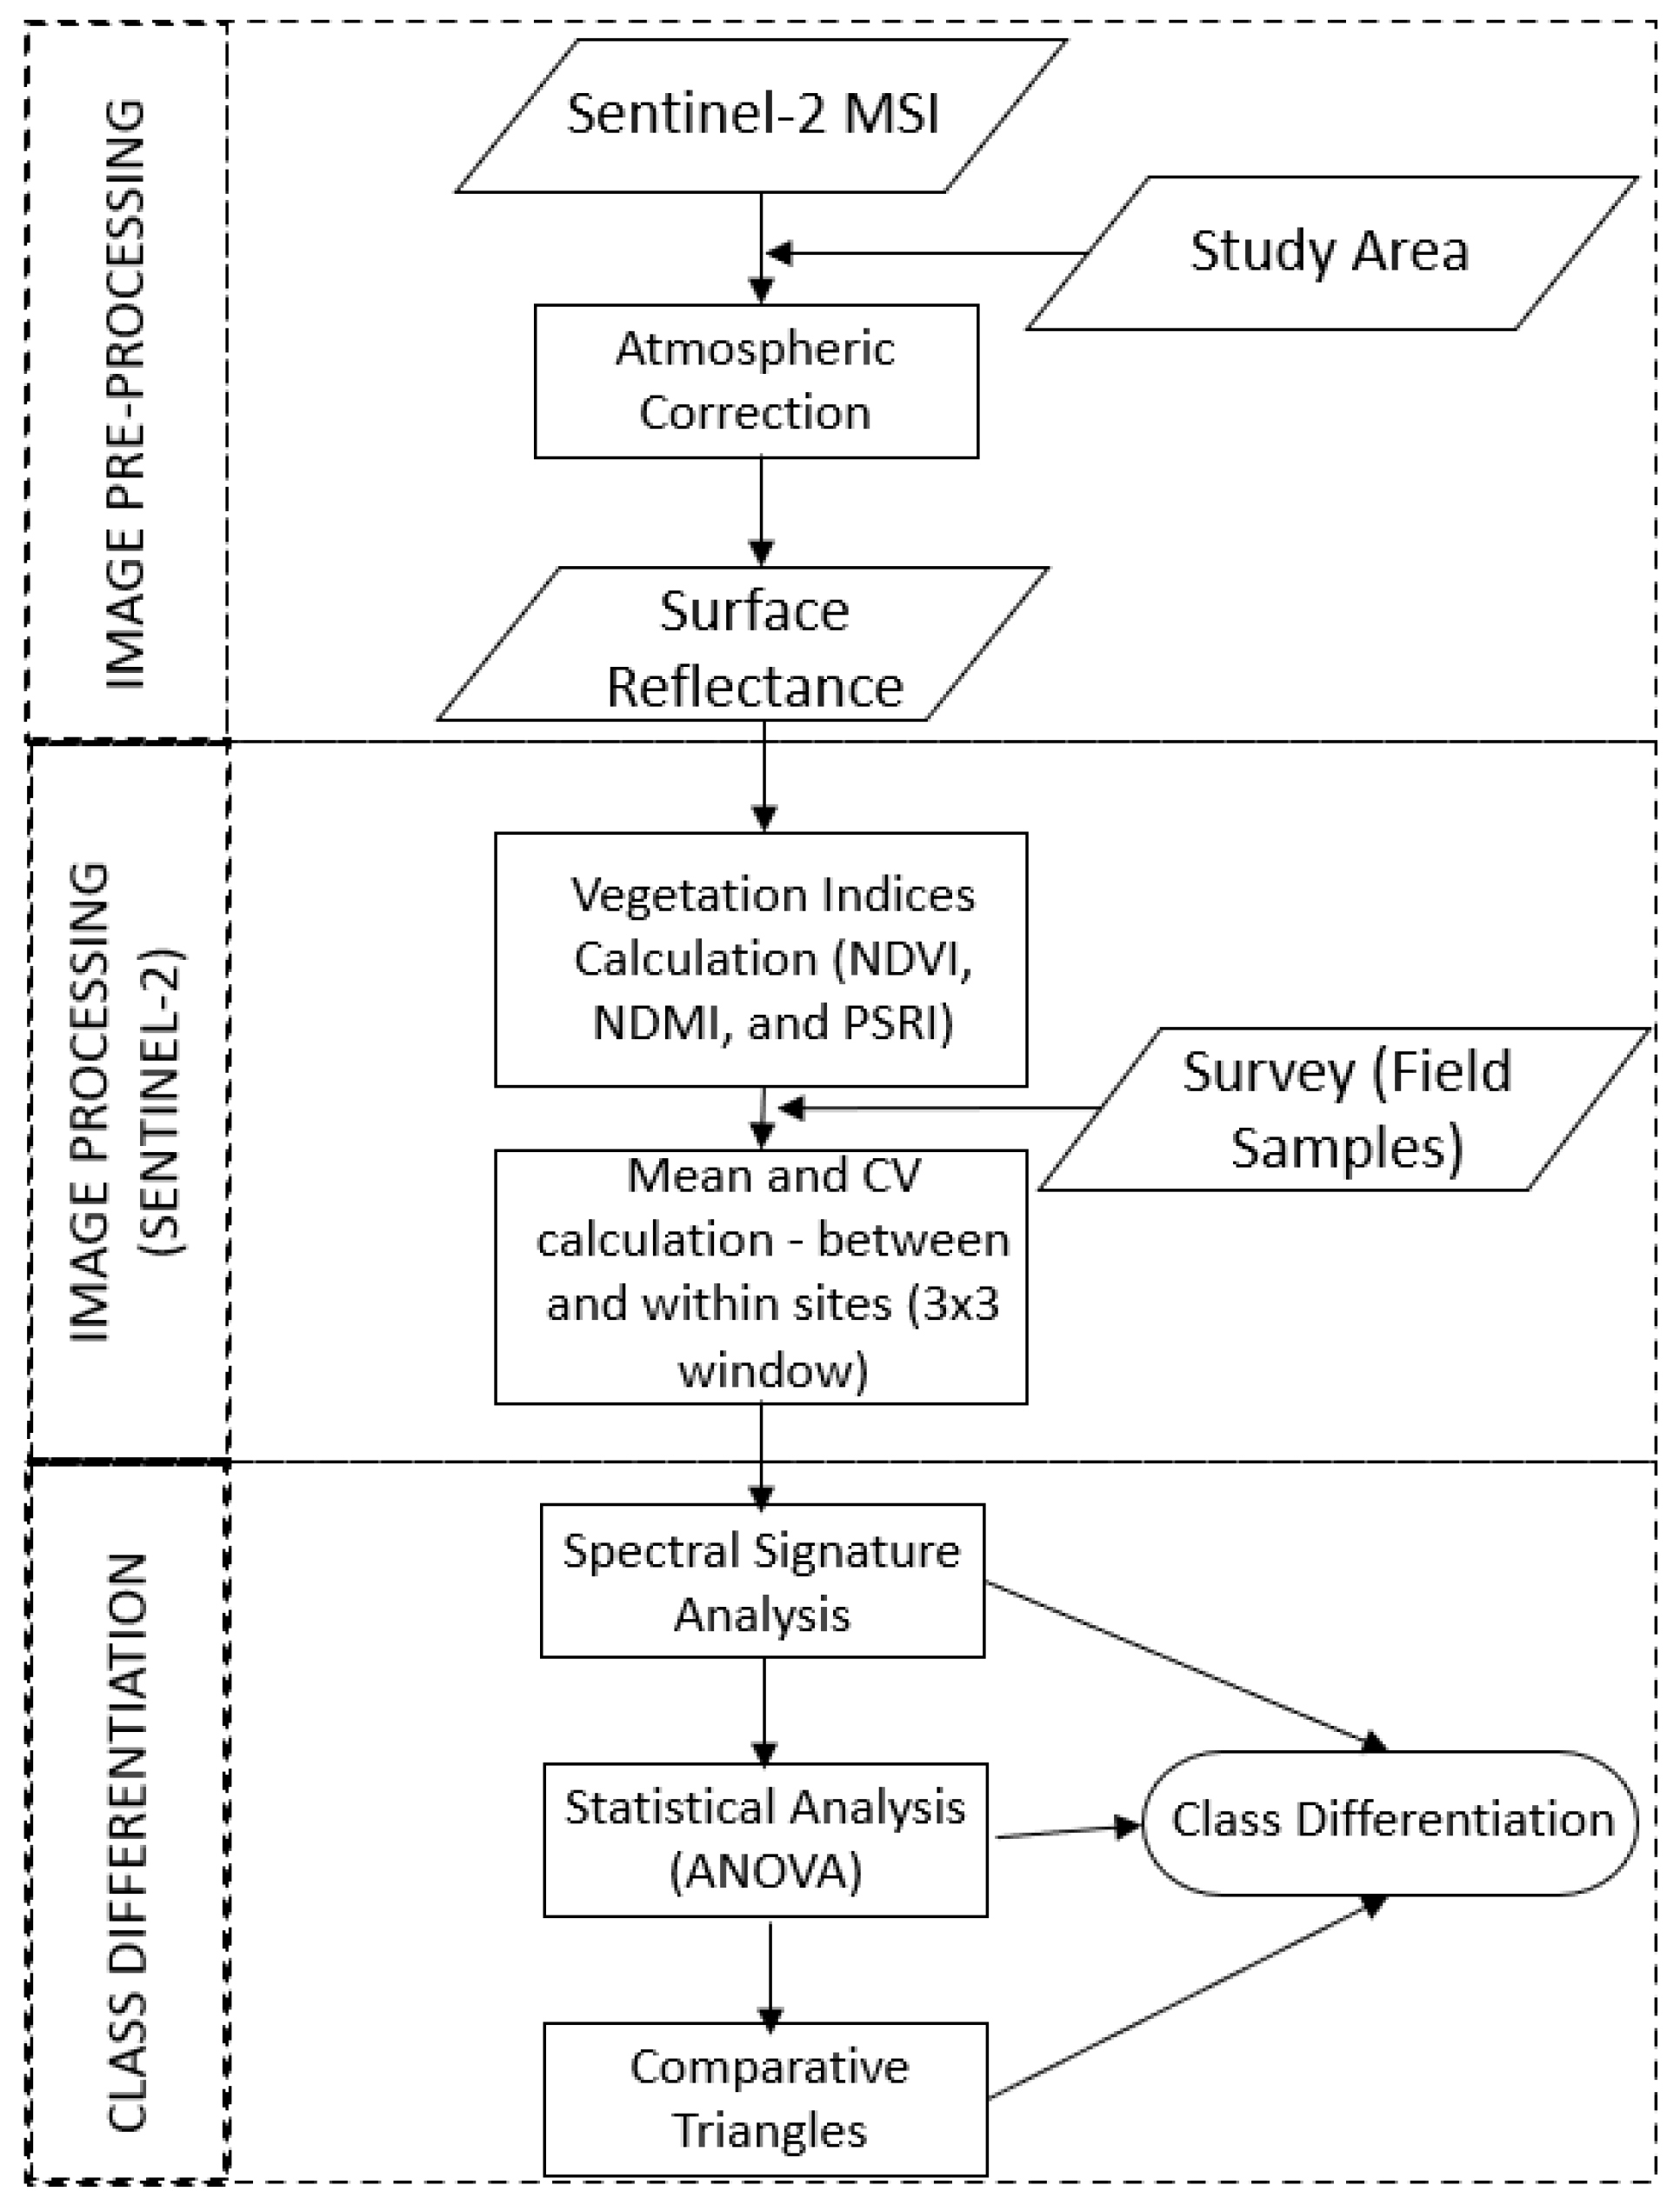
2.5. General Workflow

The flow chart of the proposed method to differentiate the six grassland/forage types based on Sentinel-2 MSI images and the vehicle survey is presented in Figure 2. The fundamental parts of the method consist of image preprocessing, image processing, and class differentiation.

3. Results

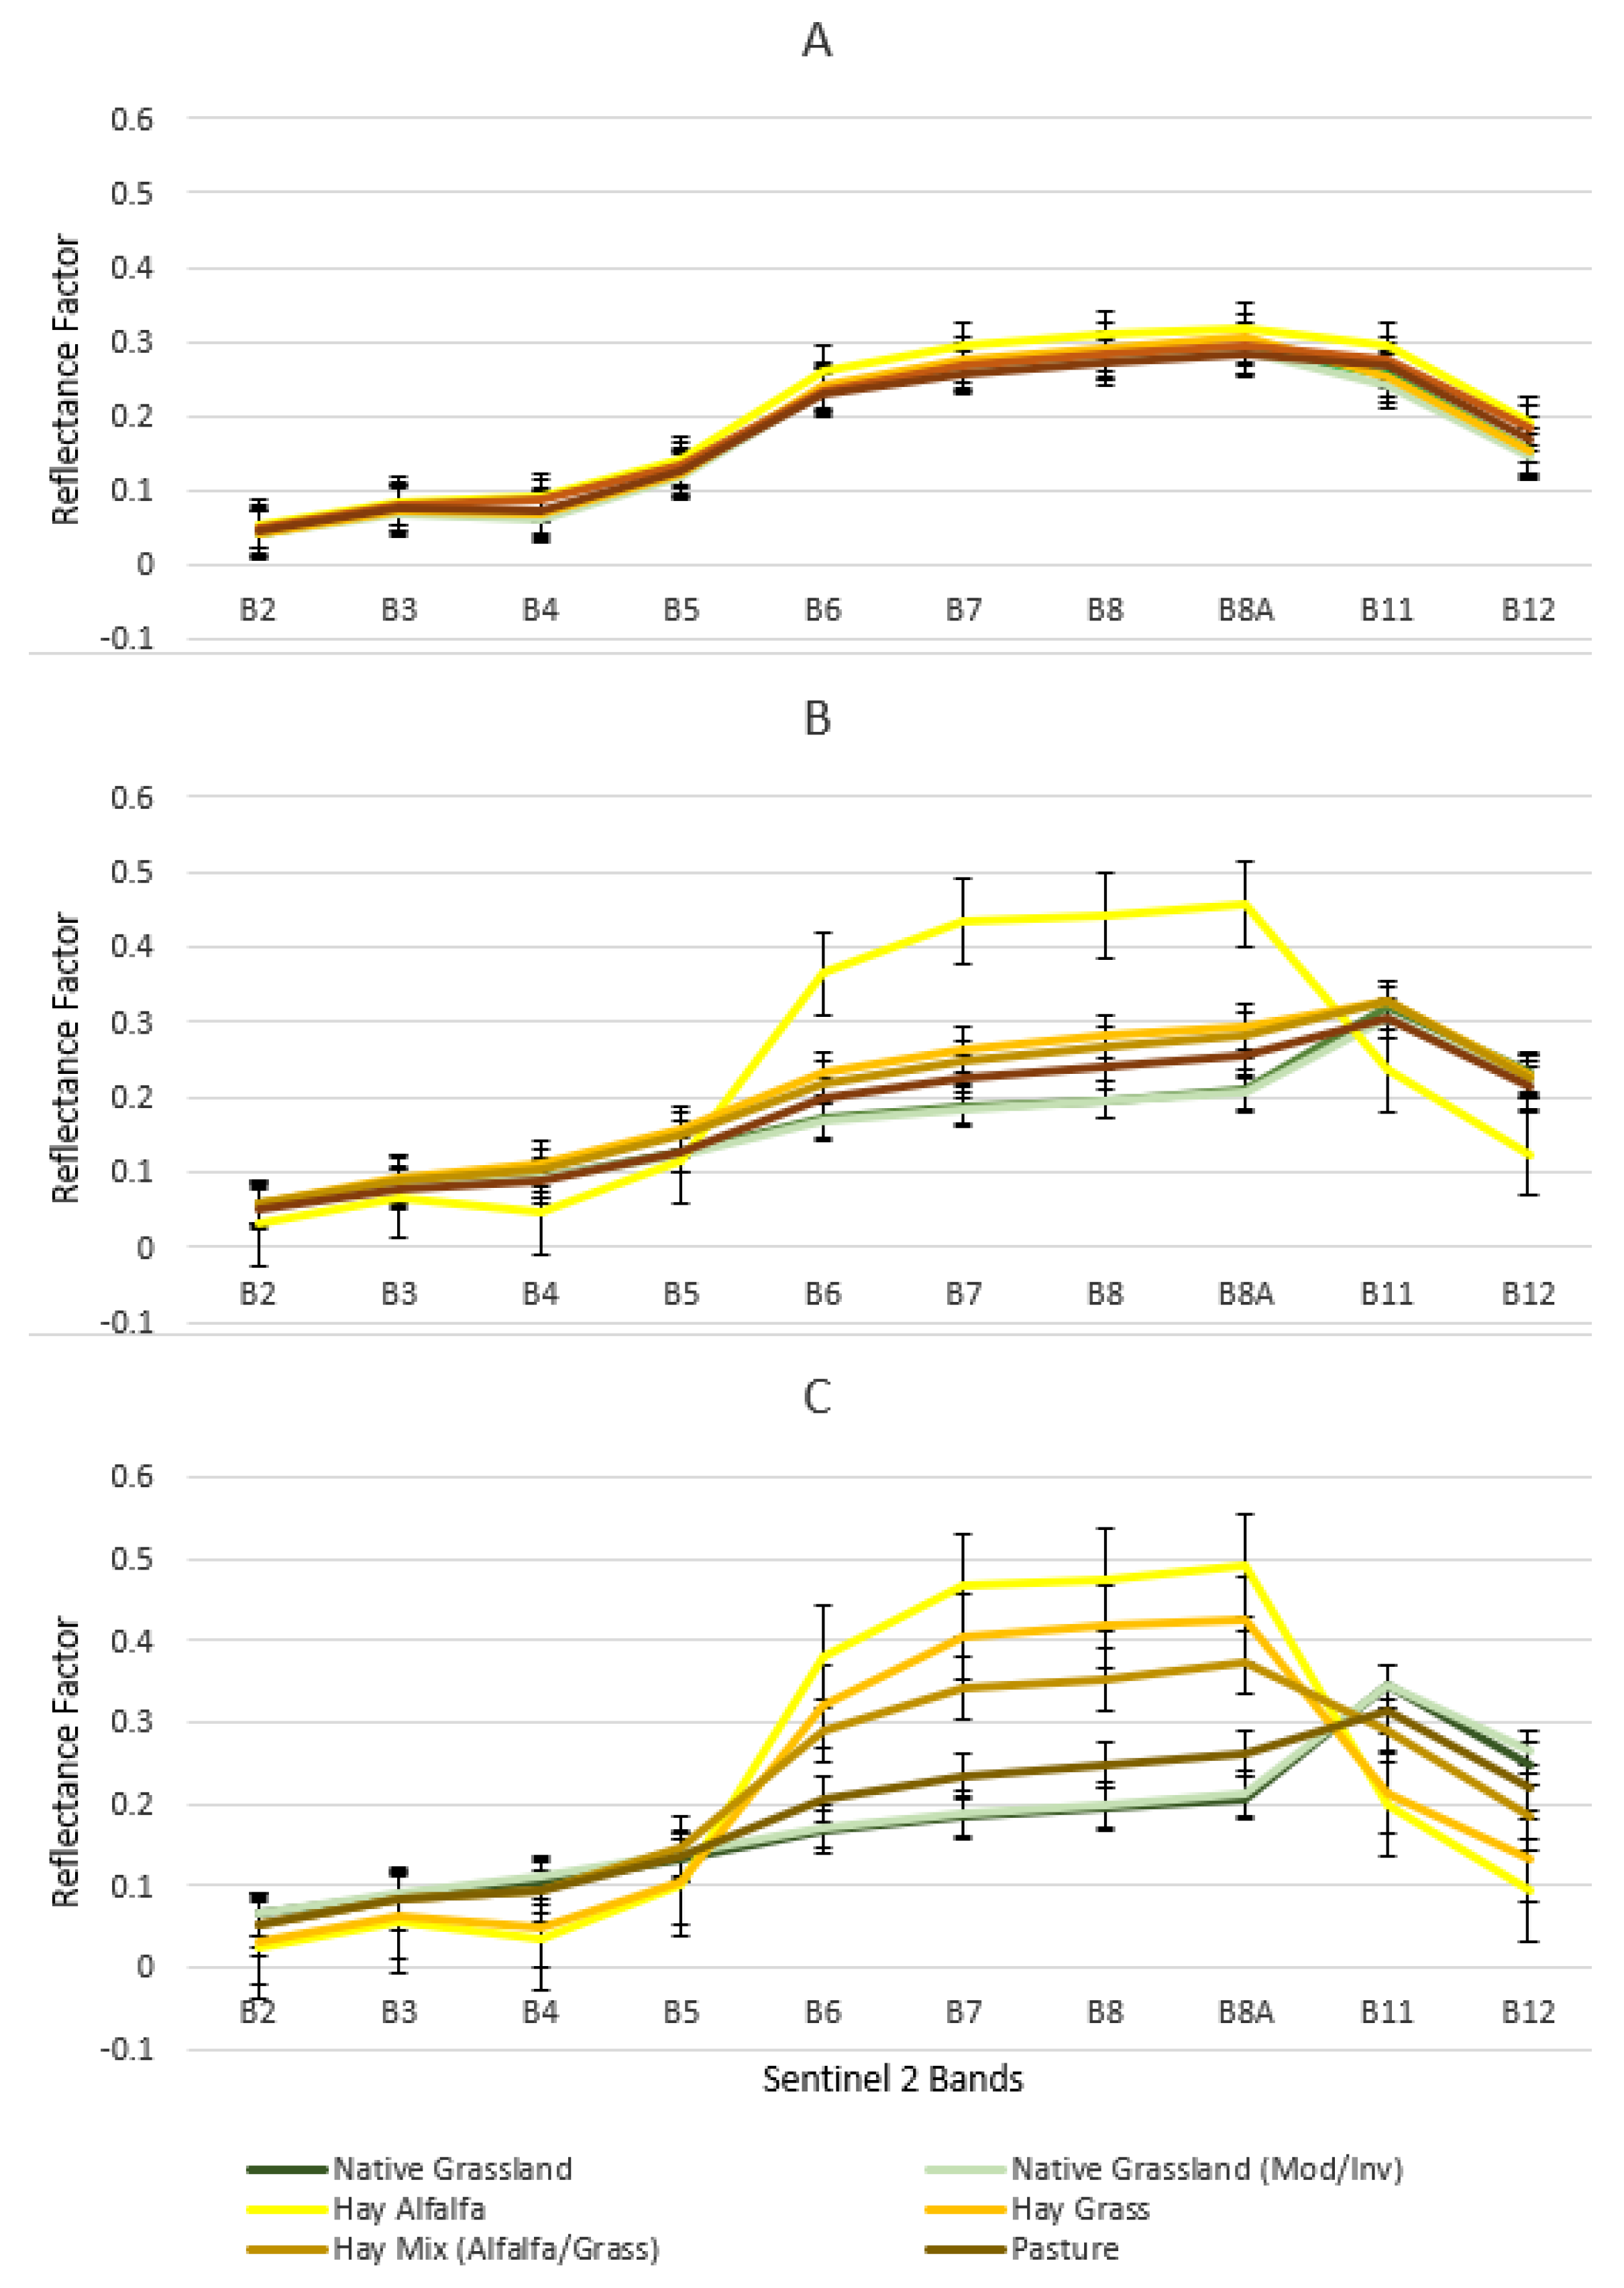
3.1. Spectral Signature of Six Grassland/Forage Land Covers

Due to edaphoclimatic (factors related to soil and climate) differences, grassland species and seeded forages will vary from one ecoregion to another, which requires an ecoregion approach to effectively separate the land cover classes. In the Fescue Ecoregion, class differentiation, based on a single multispectral satellite image acquired in the summer proved difficult. Even if the classification was more generic, such as native grassland versus seeded forage, differentiating the classes would be inaccurate (Figure 3).
The ANOVA results indicate the use of individual spectral bands have limited potential for class differentiation as there were few significant statistical differences amongst the class reflectance values. Native grassland and hay grass, as well as native modified and hay alfalfa reflectance values were significantly different. In the drier regions, the Moist-Mixed Ecoregion, and more so in the Mixed Ecoregion, the potential for differentiation of grassland/forage types was more evident. In both ecoregions the best wavelengths for differentiating between classes were in the red-edge between 740 nm to 865 nm (bands B6 through B8A) (Figure 3). In the red-edge region of the electromagnetic spectrum, it was possible to distinguish native grassland classes because they showed lower reflectance than the seeded forage classes. The shapes of the spectral profiles for the hay alfalfa class were similar in the Moist-Mixed Ecoregion and in the Mixed Ecoregion, but in the Mixed Ecoregion the reflectance peaks were higher. Meanwhile, in the Moist-Mixed Ecoregion the spectral signatures for the other seeded forage classes are closer to each other, which makes separability more difficult. The native grassland class, in both ecoregions, had similar signatures, both with respect to shape and magnitude, which makes it difficult to differentiate between them.

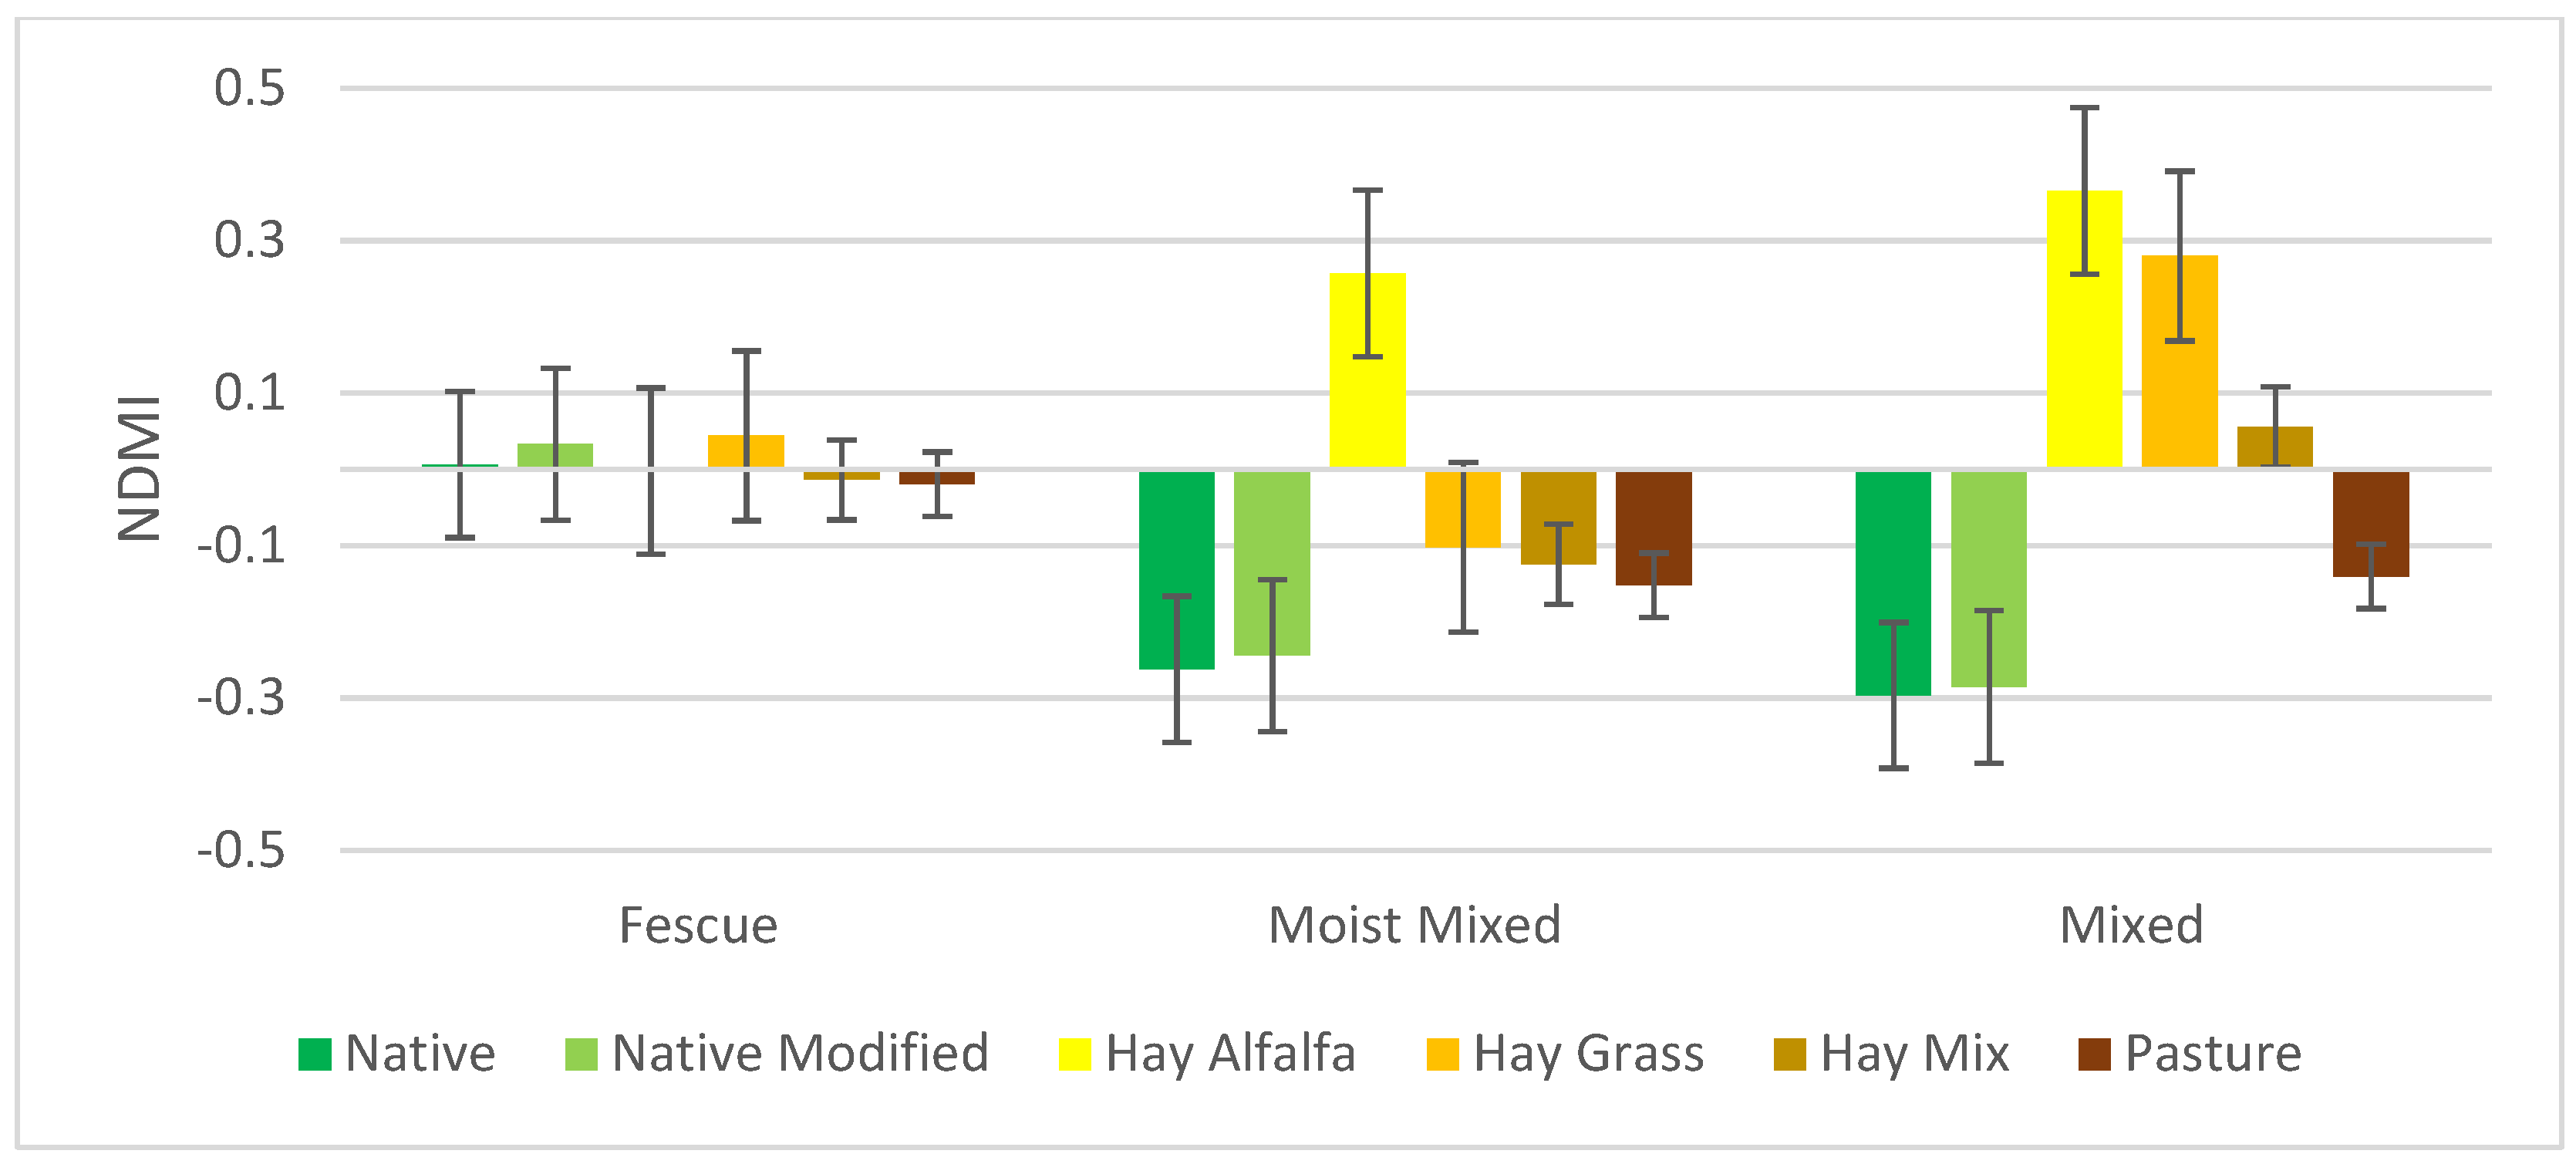
3.2. NDVI, NDMI, and PSRI

The mean NDVI values show two distinct patterns amongst ecoregions: one represented by the Fescue Ecoregion and another represented by the Moist-Mixed and the Mixed Ecoregions (Table 2). The pattern represented by the Fescue Ecoregion shows a smaller range of values between classes, which makes class differentiation using the mean NDVI difficult even when considering just native grassland and seeded forage classes. On the other hand, the seeded forage classes located in the Moist-Mixed and the Mixed Ecoregions showed higher NDVI values and potentially higher productivity. It is noteworthy that the hay alfalfa class had the highest values in both ecoregions. In the Mixed Ecoregion, hay areas (including hay grass and hay mixture classes) had greater NDVI values than pasture. However, in the Moist-Mixed Ecoregion, hay grass, hay mixture, and pasture showed similar results. The analysis indicated that the same grassland types can be differentiated amongst ecoregions. Native and native modified showed significantly higher NDVI in the Fescue Ecoregion and significantly lower values in the Mixed Ecoregion when compared to the Moist-Mixed Ecoregion. The hay mixture class shows low separability amongst the three ecoregions analyzed.
The NDMI chart (Figure 4) shows different patterns in each of the ecoregions. In the Fescue Ecoregion, no statistically significant differences were observed amongst cover classes of interest. The small range of NDMI values for the different grassland/forage classes make differentiation difficult, even a first level (native grassland vs. seeded forage). In the Moist-Mixed Ecoregion, the ANOVA result showed greater potential to separate native grassland from all other classes and hay alfalfa from all other classes (Figure 4). The highest differentiation potential for class differentiation using the NDMI was in the Mixed Ecoregion where significant differences were observed between most classes (Figure 4). It is worth noting that some classes demonstrated positive or negative values when using NDMI (Figure 4)
The lowest PSRI values were in the Fescue Ecoregion (Figure 5). The ANOVA results indicate poor class differentiation. In the Moist-Mixed Ecoregion, the PSRI of the hay alfalfa class was significantly different from the other land cover classes (excluding the hay mixture class). In the Mixed Ecoregion, it was possible to differentiate the land cover classes into three distinct groups: native grasslands (native and native modified), areas of only one type of hay (hay alfalfa and hay grass), and finally more heterogeneous areas (hay mixture and pasture). ANOVA results showed good potential for differentiating the classes of interest. As observed in the comparison of the multispectral bands, it was not possible to separate native grasslands from native modified with NDVI, NDMI, and PSRI.

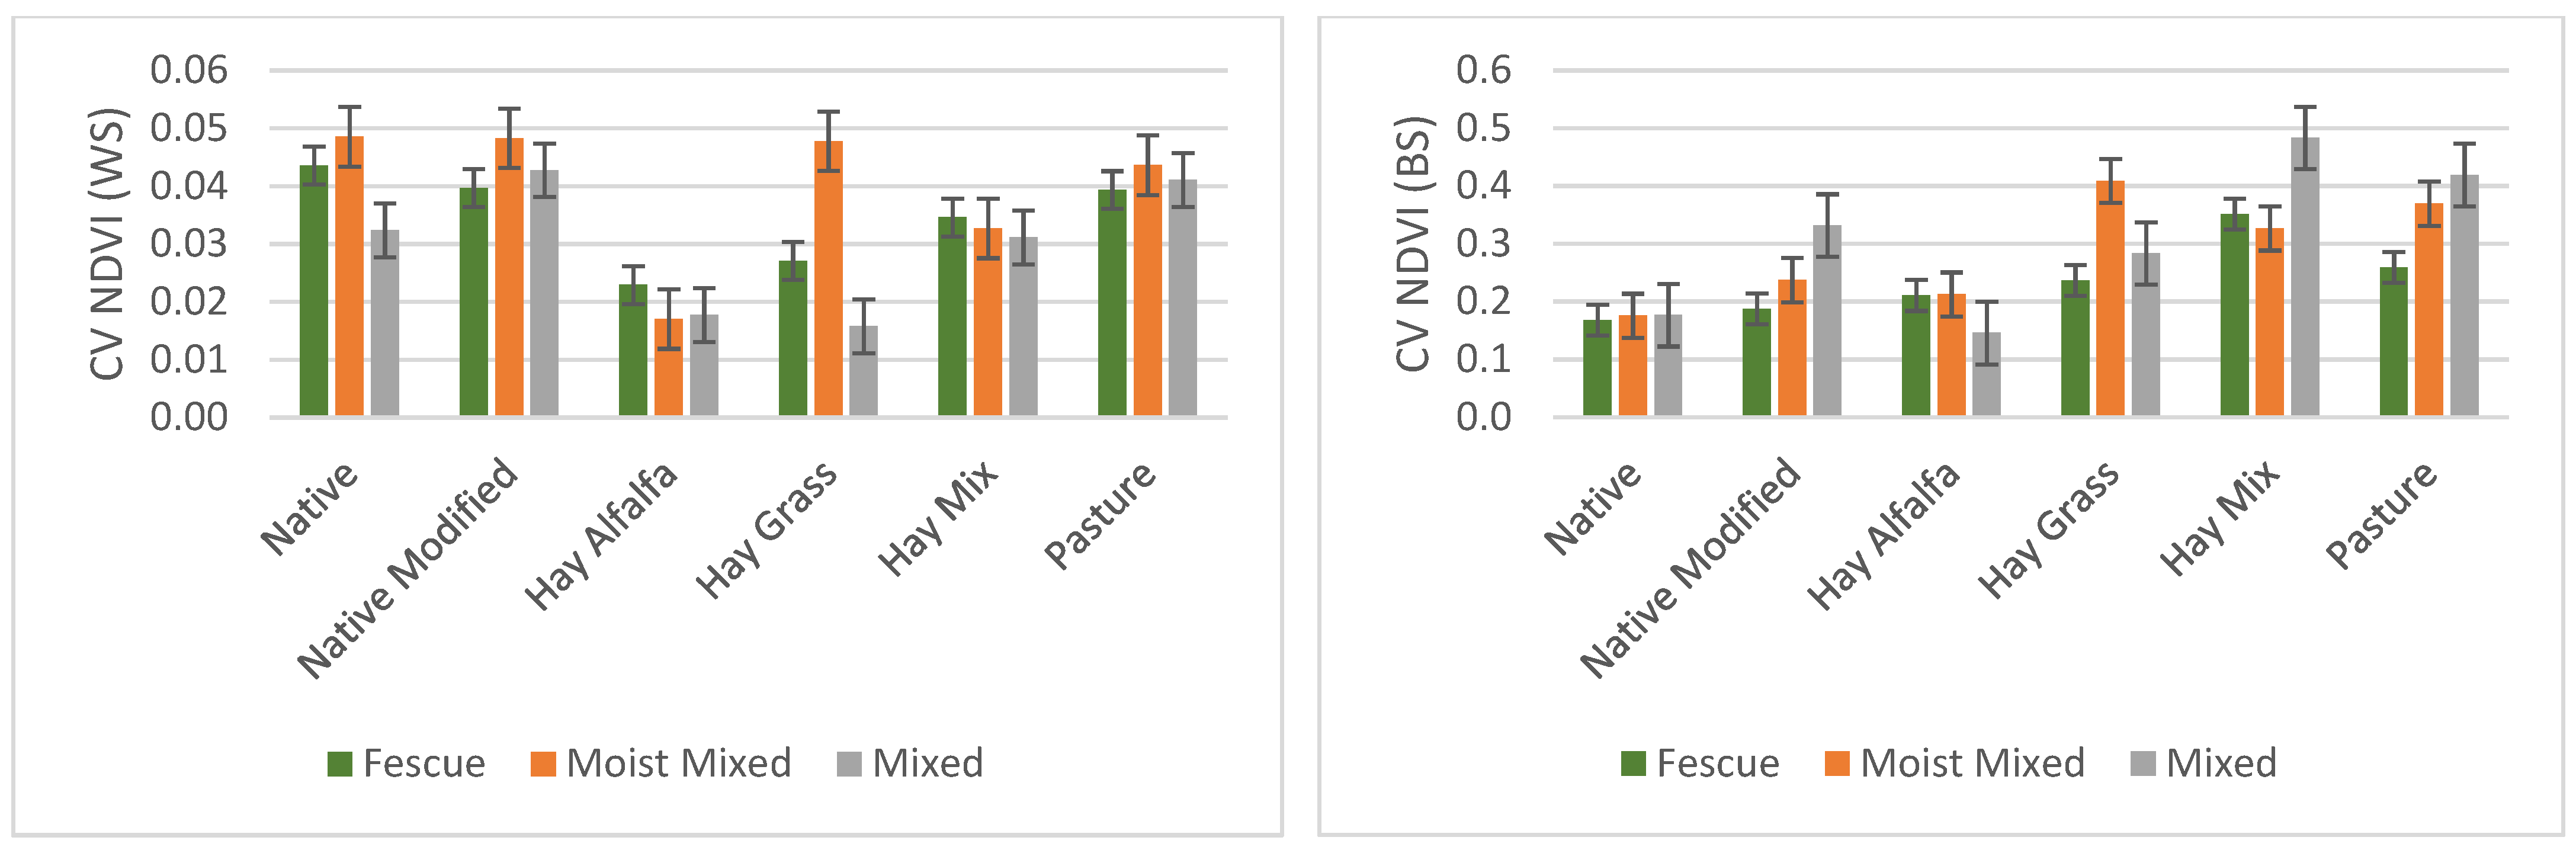
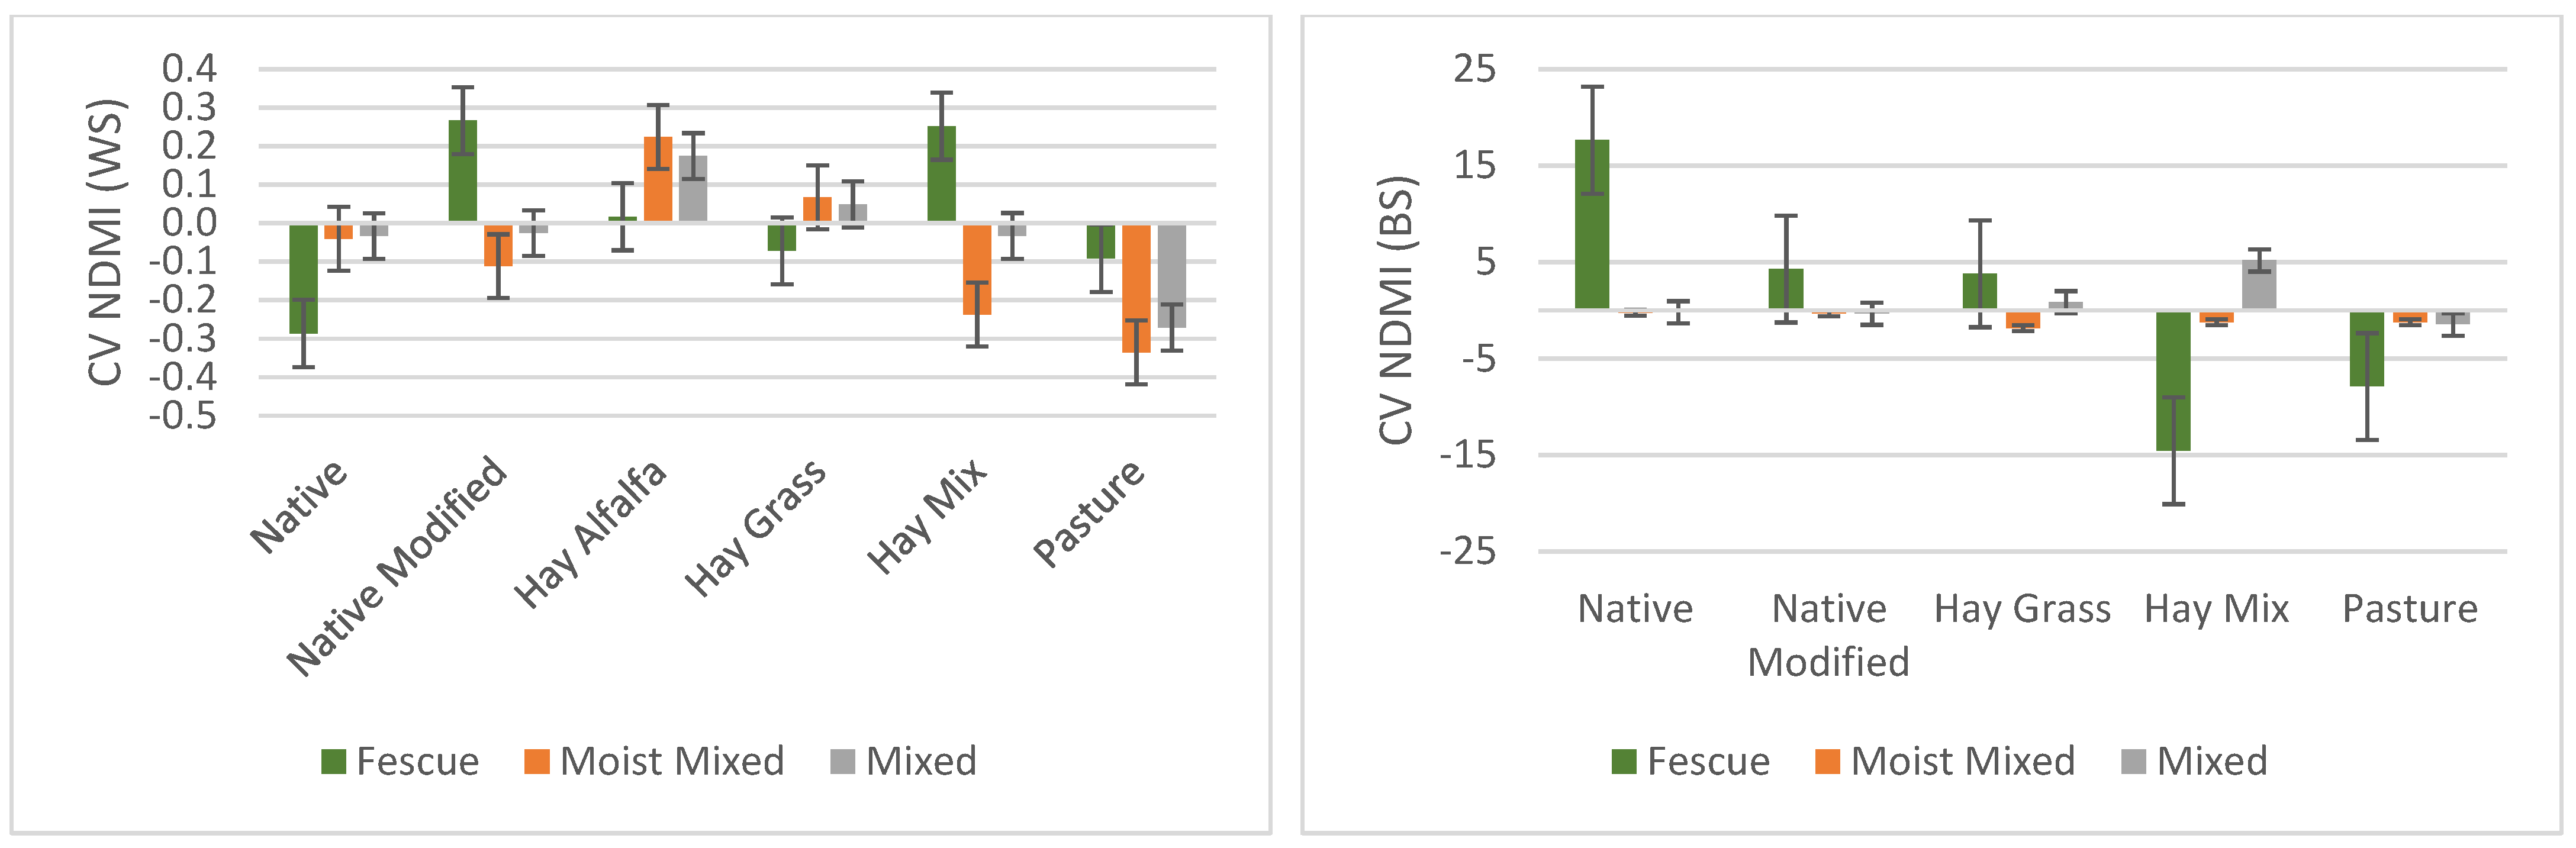
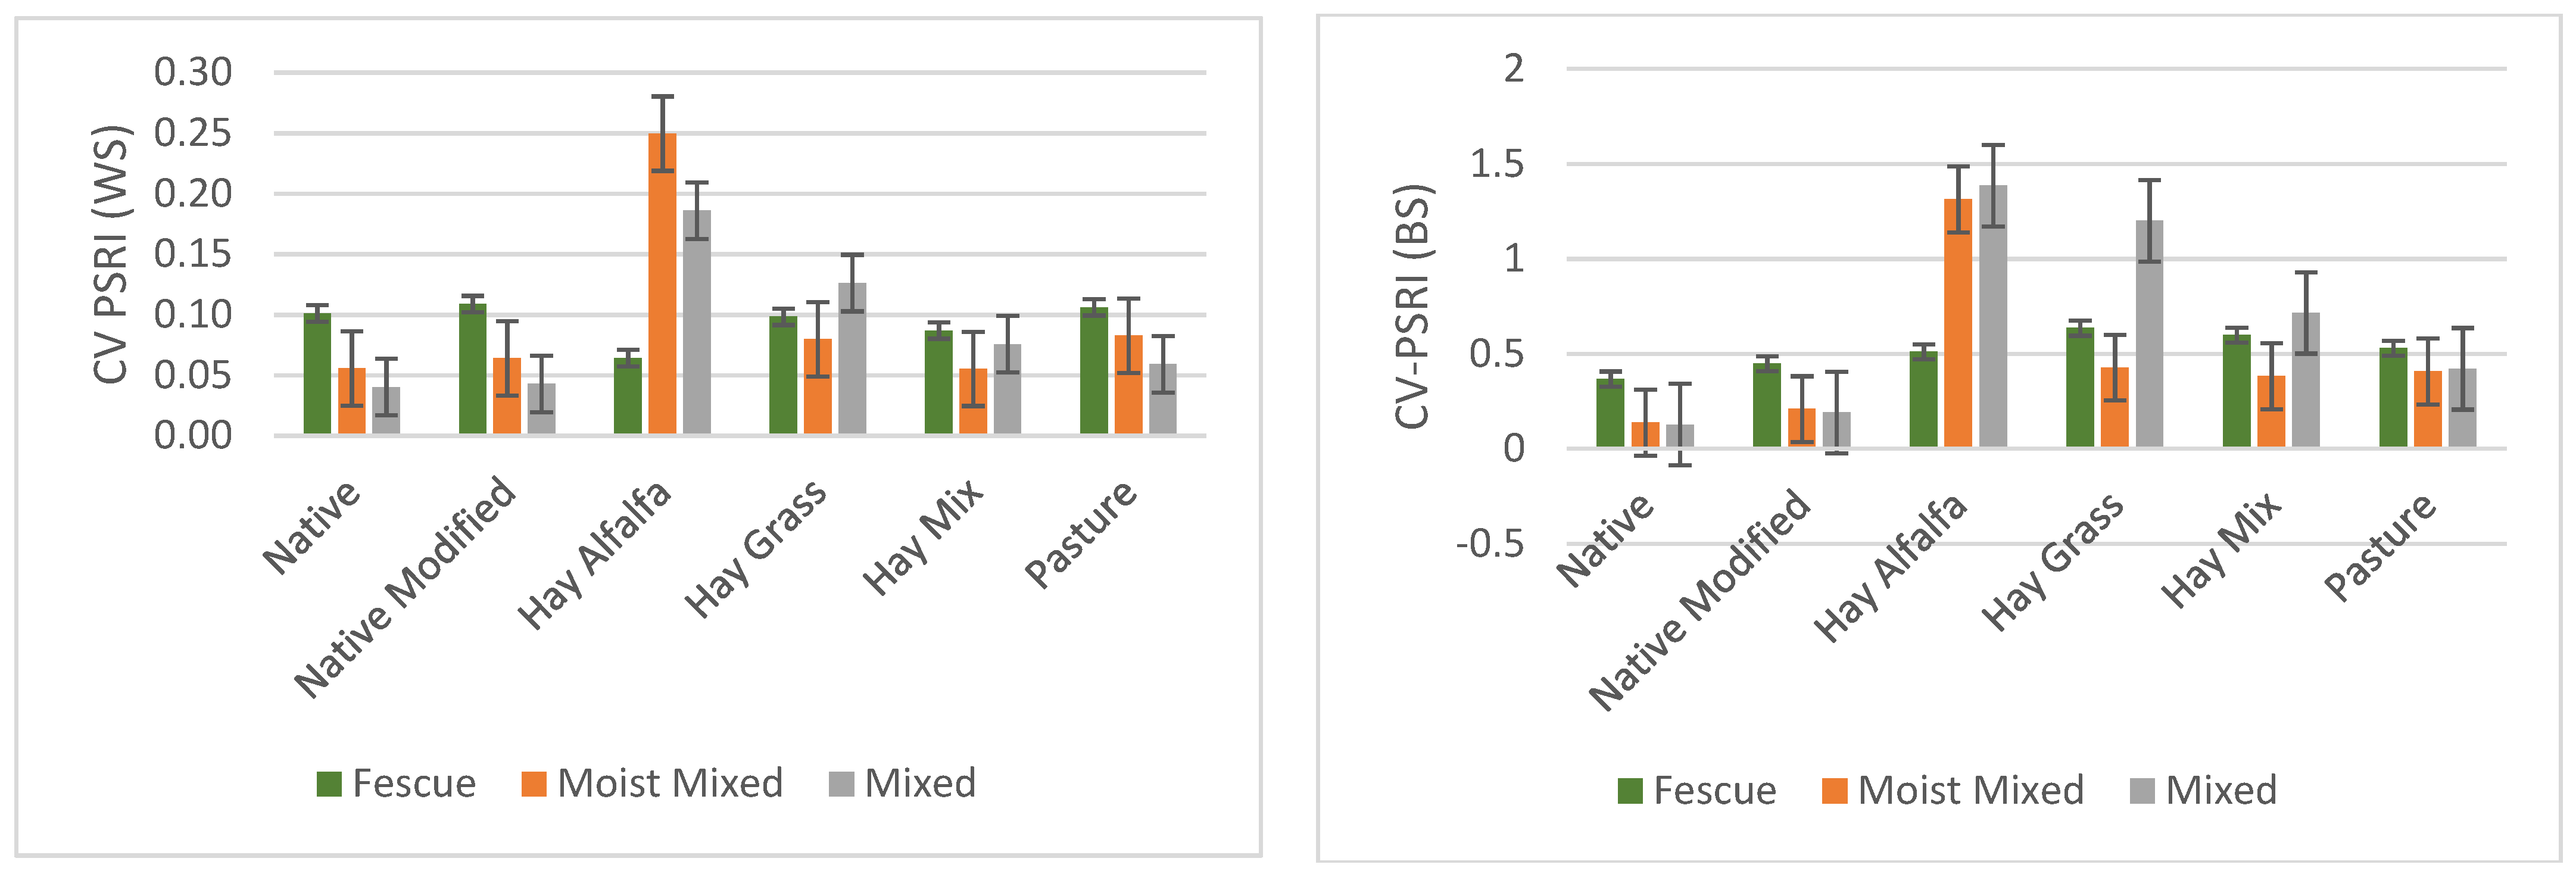
3.3. Variation within and between Sites for Different Grassland/Forage Land Covers

Examination of the NDVI CV within and between sites showed some interesting differences amongst the six land cover types (Figure 6). The NDVI CV values for the hay grass class (within and between sites) in the Moist-Mixed Ecoregion and the hay mixture (at the between-sites level) in the Mixed Ecoregion were higher than for the other grassland/forage types in each of the ecoregions. Excluding the hay grass class in the Moist-Mixed Ecoregion, hay grass and hay alfalfa areas showed relatively lower CV values indicating greater NDVI uniformity of the analyzed pixels. At the within-sites scale, except for the Moist-Mixed Ecoregion, native grassland, native modified, and pasture NDVI show greater variation than hay alfalfa and hay grass. In the comparison between sites, the NDVI shows greater uniformity in the three ecoregions for the native and hay alfalfa classes, while the native modified and pasture classes were more heterogeneous.
Based on the CV-NDMI, at the within-sites level (Figure 7), there was a high level of variation in native, native modified, and hay mixture in the Fescue Ecoregion, hay alfalfa (we removed hay alfalfa from the between-sites graph because the CV was high and it was harming the results visualization), hay mixture, and pasture in the Moist-Mixed Ecoregion, and hay alfalfa and pasture in the Mixed Ecoregion. The Fescue Ecoregion showed greater variation in NDMI between sites compared to the Moist-Mixed and Mixed Ecoregions.
Visually, the CV-PSRI (Figure 8) showed similar patterns for both within and between sites. It is noteworthy that, both within and between sites, the class that showed the greatest variation was hay alfalfa. In the Moist-Mixed and Mixed Ecoregions, native and native modified classes showed low variation in comparison with the other classes.

3.4. Separating Classes Using Comparative Triangles

The results of the comparative triangles were divided into mean and CV vegetation index values (Figure 9). Each side of the triangle (mean or CV) was classified into low (below average) and high (above average) values according to the results obtained above. To facilitate the graphic organization, the classes were converted into codes that correspond the Agriculture and Agri-Food Canada Annual Crop Inventory values [17] (Table 1). In the Fescue Ecoregion, the classes were divided into two groups, with the native grassland, native modified, and hay grass classes being grouped in the upper left part of the triangle, representing relatively higher NDVI, NDMI, and relatively lower PSRI. The other group, composed of hay alfalfa, hay mixture, and pasture, was in the lower right part of the triangle given their relatively lower NDVI, NDMI, and higher PSRI. In the Moist-Mixed Ecoregion, all classes were in different regions of the triangle, which facilitates the differentiation of classes, with emphasis on the hay grass (high NDVI, high NDMI, and low PSRI), and hay mixture (high NDVI, high NDMI, and high PSRI), that were in the upper part of the triangle. In turn, the native grassland (low NDVI, low NDMI, and low PSRI) and native modified (low NDVI, low NDMI, and high PSRI) classes were located at the base of the triangle. Finally, in the Mixed Ecoregion two clusters were observed. The hay alfalfa, hay grass, and hay mixture classes are in the upper left part of the triangle, while the native grassland, native modified, and pasture classes are located on the opposite diagonal which indicates opposite trends in the mean VI values for the two groups.
In the comparative triangles referring to the CV (Figure 9), in the Fescue Ecoregion, four distinct groups were evident. The native grassland and pasture classes belonging to the same group (relatively higher NDVI and PSRI, and relatively lower NDMI variation), while the hay alfalfa and hay mixture classes belong to the same group (relatively higher NDVI and PSRI, and relatively higher NDMI variation). The hay grass class, positioned in the lower left part of the triangle (relatively lower NDVI variation, relatively higher NDMI variation, and relatively lower PSRI variation), and the native modified class, positioned in the upper part of the triangle, were both separable from all other classes. In the Moist-Mixed Ecoregion, the same pattern of distribution within the triangles was observed for the mean VI and the CV values. The hay grass (relatively higher NDVI, NDMI and PSRI variation) and native grassland (relatively higher NDVI and NDMI variation and relatively lower PSRI variation) classes are in the upper part of the triangle. The pasture (relatively lower NDVI and NDMI variation and relatively higher PSRI variation) and hay mixture (relatively lower NDVI, NDMI, and PSRI variation) classes are located at the base of the triangle. Finally, in the Mixed Ecoregion, the variation in the pasture class was most similar to native modified (upper left part of the triangle), while the other seeded forage classes are in the right part of the triangle. In comparison with the Vis triangle, it was noticed that the CVs reached greater separability of the classes.

4. Discussion

This study demonstrated that the ability to discriminate six grassland/forage classes using a single date of Sentinel 2 imagery is ecoregion dependent. The edaphoclimatic characteristics of each ecoregion can be used to explain the results. In the Fescue Ecoregion, where higher precipitation leads to greater soil moisture availability, biomass production of native grasslands is similar to that of seeded species [6]. The spectral reflectance and associated vegetation index values for the various land cover types of interest are also similar leading to the poor discrimination. In the Moist-Mixed and more particularly the Mixed Ecoregions, which are drier [35], the native grasslands showed relatively low productivity and there is greater heterogeneity in biomass production amongst the six classes of interest [25,26]. Based on the report Rangeland Reference Areas [36], which compares the productivity of grasslands in 2016 with previous years in different ecoregions of Alberta, it was possible to identify similar patterns with those observed in the field and in satellite images. In general, it was found that the Fescue Ecoregion historically has greater biomass production, followed by the Moist-Mixed and Mixed Ecoregions.
The analysis of the within- and between-sites variation opens the opportunity for discussions regarding different management practices depending on the grassland type. [37] states that the biophysical parameters of different types of grassland are directly affected by management practices such as burning, haying, grazing, and irrigation which is consistent with other studies [38,39]. In this context, a greater variation of grassland/forage types between different regions is expected, as management practices tend to have different levels of intensity [40,41], which are usually associated with environmental conditions, such as water availability, soil type, slope, and vegetation type [42,43]. For example, the use of irrigation systems tends to decrease water deficit and contribute to higher biomass production [44,45], which would directly affect the result of the analysis via vegetation indices. It is worth mentioning that the vehicle survey also indicated whether there were signs of irrigation and harvest at the time of observation, which can be useful for understanding the results obtained in the present study. In the Fescue Ecoregion only 1% of fields were irrigated while in the Moist-Mixed and Mixed Ecoregions approximately 25% and 15% of the fields were irrigated. Harvest signs were observed only in 1% of the fields in the Fescue Ecoregion, while in the Moist-Mixed Ecoregion the occurrence of harvesting evidence was around 16% of the areas and in the Mixed Ecoregion it was just around 5%.
The results of CV-NDVI within and between sites showed expected patterns given the ecological dynamics in each ecoregion. For example, areas of hay alfalfa and hay grass had lower CV variation at the within-sites level which reveals greater homogeneity in the site and suggests more effective treatments, while native sites had higher CV variation which suggests greater variation in vegetation cover. In turn at a between-sites level, native sites of the same ecoregion tend to present results closer to each other, while hay production areas may be in different phenological stages or they may have been harvested at different times. With even greater heterogeneity, pasture areas can have different types of forage and they are likely susceptible to other factors such as grazing. The CV-NDMI, mainly at between-sites level, showed how moisture affects regions with greater water availability, such as the Fescue Ecoregion, while naturally drier regions, such as the Moist-Mixed Ecoregion and the Mixed Ecoregion, tend to be more heterogeneous regardless of class, which would facilitate class differentiation [6]. Finally, the PSRI was the only index that showed similar visual patterns, regardless of the level of analysis (within sites or between sites). In both cases the greatest variations were observed in hay production areas, which may suggest that different areas, at the time analyzed, were in different phases of their phenological cycle, which contributes to the variation. On the other hand, native areas, mainly in the Moist-Mixed Ecoregion and in the Mixed Ecoregion, showed the smallest variations, which indicates a consistency in terms of plant senescence at the time analyzed, which is in line with the ecological dynamics expected for native species [22,23,46]
The comparative triangles contributed to understanding the dynamics of vegetation cover in each of the ecoregions analyzed. In both the Fescue and Mixed Ecoregions, the pasture class, despite being considered a seeded forage class, presented spectral patterns closer to those of native grassland rather than forages. In the Moist-Mixed Ecoregion it was possible to separate distinct vegetation index and CV ranges for each land cover class. It is also noteworthy that the results of the comparative triangles corroborate the comparison of means and comparison of CVs obtained in this study, as they indicate similar patterns in the Fescue Ecoregion for classes such as native grassland and native modified and hay grass (for the vegetation indices triangle), which reinforces the difficulty of differentiating between classes in an environment with more water availability and greater potential of biomass production. On the other hand, in the Mixed Ecoregion and especially in the Moist-Mixed Ecoregion, separability occurs more clearly.
In the context of differentiating land cover types, other studies such as [23,37,39,47] identified that a multi-temporal approach increases classification accuracy and one of the reasons would be the differential in green-up rate with that of seeded forage being faster than native grassland [22]. Similarly, [46] showed the importance of a multi-temporal approach for differentiating warm season grasses and cool season grasses since cool season grasses reach their peak NDVI in May compared to July for warm season grasses. Therefore, despite being cold ecoregions, a multi-temporal approach may be more effective in identifying different grassland types throughout the growing season.
The results obtained in this study can be useful for different applications such as forage management, monitoring of the productive area, and for insurance purposes. In the context of forage management, it is crucial to identify the location and extent of different grassland/forage types since each of them may require different treatments. In the context of monitoring the forage productive area, from the differentiation of the classes it is possible to estimate the biomass production more precisely. Finally, for insurance purposes, class differentiation allows a more accurate assessment of claims and thus a fairer assessment of losses incurred in the field.

5. Conclusions

In this study we investigated the ability to use spectral characteristics to differentiate six grassland/forage types using a single summer image in three Canadian ecoregions and the variation of land cover within and between sites. In the Fescue Ecoregion, spectral signatures showed great similarities which makes the differentiation infeasible. However, in the Moist-Mixed Ecoregion and especially in the Mixed Ecoregion, class separation proved to be feasible using a suite of vegetation indices involving different parts of the electromagnetic spectrum. Comparison of the vegetation index means also indicated greater limitations for class differentiation in the Fescue Ecoregion, since the values obtained presented less variation amongst classes and less potential for class separability, which suggests greater canopy homogeneity. Separating grassland/forage types in the Moist-Mixed and Mixed Ecoregions proved to be possible, since there was a greater range of reflectance values and the results are consistent with the edaphoclimatic characteristics of each ecoregion. Based on the methodology used in this study, it was concluded that it is not possible to differentiate the native grassland class from the native modified class. The spectral variation analysis in a 3 × 3 window showed less cover variability in the Fescue Ecoregion reaffirming the lower potential for forage separability from the proposed classes. Finally, the comparative triangles are an innovative perspective for analyzing and comparing the results of different inputs in an integrated way. In this context, in the Mixed Ecoregions it was possible to separate the classes into two main groups, one being the hay production areas and the other the native grassland areas plus the pasture class, while in the Moist-Mixed Ecoregion the six classes were more spread across the triangle, both for vegetation indices and for the CV. When comparing the triangles of the VIs and CVs, it was found that the CVs were more efficient for class separation in the Mixed Ecoregion and especially in the Fescue Ecoregion.

Author Contributions

Conceptualization, T.F., A.S., B.H. and X.G.; methodology, T.F., A.S., B.H. and X.G.; software, T.F.; validation, A.S., B.H. and X.G.; formal analysis, T.F., A.S., B.H. and X.G.; investigation, T.F., A.S., B.H. and X.G.; resources, T.F., A.S., B.H., X.G. and E.L.; data curation, T.F., A.S., B.H., X.G. and E.L.; writing—original draft preparation, T.F.; writing—review and editing, A.S., B.H., X.G. and E.L.; visualization, T.F., A.S., B.H., X.G. and E.L.; supervision, A.S., B.H. and X.G.; project administration, A.S., B.H. and X.G.; funding acquisition, A.S., B.H. and X.G. All authors have read and agreed to the published version of the manuscript.

Funding

This research was funded by Agriculture and Agri-Food Canada, The Natural Sciences and Engineering Research Council of Canada (NSERC), and the University of Saskatchewan.

Conflicts of Interest

The authors declare no conflict of interest.

References

  1. Conant, R.T.; Cerri, C.E.P.; Osborne, B.B.; Paustian, K. Grassland Management Impacts on Soil Carbon Stocks: A New Synthesis. Ecol. Appl. 2017, 27, 662–668. [Google Scholar] [CrossRef] [PubMed] [Green Version]
  2. Rinehart, L. Pasture, Rangeland and Grazing Management. National Sustainable Agricultural Information Service; ATTRA Publication #IP306: Butte, MT, USA, 2006. [Google Scholar]
  3. O’Mara, F.P. The Role of Grasslands in Food Security and Climate Change. Ann. Bot. 2012, 110, 1263–1270. [Google Scholar] [CrossRef] [PubMed] [Green Version]
  4. Filho, M.G.; Kuplich, T.M.; De Quadros, F.L.F. Estimating Natural Grassland Biomass by Vegetation Indices Using Sentinel 2 Remote Sensing Data. Int. J. Remote Sens. 2020, 41, 2861–2876. [Google Scholar] [CrossRef]
  5. Jin, Y.; Yang, X.; Qiu, J.; Li, J.; Gao, T.; Wu, Q.; Zhao, F.; Ma, H.; Yu, H.; Xu, B. Remote Sensing-Based Biomass Estimation and Its Spatio-Temporal Variations in Temperate Grassland, Northern China. Remote Sens. 2014, 6, 1496–1513. [Google Scholar] [CrossRef] [Green Version]
  6. Marsett, R.C.; Qi, J.; Heilman, P.; Biedenbender, S.H.; Carolyn Watson, M.; Amer, S.; Weltz, M.; Goodrich, D.; Marsett, R. Remote Sensing for Grassland Management in the Arid Southwest. Rangel. Ecol. Manag. 2006, 59, 530–540. [Google Scholar] [CrossRef]
  7. Zha, Y.; Gao, J.; Ni, S.; Liu, Y.; Jiang, J.; Wei, Y. A Spectral Reflectance-Based Approach to Quantification of Grassland Cover from Landsat TM Imagery. Remote Sens. Environ. 2003, 87, 371–375. [Google Scholar] [CrossRef]
  8. Aragón, R.; Oesterheld, M. Linking Vegetation Heterogeneity and Functional Attributes of Temperate Grasslands through Remote Sensing. Appl. Veg. Sci. 2008, 11, 117–130. [Google Scholar] [CrossRef]
  9. Cui, T.; Martz, L.; Guo, X. Grassland Phenology Response to Drought in the Canadian Prairies. Remote Sens. 2017, 9, 1258. [Google Scholar] [CrossRef] [Green Version]
  10. Fontana, F.; Rixen, C.; Jonas, T.; Aberegg, G.; Wunderle, S. Alpine Grassland Phenology as Seen in AVHRR, VEGETATION, and MODIS NDVI Time Series—A Comparison with In Situ Measurements. Sensors 2008, 8, 2833–2853. [Google Scholar] [CrossRef] [Green Version]
  11. Ali, I.; Cawkwell, F.; Dwyer, E.; Barrett, B.; Green, S. Satellite Remote Sensing of Grasslands: From Observation to Management. J. Plant Ecol. 2016, 9, 649–671. [Google Scholar] [CrossRef] [Green Version]
  12. Xu, D.; Guo, X. Some Insights on Grassland Health Assessment Based on Remote Sensing. Sensors 2015, 15, 3070–3089. [Google Scholar] [CrossRef] [PubMed] [Green Version]
  13. Zhou, W.; Yang, H.; Huang, L.; Chen, C.; Lin, X.; Hu, Z.; Li, J. Grassland Degradation Remote Sensing Monitoring and Driving Factors Quantitative Assessment in China from 1982 to 2010. Ecol. Indic. 2017, 83, 303–313. [Google Scholar] [CrossRef]
  14. Cleland, E.E.; Collins, S.L.; Dickson, T.L.; Farrer, E.C.; Gross, K.L.; Gherardi, L.A.; Hallett, L.M.; Hobbs, R.J.; Hsu, J.S.; Turnbull, L.; et al. Sensitivity of Grassland Plant Community Composition to Spatial vs. Temporal Variation in Precipitation. Ecology 2013, 94, 1687–1696. [Google Scholar] [CrossRef] [PubMed] [Green Version]
  15. Dixon, A.P.; Faber-Langendoen, D.; Josse, C.; Morrison, J.; Loucks, C.J.; Dixon, A. Distribution Mapping of World Grassland Types. Wiley Online Libr. 2014, 41, 2003–2019. [Google Scholar] [CrossRef]
  16. Yang, Y.; Fang, J.; Ma, W.; Wang, W. Relationship between Variability in Aboveground Net Primary Production and Precipitation in Global Grasslands. Geophys. Res. Lett. 2008, 35. [Google Scholar] [CrossRef] [Green Version]
  17. Fisette, T.; Davidson, A.; Daneshfar, B.; Rollin, P.; Aly, Z.; Campbell, L. Annual Space-Based Crop Inventory for Canada: 2009–2014. In Proceedings of the International Geoscience and Remote Sensing Symposium (IGARSS), Quebec City, QC, Canada, 13–18 July 2014; pp. 5095–5098. [Google Scholar]
  18. Pogue, S.J.; Kröbel, R.; Janzen, H.H.; Beauchemin, K.A.; Legesse, G.; de Souza, D.M.; Iravani, M.; Selin, C.; Byrne, J.; McAllister, T.A. Beef Production and Ecosystem Services in Canada’s Prairie Provinces: A Review. Agric. Syst. 2018, 166, 152–172. [Google Scholar] [CrossRef]
  19. Smith, A.M.; Buckley, J.R. Investigating RADARSAT-2 as a Tool for Monitoring Grassland in Western Canada. Can. J. Remote Sens. 2011, 37, 93–102. [Google Scholar] [CrossRef]
  20. Fisher, R.J.; Sawa, B.; Prieto, B. A Novel Technique Using LiDAR to Identify Native-Dominated and Tame-Dominated Grasslands in Canada. Remote Sens. Environ. 2018, 218, 201–206. [Google Scholar] [CrossRef]
  21. Yang, X.; Smith, A.M.; Hill, M.J. Updating the Grassland Vegetation Inventory Using Change Vector Analysis and Functionally-Based Vegetation Indices. Can. J. Remote Sens. 2017, 43, 62–78. [Google Scholar] [CrossRef]
  22. McInnes, W.S.; Smith, B.; McDermid, G.J. Discriminating Native and Nonnative Grasses in the Dry Mixedgrass Prairie with MODIS NDVI Time Series. IEEE J. Sel. Top. Appl. Earth Obs. Remote Sens. 2015, 8, 1395–1403. [Google Scholar] [CrossRef]
  23. Lindsay, E.J.; King, D.J.; Davidson, A.M.; Daneshfar, B. Canadian Prairie Rangeland and Seeded Forage Classification Using Multiseason Landsat 8 and Summer RADARSAT-2. Rangel. Ecol. Manag. 2019, 72, 92–102. [Google Scholar] [CrossRef]
  24. Olimb, S.K.; Dixon, A.P.; Dolfi, E.; Engstrom, R.; Anderson, K. Prairie or Planted? Using Time-Series NDVI to Determine Grassland Characteristics in Montana. GeoJournal 2018, 83, 819–834. [Google Scholar] [CrossRef]
  25. Shorthouse, J.D. Ecoregions of Canada’s Prairie Grasslands. Arthropods Can. Grassl. 2010, 1, 53–81. [Google Scholar] [CrossRef]
  26. Bailey, A.W.; Schellenberg, M.P.; McCartney, D. Management of Canadian Prairie Rangeland; Agriculture and Agri-Food Canada: Ottawa, ON, Canada, 2010.
  27. Gitelson, A.A.; Merzlyak, M.N.; Zur, Y. Non-Destructive and Remote Sensing Techniques for Estimation of Vegetation Status. In Proceedings of the 3rd European Conference on Precision Agriculture, Montpelier, France, 18–20 June 2001; University of Nebraska: Lincoln, NE, USA, 2001. [Google Scholar]
  28. Huete, A.; Didan, K.; Miura, T.; Rodriguez, E.P.; Gao, X.; Ferreira, L.G. Overview of the Radiometric and Biophysical Performance of the MODIS Vegetation Indices. Remote Sens. Environ. 2002, 83, 195–213. [Google Scholar] [CrossRef]
  29. Tucker, C.J.; Elgin, J.H.; McMurtrey, J.E.; Fan, C.J. Monitoring Corn and Soybean Crop Development with Hand-Held Radiometer Spectral Data. Remote Sens. Environ. 1979, 8, 237–248. [Google Scholar] [CrossRef]
  30. Galvao, L.; Formaggio, A.; Environment, D.T.-R. Discrimination of Sugarcane Varieties in Southeastern Brazil with EO-1 Hyperion Data. Remote Sens. Environ. 2005, 94, 523–534. [Google Scholar] [CrossRef]
  31. Wilson, E.H.; Sader, S.A. Detection of Forest Harvest Type Using Multiple Dates of Landsat TM Imagery. Remote Sens. Environ. 2002, 80, 385–396. [Google Scholar] [CrossRef]
  32. Anderegg, J.; Yu, K.; Aasen, H.; Walter, A.; Liebisch, F.; Hund, A. Spectral Vegetation Indices to Track Senescence Dynamics in Diverse Wheat Germplasm. Front. Plant Sci. 2020, 10, 1749. [Google Scholar] [CrossRef] [Green Version]
  33. Apan, A.; Held, A.; Phinn, S.; Markley, J. Formulation and Assessment of Narrow-Band Vegetation Indices from EO-1 Hyperion Imagery for Discriminating Sugarcane Disease. In Proceedings of the Spatial Sciences Institute Biennial Conference (SSC 2003): Spatial Knowledge without Boundaries, Canberra, Australia, 22–26 September 2003; pp. 1–13. [Google Scholar]
  34. Sims, D.A.; Gamon, J.A. Relationships between Leaf Pigment Content and Spectral Reflectance across a Wide Range of Species, Leaf Structures and Developmental Stages. Remote Sens. Environ. 2002, 81, 337–354. [Google Scholar] [CrossRef]
  35. Hall-Beyer, M. Patterns in the Yearly Trajectory of Standard Deviation of NDVI over 25 Years for Forest, Grasslands and Croplands across Ecological Gradients in Alberta, Canada. Int. J. Remote Sens. 2012, 33, 2725–2746. [Google Scholar] [CrossRef]
  36. Environment Alberta. 2016 Range Reference Area Report for the Southern Grasslands; Environment Alberta: Edmonton, AB, Canada, 2017.
  37. Li, Q.; Wang, C.; Zhang, B.; Lu, L. Object-Based Crop Classification with Landsat-MODIS Enhanced Time-Series Data. Remote Sens. 2015, 7, 16091–16107. [Google Scholar] [CrossRef] [Green Version]
  38. Griffith, J.A.; Price, K.P.; Martinko, E.A. A Multivariate Analysis of Biophysical Parameters of Tallgrass Prairie Among Land Management Practices and Years. Environ. Monit. Assess. 2001, 68, 249–271. [Google Scholar] [CrossRef] [PubMed]
  39. Stumpf, F.; Schneider, M.K.; Keller, A.; Mayr, A.; Rentschler, T.; Meuli, R.G.; Schaepman, M.; Liebisch, F. Spatial Monitoring of Grassland Management Using Multi-Temporal Satellite Imagery. Ecol. Indic. 2020, 113, 106201. [Google Scholar] [CrossRef]
  40. Gómez Giménez, M.; de Jong, R.; Della Peruta, R.; Keller, A.; Schaepman, M.E. Determination of Grassland Use Intensity Based on Multi-Temporal Remote Sensing Data and Ecological Indicators. Remote Sens. Environ. 2017, 198, 126–139. [Google Scholar] [CrossRef]
  41. Peeters, A.; Beaufoy, G.; Canals, R.M.; De Vliegher, A.; Huyghe, C.; Isselstein, J.; Jones, J.; Kessler, W.; Kirilovsky, D.; Van Den Pol-Van Dasselaar, A. Grassland Term Definitions and Classifications Adapted to the Diversity of European Grassland-Based Systems. In Proceedings of the 25th EGF General Meeting on “EGF at 50: The Future of European Grasslands”, Aberystwyth, UK, 7–11 September 2014; pp. 743–750. [Google Scholar]
  42. Kizeková, M.; Hopkins, A.; Kanianska, R.; Makovníková, J.; Pollák, Š.; Pálka, B. Changes in the Area of Permanent Grassland and Its Implications for the Provision of Bioenergy: Slovakia as a Case Study. Grass Forage Sci. 2018, 73, 218–232. [Google Scholar] [CrossRef] [Green Version]
  43. Porqueddu, C.; Ates, S.; Louhaichi, M.; Kyriazopoulos, A.P.; Moreno, G.; del Pozo, A.; Ovalle, C.; Ewing, M.A.; Nichols, P.G.H. Grasslands in ‘Old World’ and ‘New World’ Mediterranean-Climate Zones: Past Trends, Current Status and Future Research Priorities. Grass Forage Sci. 2016, 71, 1–35. [Google Scholar] [CrossRef]
  44. Hudewenz, A.; Klein, A.-M.; Scherber, C.; Stanke, L.; Tscharntke, T.; Vogel, A.; Weigelt, A.; Weisser, W.W.; Ebeling, A. Herbivore and Pollinator Responses to Grassland Management Intensity along Experimental Changes in Plant Species Richness. Biol. Conserv. 2012, 150, 42–52. [Google Scholar] [CrossRef]
  45. Rose, L.; Leuschner, C. The Diversity–Productivity Relationship in a Permanent Temperate Grassland: Negative Diversity Effect, Dominant Influence of Management Regime. Plant Ecol. Divers. 2012, 5, 265–274. [Google Scholar] [CrossRef]
  46. Wang, C.; Jamison, B.E.; Spicci, A.A. Trajectory-Based Warm Season Grassland Mapping in Missouri Prairies with Multi-Temporal ASTER Imagery. Remote Sens. Environ. 2010, 114, 531–539. [Google Scholar] [CrossRef]
  47. Gómez, C.; White, J.C.; Wulder, M.A. Optical Remotely Sensed Time Series Data for Land Cover Classification: A Review. ISPRS J. Photogramm. Remote Sens. 2016, 116, 55–72. [Google Scholar] [CrossRef] [Green Version]
Figure 1. Study area of the three ecoregions and locations of survey points collected in July 2019.
Remotesensing 14 02121 g001
Figure 2. General workflow of the method used in this study.
Remotesensing 14 02121 g002
Figure 3. Spectral signature, derived from Sentinel-2 images, for different grass/forage types in three ecoregions: (A) Fescue Ecoregion, (B) Moist-Mixed Ecoregion, and (C) Mixed Ecoregion.
Remotesensing 14 02121 g003
Figure 4. Mean and standard deviation of NDMI values for the grassland/forage land classes in the three ecoregions.
Remotesensing 14 02121 g004
Figure 5. Mean and standard deviation PSRI values for the grassland/forage land classes in the three different ecoregions.
Remotesensing 14 02121 g005
Figure 6. The within-sites (WS) and between-sites (BS) NDVI coefficient of variation (CV) for six land cover types located at three ecoregions.
Remotesensing 14 02121 g006
Figure 7. The within-sites (WS) and between-sites (BS) NDMI coefficient of variation (CV) for six land cover types located at three ecoregions.
Remotesensing 14 02121 g007
Figure 8. The within-sites (WS) and between-sites (BS) PSRI coefficient of variation (CV) for six land cover types located at three ecoregions.
Remotesensing 14 02121 g008
Figure 9. Comparative triangles based on vegetation index mean and coefficient of variation values for the Fescue, Moist-Mixed, and Mixed Ecoregions. 101 = Native Grassland; 105 = Native Modified; 201 = Hay Alfalfa; 203 = Hay Grass; 204 = Hay Mixture; 210 = Pasture.
Remotesensing 14 02121 g009
Table 1. Description of the grassland/forage classes used in this study.
Class Level-1Class Level-2Code *Samples
Fescue
Samples Moist-MixedSamples MixedDescription
Native grasslandNative1017793269Land dominated by native grasses and managed as a natural ecosystem
Modified/Invaded105252169Land dominated by introduced or invasive species and managed as a natural ecosystem
Seeded
forage
Hay Alfalfa20172737Land devoted to hay production (mainly alfalfa)
Hay Grass20320279Land devoted to hay production (mainly grass)
Hay Alfalfa/Grass204253015Land devoted to hay production (mixture of alfalfa and grass)
Pasture210515350Lands isolated by fences, which receive periodic cultural treatments, composed of forage plants used to feed grazing animals
* The codes refer to those in the AAFC annual crop inventory [17].
Table 2. ANOVA test results for NDVI mean and standard deviation for the grassland/forage land classes in the three ecoregions.
NDVI Mean [Standard Deviation]
Grassland TypesFescueMoist-MixedMixed
Native0.61[0.025]a *0.36[0.019]b #0.31[0.010]d ^
Native Modified0.63[0.023]a *0.36[0.019]bc #0.28[0.012]d ^
Hay Alfalfa0.56[0.012]a *0.78[0.012]a #0.82[0.013]a #
Hay Grass0.62[0.016]a *0.43[0.019]bc #0.74[0.011]a *
Hay Mixture0.54[0.017]a *0.45[0.014]c *0.54[0.012]b *
Pasture0.58[0.022]a *0.45[0.019]c #0.43[0.016]c #
Note: letters a–d indicate significant differences between grassland/forage types in each ecoregion and the symbols *, # and ^ indicate significance between ecoregions for the same grassland/forage type.
Publisher’s Note: MDPI stays neutral with regard to jurisdictional claims in published maps and institutional affiliations.

