Article

Initial In-Flight Spectral Calibration of the Near-Infrared Spectra Acquired by the MarSCoDe Onboard the Zhurong Rover

1
Key Laboratory of Space Active Opto-Electronics Technology, Shanghai Institute of Technical Physics, Chinese Academy of Sciences, Shanghai 200083, China
2
University of Chinese Academy of Sciences, Beijing 100049, China
3
Institute of Geology and Geophysics, Chinese Academy of Sciences, Beijing 100029, China
4
Hangzhou Institute for Advanced Study, University of Chinese Academy of Sciences, Hangzhou 310024, China
5
Key Laboratory of Lunar and Deep Space Exploration, National Astronomical Observatories, Chinese Academy of Sciences, Beijing 100101, China
6
Anhui Institute of Optics and Fine Mechanics, Chinese Academy of Sciences, Hefei 230000, China
*
Author to whom correspondence should be addressed.
Remote Sens. 2022, 14(9), 2137; https://doi.org/10.3390/rs14092137
Submission received: 30 March 2022 / Revised: 26 April 2022 / Accepted: 27 April 2022 / Published: 29 April 2022
(This article belongs to the Special Issue Planetary Remote Sensing: Chang’E-4/5 and Mars Applications)

Abstract

:
The Zhurong rover successfully landed in southern Utopia Planitia as part of the Tianwen-1 mission on 15 May 2021. One of the objectives of the Mars Surface Composition Detector (MarSCoDe) onboard the rover is to investigate mineral compositions on the Martian surface by measuring the near-infrared reflectance spectra. Before conducting spectral interpretation, in-flight data calibration is a crucial step due to the significant differences between the laboratory and the Martian environment. The work of the MarSCoDe spectrometer is based on an acousto-optic tunable filter (AOTF). The temperature variation of the AOTF could induce wavelength offset, making mineral identification uncertain. We first analyzed the viewing geometry of the spectral measurements of the calibration targets on the Mars rover according to its attitude to identify the anomalous data. The wavelength offsets were then determined by fitting the absorption positions of CO2 at ~1400 and ~2000 nm, representing the primary composition of the Martian atmosphere. The results showed 2–8 nm wavelength offsets, which correlated well with AOTF temperatures. The artifacts were removed in the wavelength-corrected reflectance spectra, which is critical to identify the material types on Mars, especially water-related minerals.

1. Introduction

The Zhurong rover (Mars 2020 mission, CNSA) is exploring the mineral diversity of southern Utopia Planitia and the characteristics of the Martian topography and geological structure, along with the soil on the Martian surface and the distribution of water and ice, in addition to other scientific objectives [1,2]. Amongst its science payload, the MarSCoDe instrument plays a significant role in the Mars habitability investigation by providing rapid, synergistic, and fine-scale mineralogy, chemistry, and color imaging [3]. It carries a short-wave infrared spectrometer (SWIR), which will obtain short-wave infrared spectra of Martian surface minerals, data that were missing from all exploration missions to Mars until 2020. The SWIR is a miniaturized point spectrometer (~36.5 mrad field of view) located in the MarSCoDe’s detection unit. Its spectral range (0.85–2.4 µm) covers major silicate and hydrated mineral absorption features. Compared to the near-infrared spectrometer IRS (~1.15 mrad field of view and 1.3–2.6 µm range) on the Perseverance rover [4], the SWIR has a larger field of view and a wider spectral range.
Mars is a dusty, cold, desert planet with a very thin atmosphere. In the nominal mission phase, under the guidance of the remote sensing survey, the Zhurong rover is traveling south for specific in situ investigations, gradually approaching the direction of the highland–lowland boundary (HLB) and the suspected shorelines [2]. The MarSCoDe SWIR has conducted calibration and exploration missions on those sols (a sol is a Martian solar day, lasting about 1.0275 Earth solar days).
However, for the SWIR short-wave infrared hyperspectral data obtained, necessary data quality analysis must be performed before conducting scientific analysis. In a situation where the Mars rover could not use the surveillance camera to monitor the condition of the calibration panel, we determined the Mars rover attitude and the calibration panel plane and obtained the true incidence and azimuth angles of the calibration panel plane light to determine the quality of the calibration panel data from the Mars rover. We noticed that one-third of the calibration panel data would fail quantization when applied to the reflectance factor (REFF) calculations for the sol’s science survey. The matter was investigated for two reasons: the shadowing of the Sun’s rays due to the rover’s mechanics and the low irradiance due to the rover’s attitude causing a large angle of incidence when observing the calibration panel. This part of the work will guide the CNSA for subsequent science targeting the use of the MarSCoDe SWIR to obtain more valid calibration data.
The SWIR is an infrared spectrometer, the work of which is based on an acousto-optic tunable filter (AOTF), a spectroscopic device based on the principle of the acousto-optic effect that allows us to change the diffraction wavelength of a broadband or multilinear laser source through a crystal by controlling a radiofrequency (RF) power amplifier [5]. The deformation of the photoelectric device is caused by changes in the sensor imaging environment, misalignment of the photoelectric element due to mechanical vibrations, and aging of the photoelectric element itself; these make the center wavelength and full width at half maximum (FWHM) of each band of the sensor change with the imaging environment, causing large systematic drift [6,7,8]. Similarly, studies of SuperCam have found this type of monochromator is sensitive to internal thermal effects. They rely on the observation of the IR White SuperCam Calibration Target (SCCT) as a reflectance reference, and various algorithms to remove anomalous spectral points, atmospheric spectral signatures and increase the global signal to noise ratio (SNR) [9]. It is also difficult for the laboratory to simulate the dynamic changes of such complex scenarios, meaning the central wavelengths obtained from spectral calibrations or subsequent laboratory simulations are not truly representative of the central wavelengths of the sensors at the time of remote sensing data acquisition.
Therefore, research on the spectral calibration of hyperspectral remote sensing data focuses on the visible, near infrared and short-wave infrared spectral bands based on characteristic atmospheric scenes. The principle of spectral calibration based on characteristic atmospheric scenes is mainly to assume that the spectral response function (SRF) of the sensor is a Gaussian function, compare the difference between the simulated data and the original data in the characteristic absorption spectrum and nearby spectra, and adjust the central wavelength of the simulated data until the difference between the two is minimized to finally obtain an accurate central wavelength. These spectral calibration methods can be divided into three categories, depending on the ultimate goal: one is to assume a constant SRF and FWHM in the comparison process (using laboratory calibration results) and to find only the correct central wavelength [10,11,12,13,14]. Second, the SRF is assumed to be a Gaussian function, and the central wavelength and FWHM are changed simultaneously to finally find the correct central wavelength and FWHM [15,16,17,18,19,20]. Third, the simulated spectra are obtained by choosing different types of SRF, assuming that the central wavelength and FWHM are changed very little, and comparing with the original data to finally find the optimal SRF [21]. In addition to directly comparing the simulated data with the original data, it has also been proposed that we can calculate the parameters in the atmospheric radiative transfer equation and obtain the correct central wavelength and FWHM by adjusting them and inverting the reflectance until the spikes in the inverted reflectance curve disappear [22,23].
In this work, we performed the central wavelength offset and FWHM offset solution for the filtered MarSCoDe SWIR data and utilized the atmospheric absorption characteristics of Mars containing 95% CO2 to spectrally calibrate the hyperspectral remote sensing data acquired by the MarSCoDe SWIR (850–2400 nm, 311 band) with two CO2 absorption bands within 1428~2100 nm. The atmospheric simulation program used for spectral calibration was MODTRAN (MODerate resolution atmospheric TRANsmission). Because the calculated FWHM offset and the ratio of the FWHM corresponding to the laboratory calibration are less than 2%, the effect on the spectral calibration is negligible. Therefore, this paper focuses on the correction of the central wavelength and its influence. The spectral calibration results showed that the spectral calibration method based on the characteristic absorption scene effectively corrected the central wavelength offset of the spectrometer and achieved a good spectral calibration effect, supporting the proposal that it should be used as one of the important data-processing bases for subsequent spectral data-processing and scientific research discovery based on SWIR data. The corrected spectra are essential to the identifications of minerals in the landing area of the Zhurong rover and will thus help to better understand the water environment on the northern plain of Mars.

2. Materials and Methods

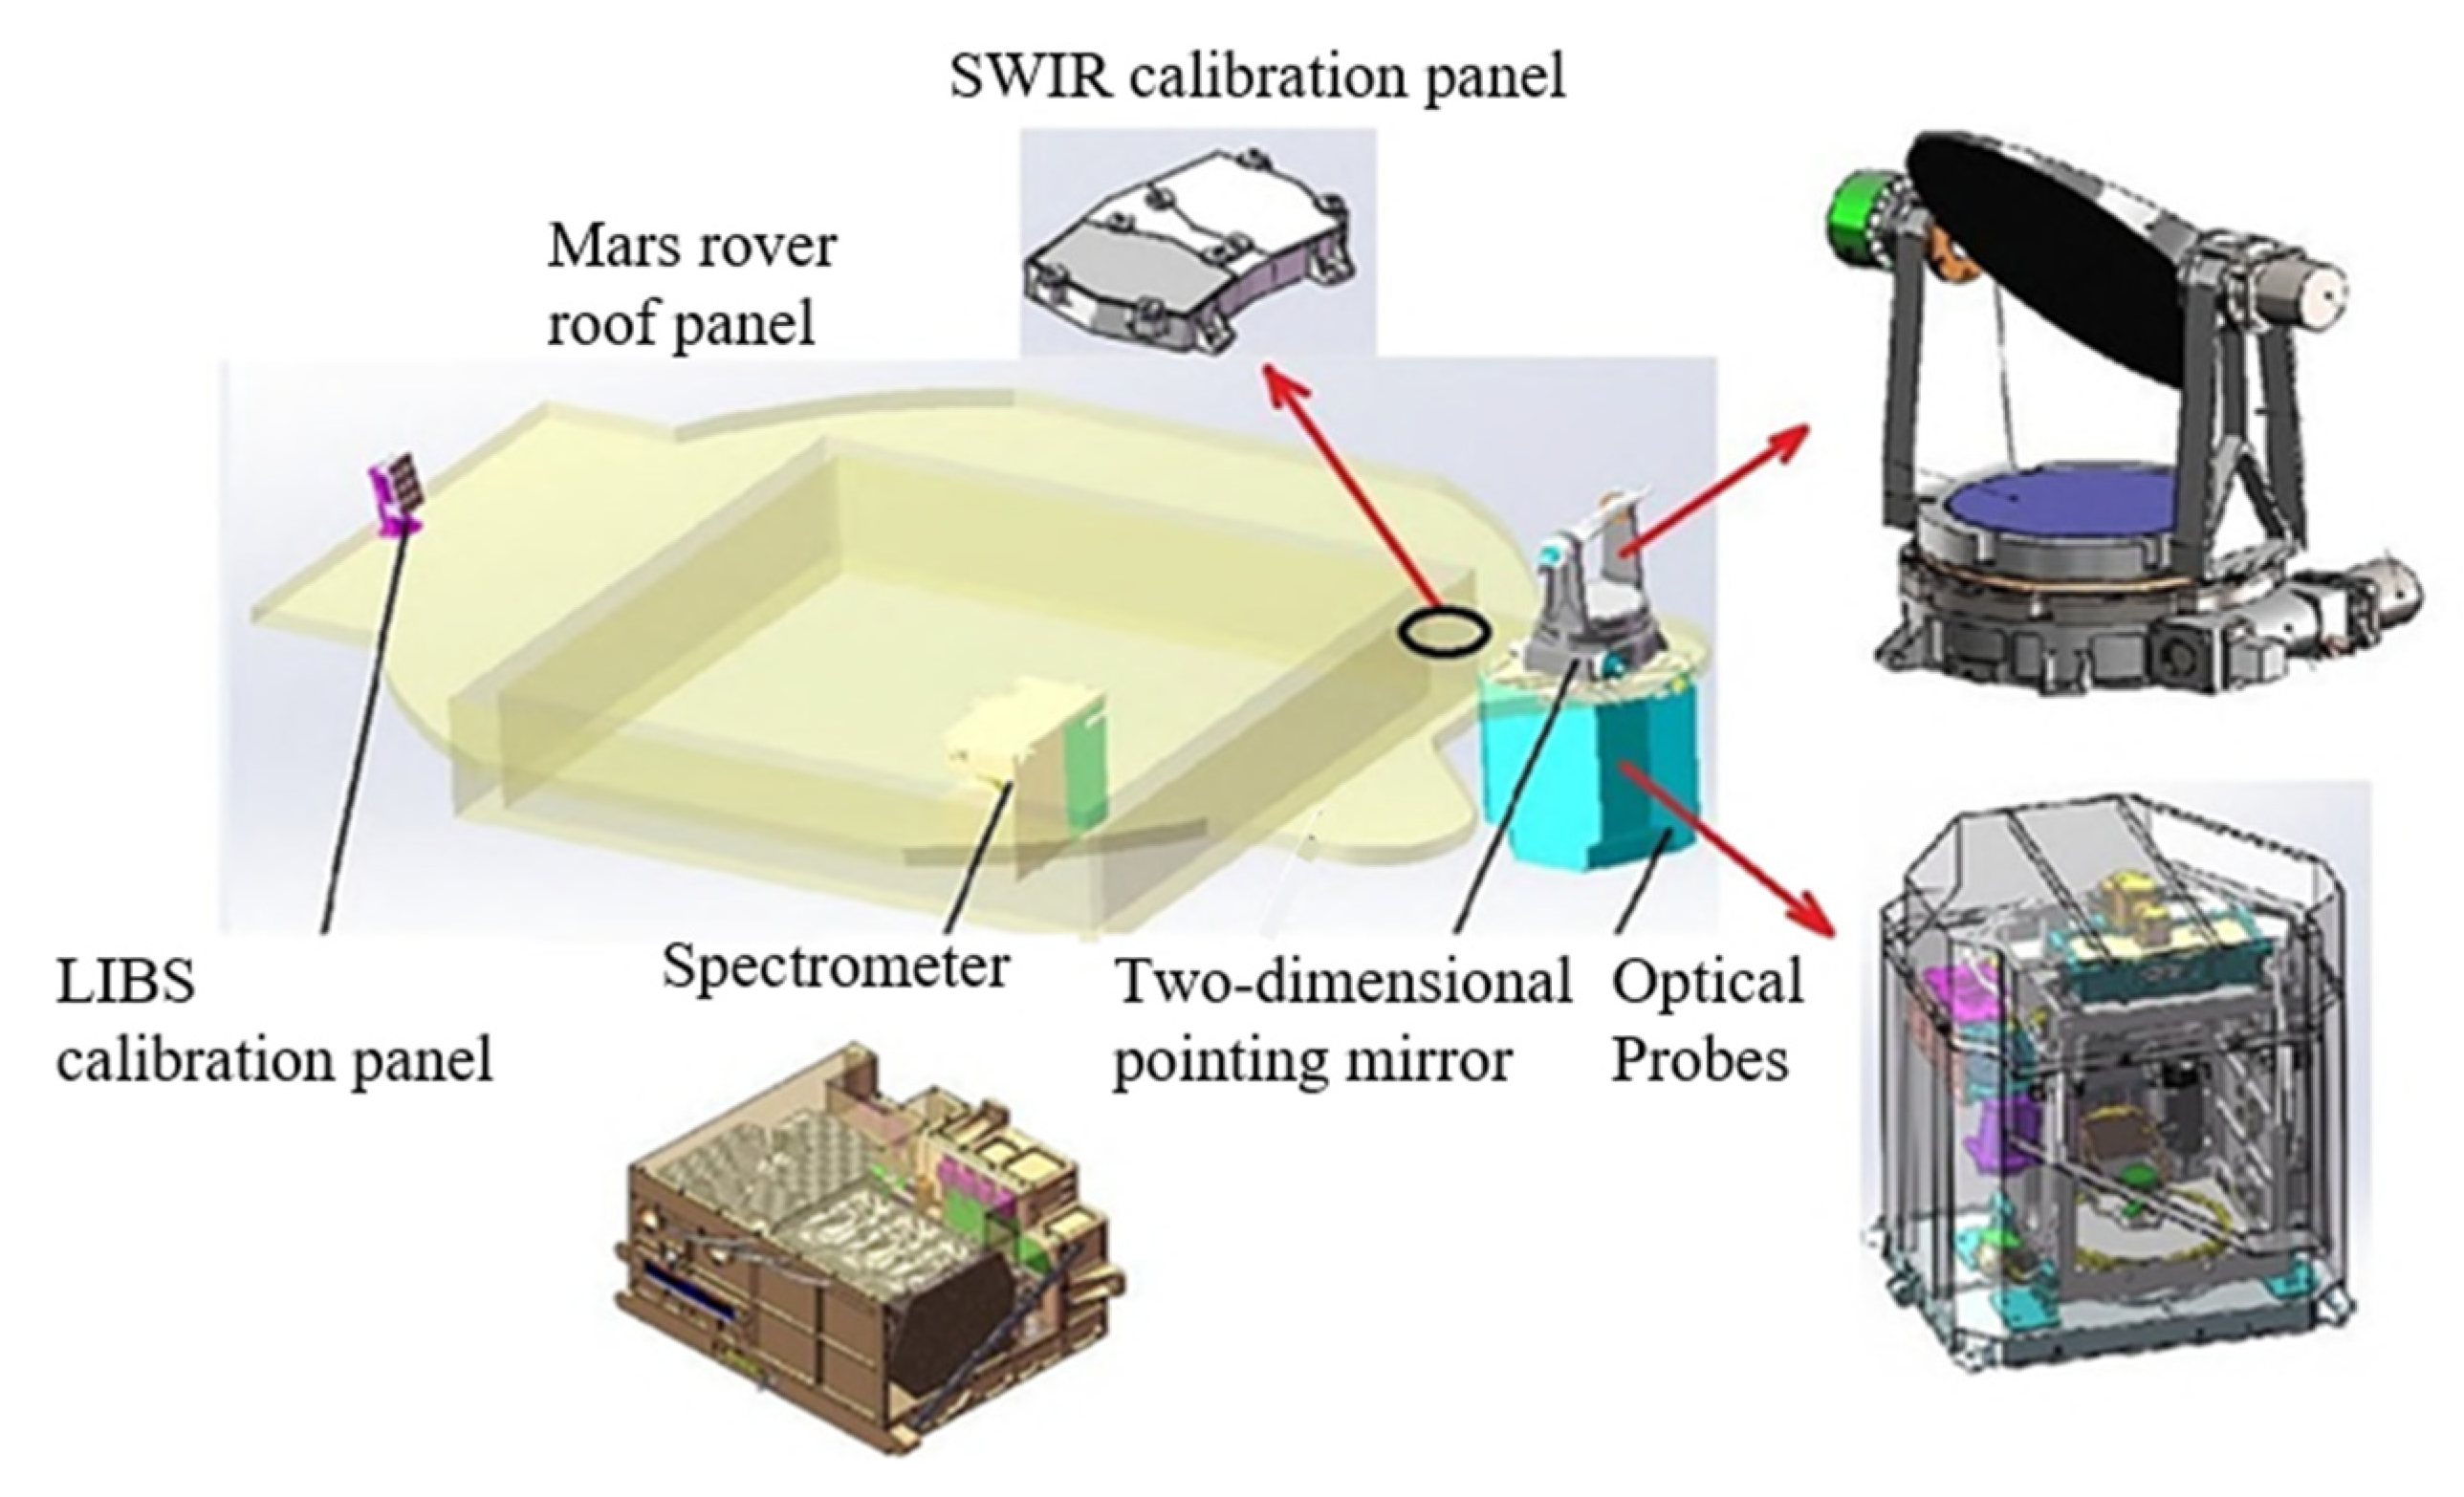
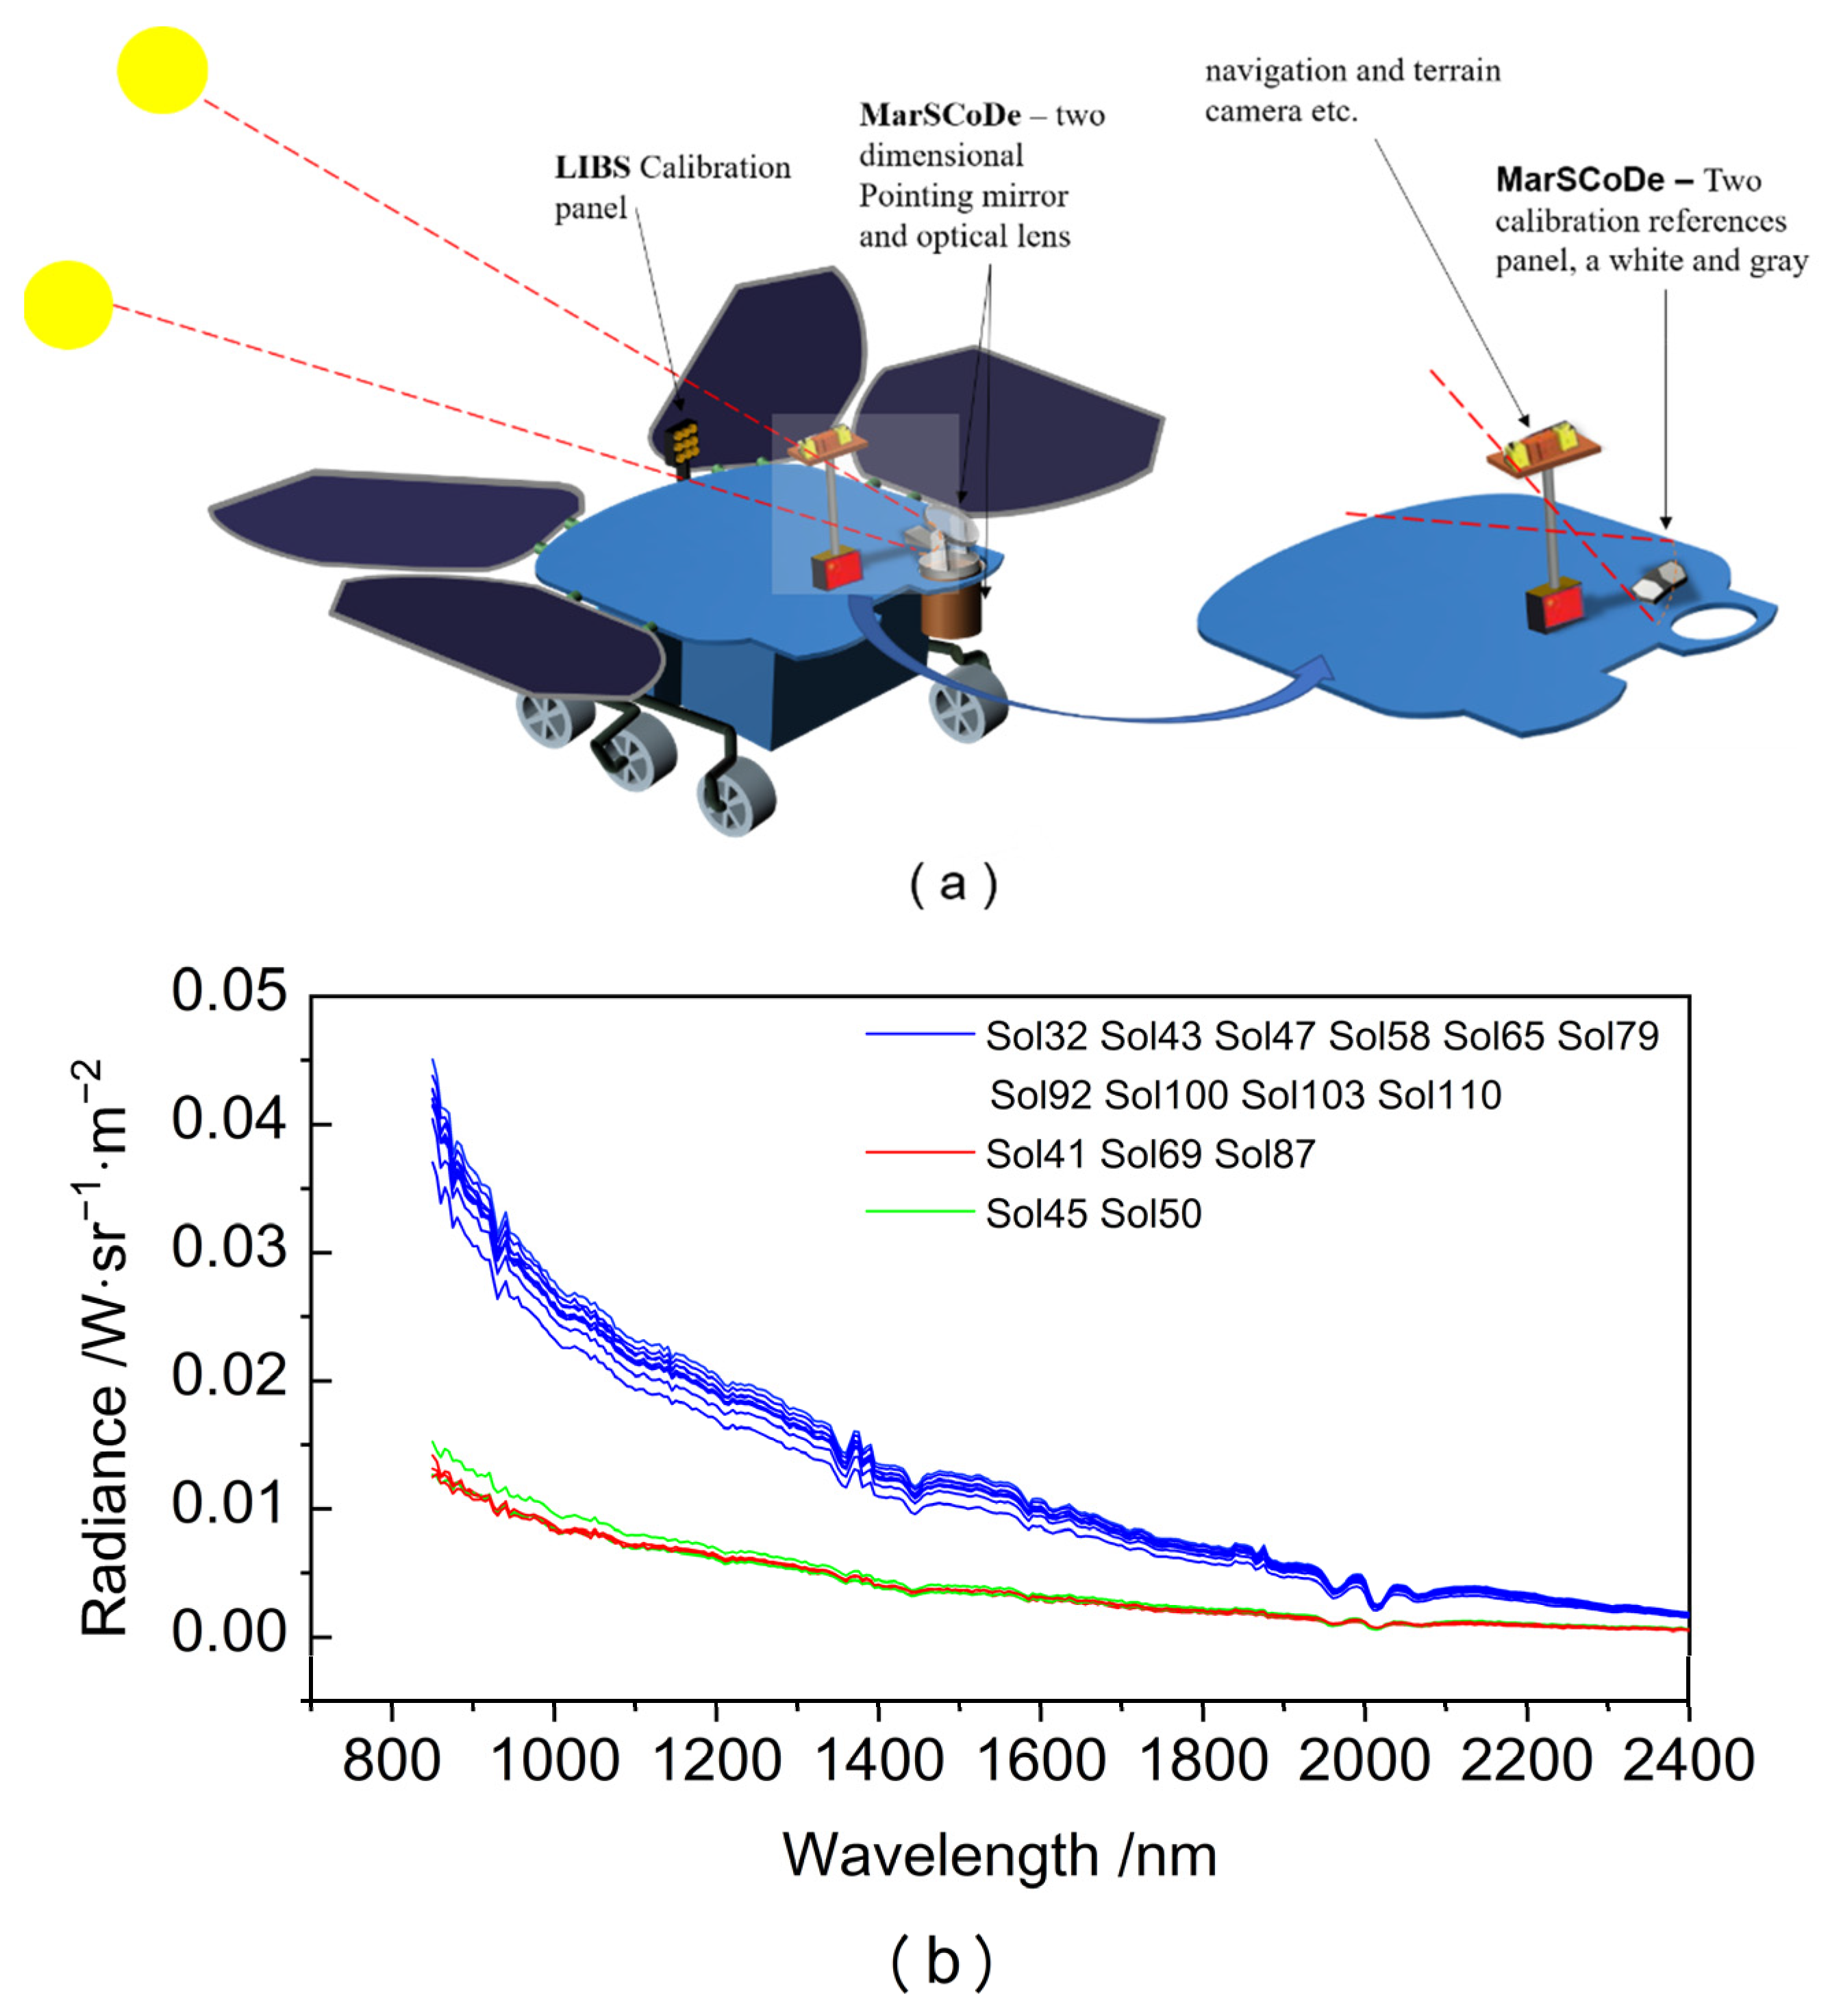
2.1. MarSCoDe SWIR Data

The MarSCoDe integrates a laser-induced breakdown spectroscopy (LIBS) spectrometer, a SWIR spectrometer, micro-imager, and calibration panels for in situ detection of the material composition of the surface of Mars, and obtains comprehensive information such as atomic spectra, molecular spectra, and micro-area topography of the target, for a physical description and quantitative inversion of the sampled target. MarSCoDe consists of an out-of-cabin probe, an in-cabin spectrometer, a main control circuit in the load controller, and a LIBS calibration panel and short-wave calibration panel on the vehicle body, as shown in Figure 1. The out-of-cabin probe part completes the functions of focusing, ranging, 2D pointing, and microscopic imaging; the in-cabin spectrometer part is used to obtain scientific data such as the LIBS spectra and SWIR spectra; the main control circuit and power circuit are in the load. The main control circuit and power supply circuit are in the load controller, which carries out the work of data downlinking and command status communications [24].
The main performance parameters of the MarSCoDe SWIR are shown in Table 1. The incident spectral signal is acquired in a step-and-scan manner by using AOTF to control the wavelength of the transmitted light through the RF signal, covering the wavelength range of 850–2400 nm; the spectral bandwidth is ≤12 nm when the full spectrum is acquired.
After dark-current subtraction and radiometric correction, the data obtained by the SWIR spectrometer were transformed to radiance by the engineering team. Two calibration references, white and gray panels, were carried by the rover to calibrate the SWIR spectra. The white and gray panels had a reflectivity of 99% and 40%, respectively [3]. The accuracy error of the radiometric calibration of the SWIR spectrometer was less than 5% [3]. The targets were located by the 2D pointing mirror of the MarSCoDe. The field-of-view of the SWIR spectrometer was 36.5 mrad (2.0913°). To date, calibration panel and science survey irradiance data have been released for 15 sols; we used these data for data quality evaluation and spectral calibration.

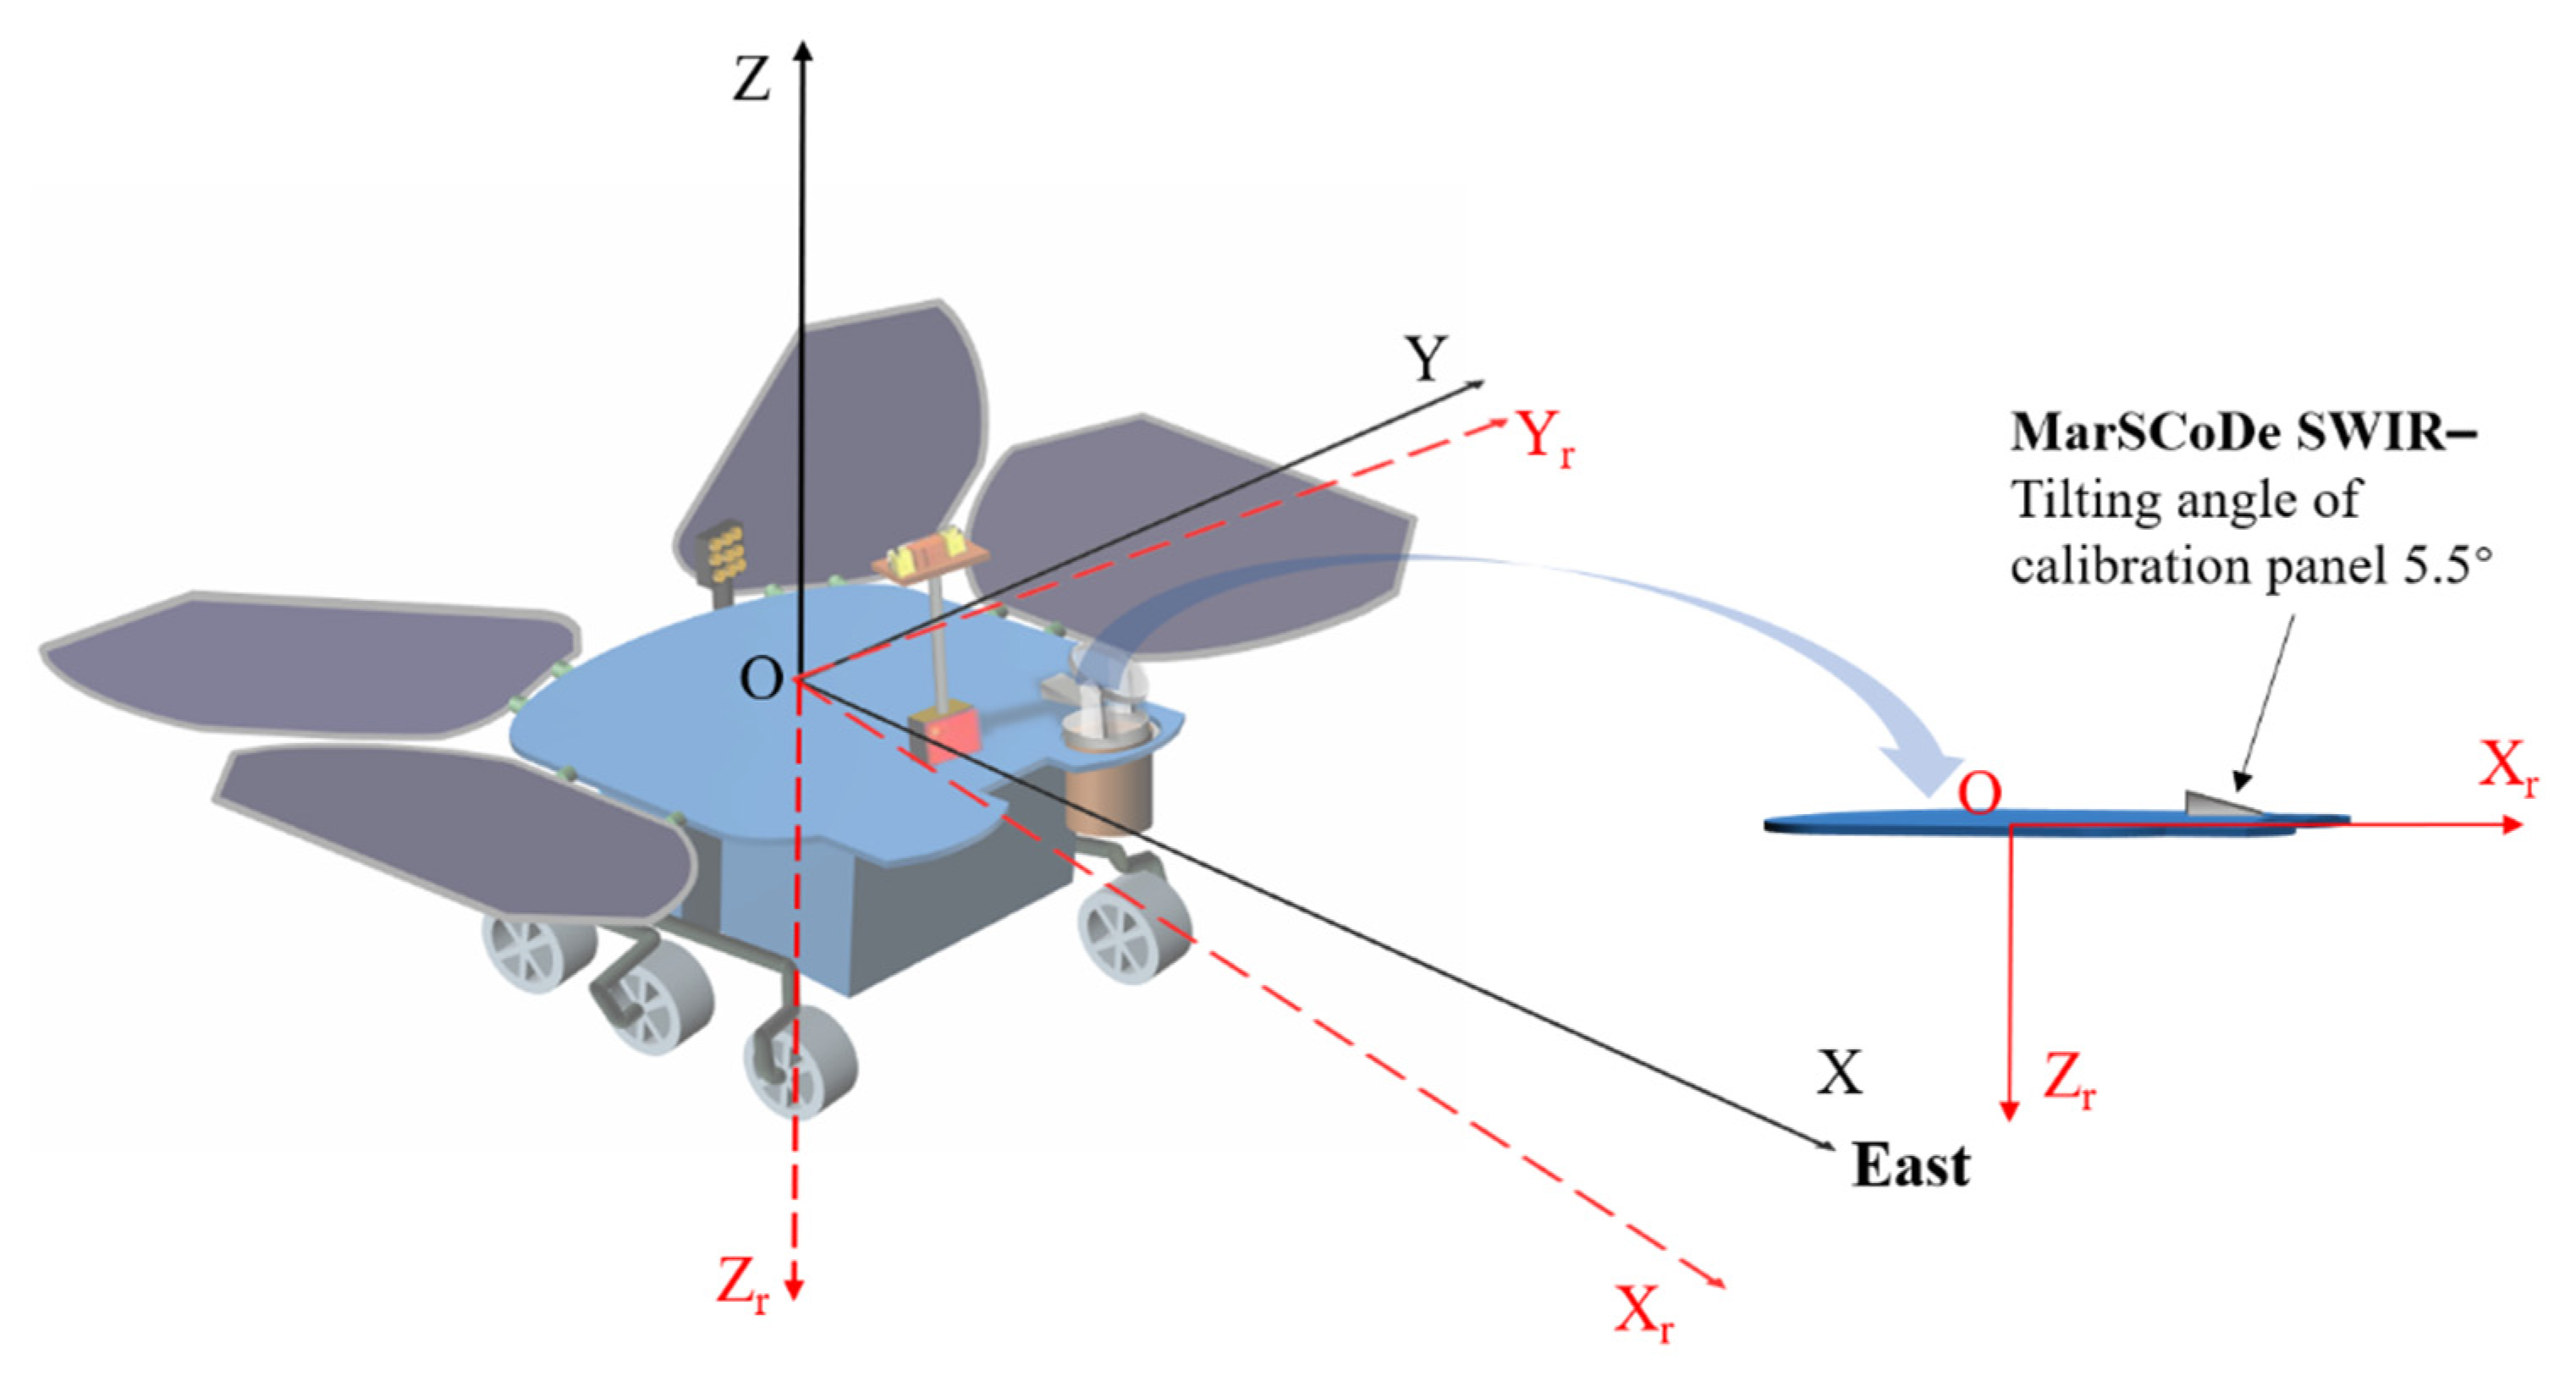
2.2. Positional Analysis

The raw data released by the CNSA recorded the light conditions of the rover; we needed to transfer the body coordinate system to the local cartesian coordinate system to obtain the actual incidence and azimuth angles of the calibration panel plane.
As shown in Figure 2 (left), according to the Mars rover’s design, the local cartesian coordinate system is based on the Mars rover’s location as the coordinate origin, and the coordinate axes point vertically to the east, north, and sky, which is the north-east-sky coordinate system, represented by O-XYZ. The body coordinate system is determined by the origin and attitude of the navigation object to be solved in the navigation. The origin of the body coordinate system is the Mars rover described by the navigation results, and the axes are fixed to the carrier, denoted by O-Xr Yr Zr. The Xr axis is defined as the forward direction (of normal navigation), the Yr axis is the left direction, the Zr axis is the earth direction (downward direction), and the three axes form an orthogonal coordinate system. For the angular motion of the Mars rover, the axes of the carrier coordinate system are also referred to as the roll, pitch, and yaw axes, where the X-axis direction is the roll axis, the Y-axis direction is the pitch axis, and the Z-axis direction is the yaw axis, all as specified by the right-handed spiral rule. When the yaw, pitch, and roll all equal zero, the head of the car is pointing east. The solar incidence angle and solar azimuth are polar angle values in O-XYZ. The calibration panel is mounted behind the LIBS pointing mechanism of the car body, in the Xr-Zr plane, at an angle of 5.5° to Xr, that is, an additional 5.5° to be considered when rotating around the Yr axis, as shown in Figure 2 (right).
The order of rotation of the coordinate system is as follows: Rotation angle ( γ ,   θ ,   ψ ) , rotation order (Z- > Y- > X), external rotation, and Euler angle rotation order: yaw (Z-axis)–pitch (Y-axis)–roll (X-axis). We obtain the rotation matrix:
C n b = C n 1 C 1 2 C 2 b C 5.5 = [ cos   γ sin   γ 0 sin   γ cos   γ 0 0 0 1 ] [ cos   θ 0 sin   θ 0 1 0 sin   θ 0 cos   θ ] [ 1 0 0 0 cos   ψ sin   ψ 0 sin   ψ cos   ψ ] [ cos   5.5 ° 0 sin   5.5 ° 0 1 0 sin   5.5 ° 0 cos   5.5 ° ]

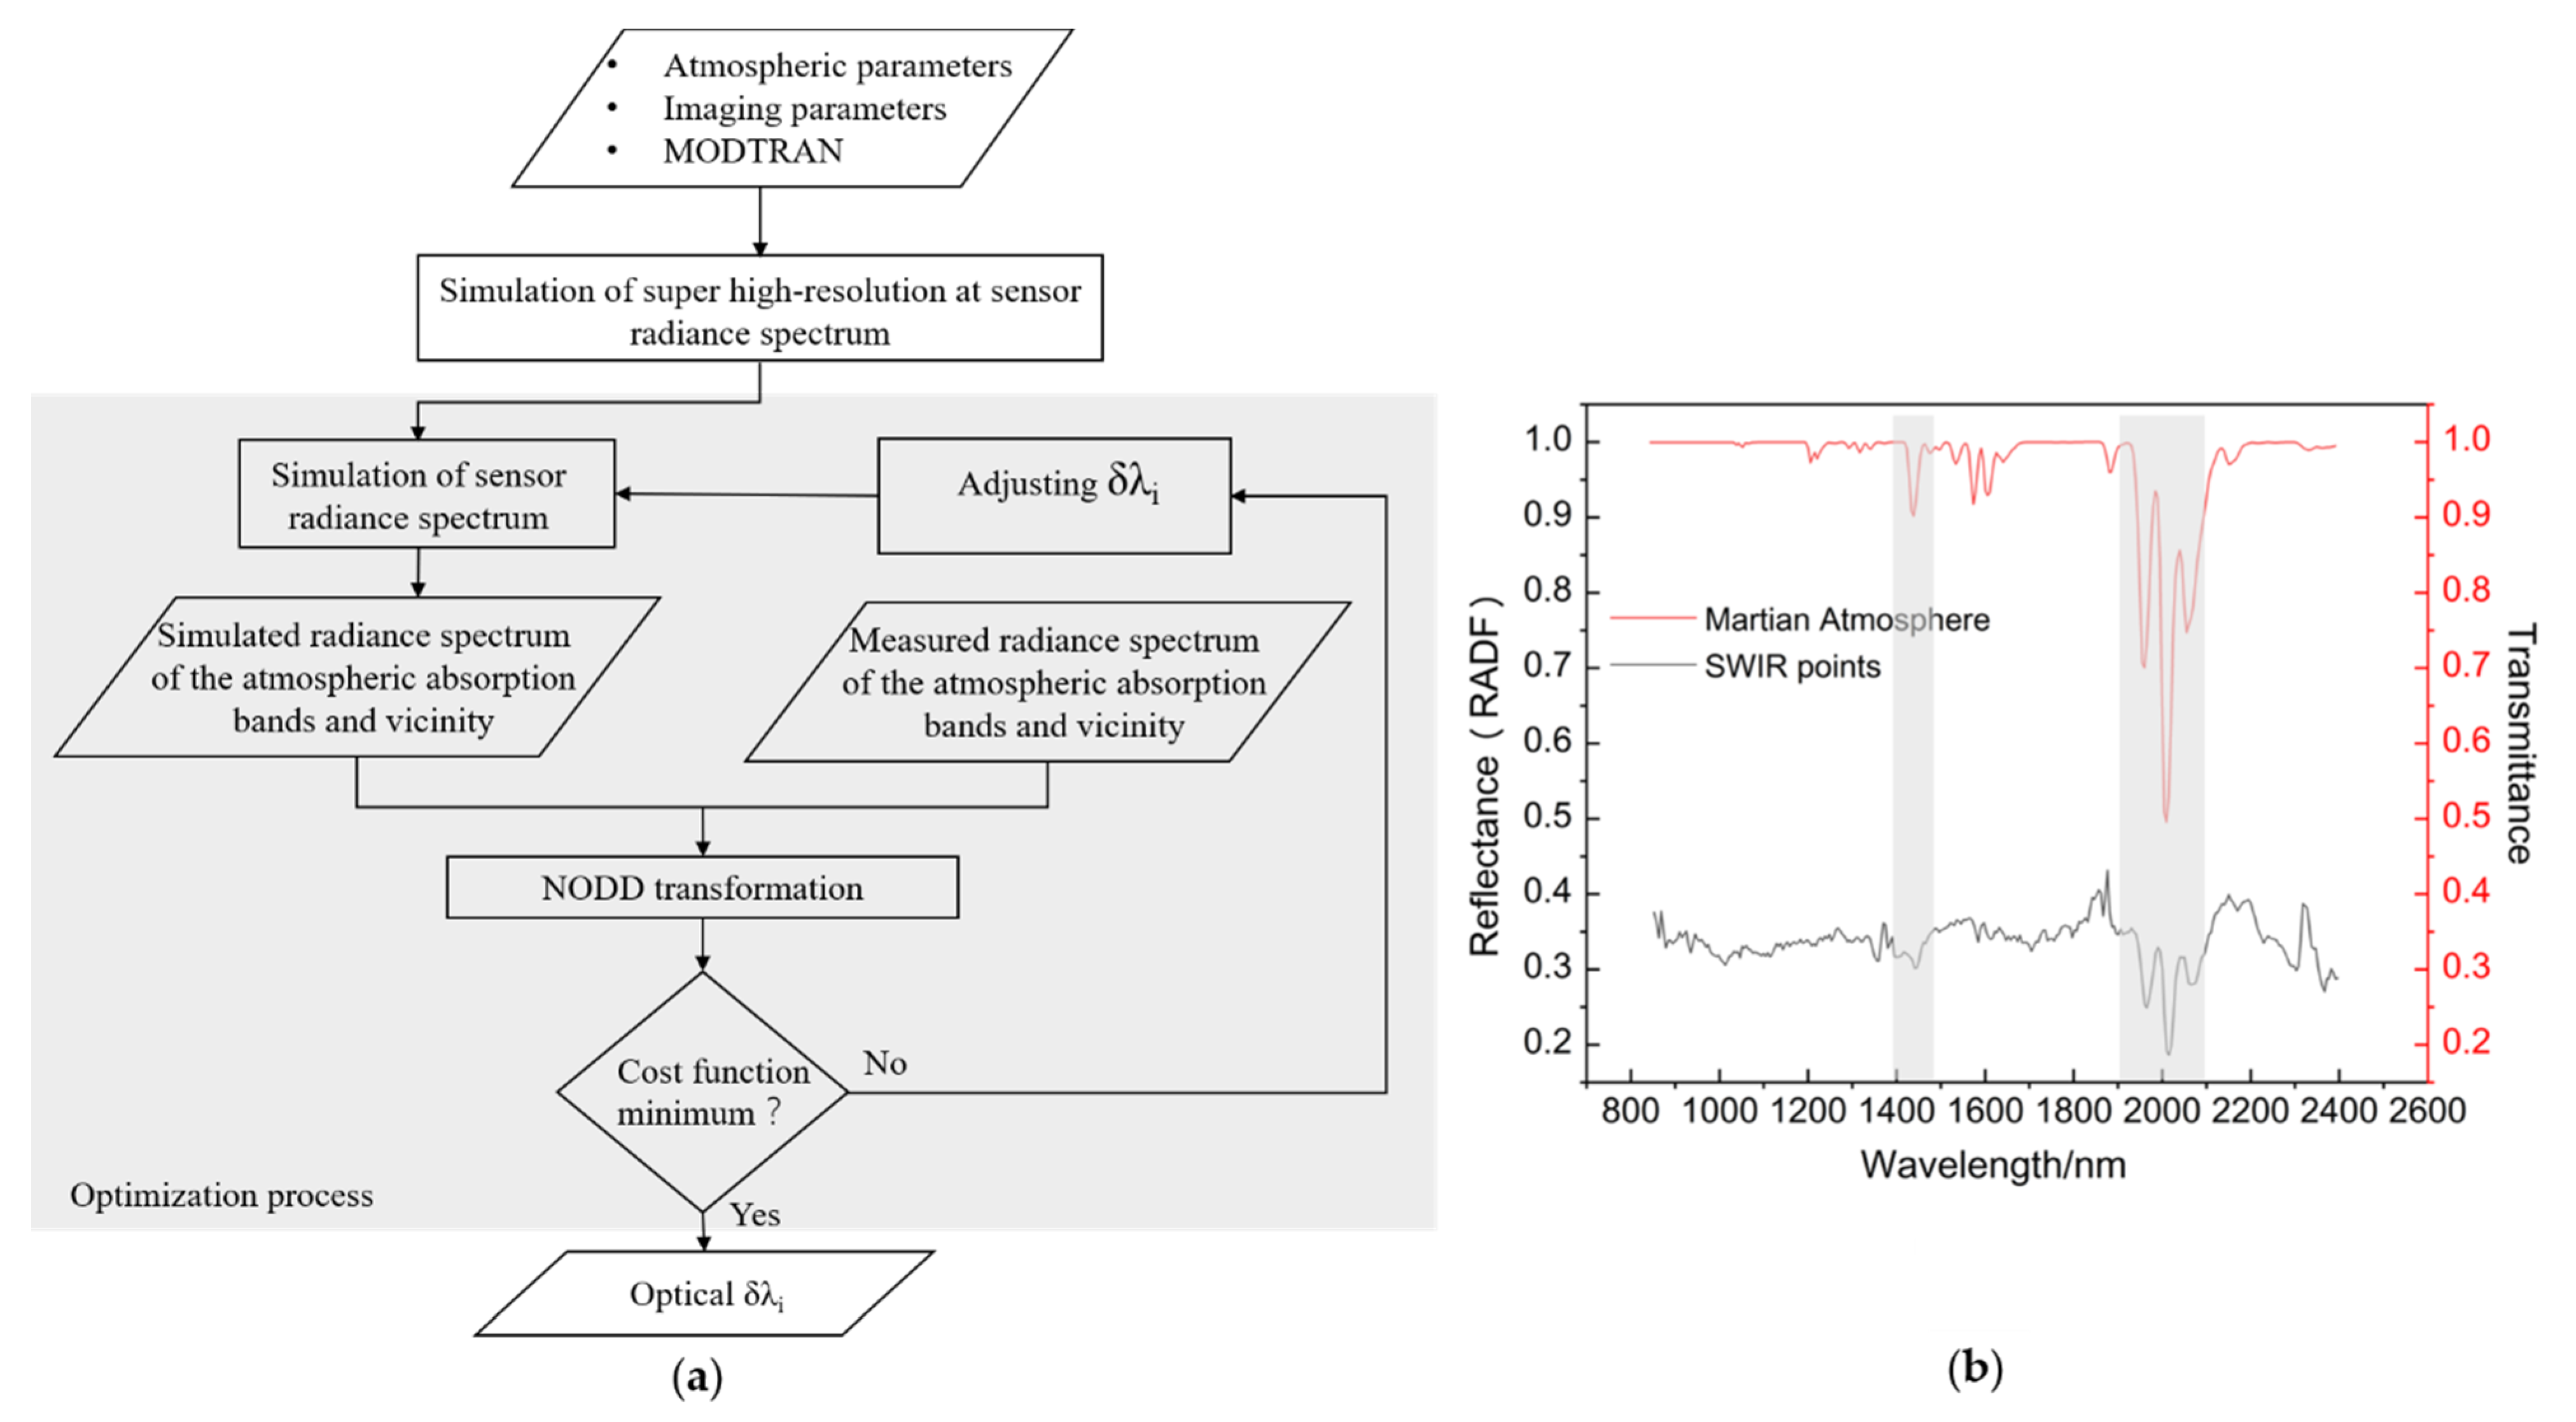
2.3. Spectral Calibration Methods

The composition of the Martian atmosphere is mainly CO2, accounting for 95.3%, followed by 2.7% nitrogen, 1.6% argon, 0.13% oxygen, 0.07% CO, and 0.03% water gas [25]. Due to this clear and simple atmospheric composition, the Martian atmosphere has a distinct absorption characteristic spectrum, which is CO2 absorption. Therefore, the central wavelength correction technique based on the absorption of the characteristic spectrum is perfectly suited to MarSCoDe SWIR spectral calibration. The calibration process mainly includes super-high-resolution (1 nm) pupil-radiation brightness-spectrum simulation, pupil-radiation brightness-spectrum simulation, and an optimization process, as shown in Figure 3a. First, the atmospheric and imaging parameters at the time of data acquisition are inputted into MODTRAN atmospheric radiation transmission simulation software to obtain the simulated ultra-high-resolution pupil-radiation brightness spectrum (1 nm resolution). Then, the super-high-resolution pupil-radiation brightness spectrum is convolved by the adjusted central wavelength (λi + δλi) to obtain the simulated pupil-radiation brightness spectrum. The simulated atmospheric absorption band and its nearby incident radiant brightness spectra are selected for comparison with the measured radiant brightness spectra, and the optimal δλi is obtained by the optimization algorithm.
Figure 3b shows the simulated spectral curve of the Mars atmospheric transmittance (red) with one of the reflectance curves without wavelength correction; it can be seen that the peaks or valleys of the atmospheric absorption band near 1400 and 2005 nm are distinctive. The rest of the peaks and valleys caused by atmospheric absorption are easily mixed with noise. Therefore, the absorption ranges of 1400–1480 nm and 1990–2050 nm were selected as the atmospheric absorption feature correction bands for the spectral calibration.
In the optimization process, the normalized optical density differential (NODD) transform [26] is first performed on the simulated pupil-in radiation brightness spectrum and the measured radiation brightness spectrum, and then, they are compared. The NODD transformation mainly consists of (1) taking the negative logarithm of the radiation brightness spectrum (measured and simulated pupil entry), (2) calculating the derivative after taking the negative logarithm spectrum to obtain the differential spectrum, and (3) carrying out the standard normal distribution transformation on the differential spectrum to obtain the so-called normalized optical thickness differential spectrum (NODD spectrum). The optimal solution is sought using Powell’s algorithm [27] with a cost function of:
f = ( 1 γ ) S D + γ S A
S D = 1 n i = 1 n ( R i R i o ) 2
S A = 1 π a t cos [ i = 1 n R i R i o i = 1 n ( R i ) 2 i = 1 n ( R i o ) 2 ]
where f is the cost function; R i is the NODD spectrum obtained from the transformation of simulated data; R i o is the NODD spectrum obtained from the transformation of measured data; SD (spectral distance) is the Euclidean distance between R i and R i o ; SA is the spectral angle between R i and R i o .

3. Results and Discussion

Taking the gray panel as an example, we obtained a new incidence angle (N-incidence) and azimuth angle (N-azimuth), as shown in Table 2, where N-azimuth is the angle between the negative direction of the X-axis and the projection, defined as positive for clockwise and negative for counterclockwise.
Therefore, when observing the mechanical design of the Mars rover with light incidence, as shown in Figure 4a, we find that sol 41, sol 69, and sol 87 are obscured by the calibration panel riser; sol 45 and sol 50 may be obscured; and there is also a certain probability that the radiant energy is low due to the large incidence angle. The irradiance of the gray panel in Figure 4b confirms our conclusion.
Based on the above process, we completed a quality analysis of the MarSCoDe SWIR calibration panel data based on the rover attitude and excluded the sol’s calibration data with inferior quality. Two important reasons for the negative data quality in the data acquisition process were proposed: mechanical structure blocking and a low incidence angle. Scientists controlling the exploration work should take care to avoid the calibration state when the calibration panel plane is at an azimuth of about −150°, −45° and an incidence angle >60°, to ensure more valid scientific target data is collected for each exploration in the future.
After removing the calibration panel data from sols such as sol 41, sol 69, and sol 87, about 50 sets of data (10 sets of gray calibration panels, 10 sets of white calibration panels, and about 30 sets of science detection points) from a total of 10 sols were screened, and the wavelength offsets of the two spectral intervals corresponding to the characteristic spectrum of CO2 absorption were calculated for each set of data using the method described above, that is, the difference between the troughs of the characteristic spectrum at different AOTF temperatures compared to the standard Mars atmospheric transmission absorption spectrum. In Figure 5, the X- and Y-axes indicate the offsets of the correction coefficients at different AOTF temperatures, respectively, and are fitted separately, showing a significant trend of linear variation of the correction coefficients with the change of AOTF temperature.
We calculated that the fitted curve R2 for the absorption center wavelength in the vicinity of 1400 was 0.830, the standard error of the intercept was 0.117, the standard error of the slope was 0.006, and the fitted linear equation is:
Y 1400 = 0.0861 T 7.9742
The fitted R2 curve for the absorption center wavelength in the vicinity of 2000 was 0.984, the standard error of the intercept was 0.039, the standard error of the slope was 0.002, and the fitted linear equation is:
    Y 2000 = 0.1141 T 6.8022
where Y 1400 and Y 2000 were the offsets of the two characteristic absorption intervals of the AOTF at T temperature, respectively.
We believe that the offset of the AOTF wavelength with temperature is linear in the ideal case. Then, the wavelength offset coefficient of the full spectrum can be obtained using the central wavelength offset of these two points, which is
G a i n = Y 1400 Y 2000 X 1400 X 2000
B i a s = Y 1400 X 2000 Y 2000 X 1400 X 2000 X 1400
where X 1400 and X 2000 are the absorption troughs in the corresponding interval, that is, the central wavelength position. Gain and Bias are the slope and intercept of the corresponding linear offset value equation, and they are used for wavelength correction:
o f f s e t i = G a i n X i + B i a s
where X i is i spectral band, and o f f s e t i is the corresponding wavelength correction value.
Taking the radiance data of the gray calibration panel of sol 32 as an example, as shown in Figure 6a, the central wavelength shift of the full spectrum after correction is obtained, and Figure 6b expresses the mutual position of one of the spectral curves before and after correction.
To quantitatively analyze whether there is a wavelength shift after wavelength correction, the spectral data was recalculated for feature position offset. As shown in Figure 7, the central wavelengths in both characteristic spectral bands were well corrected. The mean value of the central wavelength offset near 1400 nm was −0.414 nm with a standard deviation of 0.215 nm. The mean value of the central wavelength offset near 2000 nm was 0.040 nm with a standard deviation of 0.160 nm.
Then, with the corrected wavelength, the irradiance of different central wavelengths will change, as shown in Figure 8. Taking the curves of sol 32, sol 58, and sol 103 and considering the white calibration panel’s radiance factor (RADF) before and after correction, as an example, not only is the central wavelength corrected but the reflectivity value is also corrected to some extent, and the reflectivity is greatly reduced especially after 2200 nm. The reason for this may be that, before the correction, the misalignment relationship leads to a change in the reflectance value due to a non-uniform wavelength calculation during the RADF calculation. More crucially, at 2300 nm, misleading absorption characteristics are eliminated, preventing us from making wrong mineral identifications. The absorption features at ~2300 nm imply the presence of Fe/Mg phyllosilicates. It should be noted that the wavelength correction is just one of the important steps in the radiation correction, and other corrections including atmospheric correction, solar incident angle correction, etc., are needed to obtain the true reflectance value. The RADF calculation formula is:
R A D F λ = I λ D 2 π E s u n c o s   θ
where I λ is the radiance of the scientific exploration target wavelength λ; E s u n is the solar irradiance; D is the Mars-sun distance; θ is the solar incidence angle.
In addition, after obtaining the corrected wavelengths, not only is the RADF wavelength shift corrected but the calculation of REFF is also corrected for the relative reflectance, as shown in Figure 9. With the sol 32, sol 58, and sol 103 white panels and reflectance to calculate the REFF for the Mars science exploration sites, we can use the following:
R E F F λ = I λ I c a l r c a l
where I λ is the irradiance at wavelength λ;   I c a l is the irradiance of the calibration panel; r c a l is the reflectance of the calibration panel based on laboratory measurements.
The wavelength correction not only suppresses the noise to a certain extent but also, more importantly, eliminates the spike at around 2000 nm. The analysis suggests that the spike here is also due to wavelength offset, which leads to a misaligned calculation of the brightness of the radiation in different spectral bands; overcoming this, the wavelength correction eliminates the effect here. The calibrated REFF clearly exhibits the absorption band near 1900 nm (a spectral signature indicating the presence of the water molecule). This shows that wavelength correction in radiometric calibration is particularly important for performing accurate mineral analysis. It should be noted that the effects of Mars dust buildup on the calibration panels weren’t removed in this work; thus, the absorption features of REFF spectra are not final results. We only focused on the wavelength correction in this study.

4. Conclusions

This research provides a quality analysis of the first MarSCoDe SWIR science exploration irradiance data and a spectral calibration of the system wavelength offset with AOTF temperature variation, thus providing an important reference for subsequent Mars rover SWIR exploration work and data use. This research makes the following two contributions:
  • Based on the obtained calibration panel data for 15 sols, using the observation angle and Mars rover attitude, we calculated the actual solar incidence angle and azimuth angle corresponding to each, and from the Mars rover mechanical design, we analyzed and obtained the reasons for the bad quality of the data. As the Mars rover continues to make science target observations, it should avoid the following two scenarios: the overall attitude of the rover causes the calibration panel to reach an actual solar incidence angle greater than 60° and a scenario where the incident light shines in front of the right side of the rover (azimuth about −150° to −45°). We can prevent all cases of shadow covering and low incident energy owing to the attitude if we avoid both cases. This is the key to determining the REFF quantitatively.
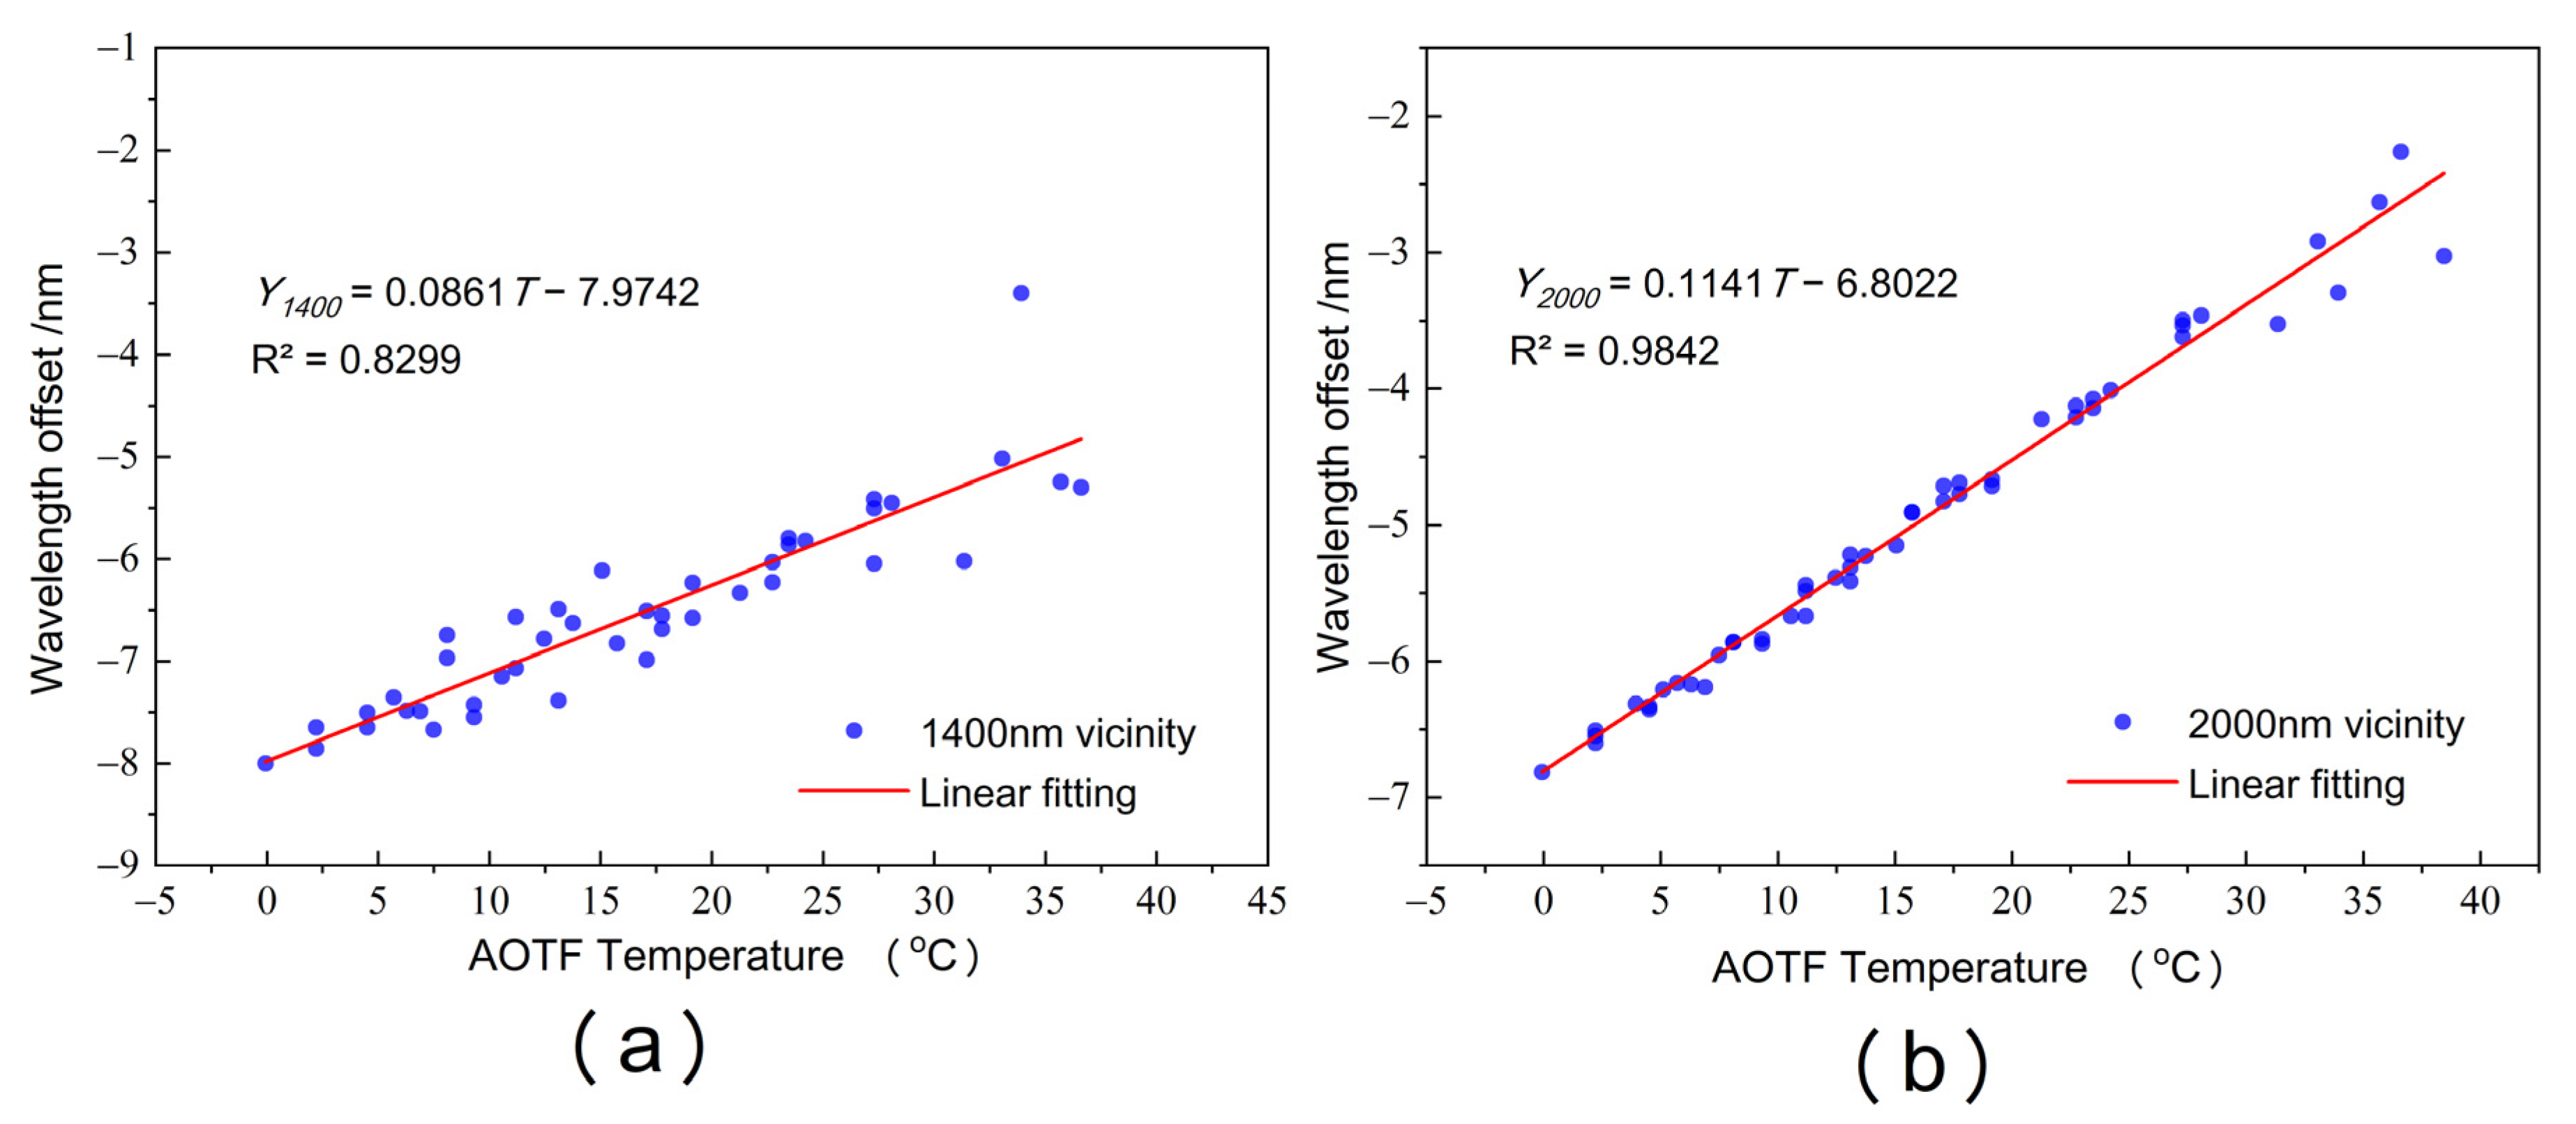
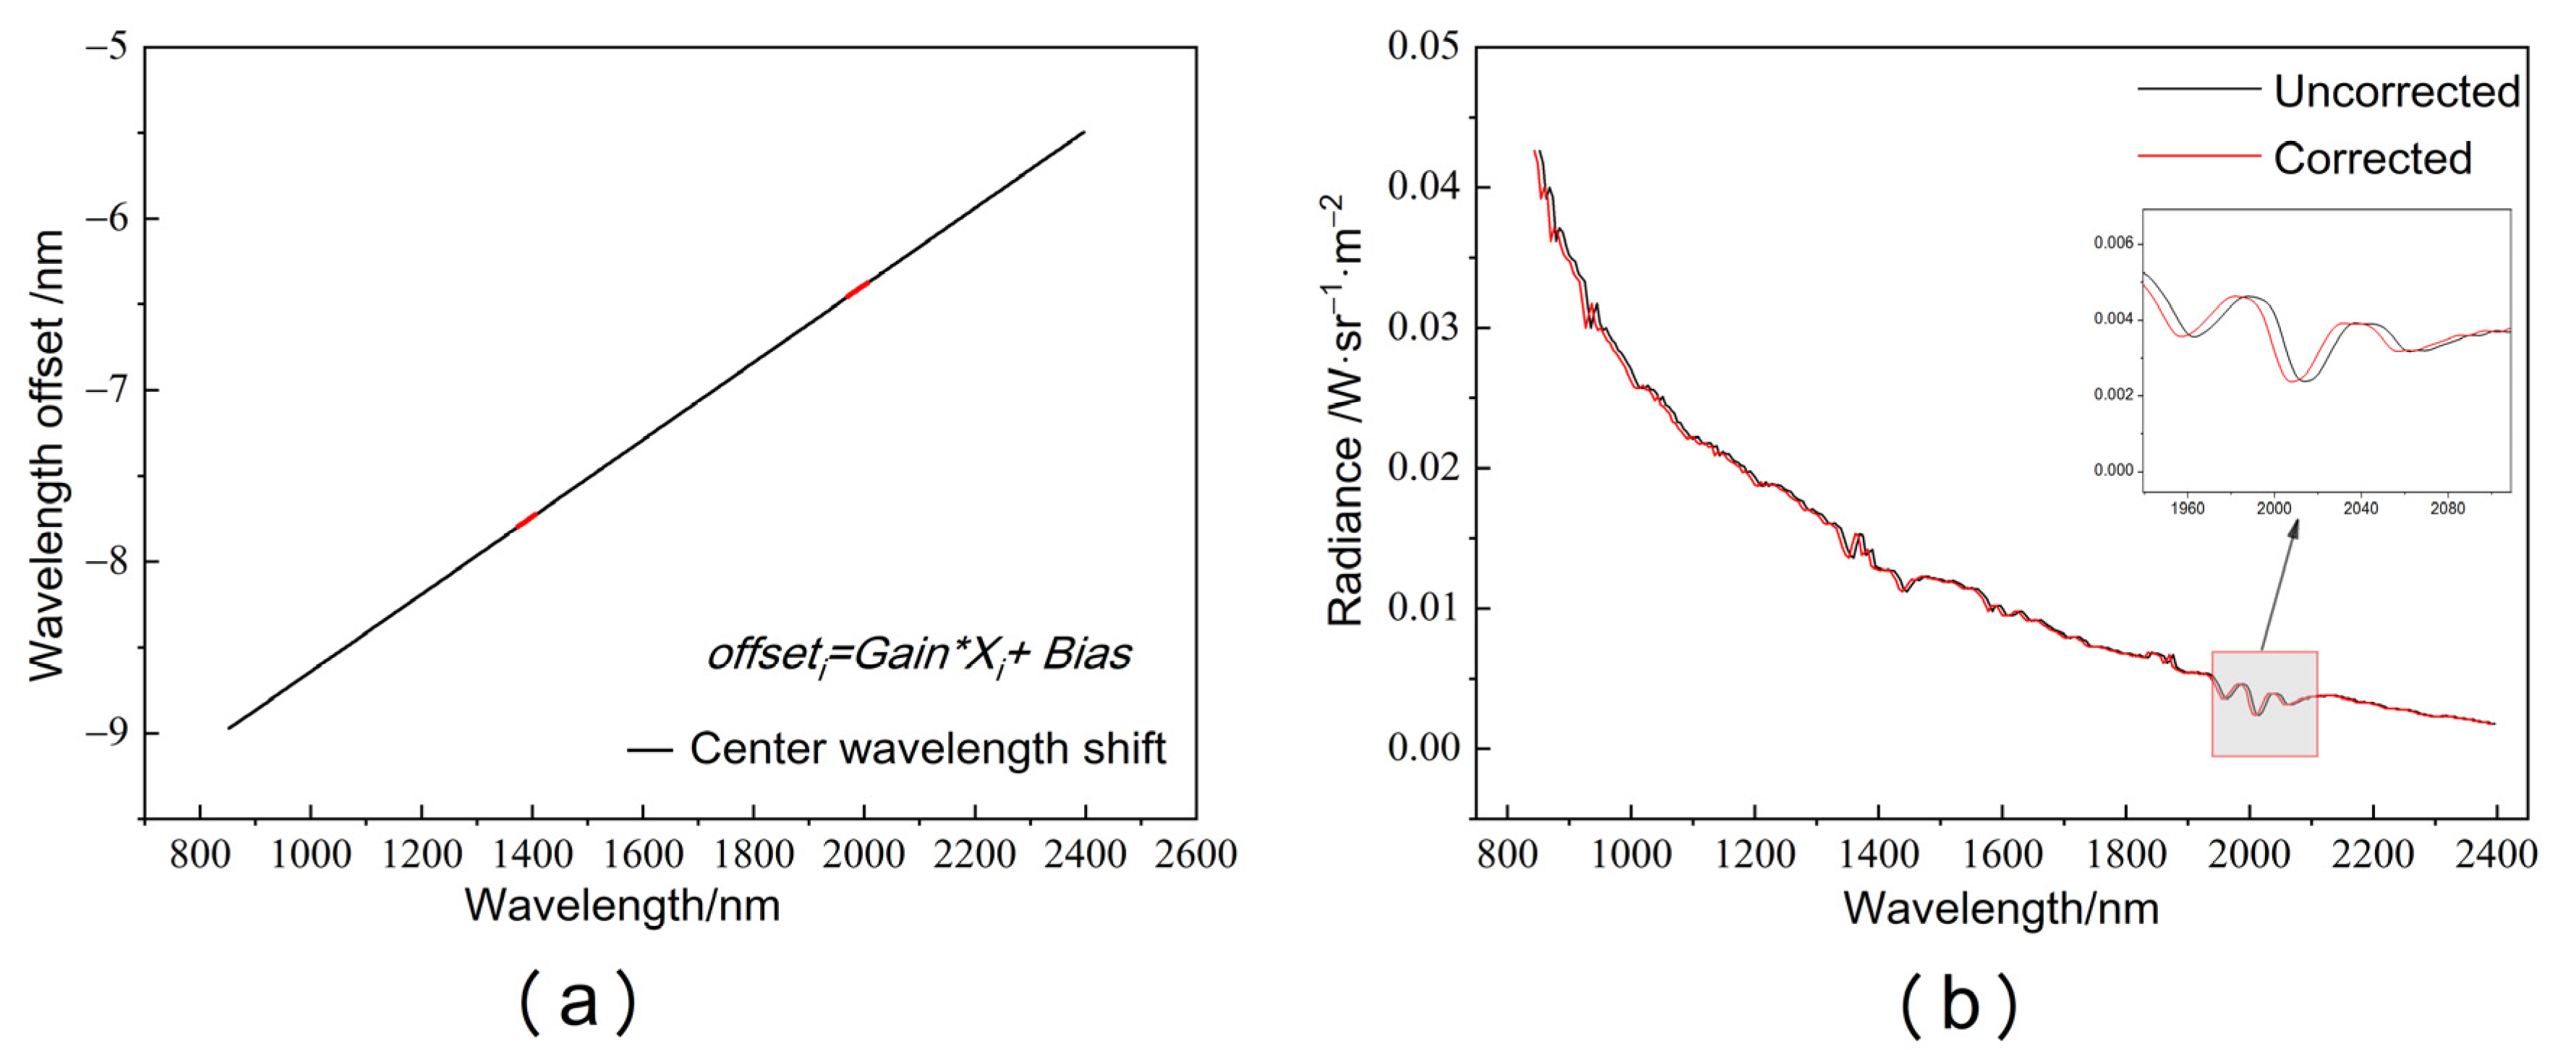
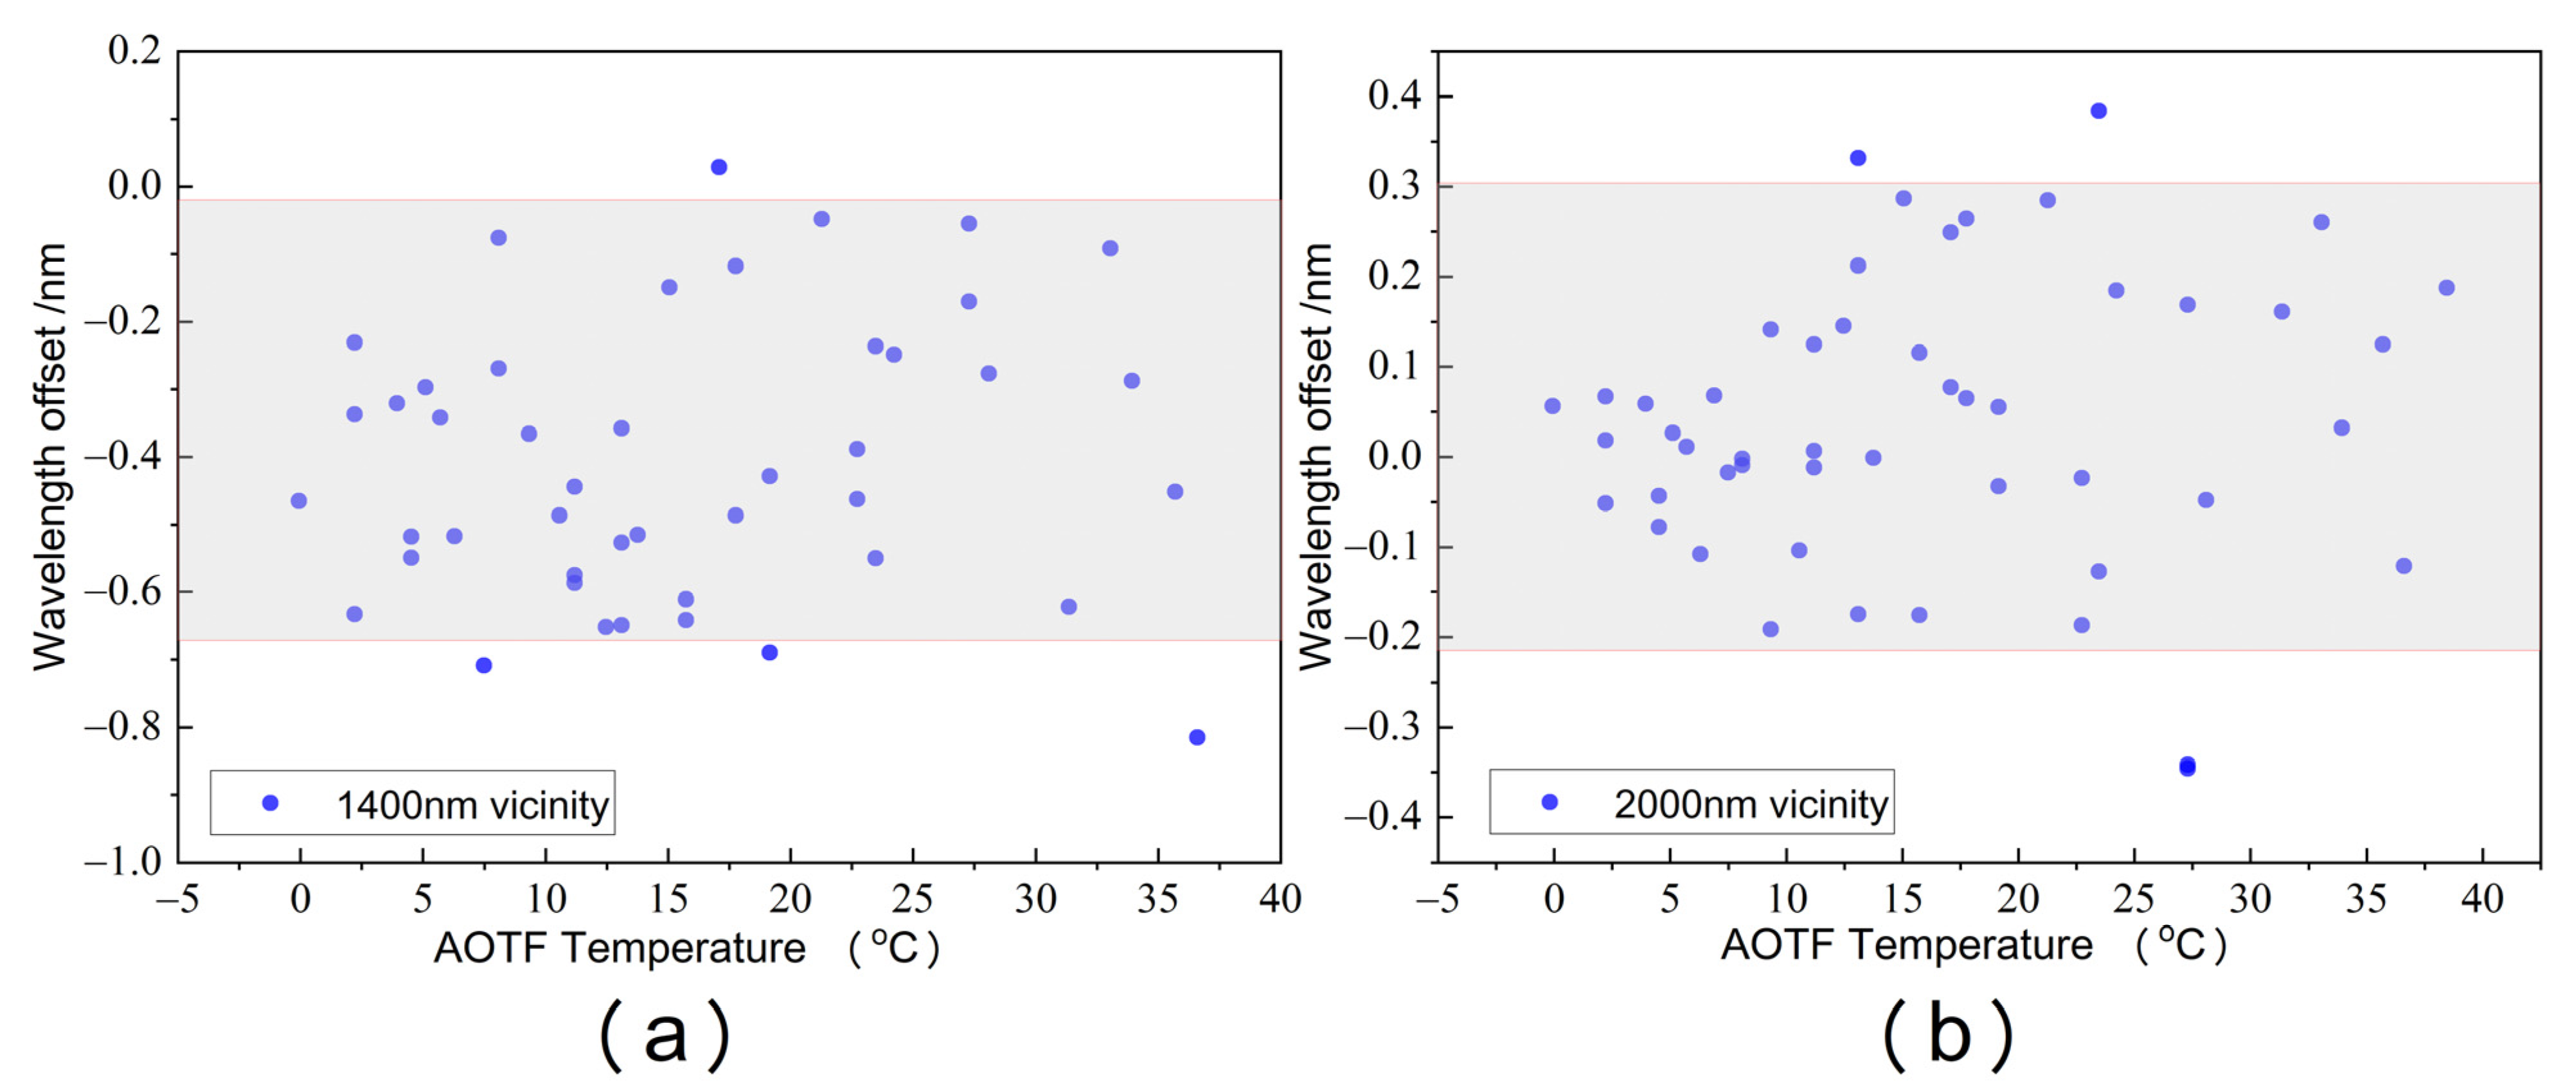
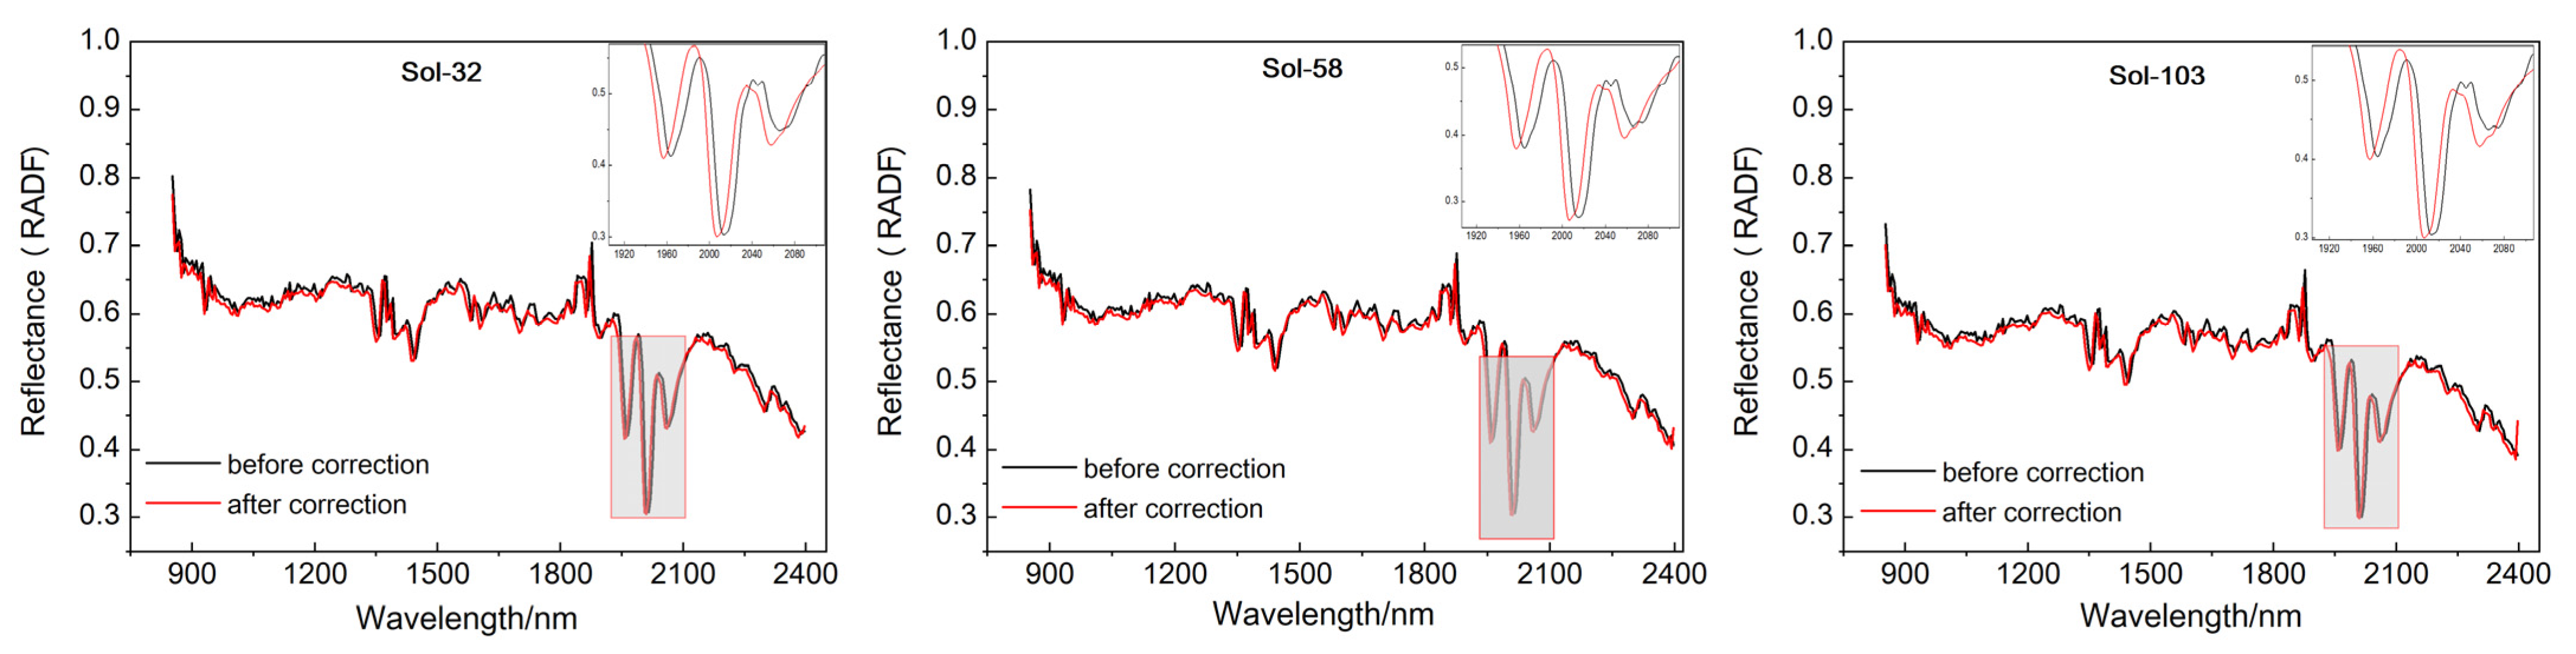
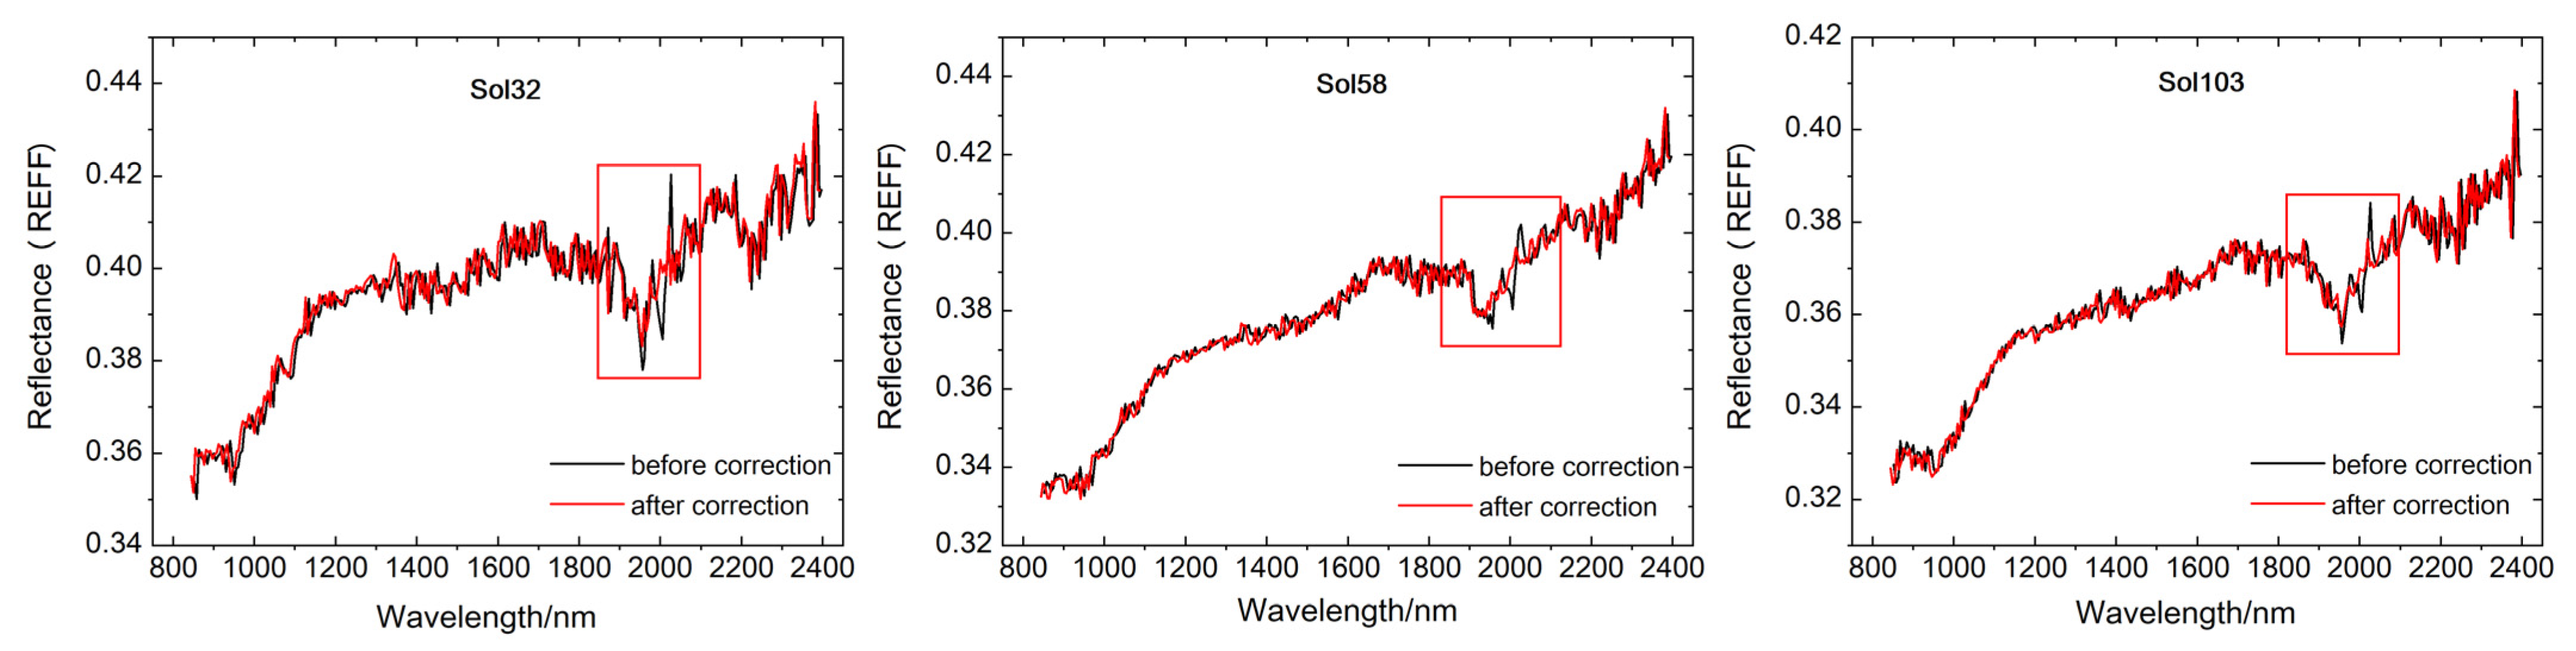
  • To determine the sensitivity of the AOTF of the SWIR to the ambient temperature change, resulting in a wavelength offset, a spectral calibration of the central wavelength offset of the AOTF with temperature change was performed based on the spectral calibration of hyperspectral data for the absorption characteristics of the Martian atmosphere, using screened SWIR data. The results show the quantitative linear relationship of the central wavelength offset (−8 nm, −2 nm) between 0° and 40° with the AOTF temperature change. The RADF and REFF results for the calculated scientific targets show further correction of the reflectance after wavelength correction. In particular, the erroneous absorption properties of the RADF near 2300 nm and the conspicuous burrs of the REFF near 2000 nm can help us to better identify Martian minerals. An important basis for subsequent data analysis and applications has thus been provided.
This work represents an important step in the processing and application of MarSCoDe SWIR data, and further analysis and studies are needed to obtain the reflectance of the Mars target, such as research into the reasons for the upward shift at the front end of the RADF reflectance curve versus the downward shift at the back end. Future work could also explore the inconsistency between the REFF reflectance of the same science target based on gray and white panels, erring from the ideal situation. We consider the possibility that Martian surface dust falling on the reference panel influences the target reflectance calculation. Looking ahead, we will continue our research and hope to address these issues.

Author Contributions

Conceptualization, B.W. and R.X.; formal analysis, B.W. and W.Y.; methodology, B.W. and C.L.; supervision, R.X., X.X., H.L., W.X. and B.L.; resources, X.R., X.L., B.Y., Z.Z. and H.L.; writing—original draft, B.W. and Y.T.; writing—review and editing, Z.H. and R.S. All authors have read and agreed to the published version of the manuscript.

Funding

This research was funded by China’s first Mars exploration program, National Science Fund for Distinguished Young Scholars (grant No. 62125505), the Shanghai Outstanding Academic Leaders Plan, the Youth Innovation Promotion Association CAS (Grant No. 2022239), Young Elite Scientists Sponsorship Program by CAST (No. 2021QNRC001), the Key Research Program of the Chinese Academy of Sciences ZDBS SSW TLC00106 and ZDBS-SSW-TLC001, Key Laboratory of Lunar and Deep Space Exploration, CAS (No. LDSE202003), Key Laboratory of Space Active Opto-Electronics Technology, Shanghai Institute of Technical Physics (No. 2021-ZDKF-2) and the Program of the Shanghai Academic/Technology Research Leader (No. 19XD1424100), National Natural Science Foundation (No. 61605231, No. 41875042).

Data Availability Statement

The data involved in this research can be requested from the Lunar and Planetary Management System at https://moon.bao.ac.cn/web/zhmanager/mars1 (accessed on 20 October 2021).

Conflicts of Interest

The authors declare no conflict of interest.

References

  1. Zou, Y.; Zhu, Y.; Bai, Y.; Wang, L.; Jia, Y.; Shen, W.; Fan, Y.; Liu, Y.; Wang, C.; Zhang, A.; et al. Scientific objectives and payloads of Tianwen-1, China’s first Mars exploration mission. Adv. Space Res. 2020, 67, 812–823. [Google Scholar] [CrossRef]
  2. Liu, J.; Li, C.; Zhang, R.; Rao, W.; Cui, X.; Geng, Y.; Jia, Y.; Huang, H.; Ren, X.; Yan, W.; et al. Geomorphic contexts and science focus of the Zhurong landing site on Mars. Nat. Astron. 2022, 6, 65–71. [Google Scholar] [CrossRef]
  3. Xu, W.; Liu, X.; Yan, Z.; Li, L.; Zhang, Z.; Kuang, Y.; Jiang, H.; Yu, H.; Yang, F.; Liu, C.; et al. The MarSCoDe Instrument Suite on the Mars Rover of China’s Tianwen-1 Mission. Space Sci. Rev. 2021, 217, 64. [Google Scholar] [CrossRef]
  4. Royer, C.; Fouchet, T.; Montmessin, F.; Poulet, F.; Forni, O.; Johnson, J.; Gasnault, O.; Quantin-Nataf, C.; Beck, P.; Ollila, A.; et al. The flight radiometric calibration of IRS/SuperCam onboard Perseverance: Campaign follow up and performance assessment. In Proceedings of the European Planetary Science Congress, Online, 13–24 September 2021. EPSC2021-735. [Google Scholar]
  5. Trost, B.M.; Bogdanowicz, M.J. New synthetic reactions. Geminal alkylation. J. Am. Chem. Soc. 1973, 95, 395–406. [Google Scholar] [CrossRef]
  6. Mantsevich, S.N.; Korablev, O.I.; Kalinnikov, Y.K.; Ivanov, A.Y.; Kiselev, A.V. Wide-aperture TeO₂ AOTF at low temperatures: Operation and survival. Ultrasonics 2015, 59, 50–58. [Google Scholar] [CrossRef] [PubMed]
  7. Lv, G.; Li, J.; Li, C.; Jin, J.; Lin, Y.; Xu, R.; He, Z. Temperature Correction and Result Evaluation of Lunar Mineralogical Spectrometer for Chang’E-5 Mission. IEEE Trans. Geosci. Remote Sens. 2022, 60, 1–8. [Google Scholar] [CrossRef]
  8. He, Z.; Li, J.; Li, C.; Xu, R. Measurement and Correction Model for Temperature Dependence of an Acousto-Optic Tunable Filter (AOTF) Infrared Spectrometer for Lunar Surface Detection. Appl. Spectrosc. 2019, 74, 81–87. [Google Scholar] [CrossRef]
  9. Royer, C.; Fouchet, T.; Montmessin, F.; Poulet, F.; Forni, O.; Johnson, J.R.; Gasnault, O.; Mandon, L.; Quantin-Nataf, C.; Beck, P.; et al. The Detection of Spectral Signatures with IRS/SuperCam, Perseverance Rover: Instrument Performance. LPI Contrib. 2022, 2678, 1840. [Google Scholar]
  10. Goetz, A.; Heidebrecht, K.; Chrien, T. High accuracy in -flight wavelength calibration of imaging spectrometry data. In Proceedings of the Summaries of the Fifth Annual JPL Airborne Earth Science Workshop, Pasadena, CA, USA, 23–26 January 1995. [Google Scholar]
  11. Barry, P.S.; Shepanski, J.; Segal, C. On-orbit spectral calibration verification of Hyperion. In Proceedings of the Geoscience and Remote Sensing Symposium, Sydney, NSW, Australia, 9–13 July 2001; Volume 6, pp. 2535–2537. [Google Scholar]
  12. Gao, B.C.; Montes, M.J.; Davis, C.O. A curve-fitting technique to improve wavelength calibrations of imaging spectrometer data. In Proceedings of the 11th JPL Airborne Earth Science, Pasadena, CA, USA, 5–8 March 2001; pp. 99–105. [Google Scholar]
  13. Gao, B.C.; Montes, M.J.; Davis, C.O. Refinement of wavelength calibrations of hyperspectral imaging data using a spectrum-matching technique. Remote Sens. Environ. 2004, 90, 424–433. [Google Scholar] [CrossRef]
  14. Dadon, A.; Ben-dor, E.; Karnieli, A. Use of derivative calculations and minimum noise fraction transform for detecting and correcting the spectral curvature effect (smile) in Hyperion images. IEEE Trans. Geosci. Remote Sens. 2010, 48, 2603–2612. [Google Scholar] [CrossRef]
  15. Green, R.O.; Pavri, B.E.; Chrien, T.G. On-orbit radiometric and spectral calibration characteristics of EO-1 Hyperion derived with an underflight of AVIRIS and in situ measurements at Salar de Arizaro, Argentina. Geosci. Remote Sens. IEEE Trans. 2003, 41, 1194–1203. [Google Scholar] [CrossRef]
  16. Lei, Y.; Zhiyang, G.; Hongying, Z.; Chen, W.; Yin, Z.-Y.; Duan, Y.-N. In-flight spectral calibration of UAV hyperspectral imager based on Radiance Matching. J. Infrared Millim. Waves 2013, 31, 517–522. (In Chinese) [Google Scholar]
  17. Liu, Y.; Wang, T.; Ma, L.; Wang, N. Spectral calibration of hyperspectral data observed from a hyperspectrometer loaded on an unmanned aerial vehicle platform. IEEE J. Sel. Top. Appl. Earth Obs. Remote Sens. 2014, 7, 2630–2638. [Google Scholar] [CrossRef]
  18. Gao, H.L.; Gu, X.F.; Tao, Y.U.; Yong, X.I.E.; Yuan, S.U.N.; Zheng, F.J. In-flight spectral calibration of oxygen absorption channels of hyperspectral sensor. Acta Photonica Sin. 2014, 43, 58–65. (In Chinese) [Google Scholar]
  19. Chen, H.; Zhang, L.; Li, X.; Si, X.; Yang, B.; Zhu, X. Hyperspectral sensor in flight spectral calibration based on characteristic spectra of atmosphere. Acta Opatica Sin. 2013, 33, 287–293. (In Chinese) [Google Scholar]
  20. Xie, F.; Liu, C.; Shao, H.; Zhang, C.; Yang, G.; Wang, J. Scene based spectral calibration of thermal infrared hyperspectral data. Infrared Laser Eng. 2017, 46, 23–28. (In Chinese) [Google Scholar]
  21. Brazile, J.; Neville, R.A.; Staenz, K.; Schläpfer, D.; Sun, L.; Itten, K.I. Toward scene-based retrieval of spectral response functions for hyperspectral imagers using Fraunhofer features. Can. J. Remote Sens. 2008, 34, 43–58. [Google Scholar] [CrossRef]
  22. Guanter, L.; Richter, R.; Moreno, J. Spectral calibration of hyperspectral imagery using atmospheric absorption features. Appl. Opt. 2006, 45, 2360–2370. [Google Scholar] [CrossRef] [Green Version]
  23. Guanter, L.; Segl, K.; Sang, B.; Alonso, L.; Kaufmann, H.; Moreno, J. Scene -based spectral calibration assessment of high spectral resolution imaging spectrometers. Opt. Express 2009, 17, 11594–11606. [Google Scholar] [CrossRef] [Green Version]
  24. Shu, R.; Xu, W.; Liu, X.; Zhang, Z.; Yang, F.; Xu, R.; NI, S.; Ruan, Y.; Chen, J. Ground calibration and validation of laser-induced breakdown spectroscopy for the Mars surface composition detector. Sci. Sin-Phys. Mech. Astron. 2022, 52, 239506. [Google Scholar] [CrossRef]
  25. Franz, H.B.; Trainer, M.G.; Malespin, C.A.; Mahaffy, P.R.; Atreya, S.K.; Becker, R.H.; Benna, M.; Conrad, P.G.; Eigenbrode, J.L.; Freissinet, C.; et al. Initial SAM calibration gas experiments on Mars: Quadrupole mass spectrometer results and implications. Planet. Space Sci. 2017, 138, 44–54. [Google Scholar] [CrossRef]
  26. Felde, G.W.; Anderson, G.P.; Cooley, T.W.; Matthew, M.W.; Berk, A.; Lee, J. Analysis of Hyperion data with the FLAASH atmospheric correction algorithm. In Proceedings of the Geoscience and Remote Sensing Symposium, Toulouse, France, 21–25 July 2003; Volume 1, pp. 90–92. [Google Scholar]
  27. Seiler, M.C.; Seiler, F.A. Numerical recipes in C: The art of scientific computing. Risk Anal. 1989, 9, 415–416. [Google Scholar] [CrossRef]
Figure 1. Schematic diagram of MarSCoDe system module distribution [23].
Remotesensing 14 02137 g001
Figure 2. The Mars rover coordinate system. (left) Both coordinate systems share a common origin O. The black axis O-XYZ indicates the local cartesian coordinates of the coordinate system, and the red O-Xr Yr Zr indicates the body coordinate system. (right) The 5.5° inclination of the calibration panel on the roof of the Mars rover in the body coordinate system.
Remotesensing 14 02137 g002
Figure 3. (a) Flow chart of central wavelength correction technique based on characteristic spectral absorption and schematic of characteristic spectrum. (b) Comparison of atmospheric transmittance and reflectance (black axis indicates the radiance factor (RADF) calculated from the detection target acquired by the sensor; red axis indicates the Mars atmospheric transmittance at the corresponding moment obtained by MODTRAN simulation).
Remotesensing 14 02137 g003
Figure 4. Schematic diagram of simulated incident light blocked by Mars rover mechanics and gray panel spoke brightness statistics. (a) Schematic of the Mars rover light, where it can be seen that when the light is incident in the body coordinate system in the Yr direction, it will lead to the projection of the Mars rover with sensors such as the navigation, terrain camera, etc., to the plane of the calibration panel. (b) Gray panel irradiance statistics for 15 sols (blue indicates normal conditions; red indicates blocked; cyan indicates a large angle of incidence and the possibility of being blocked at the same time).
Remotesensing 14 02137 g004
Figure 5. Correction coefficients with AOTF temperature fitted. (a) Correction coefficients fitted in the central wavelength absorption spectrum of around 1400 for CO2. (b) Correction coefficients fitted in the central wavelength absorption spectrum of around 2000 for CO2.
Remotesensing 14 02137 g005
Figure 6. Solution for the full spectrum offset value and the effect are shown: (a) Fitted curve of wavelength offset value of the full spectrum of hyperspectral data; (b) radiation brightness curve before and after spectral calibration (black indicates the radiation brightness curve before wavelength correction; red indicates the radiation brightness curve after correction).
Remotesensing 14 02137 g006
Figure 7. Calculation of wavelength migration based on the method for the corrected spectra. (a) Correction coefficients in the central wavelength absorption spectrum of around 1400 for CO2. (b) Correction coefficients in the central wavelength absorption spectrum of around 2000 for CO2. The gray boxes in the figure are the 95th percentile areas.
Remotesensing 14 02137 g007
Figure 8. White panel RADF reflectance curves before and after calibration of three sols’ spectra (black curve indicates before calibration; red indicates after calibration).
Remotesensing 14 02137 g008
Figure 9. Reflectance curve of white panel REFF before and after spectral calibration (black curve indicates before calibration; red indicates after calibration).
Remotesensing 14 02137 g009
Table 1. Main technical parameters of MarSCoDe SWIR.
SWIR spectrometerSpectral range (nm)850–2400
Spectral resolution (nm)3–12
Number of spectral bands321 band, 64 band @ 5 nm sample
Field of view (mrad)36.5
Two-dimensional pointing mirrorAngle rangePitch −21–199°, azimuth −59–32°
Pointing accuracyPitch 0.133°, azimuth 0.076°
Pointing stabilityPitch 0.035°, azimuth 0.043°
Table 2. 15 sols’ gray panel attitudes, with the new incidence and azimuth.
SolTilting (°)Pitch (°)Yaw (°)Roll (°)Incidence (°)Azimuth (°)N-Incidence (°)N-Azimuth (°)
325.5−2.011−96.345177.004.760138.8815.84694.952
415.5−1.643−116.253179.2651.203279.37048.044−102.598
435.5−0.143−157.740179.4317.32594.57022.50022.123
455.5−1.362−145.649−179.5066.578285.19961.932−127.964
475.5−0.341−125.114179.7417.25793.41720.96346.503
505.5−0.335−84.298−179.9866.446285.63068.232−66.478
585.5−1.132−80.645178.1623.90687.69724.53089.231
655.5−0.8462.285−178.5014.795269.90219.4845.930
695.50.214−101.569178.7214.771270.75214.519−84.701
795.5−0.747−82.776178.1214.731272.45215.247−67.029
875.5−1.198−106.530179.9314.715273.36013.360−79.987
925.5−0.291−88.209179.144.654271.8926.595−41.689
1005.5−0.445−106.816179.212.84886.8206.72629.743
1035.50.346−57.121179.964.32087.3974.87344.581
1105.52.093−45.277−177.934.98688.2746.19635.726
Publisher’s Note: MDPI stays neutral with regard to jurisdictional claims in published maps and institutional affiliations.

