Abstract
The devastating Hunga Tonga-Hunga Ha’apai underwater volcano erupted at ~04:15 UT on 15 January 2022. We captured the waves that erupted from the volcano propagating in the ionosphere by monitoring total electron content (TEC) perturbations utilizing ground-based global navigation satellite system (GNSS) receivers that receive electromagnetic signals transmitted from the geostationary satellites operated by the BeiDou Navigation Satellite System (BDS). Meanwhile, ground barometers detected unusual enhancements of air pressure traveling in the troposphere. A novel phenomenon shows that the waves can individually propagate with a speed of ~335 m/s in the ionosphere, which is faster than its’ ~305 m/s in the troposphere. We further examined multiple geophysical data at the particular site of the novel instrumental array. Analytical results show that the pressure enhancements traveling in the troposphere not only downward trigger ground vibrations mainly in the horizontal components without obvious time difference, but also upward, leading the secondary TEC perturbations with a ~12-min delay.
1. Introduction
Intense interactions between the Indo-Australian Plate and the Pacific Oceanic Plate cause major earthquakes and volcanoes along the Tonga-Kermadec subduction zone. The devastating Hunga Tonga-Hunga Ha’apai underwater volcano (20.53°S, 175.38°W) erupted at ~04:15 UT on 15 January 2022. The satellite images captured the eruption, which caused a 5 km wide plume of ashes and gases (e.g., himawari8, FY-3E, GOES West, AIRS/Aqua), rising approximately 20 km above the volcano. The eruption excited air blast in the atmosphere. Air pressure increased with ~700 hPa in New Zealand and ~2.5 hPa in Switzerland through long-distance propagation. Meanwhile, the eruption caused intense ground vibrations and tsunami. The intensity of ground vibrations triggered by the eruption is relevant to a Ms 5.8 earthquake. The underwater eruption also generated tsunami that mainly propagated in the Pacific Ocean. The previous studies reported that perturbations in total electron content (TEC) can be triggered by earthquakes, seismic waves, volcano eruptions, and tsunami [1,2,3,4,5]. Heki [6], Dautermann et al. [7], and Shults et al. [8] reported that TEC perturbations with an amplitude of ~0.2 TECU (1 TECU (TEC unit) = 1 × 10¹⁶ el/m2) were triggered by volcano eruptions in Japan, Montserrat, and South America, respectively. The propagation velocity of the TEC perturbations mainly ranged from ~600 to 1200 m/s [6,7,8]. The Hunga Tonga-Hunga Ha’apai volcano under the sea surface differs from the volcanoes on land, as has been reported in previous studies [6,7,8]. The eruption of The Hunga Tonga-Hunga Ha’apai volcano triggered significant blast waves that are quite unique and rare. The severe TEC perturbations could be generated by the eruption of the underwater volcano. In this study, we captured the waves in the ionosphere and troposphere by, respectively, utilizing changes in TEC, and air pressure. We estimated propagation speeds of the waves utilizing the ground-based global navigation satellite system (GNSS) receiver arrays and ground barometers to investigate the potential sources and expose possible interactions between the surface and ionosphere after the eruption.
2. Observation Results from GNSS Arrays
Ground-based GNSS receivers are usually utilized to detect TEC in the ionosphere. An integration of the electron number density between a ground-based receiver and a GNSS satellite is the so-called GNSS sTEC (slant TEC). The GNSS sTEC can be estimated according to the delay and changes in electromagnetic signals transmitted from satellites passing through the ionosphere [9]. The TEC observations from the GNSS, such as the Global Positioning System (GPS), can monitor ionospheric plasma irregularities [10] and traveling ionospheric disturbances [11] happening in the ionosphere frequently. However, most GNSS satellites orbiting the Earth measure TEC depending on elevation cut-off angles as a function of time. The BeiDou Navigation Satellite System (BDS) includes five geostationary (GEO) satellites over the equator in the Asia longitudinal sector [12] (Figure 1). The BDS GEO satellites hang in space at ~36,000 km above the Earth’s surface and continuously provide TEC observations 24 h a day with nearly constant elevation angles. The ionospheric pierce points (IPPs) for the BDS GEO satellites act as space buoys and seismometers to monitor TEC disturbances at particular places 350 km over the Earth’s surface [13]. We retrieved the data recorded at 215 stations (Figure 1) from the Data Sharing Infrastructure of the National Earthquake Data Center in China (http://data.earthquake.cn (accessed on 17 January 2022)) and the Crustal Dynamics Data Information System (CDDIS; https://cddis.nasa.gov/ (accessed on 17 January 2022)). The BDS sTECs in this study were computed by utilizing the pseudoranges and phases of the dual-frequency signals that are transmitted from the BDS GEO satellites (G1, G2, and G3) to the ground-based GNSS receivers [9,14,15,16] and references therein. In other words, this study included 645 IPPs above particular locations in the area of 25°S–55°S, 70°E–160°W to continuously monitor changes in BDS sTECs.
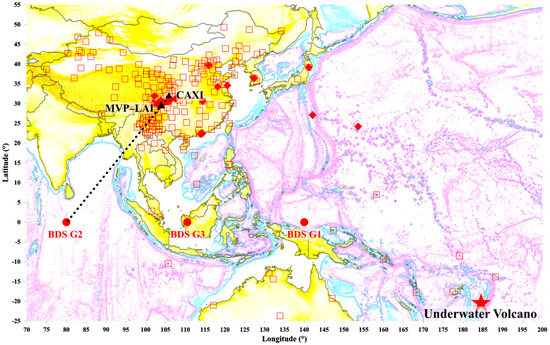
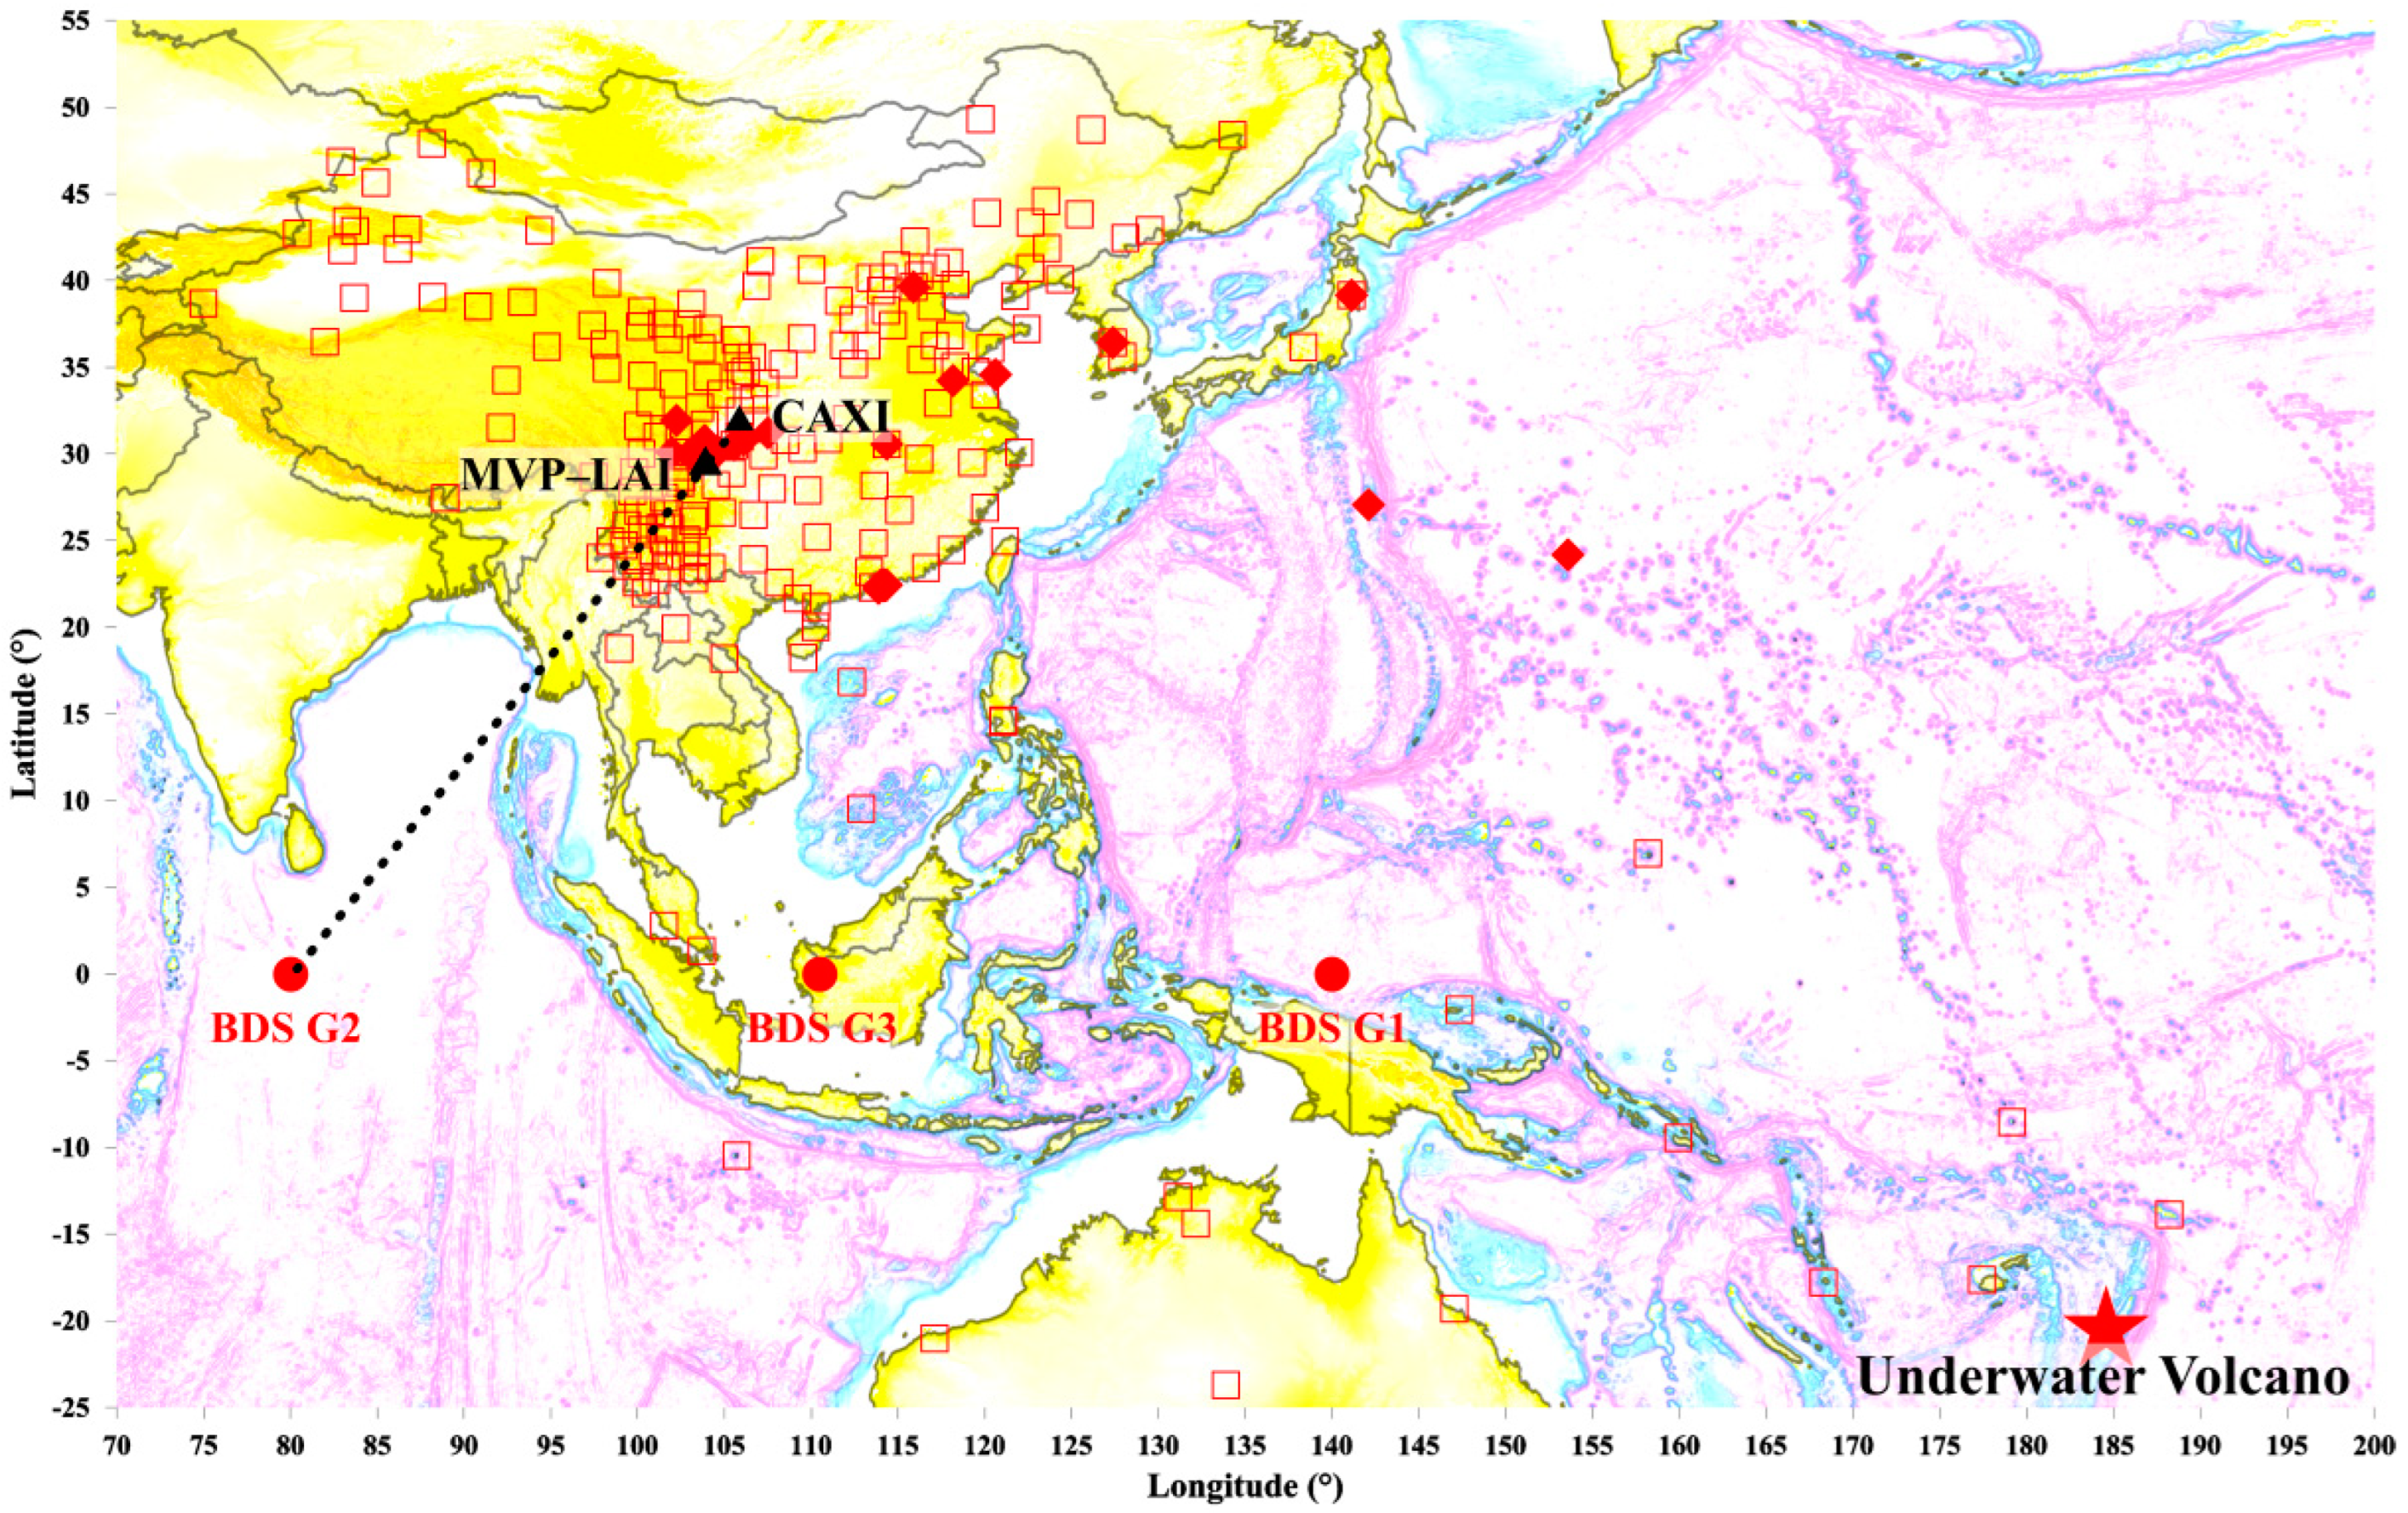
Figure 1.
Locations of the ground-based GNSS receivers, barometers, and underwater volcano lying on the topography. The location of the Hunga Tonga-Hunga Ha’apai underwater volcano is shown by the red star. The red open squares denote the locations of the ground-based GNSS receivers utilized in this study. The red solid lozenges show the locations of the barometers. The red dots indicate the locations of the GEO satellites of the BDS. The black triangles indicate the MVP-LAI system and CAXI station. The black dashed line shows the line-of-sight of the signals transmitted from the BDS GEO satellite (G2) to the ground-based GNSS receiver at the CAXI station. The ionospheric pierce point (IPP) of the CAXI sTEC for BDS G2 locates above the MVP-LAI system at Leshan at an altitude of 350 km.
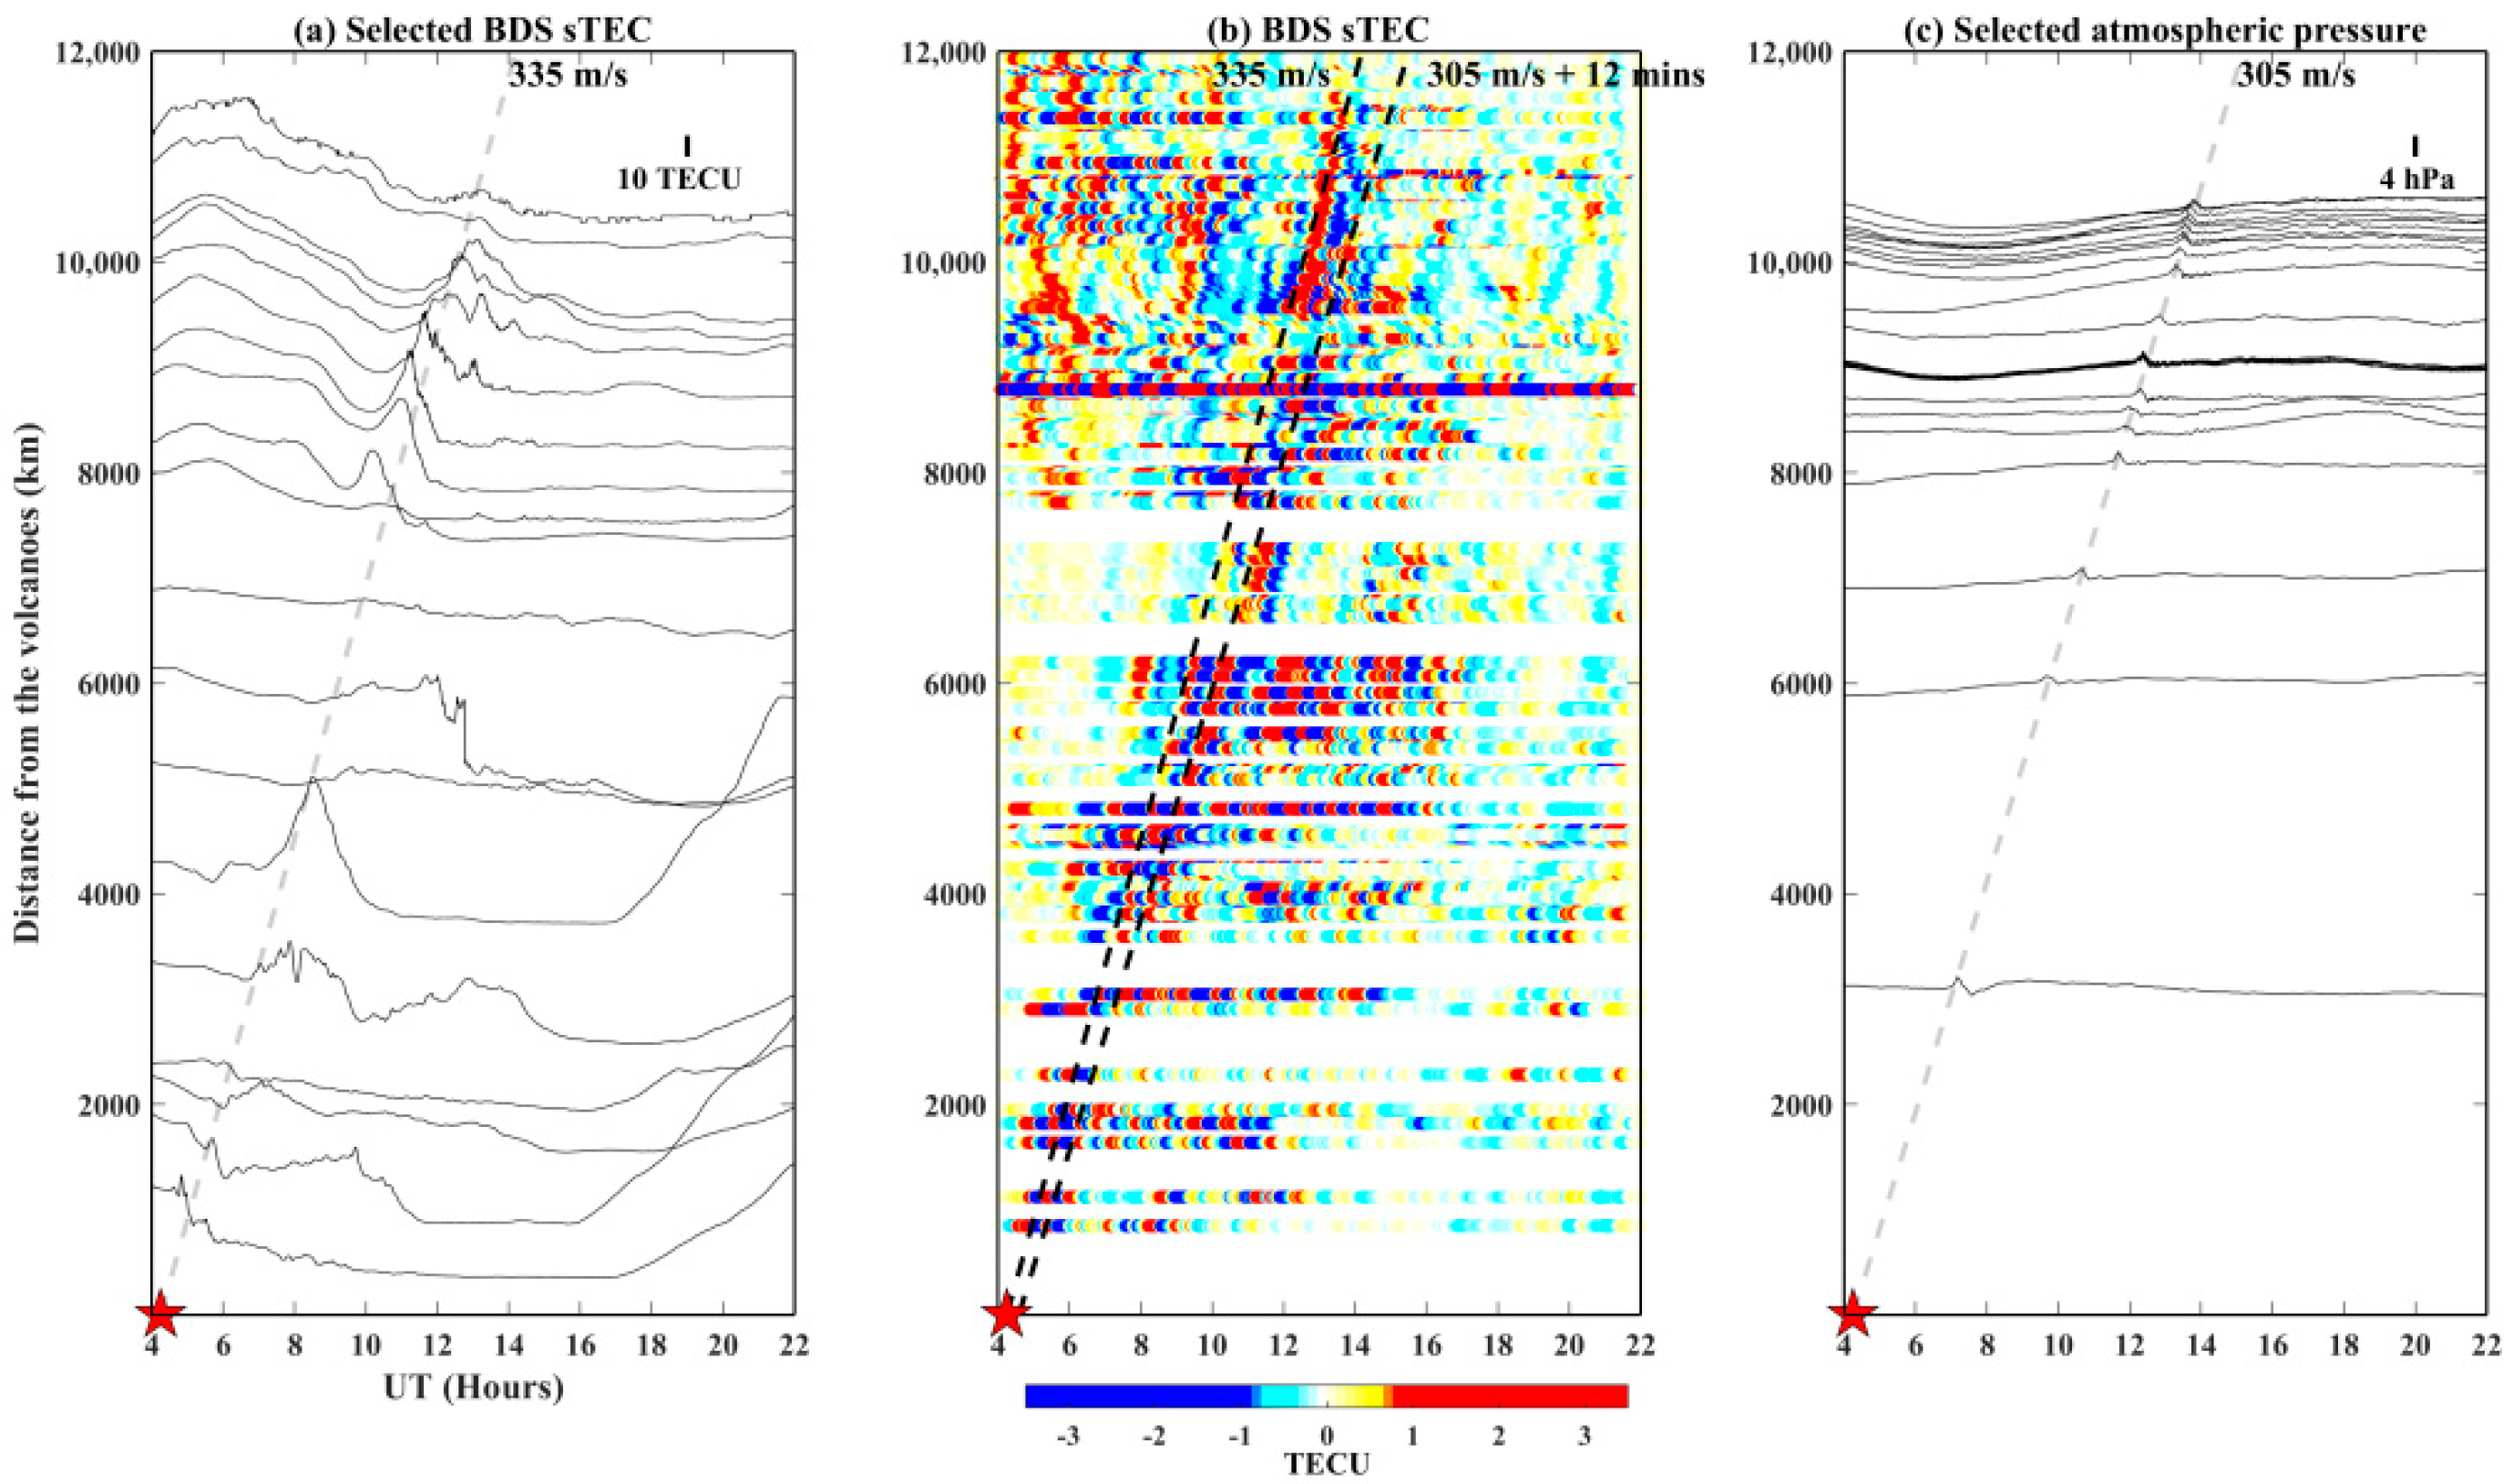
Figure 2a shows the variations in the BDS sTECs at 19 selected IPPs with an equal interval of distances away from the location of the volcano during the period of 04:00 UT–22:00 UT on 15 January 2022. The sTEC exhibits an obvious enhancement of ~10 TECU right after the eruption. The TEC perturbations are weak at distances from ~5000 to ~7500 km due to unknown reasons. The TEC perturbations propagated away from the volcano to the outlying areas at a distance > ~8000 km. The amplitude is ~20 TECU at a distances of ~8000 km and reduces to ~10 TECU at a distance of ~11,000 km. The large amplitude of the sTEC suggests that the perturbations associated with the underwater volcano propagate a long distance > ~11,000 km being significant. To mitigate the influence of TEC diurnal variations and to keep the essentials of the TEC perturbations, simultaneously, we utilized the simple process of subtracting a 1 h running average from the BDS sTECs to illustrate the eruption-triggered perturbations. Figure 2b shows the spatiotemporal distributions of all the TEC utilized in this study (also see the Movie (Video S1: Supp_Mov.avi) in the Supplementary Materials). The front of the perturbations lies on the arrival time with a velocity of ~335 m/s, according to the peaks of the TEC enhancements. The long-lasting disturbance, resonance, or TEC irregularities can be found following the front due to the eruption or tsunami [17,18], which can seriously disturb the electromagnetic wave communication [19] and may cause the disconnection of Tonga after the eruption and hinder rescue operations.
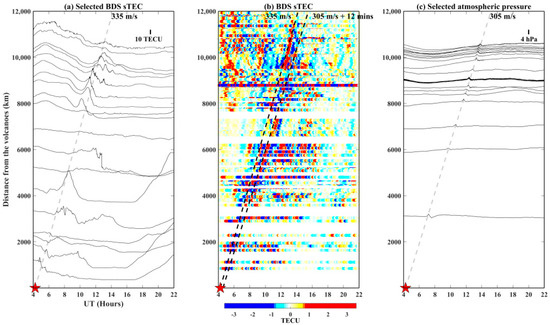
Figure 2.
Variations in the BDS sTEC and air pressure associated with the underwater volcano eruption during 04:00 UT–22:00 UT on 15 January 2022: (a) Variations in the BDS sTEC from 19 selected IPPs with a distance of 0–12,000 km away from the volcano. (b) Spatiotemporal distribution of the TEC perturbations. The BDS sTEC is processed with a removal of a 1 h running average. (c) Variations in the air pressure from the 26 barometers. The red star indicates occurrence of the volcano eruption. The dashed lines show arrival times of the waves propagating away from the volcanoes, which are estimated by utilizing the speed and delay time as written above.
3. Observations of Air Pressure from Barometer Arrays
Air pressure measurements were retrieved from Japan Meteorological Agency (JMA; https://www.jma.go.jp/ (accessed on 17 January 2022)), Crustal Dynamics Data Information System (CDDIS; https://cddis.nasa.gov/ (accessed on 17 January 2022)), Survey and Mapping Office Lands Department, Hong Kong (https://www.geodetic.gov.hk/ (accessed on 17 January 2022)), and the Sichuan meteorological disaster prevention technology center in China. Similarly, we showed the retrieved data at the 26 stations (Figure 1) along with the distance away from the volcano. The sudden pressure enhancements riding on the typical diurnal variations can be found from the data at all the stations with the distance ranging from 0 to ~11,000 km (Figure 2c). The traveling speed of the pressure enhancements is ~305 m/s. In other words, the air pressure enhancements do not contribute to the TEC perturbations with a velocity of ~335 m/s (Figure 2b) due to the TEC perturbations leading the pressure enhancement by ~10% in velocity. To examine the leading phenomenon in detail, the measurements of air pressure and ground vibrations, as well as the BDS sTEC above the particular site of the novel instrumental array, are further compared.
4. Observations in the MVP-LAI System
The novel instrumental array officially started functioning in Leshan (29.6°N, 103.9°E), Sichuan province, China, in September 2021 [20]. The array comprises broadband seismometers, barometers, and ground-based GNSS receivers for Monitoring Vibrations and Perturbations in the Lithosphere, Atmosphere, and Ionosphere (MVP-LAI; please find the detail of the instruments in [20]. Notably, those instruments are installed and operated within a limited area of ~20 by ~20 m. Meanwhile, a ground-based GNSS receiver was established in a sub-location at the Cangxi county (CAXI) (31.8°N, 105.8°E) that is located ~300 km away from the MVP-LAI system. The IPP for the CAXI sTEC retrieved from the BDS G2 satellite is above the MVP-LAI system. Comparisons between the CAXI sTEC from BDS G2, air pressure, and ground vibrations at the MVP-LAI system benefits investigation of vibrations and perturbations in the vertical direction.
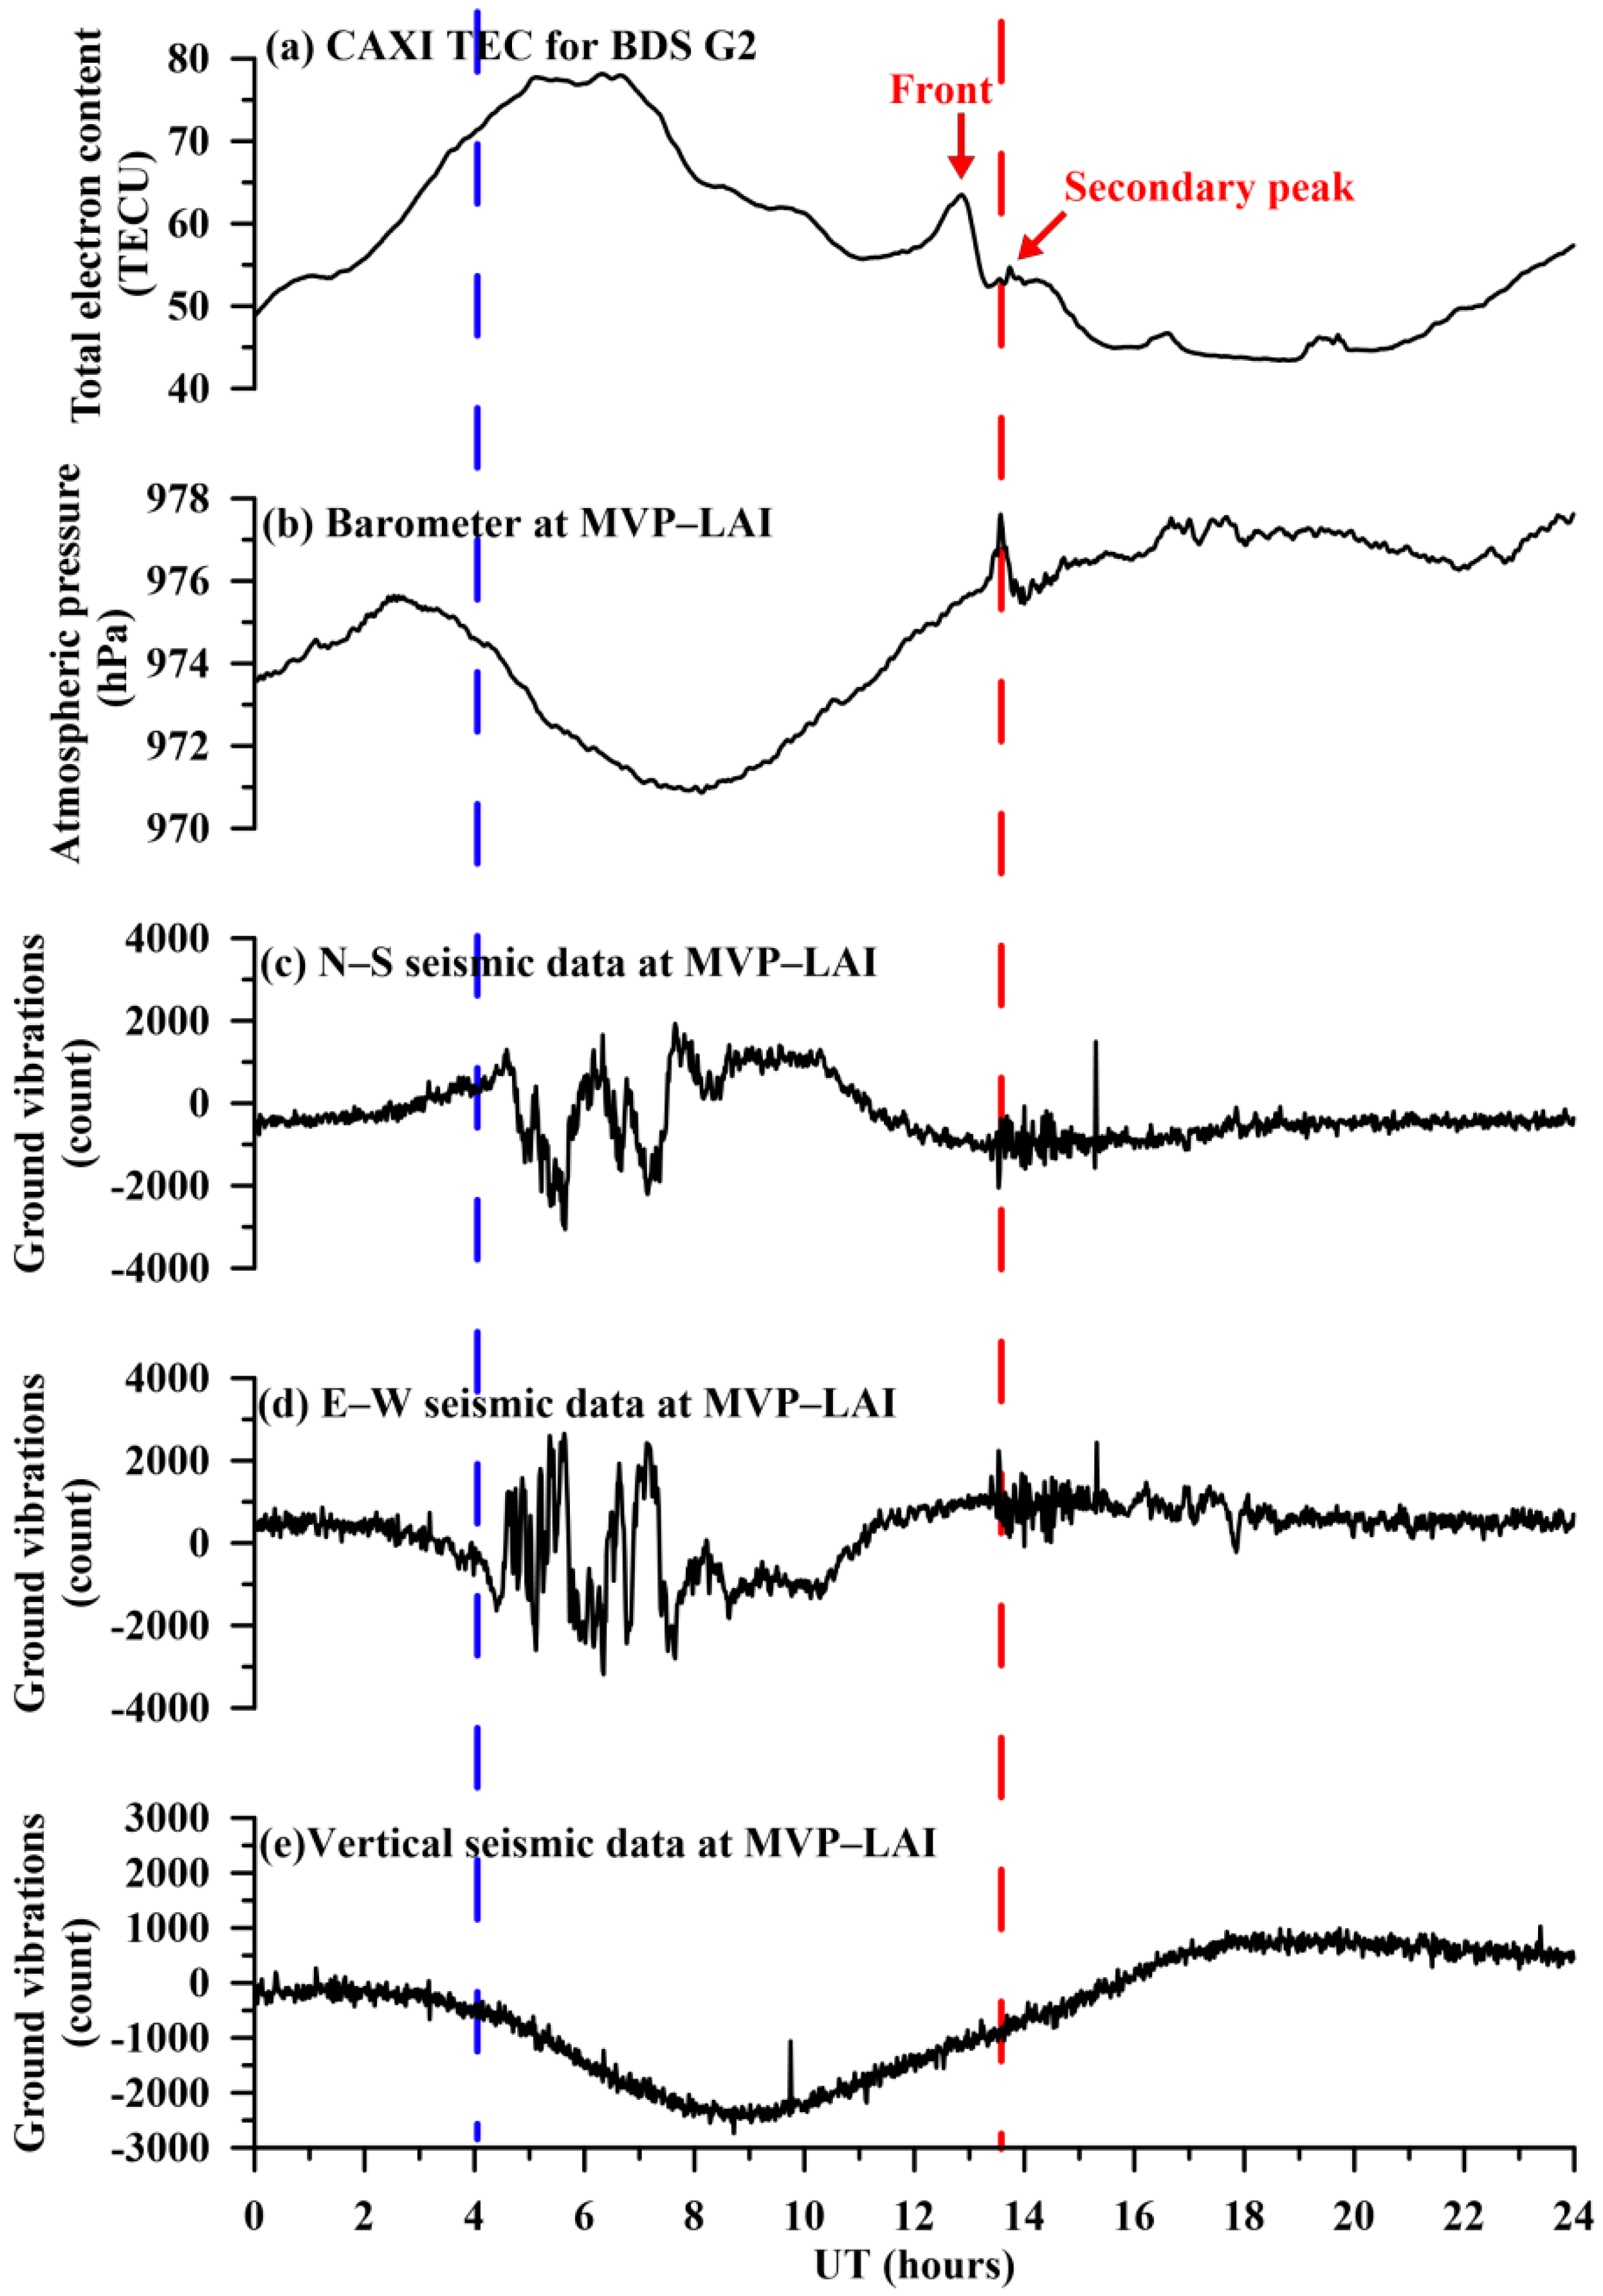
Figure 3a shows variations in the CAXI sTEC on 15 January 2022. The sTEC exhibited the typical maxima near the noon-time on 15 January 2022 (Figure 3a). The sTEC decreased after ~07:00 UT and kept at a low level in the nighttime. The CAXI sTEC variations agree with the typical variations in the TEC from the arrays (Figure 2a). Notably, the perturbations of the CAXI sTEC exhibited an obvious enhancement of ~10 TECU at ~12:50 UT, which is ~8 h and 35 min after the volcano eruption. The distance between the MVP-LAI system and the volcano is ~10,275 km. The corresponding traveling speed is ~333 m/s (=10,275,000 m/30,900 s), which agrees with the propagation velocity obtained from the GNSS arrays (Figure 2b). The enhancements are the front of the TEC perturbations propagating in the ionosphere after the eruption.

Figure 3.
Variations in the CAXI sTEC, air pressure, and ground vibrations in the MVP-LAI system on 15 January 2022: (a,b) show the variations in the CAXI sTEC and the air pressure, respectively. (c–e) exhibit the ground vibrations in the NS, EW, and vertical components. The blue vertical dashed line indicates the occurrence time of the underwater volcano eruption. The red vertical dashed line indicates the arrivals of perturbations in the troposphere. The two arrows mark the front and the secondary peak of TEC perturbations in the ionosphere associated with the volcano eruption.
Figure 3b shows the changes in air pressure at the MVP-LAI system on 15 January 2022. An unusual enhancement with an amplitude of ~2 hPa happened in the air pressure at ~13:30 UT, which is ~40 min later than the front of the TEC perturbations. The delay of ~9 h and 15 min to the volcano eruption suggests that the traveling speed of the air pressure enhancement is ~309 m/s (=10,275,000 m/33,300 s). Figure 3c–e show the ground vibrations recorded by the broadband seismometer at the MVP-LAI system. The ground vibrations occurred in the NS and EW components near noon-time. Notably, the pronounced ground vibrations can be found at the time near the appearance of the air pressure enhancement. The pronounced ground vibrations are not observed in the raw data at the vertical component, but mainly at two horizontal components. Moreover, a secondary peak exists in the CAXI sTEC ~50 min after the front of the TEC perturbations (Figure 3a). The air pressure enhancements lead the secondary peak by ~12 min.
5. Discussion
The TEC perturbations can be attributed to the different sources depending on their propagation speeds. Large earthquakes and tsunami can induce broad-band waves with speeds ranging from a few kilometers per second (e.g., Rayleigh waves) to ~200 m/s (e.g., tsunami waves), and resonance in the ionosphere [16] and persist for several days [17]. Previous studies [6,7,8] have shown that the propagation velocity of the TEC perturbations triggered by the volcanoes ranging from ~600 to 1200 m/s refer to an acoustic wave [5]. In this study, the velocity of ~335 m/s is much slower than that reported in previous studies [6,7,8] and, therefore, acoustic waves are not relevant here. Lin et al. [21] reported that Lamb waves [22] can propagate in the ionosphere with a velocity of ~340 m/s for a long distance, which might be the reason for the significant TEC perturbations observed in this study (Figure 2a). Note that the TEC perturbations, which appeared before the arrivals of the Lamb waves far away from the volcano (beyond ~8000 km), are dominated by the rapid conjugate effect [21]. On the other hand, the pressure perturbations with a propagation velocity of ~310 m/s (Figure 2c) agree with the velocity of the Lamb waves propagating in the troposphere [22,23,24]. This suggests that Lamb waves individually propagate in the troposphere and ionosphere after the eruption. Meanwhile, the pressure enhancements travel in the troposphere with a subsonic speed that is ~10% slower than it in the ionosphere. In other words, the TEC front (Figure 3a) leads the air pressure enhancements in the troposphere.
Propagations of Lamb waves in the troposphere can generate acoustic and gravity waves [23,24]. The secondary TEC peak lags the air pressure enhancement by ~12 min (Figure 3a,b) and is caused by the upward propagation of the acoustic waves, which takes nearly 10 min from the troposphere to the ionosphere [5,25]. We further estimated the arrival time, as a function of the propagation distance, utilizing the speed of 305 m/s by adding the 12 min delay for further comparison with the spatiotemporal distribution of BDS sTEC, as shown in Figure 2b. The comparison shows that the secondary peaks following the front of the TEC perturbations are continuously triggered by the pressure enhancements traveling in the troposphere with a lower speed (i.e., ~305 m/s). The simple, but intense front, benefits us to recognize the TEC perturbations leading the pressure enhancements by ~12 min. These results show that the BDS GEO TECs together with the novel MVP-LAI system is efficient to clarify causal mechanisms of the TEC perturbations. The air pressure underlying IPPs plays an important role in determining the influence from the Lamb waves. The TEC perturbations with a propagation velocity close to a sonic speed (i.e., ~300 to 350 m/s) have generally been referred to as acoustic waves in the past, though this should be reconsidered in the future.
On the other hand, Lamb waves can trigger ground vibrations, simultaneously. Significant ground vibrations in the two horizontal components (Figure 3c,d) could result from Lamb waves that mainly propagate in the horizontal direction. Meanwhile, the air density is much smaller than it of the crust. It is difficult to trigger ground vibrations in the vertical component by Lamb waves mainly propagating in the horizontal direction around the sphere.
6. Conclusions
The global navigation satellite system (GNSS) and air pressure arrays capture the blast waves excited by the Hunga Tonga-Hunga Ha’apai underwater volcano eruption, simultaneously. The waves excited by the volcano individually propagate in the troposphere and ionosphere. The wave speed in the ionosphere is ~335 m/s, which is ~10% faster than its’ ~305 m/s propagating in the troposphere. The multiple data from the MVP-LAI system show that the waves in the troposphere trigger ground vibrations (mainly in the horizontal component) in the lithosphere without an obvious time difference. In contrast, the waves in the troposphere propagate upward and induce perturbations in the total electron content (TEC) in the ionosphere with a delay of ~12 min through the acoustic waves. The geostationary (GEO) satellites operated by the BeiDou Navigation Satellite System (BDS) are space seismometers or buoys to detect the TEC perturbations that can be utilized to support the early warning.
Supplementary Materials
The following supporting information can be downloaded at: https://doi.org/10.5281/zenodo.6348536, Video S1: Supp_Mov.avi.
Author Contributions
Conceptualization, C.-H.C.; methodology, C.-H.C. and Y.-Y.S.; software, C.-H.C.; validation, C.-Y.L.; formal analysis, C.-H.C., C.-Y.L., Y.G., D.Z. and J.-Y.L.; investigation, X.Z. (Xuemin Zhang), F.W., T.-C.L., J.L., X.J., X.Z. (Xiaoli Zhao), X.C., P.Z., Q.C., D.Z., Z.M. and J.-Y.L.; data curation, C.-H.C., X.Z. (Xuemin Zhang) and T.-C.L.; writing—original draft preparation, C.-H.C.; writing—review and editing, C.-H.C. and Y.-Y.S.; visualization, C.-H.C.; supervision, C.-H.C.; project administration, C.-H.C.; funding acquisition, C.-H.C. All authors have read and agreed to the published version of the manuscript.
Funding
This research was funded by the Joint Funds of the National Natural Science Foundation of China, grant number U2039205, and the National Natural Science Foundation of China, grant numbers 42174211 and 42174084.
Data Availability Statement
All data have been collected and are available at the link https://doi.org/10.6084/m9.figshare.18689255.v5 (accessed on 20 January 2022).
Acknowledgments
The authors thank the Crustal Dynamics Data Information System (CDDIS); Japan Meteorological Agency (JMA); Survey and Mapping Office Lands Department, Hong Kong; China Earthquake Networks Center; National Earthquake Data Center; and Sichuan Meteorological Disaster Prevention Technology Center in China who provided GNSS and air pressure data. The authors also thank the people who established and maintain the MVP-LAI system for providing GNSS, air pressure, and ground vibration data.
Conflicts of Interest
The authors declare no conflict of interest.
References
- Astafyeva, E. Ionospheric detection of natural hazards. Rev. Geophys. 2019, 57, 1265–1288. [Google Scholar] [CrossRef]
- Chen, C.H.; Saito, A.; Lin, C.H.; Liu, J.Y.; Tasi, H.F.; Tsugawa, T.; Otsuka, Y.; Nishioka, M.; Matsumura, M. Long-distance propagation of ionospheric disturbance generated by the 2011 off the Pacific coast of Tohoku Earthquake. Earth Planets Space 2011, 63, 881–884. [Google Scholar] [CrossRef] [Green Version]
- Komjathy, A.; Yang, Y.-M.; Meng, X.; Verkhoglyadova, O.; Mannucci, A.J.; Langley, R.B. Review and perspectives: Understanding natural-hazards-generated ionospheric perturbations using GPS measurements and coupled modeling. Radio Sci. 2016, 51, 951–961. [Google Scholar] [CrossRef]
- Liu, J.Y.; Tsai, Y.B.; Chen, S.W.; Lee, C.P.; Chen, Y.C.; Yen, H.Y.; Chang, W.Y.; Liu, C. Giant ionospheric disturbances excited by the M9.3 Sumatra earthquake of 26 December 2004. Geophys. Res. Lett. 2006, 33, L02103. [Google Scholar] [CrossRef] [Green Version]
- Sun, Y.-Y.; Liu, J.-Y.; Lin, C.-Y.; Tsai, H.-F.; Chang, L.C.; Chen, C.-Y.; Chen, C.-H. Ionospheric F2 region perturbed by the 25 April 2015 Nepal earthquake. J. Geophys. Res. Space Phys. 2016, 121, 5778–5784. [Google Scholar] [CrossRef]
- Heki, K. Explosion energy of the 2004 eruption of the Asama Volcano, central Japan, inferred from ionospheric disturbances. Geophys. Res. Lett. 2006, 33, L14303. [Google Scholar] [CrossRef] [Green Version]
- Dautermann, T.; Calais, E.; Mattioli, G.S. Global Positioning System detection and energy estimation of the ionospheric wave caused by the 13 July 2003 explosion of the Soufrière Hills Volcano, Montserrat. J. Geophys. Res. 2009, 114, B02202. [Google Scholar] [CrossRef]
- Shults, K.; Astafyeva, E.; Adourian, S. Ionospheric detection and localization of volcano eruptions on the example of the April 2015 Calbuco events. J. Geophys. Res. Space Phys. 2016, 121, 10303–10315. [Google Scholar] [CrossRef] [Green Version]
- Liu, J.Y.; Tsai, H.F.; Jung, T.K. Total electron content obtained by using the Global Positioning System. Terr. Atmos. Ocean Sci. 1996, 7, 107–117. [Google Scholar] [CrossRef]
- Sun, Y.Y.; Liu, J.Y.; Chao, C.K.; Chen, C.H. Intensity of low-latitude nighttime F-region ionospheric density irregularities observed by ROCSAT and ground-based GPS receivers in solar maximum. J. Atmos. Sol.-Terr. Phy. 2015, 123, 92–101. [Google Scholar] [CrossRef]
- Otsuka, Y.; Shinbori, A.; Tsugawa, T.; Nishioka, M. Solar activity dependence of medium-scale traveling ionospheric disturbances using GPS receivers in Japan. Earth Planets Space 2021, 73, 22. [Google Scholar] [CrossRef]
- Su, X.; Meng, G.; Sun, H.; Wu, W. Positioning Performance of BDS Observation of the Crustal Movement Observation Network of China and Its Potential Application on Crustal Deformation. Sensors 2018, 18, 3353. [Google Scholar] [CrossRef] [PubMed] [Green Version]
- Liu, J.-Y.; Chen, C.-H.; Lin, C.-H.; Tsai, H.-F.; Chen, C.-H.; Kamogawa, M. Ionospheric disturbances triggered by the 11 March 2011 M9.0 Tohoku earthquake. J. Geophys. Res. 2011, 116, A06319. [Google Scholar] [CrossRef]
- Sun, Y.-Y.; Matsuo, T.; Araujo-Pradere, E.A.; Liu, J.-Y. Ground-based GPS observation of SED-associated irregularities over CONUS. J. Geophys. Res. Space Phys. 2013, 118, 2478–2489. [Google Scholar] [CrossRef] [Green Version]
- Sun, Y.-Y.; Liu, J.-Y.; Tsai, H.-F.; Krankowski, A. Global ionosphere map constructed by using total electron content from ground-based GNSS receiver and FORMOSAT-3/COSMIC GPS occultation experiment. GPS Solut. 2017, 21, 1583–1591. [Google Scholar] [CrossRef]
- Chen, C.-H.; Sun, Y.-Y.; Xu, R.; Lin, K.; Wang, F.; Zhang, D.; Liu, J.-Y. Resident waves in the ionosphere before the M6.1 Dali and M7.3 Qinghai earthquakes of 21–22 May 2021. Earth Space Sci. 2022, 9, e2021EA002159. [Google Scholar] [CrossRef]
- Chou, M.-Y.; Yue, J.; Lin, C.C.; Rajesh, P.K.; Pedatella, N.M. Conjugate effect of the 2011 Tohoku reflected tsunami-driven gravity waves in the ionosphere. Geophys. Res. Lett. 2022, 49, e2021GL097170. [Google Scholar] [CrossRef]
- Liu, J.Y.; Chen, C.Y.; Sun, Y.Y.; Lee, I.T.; Chum, J. Fluctuations on vertical profiles of the ionospheric electron density perturbed by the March 11, 2011 M9.0 Tohoku earthquake and tsunami. GPS Solut. 2019, 23, 76. [Google Scholar] [CrossRef]
- Davies, K. Ionospheric Radio; Peter Peregrinus Ltd.: London, UK, 1990. [Google Scholar]
- Chen, C.-H.; Sun, Y.-Y.; Lin, K.; Zhou, C.; Xu, R.; Qing, H.; Gao, Y.; Chen, T.; Wang, F.; Yu, H.; et al. A new instrumental array in Sichuan, China, to monitor vibrations and perturbations of the lithosphere, atmosphere and ionosphere. Surv. Geophys. 2021, 42, 1425–1442. [Google Scholar] [CrossRef]
- Lin, J.-T.; Rajesh, P.K.; Lin Charles, C.-H.; Chou, M.-Y.; Liu, J.-Y.; Yue, J.; Tsai, H.-F.; Chao, H.-M.; Kung, M.-M. Rapid Conjugate Appearance of the Giant Ionospheric Lamb Wave in the Northern Hemisphere after Hunga-Tonga Volcano Eruptions. Geophys. Res. Lett. 2022, 49, e2022GL098222. [Google Scholar] [CrossRef]
- Nishida, K.; Kobayashi, N.; Fukao, Y. Background Lamb Waves in the Earth’s Atmosphere. Geophys. J. Int. 2014, 196, 312–316. [Google Scholar] [CrossRef] [Green Version]
- Bossert, K.; Vadas, S.L.; Hoffmann, L.; Becker, E.; Harvey, V.L.; Bramberger, M. Observations of Stratospheric Gravity Waves over Europe on 12 January 2016: The Role of the Polar Night Jet. J. Geophys. Res. Atmospheres. 2020, 125, e2020JD032893. [Google Scholar] [CrossRef]
- Lindzen, R.S.; Blake, D. Lamb Waves in the Presence of Realistic Distributions of Temperature and Dissipation. J. Geophys. Res. Space Phys. 1972, 77, 2166–2176. [Google Scholar] [CrossRef]
- Liu, J.Y.; Chen, C.H.; Sun, Y.Y.; Chen, C.H.; Tsai, H.F.; Yen, H.Y.; Chum, J.; Lastovicka, J.; Yang, Q.S.; Chen, W.S.; et al. The vertical propagation of disturbances triggered by seismic waves of the 11 March 2011 M9.0 Tohoku Earthquake over Taiwan. Geophys. Res. Lett. 2016, 43, 1759–1765. [Google Scholar] [CrossRef] [Green Version]
Publisher’s Note: MDPI stays neutral with regard to jurisdictional claims in published maps and institutional affiliations. |
© 2022 by the authors. Licensee MDPI, Basel, Switzerland. This article is an open access article distributed under the terms and conditions of the Creative Commons Attribution (CC BY) license (https://creativecommons.org/licenses/by/4.0/).