Article

Recomputation and Updating of MOLA Geolocation

1
Institute of Geodesy and Geoinformation Science, Technische Universität Berlin, 10553 Berlin, Germany
2
German Aerospace Center (DLR), Institute of Planetary Research, 12489 Berlin, Germany
*
Author to whom correspondence should be addressed.
Remote Sens. 2022, 14(9), 2201; https://doi.org/10.3390/rs14092201
Submission received: 31 March 2022 / Revised: 25 April 2022 / Accepted: 2 May 2022 / Published: 5 May 2022
(This article belongs to the Special Issue Planetary Exploration Using Remote Sensing)

Abstract

:
The Mars Orbiter Laser Altimeter (MOLA) Precision Experiment Data Records (PEDR) serve as the geodetic reference of Mars. However, these MOLA footprints were geolocated using outdated auxiliary information that dates back to 2003. In this study, we recompute the MOLA PEDR footprint locations and investigate the impact of the updated spacecraft orbit model and Mars rotational model on MOLA’s geolocation. We observe quasi-exponential increases near the poles of up to 30 m in the recomputation residuals for the nadir profiles. Meanwhile, we demonstrate that limitations exist in the stored MOLA PEDR attitude records, which can shift the footprint up to hundreds of meters laterally and several meters radially. The usage of the Navigation and Ancillary Information Facility (NAIF)-archived attitude information instead can circumvent this issue and avoid the approximation errors due to discrete samplings of the attitude information used in geolocation by the PEDR dataset. These approximation errors can be up to 60 m laterally and 1 m radially amid controlled spacecraft maneuvers. Furthermore, the incorporation of the updated spacecraft orbit and Mars rotational model can shift the MOLA profiles up to 200 m laterally and 0.5 m radially, which are much larger in magnitude than the aforementioned dramatic increases near the poles. However, the shifted locations of the reprocessed profiles are significantly inconsistent with the PEDR profiles after the global cross-over analysis.

1. Introduction

Laser altimeters are widely used in planetary exploration to derive the shape and topography of a celestial object, e.g., [1,2]. Furthermore, differential range measurements at profile intersecting points, i.e., cross-overs, can be used for detecting surface height change from either tidal flexing [3,4,5] or seasonal deposition/sublimation of the CO 2 snow/ice [6,7]. Besides, these cross-overs can be incorporated in the precise orbit determination process, e.g., [8,9]. Co-registration of laser altimeter profiles to reference topography can be used for rotation measurements [10], to enhance the spatial coverage of the merged product [11], and to temporally resolve the height variations of the seasonal polar caps of Mars [12]. In addition, by studying the width and energy of the reflected laser pulse, the surface albedo and roughness at the footprint scale [2,13] can be investigated and reflective and absorptive clouds can be mapped [14]. Due to their high measurement accuracy and wide applications, laser altimeters are continuing to be used in planetary exploration [15,16,17,18,19].
Laser altimeters aim at a precise measurement of two-way ranges from the instrument to the surface of the target body. This is achieved by accurate measurements of the times-of-flight of short (few ns) laser pulses. Currently, there exist four commonly adopted methods to measure the times-of-flight: leading-edge detection, waveform processing and analyzing, constant fraction discrimination, and photon-counting; see for details [20]. Given the trajectory and attitude of the spacecraft, pointing alignment of the laser altimeter, and rotational model of the target body, the time-of-flight measurements can be converted to surface coordinates in the body-fixed reference frame of the target body, i.e., the geolocation process. In a previous work, we presented a consistent and systematic formulation of three commonly-used geolocation models with increasing complexity: Static Model (SM), Spacecraft Motion Model (SMM), and Pointing Aberration Model (PAM) [21]. Furthermore, the Special Relativity Model (SRM) is proposed to take care of the special relativity effects, which have been analytically demonstrated to be equivalent to PAM given some assumptions. These various models were then compared taking Mars Orbiter Laser Altimeter (MOLA) and Mercury Laser Altimeter (MLA) profiles as examples [21].
It should be noted that the performance of the geolocation process is often compromised by significant unmodeled orbit, attitude errors, and less precise rotational parameters of the target bodies. These issues are significantly more prominent in the planetary case than the terrestrial one, e.g., [22,23]. Due to the lack of ground truth for validation and calibration on planetary bodies, the most common approaches to post-correct the geolocation are the cross-over analysis, e.g., [9,24], and co-registration to optical stereoscopic Digital Terrain Models (DTMs), e.g., [11,25,26]. Meanwhile, a recently devised technique for post-correcting the laser profiles, so-called self-registration, has shown great merits in improving the inter-consistency of the laser profiles, especially at the polar regions, where laser tracks converge [10,12,27,28].
The Mars Global Surveyor (MGS) entered Mars polar orbit in September 1997. The MOLA onboard carried out time-of-flight measurements to map Mars topography along the orbital ground tracks, from pole-to-pole. MOLA operated at a shot rate of 1 Hz, thus resulting in a shot spacing of approximately 300 m from the nominal circular orbit of an altitude of ∼400 km. Laser spot sizes are approximately 150 m in diameter. The precision of MOLA range measurements approaches the limiting timing resolution of 37.5 cm on smooth level surfaces, but is expected to increase up to ∼10 m on 30 ° slopes. The footprint geolocation accuracy is limited by uncertainties in the spacecraft orbital position and altitude determination, which is about 1 m in the radial direction and a few hundred meters in the lateral position.
The currently available geolocated MOLA dataset is the Precision Experiment Data Records (PEDR) dataset Version L. This dataset, as well as the gridded data products from it represent a critical geodetic reference for the planet Mars and have been extensively used in various geological and geophysical applications, e.g., [29,30]. However, the MGS trajectory and the Mars IAU2000 rotational model adopted for geolocation by the PEDR dataset date back to nearly 20 years ago, while an improved spacecraft MGS orbit model [31] and updated Mars rotational model are available, IAU2015 [32]. The nominal accuracy of the refined orbit model is ∼2 m laterally and ∼15 cm radially, as revealed by an orbital arc overlap analysis [31]. Compared to the IAU2000 model, the updated Mars rotational model has additionally resolved small oscillations in the pole orientation angles (on the order of ∼2 arcseconds) and the rotational rate. These differences can laterally shift the MOLA laser footprints of up to ∼100 m at around the equator. These shifts gradually decrease to between 10 and 30 m at the poles. Thus, it is very essential to update the entire MOLA dataset based on this updated auxiliary information. Meanwhile, we previously demonstrated that the archived MOLA dataset has not considered the effect of pointing aberration, which can shift the nadir profiles by 4 to 5 m laterally and up to ±3 cm radially.
In this paper, we first introduce the MOLA PEDR dataset. Then, we try to recompute the PEDR footprint locations and draw attention to unexpected features in the residuals and issues regarding the PEDR-documented attitude information and that adopted for the footprint geolocation by the PEDR. Following this, we set out to update the locations of the MOLA footprints using an updated spacecraft trajectory model and Mars rotational model and analyze its impacts. Finally, we discuss the results and prospects to further improve the MOLA geolocation accuracy.

2. Data

The MOLA PEDR dataset Version L includes more than 8700 pole-to-pole laser profiles acquired in the mapping and extended phases from March 1999 to June 2001, which spanned more than one full Martian year (Martian Year 24 to 25). Among them are more than 100 off-nadir profiles intermittently acquired by commanding MGS to roll off-nadir > 10 ° to fill the gaps beyond the orbital limits of MGS (∼87 ° S/N to the poles). Additionally, there also exist off-nadir profiles that are mainly due to high-gain antenna tracking passes and occasional off-nadir roll maneuvers to acquire off-nadir contiguous data from the Mars Orbiter Camera (MOC), the Thermal Emission Spectrometer (TES), and MOLA, which was used to support landing site certification for future missions. The MOLA PEDR dataset contains shot emission times, times-of-flight, MGS position and attitude angles, as well as other instrument and observation characteristics. In the PEDR processing, flagged noise returns and shots with missing attitude information have been excluded. Further, corrections due to detector response delay and range walk, which are in the order of meters and also documented in the PEDR, have been applied [24]. Range walk denotes the time interval from the pulse centroid to the leading-edge time, which is terrain- and link-dependent. When the energy and pulse width measurements are saturated (approximately 67% in proportion), a simulated leading-edge timing bias is used instead. However, this correction scheme can systematically underestimate laser ranges over very bright terrain, e.g., residual and seasonal polar caps, by a few tenths of a meter. Meanwhile, this dataset also includes corrections in longitude, latitude, and height for each footprint from a global cross-over adjustment [24]. Neumann et al. [24] parameterized uncertainties in the MOLA profiles by slowly varying harmonic functions to adjust the tracks in 3D to minimize the height misfits at cross-overs, in order to post-correct for residual spacecraft orbit, timing, and pointing errors. The accuracy of individual footprints after the global cross-over analysis is better than 100 m laterally and approximately 1 m radially [24].
The updated MGS orbit model [31] using a combination of MGS and Mars Odyssey radio tracking data is available as trajectory kernels in the Navigation and Ancillary Information Facility (NAIF). The Mars ephemerides file DE414, which used improved asteroid modeling back then in 2006, is used in accordance with the updated MGS orbit. The updated Mars rotational model, i.e., IAU2015 model, is defined in Archinal et al. [32].

3. Methods

Before the investigation of the updated MGS orbit model and Mars rotational model, we need to be able to recompute the footprint locations documented in the PEDR to make sure we correctly handle the geolocation procedures. From the brief description of the MOLA PEDR geolocation process [33], we inferred that they have accounted for the motion of the spacecraft during times-of-flight, but have not mentioned anything about pointing aberration or other forms of pointing correction. Thus, we applied the SMM geolocation model with Mars as the observer for the recomputation [21]:
r in SMM = c τ 2 β 2 1 β · e 1 1 e 1 + r S t 1   ,
where r in SMM is the inertial positional vector of the bounce point with respect to Mars. c is the speed of light in a vacuum, and τ is the laser time-of-flight. t 1 is the laser transmission time stamp. β = r 12 / τ c , in which r 12 denotes the vector directed from the spacecraft’s position at t 1 to that at reception time t 1 + τ . e 1 is the normalized boresight vector denoting the orientation of the emitter of the laser altimeter. r s ( t 1 ) is the spacecraft’s position vector with respect to the Center-of-Mass (CoM) of Mars at t 1 . Then, body-fixed footprint coordinates r bf SMM can be related to the inertial coordinates as
r bf SMM = R z W t SMM R x π 2 δ t SMM R z π 2 + α t SMM · r in SMM   ,
with the time-dependent Euler angles α , δ , and W denoting the right ascension, declination, and prime meridian angle in the International Celestial Reference Frame (ICRF), respectively; see Archinal et al. [32] for details. t SMM = t 1 + τ 2 β 2 1 β · e 1 1 denotes the laser reflection time. R x , z denote counter-clockwise rotation matrices about the respective axis. The obtained Cartesian coordinates of a footprint can further be converted to spherical coordinates as longitude, latitude, and height.
For the PEDR-documented trajectory of MGS, we extracted its positions at the laser emission time stamps, interpolated them using the Lagrange polynomials with degree 3, and converted them to Spacecraft, Planet, Instrument, Camera-matrix, Events (SPICE) Type 9 kernels [34]. For the orientation of the spacecraft reference frame with respect to the ICRF, we used the “Camera-matrix” Kernels (CKs) maintained at the NAIF. Considering the timing biases specific to MOLA, including the internal timing bias of 117.1875 ms and the attitude kernel time tag adjustment bias of −1.15 s [24], the rotation matrix that relates the coordinates in the MGS frame to the ICRF frame at a laser emission time stamp (andas the ephemeris time in seconds past J2000) is obtained at a time stamp 1.2671875 s earlier. The laser boresight is assumed to be aligned perfectly with the +Z axis of the spacecraft frame. Thus, the unit boresight vector in ICRF can be formulated as
e 1 | et = R MGS ICRF | et 1.2671875 · [ 0 ,   0 ,   1 ] T   .
In addition, we adopted the IAU2000 Mars rotational model [35] to convert the inertial coordinates to body-fixed ones, i.e., in longitude, latitude, and height. Further, range corrections documented in the PEDR were applied to account for electronic delays and range walks. Finally, lateral and radial differences between the outputs from the recomputation and the PEDR locations were calculated. Here, the lateral difference was computed as the geodetic distance on the IAU2015 ellipsoid of Mars between a pair of longitudes and latitudes, which represents the shortest distance on the ellipsoidal surface. For this purpose, we resorted to an improved Vincenty’s formula, which has errors in nanometers and always converges, even for antipodal points [36].
Xiao et al. [21] demonstrated that the PEDR processing ignored a pointing aberration due to the relative velocity of the spacecraft with respect to Mars. For the nadir-pointing profiles, this can lead to shifts of up to 5 m in the lateral direction and up to ±5 cm in the radial direction (Figure 8 in Xiao et al. [21]). Here, we also compared the outputs of SMM model with Mars as the observer and the PAM model with Mars as the observer [21] to investigate the impact of the pointing aberration on the off-nadir profiles. It should be noted that the results of PAM model are independent of the observers, and the SRM model can be reduced to PAM if the relative velocity of the spacecraft with respect to the observer is small compared to the speed of light. The PAM model is written as [21]
r 1 PAM = c τ 2 β 2 1 β 2 + β · e 1 β 2 + 2 β · e 1 + 1 e 1 + β r in PAM = r 1 PAM + r s t 1   ,
where r 1 PAM is the one-way vector of the outgoing leg. The other variables are the same as in Equation (1). Those with superscript PAM denote the outputs specific to this model. Then, body-fixed footprint coordinates r bf PAM can be related to the inertial coordinates r in PAM as in Equation (2), evaluated at the laser reflection time t PAM = t 1 + r 1 PAM / c .
For reprocessing of the MOLA PEDR using updated auxiliary information, the updated MGS orbit model [31] is available as Spacecraft and Planet Kernel (SPK) files at the NAIF, and the updated Mars rotational model is well documented in Archinal et al. [32]. The PAM model was applied for the geolocation. The CKs maintained at the NAIF were used for the determination of the spacecraft attitude and laser pointing. The internal consistency of the updated profiles was then assessed by evaluating the height misfits at the track cross-overs. To ease the computational load, a coarse-to-fine strategy using subsampled and fully sampled profiles was followed when searching and locating the intersections. In addition, the footprint locations of the reprocessed dataset were also compared to the PEDR dataset after the global cross-over analysis to analyze the impact of this updated auxiliary information on the geolocation.

4. Results

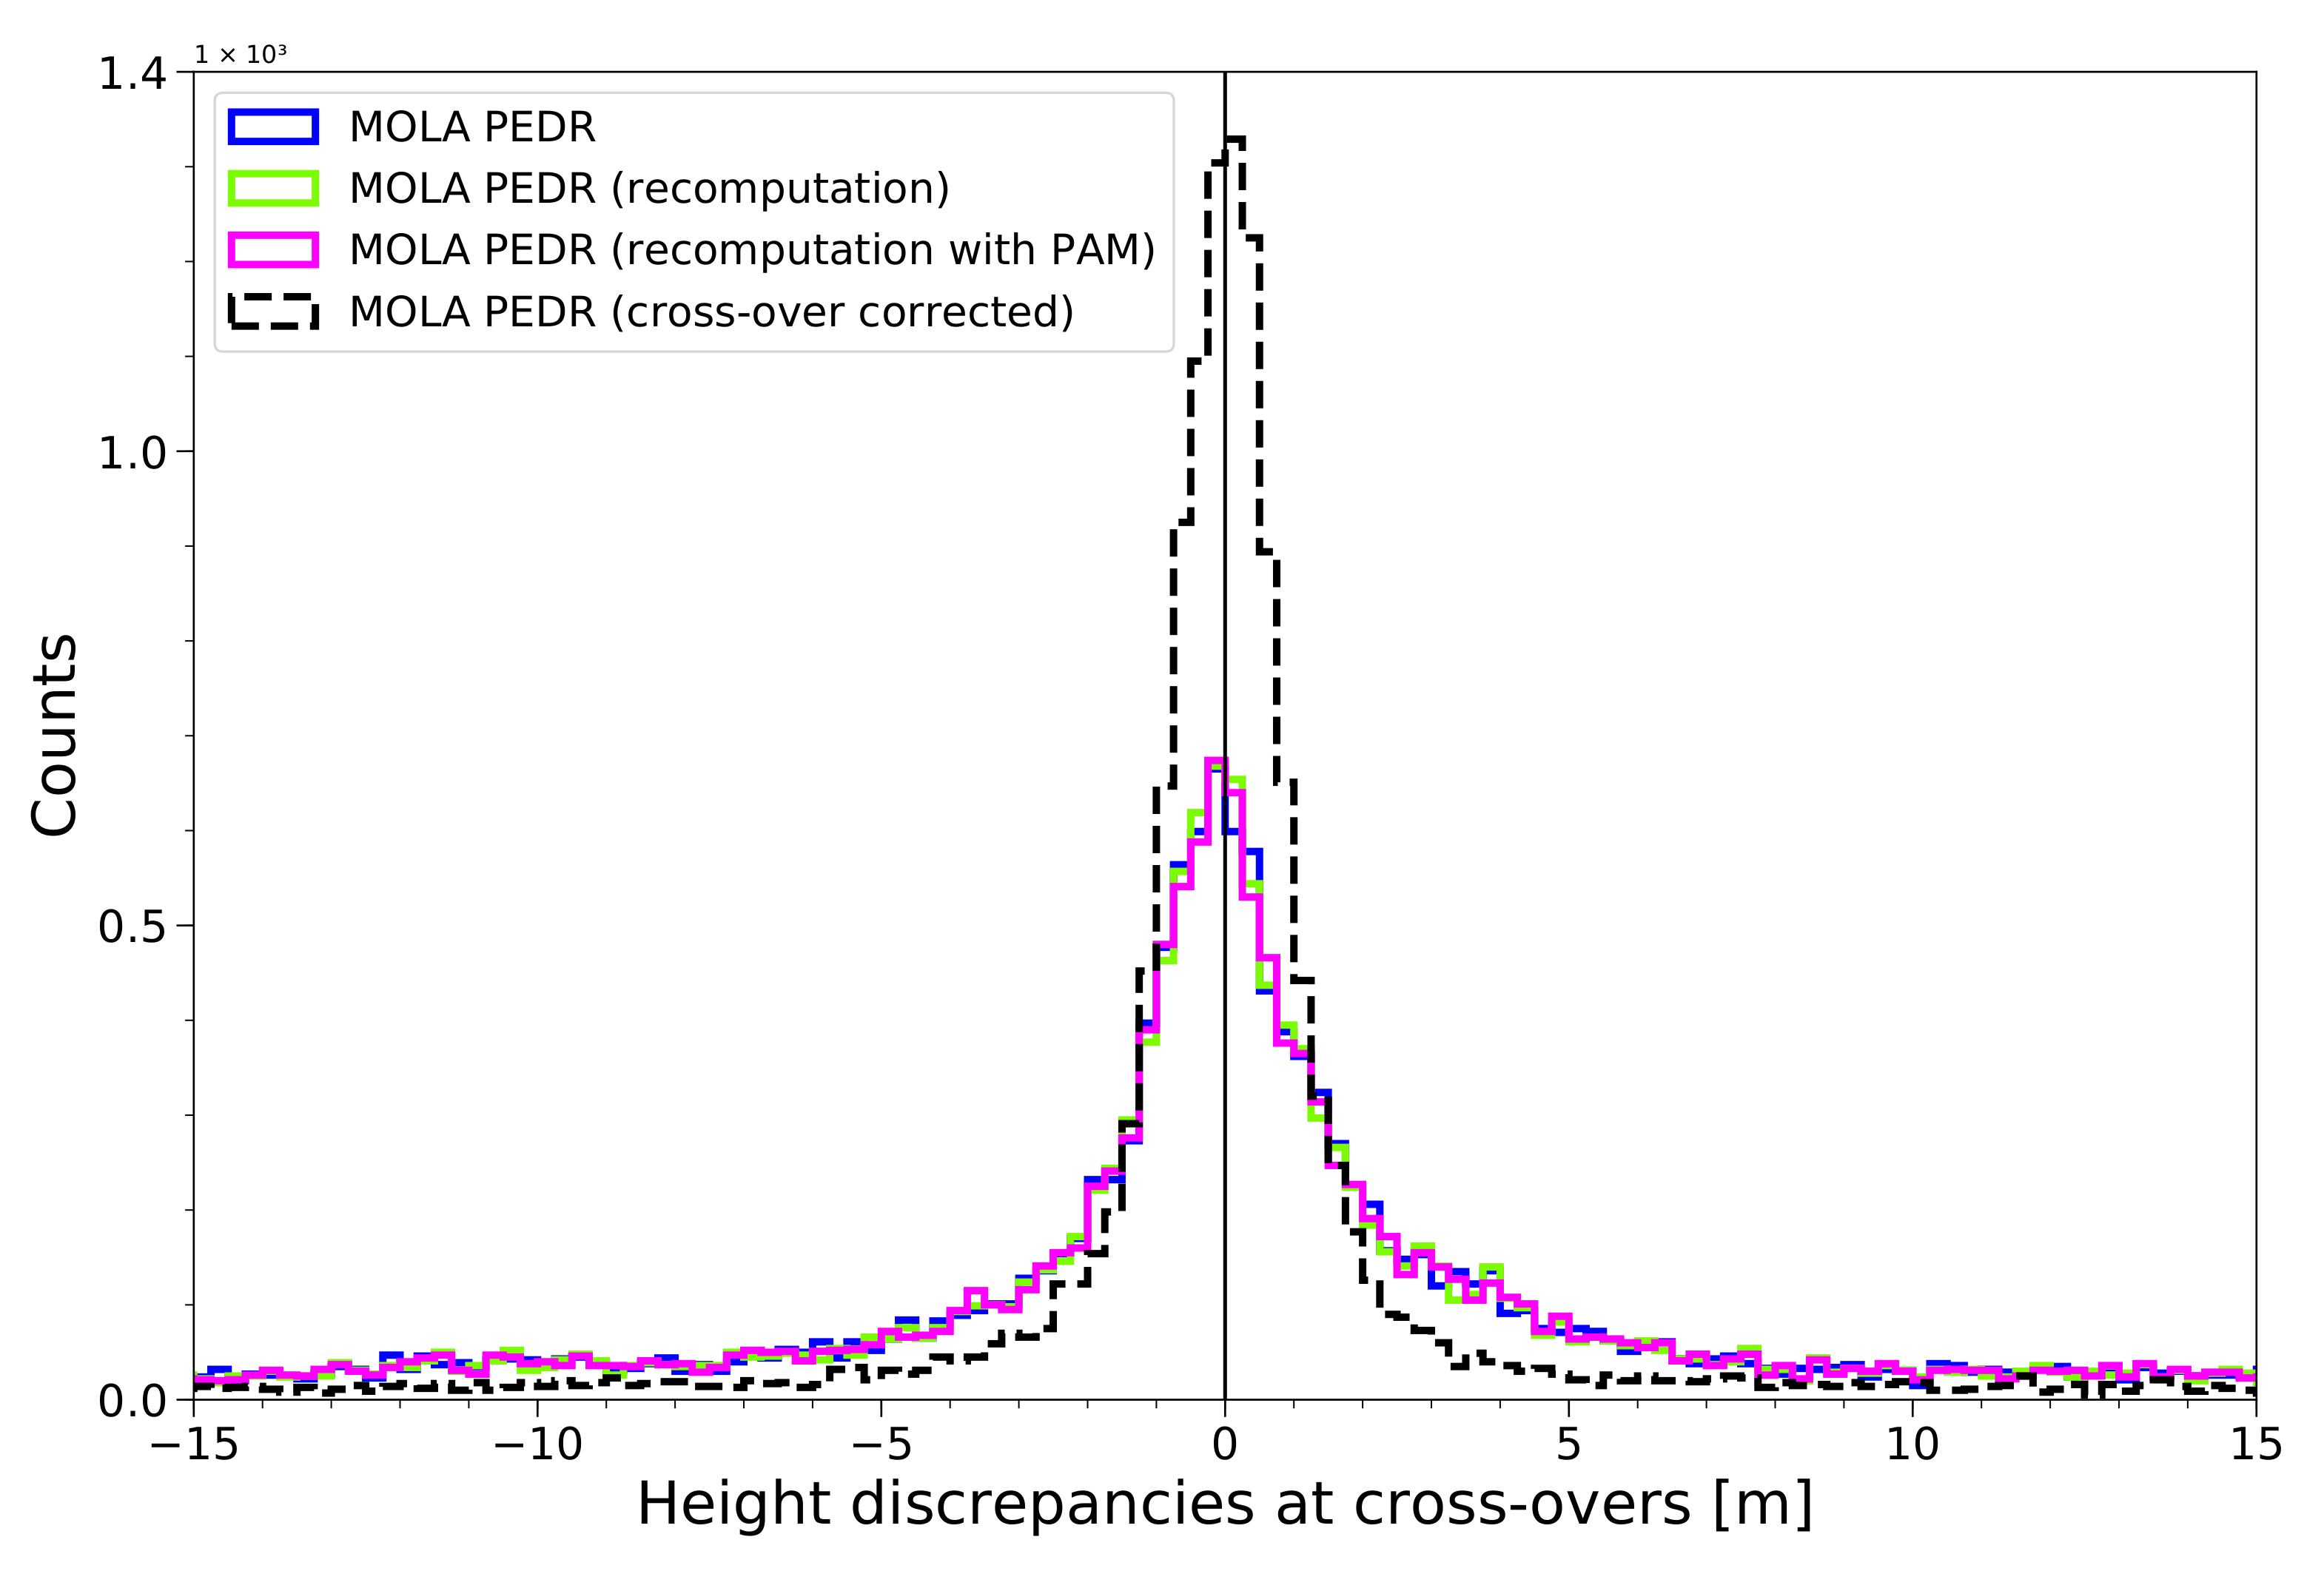
4.1. Recomputation of the PEDR Dataset

Five nadir-pointing profiles that sample most of the duration of the mission, numbered orbits 1000, 3000, 5000, 7000, and 8000, were selected for experimentation. The locations of the selected profiles are shown in Figure 1. The off-nadir angles of these profiles remain less than 1 ° during operation (top panel of Figure 2). These off-nadir angles are from those documented in the PEDR dataset and represent the separation between the transmitted laser shot direction and areocentric direction from the CoM of Mars to the spacecraft. Recomputation uses the SMM geolocation model with Mars as the observer, the spacecraft orbit documented in the MOLA PEDR, the attitude kernels available at the NAIF, and the IAU2000 Mars rotational model. The recomputed footprint locations as compared to the PEDR footprint positions without incorporating the cross-over corrections are shown in Figure 2. Laterally, we observe dramatic quasi-exponential increases in the residuals with the latitude poleward of about 75 ° S/N, reaching values of more than 30 m at 87 ° S/N. In contrast, 98.5% of the differences are below 4 m within 60 ° S/N. In addition, the occurrence of large spiky residuals of up to 40 m in magnitude is observed, corresponding to time periods when off-nadir angles rapidly changed. Radially, the results of re-analysis are consistent with the PEDR dataset (Version L) to within 4 cm with a bias of ∼1 cm.
Furthermore, four off-nadir profiles were randomly selected for the recomputation experiment (see Figure 1 for locations). These off-nadir profiles were acquired to fill the gaps at the poles beyond 87 ° S/N. The dedicated maneuvers can begin at low to mid-latitudes, and the off-nadir angles are more than 15 ° at the poles (top panel of Figure 3). As has been done with the nadir-pointing profiles, we tried to recompute the locations of the footprints. The recomputation result as compared to the PEDR for these off-nadir profiles is shown in Figure 3. Dramatic increases in residuals near the poles are present in these off-nadir profiles and can approach 100 m close to the poles. It is clear that the abrupt deviations can still be observed in both the lateral and radial directions and coincide with when attitude maneuvers were being initiated. The lateral components of these abrupt deviations can rise up to 60 m. Due to the off-nadir configuration, recomputation errors in the radial direction (up to 150 cm) are much larger than for the nadir-pointing profiles (less than 6 cm).

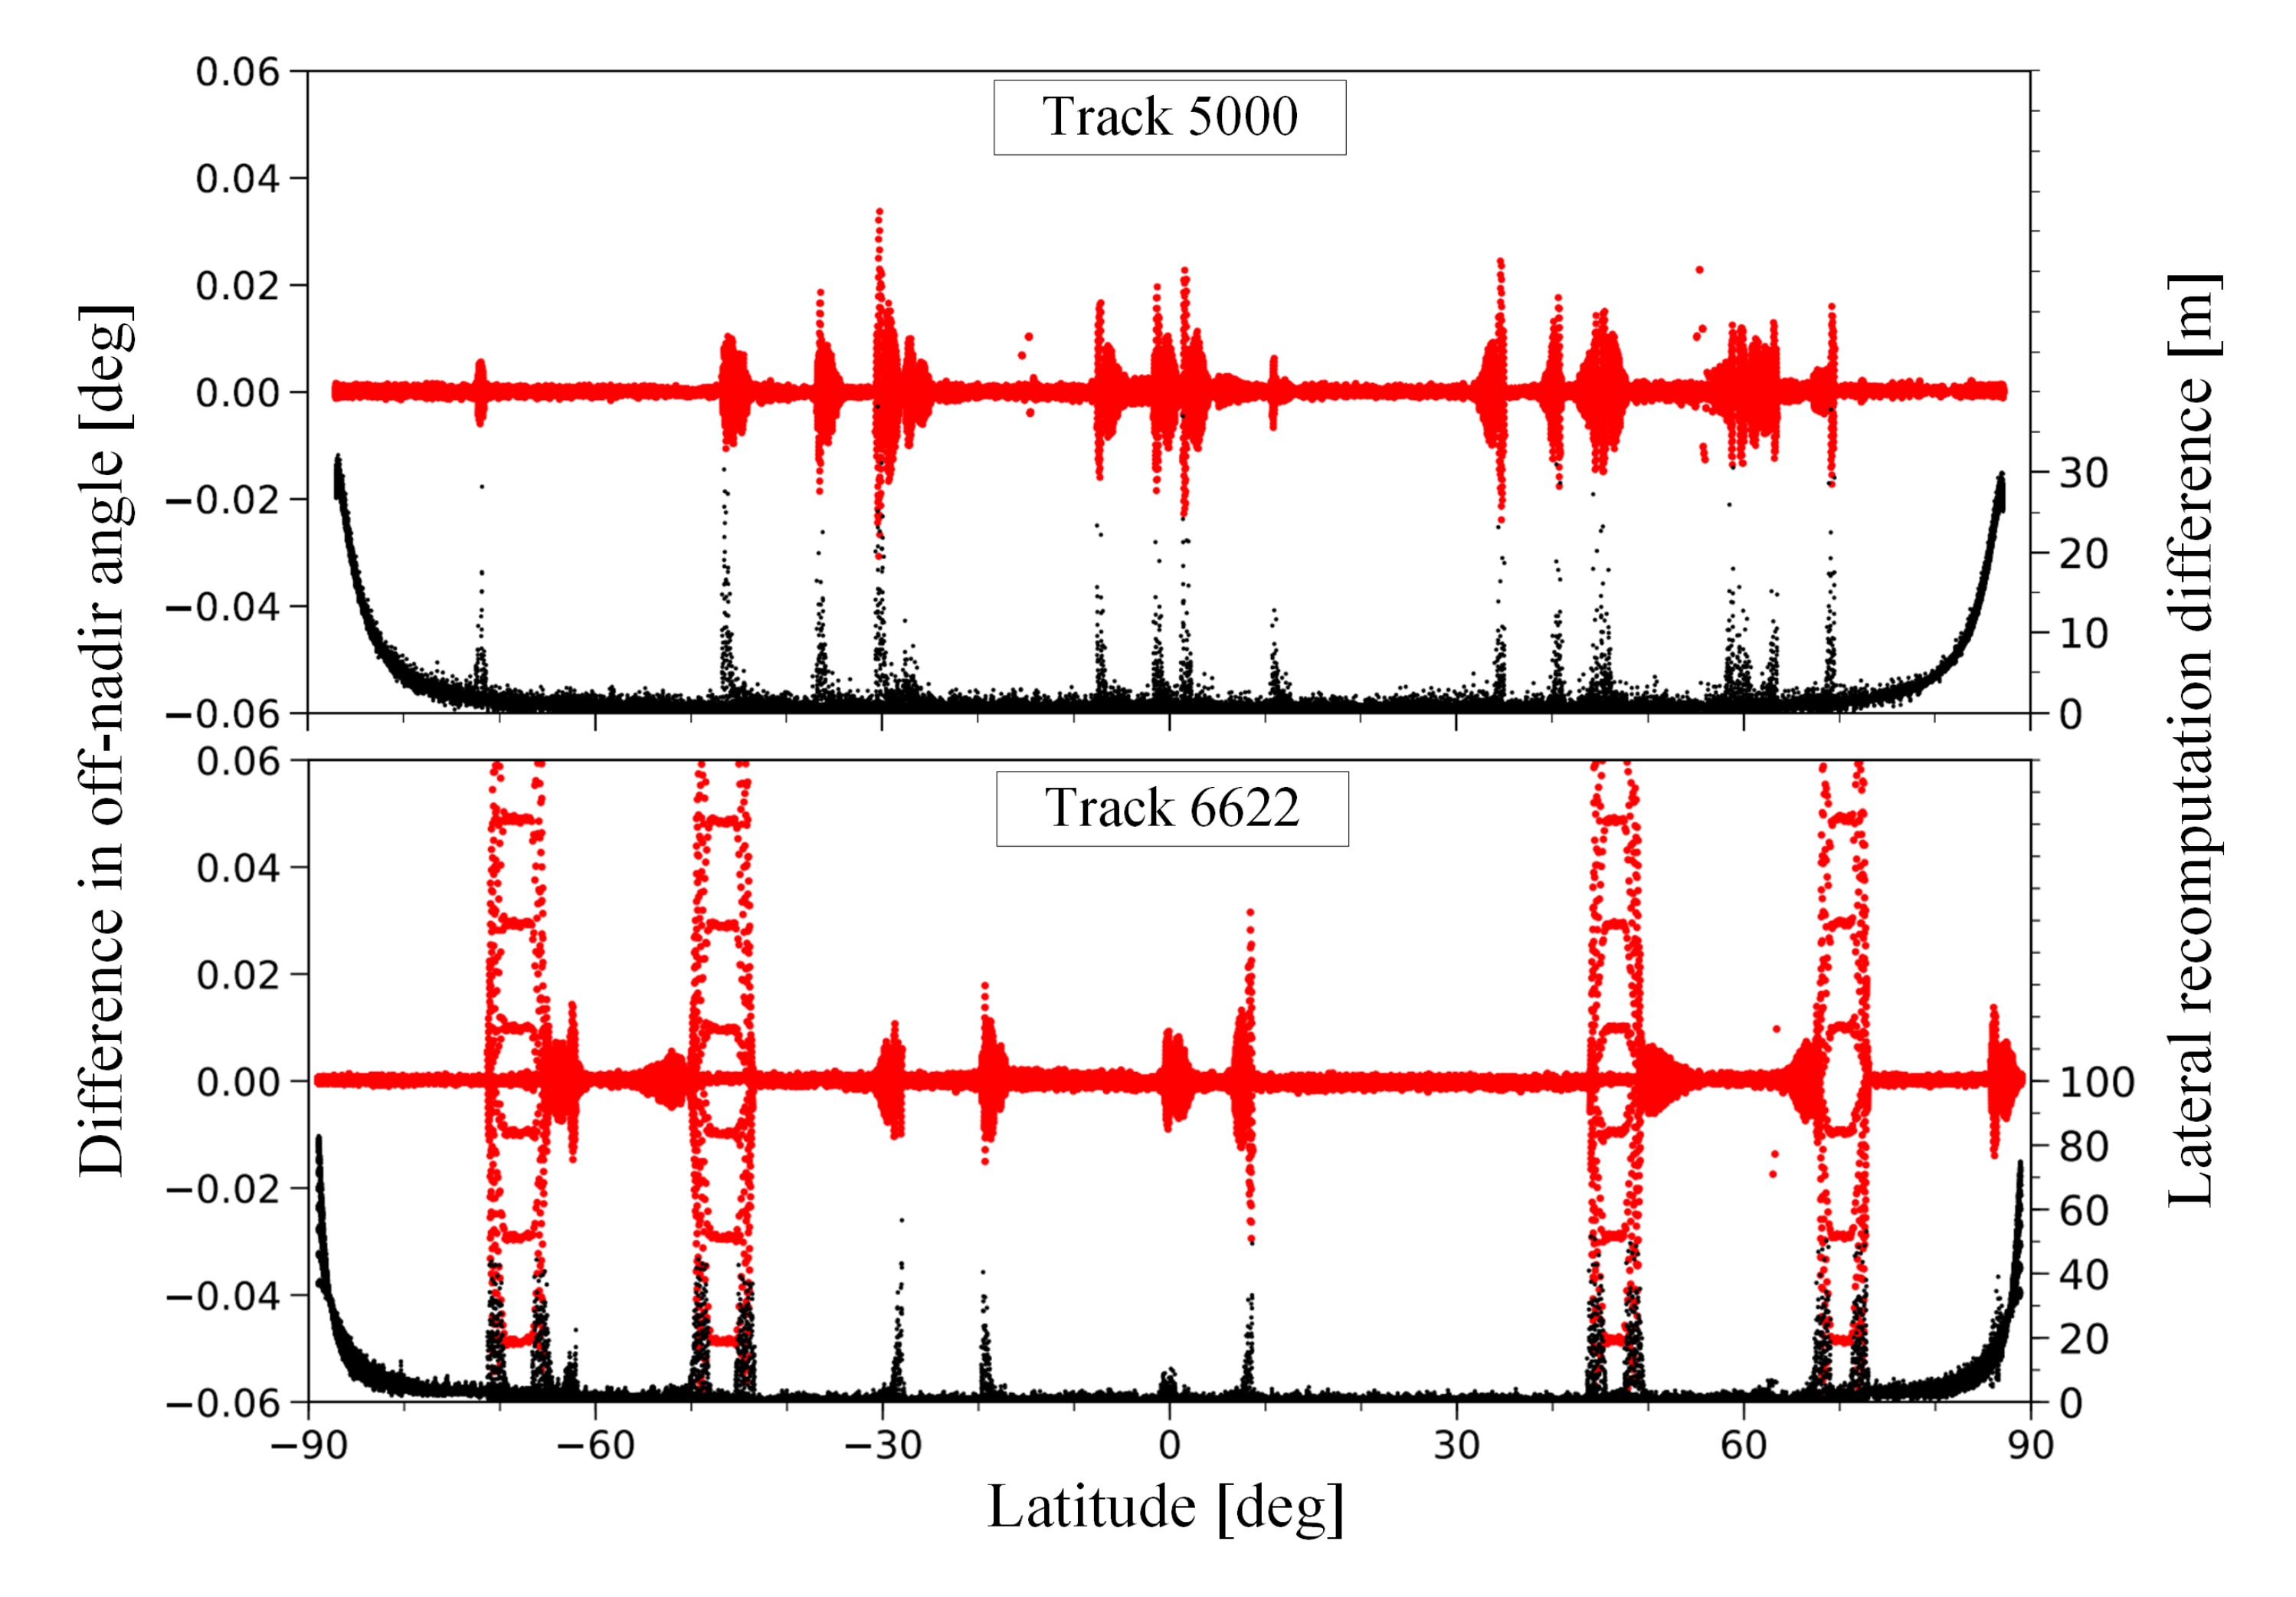
4.2. Impact of Pointing Aberration on Off-Nadir Profiles

The impact of the pointing aberration due to the relative velocity of the spacecraft with respect to Mars on the off-nadir profiles was then investigated, as shown in Figure 4. We used the same set of off-nadir profiles as in Section 4.1 and compared the PAM and SMM geolocation models with Mars as the observer while keeping all other data the same. The shifts of the footprints were within 5.5 m laterally and −7 to 4 cm radially, which are on a similar level as that of the nadir-pointing profiles (4 to 5 m laterally and up to ±3 cm radially [21]). The small magnitudes in the radial direction were mainly due to the spacecraft’s flight direction, hence that of the pointing aberration, being quasi-parallel to the Martian surface. Indeed, the roll maneuvers of the spacecraft to point off-nadir did not change this geometric property. Temporal quasi-linear tilts have been occasionally observed in mainly the intermittently acquired off-nadir profiles (refer to Figure 1 of Xiao et al. [12]). This tilt can lead to misfits with respect to the nadir profiles with peak-to-peak variations up to hundreds of meters. As the aforementioned pointing aberration factor does not lead to shifts compatible with the temporally linear patterns, it is then just a minor contributor to this linear bias. Other elements, e.g., attitude errors of the spacecraft during these off-nadir observation configuration, could be responsible.

4.3. Reprocessing of the PEDR Data

The comparison between PAM, after the incorporation of the improved MGS orbit determination [31] and the updated Mars rotational model (IAU2015, [32]), and the original PEDR footprint locations is shown in Figure 5. We used the IAU2015 Mars rotational model rather than the more recent Konopliv et al. [38] model as the difference between them during the MOLA period is 6 m at most on the Martian ground (Section 5.5.1). Note that a prime meridian offset of 0.002 ° at J2000 was applied to the IAU2015 Mars rotational model to match that of the IAU2000 in order to facilitate the comparison. This offset can translate to ∼120 m at the Martian equator, but decreases towards the poles. Lateral shifts due to the reprocessing were less than 100 m except at the poles, where they reached ∼150 m at the south pole and ∼200 m at the north pole. The radial shifts were merely due to the updated orbit adopted, which can be up to 0.5 m in magnitude. Furthermore, we also compared the reprocessed MOLA profiles to the PEDR cross-over-corrected footprint locations, as shown in Figure 6. Most of the lateral differences (76.7%) were within the uncertainty of the cross-over-corrected footprint locations. However, some parts showed large deviations of up to 200 m, especially towards the north pole. The radial differences indicate significant inconsistency between the two datasets, which can be up to 2 m in magnitude at the polar regions. The much larger deviations at the poles than at the equatorial regions can be partially attributed to the annual height variations of the seasonal polar caps, e.g., [6,7,12]. In summary, the combination of PAM, the refined orbit determination, and the updated Mars rotational model can lead to significant displacements of the MOLA profiles with respect to the PEDR product.

5. Discussion

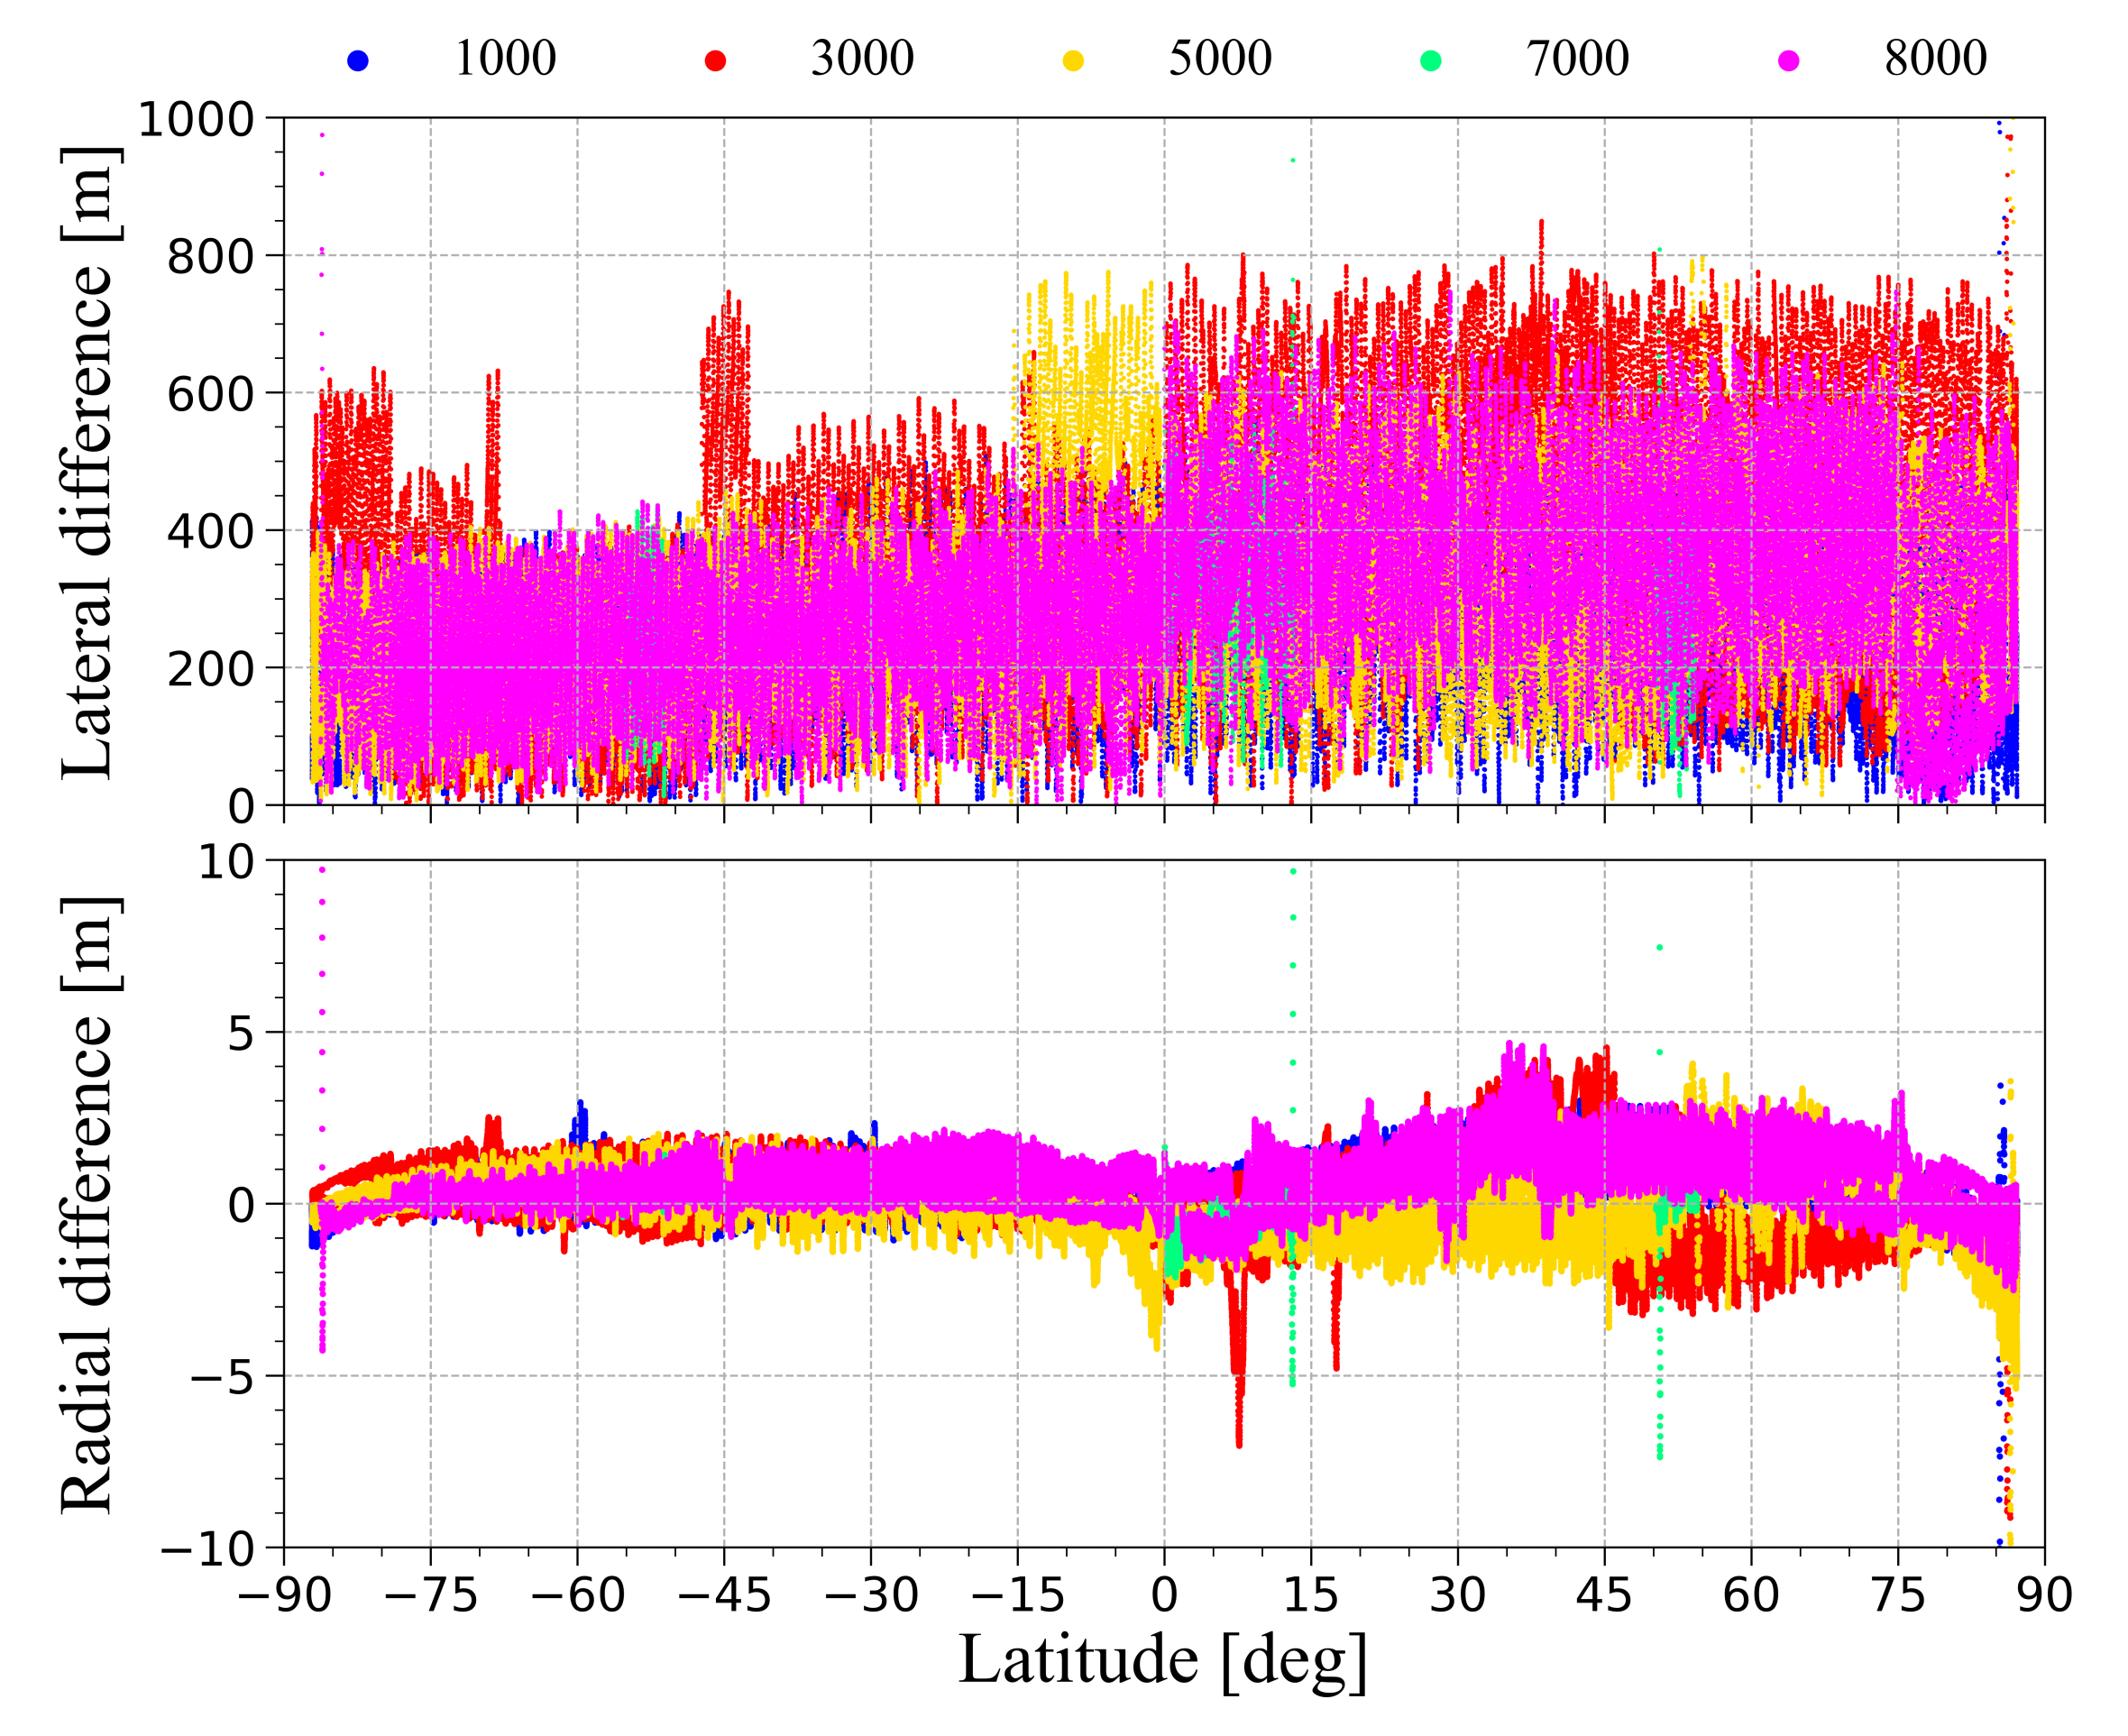
5.1. Dramatic Increases in Residuals Near the Poles

For recomputation of the PEDR, the dramatic increases in residuals near the poles corresponding to when off-nadir angles abruptly changed are an unexpected feature (Figure 2 and Figure 3). In fact, we also performed the recomputation for the MLA dataset on Mercury using our geolocation models, and the residuals were less than ∼30 cm laterally and ∼10 cm radially, which were attributed to the precision loss of the documented numerical values (e.g., longitudes, latitudes, and times-of-flight) and the Shapiro delay that they additionally accounted for [21]. Thus, the geolocation model applied to MOLA is not responsible for these anomalies in residuals. We then made other efforts to pin down the cause for this unexpected feature. First, we attempted to examine the height misfits at cross-overs for the PEDR and the recomputed PEDR at the south polar region (82 ° S to 85 ° S and 0 ° to 360 ° E) to determine if these polar trends deteriorate the self-consistency of the profiles. We also involved the recomputed PEDR corrected for pointing aberration, i.e., using the PAM geolocation model instead of the SMM model in the recomputation, and the cross-over-corrected PEDR [24] in the analysis for comparison (Figure 7). Unfortunately, the results were hardly distinguishable from each other except for the cross-over-corrected PEDR, which featured much higher self-consistency. This indicates the negligible impacts of both the polar trends and the pointing aberration on cross-over misfits of the MOLA profiles.
The IAU1991 Mars rotational model was used in an earlier version of the MOLA dataset, and the IAU2000 rotational model was retrofitted in 2001 to convert the MOLA profiles. For the comparison of the IAU1991 and IAU2000 Mars rotational models, we beforehand compensated for a constant difference of 0.238 ° in the prime meridian angle. Figure 8 illustrates the lateral and radial differences as a function of latitude for the selected nadir profiles. However, the change in the rotation model does not explain the large lateral differences towards the poles in the recomputation experiments.

5.2. Spiky Deviations

The spiky deviations in the recomputation residuals, which occurred when pointing abruptly changed, are another unexpected feature (Figure 2 and Figure 3). Further investigation pointed out the cause to be the temporally discrete attitude information that the MOLA PEDR used for its geolocation. Figure 9 shows the differences in the off-nadir angle between that retrieved using the NAIF CK kernels and that documented in the PEDR dataset for both a nadir ground track (5000) and an off-nadir ground track (6622). We can see that large discrepancies coincide well with both the attitude maneuvers and the abrupt deviations in the recomputation residuals (also shown in Figure 9 for comparison). These deviations in off-nadir angle comparison are due to the fact that the PEDR-documented MGS attitude information, and thus off-nadir angles, used for its geolocation was recorded every 2 s. That means that around 20 footprints in a data frame share constant attitude information. In comparison, the orientation data with a nominal sampling rate of 0.25 Hz were used to generate the NAIF CKs, which can be interpolated to extract attitude information at the footprint time stamps. The resultant approximation errors due to the discrete sampling culminated when the attitude information rapidly changed during the maneuvers. In contrast, when the attitude was slowly changing, e.g., prior to or after the maneuvers, the approximation-induced shifts of the footprints can be limited to a few meters laterally and several centimeters radially.

5.3. Comparison of Different MGS Attitude Sources

We adopted the attitude information from the NAIF-documented CK kernels instead of that recorded in the PEDR dataset due to approximation errors as previously mentioned. In a detailed analysis, we compared these two sets of attitude sources by examining the differences between the Euler angles, right ascension α , declination δ , and twist angle s, which form the rotation matrix from the IAU_MARS body-fixed frame to the MOLA laser altimeter frame (MGS_MOLA), illustrated as follows:
R IAU _ MARS MGS _ MOLA = R z ( s ) R y ( π 2 δ ) R z ( π 2 + α )   .
The PEDR-documented MGS attitude angles were recorded every 2 s (20-shot data frame). As an attempt to alleviate the approximation errors, we interpolated these attitude angles at data frame mid-footprints using a piecewise cubic polynomial, which is twice continuously differentiable, and extrapolated to other footprints with each data frame. The comparison differences are summarized with respect to latitude in Figure 10. Offsets and high-frequency deviations can be observed in all three attitude angles. Meanwhile, the units of the PEDR 20-shot data frames (2 s) can still be clearly identified as in the enlarged windows (approximation errors of the PEDR-recorded MGS attitude information). Besides, dramatically increasing deviations can be observed towards the poles for right ascension and twist. Given a 400 km one-way ranging leg, these small offsets and deviations can translate into ground shifts up to hundreds of meters. These issues could be due to a PEDR attitude storage issue, and these attitude angles were not used in the geolocation of the MOLA PEDR dataset.
Indeed, the obtained recomputation residuals using the interpolated PEDR-documented attitude information are shown in Figure 11, and deviations due to limited attitude information were demonstrated to be as much as hundreds of meters laterally and several meters radially. This is in stark contrast to up to 30 m laterally and several centimeters radially, as when using the MGS attitude information from that archived in the NAIF kernels (Figure 2).

5.4. Impact of the Updated MGS Orbit Model and Mars Rotational Model

To investigate if the reprocessing could actually bring improvements to the internal consistency of the the PEDR dataset, we compared the height misfits at cross-overs for the PEDR and the reprocessed PEDR in the region from 60 ° S to 60 ° N and 180 ° E to 220 ° E, which entails the entire range of latitudes that are free of the seasonal polar caps [12]. While the median of the height misfits at cross-overs stayed largely unchanged (0.29 m to 0.33 m), the Root Mean Square (RMS) decreased from 8.2 m to 7.0 m. In comparison, the cross-over height misfits were much smaller for the cross-over-corrected PEDR, with a median of just −0.12 m and an RMS of 3.2 m, showcasing the better internal consistency of the dataset after the post-correction. While the global cross-over analysis corrected the profiles to be at the annually mean surface, the seasonal signal remained in our reprocessed profiles.
In another effort, we compared the lateral displacement vectors between the footprint locations after reprocessing and that after the global cross-over analysis from Neumann et al. Neumann et al. [24] for 15 randomly selected profiles in the south pole (Figure 12). For the reprocessing, we adopted the PAM geolocation model combined with the updated orbit from konopliv et al. [31], the attitude information from the CKs maintained at the NAIF, and the IAU2015 Mars rotational model. The magnitudes of the cross-over corrections can be up to 331.4 m with a mean of 96.7 m. In contrast, corrections from the reprocessing featured a significantly smaller maximum of 119.6 m and a mean of 57.3 m. In addition, the magnitudes of the cross-over corrections were much more variable along-track. Despite the differences, these two categories of corrections shared similar directions. Since the updated MGS orbit model and Mars rotational model were already precisely constrained, the remaining uncertainties in the MOLA geolocation came from timing, attitude, and pointing alignment errors. The accuracy of the MGS Spacecraft Clock Coefficients Kernels (SCLKs), which convert the spacecraft clock ticks to Terrestrial Dynamical Time (TDT) time, is only 10 ms (corresponding to almost 30 m of along-track shift on the Martian surface) in the orbital phase [39]. In addition, MOLA boresight alignment and/or MGS attitude timing bias have been reported in the global cross-over adjustment, which are seasonally controlled and can lead to lateral shifts of up to more than 100 m (Figure 9 in [24]). In summary, the global cross-over adjustment potentially accounted for more effects (seasonal as well as timing, attitude, and boresight alignment) than the reprocessing in this study, so further improvements to the MOLA geolocation are still necessary. This is discussed in Section 5.5.2.

5.5. Prospects for Further Improvement of MOLA Geolocation

5.5.1. Incorporation of a More Recent Mars Rotational Model

The Mars rotation model of Konopliv et al. [38] is based on additional data compared to that brought up by Kuchynka et al. [40], or the IAU2015 rotational model. Both models adopt the origin of the longitude system for Mars to be 47.95137 ° west to the Viking 1 lander, which is more precise than the previous measure of assigning a zero longitude to the center of the Airy-0 crater. Back then, Kuchynka et al. [40] provided a series expansion of the Mars orientation model in the conventional form, i.e., right ascension, declination, and prime meridian measured easterly along the body’s equator. Thus, its use was recommended by the International Astronomical Union (IAU). Now that a series expansion of the model of Konopliv et al. [38] in the conventional form has become available [41], the IAU will consider updating its recommendation. The difference between the IAU2015 rotational model and that of Konopliv et al. [38] compared over January 2000 to January 2030 is just over 13 m [32]. The right ascension, declination, and prime meridian of the model of Konopliv et al. [38] are known to about 13 milliarcseconds (mas), 8 mas, and 71 mas at the J2000 epoch, respectively [41]. Approximately, 1 mas corresponds to about 16 mm on the surface of Mars at the equator. Figure 13 illustrates the lateral and radial differences between these two rotational models as a function of latitude for the selected nadir profiles in the period of 1999 to 2001. The shifts in the lateral direction generally increase towards the equator with peak magnitudes of less than 6 m. This is consistent with the statement that the difference between the rotational models of Kuchynka et al. [40] and Konopliv et al. [38] compared over 1 January 2000 to 1 January 2030 is just over 13 m [32].

5.5.2. Post-Correction of Reprocessed MOLA Profiles

As stated in Section 5.4, significant uncertainties in the MOLA geolocation from timing, attitude, and boresight alignment errors remain after the incorporation of the updated MGS orbit model and Mars rotational model. Meanwhile, a global systematic temporal bias exists at all latitudes, which features a peak-to-peak amplitude of 2 m and a periodicity that matches the synodic cycle of Mars [6,12]. The cause for this bias remains to be explored, which could possibly be due to unmodeled spacecraft orbit and attitude errors. Unfortunately, the incorporation of the orbit of Konopliv et al. [31] does not compensate for this global temporal bias [12]. The combination of this global temporal bias and the temporal height variations at the polar regions due to the waning and waxing of the seasonal polar caps can cause the profiles to deviate from the mean static surface by several meters.
These shifts of the laser profiles can be compensated by various means to improve their internal consistency. The most commonly used are global cross-over adjustment, co-registration to existing DTMs, and self-registration of the laser profiles, which are introduced and summarized as follows. The global cross-over analysis is to parameterize the uncertainties by slowly varying functions to adjust the tracks in 3D for post-correction purposes [24]. However, locating the cross-overs in each of the least-squares iterations can amount to significant computational load. Furthermore, significant interpolation errors and shallow intersection angles of the ground tracks in the equatorial and tropical regions can contaminate the height misfits at cross-overs, which are to be minimized in the cross-over analysis. A refinement approach that overcomes the aforementioned issues is to co-register the laser profiles to high-resolution DTMs from satellite stereo images [25,26]. However, the availability of the high-resolution Context Camera (CTX; [42]), Color and Stereo Surface Imaging System (CaSSIS; [43]), and High Resolution Imaging Science Experiment (HiRISE; [44]) DTMs is spatially limited at the current stage. As an alternative approach, self-registration of the MOLA profiles themselves can be applied to make a self-consistent reference DTM, which has already been proven feasible in various applications [12,27]. This process is iteratively performed by co-registering random subsets of laser profiles to an intermediate DTM produced by the rest of the profiles. To account for the slowly changing shifts of the profiles and minimize the interference of the spatially and temporally inhomogeneous height variations of the seasonal caps at the Martian poles, a divide-and-conquer strategy can be followed. Specifically, self-registration can be performed separately in small overlapping latitudinal annuli to acquire the post-corrected MOLA profiles. The temporal linear tilts observed mainly in the intermittently-acquired off-nadir profiles can be compensated by introducing an additional parameter, the height trend, to the co-registration process [12]. However, at low latitudes where profiles are sparse and cross-track gaps are large, self-registration may not work well, and the co-registration to aforementioned stereophotometric DTMs or regional cross-over adjustment can be adopted instead. It should also be noted that the profiles after the self-registration will still represent an average surface over multiple seasons at the polar regions. A separate effort is needed to precisely measure these seasonal height variations, e.g., apply the approach of Xiao et al. [12] to the SHARAD radar altimetry profiles [45], and decouple them from the MOLA heights. For all of these mentioned approaches, it is worthwhile to reprocess the MOLA profiles beforehand to avoid the risk of improving precision without better absolute accuracy.

5.5.3. Waveform Simulation to Account for Pulse Saturation and Distortion

Due to the absence of a variable gain amplifier and limited digital ranges in width and amplitude, approximately 67% of MOLA’s returned pulses were saturated, especially in the presence of bright perennial and seasonal snow/ice deposits [13]. Power and telemetry bandwidth restrictions precluded digitization and recording of the return pulses, so no full waveform is available for analysis. MOLA addressed the issue of the range walk by measuring the echo pulse width at a preset threshold and the echo energy. Time-of-flight measurements were corrected to the centroid of the pulse using half of the measured pulse widths for unsaturated pulses. This correction is typically 1 to 3 m in amplitude and has an uncertainty of approximately 30 cm [7,46]. However, for the saturated pulses, the pulse width and returned energy measurements were unreliable. The leading-edge to centroid timing delay was then empirically estimated based on the along-track slope (without the consideration of footprint-scale roughness) and receiver characteristics and applied as an upper limit (refer to [24]), which can shorten measured ranges and bias the surface upwards. The inter-channel comparison of saturated and unsaturated ranges exhibits a median height bias of 0.64 m [24,46]. In addition, when the surface is rough with a short decorrelation length, e.g., at the Olympia Undae [13,47], the returned pulses could be non-Gaussian and non-symmetric due to shape distortion, e.g., with a long trailing edge or even with multiple peaks [48]. In this case, the range walk correction scheme using half of the measured or simulated pulse width can be biased. These temporal biases can be misinterpreted as seasonal height variations at the Martian poles; thus, taking care of these biases can have important implications for these kinds of studies, e.g., [6,7].
The Geoscience Laser Altimeter System (GLAS) onboard the Ice, Cloud, and land Elevation Satellite (ICESat) also suffered from this problem over bright ice sheets, but scientists at NASA Goddard Space Flight Center (GSFC) have managed to come up with accurate saturation corrections [49]. However, this is performed by carrying out lab experiments and comparing to the ground truth at flat and static surfaces, none of which could be possible in the case of MOLA. A solution to resolve these aforementioned issues is to simulate the full waveform of the saturated pulses, e.g., [50,51,52], by taking footprint-scale topography measured from high-resolution DTMs such as HiRISE, CaSSIS, and CTX DTMs. Available High Resolution Stereo Camera (HRSC) DTMs feature a grid resolution of 50 m and significantly lower effective resolution (up to hundreds of meters [53]). The nominal effective footprint size of MOLA was stated as 150 m, which corresponds to a divergence angle of 93 µrad. However, two post-launch studies suggested lower divergence angles due to a hot spot in the laser beam, resulting in footprint sizes of 75 m and 50 m, respectively [13,54]. For HiRISE and CTX images, despite their high temporal and spatial resolution, stereo pairs cluster in specific locations that are of interest to scientists (e.g., landing sites, regions that exhibit intriguing seasonal changes), and the generated DTMs are thus spatially limited. However, as the availability and spatial coverage of HiRISE, CaSSIS, and CTX stereo images and DTMs are continuously increasing, this problem will be alleviated through time [55].
As a preliminary treatment of the simulation implementation, we will need to precisely align the MOLA footprints and the high-resolution DTMs. This alignment can be achieved in two steps. First, rotate and translate the DTMs to the spatially overlapping MOLA footprint clouds to make sure the DTMs are accurate geo-references. Then, co-register individual MOLA profiles to the geo-referenced DTMs to compensate for lateral shifts in the former. Subsequently, the waveform can be modeled by the convolution of the footprint-scale topography with the Gaussian-shaped spatial distribution of the emitted pulse energy. Once we have the simulated waveform, the pulse width at the preset thresholds for different MOLA channels can be obtained and used for the range walk correction.

6. Conclusions

In this study, we tried to recompute the MOLA PEDR footprint locations. Based on that, we investigated the impact of the updated MGS orbit model and Mars rotational model on MOLA’s geolocation. Dramatic increases near the poles of up to 30 m for the nadir profiles and up to more than 100 m for the off-nadir profiles were observed in the recomputation residuals. However, despite ruling out several possible causes, the reason behind this unexpected feature remains to be explained. Limitations exist in the MOLA PEDR-stored attitude data, which can shift the footprint location up to hundreds of meters. The usage of the NAIF CKs is recommended, which can additionally avoid the approximation errors due to the discrete samplings of the attitude information used in the geolocation by the PEDR dataset. These approximation-induced errors can lead to footprint shifts of less than a few meters laterally and several centimeters when the attitude of the spacecraft is stable. However, these figures can rise up to 60 m laterally and 1 m radially amid controlled maneuvers. The incorporation of the improved spacecraft orbit and Mars rotational model in the reprocessing can significantly shift the MOLA profiles, i.e., up to 200 m laterally and 0.5 m radially. These shifts are much larger in magnitude than the aforementioned dramatic increases near the poles (up to 30 m). The RMS height discrepancy at cross-overs slightly decreased from 8.2 m to 7.0 m after the reprocessing. However, the locations of the reprocessed profiles were largely inconsistent with the PEDR profiles after the global cross-over analysis [24]. Possible causes could be residual timing, attitude, and boresight alignment errors, which remain unaccounted for.
Self-registration of the laser profiles can further refine the reprocessed MOLA profiles to a better or comparable level to the PEDR dataset after the global cross-over analysis [12]. As the next step, we will model the range walk corrections for the saturated and non-Gaussian laser return pulses and apply the self-registration at small latitudinal annuli to come up with an updated geodetic reference for at least the mid-to-high latitudes of Mars. DTMs will be gridded from these reference MOLA profiles and made available to the scientific community. Concepts of future laser altimeter missions to Mars have already been brought up, e.g., [19,56,57], but that may take years or longer before the actual acquisition of measurements on Mars is possible. Thus, it is still imperative that we make the most out of the legacy MOLA dataset in the meantime.

Author Contributions

A.S. and J.O. conceptualized the research; H.X., H.C. and A.S. contributed to the methodology; A.S. and J.O. supervised the study; H.X. and A.S. developed the software; H.X. and H.C. performed the validation and performance analysis; H.X. prepared the initial draft; A.S., H.C. and J.O. contributed to the review and data analysis; H.X., H.C. and J.O. acquired funding. All authors have read and agreed to the published version of the manuscript.

Funding

H.X. and H.C. thank the China Scholarship Council (CSC) for financial support of their Ph.D. studies in Germany (Nos. 201706260266 and 202006260004). H.X. was also supported by a scholarship from the Deutsche Forschungsgemeinschaft (DFG) Grant SFB-TRR 170: Late Accretion onto Terrestrial Planets.

Institutional Review Board Statement

Not applicable.

Informed Consent Statement

Not applicable.

Data Availability Statement

The MOLA PEDR dataset (Version L) is available from the Planetary Data System (PDS) Geosciences Node at https://pds-geosciences.wustl.edu/missions/mgs/pedr.html (Accessed on 7 September 2018). The MGS trajectory and attitude kernels can be obtained from NASA NAIF at https://naif.jpl.nasa.gov/pub/naif/pds/data/mgs-m-spice-6-v1.0/mgsp_1000/data/ (Accessed on 7 September 2018). Planetary ephemerides SPK file DE414 is available at https://naif.jpl.nasa.gov/pub/naif/generic_kernels/spk/planets/a_old_versions/ (Accessed on 19 January 2022).

Acknowledgments

We acknowledge the MOLA team for valuable insights, which drove this research forward. We thank three anonymous Reviewers for insightful comments on Xiao et al. [12], which also contributed to the current work.

Conflicts of Interest

The authors declare no conflict of interest.

References

  1. Perry, M.E.; Neumann, G.A.; Phillips, R.J.; Barnouin, O.S.; Ernst, C.M.; Kahan, D.S.; Solomon, S.C.; Zuber, M.T.; Smith, D.E.; Hauck, S.A.; et al. The low-degree shape of Mercury. Geophys. Res. Lett. 2015, 42, 6951–6958. [Google Scholar] [CrossRef] [Green Version]
  2. Smith, D.E.; Zuber, M.T.; Neumann, G.A.; Mazarico, E.; Lemoine, F.G.; Head, J.W., III; Lucey, P.G.; Aharonson, O.; Robinson, M.S.; Sun, X.; et al. Summary of the results from the Lunar Orbiter Laser Altimeter after seven years in lunar orbit. Icarus 2017, 283, 70–91. [Google Scholar] [CrossRef] [Green Version]
  3. Mazarico, E.; Barker, M.K.; Neumann, G.A.; Zuber, M.T.; Smith, D.E. Detection of the lunar body tide by the Lunar Orbiter Laser Altimeter. Geophys. Res. Lett. 2014, 41, 2282–2288. [Google Scholar] [CrossRef] [PubMed] [Green Version]
  4. Steinbrügge, G.; Stark, A.; Hussmann, H.; Sohl, F.; Oberst, J. Measuring tidal deformations by laser altimetry. A performance model for the Ganymede Laser Altimeter. Planet. Space Sci. 2015, 117, 184–191. [Google Scholar] [CrossRef]
  5. Steinbrügge, G.; Stark, A.; Hussmann, H.; Wickhusen, K.; Oberst, J. The performance of the BepiColombo Laser Altimeter (BELA) prior launch and prospects for Mercury orbit operations. Planet. Space Sci. 2018, 159, 84–92. [Google Scholar] [CrossRef]
  6. Smith, D.E.; Zuber, M.T.; Neumann, G.A. Seasonal variations of snow depth on Mars. Science 2001, 294, 2141–2146. [Google Scholar] [CrossRef] [Green Version]
  7. Aharonson, O.; Zuber, M.T.; Smith, D.E.; Neumann, G.A.; Feldman, W.C.; Prettyman, T.H. Depth, distribution, and density of CO2 deposition on Mars. J. Geophys. Res. Planets 2004, 109, E05004. [Google Scholar] [CrossRef] [Green Version]
  8. Rowlands, D.D.; Pavlis, D.E.; Lemoine, F.G.; Neumann, G.A.; Luthcke, S.B. The use of laser altimetry in the orbit and attitude determination of Mars Global Surveyor. Geophys. Res. Lett. 1999, 26, 1191–1194. [Google Scholar] [CrossRef] [Green Version]
  9. Mazarico, E.; Neumann, G.; Rowlands, D.; Smith, D. Geodetic constraints from multi-beam laser altimeter crossovers. J. Geod. 2010, 84, 343–354. [Google Scholar] [CrossRef]
  10. Stark, A.; Oberst, J.; Preusker, F.; Peale, S.J.; Margot, J.L.; Phillips, R.J.; Neumann, G.A.; Smith, D.E.; Zuber, M.T.; Solomon, S.C. First MESSENGER orbital observations of Mercury’s librations. Geophys. Res. Lett. 2015, 42, 7881–7889. [Google Scholar] [CrossRef] [Green Version]
  11. Barker, M.K.; Mazarico, E.; Neumann, G.A.; Zuber, M.T.; Haruyama, J.; Smith, D.E. A new lunar digital elevation model from the Lunar Orbiter Laser Altimeter and SELENE Terrain Camera. Icarus 2016, 273, 346–355. [Google Scholar] [CrossRef] [Green Version]
  12. Xiao, H.; Stark, A.; Steinbrügge, G.; Thor, R.; Schmidt, F.; Oberst, J. Prospects for mapping temporal height variations of the seasonal CO2 snow/ice caps at the Martian poles by co-registration of MOLA Profiles. Planet. Space Sci. 2022, 214, 105446. [Google Scholar] [CrossRef]
  13. Neumann, G.A.; Abshire, J.B.; Aharonson, O.; Garvin, J.B.; Sun, X.; Zuber, M.T. Mars Orbiter Laser Altimeter pulse width measurements and footprint-scale roughness. Geophys. Res. Lett. 2003, 30, 1561. [Google Scholar] [CrossRef]
  14. Neumann, G.A.; Smith, D.E.; Zuber, M.T. Two Mars years of clouds detected by the Mars Orbiter Laser Altimeter. J. Geophys. Res. Planets 108, 5023. [CrossRef] [Green Version]
  15. Daly, M.G.; Barnouin, O.S.; Dickinson, C.; Seabrook, J.; Johnson, C.L.; Cunningham, G.; Haltigin, T.; Gaudreau, D.; Brunet, C.; Aslam, I.; et al. The OSIRIS-REx Laser Altimeter (OLA) investigation and instrument. Space Sci. Rev. 2017, 212, 899–924. [Google Scholar] [CrossRef]
  16. Hussmann, H. Laser Altimetry and Its Applications in Planetary Science. In Planetary Geodesy and Remote Sensing; CRC Press: Boca Raton, FL, USA, 2014; Chapter 3; pp. 51–75. [Google Scholar]
  17. Hussmann, H.; Lingenauber, K.; Kallenbach, R.; Enya, K.; Thomas, N.; Lara, L.M.; Althaus, C.; Araki, H.; Behnke, T.; Castro, J.M.; et al. The Ganymede laser altimeter (GALA): Key objectives, instrument design, and performance. CEAS Space J. 2019, 11, 381–390. [Google Scholar] [CrossRef]
  18. Thomas, N.; Hussmann, H.; Spohn, T.; Lara, L.M.; Christensen, U.; Affolter, M.; Bandy, T.; Beck, T.; Chakraborty, S.; Geissbuehler, U.; et al. The BepiColombo Laser Altimeter. Space Sci. Rev. 2021, 217, 25. [Google Scholar] [CrossRef]
  19. Oberst, J.; Wickhusen, K.; Gwinner, K.; Hauber, E.; Stark, A.; Elgner, S.; Grott, M.; Fanara, L.; Hussmann, H.; Steinbrügge, G.; et al. Planetary polar explorer—The case for a next-generation remote sensing mission to low Mars orbit. Exp. Astron. 2022, 1–17. [Google Scholar] [CrossRef]
  20. Zhou, H.; Chen, Y.; Hyyppä, J.; Li, S. An overview of the laser ranging method of space laser altimeter. Infrared Phys. Technol. 2017, 86, 147–158. [Google Scholar] [CrossRef]
  21. Xiao, H.; Stark, A.; Steinbrügge, G.; Hussmann, H.; Oberst, J. Processing of laser altimeter Time-of-Flight measurements to geodetic coordinates. J. Geod. 2021, 95, 1–23. [Google Scholar] [CrossRef]
  22. Luthcke, S.B.; Rebold, T.; Thomas, T.; Pennington, T. GEDI Waveform Geolocation for L1 and L2 Products (version 1.0). In Algorithm Theoretical Basis Documents (ATBD); Goddard Space Flight Center: Greenbelt, MD, USA, 2019; pp. 1–62. Available online: https://lpdaac.usgs.gov/documents/579/GEDI__WFGEO_ATBD_v1.0.pdf (accessed on 30 March 2022).
  23. Luthcke, S.; Thomas, T.; Pennington, T.; Rebold, T.; Nicholas, J.; Rowlands, D.; Gardner, A.; Bae, S. ICESat-2 pointing calibration and geolocation performance. Earth Space Sci. 2021, 8, e2020EA001494. [Google Scholar] [CrossRef]
  24. Neumann, G.A.; Rowlands, D.D.; Lemoine, F.G.; Smith, D.E.; Zuber, M.T. Crossover analysis of Mars Orbiter Laser Altimeter data. J. Geophys. Res. Planets 2001, 106, 23753–23768. [Google Scholar] [CrossRef] [Green Version]
  25. Gläser, P.; Haase, I.; Oberst, J.; Neumann, G.A. Co-registration of laser altimeter tracks with digital terrain models and applications in planetary science. Planet. Space Sci. 2013, 89, 111–117. [Google Scholar] [CrossRef] [Green Version]
  26. Stark, A.; Oberst, J.; Preusker, F.; Gwinner, K.; Peale, S.J.; Margot, J.L.; Phillips, R.J.; Zuber, M.T.; Solomon, S.C. Mercury’s rotational parameters from MESSENGER image and laser altimeter data: A feasibility study. Planet. Space Sci. 2015, 117, 64–72. [Google Scholar] [CrossRef] [Green Version]
  27. Stark, A.; Annibali, S.; Oberst, J.; Hussmann, H. Measurement of lunar rotation with Lunar Orbiter Laser Altimeter data. In Proceedings of the European Planetary Science Congress, Berlin, Germany, 16–21 September 2018. Abstract EPSC2018-931. [Google Scholar]
  28. Barker, M.K.; Mazarico, E.; Neumann, G.A.; Smith, D.E.; Zuber, M.T.; Head, J.W. Improved LOLA elevation maps for South Pole landing sites: Error estimates and their impact on illumination conditions. Planet. Space Sci. 2020, 105–119. [Google Scholar] [CrossRef]
  29. Parro, L.M.; Jimenezdiaz, A.; Mansilla, F.; Ruiz, J. Present-day heat flow model of Mars. Sci. Rep. 2017, 7, 45629. [Google Scholar] [CrossRef] [Green Version]
  30. Pardo-Igúzquiza, E.; Dowd, P. Fractal analysis of the Martian landscape: A study of kilometre-scale topographic roughness. Icarus 2022, 372, 114727. [Google Scholar] [CrossRef]
  31. Konopliv, A.S.; Yoder, C.F.; Standish, E.M.; Yuan, D.N.; Sjogren, W.L. A global solution for the Mars static and seasonal gravity, Mars orientation, Phobos and Deimos masses, and Mars ephemeris. Icarus 2006, 182, 23–50. [Google Scholar] [CrossRef]
  32. Archinal, B.A.; Acton, C.H.; A’Hearn, M.F.; Conrad, A.; Consolmagno, G.J.; Duxbury, T.; Hestroffer, D.; Hilton, J.L.; Kirk, R.L.; Klioner, S.A.; et al. Report of the IAU working group on cartographic coordinates and rotational elements: 2015. Celest. Mech. Dyn. Astron. 2018, 130, 22. [Google Scholar] [CrossRef]
  33. Smith, D.E.; Zuber, M.T.; Neumann, G.A. Mars Orbiter Laser Altimeter (MOLA) Precision Experiment Data Records (PEDR) Dataset Document. Available online: http://pds-geosciences.wustl.edu/mgs/mgs-m-mola-3-pedr-l1a-v1/mgsl_21xx/catalog/pedrds.cat (accessed on 7 September 2018).
  34. Acton, C.H.J. Ancillary data services of NASA’s Navigation and Ancillary Information Facility. Planet. Space Sci. 1996, 44, 65–70. [Google Scholar] [CrossRef]
  35. Seidelmann, P.K.; Abalakin, V.K.; Bursa, M.; Davies, M.E.; De Bergh, C.; Lieske, J.H.; Oberst, J.; Simon, J.L.; Standish, E.M.; Stooke, P.; et al. Report of the IAU/IAG working group on cartographic coordinates and rotational elements of the planets and satellites: 2000. Celest. Mech. Dyn. Astron. 2002, 82, 83–111. [Google Scholar] [CrossRef]
  36. Karney, C.F. Algorithms for geodesics. J. Geod. 2013, 87, 43–55. [Google Scholar] [CrossRef] [Green Version]
  37. Smith, D.E.; Neumann, G.A.; Arvidson, R.E.; Guinness, E.A.; Slavney, S. Mars Global Surveyor Laser Altimeter Mission Experiment Gridded Data Record (MEGDR). NASA Planetary Data System. Technical Report, MGS-M-MOLA-5-MEGDR-L3-V1.0. 2003. Available online: https://pds.nasa.gov/ds-view/pds/viewProfile.jsp?dsid=MGS-M-MOLA-5-MEGDR-L3-V1.0 (accessed on 30 March 2022).
  38. Konopliv, A.S.; Park, R.S.; Folkner, W.M. An improved JPL Mars gravity field and orientation from Mars orbiter and lander tracking data. Icarus 2016, 274, 253–260. [Google Scholar] [CrossRef]
  39. Neumann, G.A.; Cavanaugh, J.F.; Coyle, D.B.; McGarry, J.; Smith, D.E.; Sun, X.; Torrence, M.; Zagwodski, T.W.; Zuber, M.T. Laser ranging at interplanetary distances. In Proceedings of the 15th International Workshop on Laser Ranging, Canberra, Australia, 15–20 October 2006. [Google Scholar]
  40. Kuchynka, P.; Folkner, W.M.; Konopliv, A.S.; Parker, T.J.; Park, R.S.; Le Maistre, S.; Dehant, V. New constraints on Mars rotation determined from radiometric tracking of the Opportunity Mars Exploration Rover. Icarus 2014, 229, 340–347. [Google Scholar] [CrossRef]
  41. Jacobson, R.A.; Konopliv, A.S.; Park, R.S.; Folkner, W.M. The rotational elements of Mars and its satellites. Planet. Space Sci. 2018, 152, 107–115. [Google Scholar] [CrossRef]
  42. Malin, M.C.; Bell, J.F.; Cantor, B.A.; Caplinger, M.A.; Calvin, W.M.; Clancy, R.T.; Edgett, K.S.; Edwards, L.; Haberle, R.M.; James, P.B.; et al. Context camera investigation on board the Mars Reconnaissance Orbiter. J. Geophys. Res. Planets 2007, 112. [Google Scholar] [CrossRef] [Green Version]
  43. Thomas, N.; Cremonese, G.; Ziethe, R.; Gerber, M.; Brändli, M.; Bruno, G.; Erismann, M.; Gambicorti, L.; Gerber, T.; Ghose, K.; et al. The Color and Stereo Surface Imaging System (CaSSIS) for the ExoMars Trace Gas Orbiter. Space Sci. Rev. 2017, 212, 1897–1944. [Google Scholar] [CrossRef] [Green Version]
  44. McEwen, A.S.; Eliason, E.M.; Bergstrom, J.W.; Bridges, N.T.; Hansen, C.J.; Delamere, W.A.; Grant, J.A.; Gulick, V.C.; Herkenhoff, K.E.; Keszthelyi, L.; et al. Mars reconnaissance orbiter’s high resolution imaging science experiment (HiRISE). J. Geophys. Res. Planets 2007, 112, E05S02. [Google Scholar] [CrossRef] [Green Version]
  45. Steinbrügge, G.; Haynes, M.S.; Schroeder, D.M.; Scanlan, K.M.; Stark, A.; Young, D.A.; Grima, C.; Kempf, S.; Ng, G.; Buhl, D.; et al. Altimetry measurements from planetary radar sounders and application to SHARAD on Mars. IEEE Trans. Geosci. Remote Sens. 2022, 60, 1–14. [Google Scholar] [CrossRef]
  46. Abshire, J.B.; Sun, X.; Afzal, R.S. Mars Orbiter Laser Altimeter: Receiver model and performance analysis. Appl. Opt. 2000, 39, 2449–2460. [Google Scholar] [CrossRef] [Green Version]
  47. Aharonson, O.; Zuber, M.T.; Rothman, D.H. Statistics of Mars’ topography from the Mars Orbiter Laser Altimeter: Slopes, correlations, and physical models. J. Geophys. Res. Planets 2001, 106, 23723–23735. [Google Scholar] [CrossRef]
  48. Harding, D.J.; Carabajal, C.C. ICESat waveform measurements of within-footprint topographic relief and vegetation vertical structure. Geophys. Res. Lett. 2005, 32, L21S10. [Google Scholar] [CrossRef] [Green Version]
  49. Sun, X.; Abshire, J.B.; Borsa, A.A.; Fricker, H.A.; Yi, D.; DiMarzio, J.P.; Paolo, F.S.; Brunt, K.M.; Harding, D.J.; Neumann, G.A. ICESAT/GLAS altimetry measurements: Received signal dynamic range and saturation correction. IEEE Trans. Geosci. Remote. Sens. 2017, 55, 5440–5454. [Google Scholar] [CrossRef] [PubMed]
  50. Budge, S.; Leishman, B.; Pack, R. Simulation and modeling of return waveforms from a ladar beam footprint in USU LadarSIM. In Proceedings of the Laser Radar Technology and Applications XI, International Society for Optics and Photonics, Orlando, FL, USA, 19 May 2006; Volume 6214, p. 62140. [Google Scholar] [CrossRef] [Green Version]
  51. Jacob, D.; Gatt, P.; Nichols, T. Overview of LMCT’s advanced ladar signal simulator (ALASS). In Proceedings of the Laser Radar Technology and Applications XIII, International Society for Optics and Photonics, Orlando, FL, USA, 17 April 2008; Volume 6950, p. 69500. [Google Scholar] [CrossRef]
  52. Steinvall, O.K.; Carlsson, T. Three-dimensional laser radar modeling. In Proceedings of the Laser Radar Technology and Applications VI, International Society for Optics and Photonics, Orlando, FL, USA, 19 September 2001; Volume 4377, pp. 23–34. [Google Scholar] [CrossRef]
  53. Kirk, R.L.; Mayer, D.P.; Fergason, R.L.; Redding, B.L.; Galuszka, D.M.; Hare, T.M.; Gwinner, K. Evaluating stereo Digital Terrain Model quality at Mars rover landing sites with HRSC, CTX, and HiRISE images. Remote Sens. 2021, 13, 3511. [Google Scholar] [CrossRef]
  54. Kim, J.R.; Muller, J.P. Very high resolution stereo DTM extraction and its application to surface roughness estimation over Martian surface. Int. Arch. Photogramm. Remote Sens. Spat. Inf. Sci. 2008, 37, 993–998. [Google Scholar]
  55. Tao, Y.; Muller, J.P.; Sidiropoulos, P.; Xiong, S.T.; Putri, A.; Walter, S.; Veitch-Michaelis, J.; Yershov, V. Massive stereo-based DTM production for Mars on cloud computers. Planet. Space Sci. 2018, 154, 30–58. [Google Scholar] [CrossRef]
  56. Brown, A.J.; Michaels, T.I.; Byrne, S.; Sun, W.; Titus, T.N.; Colaprete, A.; Wolff, M.J.; Videen, G.; Grund, C.J. The case for a modern multiwavelength, polarization-sensitive LIDAR in orbit around Mars. J. Quant. Spectrosc. Radiat. Transf. 2015, 153, 131–143. [Google Scholar] [CrossRef] [Green Version]
  57. Genova, A. ORACLE: A mission concept to study Mars’ climate, surface and interior. Acta Astronaut. 2020, 166, 317–329. [Google Scholar] [CrossRef]
Figure 1. Location of the selected nadir profiles (1000, 3000, 5000, 7000, and 8000) and off-nadir profiles (1739, 4440, 5340, and 6622) for the recomputation and reprocessing experiments. Color scale indicates the footprint height with respect to the IAU2015 Mars ellipsoid with an equatorial radius of 3396.19 km and mean polar radius of 3376.20 km [32]. The background is the Martian topography represented by the 463 m per pixel global grayscale hillshade of the MOLA Mission Experiment Gridded Data Record (MEGDR) [37]. Projection is Van der Grinten, which emphasizes the polar regions with a central meridian of 90 ° E.
Remotesensing 14 02201 g001
Figure 2. Off-nadir angles of the selected profiles as documented in the PEDR dataset (top). Lateral (center) and radial (bottom) residuals of SMM with Mars as the observer with respect to the PEDR. The lateral difference is treated as the geodetic distance along the IAU2015 Mars ellipsoid.
Remotesensing 14 02201 g002
Figure 3. Off-nadir angles of the selected off-nadir profiles (top). Lateral (center) and radial (bottom) residuals of SMM with Mars as the observer with respect to the PEDR for the selected off-nadir profiles.
Remotesensing 14 02201 g003
Figure 4. Lateral (top) and radial (bottom) differences of PAM with Mars as the observer with respect to SMM with Mars as the observer (impact of pointing aberration) for the selected off-nadir profiles.
Remotesensing 14 02201 g004
Figure 5. Lateral (top) and radial (bottom) differences of PAM with Mars as the observer using updated auxiliary information with respect to the PEDR footprint locations for the selected nadir profiles.
Remotesensing 14 02201 g005
Figure 6. Lateral (top) and radial (bottom) differences of PAM with Mars as the observer using updated auxiliary information with respect to cross-over-corrected PEDR for the selected nadir profiles. Shaded areas denote the inherited uncertainties in the PEDR cross-over-corrected locations [24].
Remotesensing 14 02201 g006
Figure 7. Histograms of the height discrepancies at cross-overs for the PEDR (blue), recomputed PEDR (lime), recomputed PEDR corrected for pointing aberration (magenta), and cross-over-corrected PEDR (dashed black) at 82 ° S to 85 ° S and 0 ° to 360 ° E in the Martian south pole.
Remotesensing 14 02201 g007
Figure 8. Lateral (top) and radial (bottom) differences between the footprint geolocations using the IAU1991 and IAU2000 Mars rotational models.
Remotesensing 14 02201 g008
Figure 9. Comparison of the footprint off-nadir angles between that retrieved using the NAIF CK kernels and that documented in the PEDR dataset for ground track 5000 (nadir; (top)) and 6622 (off-nadir; (bottom)). Shown for comparison are these two tracks’ lateral differences in the recomputation experiments, as in Section 4.1.
Remotesensing 14 02201 g009
Figure 10. Comparison of the MGS orientation angles between the attitude information documented in the NAIF CK kernels and the PEDR dataset. Insets in the right column exhibit zoom-in views of these differences. Examples of 20-shot patterns are indicated by arrows.
Remotesensing 14 02201 g010
Figure 11. Lateral (top) and radial (bottom) differences of SMM with Mars as the observer and using the PEDR-documented MGS attitude information, with respect to the locations documented in the PEDR dataset for the selected nadir profiles.
Remotesensing 14 02201 g011
Figure 12. Lateral vectors of the reprocessing updates from the updated orbit and Mars rotational model (black) and corrections from the global cross-over analysis (blue) for 15 randomly selected profiles in the south pole. Note that the length of the arrows within the legend corresponds to 200 m in displacement. The projection is stereographic centered at the south pole.
Remotesensing 14 02201 g012
Figure 13. Lateral (top) and radial (bottom) differences between the footprint locations using the Mars rotational models of Kuchynka et al. [40] and Konopliv et al. [38].
Remotesensing 14 02201 g013
Publisher’s Note: MDPI stays neutral with regard to jurisdictional claims in published maps and institutional affiliations.

