Technical Note

Assessing the Performance of Multi-Resolution Satellite SAR Images for Post-Earthquake Damage Detection and Mapping Aimed at Emergency Response Management

1
NHAZCA S.r.l., Via V. Bachelet 12, 00185 Rome, Italy
2
Earth Sciences Department, Sapienza University of Rome, Piazzale Aldo Moro 5, 00185 Rome, Italy
3
Agenzia Spaziale Italiana (ASI), Via del Politecnico, 00133 Rome, Italy
4
Corpo Nazionale dei Vigili del Fuoco, Ministero dell’Interno, Piazza del Viminale, 1, 00184 Rome, Italy
*
Author to whom correspondence should be addressed.
Remote Sens. 2022, 14(9), 2210; https://doi.org/10.3390/rs14092210
Submission received: 15 March 2022 / Revised: 26 April 2022 / Accepted: 3 May 2022 / Published: 5 May 2022
(This article belongs to the Special Issue Remote Sensing for Near-Real-Time Disaster Monitoring)

Abstract

:
The increasing availability of satellite Synthetic Aperture Radar (SAR) images is opening new opportunities for operational support to predictive maintenance and emergency actions. With the purpose of investigating the performances of SAR images characterized by different geometric resolutions for post-earthquake damage detection and mapping, we analyzed three SAR image datasets (Sentinel-1, COSMO-SkyMed Spotlight, and COSMO-SkyMed StripMap) available in Norcia (Central Italy) that were severely affected by a strong seismic sequence in 2016. By applying the amplitude and the coherent change detection processing tools, we compared pairs of images with equivalent features collected before and after the main shock on 30 October 2016 (at 06:40, UTC). Results were compared against each other and then measured against the findings of post-earthquake field surveys for damage assessment, performed by the Italian National Fire and Rescue Service (Corpo Nazionale dei Vigili del Fuoco—CNVVF). Thanks to the interesting and very rare opportunity to have pre-event COSMO-SkyMed Spotlight images, we determined that 1 × 1-m nominal geometric resolutions can provide very detailed single-building damage mapping, while COSMO-SkyMed StripMap HIMAGE images at 3 × 3-m resolutions return relatively good detections of damaged buildings; and, the Sentinel-1 images did not allow acquiring information on single buildings—they simply provided approximate identifications of the most severely damaged sectors. The main outcomes of the performance investigation we carried out in this work can be exploited considering the exponentially growing satellite market in terms of revisit time and image resolution.

1. Introduction

In the last two decades, many studies have been carried out worldwide aiming to identify and to map land cover variations or post-event damaged areas through change detection approaches, using remotely sensed data acquired by different sensors and platforms (e.g., Satellite, UAV) applied to floods [1], volcanoes [2], earthquakes [3,4,5,6,7,8], wildfires [9], urban development [10,11] and landslides [12].
The first step in any emergency response is to assess the extent and the impact of the damage caused by the disaster. First responders need to recognize and to collect useful information to mount their rescue operation effectively and quickly. There is indeed a strong link between timely rescue operations and the percentage of survived victims from natural disasters. Therefore, it is extremely important to ensure effective deployment of rescue teams as soon as possible by means of the optimization of resources, accurate information on how to access and to settle in the affected areas, and the definition of operational priorities. To further optimize the activity on the field, the potential of SAR satellite analysis was approached, thinking backwards about the seismic event of 30 October in Norcia (occurred at 06:40, UTC), where a damage map derived by CNVVF field surveys and satellite products for comparative analysis were available.
Among the different kinds of Earth Observation systems, satellite SAR data are considered one of the most powerful systems for natural hazard detection and assessment due to their advantage of being independent from atmospheric and sunlight conditions and the capability of satellites to regularly acquire data over the same area [13]. Today, several satellite SAR missions are available, characterized by different technical features in terms of wavelengths, and temporal and geometric resolutions [14]. COSMO-SkyMed (Italian Space Agency) is one of the most powerful datasets available thanks to its 5-satellite constellation equipped with X-band SAR sensors [15] that can provide images with geometric resolutions up to 0.35 m (Spotlight mode), with a potential sampling frequency of a few hours. On the other hand, SAR missions such as C-band Sentinel 1 (made up of two satellites since 2015) are collecting images worldwide with a 6-day sampling frequency and a 5 × 20-m geometric resolution.
In the last few years, a growing number of missions that are expected to provide high-resolution (1 m or less) images with high sampling frequencies (days/hours) are under development or in planning (i.e., [16,17]) and, in the light of this scenario, it is important to understand the performance of satellite SAR images characterized by different geometric resolutions to better support emergency phases after natural disasters. With this aim, we focused on the 2016 central Italy seismic sequence that caused severe damage in several municipalities in the region [18,19]. This sequence of moderate to large earthquakes produced three main shocks: 24 August 2016 (Mw 6.0), 26 October 2016 (Mw 5.9), and 30 October 2016 (Mw 6.5). The epicenter of the latter was located close to the small towns of Norcia and Castelluccio. In these two towns that were severely affected by the 30 October 2016 earthquake, we had the opportunity to exploit the availability of three pre-event and post-event datasets of SAR images with different geometric features: Sentinel-1 Interferometric Wide Swath (20 m × 5 m meter nominal geometric resolution); COSMO-SkyMed StripMap (background mission in Italy with 3-m nominal geometric resolution), and COSMO-SkyMed Spotlight (1-m nominal geometric resolution) acquisition modes. Spotlight is not planned to be the background acquisition mode of COSMO-SkyMed but it is, at present, among the radar satellite missions one of the best images resolutions, and in this area we have the very rare opportunity to have pre-event acquisitions and to test the performance of such a radar image, especially considering the future satellite mission planned. Different change detection approaches implemented in SARPROZ [20] and IRIS software by NHAZCA S.r.l. were applied to compare two or more pre- and post-event images with similar technical features to identify and to map amplitudes or phase changes due to the consequences of the 30 October main shock. Then, we benchmarked the results against the findings of field surveys carried out by experts of the CNVVF.

2. Materials and Methods

In this study, three datasets of satellite SAR data acquired from different constellations have been used and compared to conduct a “multiresolution and multifrequency” performance comparison, considering the pros and the cons of the satellite mission calibrated on a rapid response to emergencies. This approach is summarized in the flowchart reported in Figure 1; and, it is aimed at giving an effective contribution to the planners of future satellite missions and to assess the potential of satellite SAR data as an important tool to support the decision-making processes of first responders and to address rescue units in case of earthquakes or any other natural disaster.

2.1. Spaceborne SAR Data

High-resolution COSMO-SkyMed and medium-resolution Sentinel-1 data were used in this study (Table 1). COSMO-SkyMed is a four-satellite constellation carrying onboard X-band SAR sensors (9.60-GHz frequency and approximately 3.1-cm wavelength); it was launched in 2007 and designed for both civil and military purposes [15]. A COSMO-SkyMed second-generation constellation is planned to operate in addition to the original constellation to guarantee operational continuity and to improve the revisit time of the system, whose first satellite was launched in 2019 and began operation in 2021. The sensors scan with different modes, allowing investigations of areas with different resolutions and sizes. In this work, we used a rare stack of 3 Spotlight 1 × 1-m-resolution images (2 pre-earthquake and 1 post-earthquake) covering Norcia village and 8 ascending and descending StripMap 3 × 3-m-resolution images (4 pre- and 4 post-event) covering the Norcia and Castelluccio villages (Figure 1).
Sentinel-1 (European Space Agency) is a two-satellite constellation carrying onboard C-band SAR sensors (5.40-GHz frequency and approximately 5.55-cm wavelength), launched in 2014, and it is able to acquire SAR images with extremely variable resolutions and coverage swaths up to 400 km [21]. Specifically, the standard acquisition mode of Sentinel-1 is the Interferometric Wide Swath (IW), which is characterized by 250-km-wide images. One of the main advantages of Sentinel-1 is its short revisit time, at 6 days (or 12 days for specific regions of the planet) over the same area, considering both satellites, S1A and S1B. In this study, we used a stack of 4 ascending and 4 descending 20 m × 5 m (4 pre- and 4 post-event) IW images (Figure 2).

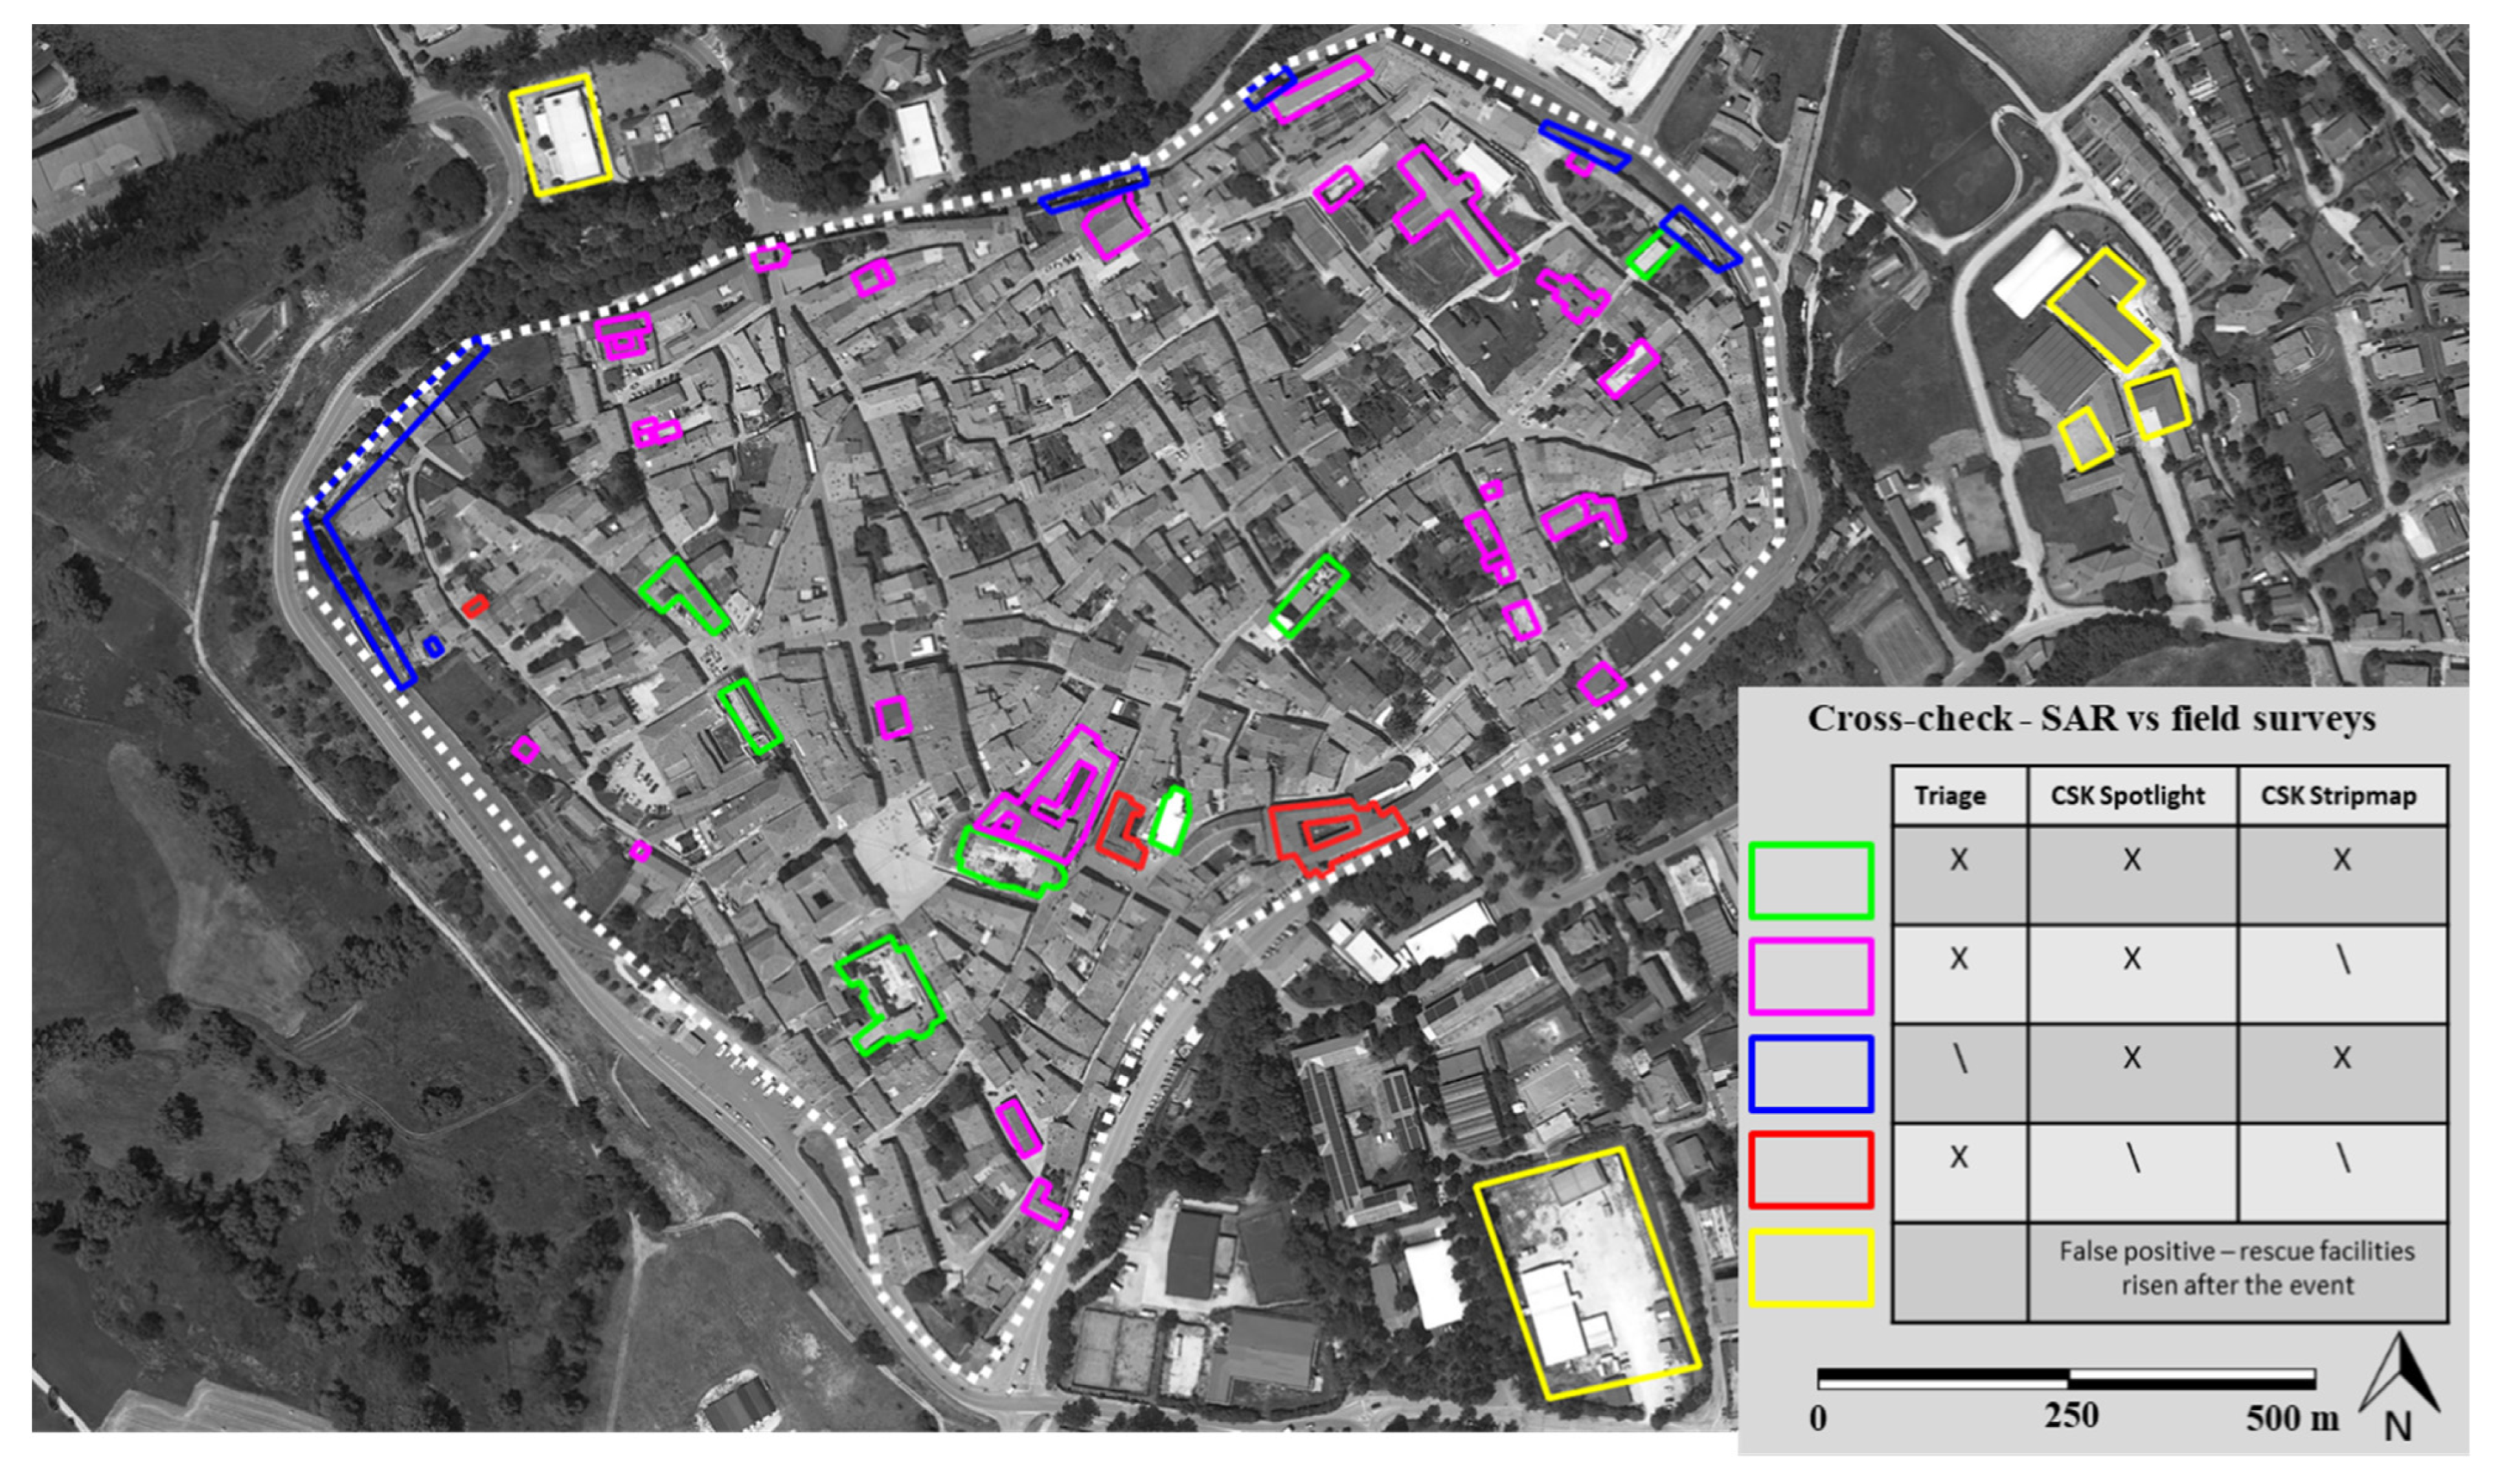
2.2. Field Survey Damage Mapping

The CNVVF approaches seismic emergencies with a systematic assessment method aimed at accurately dimensioning the operational response through subsequent approximations.
When a seismic event happens, the first step is an analysis of the first data available related to the seismic event, such as shake maps, a localized call for help to the operations rooms of the National Fire and Rescue Service with territorial competence, information about traffic, information from social media, etc. In this way, areas “with greater criticality” can be defined, and they can be useful for the first sizing of the operational emergency response system. On these areas, a second assessment step is carried out by helicopter overflights, outlining smaller areas with evidence of critical issues. A third in-depth study is carried out in such smaller areas, CNVVF expert technicians make a site inspection in the field in order to detect structural criticalities through an activity structural analysis called “QuickTriage”.
To cross-check the satellite damage map, we use the findings of the conducted QuickTriage in Norcia village by CNVVF (i.e., a building damage mapping based on field surveys). Specifically, QuickTriage results are derived from the rapid on-field detection of severe and imminent danger for the safety of people and buildings, and their aim is to estimate the countermeasures to be adopted in the days immediately after the event. This activity was performed using a building-to-building survey based on a dedicated form that was manually filled out by expert technicians. Starting from these results, only the buildings indicated to be affected by partial or total collapse were selected.
Furthermore, the CEDIT catalog [22], the most complete database of earthquake-induced ground effects in Italy, was also examined. Particular attention was given to the EQtLs (EarthQuake triggered Landslides) that impacted transportation routes during the 2016–2017 central Italy seismic sequence.

2.3. IRIS Software

The IRIS software developed by the company NHAZCA Ltd. (Rome, Italy) can be used to implement advanced image-processing algorithms to monitor ground and structural displacements and changes; IRIS was conceived to work with terrestrial, aerial, and satellite imagery of any data type (radar, optical, thermal, or near-infrared). This software allows users to reach subpixel accuracy in displacement monitoring with several digital image correlation (based on the most common DIC algorithms, such as [23,24] and change detection algorithms (based on the SSI Index [25]), allowing a multitemporal approach with the generation of displacement time series. From image preparation, pre-processing, and manual/automatic processing to post-processing, IRIS implements several analysis modules. IRIS can be used individually or combined with other monitoring systems without the installation of contact sensors/reflectors, and it allows real-time analyses, with results ready within minutes after image acquisition.

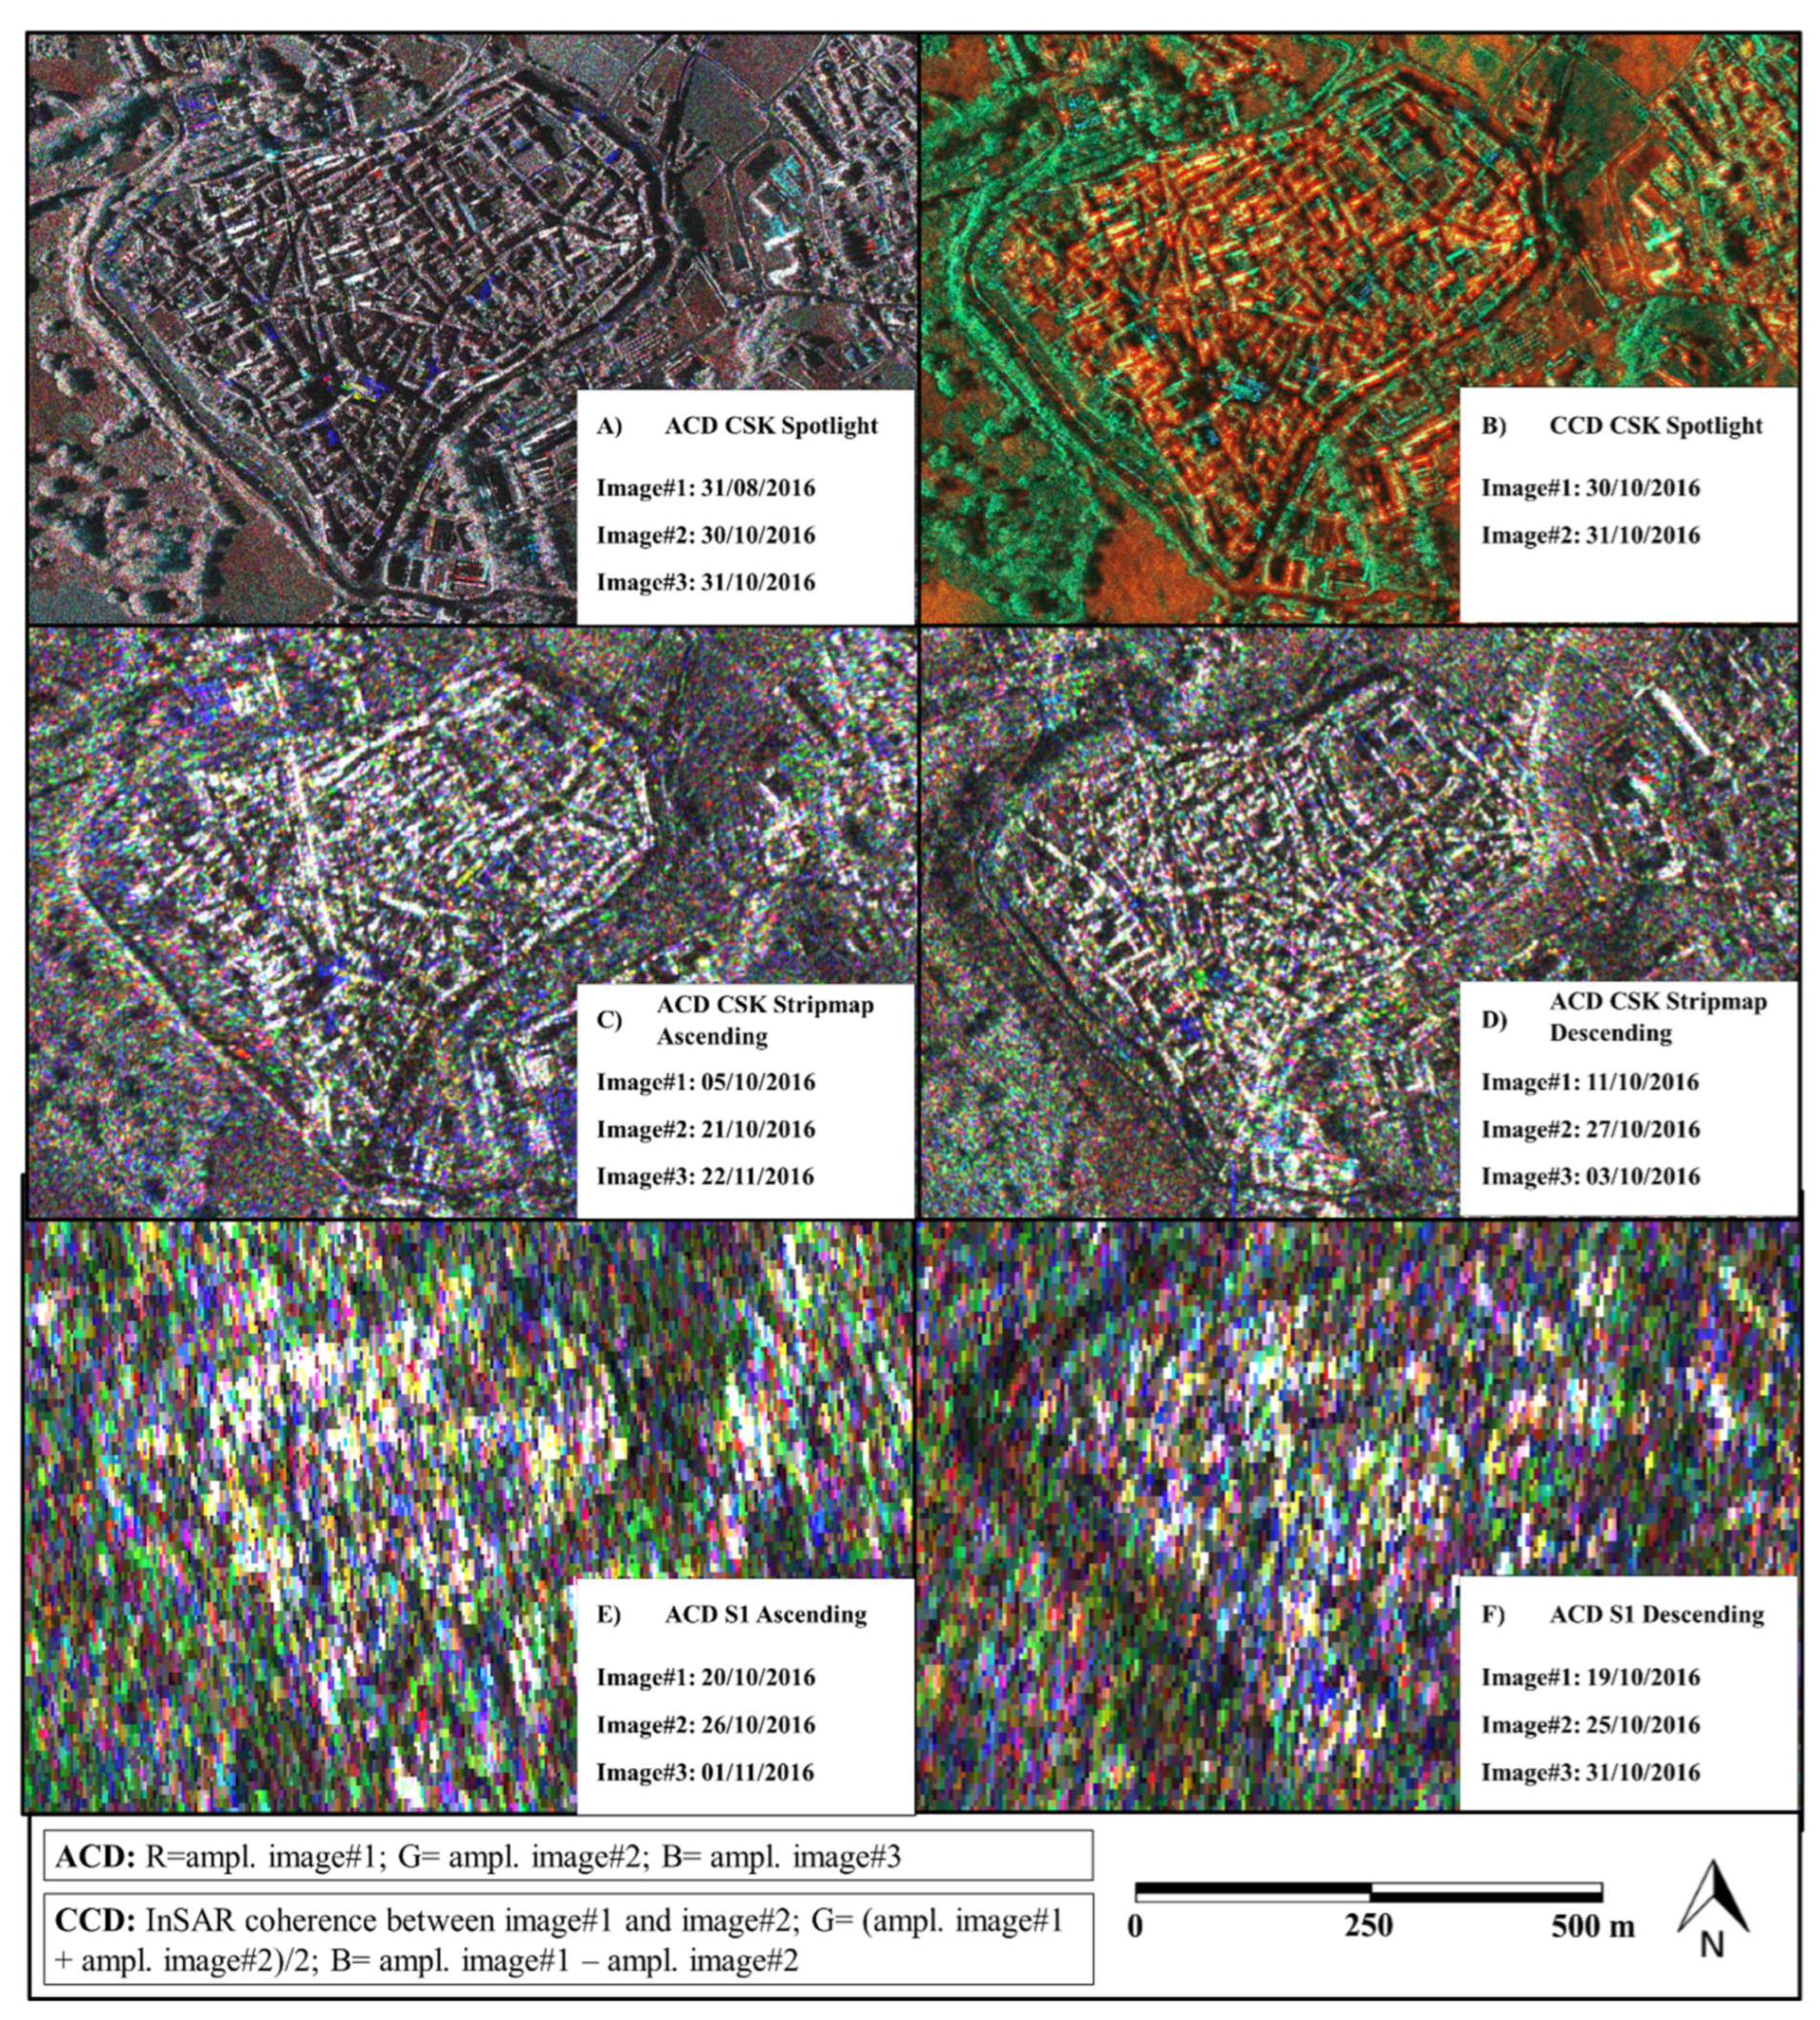
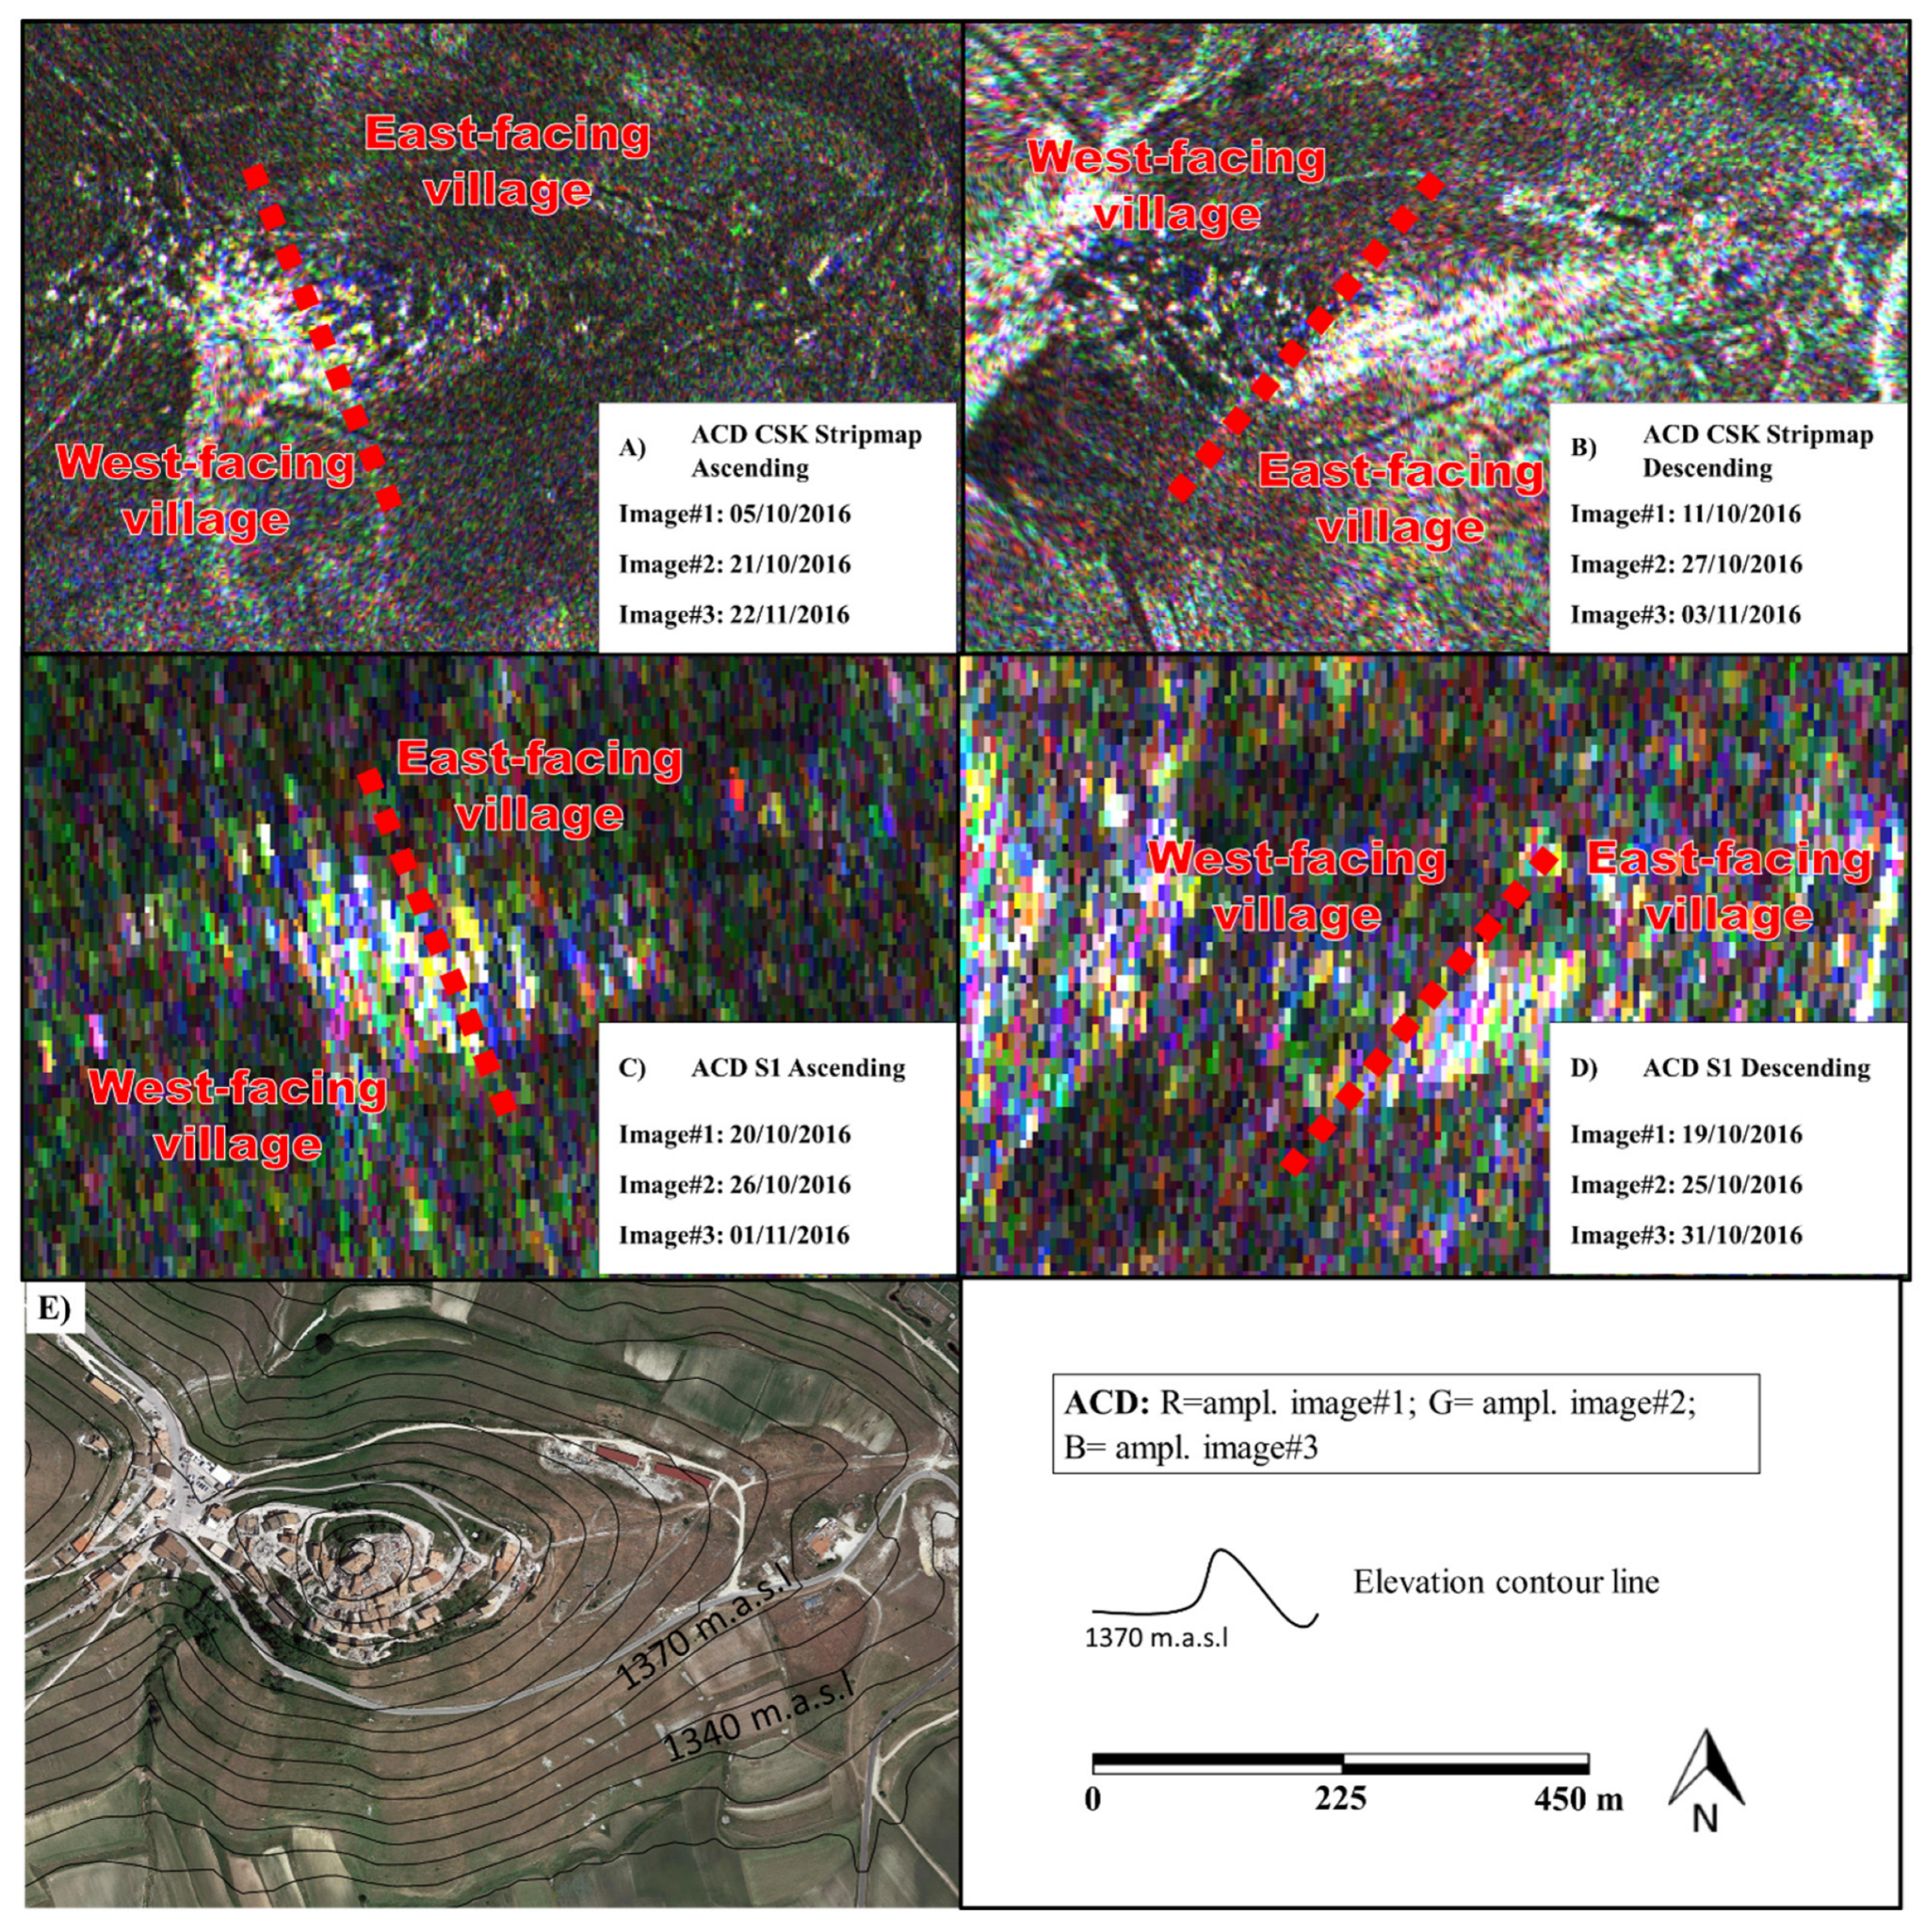
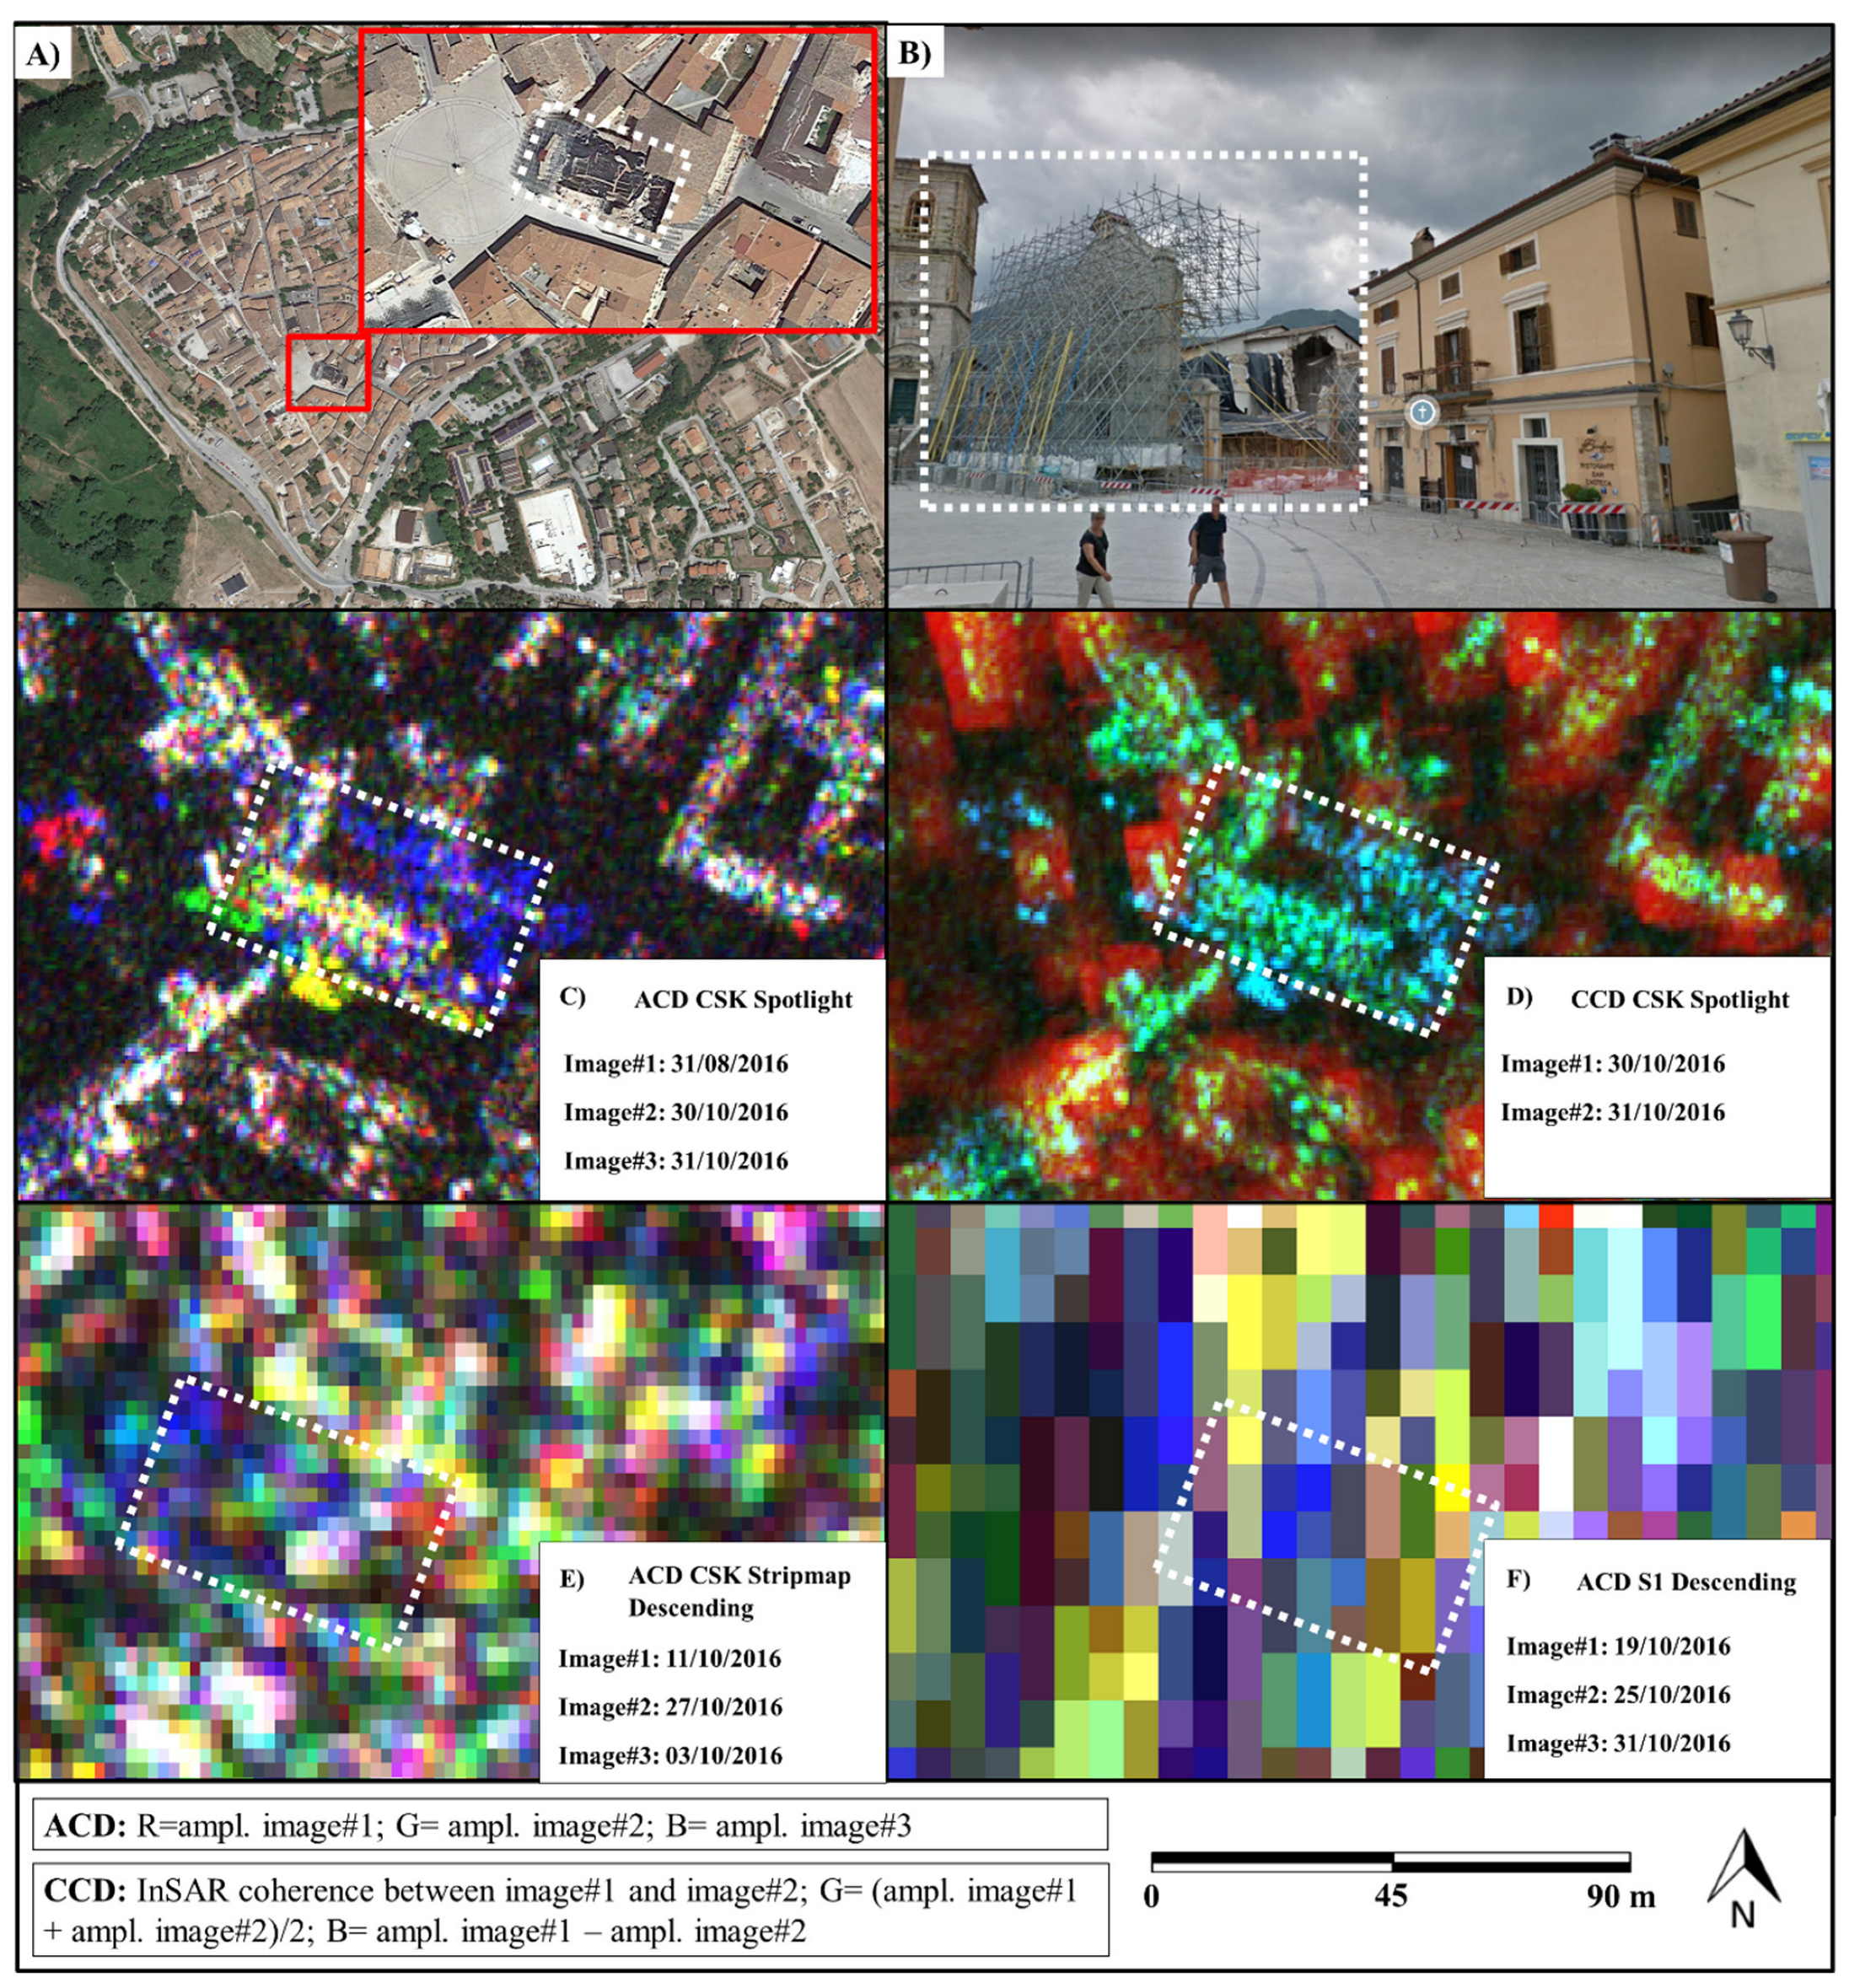
2.4. Amplitude and Coherent Change Detection

SAR images consist of complex data containing the amplitude and phase information of backscattered signals. Both these information types can be used as indicators for change detections.
Two change detection approaches can be performed using SAR data [26]: the amplitude change detection (ACD), which identifies changes in backscatter intensity between two or more scenes; and the coherent change detection (CCD), which investigates interferometric coherence between two or more scenes [27].
To simulate an emergency scenario and to investigate the performance of our datasets, we selected the images pairs nearest to the event (StripMap and Sentinel-1) and, in the case of Spotlight, it was the only available since they are very rare. In the CCD method we also selected image pairs considering the best compromise with the lower temporal baseline and InSAR coherence.
Pre-processing of the COSMO-SkyMed and Sentinel-1 SAR images, including coregistration and interferogram computation to generate interferometric coherence, was carried out by using SARPROZ software before applying ACD/CCD.
Both IRIS and SARPROZ software were used for the ACD/CCD analyses, with the aim to generate an RGB image through the combination of different channels together, by using two or more SAR images and assigning to the R, G, and B channels the amplitude or the InSAR coherence of the SAR images (Equations (1) and (2)).
In ACD methods, amplitude values are used without interferometric phase information by calculating the amount to which the backscatter intensity changed due to natural disasters, using the difference between or the ratio of SAR images acquired before and after the event [12]. This technique is sensitive only to changes that affect backscatter and does not consider complex SAR information (intensity or phase). However, such events must be of adequate size to be recognizable in SAR imagery, and the changes in backscatter intensity must be higher than the noise or the speckle effect. We combined the amplitudes of three different images to generate RGB images (i.e., two images taken before and one after the earthquake).
We assigned the RGB channels as follows (Table 2).
R = amplitude Image #1; [0–255]
G = amplitude Image #2; [0–255]
B = amplitude Image #3. [0–255]
In CCD, the InSAR coherence of an image pair is used to quantify changes in the phase of each pixel of the images. Loss of coherence or any decorrelation in the phase allows the quantification of the scattering characteristic changes and the subsequent detection of surface changes [28,29]. This approach reveals changes that are not detectable in the pixel intensities/amplitudes, since changing the surface generates phase differences and leads to the decorrelation of complex signals. We combined the amplitudes and the phases of two images from each dataset (i.e., one taken before and one after the earthquake) to generate RGB images. In particular, the RGB channels were filled as follows (Table 3).
R = interferometric coherence between Image#1 and Image#2 [0–255]
G = (amplitude Image#1 + amplitude Image#2)/2 [0–255]
B = amplitude Image#1—amplitude Image#2 [0–255]
Focusing on the ACD results, the red (Image #1 amplitude), green (Image #2 amplitude), and blue (Image #3 amplitude) pixels identified the sectors in which the amplitude in the image assigned in the red, green, or blue channels was greater than those assigned to the other two channels, respectively. All other colors represented pixels with different combinations of amplitude values for each pixel in the three analyzed images: white represents pixels with high and similar amplitudes among the three images (e.g., intact buildings), black represents pixels with low amplitudes in the three images (e.g., vegetation/water), and so on. Since we were looking for structures, whose shapes were significantly modified by shaking, we focused on the yellow (e.g., high amplitude in Images #1 and #2 and low amplitude in Image #3) and blue (e.g., low/medium amplitude in Images #1 and #2 and high amplitude in Image #3) pixels.
Regarding CCD results, the red pixels identify sectors in which the interferometric coherence between Image #1 and Image #2 was high and their amplitudes were stable, green pixels identify sectors in which the interferometric coherence between Image #1 and Image #2 was medium/low and their amplitudes were high, and blue pixels identify sectors in which the interferometric coherence between Image #1 and Image #2 was low/medium and their amplitudes changed sharply. All other colors represent pixels with different combinations of amplitude and phase values for each pair of pixels. Since we wanted to focus on structures whose shapes were significantly modified by shaking, we focused on the cyan (e.g., low InSAR coherence in Images #1 and #2 and medium/high amplitudes) and the blue (e.g., low InSAR coherence in Images #1 and #2 and strongly changed amplitudes) pixels.

3. Results

The results achieved for the COSMO-SkyMed and Sentinel-1 datasets in the Norcia and Castelluccio areas are reported in Figure 3 and Figure 4, respectively.
In both Norcia (Figure 3) and Castelluccio (Figure 4), the differences in the ground resolutions among the COSMO-SkyMed Spotlight, StripMap and Sentinel-1 images can be clearly appreciated, thus helping to define the capability of each image source to detect backscattering variations referred to as single buildings. It is worth mentioning that Castelluccio village was not included in the Spotlight COSMO-SkyMed footprint; therefore, in this area, the ACD and the CCD analyses were carried out using only the StripMap COSMO-SkyMed and the IW Sentinel-1 datasets.
In Figure 5, an extract of the San Benedetto Church in Norcia is shown to compare and to appreciate in detail the potential of the three datasets used at the single-building scale.
The cross-check conducted with an on-site damage mapping in Norcia village (Figure 6 and Table 4) confirmed that the ACD and CCD processing of the Spotlight COSMO-SkyMed images had the potential to serve as excellent options for rapid damage mapping at the single-building scale under operational conditions.
Furthermore, it is worth mentioning that, using Spotlight COSMO-SkyMed images, it is possible to map, with many details, the damage affecting slopes, transportation routes, and other infrastructure that are not commonly inventoried during “Triage” field inspections and that focus mainly on buildings, as reported in Figure 7, an extract of ancient walls in Norcia that were not inventoried by the Triage.
However, we cannot neglect that some false positives can be detected, as shown by the yellow polygons in (Figure 6). These features show changes occurred due to the rise of the rescue facilities. They can be easily filtered out because the position of these structures is known through civil protection emergency plans.
A quantitative evaluation for the accuracy of each dataset, computed with respect to the “ground truth” derived from Triage field surveys, is reported in Table 4. Collapsed buildings were selected by setting a threshold on yellow (210 < R < 255; 210 < G < 255; 0 < B < 60) and blue (0 < R < 60; 0 < G < 60; 210 < B < 255) and taking into consideration only clusters with at least 4 pixels to discard false alarms due to single noisy pixels.
As we can see, COSMO-SkyMed Spotlight returns a very accurate mapping, detecting of approximately 90% of the structures severely damaged, while COSMO-SkyMed Stripmap has been able to detect about the 45% of the damaged buildings.

4. Discussions

The ACD/CCD results clearly reveal the different capabilities of sensors with different resolutions and acquisition geometries to perform single-building damage mapping after earthquakes. As we can see from Figure 4 and Figure 6, COSMO-SkyMed Spotlight images allowed very detailed single-building damage mapping. In Figure 5C, the yellow pixels represent the line-of-sight (LOS) visible front of the building that is now collapsed, while the blue pixels represent the shadowed-in-LOS portion of the church that is now covered by backscattering debris. In Figure 5D, the CCD method achieved a perimeter of the shape of the collapsed structure with a high precision. Additionally, the COSMO-SkyMed StripMap ACD results (Figure 5E) showed an adequate capability of mapping the collapsed building, though with less detail than that obtained with Spotlight (Figure 6). On the other hand, the Sentinel-1 ACD results (Figure 5F) did not allow single-building damage mapping to be achieved because of the relatively poor geometric resolution of the sensors.
In this study, the pros and the cons of the three analyzed datasets are deepened as follows; COSMO-SkyMed was designed for both civil and military purposes. In its nominal configuration, the constellation can guarantee a 12-h revisit time (in emergency conditions) for 100% of the Earth’s surface. With the aim of creating a regularly updated interferometric archive according to the specific needs of the Italian Civil Protection Department, the ASI activated the “MapItaly project” in 2009. Thanks to this project, historical image series were acquired over the whole Italian territory based on 16-day, 40 × 40-km-swath StripMap acquisitions obtained in double-orbital geometry. On the other hand, Spotlight COSMO-SkyMed was not planned as a “background mission” acquisition in Italy. This implies that there is no already-acquired pre-event radar map of the territory, but image collection is instead planned on demand or for specific purposes.
The ascending and the descending acquisition geometries that are available for StripMap data have proven to be fundamental for obtaining the information of villages, structures, and infrastructures in complex topographic environments, as demonstrated by the results obtained for Castelluccio village. In contrast with the Norcia village results, we can see how the radar images in Castelluccio were affected by typical foreshortening and layover geometric distortions [13], affecting the visibility of the village. Specifically, the east-facing portion of the village was visible under descending geometry, while the west-facing portion was affected by foreshortening under this condition (Figure 4B). In contrast, under ascending geometry, we could map and detect damage to the west-facing portion of the village (Figure 4A). In such a scenario, if a single orbital geometry had been used to map damaged areas, incomplete information would have been provided to emergency units.
By comparing the ACD and the CCD results obtained for the same satellite mission, we can see how both processing methodologies can be effectively applied for damage-mapping purposes with comparable results (Figure 4 and Figure 5). Since CCD is related to phase variations, it is worth mentioning that the satellite revisit time plays a key role in the results. The greater the time span between the image pair, the lower the effectiveness of the approach because of the temporal decorrelation of the InSAR coherence [30]. In contrast, the ACD method is less affected by the temporal decorrelation effect than the CCD method.
The Spotlight images were also proven to be effective in mapping EQtLs, which—in several cases—are the main causes of routes interruptions. In Figure 8, we show an example of an EQtL that was detected in high detail by both ACD and CCD analyses conducted on Spotlight images, with less clear but still visible results obtained with StripMap data. Sentinel-1, on the other hand, was not able to detect this feature. Such information is fundamental for defining potential damage or interruptions to communication routes to avoid slowdowns in an emergency context and to guarantee the fastest and the most effective actions for rescue units.
Lastly, Sentinel-1 has the advantage of providing background data collection with a 6-day revisit time, thus allowing very rapid temporal reactions (from 1 to 6 days); however, single-amplitude IW ground resolutions cannot aid in mapping or detecting damaged areas with the necessary precision. In contrast, recent studies that applied single Sentinel-1 images for natural or anthropic disaster mapping indicated that the images were useful when dealing with spatially widespread phenomena [31,32]. However, if the aim is to detect and to map individual buildings or transportation routes, one must manage a time series of images or despeckled mean amplitudes [33]. In an emergency scenario, when only a single amplitude is available after the event, the S1 IW ground resolution is not adequate to provide effective information to rescue units with the aim of properly addressing emergencies, identifying priorities, and quickly moving people to safe locations. On the other hand, the Sentinel-1 StripMap mode has a higher spatial resolution (5 m × 5 m) than other modes, and it can be used to support emergency services; however, this imaging mode is not used regularly, and no archive data are available with global coverage [34].
In summary, the performances and the reaction times of the utilized datasets, as demonstrated, were functions of the combination of the: (i) ground resolution, (ii) revisit time, and (iii) availability of historical acquisition data in double-orbital geometry of each dataset; the results are recapped in Table 5.
Considering an overall production effort of 6 h/10 km2, we can derive that by using high resolution satellites it would be reliable to expect an accurate damage map provision up to 1.25 days after the event that can be a suitable time for evaluating the impact of the event and address rescues.
In literature, at present, most of the other works investigate the potential of optical or radar images by exploiting images acquired even months after the event, however without considering timing, as we did, which plays a key role in natural disasters. We wanted to provide an operational contribution on the suitability of SAR data for the purposes of emergency management to direct the user responsible for the rescue to manage the emergency through a comparison of data with significantly different geometric resolution and revisit times. Most of these above-cited authors stated that the use of optical or ancillary data is needed to provide accurate damage maps. By using high-resolution and frequent revisit time SAR data, which at that time were not operational, we demonstrate that a quick-response damage map can be conducted in a “blind” manner without the use of ancillary or optical data. In fact, we used ancillary data (QuickTriage) just as ground truth to benchmark and to evaluate the performances of our approach.
In addition, considerable literature applied sophisticated algorithms, such as machine learning, genetic algorithms, principal component analysis, etc. [6,35,36,37], or multitemporal acquisitions, all methods that can involve a considerable computational effort and an emergency response timing not adequate. Besides, the more complex the model, the harder it is to seek its theoretical consistency in statistical terms (see e.g., [38,39]). On the contrary, we used a rapid, relatively simple method that had success also thanks to the availability of very high-resolution SAR images.

5. Conclusions

In this work, the performances of SAR images acquired by different satellite missions with different geometric resolutions when mapping post-earthquake damage were analyzed. We focused on the earthquake that affected Norcia and Castelluccio (Italy) on 30–31 October 2016 by applying ACD and CCD methodologies to COSMO-SkyMed and Sentinel-1 images. The COSMO-SkyMed Spotlight images allowed very detailed single-building damage mapping, while the COSMO-SkyMed StripMap HIMAGE images returned good delimitations of buildings; hence, both image types can be effectively used for emergency purposes. On the other hand, Sentinel-1 did not allow single-building damage mapping to be achieved but instead provided approximate identifications of the most severely damaged sectors. Additionally, COSMO-SkyMed Spotlight was also proven to be effective in mapping and detecting small EQtL that can cause street interruptions and slow emergency actions. The double-acquisition geometry was proven to be fundamental for obtaining information on villages, structures, and infrastructures located in complex topographic environments.
Thanks to its all-day and all-weather acquisition capabilities, spaceborne SAR images are the best option for damage mapping during emergency conditions caused by earthquakes, when rescue units need rapid answers to address their support. However, other factors are fundamental for emergency operations in addition to the right geometric resolution, such as the temporal resolution and the availability of background historical acquisitions in double-orbital geometry at the global scale.
At present, few satellite SAR missions have the potential to provide images with adequate geometries and temporal resolutions, as shown in the present paper. Therefore, similar applications are performed using competitive technologies like UAV or aerial/satellite flights equipped with optical sensors, able to provide similar or, in some cases, even better results. However, rescue operations during emergency condition have strict requirements in terms of results delivery time, accessibility, and extension of sites (not compatible in case of unfavorable light/weather conditions or economically sustainable for large areas).
In this perspective, the exponentially growing number of satellite SAR missions that we are experiencing in recent years is expected to provide in the near future very high-resolution SAR images (<1 m) with very high temporal resolutions (up to multiple revisits per day) in any weather/light conditions immediately before and after event. Our research and the unusual chance to have high-resolution images immediately before and after event, can guide the choices of future satellite missions, and it can make operators aware of the potential of these types of data for their applications.
If the expected capabilities of these new generations of “Small-satellites” missions (i.e., [16,17]) are confirmed, single-building damage mapping by SAR images after earthquakes and other natural hazards should soon become an excellent operational tool used for disaster management.

Author Contributions

P.M.: Conceptualization, Validation, Writing—review and editing, Supervision; S.S.: Methodology, Formal analysis, Validation, Writing—Original Draft, Data Curation; M.V.: Conceptualization, Validation, Writing—review and editing, Data Curation; S.F.: Conceptualization, Validation, Data Curation; V.N.: Conceptualization, Validation, Writing—review and editing; F.L.: Conceptualization, Validation, Writing—review and editing, Supervision. All authors have read and agreed to the published version of the manuscript.

Funding

This research received no external funding.

Acknowledgments

We thank the Italian Space Agency (ASI) for providing COSMO-SkyMed satellite images and the Italian National Fire and Rescue Service (CNVVF) for providing QuickTriage field surveys.

Conflicts of Interest

The authors declare no conflict of interest.

References

  1. Clement, M.A.; Kilsby, C.G.; Moore, P. Multi-temporal synthetic aperture radar flood mapping using change detection. J. Flood Risk Manag. 2018, 11, 152–168. [Google Scholar] [CrossRef]
  2. Jung, J.; Kim, D.J.; Lavalle, M.; Yun, S.H. Coherent change detection using InSAR temporal decorrelation model: A case study for volcanic ash detection. IEEE Trans. Geosci. Remote Sens. 2016, 54, 5765–5775. [Google Scholar] [CrossRef]
  3. Bovolo, F.; Marin, C.; Bruzzone, L. A novel approach to building change detection in very high-resolution SAR images. Image Signal Processing Remote Sens. XVIII 2012, 8537, 285–296. [Google Scholar] [CrossRef]
  4. Li, Q.; Gong, L.; Zhang, J. Earthquake-Induced Building Recognition Using Correlation Change Detection of Texture Features Based on SAR Data. Geod. List 2018, 72, 93–112. [Google Scholar]
  5. Miura, H.; Midorikawa, S.; Matsuoka, M. Building damage assessment using high-resolution satellite SAR images of the 2010 Haiti earthquake. Earthq. Spectra 2016, 32, 591–610. [Google Scholar] [CrossRef]
  6. Wieland, M.; Liu, W.; Yamazaki, F. Learning change from Synthetic Aperture Radar images: Performance evaluation of a Support Vector Machine to detect earthquake and tsunami-induced changes. Remote Sens. 2016, 8, 792. [Google Scholar] [CrossRef] [Green Version]
  7. Gamba, P.; Dell’Acqua, F.; Trianni, G. Rapid damage detection in the Bam area using multitemporal SAR and exploiting ancillary data. IEEE Trans. Geosci. Remote Sens. 2007, 45, 1582–1589. [Google Scholar] [CrossRef]
  8. Brunner, D.; Lemoine, G.; Bruzzone, L. Earthquake damage assessment of buildings using VHR optical and SAR imagery. IEEE Trans. Geosci. Remote Sens. 2010, 48, 2403–2420. [Google Scholar] [CrossRef] [Green Version]
  9. Ajadi, O.A.; Meyer, F.J.; Webley, P.W. Change detection in synthetic aperture radar images using a multiscale-driven approach. Remote Sens. 2016, 8, 482. [Google Scholar] [CrossRef] [Green Version]
  10. Luo, H.; Liu, C.; Wu, C.; Guo, X. Urban change detection based on Dempster–Shafer theory for multitemporal very high-resolution imagery. Remote Sens. 2018, 10, 980. [Google Scholar] [CrossRef] [Green Version]
  11. Saur, G.; Krüger, W. Change detection in UAV video mosaics combining a feature based approach and extended image differencing. In Proceedings of the International Archives of the Photogrammetry, Remote Sensing & Spatial Information Sciences, Prague, Czech Republic, 2–19 July 2016; Volume 41. [Google Scholar]
  12. Jung, J.; Yun, S.H. Evaluation of Coherent and Incoherent Landslide Detection Methods Based on Synthetic Aperture Radar for Rapid Response: A Case Study for the 2018 Hokkaido Landslides. Remote Sens. 2020, 12, 265. [Google Scholar] [CrossRef] [Green Version]
  13. Curlander, J.C.; McDonough, R.N. Synthetic Aperture Radar; Wiley: New York, NY, USA, 1991; Volume 11, ISBN 047185770X. [Google Scholar]
  14. Bovenga, F.; Belmonte, A.; Refice, A.; Pasquariello, G.; Nutricato, R.; Nitti, D.O.; Chiaradia, M.T. Performance analysis of satellite missions for multi-temporal SAR interferometry. Sensors 2018, 18, 1359. [Google Scholar] [CrossRef] [PubMed] [Green Version]
  15. Caltagirone, F.; Capuzi, A.; Coletta, A.; De Luca, G.F.; Scorzafava, E.; Leonardi, R.; Rivola, S.; Fagioli, S.; Angino, G.; L’Abbate, M.; et al. The COSMO-SkyMed dual use Earth observation program: Development, qualification, and results of the commissioning of the overall constellation. IEEE J. Sel. Top. Appl. Earth Obs. Remote Sens. 2014, 7, 2754–2762. [Google Scholar] [CrossRef]
  16. Ignatenko, V.; Laurila, P.; Radius, A.; Lamentowski, L.; Antropov, O.; Muff, D. ICEYE Microsatellite SAR Constellation Status Update: Evaluation of First Commercial Imaging Modes. In Proceedings of the IEEE International Symposium on Geoscience and Remote Sensing 2020, Waikoloa, HI, USA, 26 September–2 October 2020; pp. 3581–3584. [Google Scholar] [CrossRef]
  17. Farquharson, G.; Woods, W.; Stringham, C.; Sankarambadi, N.; Riggi, L. The Capella Synthetic Aperture Radar Constellation. In Proceedings of the EUSAR, 12th European Conference on Synthetic Aperture Radar 2018, Valencia, Spain, 22–27 July 2018; pp. 1–5. [Google Scholar] [CrossRef]
  18. Civico, R.; Pucci, S.; Villani, F.; Pizzimenti, L.; De Martini, P.M.; Nappi, R.; Open EMERGEO Working Group. Surface ruptures following the 30 October 2016 M w 6.5 Norcia earthquake, central Italy. J. Maps 2018, 14, 151–160. [Google Scholar] [CrossRef] [Green Version]
  19. Zanini, M.A.; Hofer, L.; Faleschini, F.; Zampieri, P.; Fabris, N.; Pellegrino, C. Preliminary macroseismic survey of the 2016 Amatrice seismic sequence. Ann. Geophys. 2016, 59. [Google Scholar] [CrossRef]
  20. Perissin, D.; Wang, Z.; Wang, T. The SARPROZ InSAR tool for urban subsidence/manmade structure stability monitoring in China. In Proceedings of the ISRSE 2011, Sidney, Australia, 10–15 April 2011. [Google Scholar]
  21. Torres, R.; Snoeij, P.; Geudtner, D.; Bibby, D.; Davidson, M.; Attema, E.; Potin, P.; Rommen, B.; Floury, N.; Brown, M.; et al. GMES Sentinel-1 mission. Remote Sens. Environ. 2012, 120, 9–24. [Google Scholar] [CrossRef]
  22. Martino, S.; Bozzano, F.; Caporossi, P.; D’Angiò, D.; Della Seta, M.; Esposito, C.; Fantini, A.; Fiorucci, M.; Giannini, L.M.; Iannucci, R.; et al. Ground effects triggered by the August 24th, 2016, Mw 6.0 Amatrice (Italy) earthquake: Survey and inventorying to update the CEDIT catalogue. Geogr. Fis. Din. Quat. 2017, 40, 77–95. [Google Scholar] [CrossRef]
  23. Bickel, V.T.; Manconi, A.; Amann, F. Quantitative assessment of digital image correlation methods to detect and monitor surface displacements of large slope instabilities. Remote Sens. 2018, 10, 865. [Google Scholar] [CrossRef] [Green Version]
  24. Tong, X.; Ye, Z.; Xu, Y.; Gao, S.; Xie, H.; Du, Q.; Liu, S.; Xu, X.; Liu, S.; Luan, K.; et al. Image registration with Fourier-based image correlation: A comprehensive review of developments and applications. IEEE J. Sel. Top. Appl. Earth Obs. Remote Sens. 2019, 12, 4062–4081. [Google Scholar] [CrossRef]
  25. Wang, Z.; Bovik, A.C.; Sheikh, H.R.; Simoncelli, E.P. Image quality assessment: From error visibility to structural similarity. IEEE Trans. Image Processing 2004, 13, 600–612. [Google Scholar] [CrossRef] [Green Version]
  26. Novak, L.M. Advances in SAR Change Detection; North Atlantic Treaty Organization, Technical Report, 2013. Available online: https://www.sto.nato.int/publications/STO%20Educational%20Notes/STO-EN-SET-172-2013/EN-SET-172-2013-09.pdf (accessed on 4 May 2022).
  27. Scheuchl, B.; Ullmann, T.; Koudogbo, F. Change detection using high resolution TerraSAR-X data: Preliminary results. Int. Arch. Photogramm. Remote Sens. Spat. Inf. Sci. 2009, 38, 1–47. [Google Scholar]
  28. Bouaraba, A.; Milisavljević, N.; Acheroy, M.; Closson, D. Change Detection and Classification Using High Resolution SAR Interferometry. In Land Applications of Radar Remote Sensing; InTech Open: Rijeka, Croatia, 2014; p. 149. [Google Scholar] [CrossRef] [Green Version]
  29. Mishra, A.; Chaudhuri, D.; Bhattacharya, C.; Rao, Y.S. Coherent Change Detection with COSMO-SkyMed Data-experimental Results. Def. Sci. J. 2013, 63, 69. [Google Scholar] [CrossRef] [Green Version]
  30. Hanssen, R.F. Radar Interferometry: Data Interpretation and Error Analysis; Kluwer Academic Publishers: Dordrecht, Netherland, 2001; ISBN 978-0-306-47633-4. [Google Scholar]
  31. Malmgren-Hansen, D.; Sohnesen, T.; Fisker, P.; Baez, J. Sentinel-1 change detection analysis for cyclone damage assessment in urban environments. Remote Sens. 2020, 12, 2409. [Google Scholar] [CrossRef]
  32. Washaya, P.; Balz, T.; Mohamadi, B. Coherence change-detection with Sentinel-1 for natural and anthropogenic disaster monitoring in urban areas. Remote Sens. 2018, 10, 1026. [Google Scholar] [CrossRef] [Green Version]
  33. Olen, S.; Bookhagen, B. Mapping damage-affected areas after natural hazard events using sentinel-1 coherence time series. Remote Sens. 2018, 10, 1272. [Google Scholar] [CrossRef] [Green Version]
  34. Aschbacher, J.; Milagro-Peréz, M.P. The European Earth monitoring (GMES) programme: Status and perspectives. Remote Sens. Environ. 2012, 120, 3–8. [Google Scholar] [CrossRef]
  35. Kusetogullari, H.; Yavariabdi, A.; Celik, T. Unsupervised Change Detection in Multitemporal Multispectral Satellite Images Using Parallel Particle Swarm Optimization. IEEE J. Sel. Top. Appl. Earth Obs. Remote Sens. 2015, 8, 2151–2164. [Google Scholar] [CrossRef]
  36. Du, P.; Liu, S.; Xia, J.; Zhao, Y. Information Fusion Techniques for Change Detection from Multi-Temporal Remote Sensing Images. Inf. Fusion 2013, 14, 19–27. [Google Scholar] [CrossRef]
  37. Janalipour, M.; Taleai, M. Building change detection after earthquake using multi-criteria decision analysis based on extracted information from high spatial resolution satellite images. Int. J. Remote Sens. 2017, 38, 82–99. [Google Scholar] [CrossRef]
  38. Lombardo, F.; Napolitano, F.; Russo, F.; Koutsoyiannis, D. On the Exact Distribution of Correlated Extremes in Hydrology. Water Resour. Res. 2019, 55, 10405–10423. [Google Scholar] [CrossRef] [Green Version]
  39. Serinaldi, F.; Lombardo, F.; Kilsby, C.G. Testing tests before testing data: An untold tale of compound events and binary dependence. Stoch. Environ. Res. Risk Assess 2022, 1–23. [Google Scholar] [CrossRef]
Figure 1. Workflow of the approach carried out to evaluate the performance of Multi-resolution Satellite SAR Images for Post-Earthquake Damage Detection and Mapping.
Remotesensing 14 02210 g001
Figure 2. Footprints of the selected SAR datasets over Norcia and Castelluccio towns.
Remotesensing 14 02210 g002
Figure 3. Results achieved in Norcia village: (A) ACD Spotlight COSMO-SkyMed; (B) CCD Spotlight COSMO-SkyMed; (C) ACD StripMap COSMO-SkyMed ascending; (D) ACD StripMap COSMO-SkyMed descending; (E) ACD IW Sentinel-1 ascending; and (F) ACD IW Sentinel-1 descending.
Remotesensing 14 02210 g003
Figure 4. ACD results achieved in Castelluccio village: (A) StripMap COSMO-SkyMed ascending; (B) StripMap COSMO-SkyMed descending; (C) IW Sentinel-1 ascending; (D) IW Sentinel-1 descending; and (E) Google Earth background of Castelluccio village and elevation contour lines (in m. a. s. l.). The red dotted lines indicatively separate the east-facing portion and the west-facing portion of the village. The difference of the foreshortening related to ascending and descending geometry is clear and demonstrates the importance of the double geometry to map damaged areas in complex topographic environments.
Remotesensing 14 02210 g004
Figure 5. Extracts of the San Benedetto Church in Norcia. (A,B) Locations and post-earthquake pictures of the church (source: Google); (C) ACD Spotlight COSMO-SkyMed; (D) CCD Spotlight COSMO-SkyMed; (E) ACD StripMap COSMO-SkyMed descending; and (F) ACD IW Sentinel-1 descending.
Remotesensing 14 02210 g005
Figure 6. Cross-check among field surveys, COSMO-SkyMed Spotlight, and StripMap results. The white dotted line is the perimeter of the Norcia ancient walls used for the quantitative evaluation of the damage map reported in Table 4.
Remotesensing 14 02210 g006
Figure 7. Extracts of two portions of the ancient walls of Norcia [source: Google maps in (A,B)]. (A,C,E) show the locations and ACD results of the northwestern sector of the walls. (B,D,F) show the locations and ACD results of the eastern sector of the walls.
Remotesensing 14 02210 g007
Figure 8. Extracts of EQtL in the northeastern sector of Norcia (red ellipses). (A,B) show the locations and pre/post-earthquake pictures of the landslide; (C) ACD Spotlight COSMO-SkyMed results; (D) CCD Spotlight COSMO-SkyMed results; (E) ACD StripMap COSMO-SkyMed descending results; and (F) ACD IW Sentinel-1 descending results.
Remotesensing 14 02210 g008
Table 1. Description of the analyzed dataset (dates are in dd/mm/yyyy hh:mm UTC). The SAR images for each dataset have been acquired with the same acquisition condition and geometry.
Acquisition ModeGeom. Resol.Ground Resol.Swath WidthLook AngleIncidence AnglePolarizationAscendingStandard
Revisit Time
Spotlight CSK1 m × 1 m0.5 m × 0.7 m10 km × 10 kmRight52.39°VV31 August 2016 (04:58 UTC)
30 October 2016 (04:58 UTC)
31 October 2016 (04:58 UTC)
n.a.
StripMap HIMAGE CSK3 m × 3 m2.1 m × 2.3 m40 km × 40 km29.35°HH5 October 2016 (04:41 UTC)
21 October 2016 (04:41 UTC)
6 November 2016 (04:41 UTC)
22 November 2016 (04:41 UTC)
16 days
IW Sentinel-120 m × 5 m3.4 m × 14 m250 km43.81°VV20 October 2016 (17:04 UTC)—S1B6 days
26 October 2016 (17:04 UTC)—S1A
1 November 2016 (17:04 UTC)—S1B
7 November 2016 (17:04 UTC)—S1A
Descending
StripMap HIMAGE CSK3 m × 3 m2.1 m × 2.2 m40 km × 40 km26.58°HH11 October 2016 (17:08 UTC)
27 October 2016 (17:08 UTC)
3 November 2016 (17:08 UTC)
19 November 2016 (17:08 UTC)
16 days
IW Sentinel-120 m × 5 m4.2 m × 14 m250 km33.82°VV19 October 2016 (05:19 UTC)—S1B6 days
25 October 2016 (05:19 UTC)—S1A
31 October 2016 (05:19 UTC)—S1B
6 November 2016 (05:19 UTC)—S1A
Table 2. RGB combination used for each stack for the ACD.
DatasetImage #1
(dd/mm/yyyy)
Image #2
(dd/mm/yyyy)
Image #3
(dd/mm/yyyy)
Spotlight31 August 201630 October 201631 October 2016
StripMap HIMAGE Ascending5 October 201621 October 201622 November 2016
StripMap HIMAGE Descending11 October 201627 October 20163 November 2016
Sentinel-1 Ascending20 October 201626 October 20161 November 2016
Sentinel-1 Descending19 October 201625 October 201631 October 2016
Table 3. RGB combination used for each stack for the CCD.
DatasetImage #1 (dd/mm/yyyy)Image #2 (dd/mm/yyyy)
Spotlight30 October 201631 October 2016
StripMap HIMAGE Ascending5 October 20166 November 2016
StripMap HIMAGE Descending27 October 20163 November 2016
Sentinel-1 Ascending26 October 20161 November 2016
Sentinel-1 Descending25 October 201631 October 2016
Table 4. Quantitative evaluation of damage map in Figure 5.
Extension (m2)Overall Accuracy (with Respect to “Ground Truth”)
Norcia village232,000 m2/
Damaged areas by “ground truth”17,600 m2Reference (100%)
COSMO-SkyMed Spotlight damage map15,900 m290%
COSMO-SkyMed Stripmap damage map7900 m245%
Sentinel-1 damage mapNot determinable
Table 5. Estimated times required for damage map provisioning for each dataset used to study post-earthquake emergencies.
COSMO-SkyMed Spotlight (1-m × 1-m res.)COSMO-SkyMed
StripMap HIMAGE (3-m × 3-m res.)
Sentinel-1 (20-m × 5-m res.)
Availability of t0 acquisition (Italian territory)NoYesYes
Standard Revisit timen.a.16 days6 days
Post-earthquake acquisition (from the occurrence of the event) and delivery to service providerup to 1 day (for civil protection request)up to 1 day (for civil protection request)from 6 to 1 day
Pre-processing, processing, interpretation, and validation (hours/10 km2)6 h/10 km2
Damage map provision from event (days)up to 1.25 daysup to 1.25 daysfrom 6.25 to 1.25 days
Publisher’s Note: MDPI stays neutral with regard to jurisdictional claims in published maps and institutional affiliations.

