
Monitoring the Surface Elevation Changes of a Monsoon Temperate Glacier with Repeated UAV Surveys, Mainri Mountains, China

 , ,
, , 
Abstract
:1. Introduction
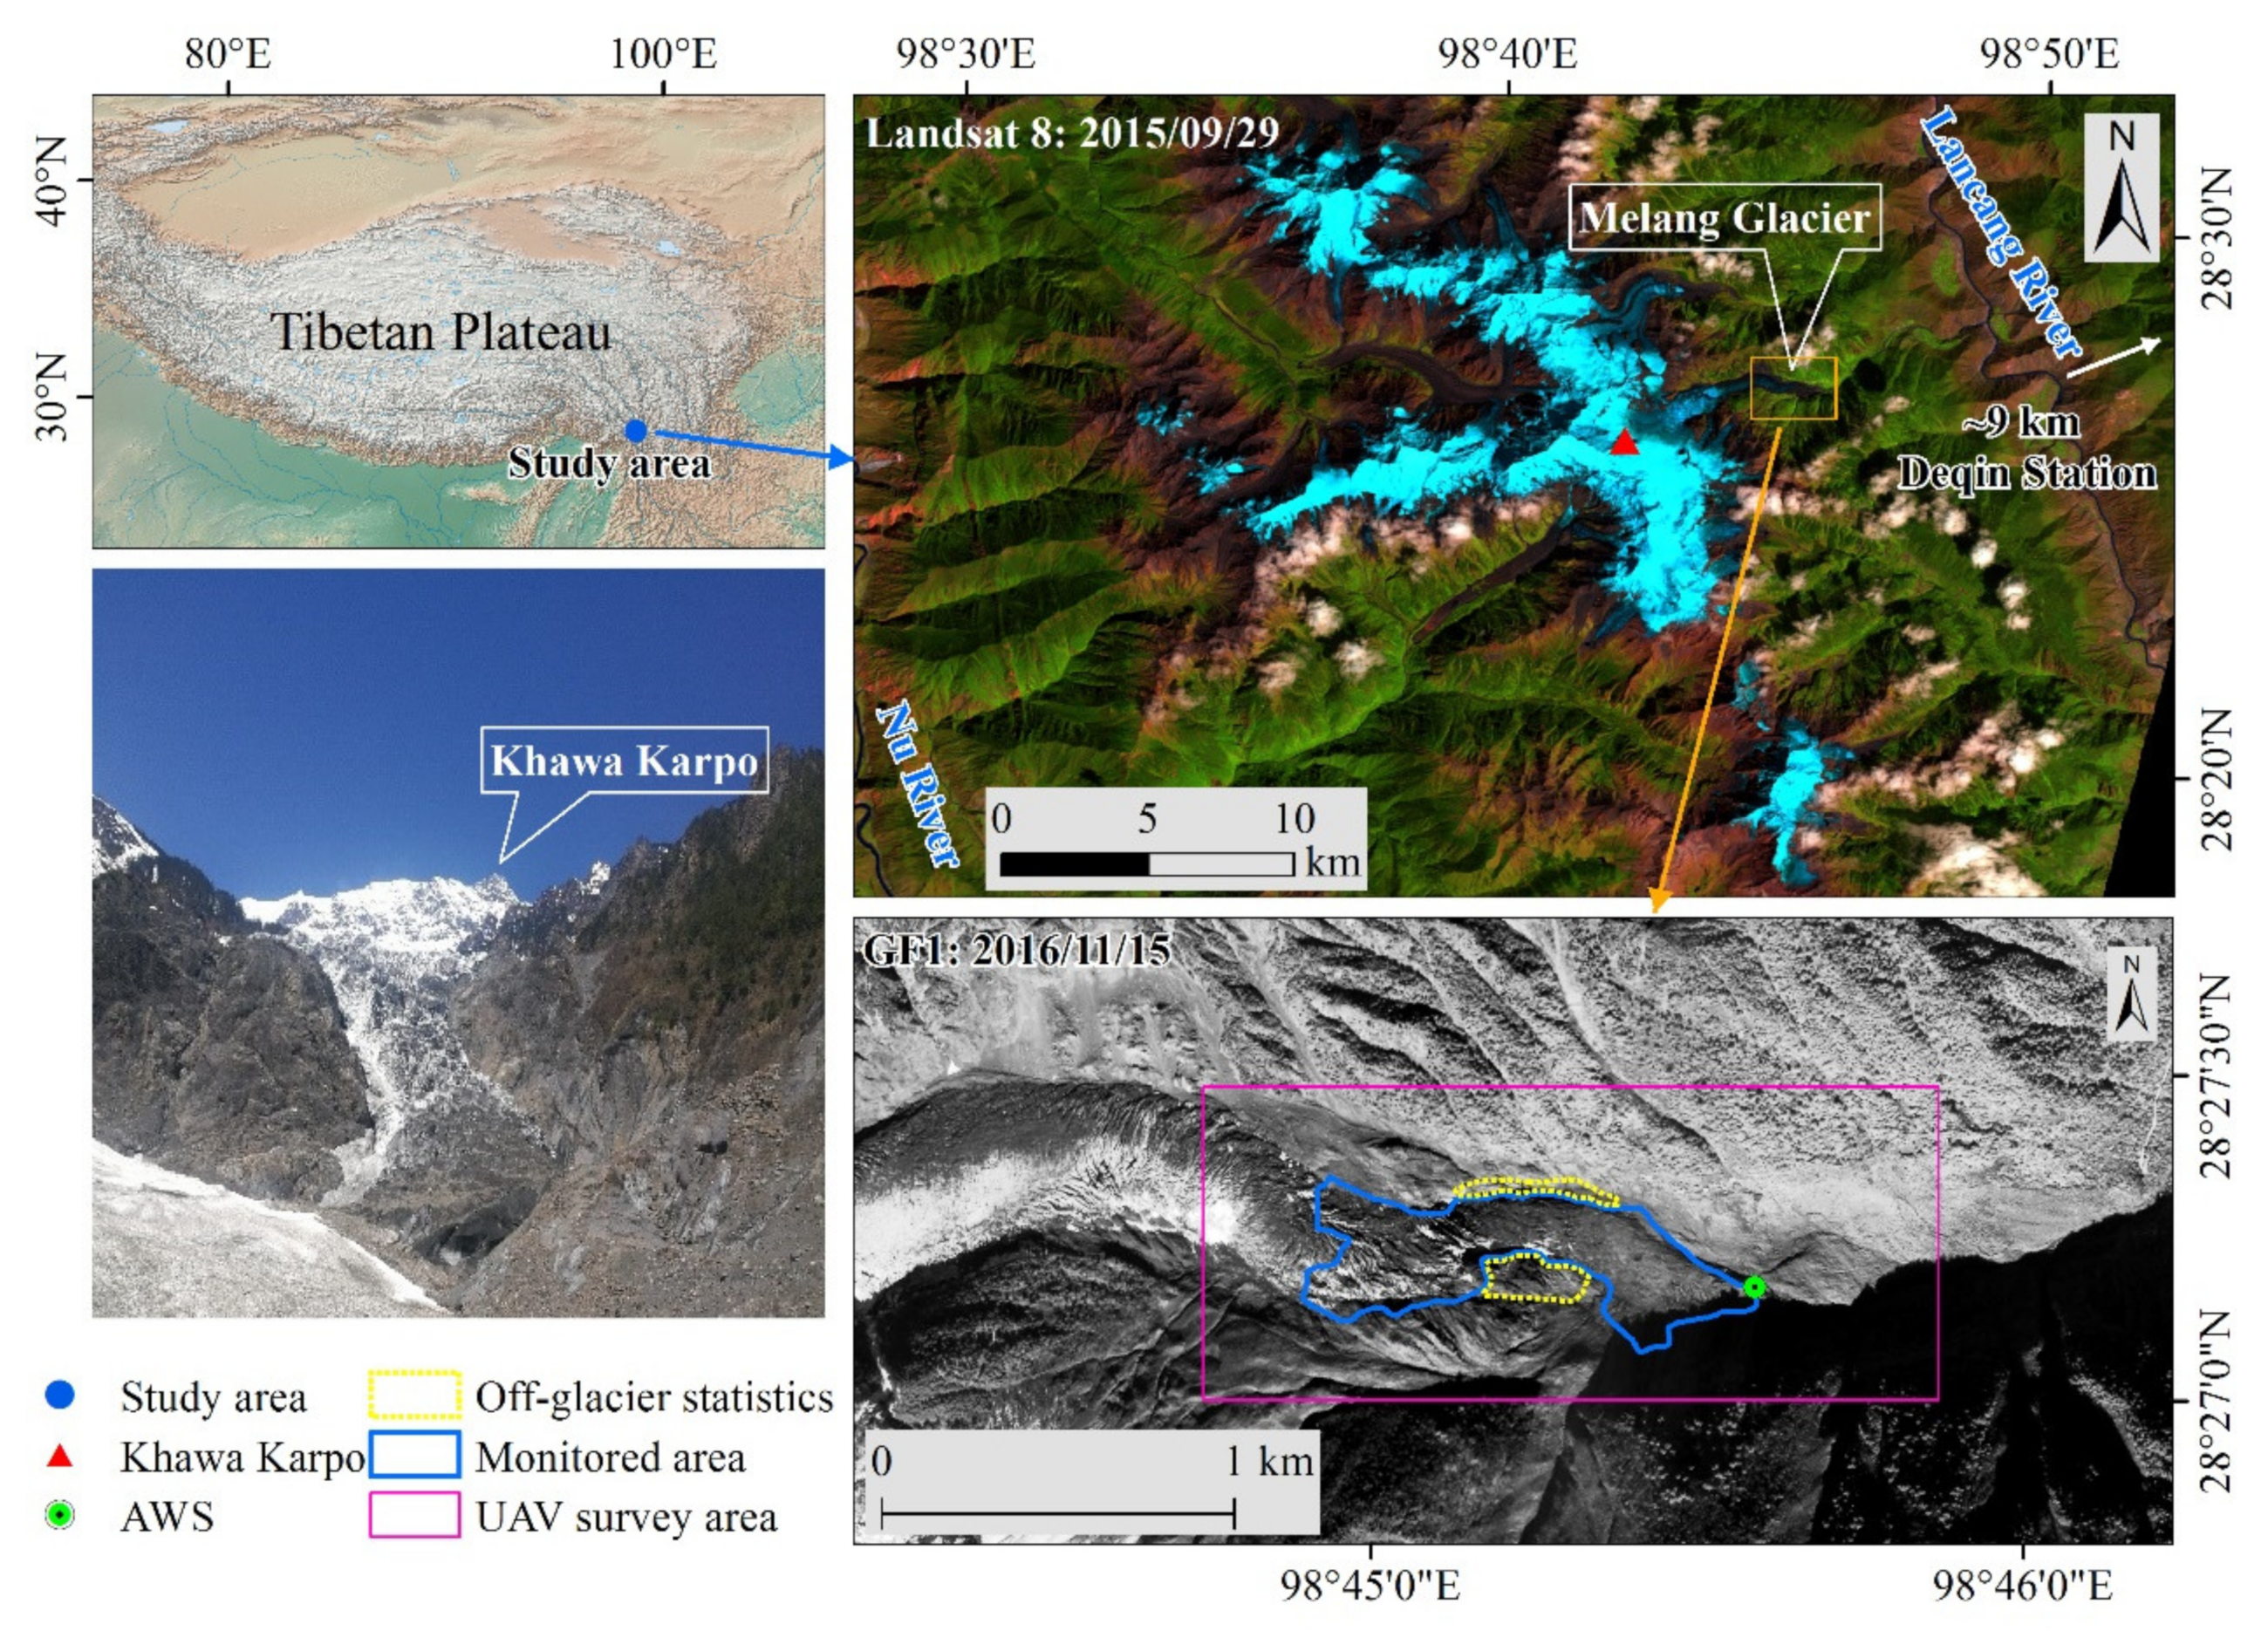
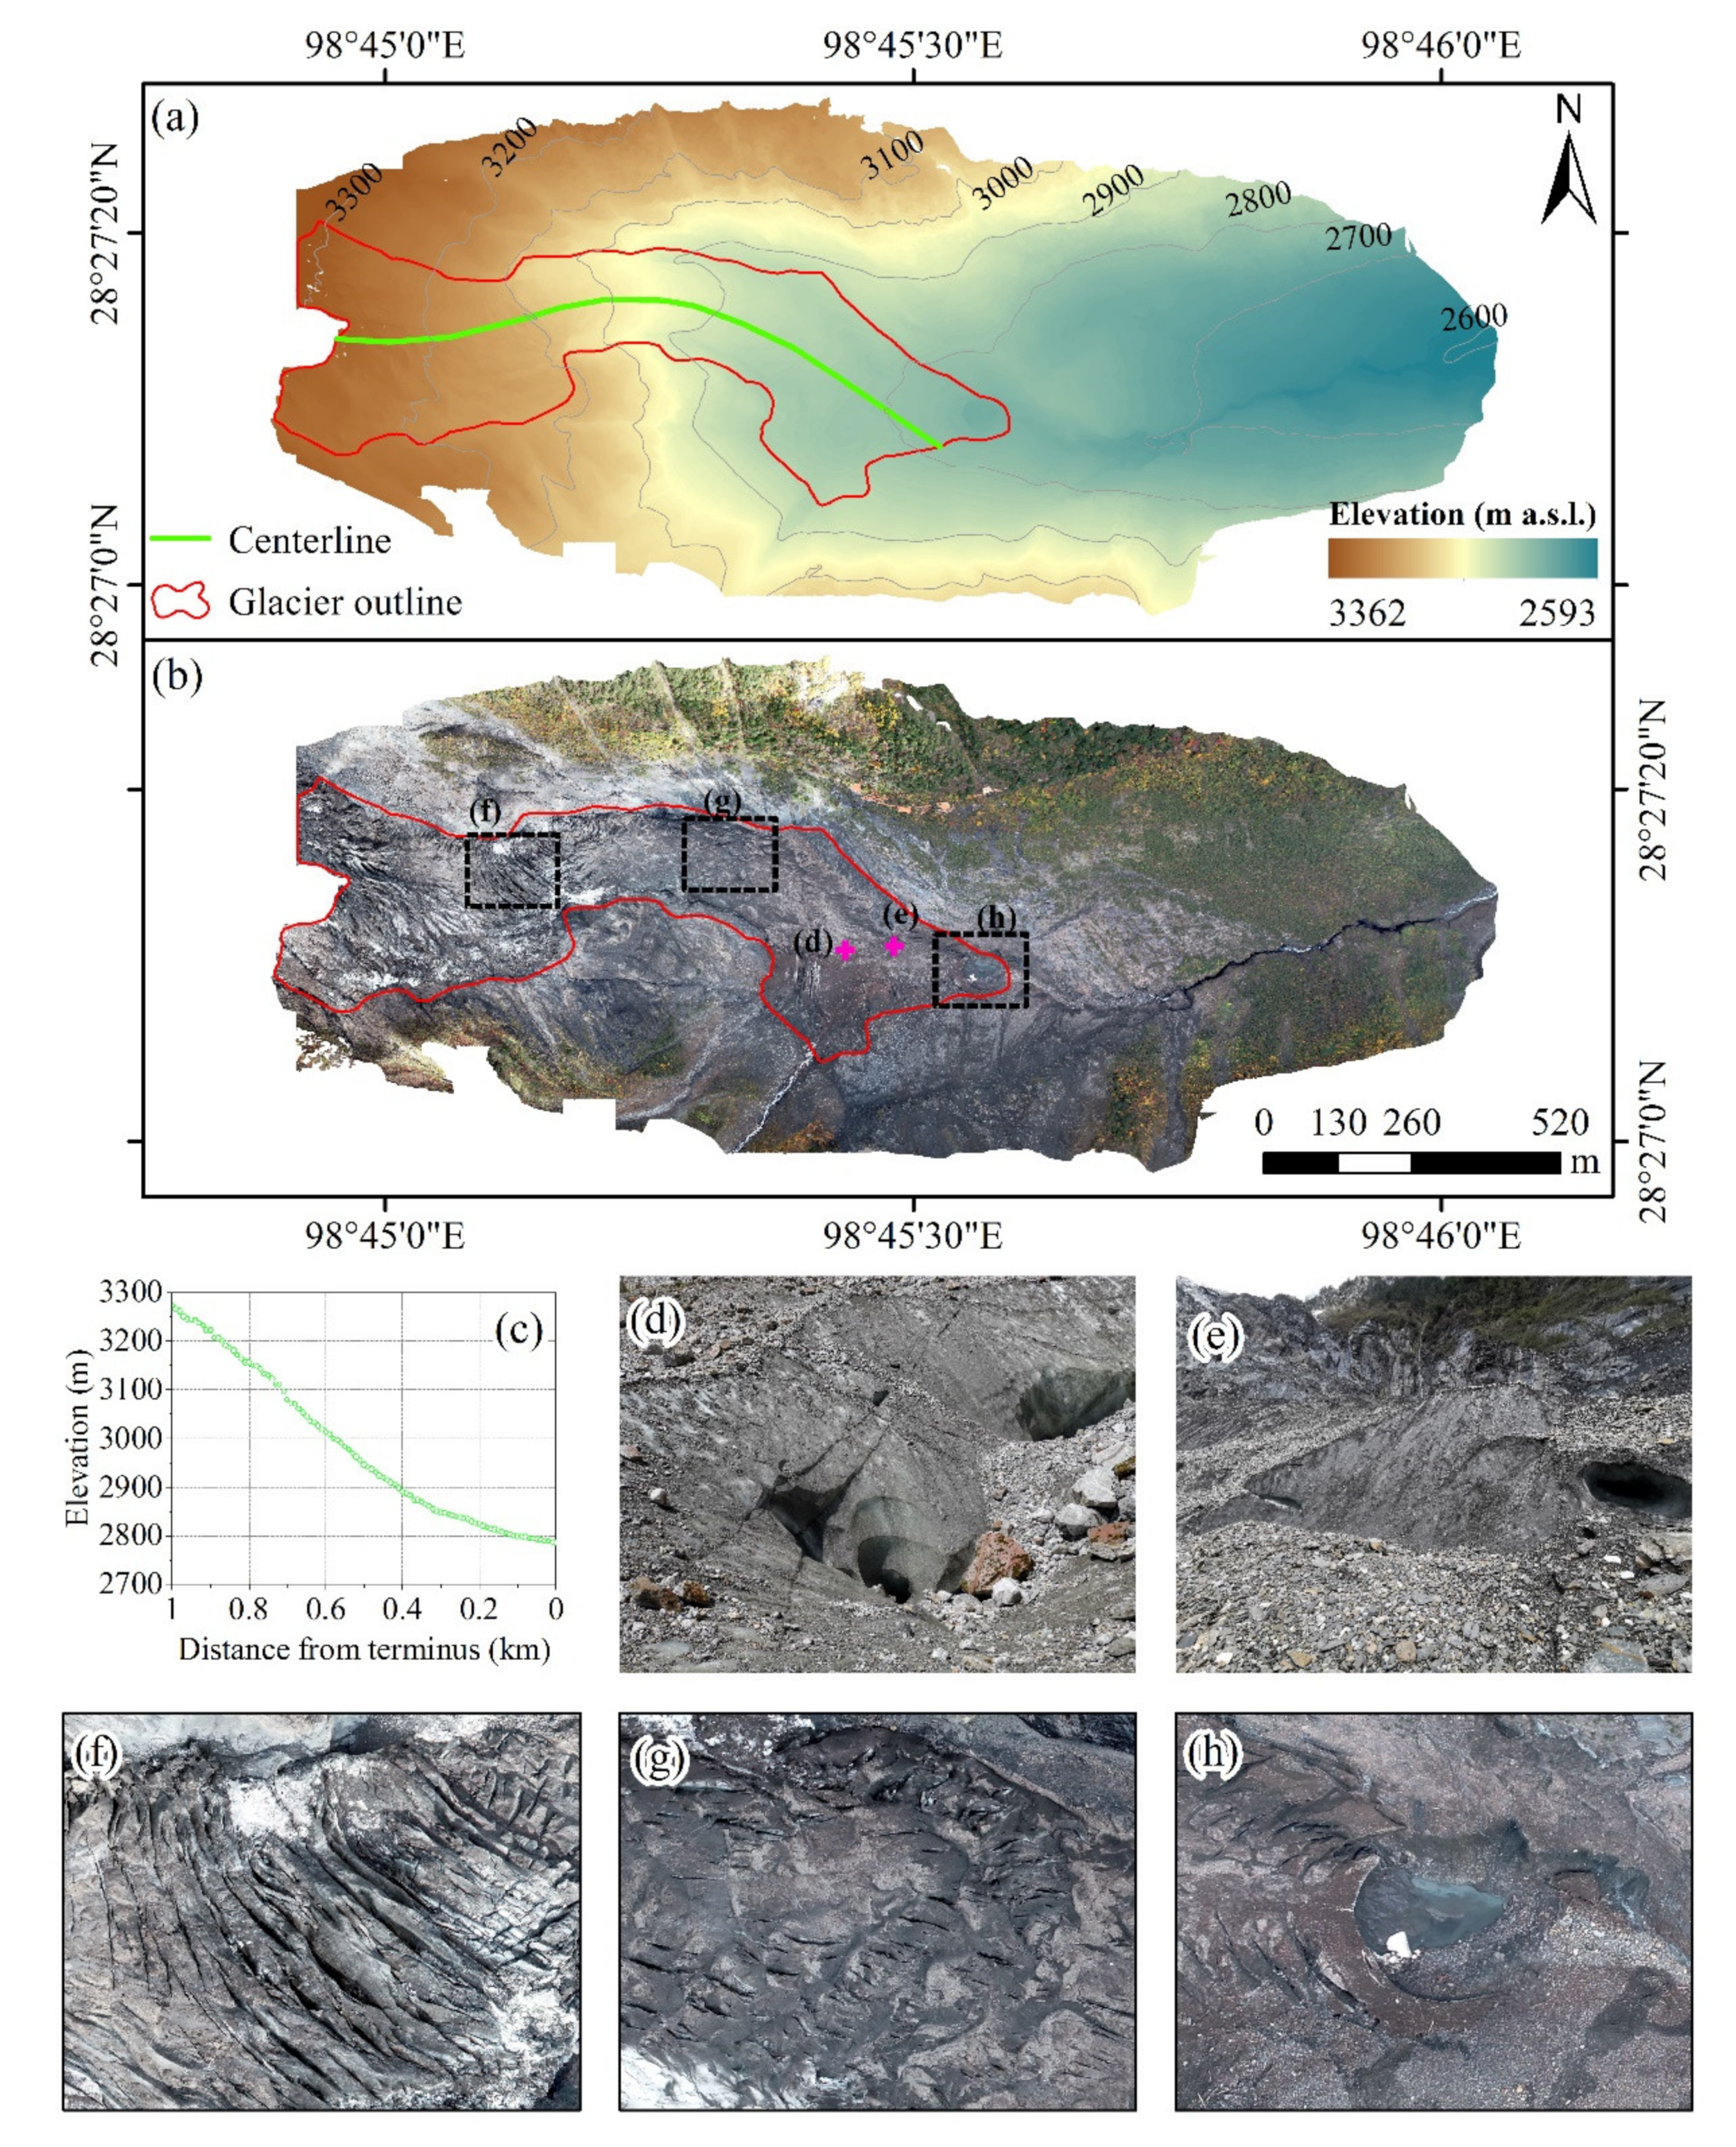
2. Study Site
3. Aerial Survey and Data Processing
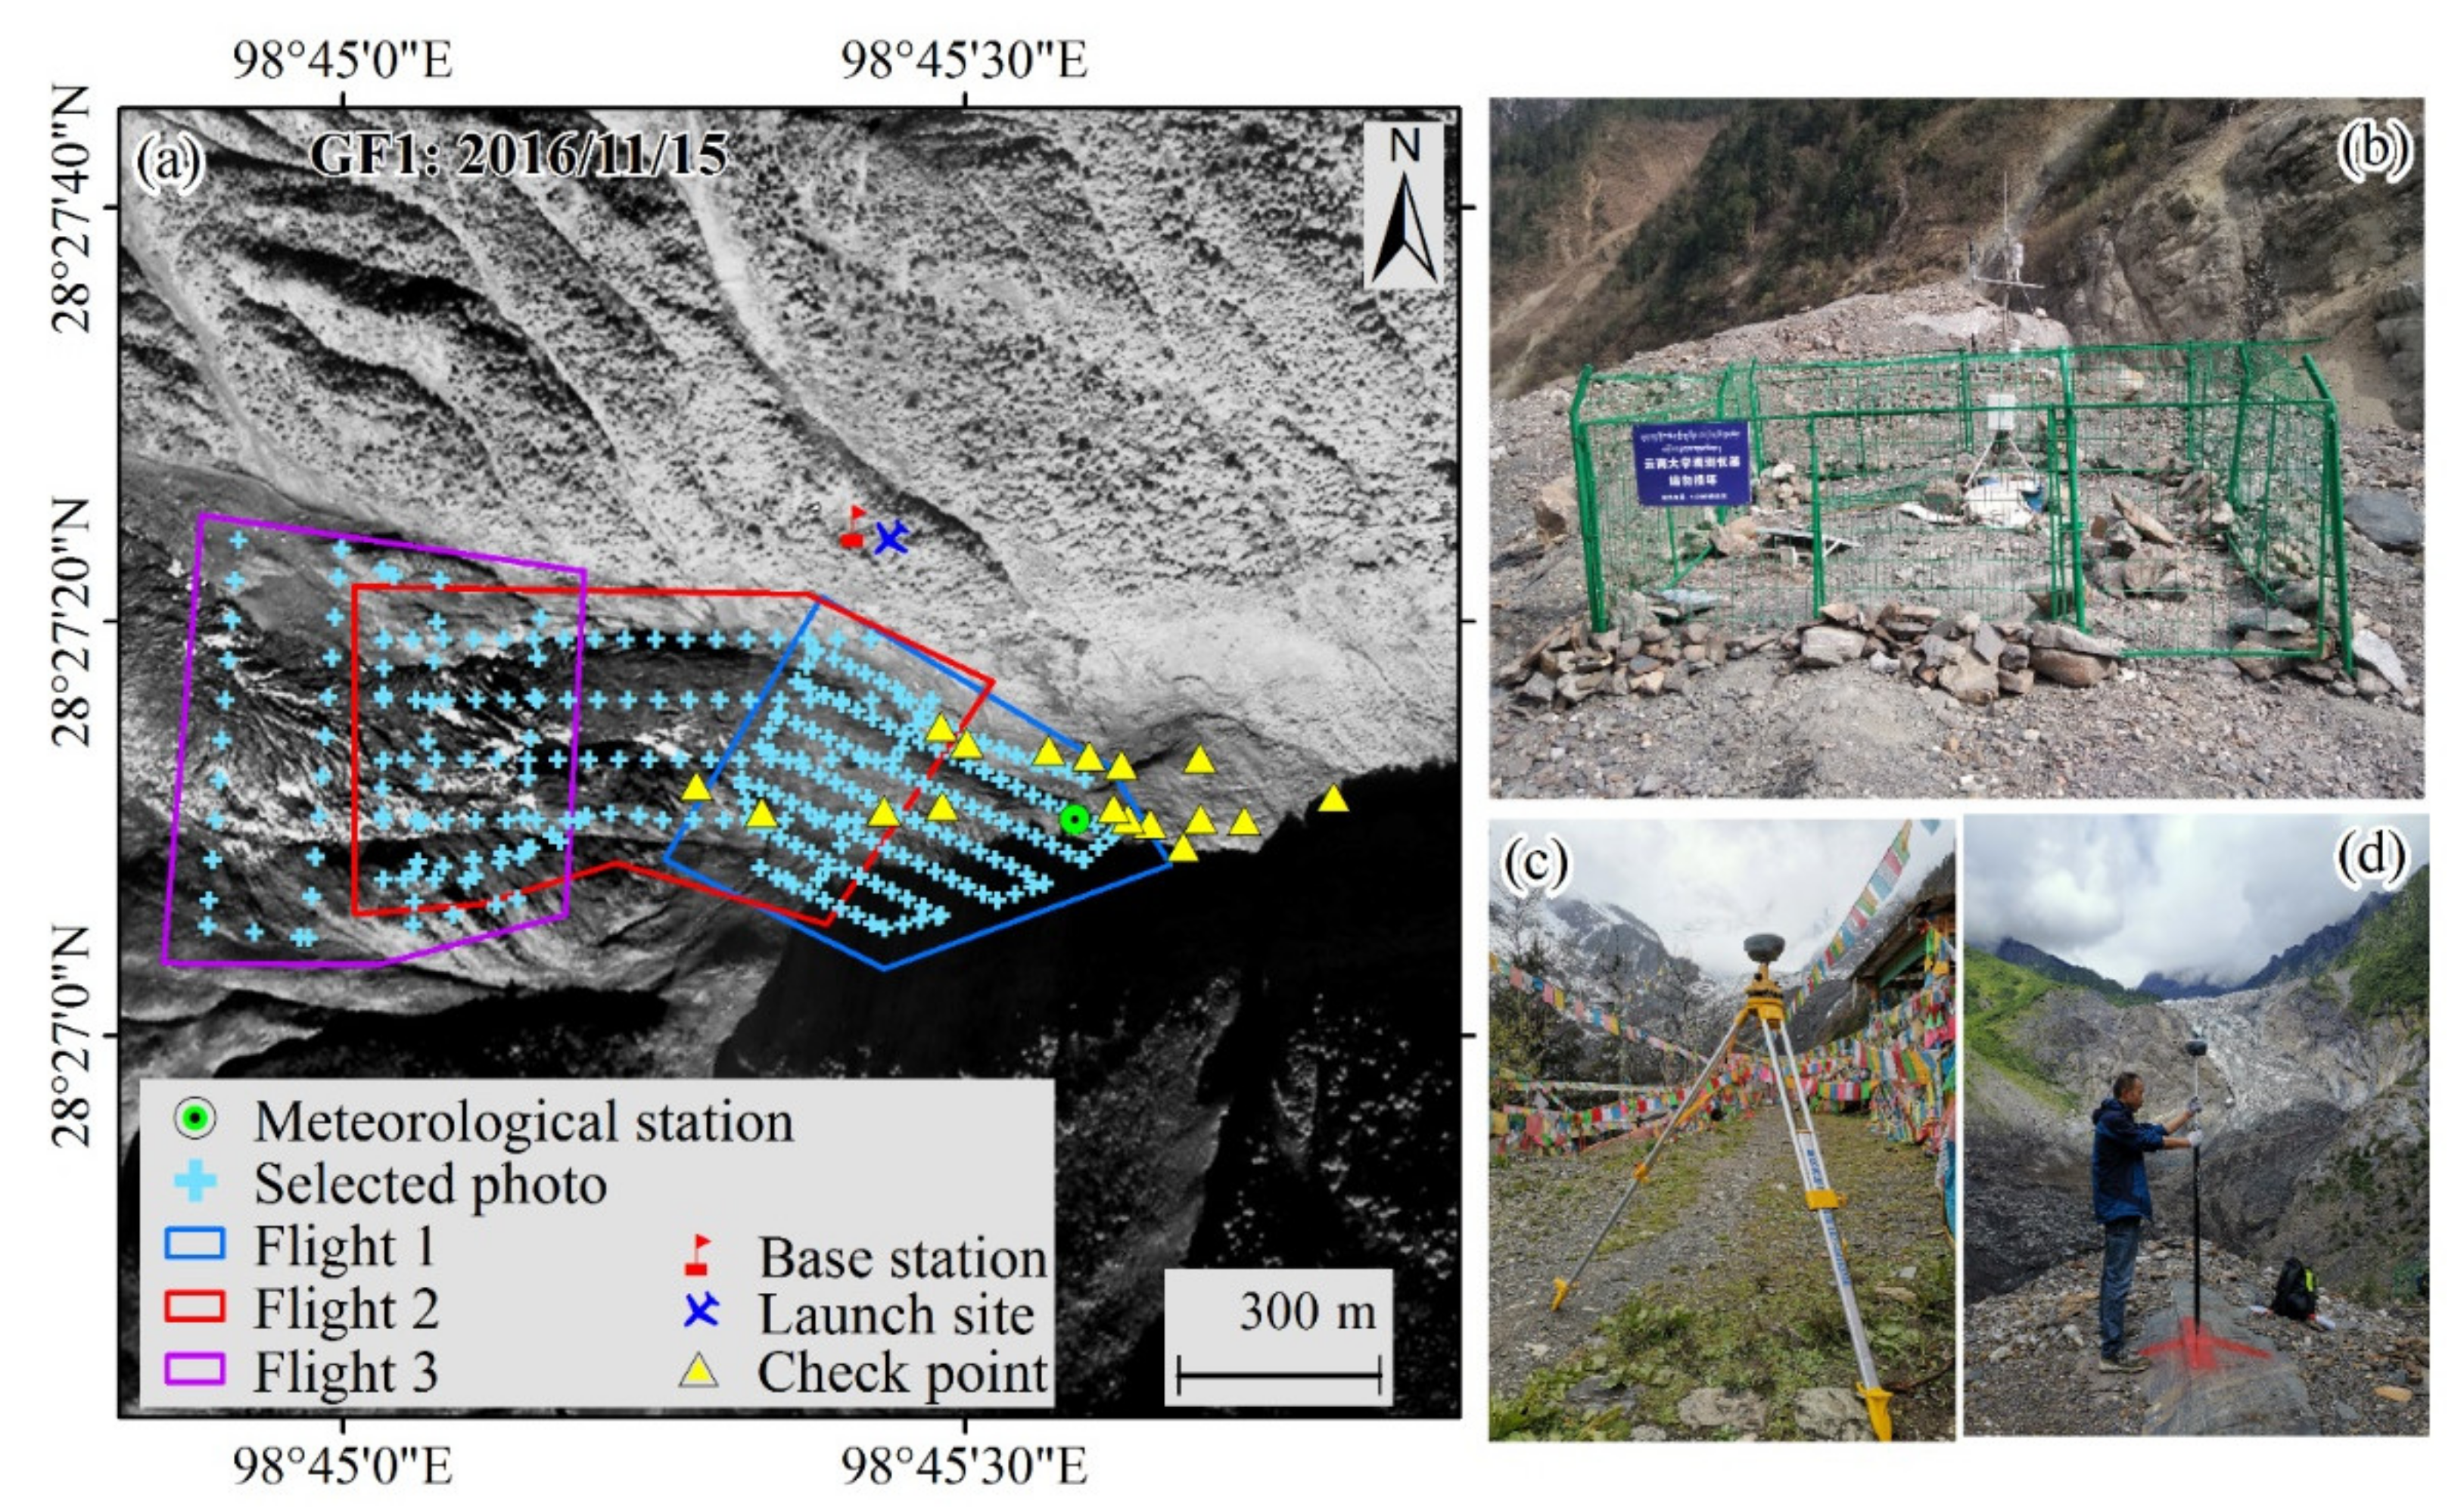
3.1. UAV Flights and Ground Control Points
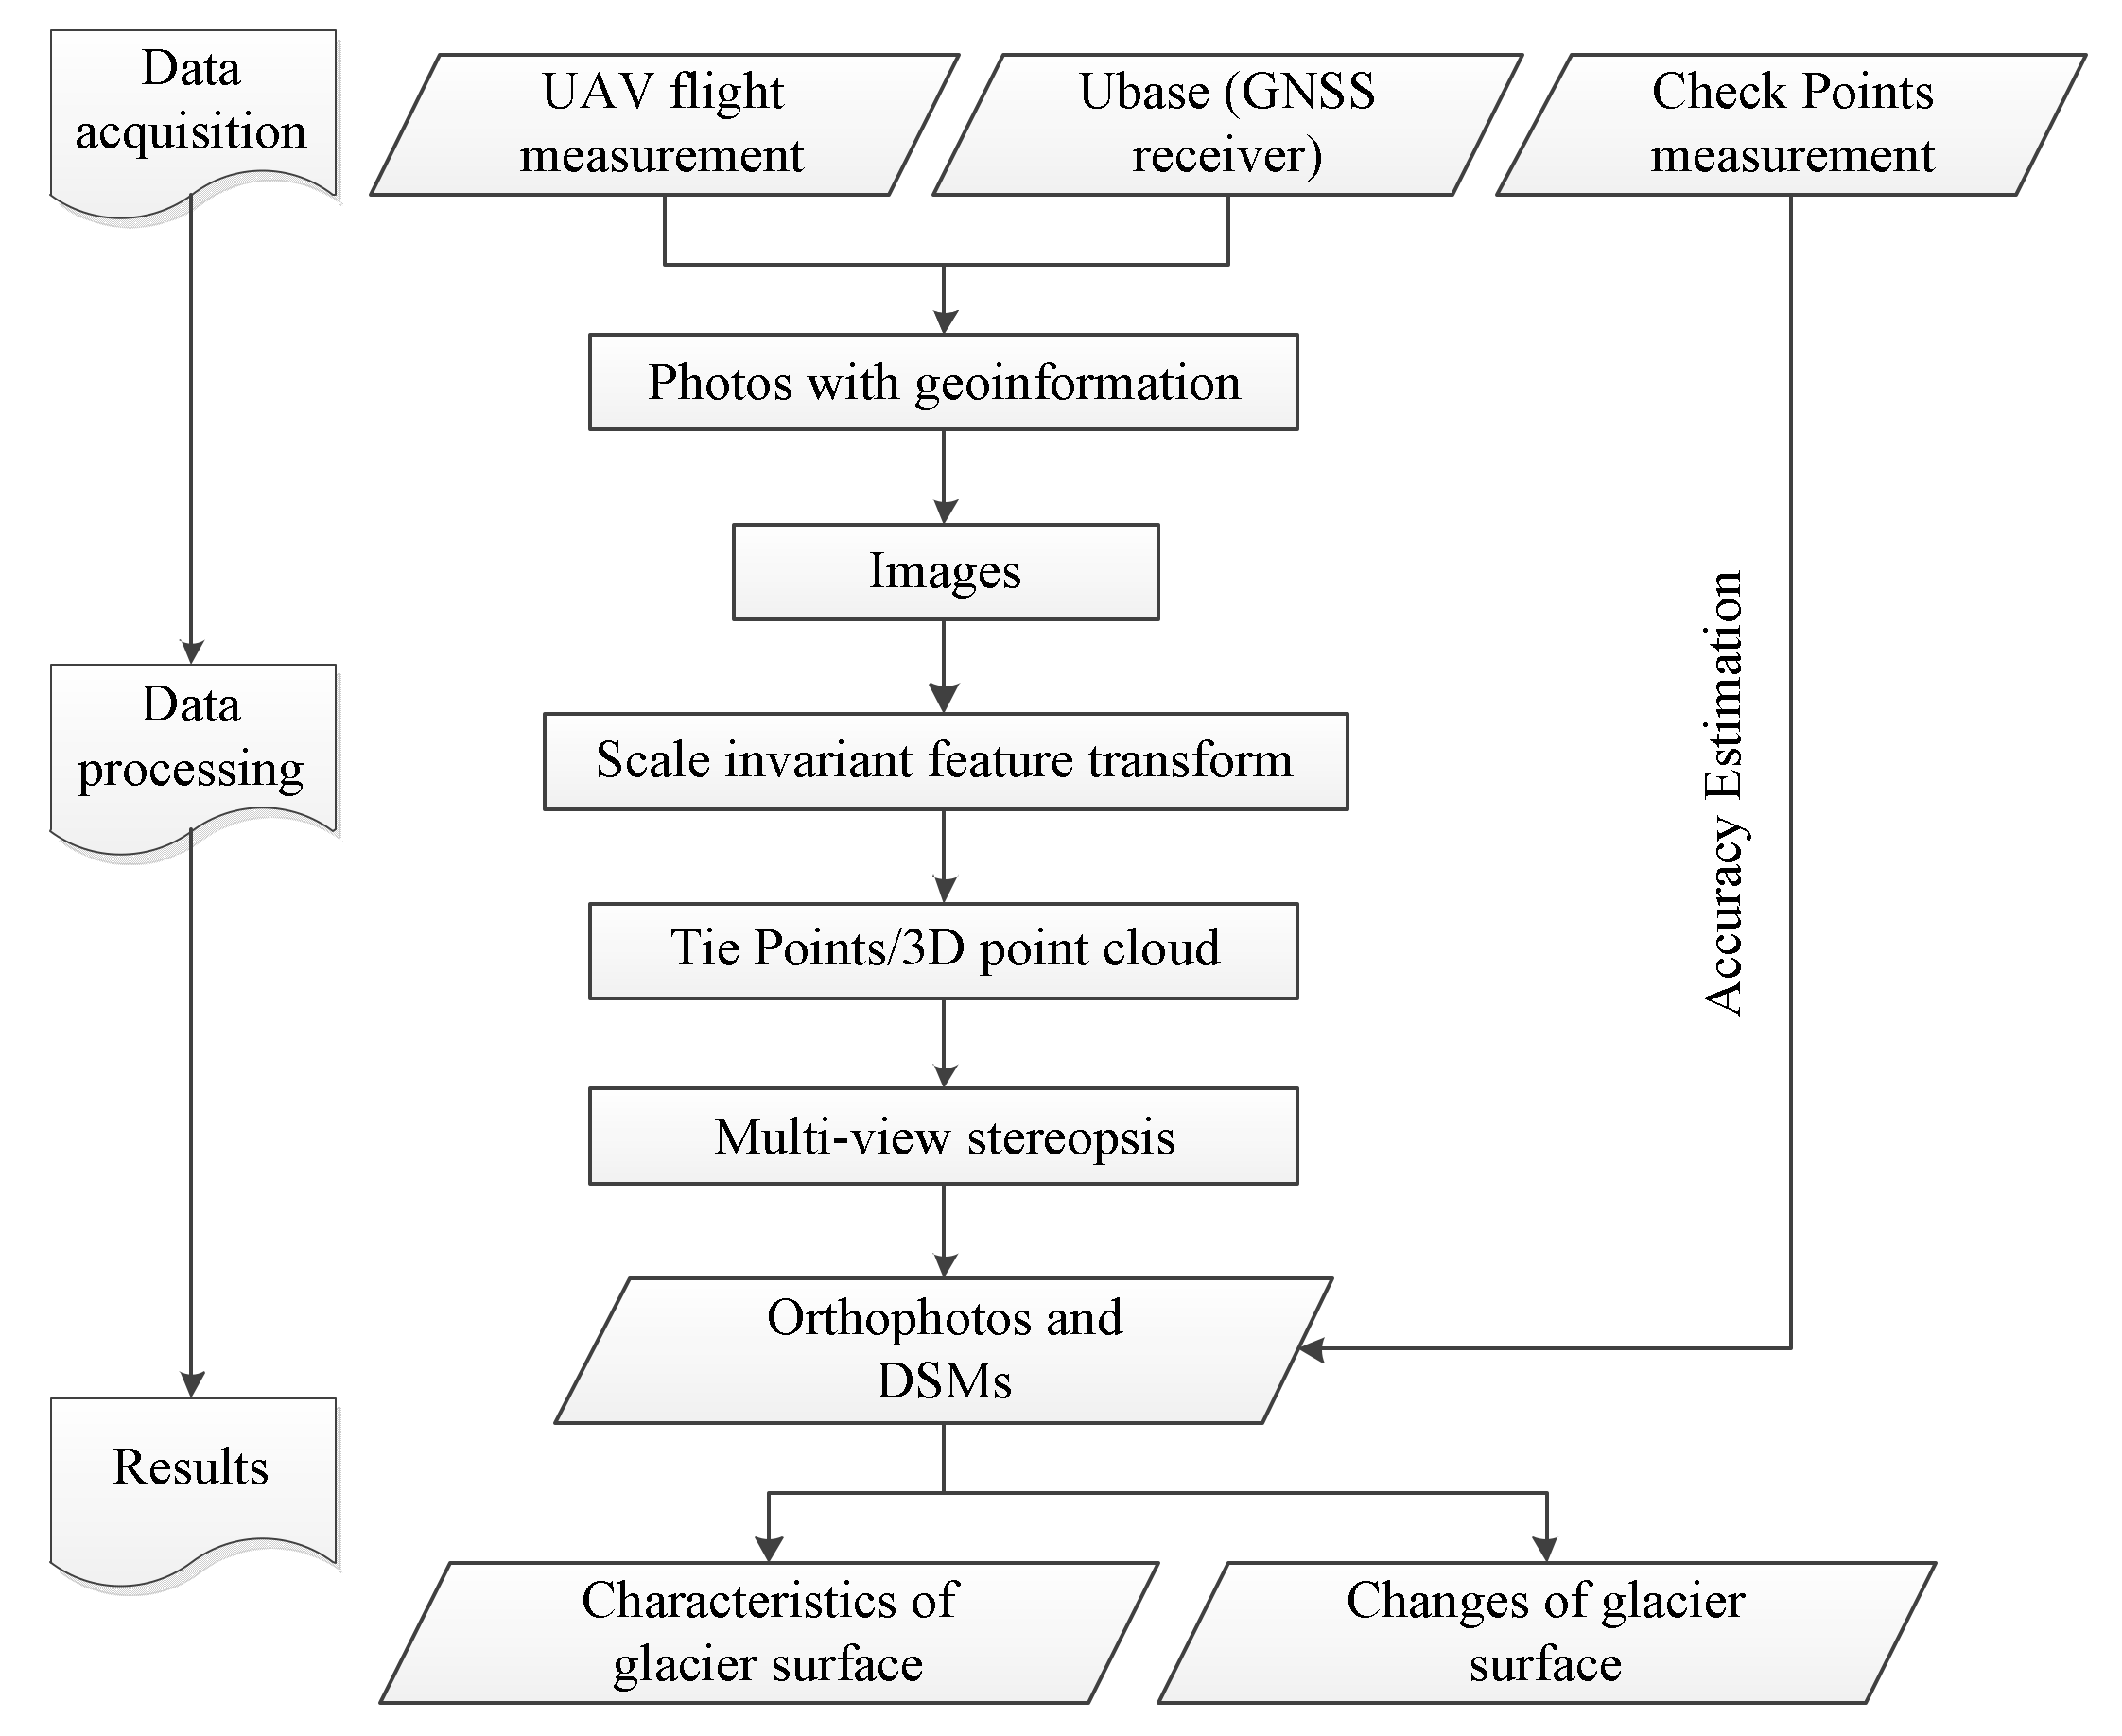
3.2. Data Processing
3.3. Accuracy Estimation
4. Results
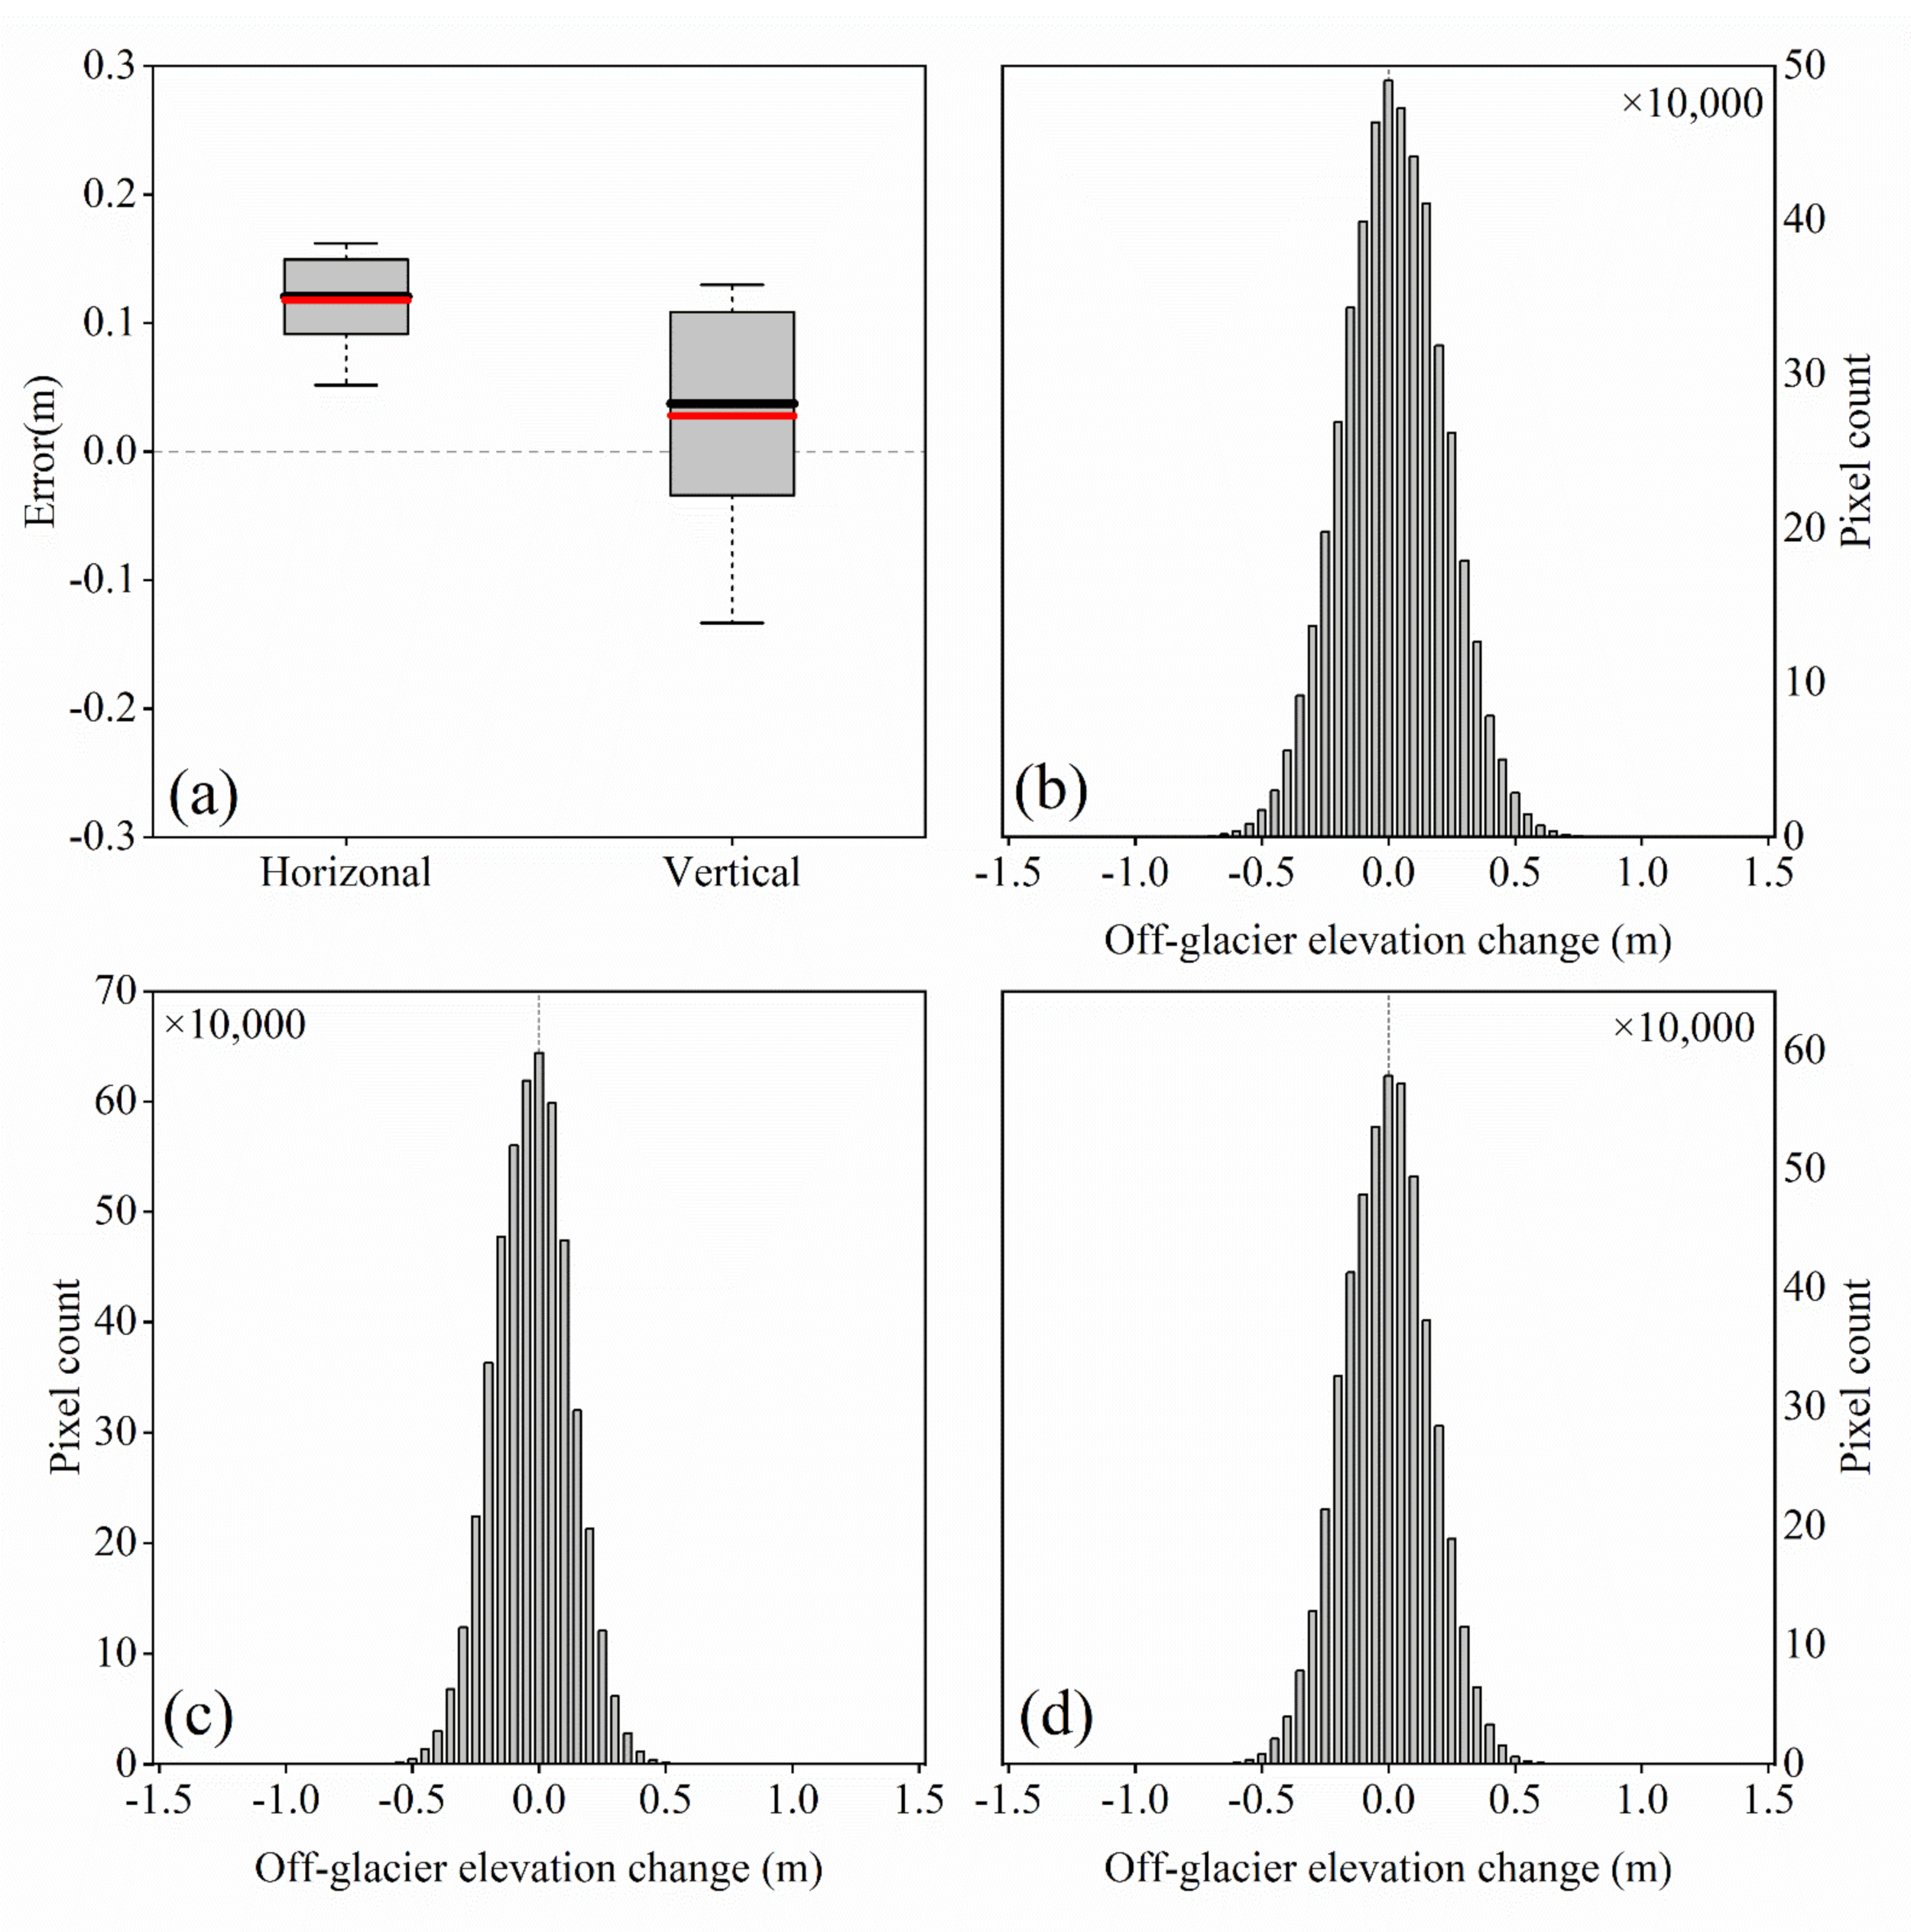
4.1. Uncertainty
4.2. The Characteristics of Glacier Surface
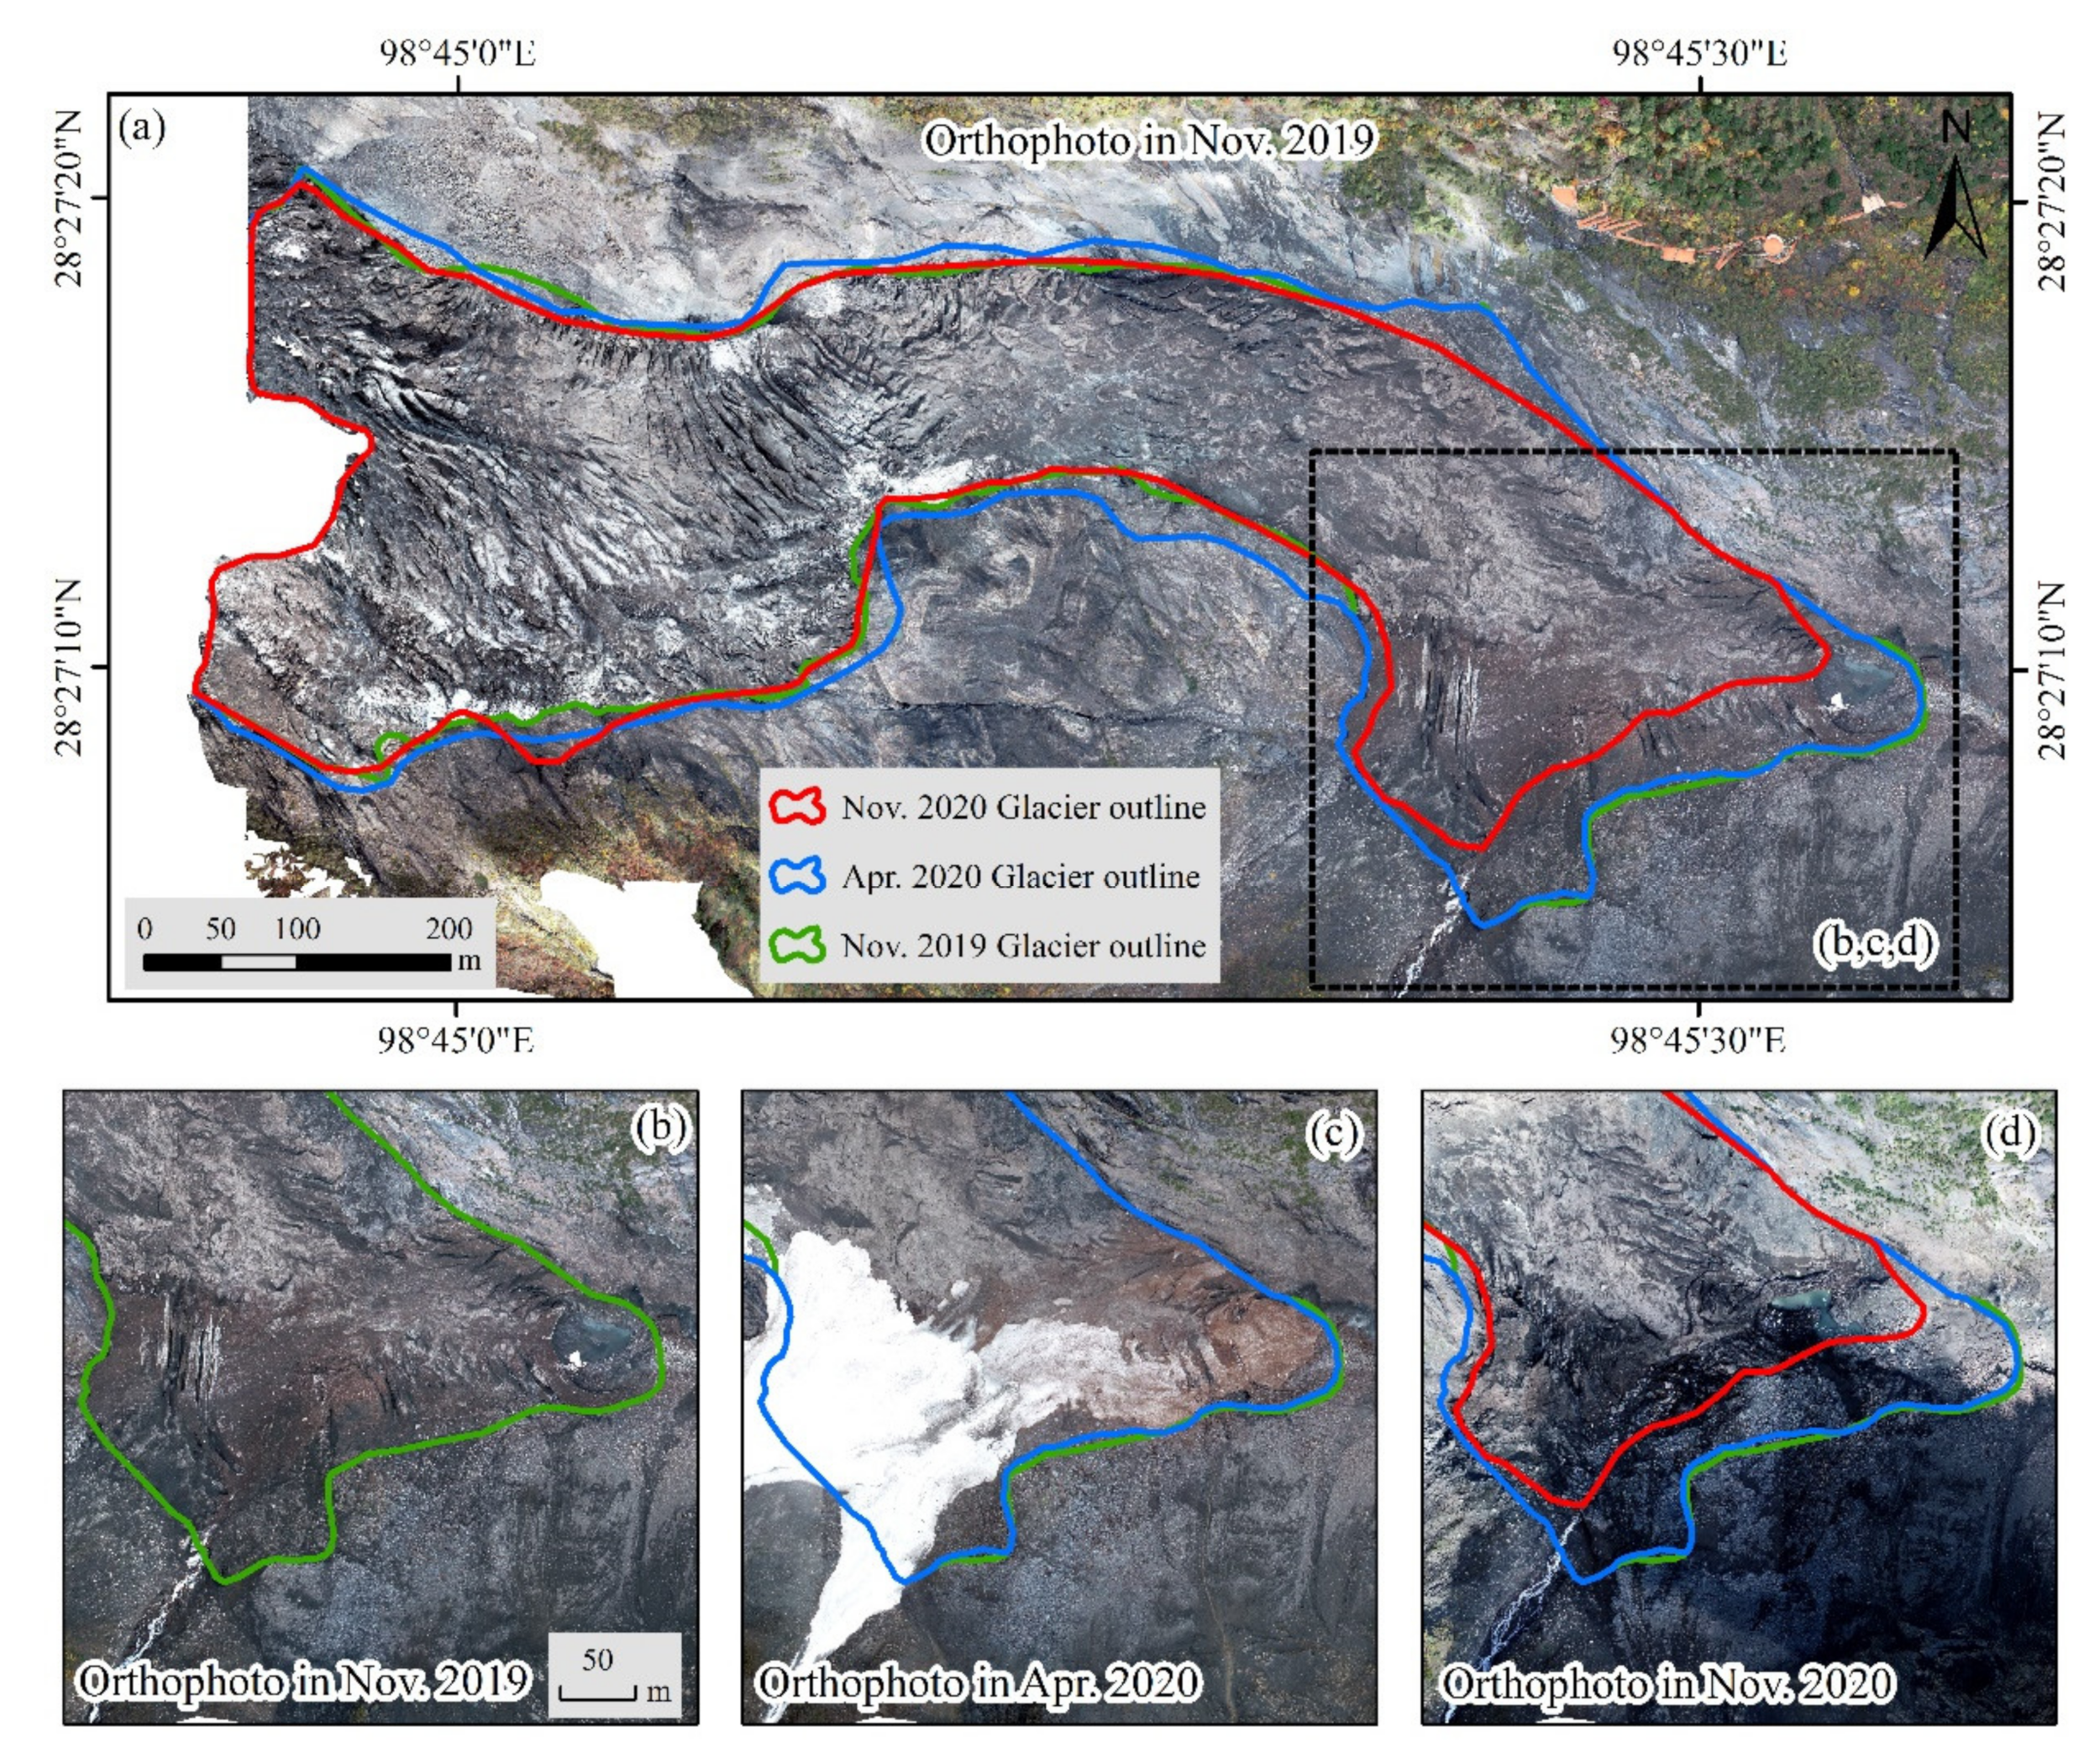
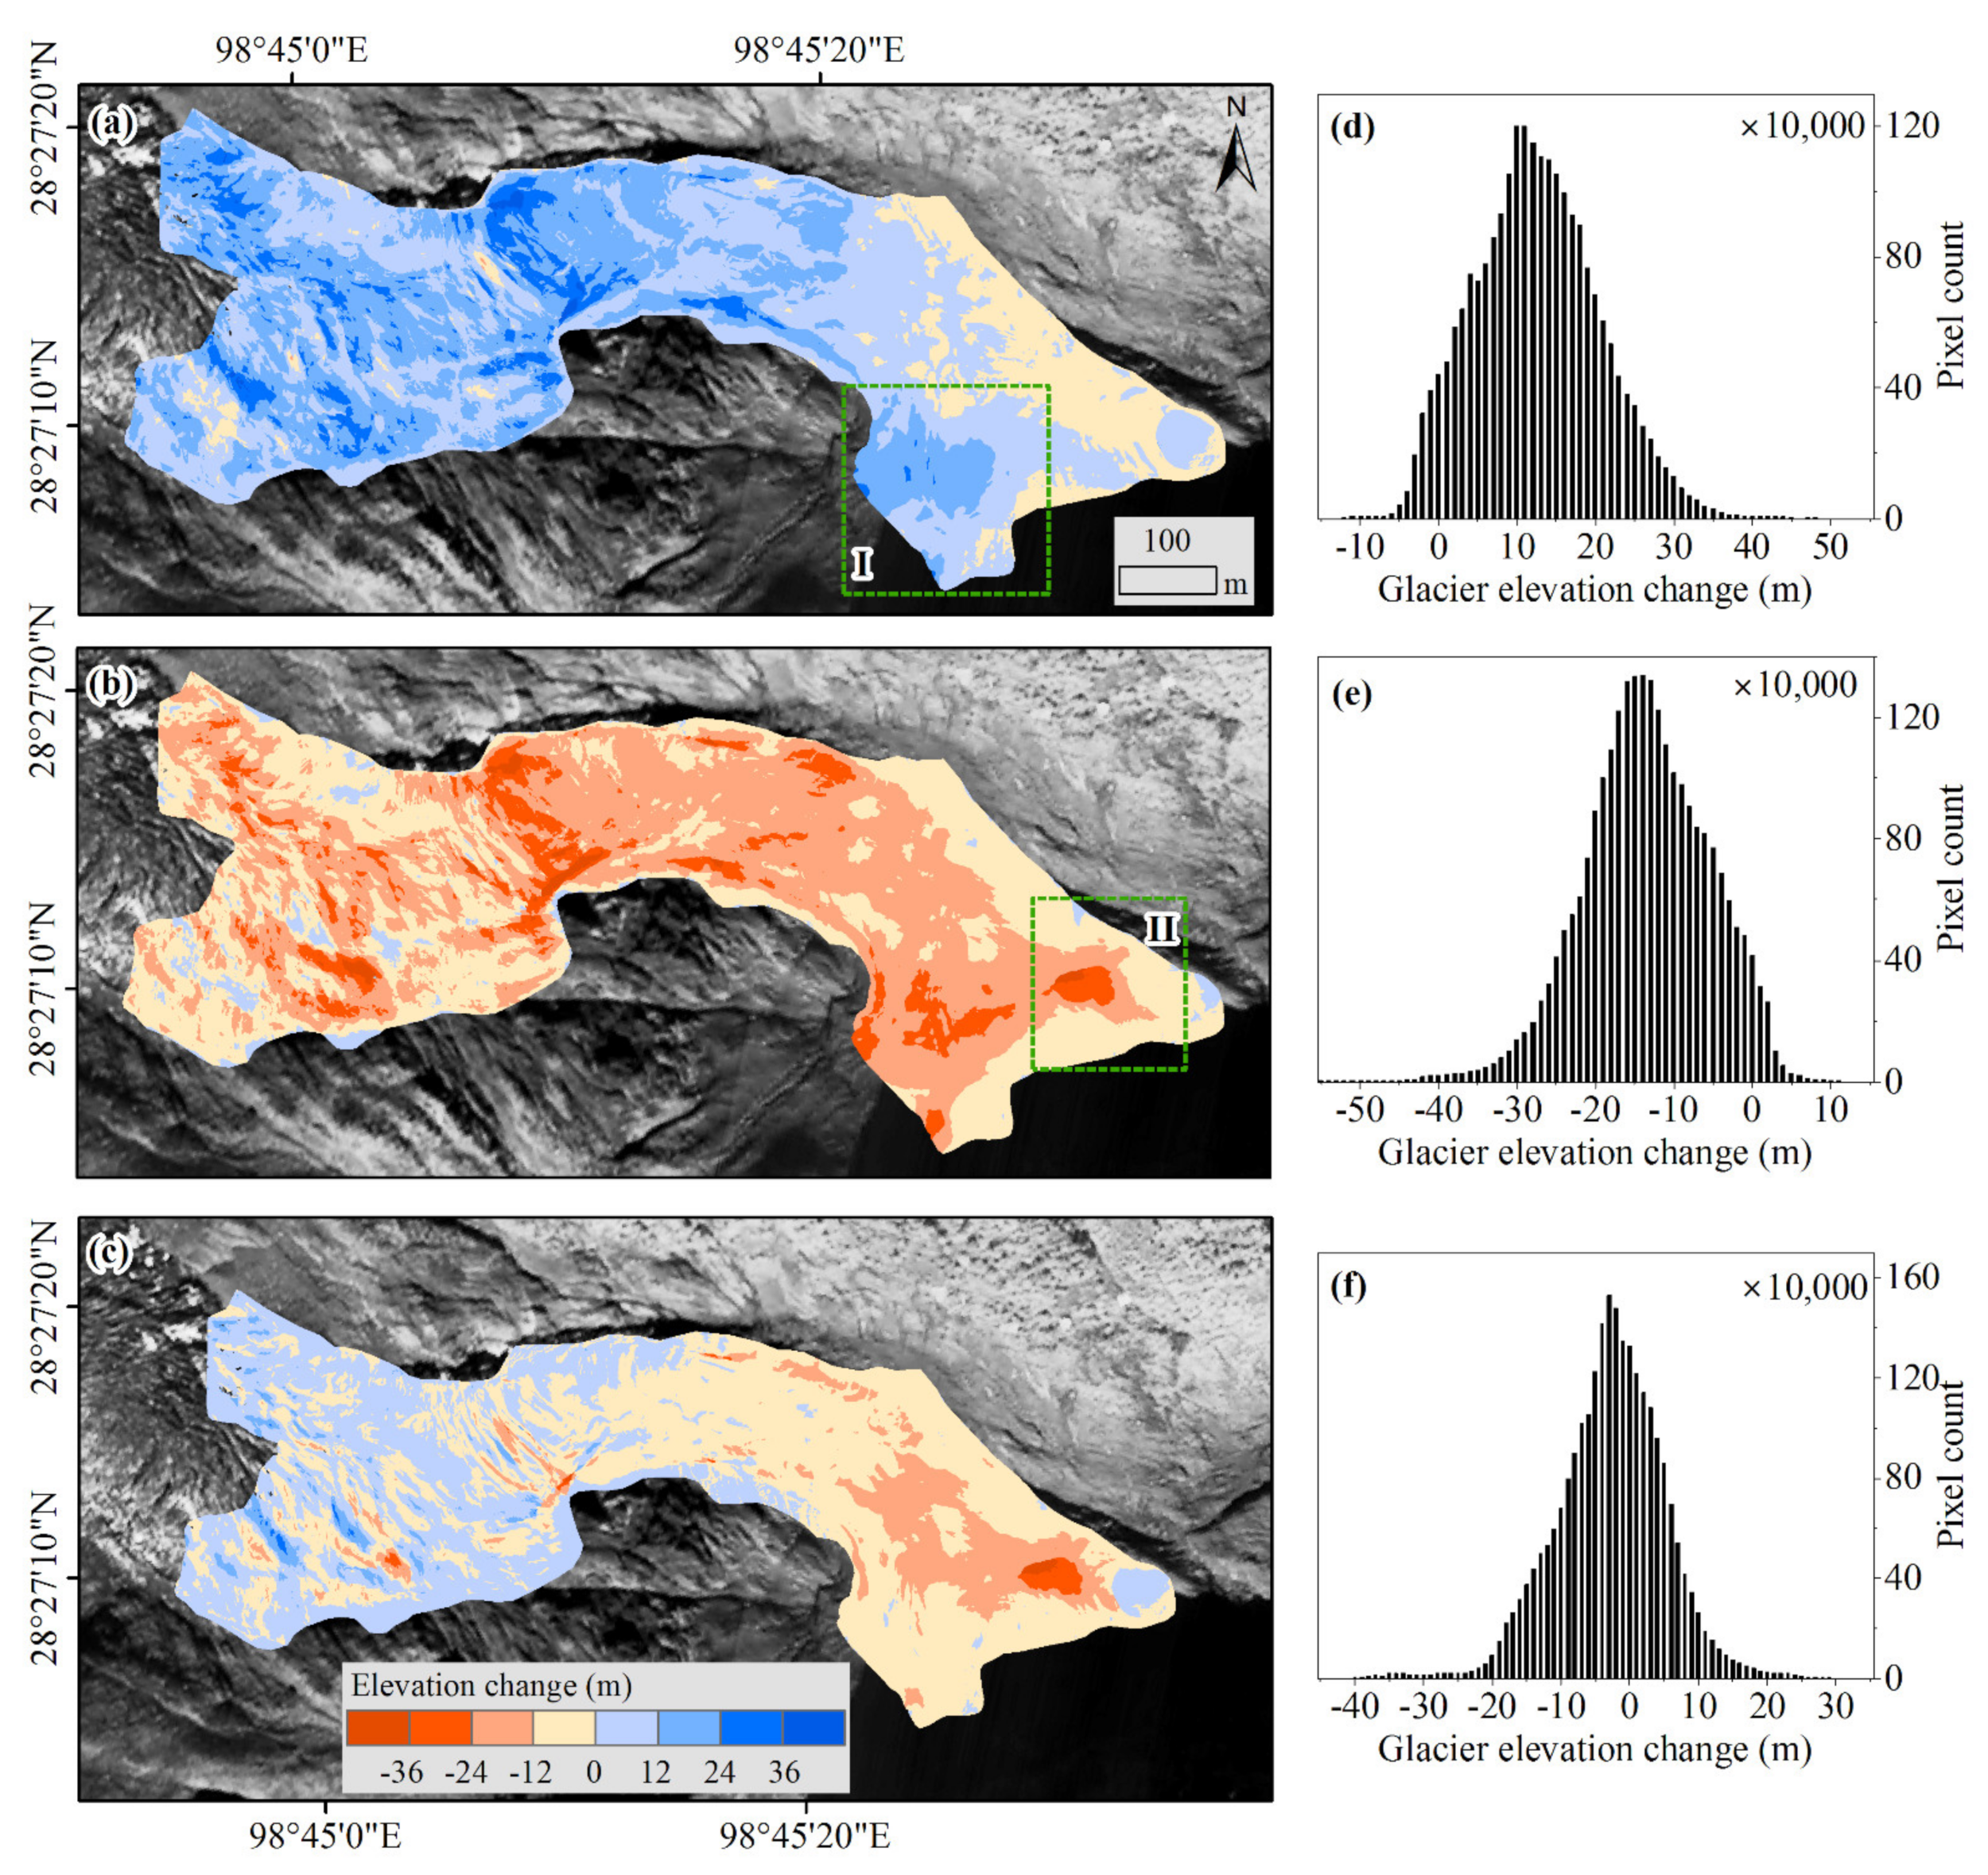
4.3. The Changes in Glacier Surface
5. Discussion
5.1. Glacier Changes and Its Affected Features
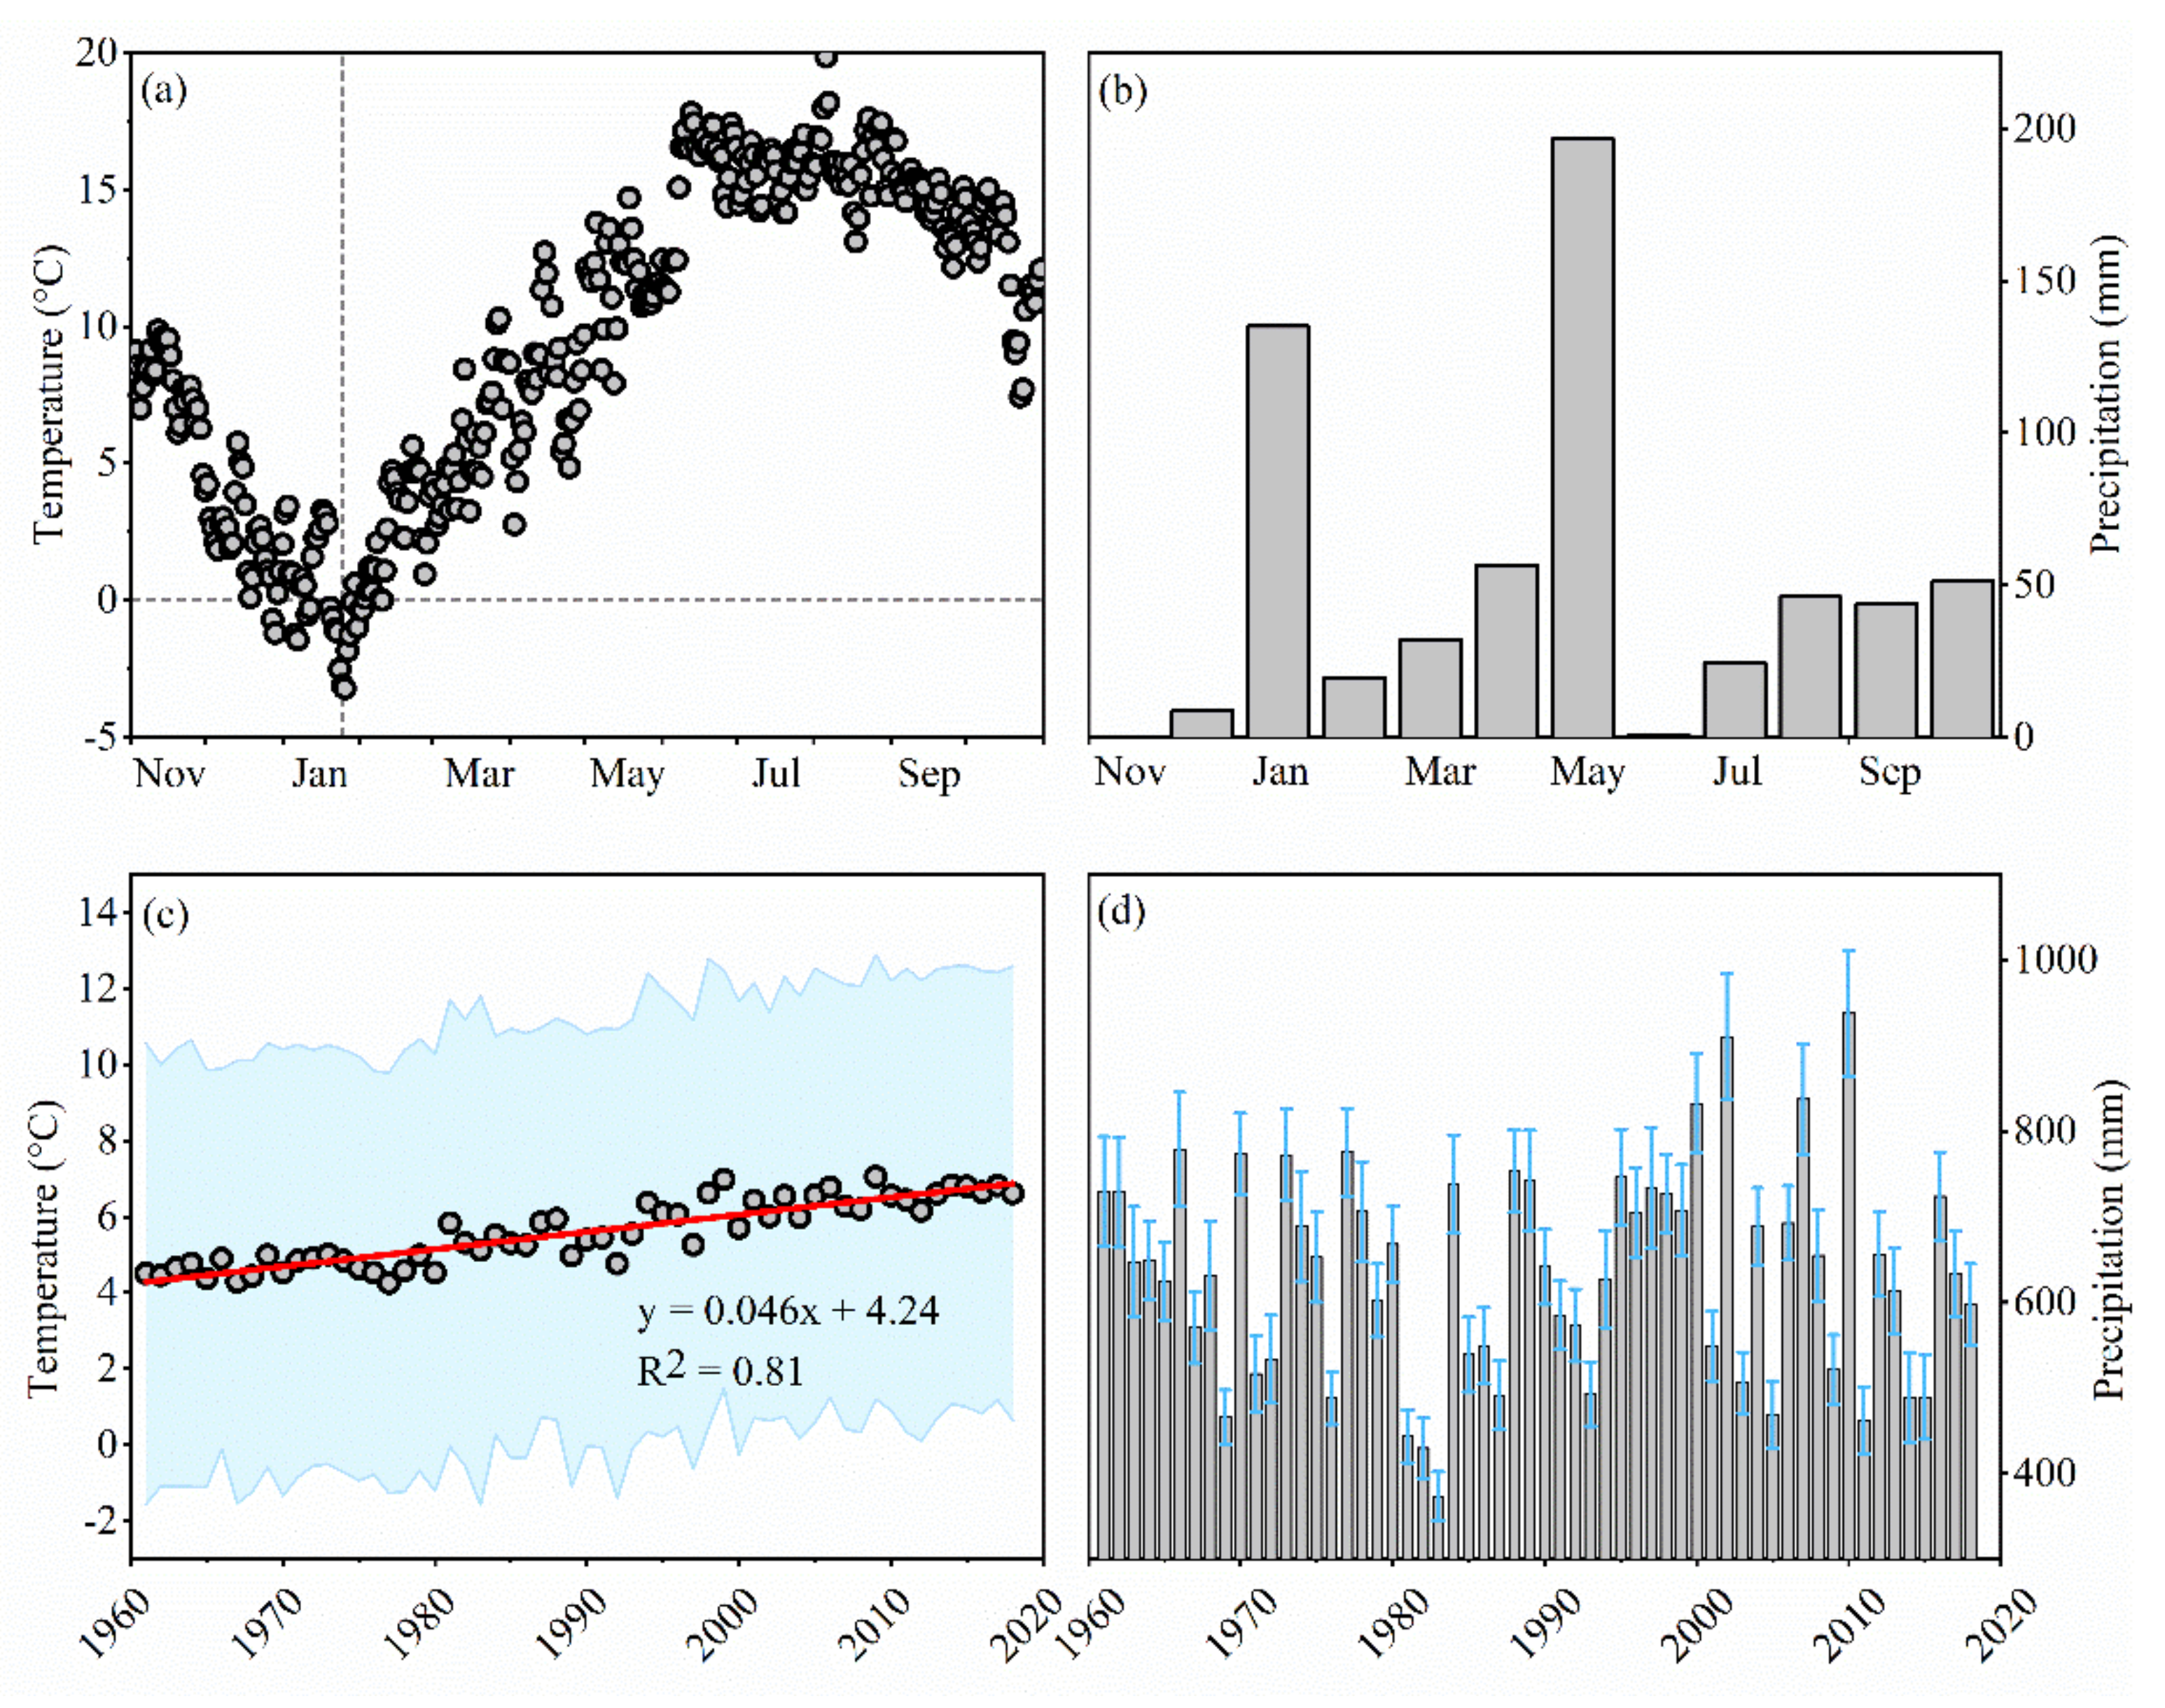
5.2. Climate Background
5.3. Strengths and Weaknesses of the UAV Survey
6. Conclusions and Perspectives
Author Contributions
Funding
Data Availability Statement
Conflicts of Interest
Abbreviations
| UAV | unmanned aerial vehicles |
| DSM | digital surface model |
| SAR | synthetic aperture radar |
| HMA | High Mountain Asia |
| InSAR | SAR interferometry |
| RTK | real-time kinematic |
| GSD | ground sample distance |
| CP | checkpoint |
| RMS | root mean square |
| GNSS | global navigation satellite system |
| GPS | global positioning system |
| RTK-GPS | real-time kinematic GPS |
| P4R | Phantom 4 RTK |
| PPK | postprocessed kinematic |
| SGA | surveyed glacier area |
| CMDSC | China Meteorological Data Service Centre |
| CMOS | complementary metal oxide semiconductor |
| FCGI | First Chinese Glacier Inventory |
References
- Oerlemans, J. Extracting a climate signal from 169 glacier records. Science 2005, 308, 675–677. [Google Scholar] [CrossRef] [PubMed] [Green Version]
- Immerzeel, W.W.; Lutz, A.F.; Andrade, M.; Bahl, A.; Biemans, H.; Bolch, T.; Hyde, S.; Brumby, S.; Davies, B.J.; Elmore, A.C.; et al. Importance and vulnerability of the world’s water towers. Nature 2020, 577, 364–369. [Google Scholar] [CrossRef] [PubMed]
- IPCC. Climate Change 2013: The Physical Science Basis; Contribution of Working Group I to the Fifth Assessment Report of the Intergovernmental Panel on Climate Change; Stocker, T.F., Qin, D., Plattner, G.K., Eds.; Cambridge University Press: Cambridge, UK; New York, NY, USA, 2013; pp. 1–30. [Google Scholar]
- Sommer, C.; Malz, P.; Seehaus, T.C.; Lippl, S.; Zemp, M.; Braun, M.H. Rapid glacier retreat and downwasting throughout the European Alps in the early 21(st) century. Nat. Commun. 2020, 11, 3209. [Google Scholar] [CrossRef] [PubMed]
- Barry, R.G. The status of research on glaciers and global glacier recession: A review. Prog. Phys. Geogr. 2006, 30, 285–306. [Google Scholar] [CrossRef]
- Braun, M.H.; Malz, P.; Sommer, C.; Farias-Barahona, D.; Sauter, T.; Casassa, G.; Soruco, A.; Skvarca, P.; Seehaus, T.C. Constraining glacier elevation and mass changes in South America. Nat. Clim. Change 2019, 9, 130–136. [Google Scholar] [CrossRef]
- Brun, F.; Berthier, E.; Wagnon, P.; Kaab, A.; Treichler, D. A spatially resolved estimate of High Mountain Asia glacier mass balances, 2000–2016. Nat. Geosci. 2017, 10, 668–673. [Google Scholar] [CrossRef]
- Shean, D.E.; Bhushan, S.; Montesano, P.; Rounce, D.R.; Arendt, A.; Osmanoglu, B. A Systematic, Regional Assessment of High Mountain Asia Glacier Mass Balance. Front. Earth Sci. 2020, 7, 363. [Google Scholar] [CrossRef] [Green Version]
- Chen, C.; Zhang, L.; Xiao, T.; He, J. Barrier lake bursting and flood routing in the Yarlung Tsangpo Grand Canyon in October 2018. J. Hydrol. 2020, 583, 124603. [Google Scholar] [CrossRef]
- Bhambri, R.; Watson, C.S.; Hewitt, K.; Haritashya, U.K.; Kargel, J.S.; Pratap Shahi, A.; Chand, P.; Kumar, A.; Verma, A.; Govil, H. The hazardous 2017–2019 surge and river damming by Shispare Glacier, Karakoram. Sci. Rep. 2020, 10, 4685. [Google Scholar] [CrossRef] [Green Version]
- Kääb, A.; Leinss, S.; Gilbert, A.; Bühler, Y.; Gascoin, S.; Evans, S.G.; Bartelt, P.; Berthier, E.; Brun, F.; Chao, W.A.; et al. Massive collapse of two glaciers in western Tibet in 2016 after surge-like instability. Nat. Geosci. 2018, 11, 114–120. [Google Scholar] [CrossRef] [Green Version]
- Imbie-Team. Mass balance of the Greenland Ice Sheet from 1992 to 2018. Nature 2020, 579, 233–239. [Google Scholar] [CrossRef] [PubMed]
- Zemp, M.; Huss, M.; Thibert, E.; Eckert, N.; McNabb, R.; Huber, J.; Barandun, M.; Machguth, H.; Nussbaumer, S.U.; Gartner-Roer, I.; et al. Global glacier mass changes and their contributions to sea-level rise from 1961 to 2016. Nature 2019, 568, 382–386. [Google Scholar] [CrossRef] [PubMed]
- Yao, T.; Thompson, L.; Yang, W.; Yu, W.S.; Gao, Y.; Guo, X.J.; Yang, X.X.; Duan, K.Q.; Zhao, H.B.; Xu, B.Q.; et al. Different glacier status with atmospheric circulations in Tibetan Plateau and surroundings. Nat. Clim. Change 2012, 2, 663–667. [Google Scholar] [CrossRef]
- Wu, K.; Liu, S.; Jiang, Z.; Xu, J.; Wei, J.; Guo, W. Recent glacier mass balance and area changes in the Kangri Karpo Mountains from DEMs and glacier inventories. Cryosphere 2018, 12, 103–121. [Google Scholar] [CrossRef] [Green Version]
- Kääb, A.; Berthier, E.; Nuth, C.; Gardelle, J.; Arnaud, Y. Contrasting patterns of early twenty-first-century glacier mass change in the Himalayas. Nature 2012, 488, 495. [Google Scholar] [CrossRef]
- Jacob, T.; Wahr, J.; Pfeffer, W.T.; Swenson, S. Recent contributions of glaciers and ice caps to sea level rise. Nature 2012, 482, 514–518. [Google Scholar] [CrossRef]
- Gardelle, J.; Berthier, E.; Arnaud, Y. Slight mass gain of Karakoram glaciers in the early twenty-first century. Nat. Geosci. 2012, 5, 322–325. [Google Scholar] [CrossRef]
- Kääb, A.; Treichler, D.; Nuth, C.; Berthier, E. Brief Communication: Contending estimates of 2003–2008 glacier mass balance over the Pamir–Karakoram–Himalaya. Cryosphere 2015, 9, 557–564. [Google Scholar] [CrossRef] [Green Version]
- Gardelle, J.; Berthier, E.; Arnaud, Y.; Kaab, A. Region-wide glacier mass balances over the Pamir–Karakoram–Himalaya during 1999–2011. Cryosphere 2013, 7, 1885–1886. [Google Scholar] [CrossRef] [Green Version]
- Wu, K.; Liu, S.; Zhu, Y.; Liu, Q.; Jiang, Z. Dynamics of glacier surface velocity and ice thickness for maritime glaciers in the southeastern Tibetan Plateau. J. Hydrol. 2020, 590, 125527. [Google Scholar] [CrossRef]
- Li, G.; Lin, H.; Ye, Q. Heterogeneous decadal glacier downwasting at the Mt. Everest (Qomolangma) from 2000 to ~2012 based on multi-baseline bistatic SAR interferometry. Remote Sens. Environ. 2018, 206, 336–349. [Google Scholar] [CrossRef]
- Samuele, D.P.; Filippo, S.; Orusa, T.; Enrico, B.-M. Mapping SAR geometric distortions and their stability along time: A new tool in Google Earth Engine based on Sentinel-1 image time series. Int. J. Remote Sens. 2021, 42, 9135–9154. [Google Scholar] [CrossRef]
- Ioli, F.; Bianchi, A.; Cina, A.; De Michele, C.; Maschio, P.; Passoni, D.; Pinto, L. Mid-Term Monitoring of Glacier’s Variations with UAVs: The Example of the Belvedere Glacier. Remote Sens. 2021, 14, 28. [Google Scholar] [CrossRef]
- Jouvet, G.; van Dongen, E.; Lüthi, M.P.; Vieli, A. In situ measurements of the ice flow motion at Eqip Sermia Glacier using a remotely controlled unmanned aerial vehicle (UAV). Geosci. Instrum. Methods Data Syst. 2020, 9, 1–10. [Google Scholar] [CrossRef] [Green Version]
- Bash, E.A.; Moorman, B.J. Surface melt and the importance of water flow—An analysis based on high-resolution unmanned aerial vehicle (UAV) data for an Arctic glacier. Cryosphere 2020, 14, 549–563. [Google Scholar] [CrossRef] [Green Version]
- Wigmore, O.; Mark, B. Monitoring tropical debris-covered glacier dynamics from high-resolution unmanned aerial vehicle photogrammetry, Cordillera Blanca, Peru. Cryosphere 2017, 11, 2463–2480. [Google Scholar] [CrossRef] [Green Version]
- Kraaijenbrink, P.D.A.; Shea, J.M.; Pellicciotti, F.; Jong, S.M.d.; Immerzeel, W.W. Object-based analysis of unmanned aerial vehicle imagery to map and characterise surface features on a debris-covered glacier. Remote Sens. Environ. 2016, 186, 581–595. [Google Scholar] [CrossRef]
- Immerzeel, W.W.; Kraaijenbrink, P.D.A.; Shea, J.M.; Shrestha, A.B.; Pellicciotti, F.; Bierkens, M.F.P.; de Jong, S.M. High-resolution monitoring of Himalayan glacier dynamics using unmanned aerial vehicles. Remote Sens. Environ. 2014, 150, 93–103. [Google Scholar] [CrossRef]
- Yang, W.; Zhao, C.X.; Westoby, M.; Yao, T.D.; Wang, Y.J.; Pellicciotti, F.; Zhou, J.M.; He, Z.; Miles, E. Seasonal Dynamics of a Temperate Tibetan Glacier Revealed by High-Resolution UAV Photogrammetry and In Situ Measurements. Remote Sens. 2020, 12, 2389. [Google Scholar] [CrossRef]
- Che, Y.; Wang, S.; Yi, S.; Wei, Y.; Cai, Y. Summer Mass Balance and Surface Velocity Derived by Unmanned Aerial Vehicle on Debris-Covered Region of Baishui River Glacier No. 1, Yulong Snow Mountain. Remote Sens. 2020, 12, 3280. [Google Scholar] [CrossRef]
- Wang, X.; Chai, K.; Liu, S.; Wei, J.; Jiang, Z.; Liu, Q. Changes of glaciers and glacial lakes implying corridor-barrier effects and climate change in the Hengduan Shan, southeastern Tibetan Plateau. J. Glaciol. 2017, 63, 535–542. [Google Scholar] [CrossRef] [Green Version]
- Li, Z.; He, Y.; Wang, C.; Wang, X.; Xin, H.; Zhang, W.; Cao, W. Spatial and temporal trends of temperature and precipitation during 1960–2008 at the Hengduan Mountains, China. Quat. Int. 2011, 236, 127–142. [Google Scholar] [CrossRef]
- Mi, D.; Xie, Z.; Luo, R.; Feng, Q. Glacier Inventory of China XI. The Ganga Drainage Basin; Xi’an Cartographic Publishing House: Xi’an, China, 2002. [Google Scholar]
- Zheng, B.; Zhao, X.; Li, T.; Wang, C. Features and Fluctuation of the Melang Glacier in the Mainri Mountain. J. Glaciol. Geocryol. 1999, 21, 145–150. [Google Scholar]
- Xie, Z.; Liu, C. The Introduction of Glaciology; Shanghai Popular Science Press: Shanghai, China, 2010. [Google Scholar]
- Taddia, Y.; González-García, L.; Zambello, E.; Pellegrinelli, A. Quality Assessment of Photogrammetric Models for Façade and Building Reconstruction Using DJI Phantom 4 RTK. Remote Sens. 2020, 12, 3144. [Google Scholar] [CrossRef]
- Wei, J.; Liu, S.; Wang, X.; Zhang, Y.; Jiang, Z.; Wu, K.; Zhang, Z.; Zhang, T. Longbasaba Glacier recession and contribution to its proglacial lake volume between 1988 and 2018. J. Glaciol. 2021, 67, 473–484. [Google Scholar] [CrossRef]
- Watson, C.S.; Kargel, J.S.; Shugar, D.H.; Haritashya, U.K.; Schiassi, E.; Furfaro, R. Mass Loss From Calving in Himalayan Proglacial Lakes. Front. Earth Sci. 2020, 7, 342. [Google Scholar] [CrossRef] [Green Version]
- Sutherland, J.L.; Carrivick, J.L.; Gandy, N.; Shulmeister, J.; Quincey, D.J.; Cornford, S.L. Proglacial Lakes Control Glacier Geometry and Behavior During Recession. Geophys. Res. Lett. 2020, 47, e2020GL088865. [Google Scholar] [CrossRef]
- Wu, K.; Liu, S.; Jiang, Z.; Xu, J.; Wei, J. Glacier mass balance over the central Nyainqentanglha Range during recent decades derived from remote-sensing data. J. Glaciol. 2019, 65, 422–439. [Google Scholar] [CrossRef] [Green Version]
- Brun, F.; Wagnon, P.; Berthier, E.; Shea, J.M.; Immerzeel, W.W.; Kraaijenbrink, P.D.; Vincent, C.; Reverchon, C.; Shrestha, D.; Arnaud, Y. Ice cliff contribution to the tongue-wide ablation of Changri Nup Glacier, Nepal, central Himalaya. Cryosphere 2018, 12, 3439–3457. [Google Scholar] [CrossRef] [Green Version]
- King, O.; Turner, A.G.D.; Quincey, D.J.; Carrivick, J.L. Morphometric evolution of Everest region debris-covered glaciers. Geomorphology 2020, 371, 107422. [Google Scholar] [CrossRef]
- Huang, L.; Li, Z.; Han, H.; Tian, B.; Zhou, J. Analysis of thickness changes and the associated driving factors on a debris-covered glacier in the Tienshan Mountain. Remote Sens. Environ. 2018, 206, 63–71. [Google Scholar] [CrossRef]
- Neckel, N.; Loibl, D.; Rankl, M. Recent slowdown and thinning of debris-covered glaciers in south-eastern Tibet. Earth Planet. Sci. Lett. 2017, 464, 95–102. [Google Scholar] [CrossRef] [Green Version]
- Scherler, D.; Bookhagen, B.; Strecker, M.R. Spatially variable response of Himalayan glaciers to climate change affected by debris cover. Nat. Geosci. 2011, 4, 156–159. [Google Scholar] [CrossRef]
- Reid, T.D.; Brock, B.W. Assessing ice-cliff backwasting and its contribution to total ablation of debris-covered Miage glacier, Mont Blanc massif, Italy. J. Glaciol. 2014, 60, 3–13. [Google Scholar] [CrossRef] [Green Version]
- Li, Z.; He, Y.; Wang, S.; Jia, W.; Xin, H. Changes of Some Monsoonal Temperate Glaciers in Hengduan Mountains Region during 1900–2007. Acta Geogr. Sin. 2009, 64, 1319–1330. [Google Scholar]
- Wang, R.; Liu, S.; Shangguan, D.; Radić, V.; Zhang, Y. Spatial Heterogeneity in Glacier Mass-Balance Sensitivity across High Mountain Asia. Water 2019, 11, 776. [Google Scholar] [CrossRef] [Green Version]
- Brown, J.; Harper, J.; Humphrey, N. Cirque glacier sensitivity to 21st century warming: Sperry Glacier, Rocky Mountains, USA. Glob. Planet. Change 2010, 74, 91–98. [Google Scholar] [CrossRef]
- Ghaderpour, E.; Vujadinovic, T.; Hassan, Q.K. Application of the Least-Squares Wavelet software in hydrology: Athabasca River Basin. J. Hydrol. Reg. Stud. 2021, 36, 100847. [Google Scholar] [CrossRef]
- Ke, L.; Song, C.; Yong, B.; Lei, Y.; Ding, X. Which heterogeneous glacier melting patterns can be robustly observed from space? A multi-scale assessment in southeastern Tibetan Plateau. Remote Sens. Environ. 2020, 242, 11177. [Google Scholar] [CrossRef]

Publisher’s Note: MDPI stays neutral with regard to jurisdictional claims in published maps and institutional affiliations. |
© 2022 by the authors. Licensee MDPI, Basel, Switzerland. This article is an open access article distributed under the terms and conditions of the Creative Commons Attribution (CC BY) license (https://creativecommons.org/licenses/by/4.0/).
Share and Cite
Wu, K.; Liu, S.; Zhu, Y.; Xie, F.; Gao, Y.; Qi, M.; Miao, W.; Duan, S.; Han, F.; Grünwald, R. Monitoring the Surface Elevation Changes of a Monsoon Temperate Glacier with Repeated UAV Surveys, Mainri Mountains, China. Remote Sens. 2022, 14, 2229. https://doi.org/10.3390/rs14092229
Wu K, Liu S, Zhu Y, Xie F, Gao Y, Qi M, Miao W, Duan S, Han F, Grünwald R. Monitoring the Surface Elevation Changes of a Monsoon Temperate Glacier with Repeated UAV Surveys, Mainri Mountains, China. Remote Sensing. 2022; 14(9):2229. https://doi.org/10.3390/rs14092229
Chicago/Turabian StyleWu, Kunpeng, Shiyin Liu, Yu Zhu, Fuming Xie, Yongpeng Gao, Miaomiao Qi, Wenfei Miao, Shimei Duan, Fengze Han, and Richard Grünwald. 2022. "Monitoring the Surface Elevation Changes of a Monsoon Temperate Glacier with Repeated UAV Surveys, Mainri Mountains, China" Remote Sensing 14, no. 9: 2229. https://doi.org/10.3390/rs14092229