
Absolute Radiometric Calibration of an Imaging Spectroradiometer Using a Laboratory Detector-Based Approach


Abstract
:1. Introduction
2. Detector-Based Calibration with a Tunable Laser Source
2.1. Detector-Based Calibration Approach
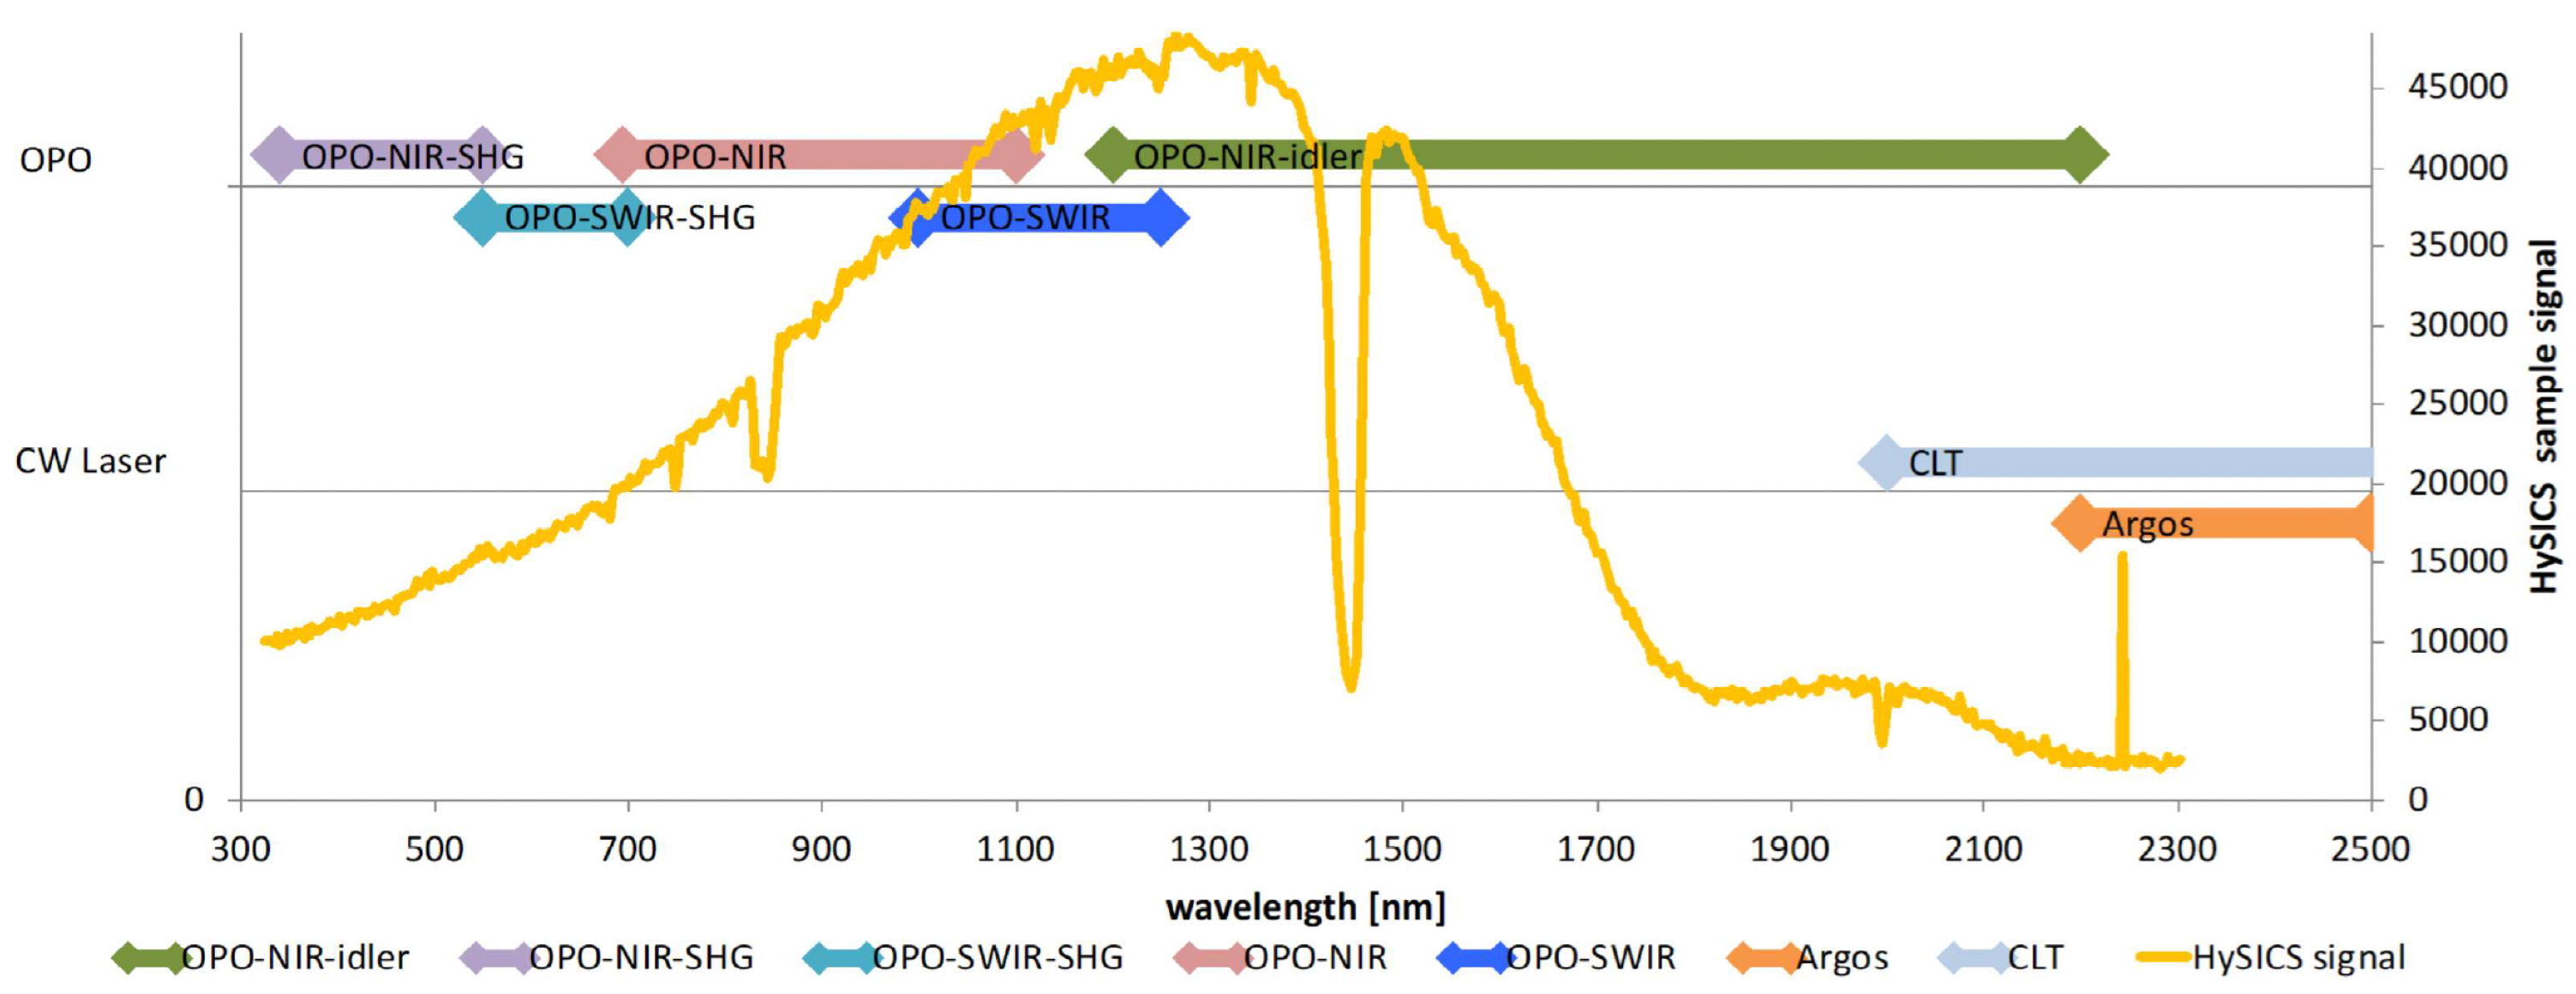
2.2. Tunable Laser Source: GLAMR
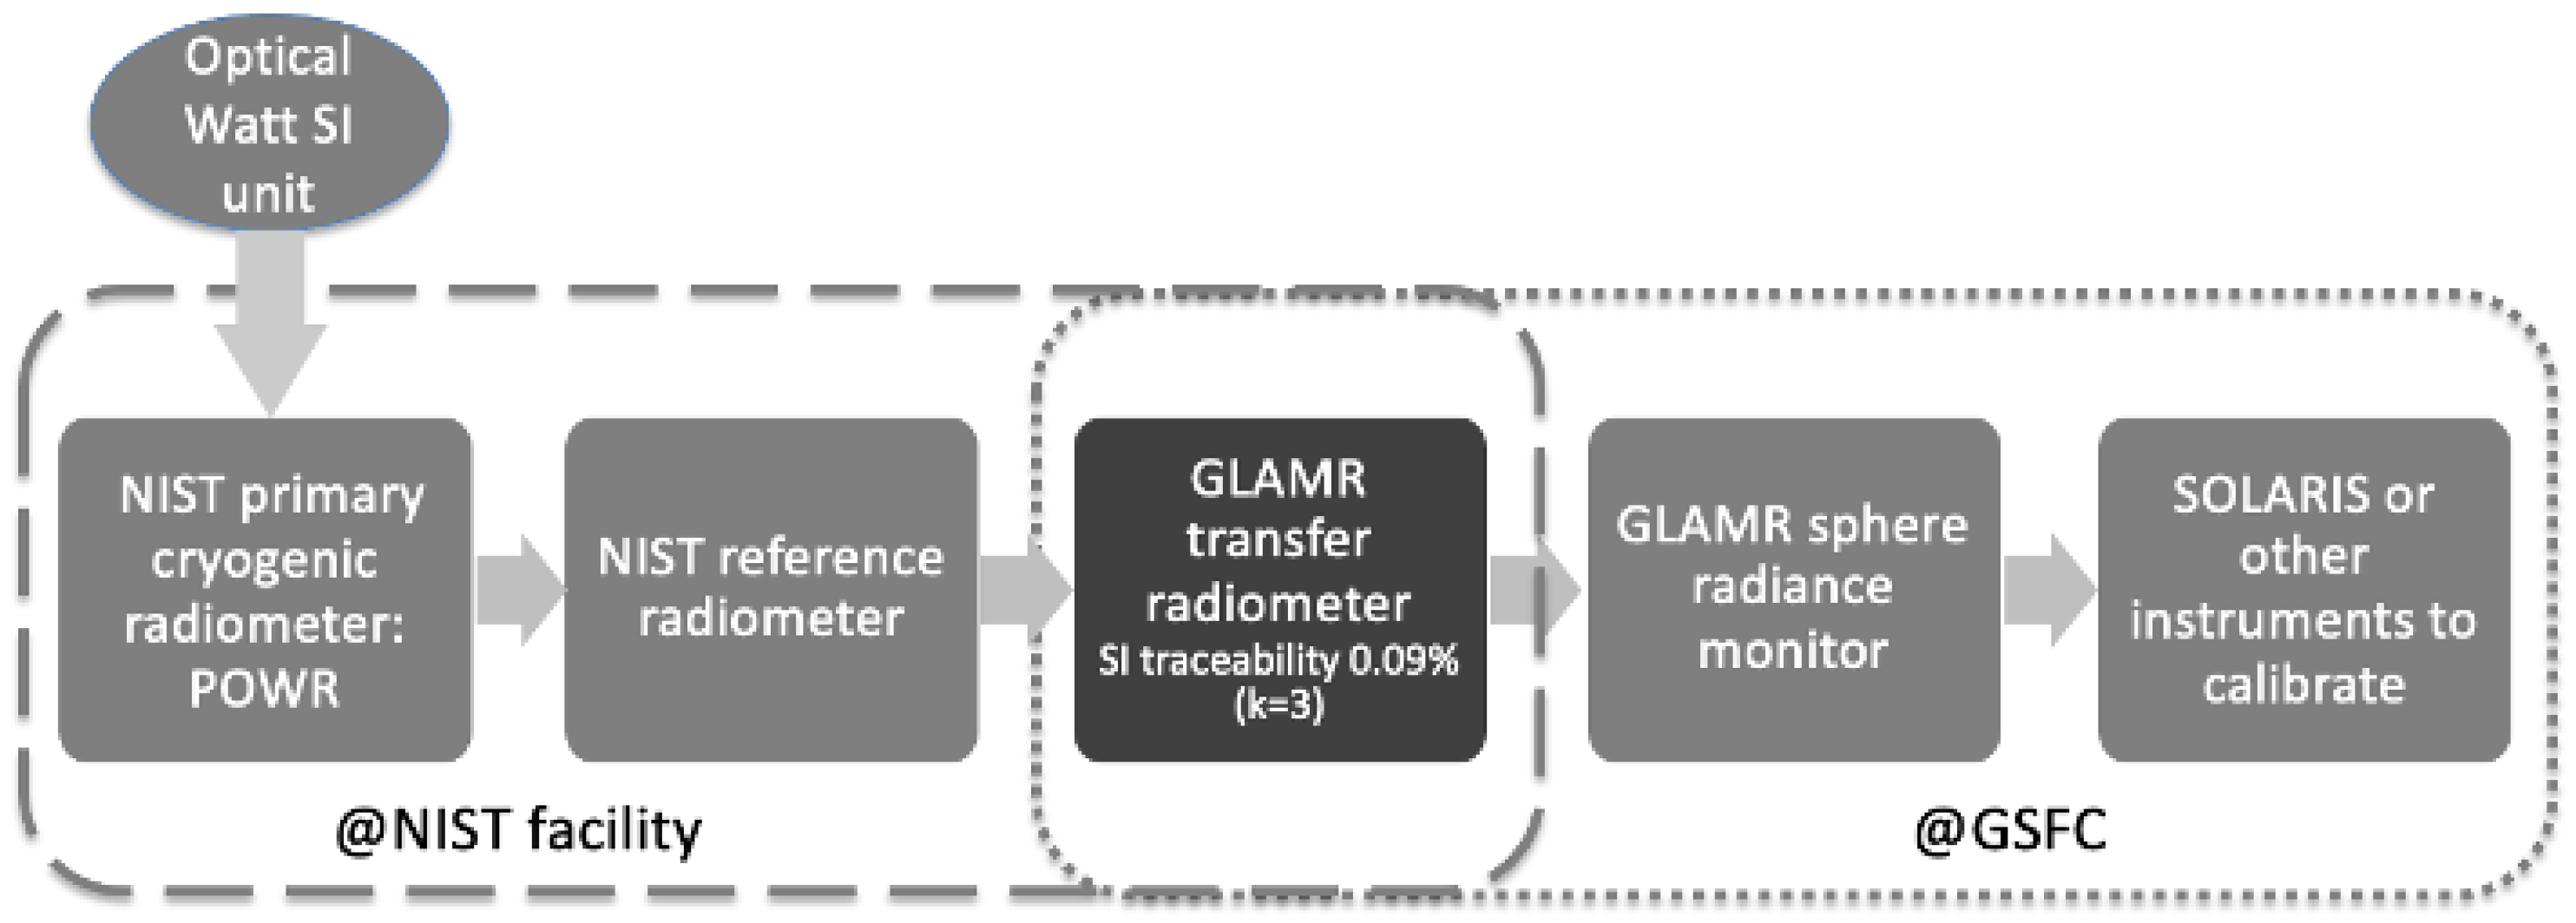
2.3. SI Traceability of GLAMR RadCal
3. SOLARIS Absolute RadCal with GLAMR
3.1. SOLARIS Overview
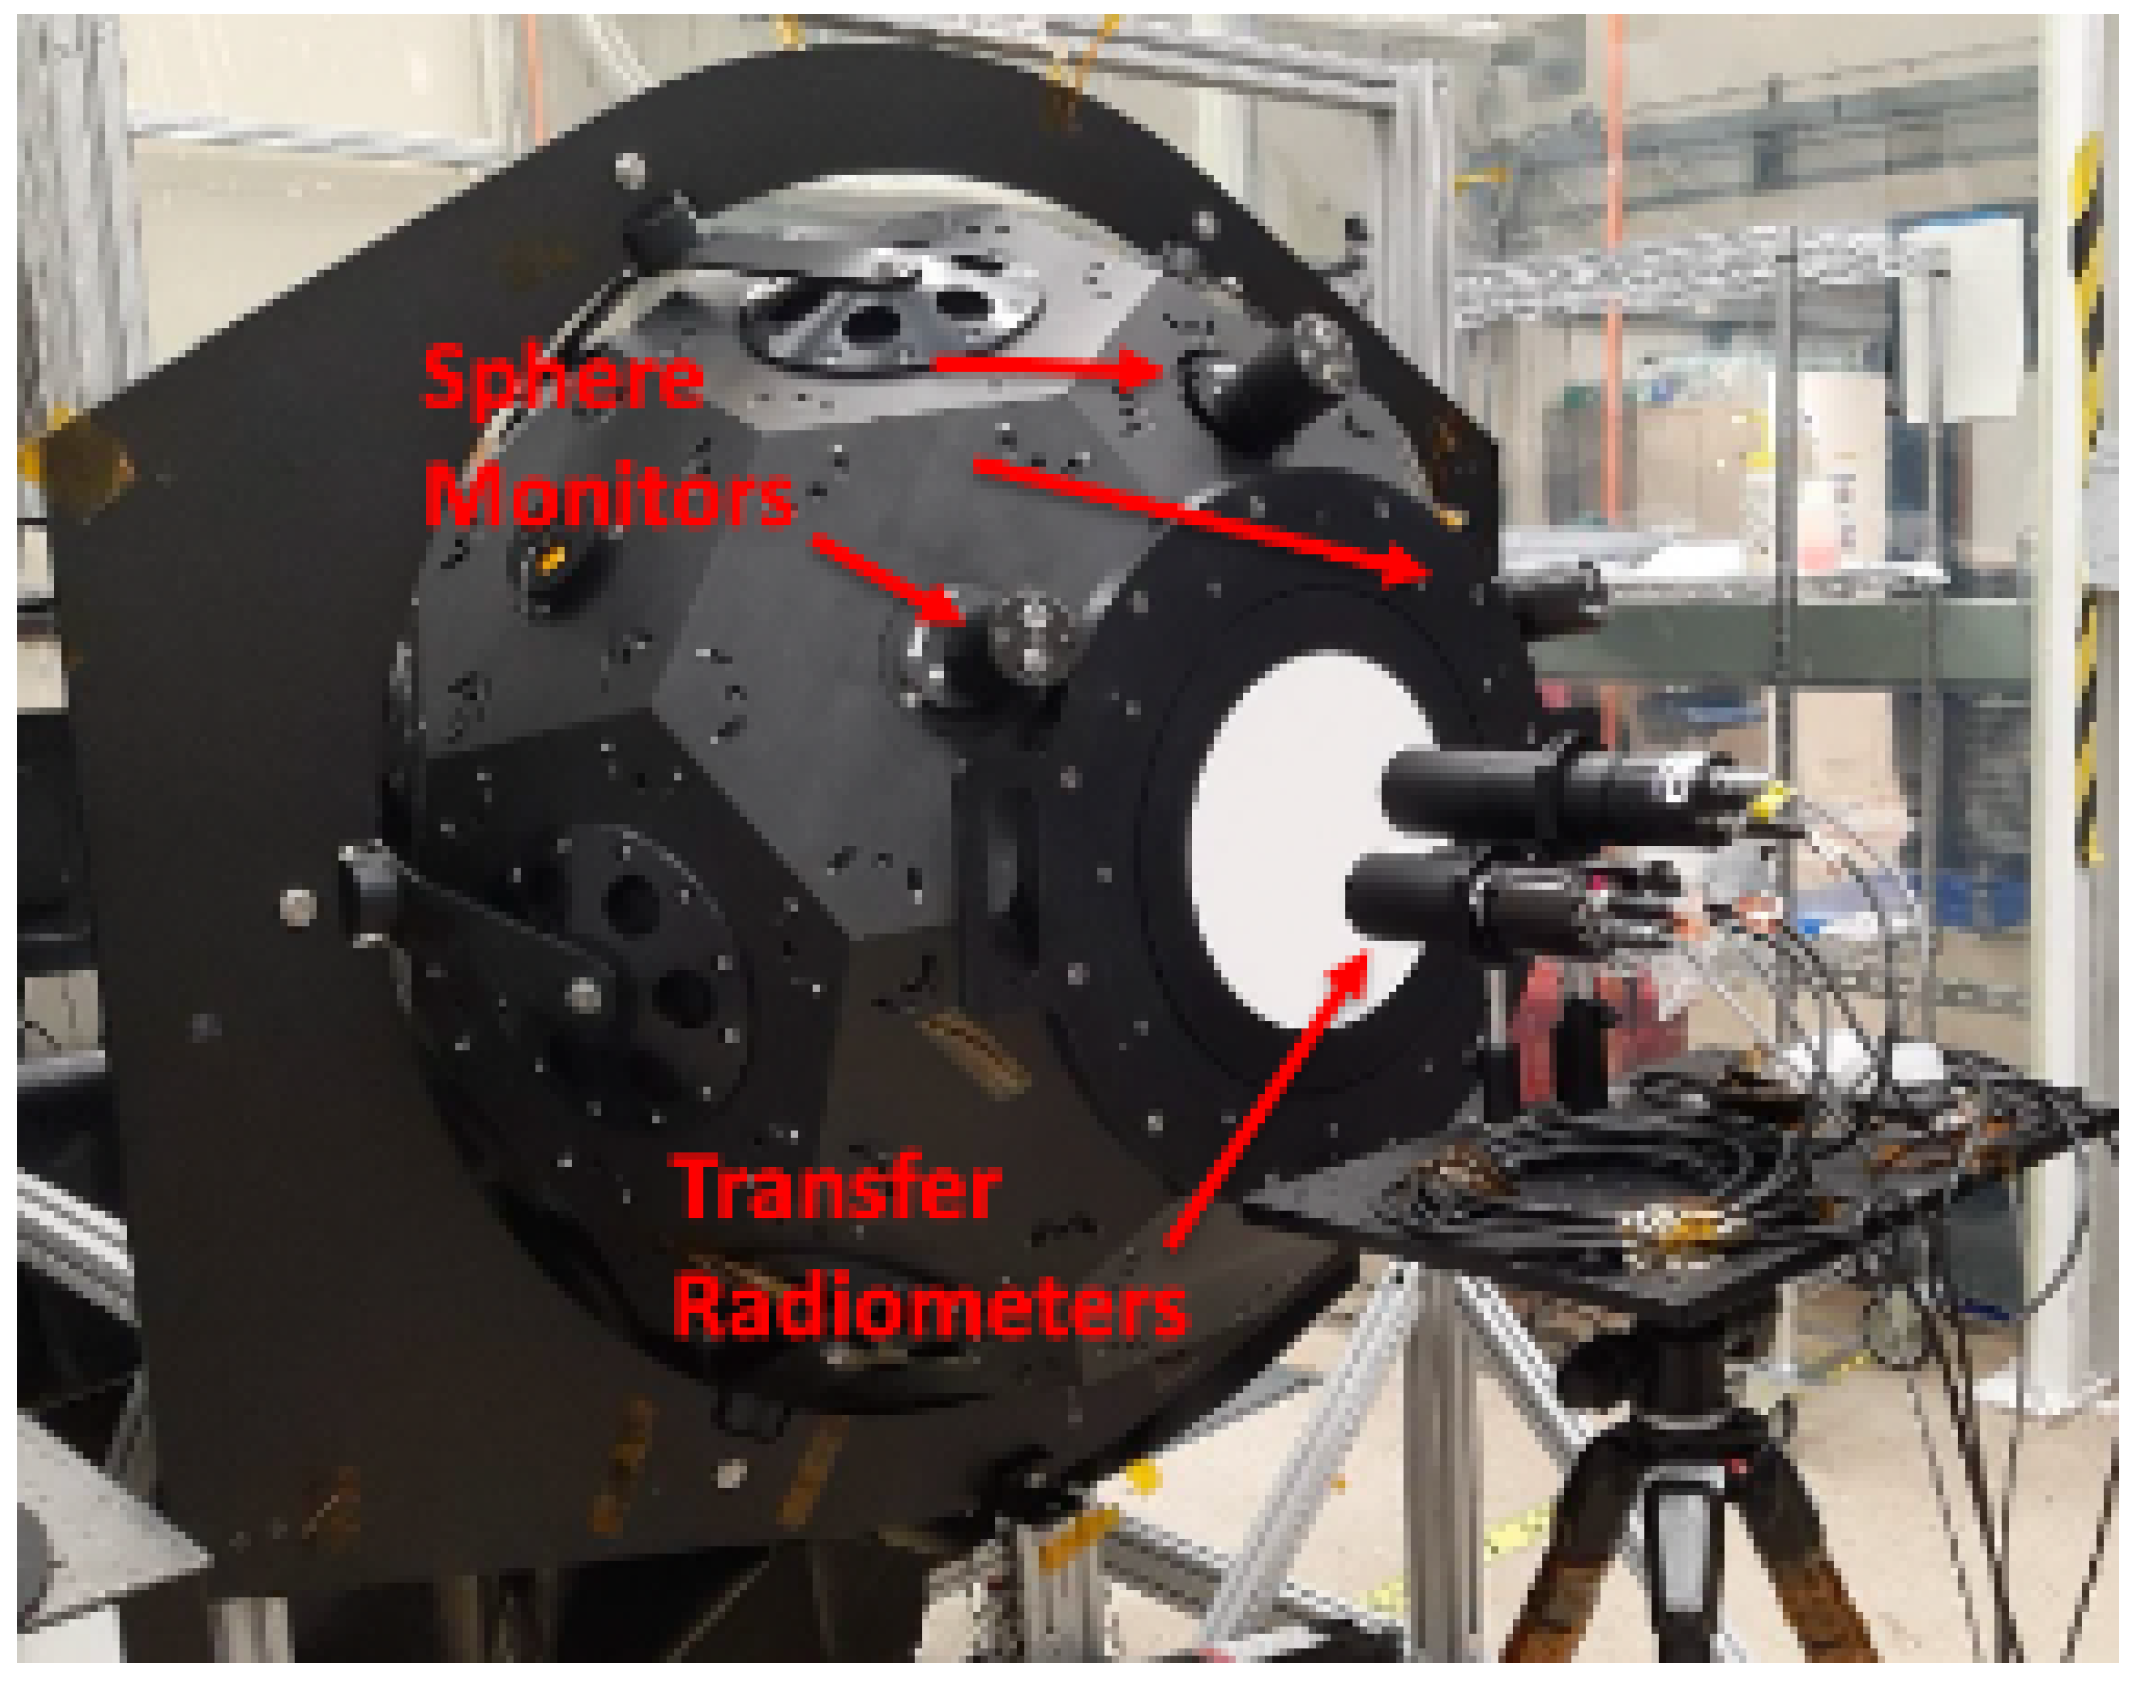
3.2. Lab Setup for the SOLARIS RadCal
3.3. Data Collection
4. Data Processing and Results
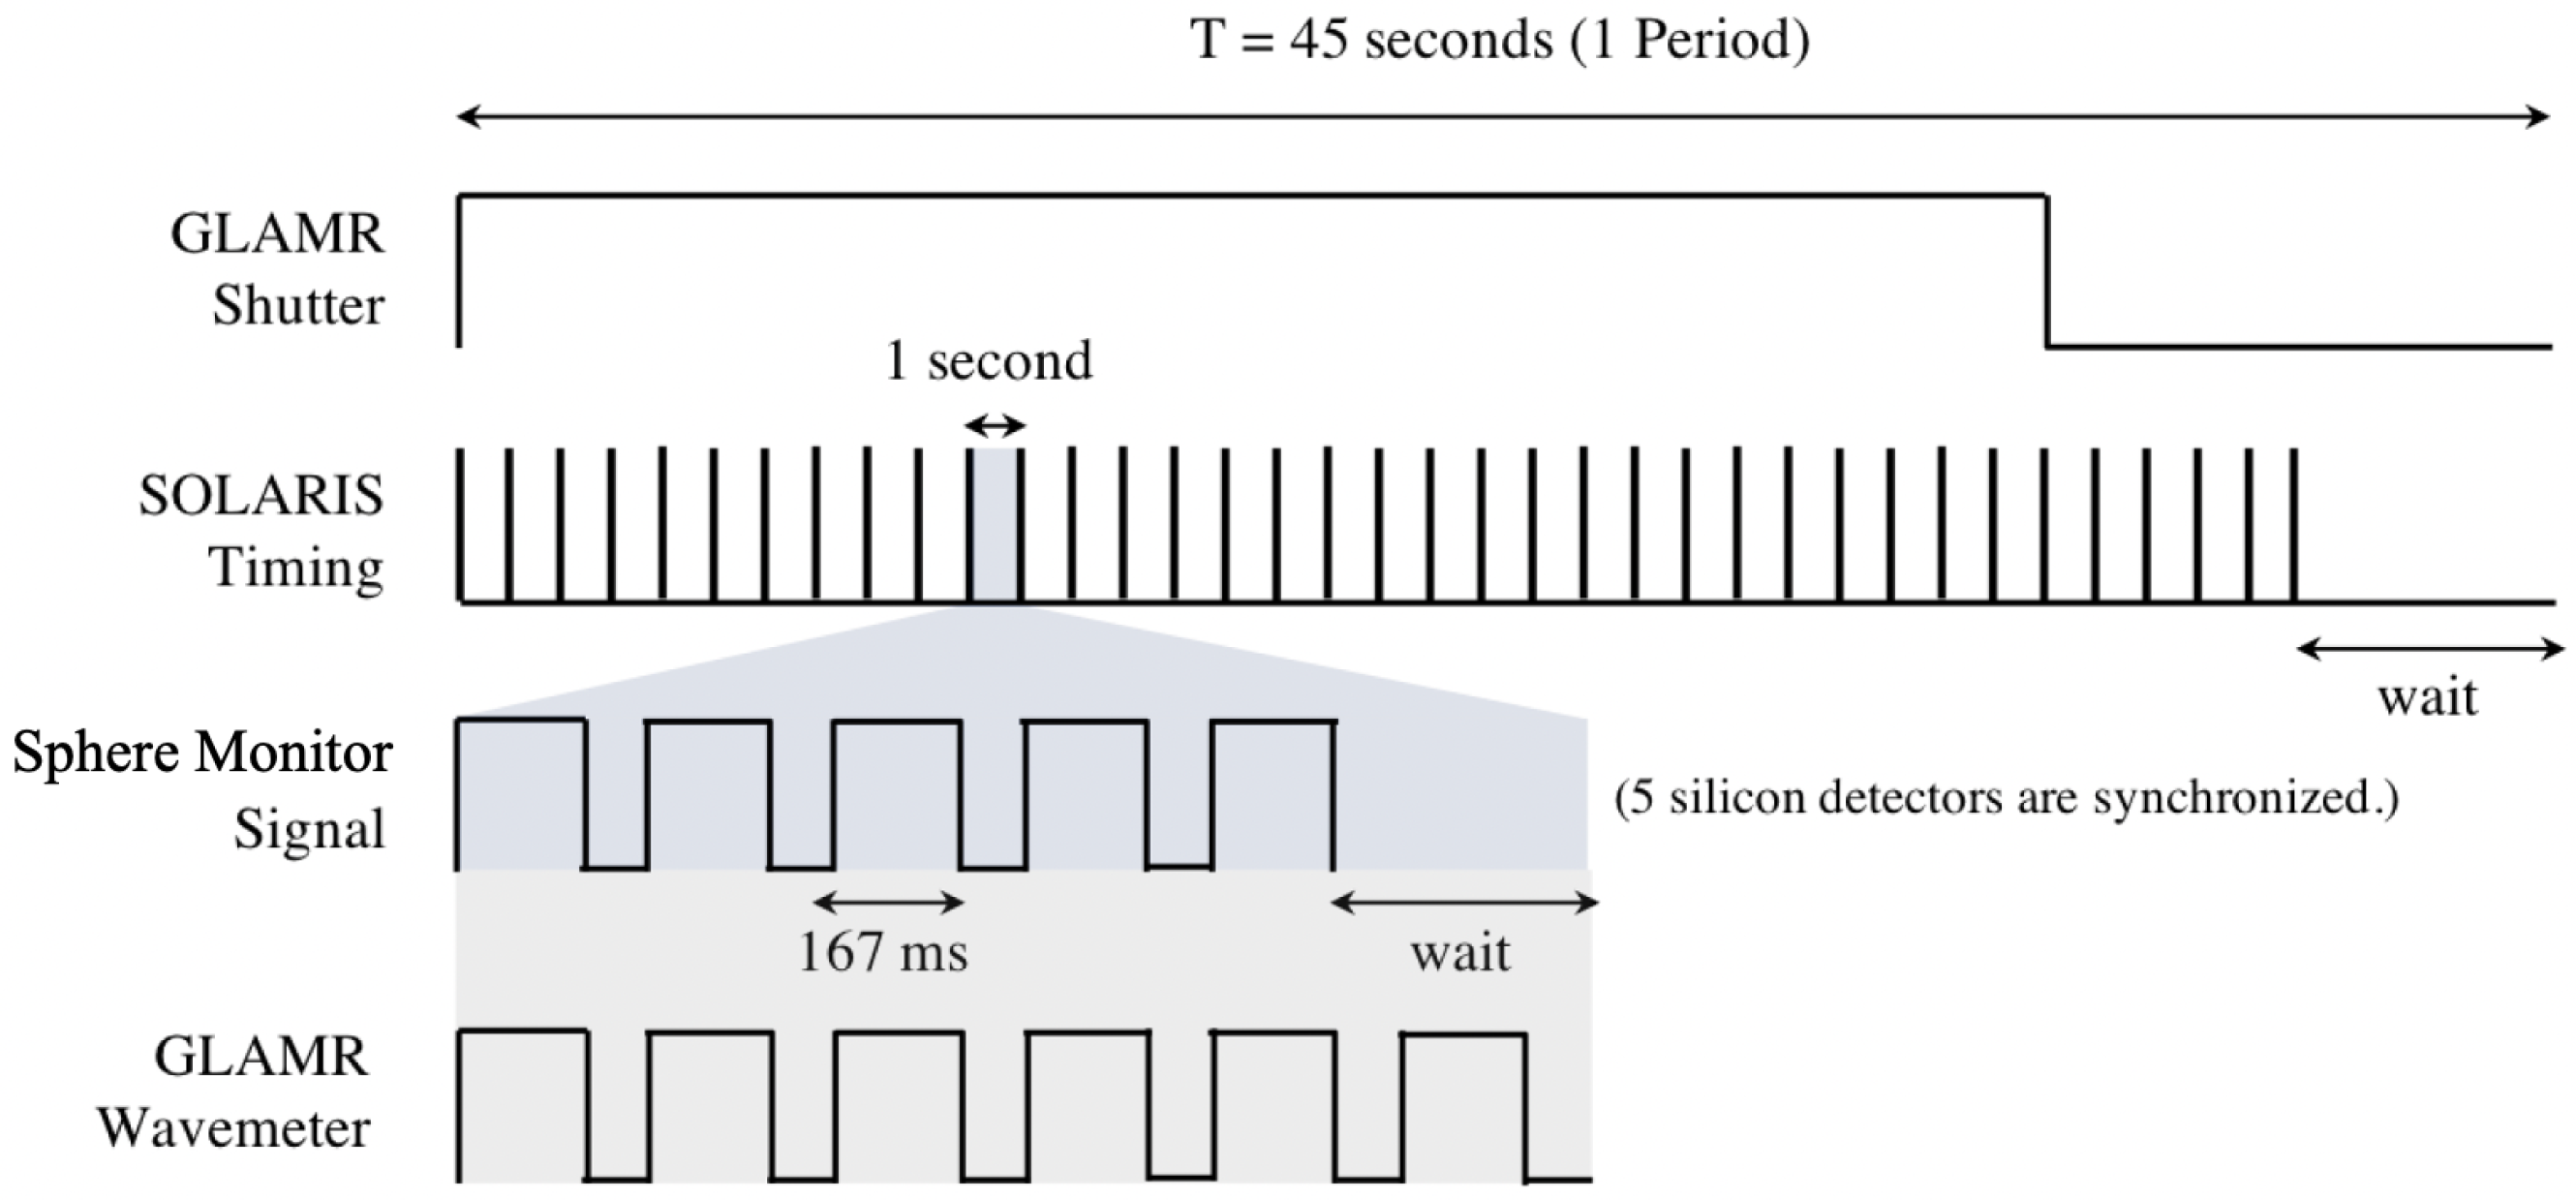
4.1. SOLARIS RadCal Schedule
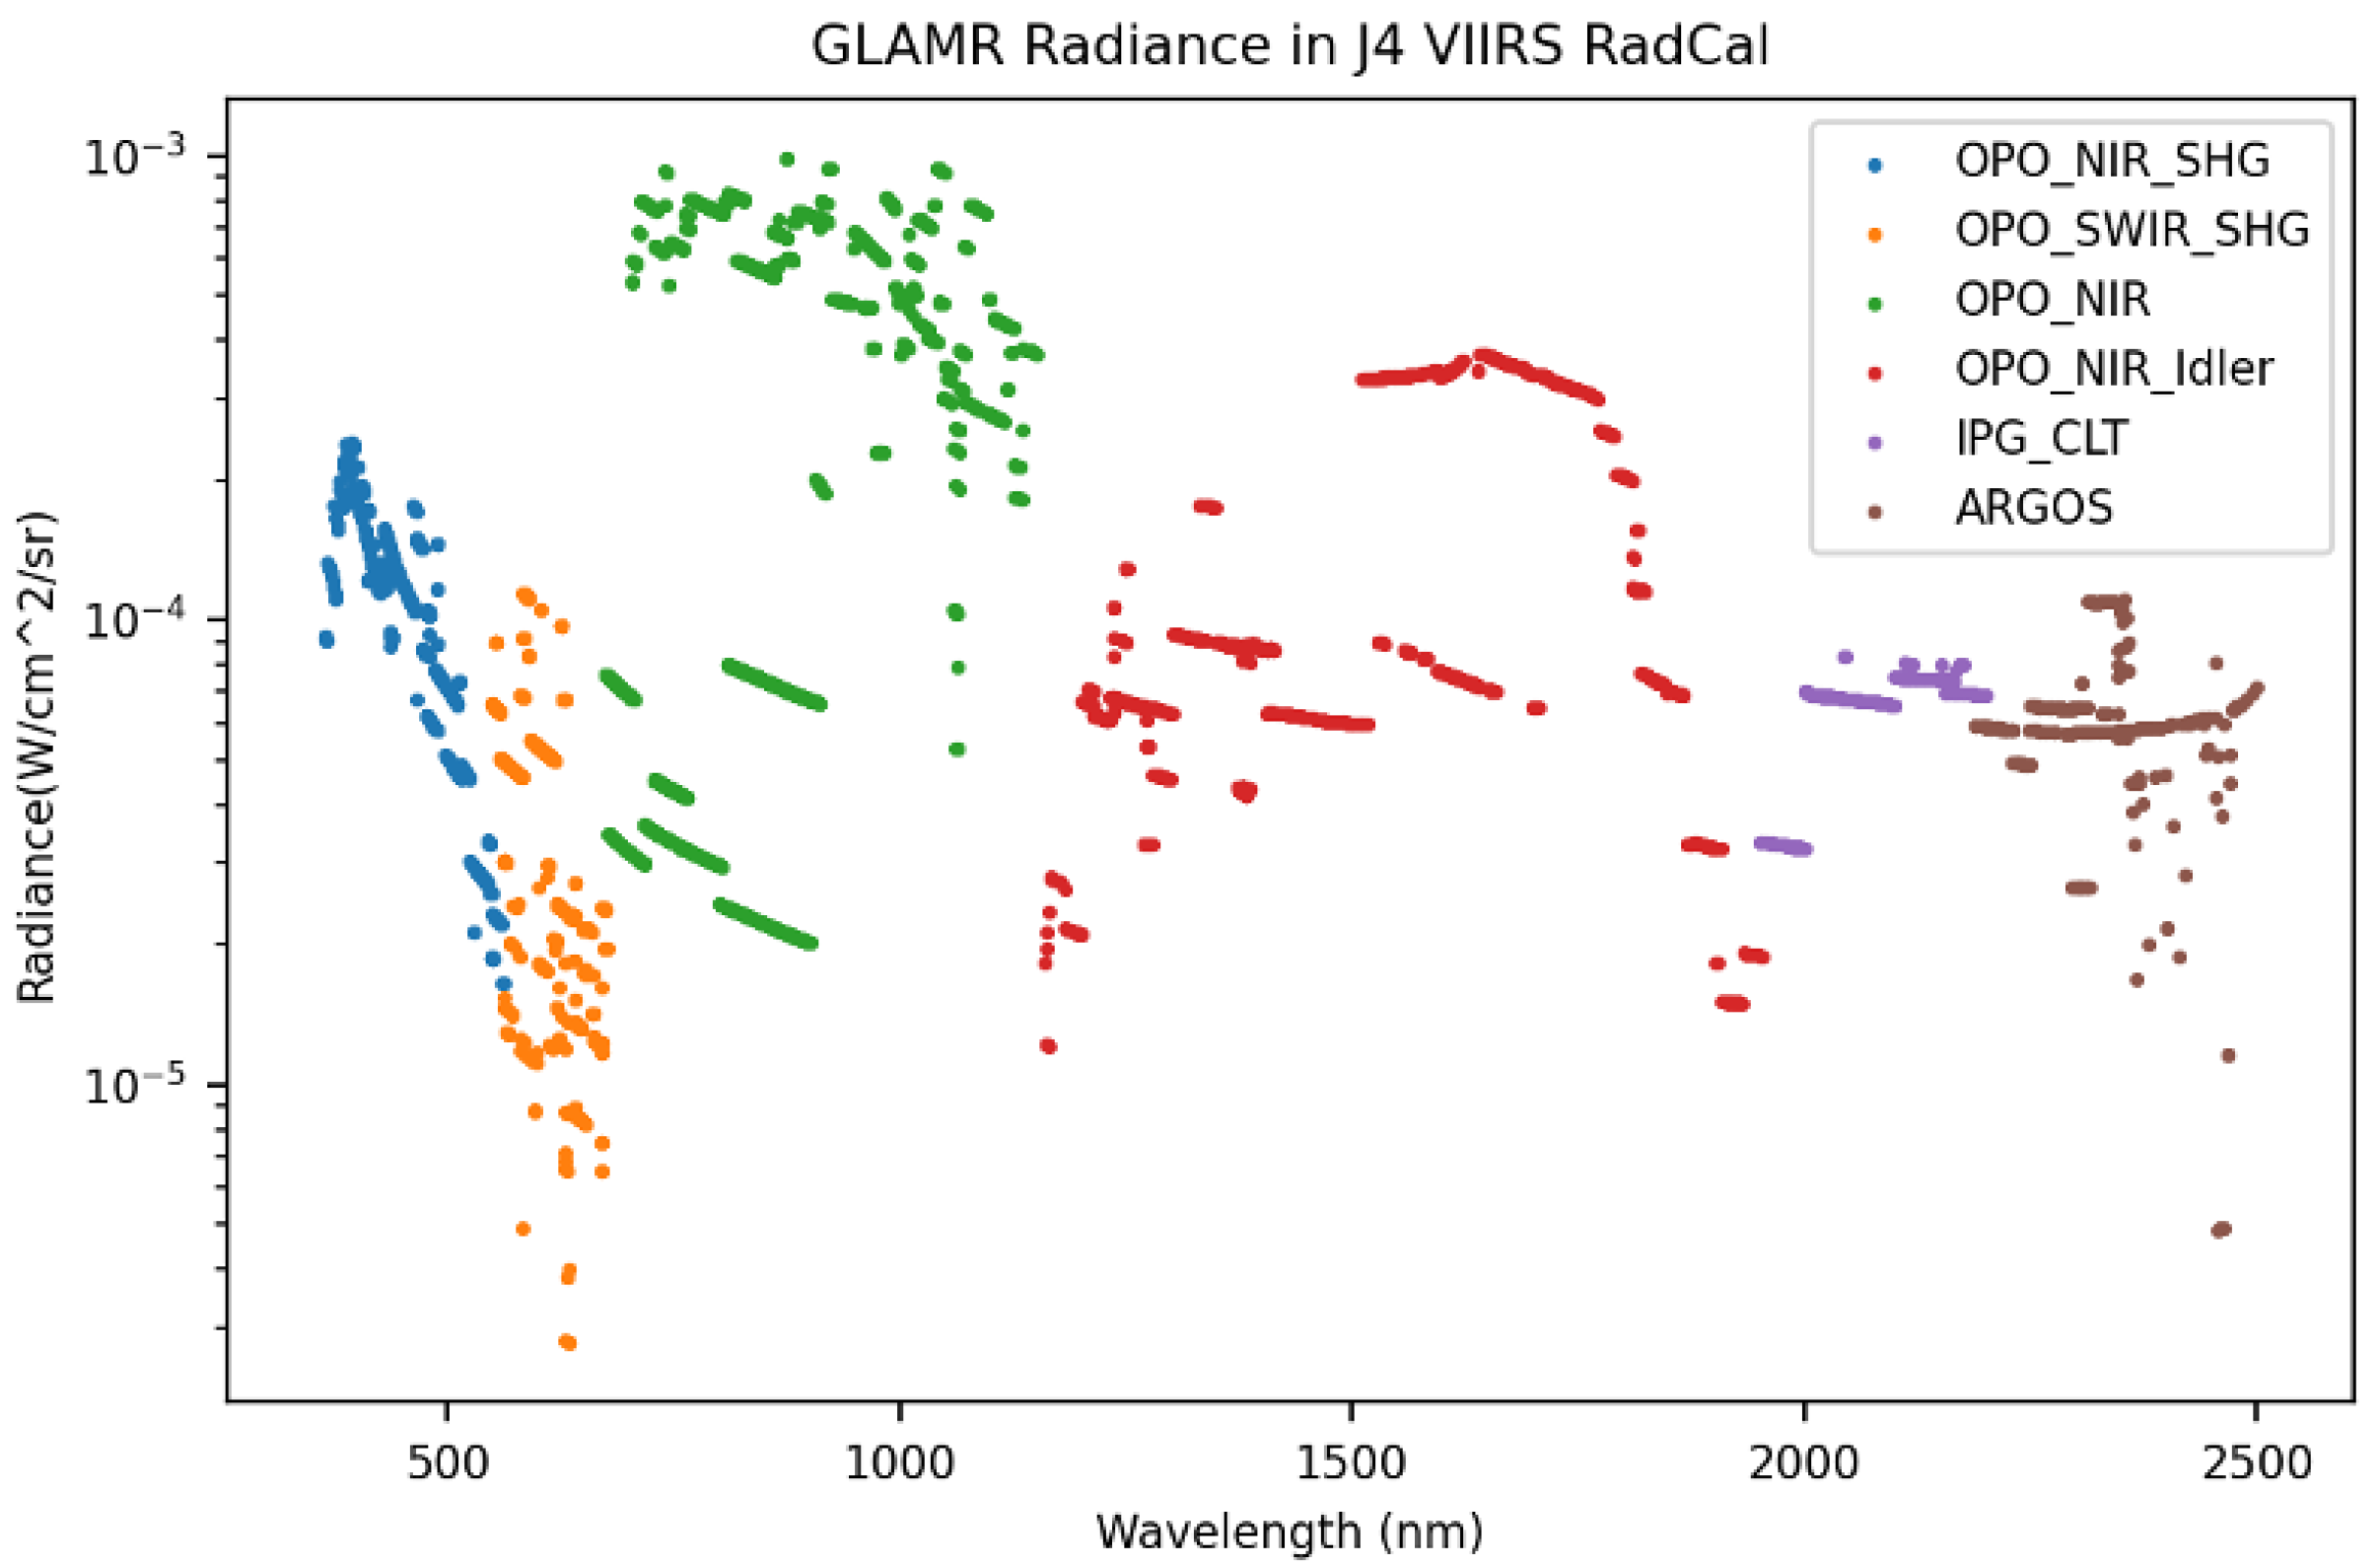
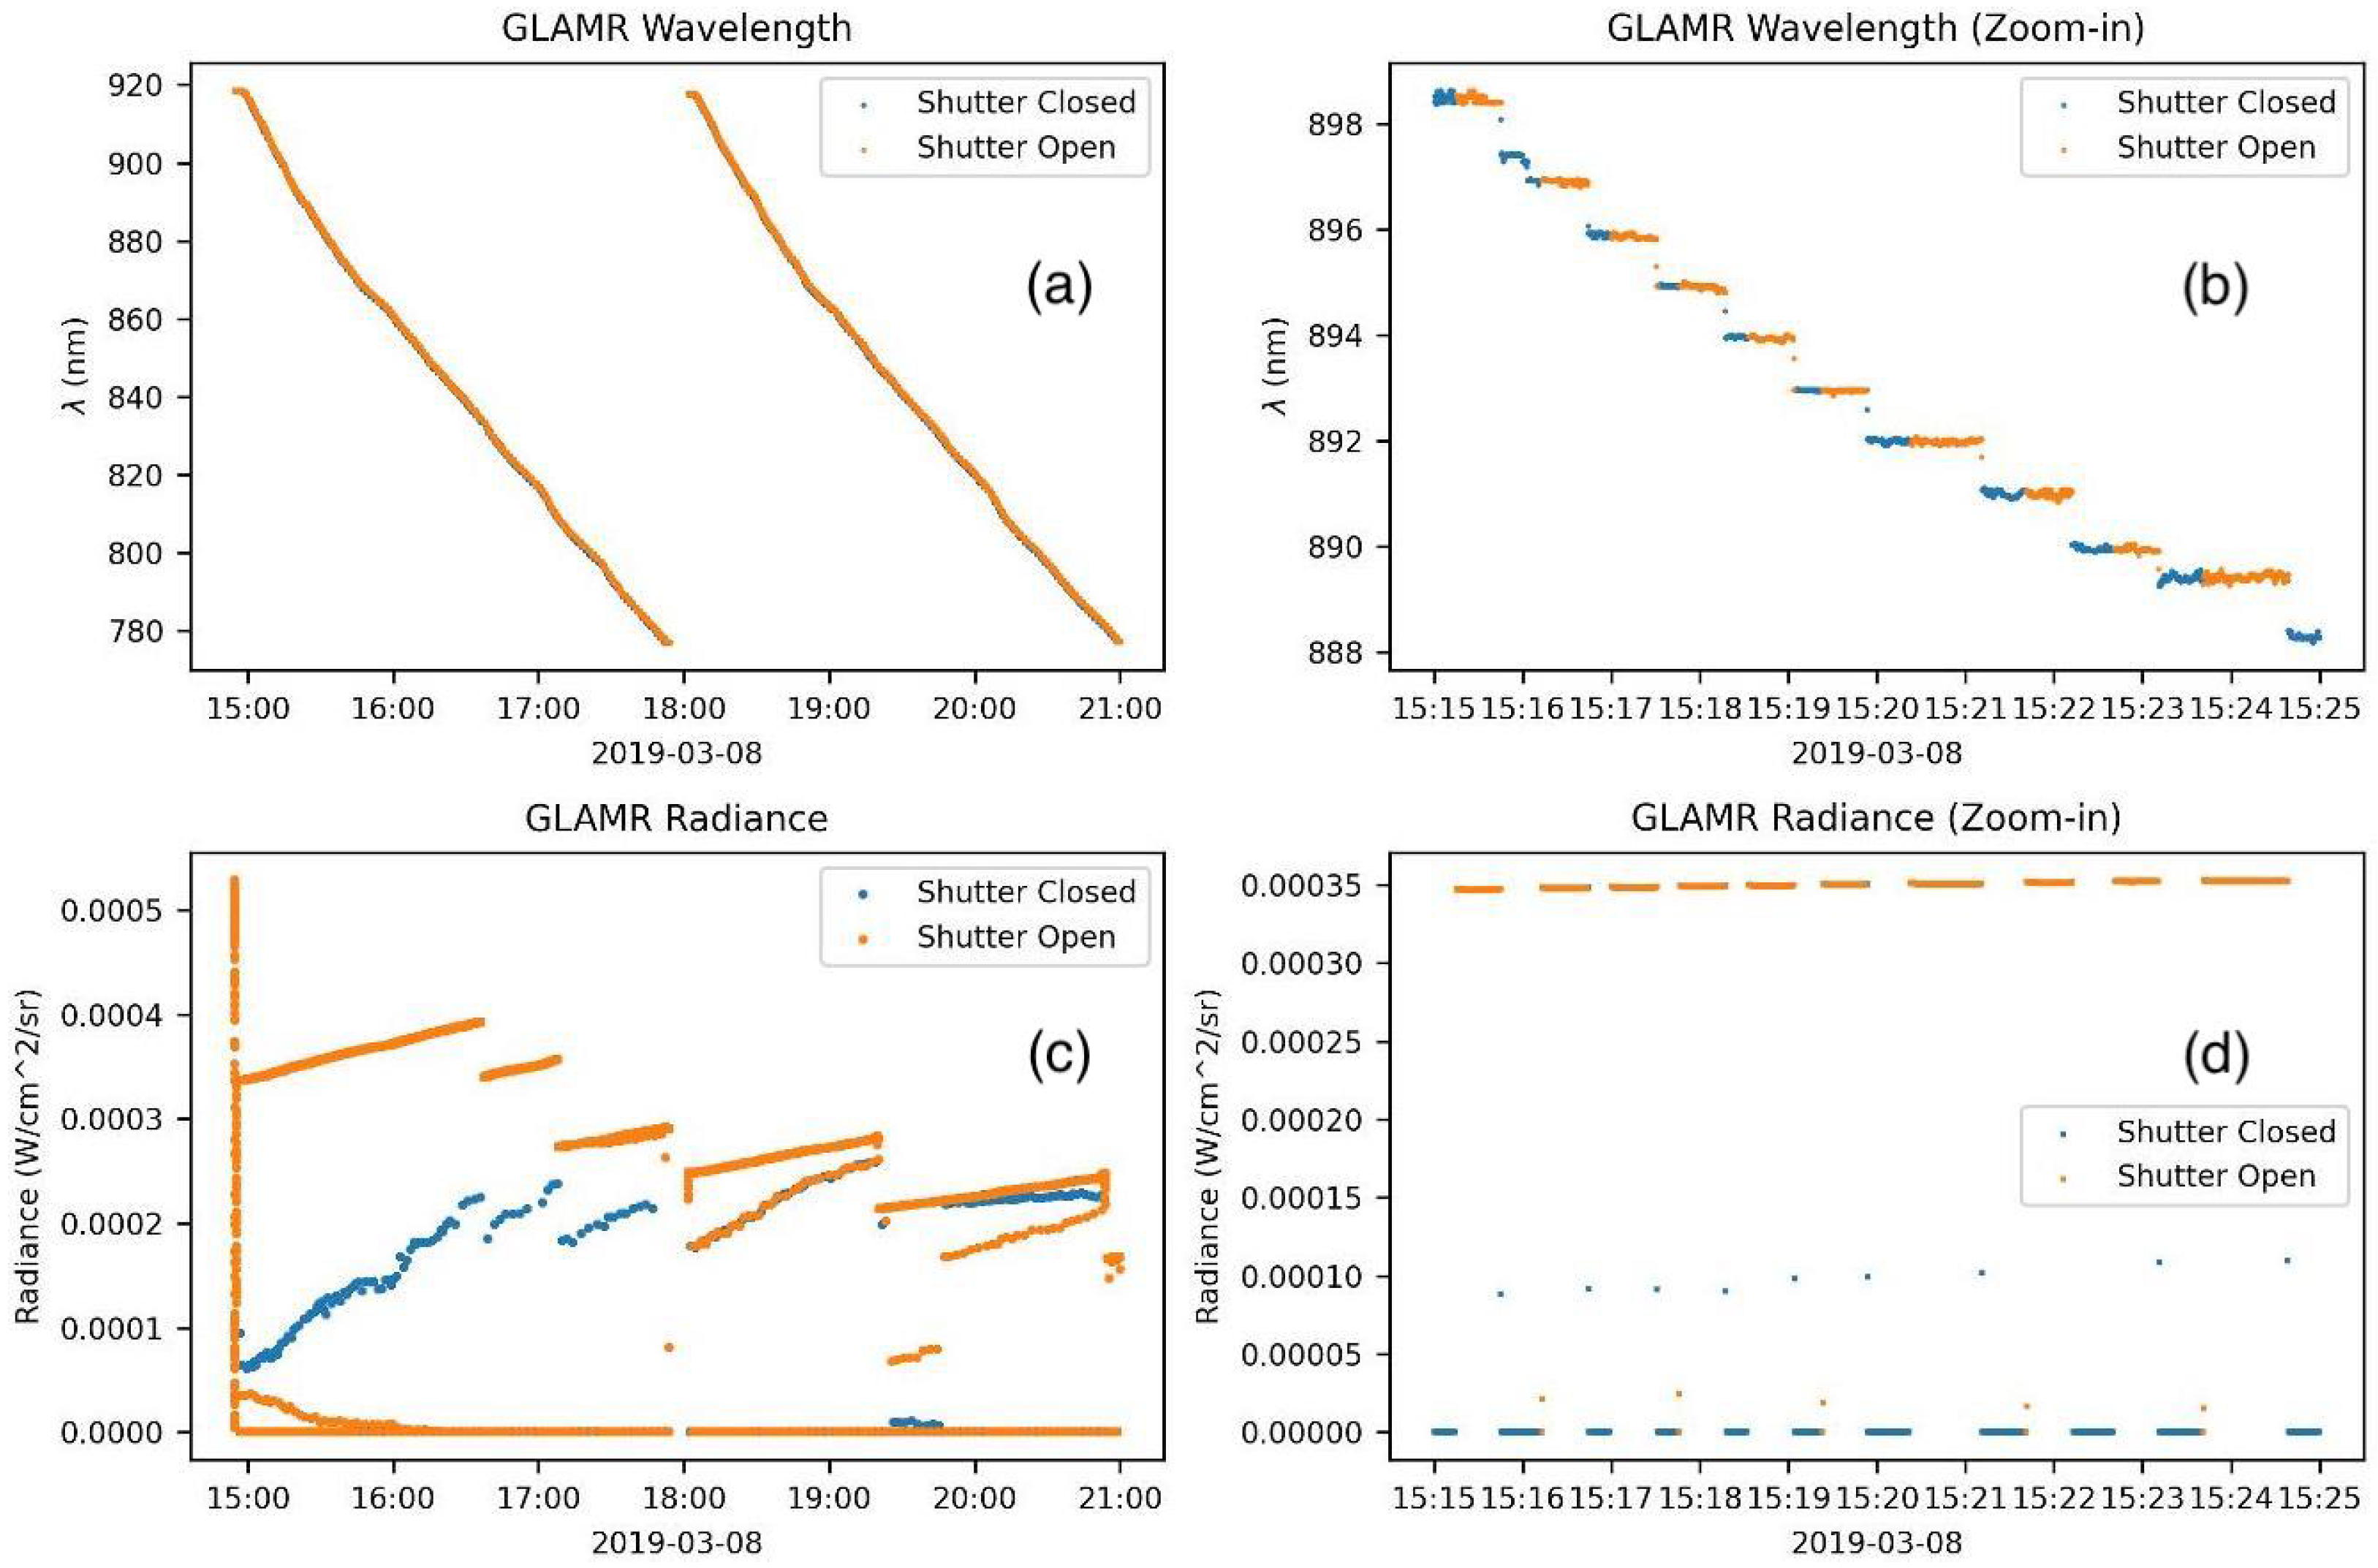
4.2. GLAMR Data Processing
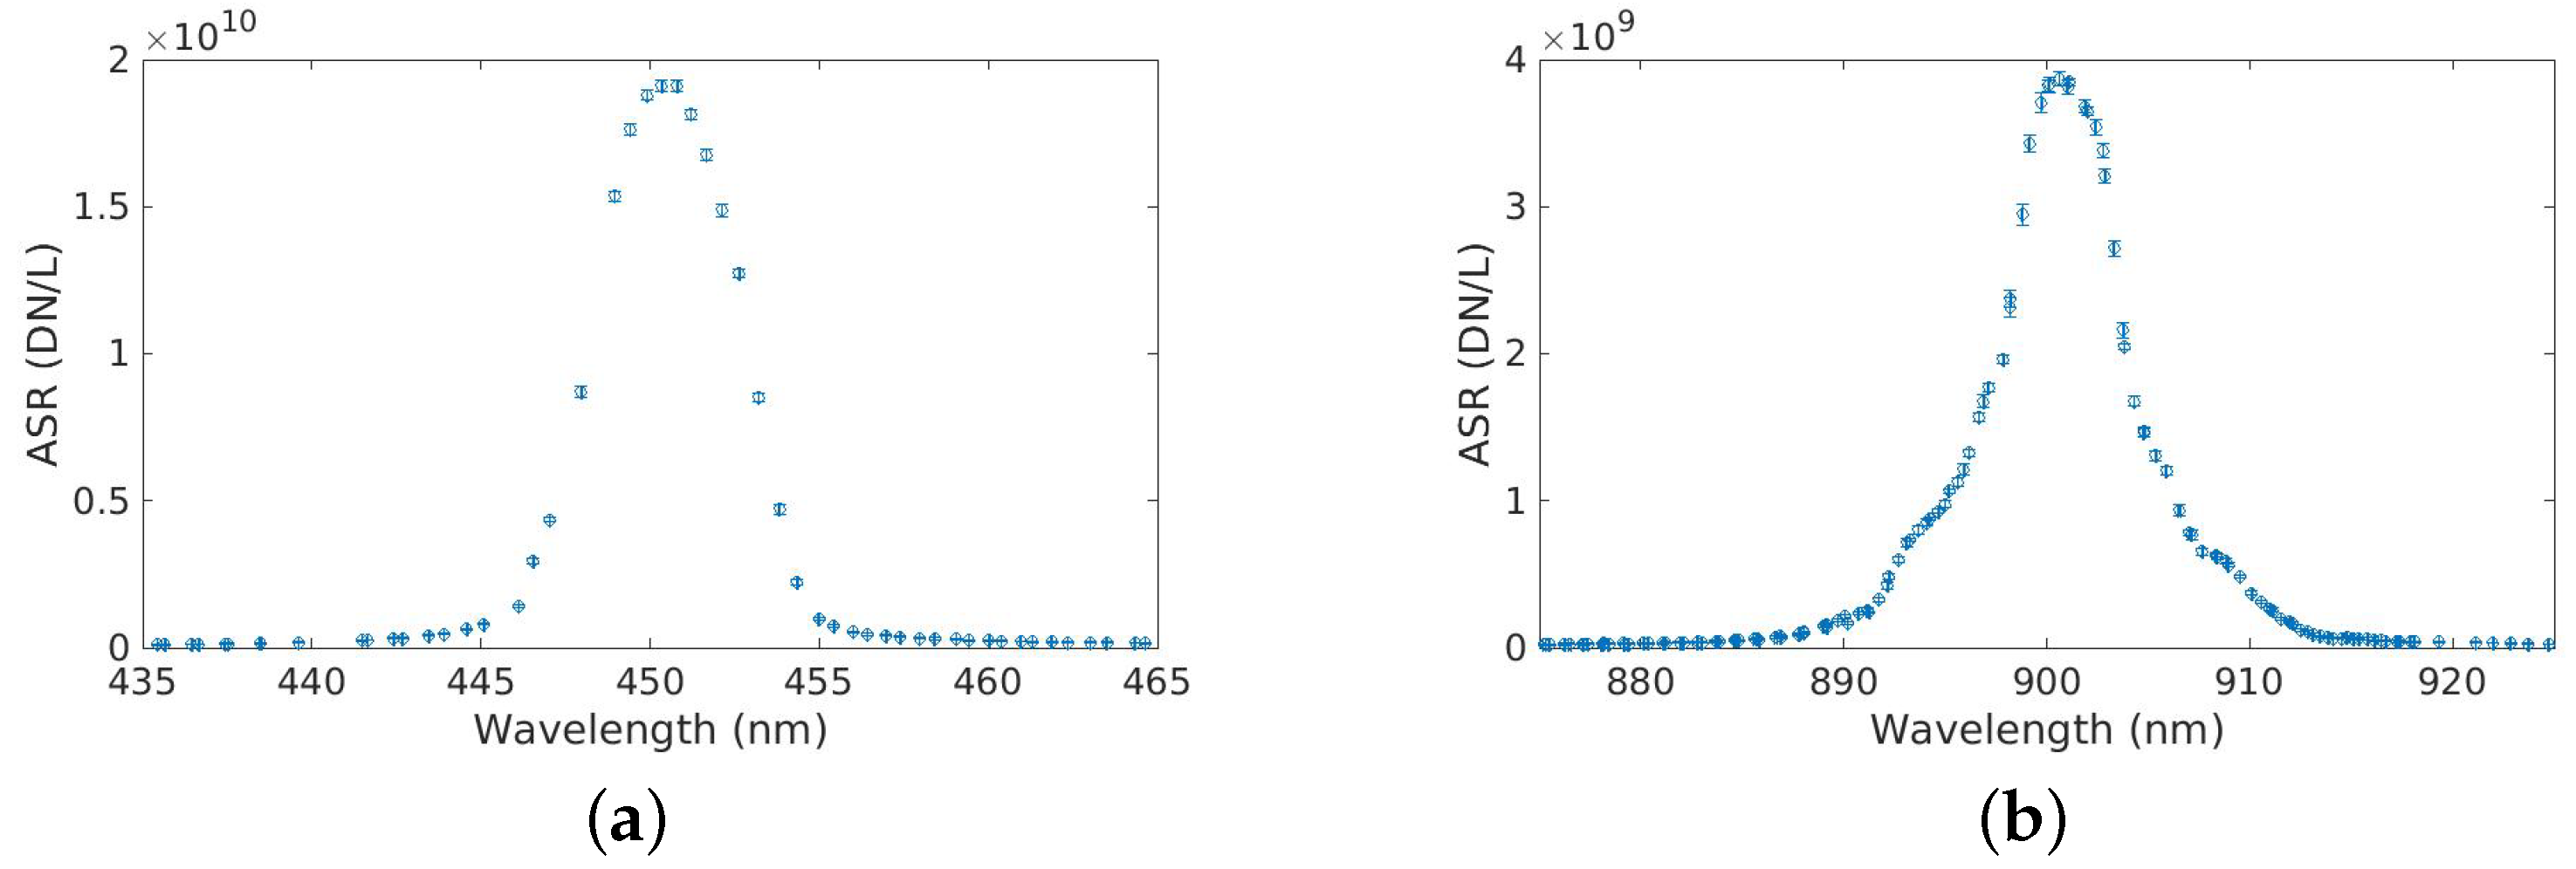
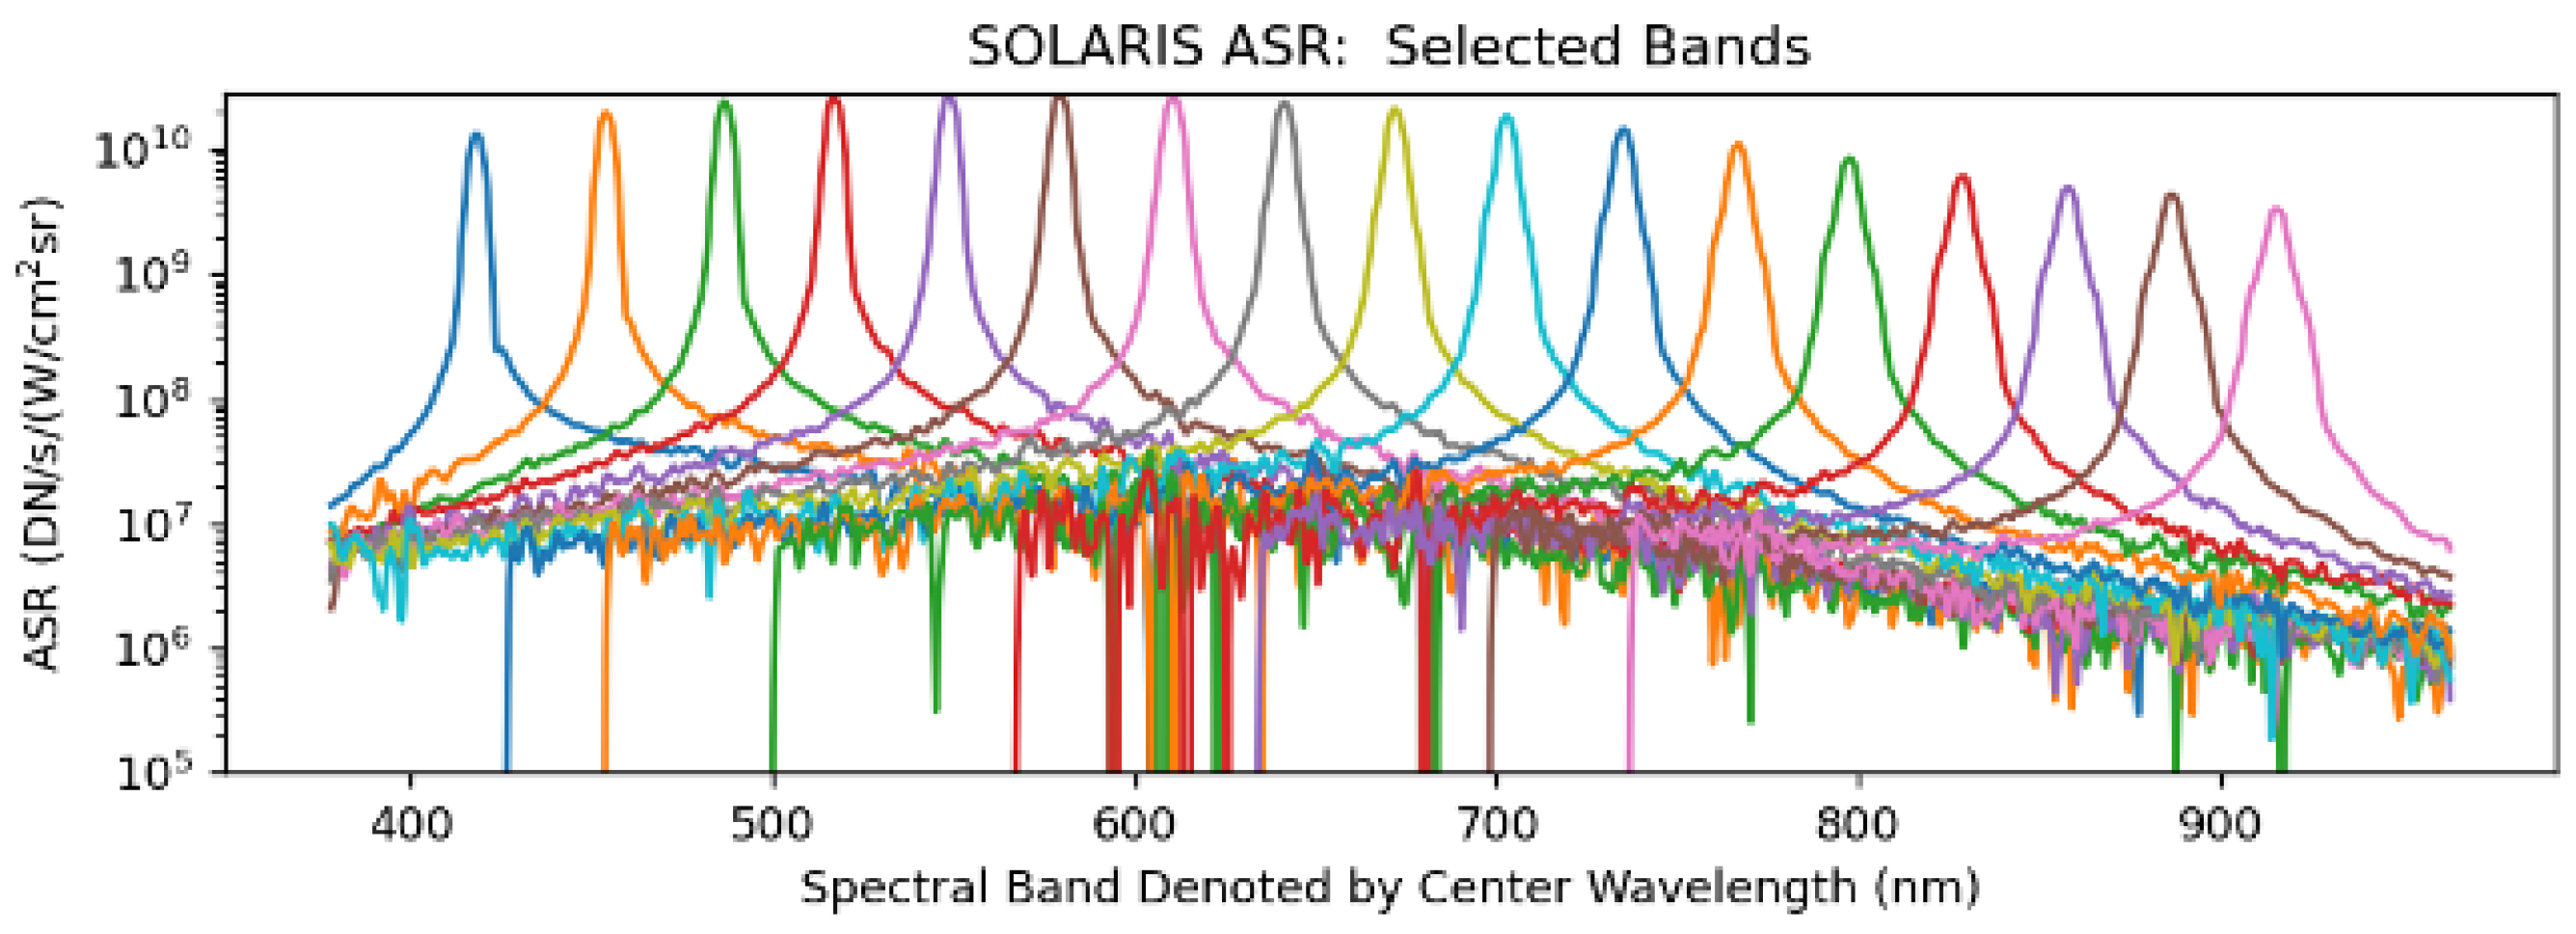
4.3. SOLARIS Data Processing
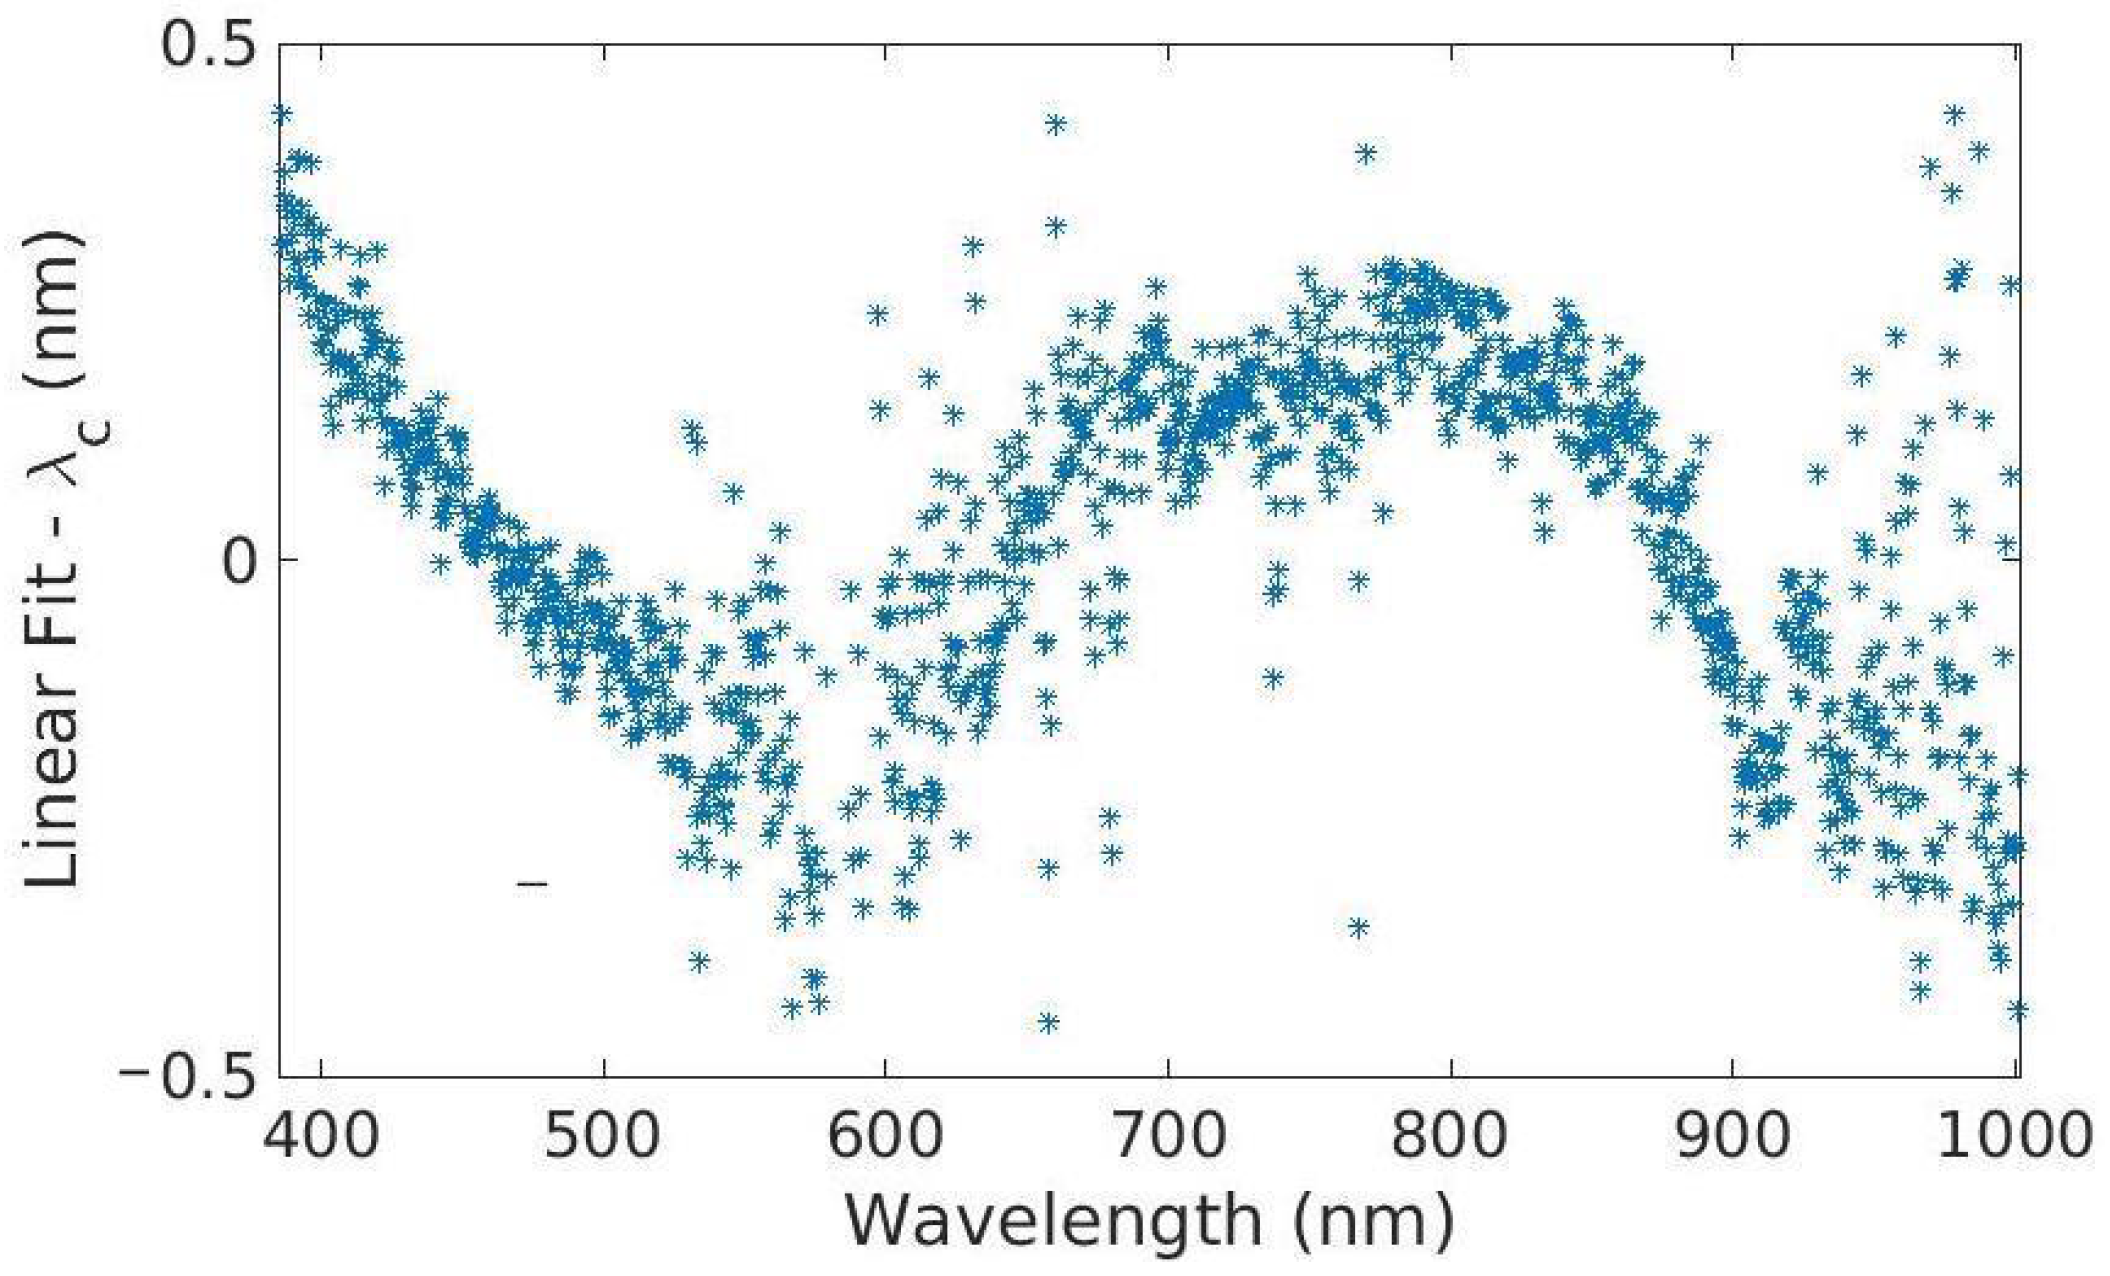
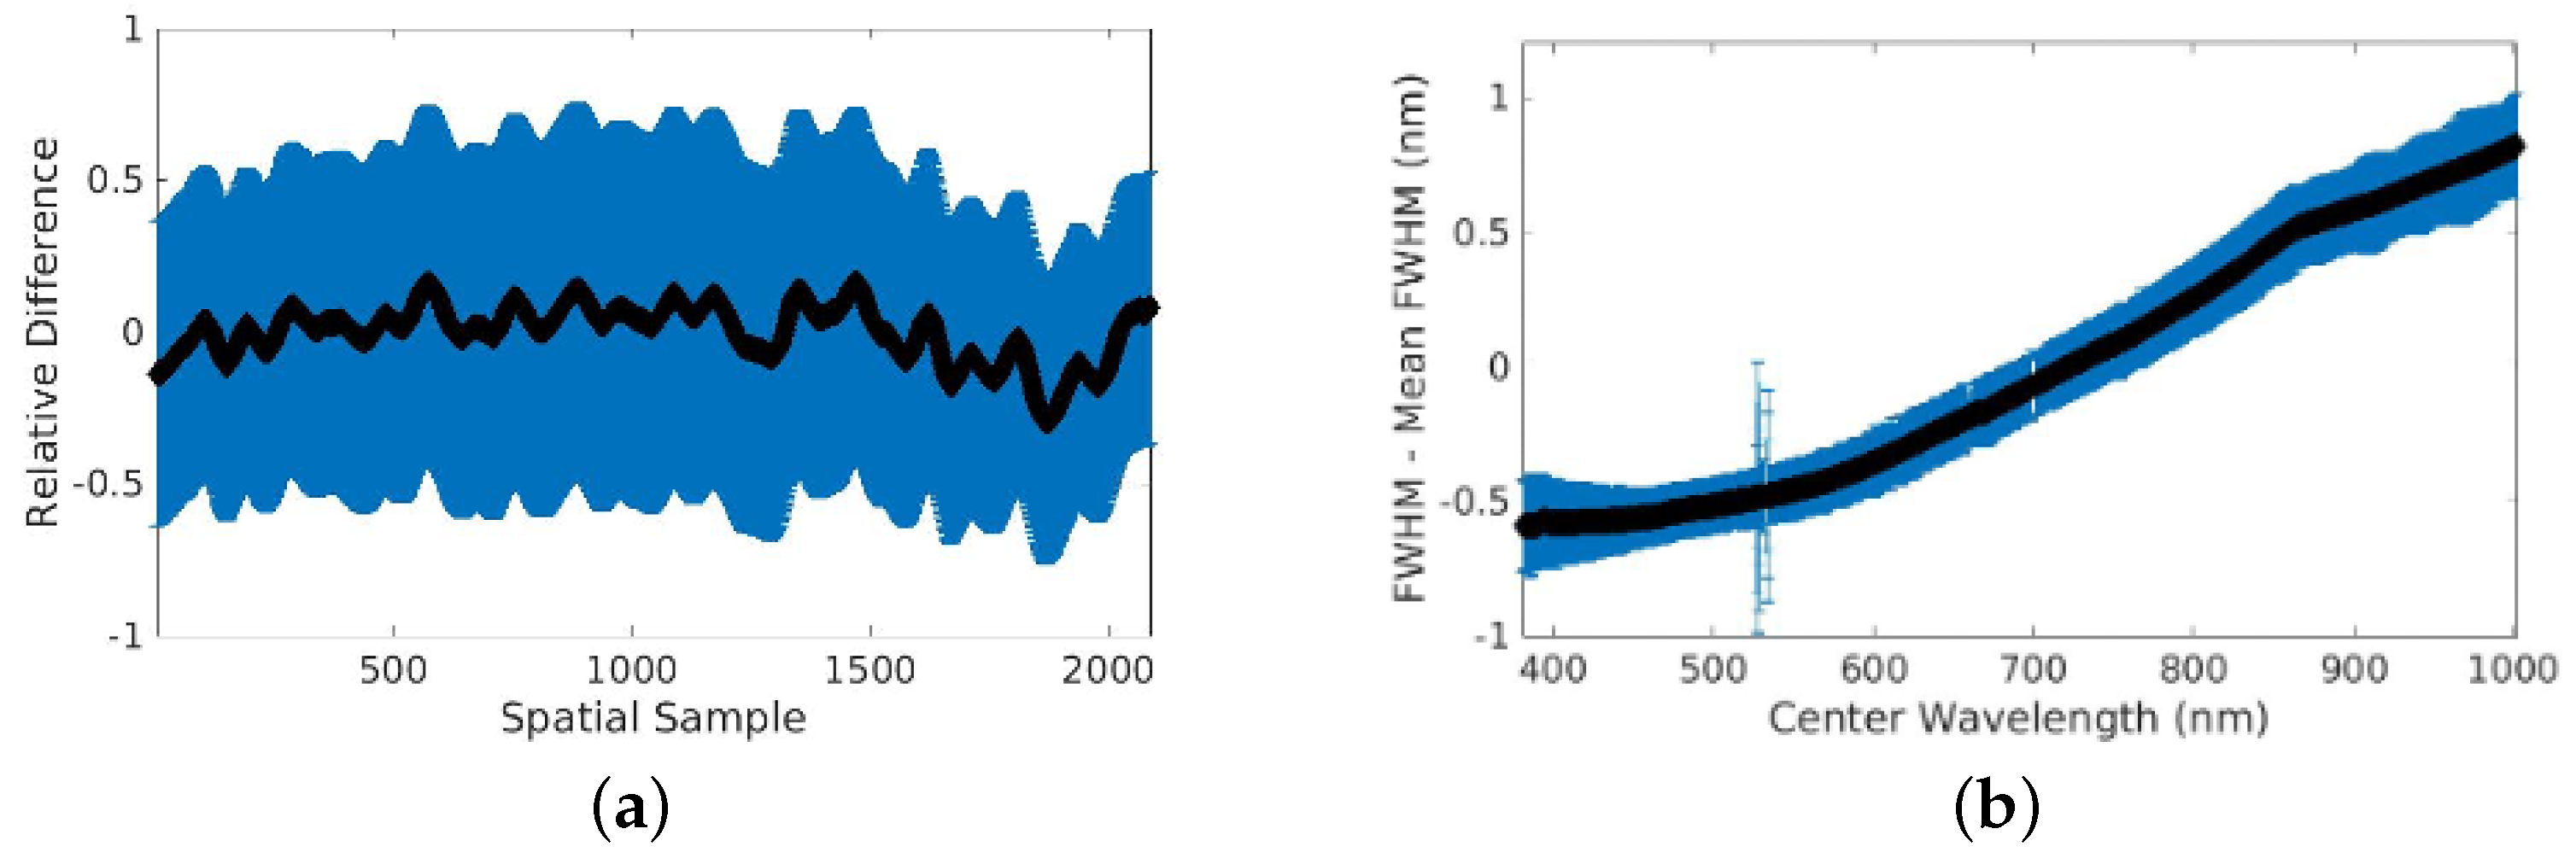
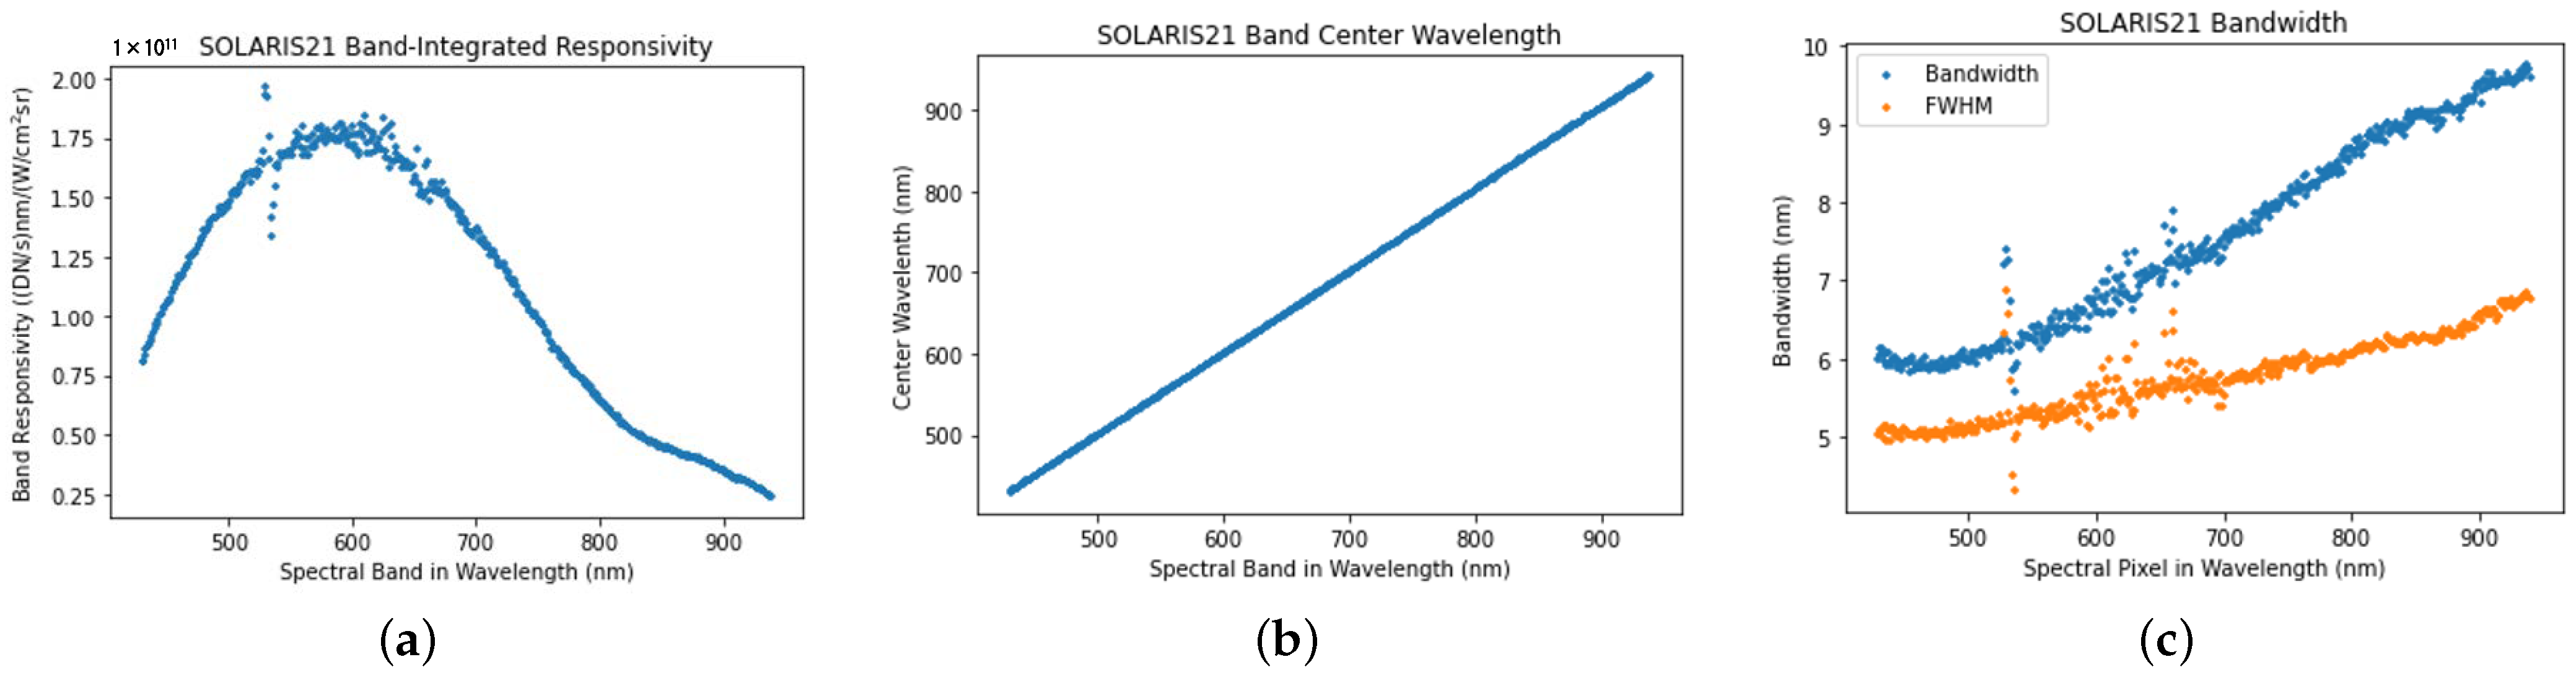
4.4. Characterization of Band Parameters
5. Discussion
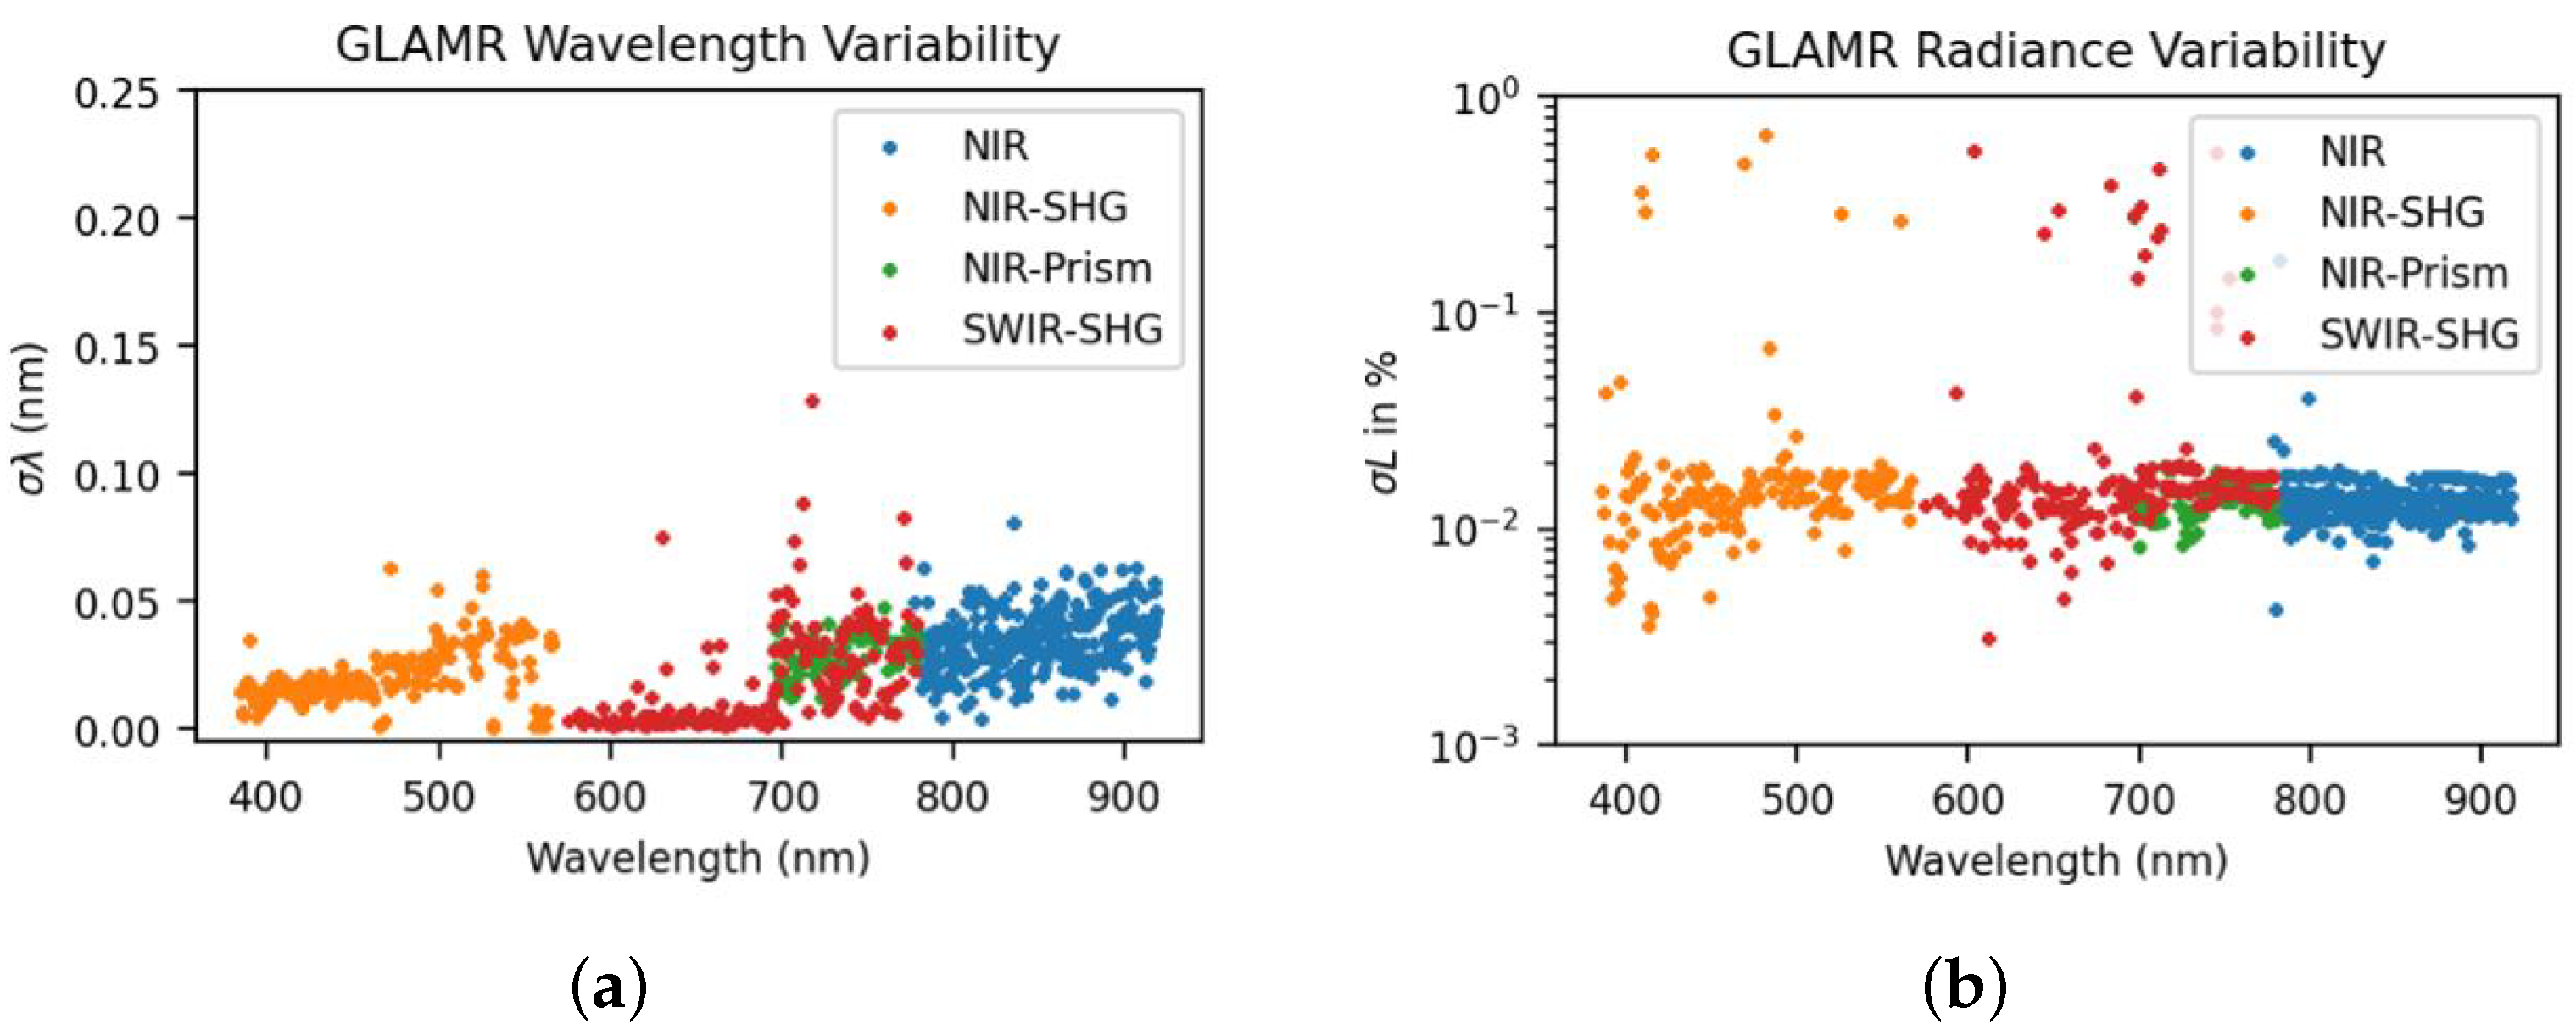
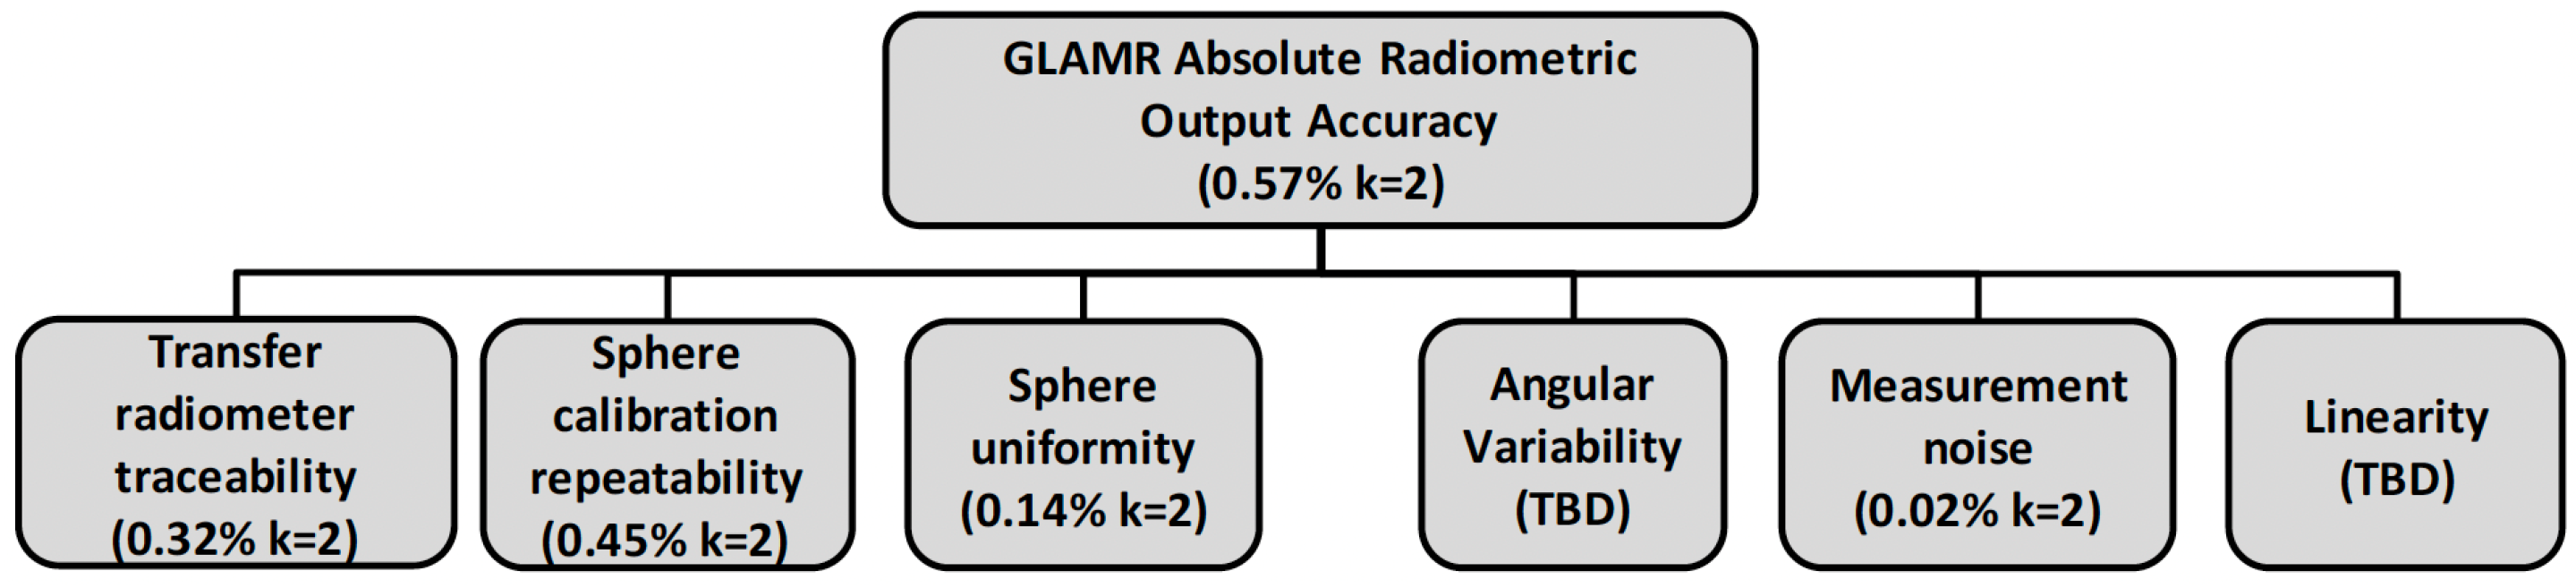
5.1. Uncertainties
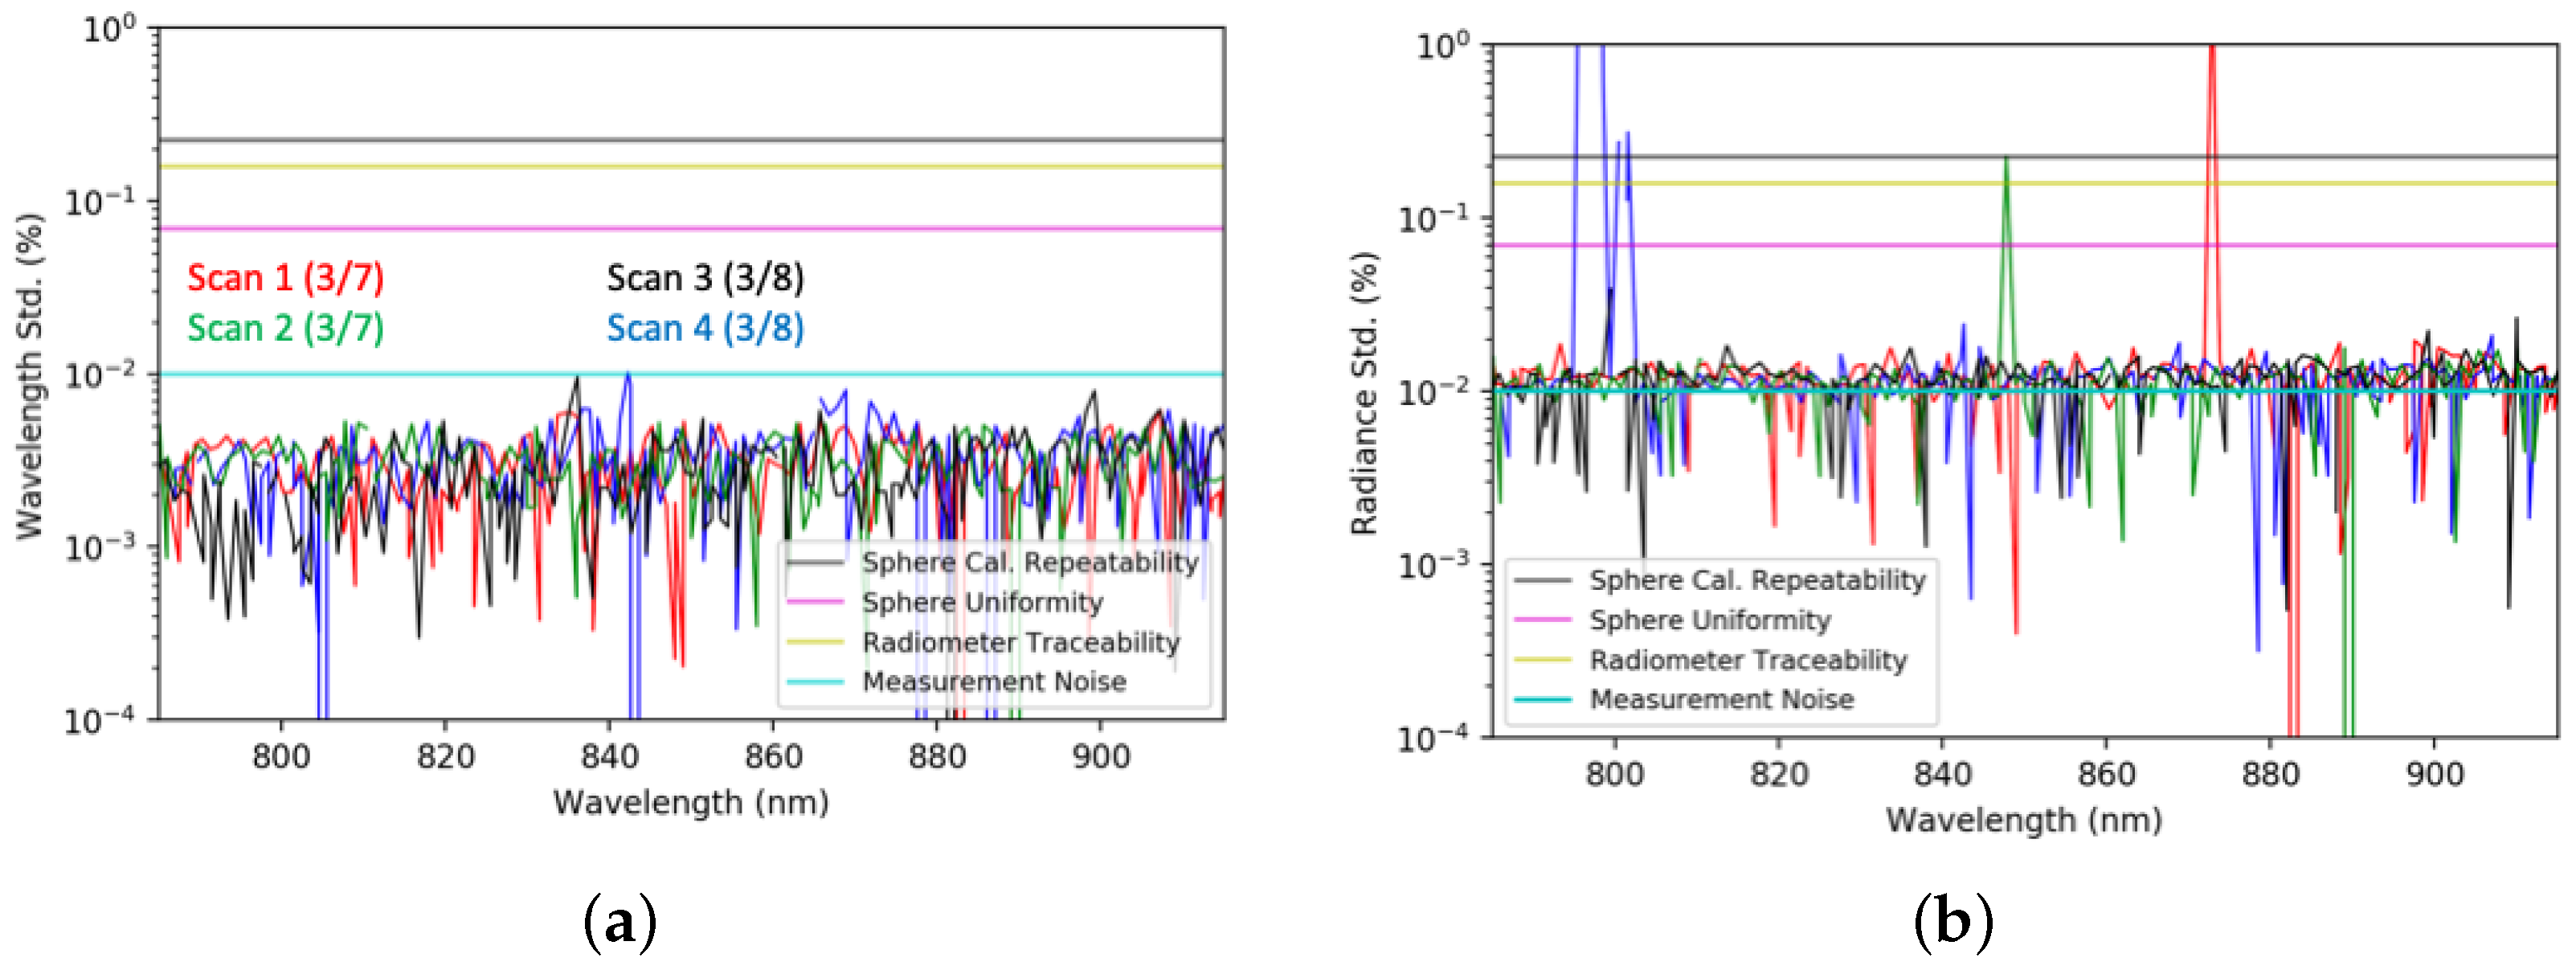
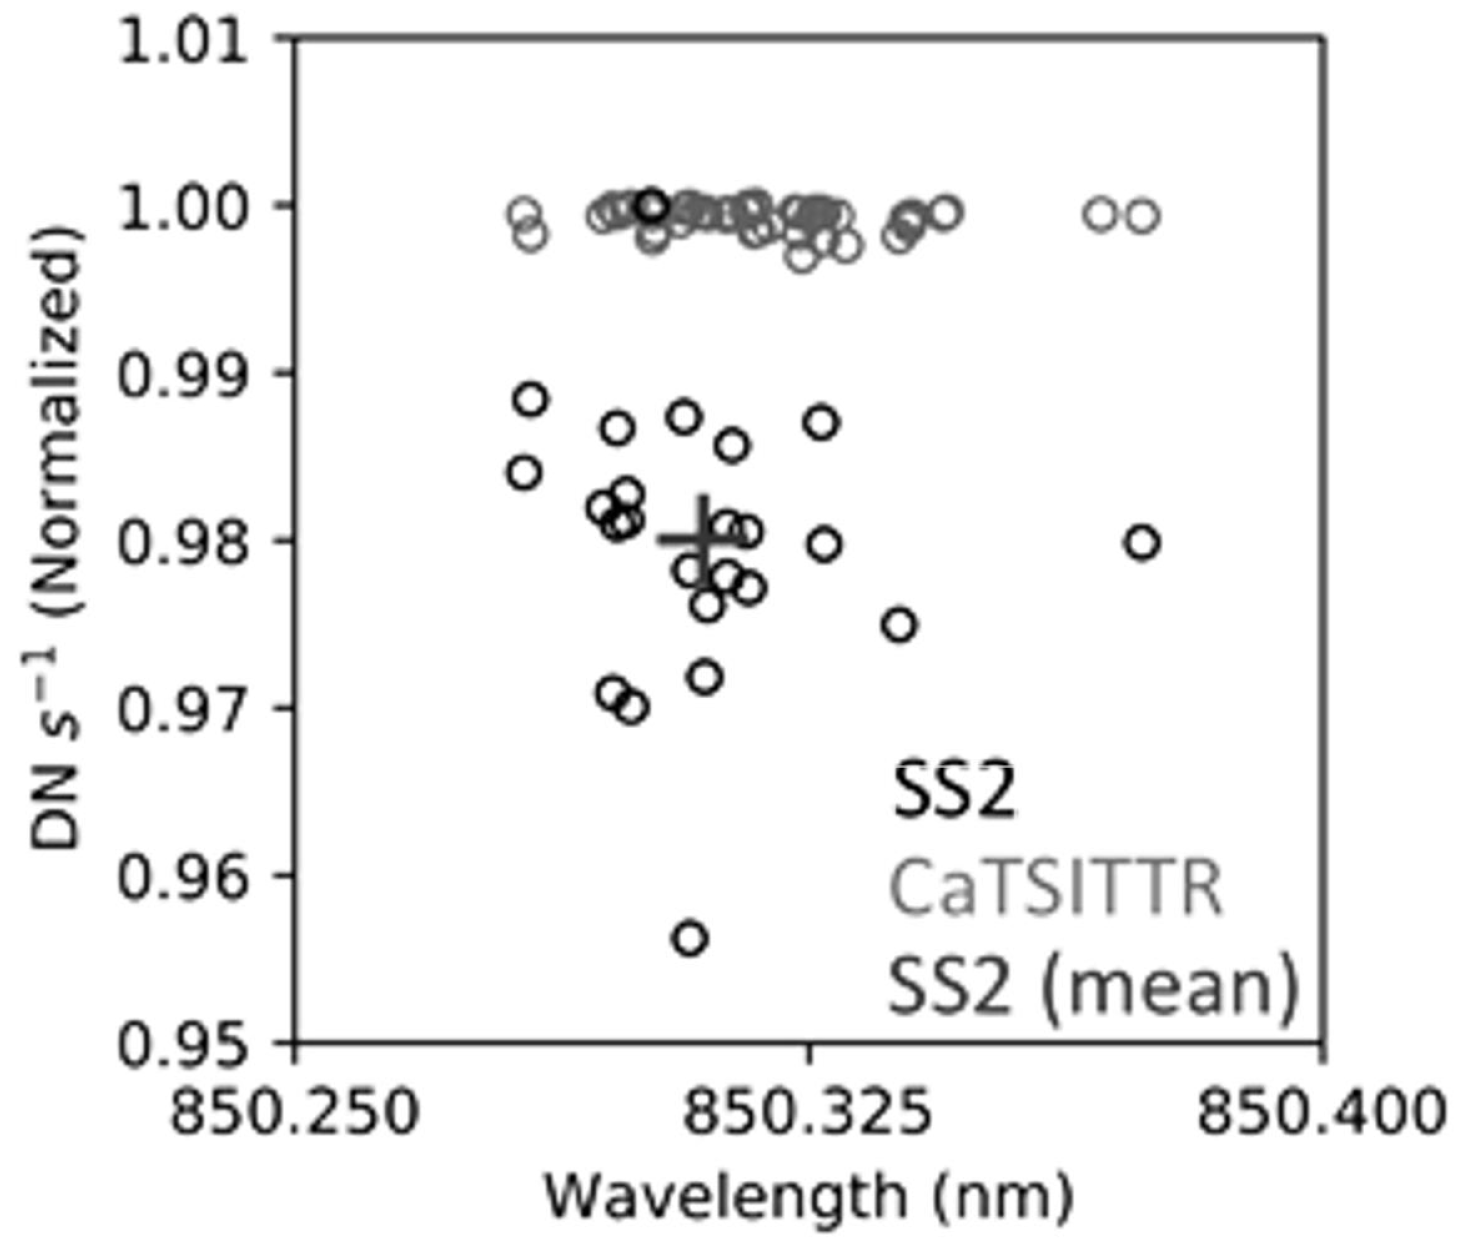
5.2. Repeatability
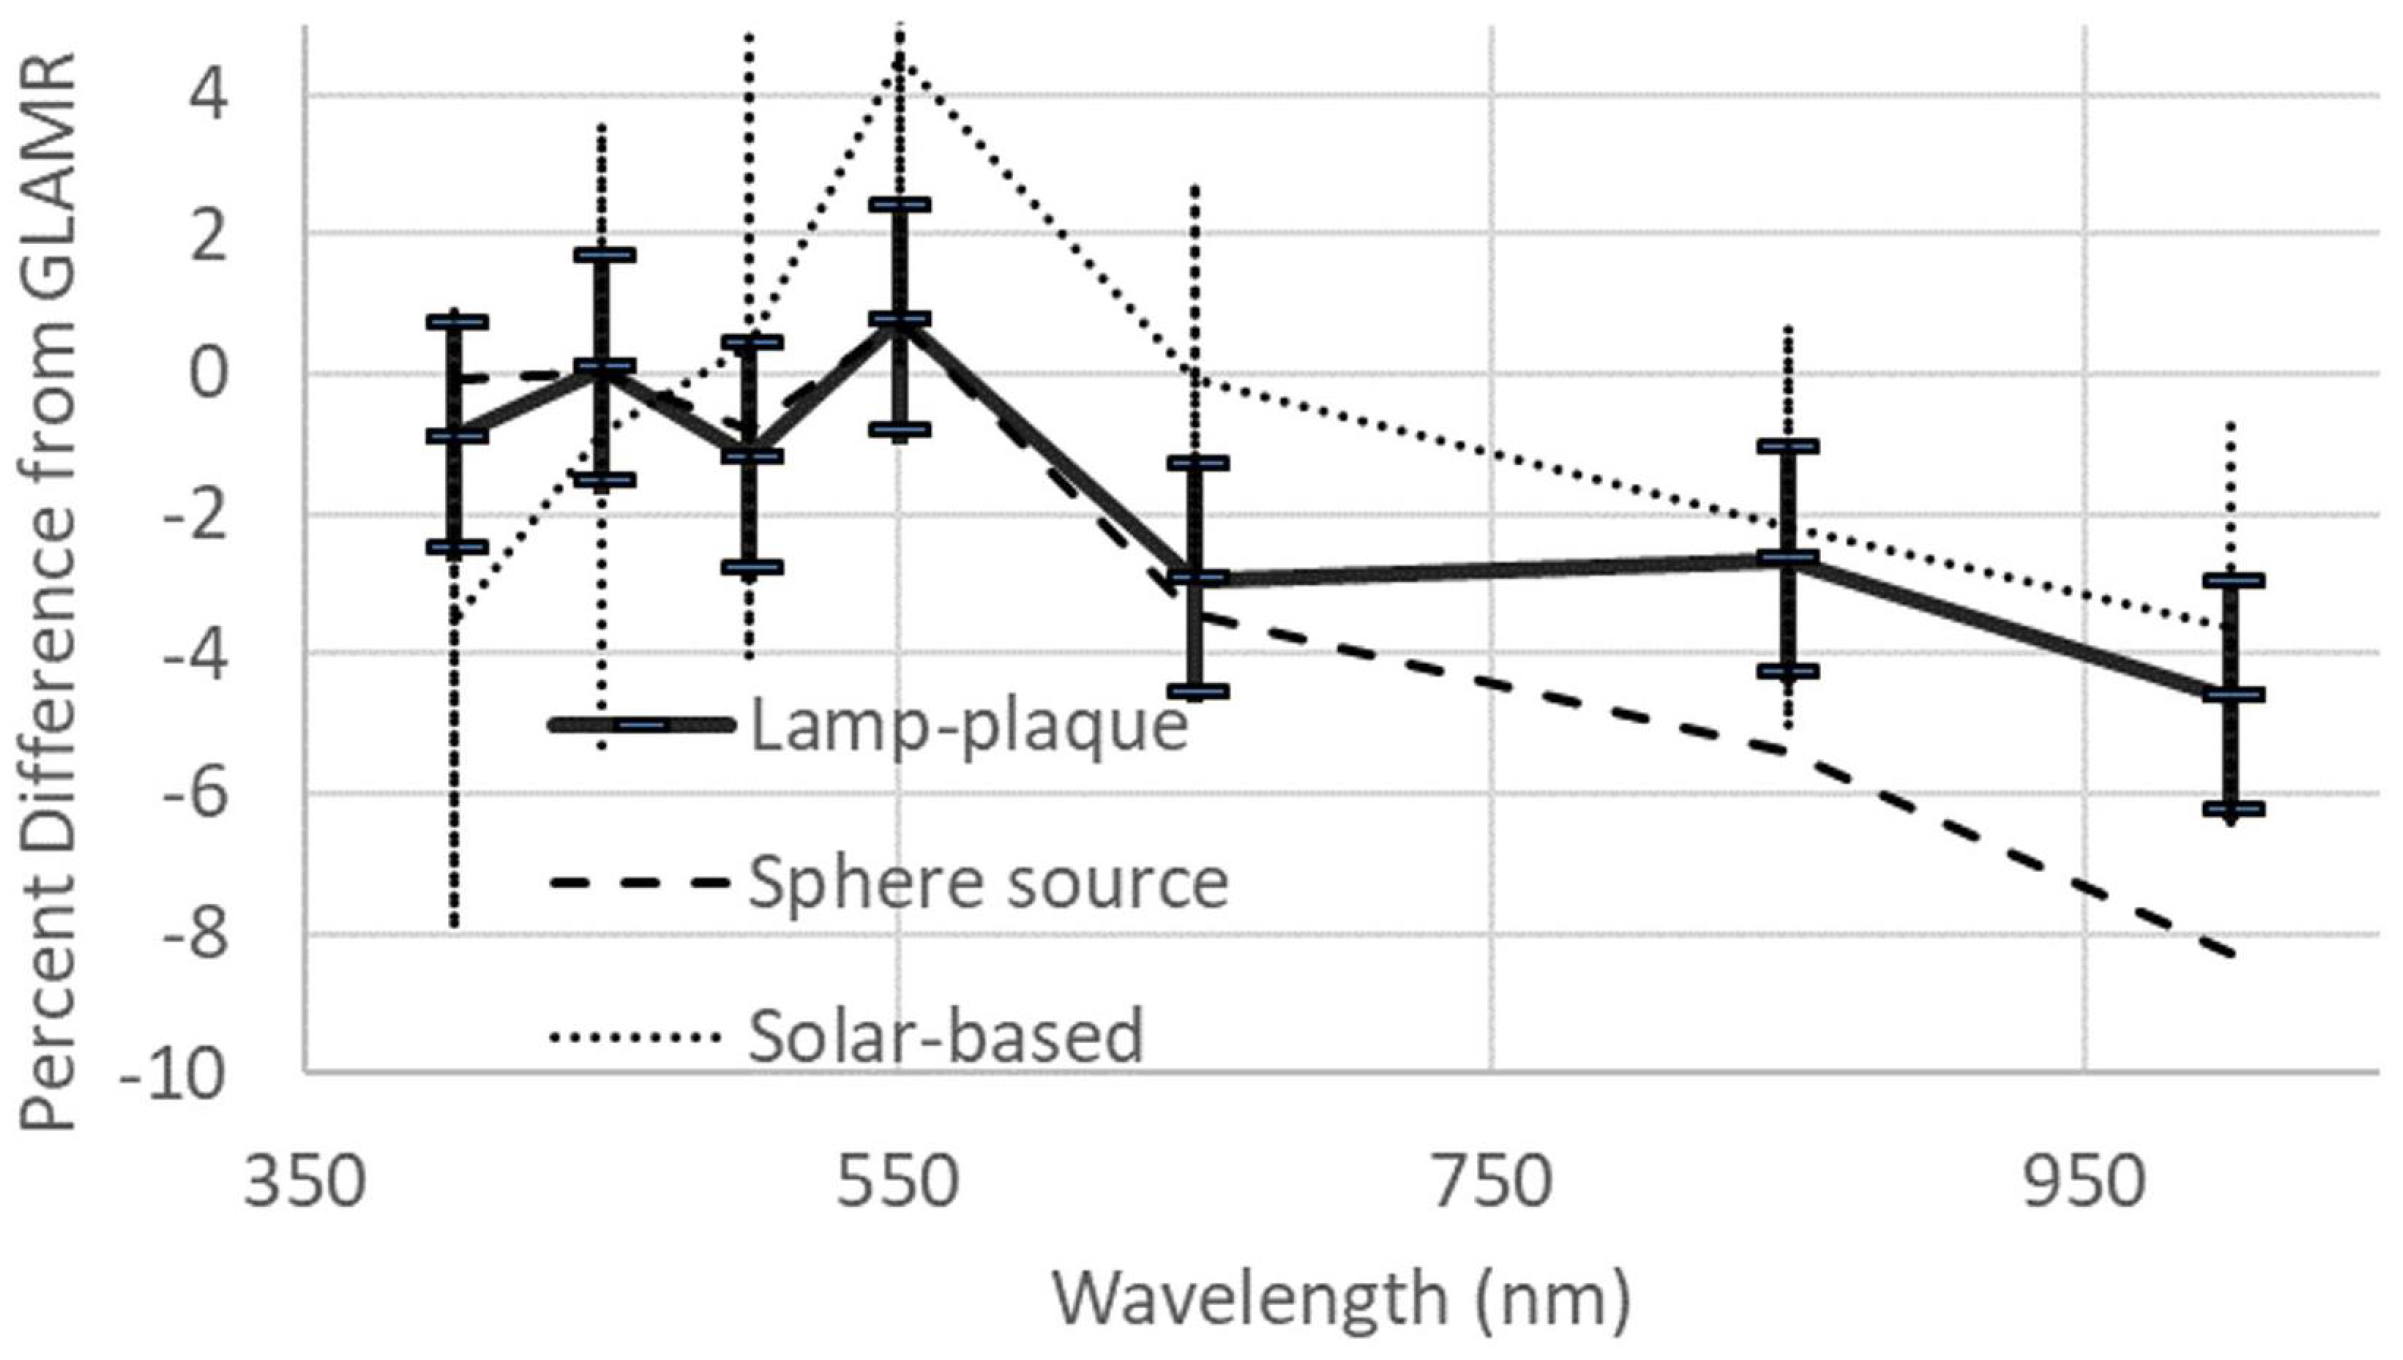
5.3. Multi-Spectral Source-Based Results
6. Conclusions
Author Contributions
Funding
Data Availability Statement
Acknowledgments
Conflicts of Interest
References
- Cao, C.; Luccia, F.J.D.; Xiong, X.; Wolfe, R.; Weng, F. Early on-orbit performance of the Visible Infrared Imaging Radiometer Suite onboard the Suomi National Polar-Orbiting Partnership (S-NPP) satellite. IEEE Trans. Geosci. Remote Sens. 2014, 52, 1142–1156. [Google Scholar] [CrossRef] [Green Version]
- Thome, K.J.; Helder, D.L.; Aaron, D.; Dewald, J.D. Landsat-5 TM and Landsat-7 ETM+ absolute radiometric calibration using the reflectance-based method. IEEE Trans. Geosci. Remote Sens. 2004, 42, 2777–2784. [Google Scholar] [CrossRef]
- Xiong, X.; Butler, J.; Chiang, K.; Efremova, B.; Fulbright, J.; Lei, N.; McIntire, J.; Oudrari, H.; Sun, J.; Wang, Z.; et al. VIIRS on-orbit calibration methodology and performance. J. Geophys. Res. Atmos. 2013, 119, 5065–5078. [Google Scholar] [CrossRef]
- Cao, C.; Xiong, J.; Blonski, S.; Liu, Q.; Uprety, S.; Shao, X.; Bai, Y.; Weng, F. Suomi NPP VIIRS sensor data record verification, validation, and long-term performance monitoring. J. Geophys. Res. Atmos. 2013, 118, 11664–11678. [Google Scholar] [CrossRef]
- Wielicki, B.A.; Young, D.F.; Mlynczak, M.G.; Thome, K.J.; Leroy, S.; Corliss, J. Achieving climate change absolute accuracy in orbit. Bull. Am. Meteorol. Soc. 2013, 94, 1519–1539. [Google Scholar] [CrossRef] [Green Version]
- CLARREO Pathfinder Mission. Available online: https://clarreo-pathfinder.larc.nasa.gov/ (accessed on 22 February 2022).
- TRUTHS Satellite Calibration Mission. Available online: https://www.esa.int/Applications/Observing_the_Earth/TRUTHS (accessed on 22 February 2022).
- Lukashin, C.; Wielicki, B.A.; Young, D.F.; Thome, K.; Jin, Z.; Sun, W. Uncertainty estimates for imager reference inter-calibration with CLARREO reflected solar spectrometer. IEEE Trans. Geosci. Remote Sens. 2013, 51, 1425–1436. [Google Scholar] [CrossRef]
- Kopp, G.; Smith, P.; Belting, C.; Castleman, Z.; Drake, G.; Espejo, J.; Heuerman, K.; Lanzi, J.; Stuchlik, D. Radiometric flight results from the HyperSpectral Imager for Climate Science (HySICS). Geosci. Instrum. Method. Data Syst. 2017, 6, 169–191. [Google Scholar] [CrossRef] [Green Version]
- Woodward, J.T.; Shaw, P.S.; Yoon, H.W.; Zong, Y.; Brown, S.W.; Lykke, K.R. Invited Article: Advances in tunable laser-based radiometric calibration applications at the National Institute of Standards and Technology, USA. Rev. Sci. Instrum. 2016, 89, 091301. [Google Scholar] [CrossRef] [PubMed]
- McIntire, J.; Moyer, D.; Brown, S.W.; Lykke, K.R.; Waluschka, E.; Oudrari, H.; Xiong, X. Monochromatic measurements of the JPSS-1 VIIRS polarization sensitivity. Appl. Opt. 2016, 55, 7444–7454. [Google Scholar] [CrossRef] [PubMed] [Green Version]
- McAndrew, B.; McCorkel, J.; Shuman, T.; Zukowski, B.; Traore, A.; Rodriguez, M.; Brown, S.; Woodward, J. Goddard laser for absolute measurement of radiance for instrument calibration in the ultraviolet to short wave infrared. In Proceedings of the Conference on Lasers and Electro-Optics (CLEO), San Jose, CA, USA, 5–10 May 2018; pp. 1–2. [Google Scholar]
- Barsi, J.A.; McCorkel, J.; McAndrew, B.; Zukowski, B.; Shuman, T.; Johnston, S.; Markham, B. Spectral testing of the Landsat-9 OLI-2 instrument using the Goddard Laser Absolute Measurement of Radiance (GLAMR). In Earth Observing Systems XXIII; International Society for Optics and Photonics: Bellingham, WA, USA, 2018; Volume 10764, p. 1076405. [Google Scholar]
- Angal, A.; McCorkel, J.; Thome, K. Evaluation of GLAMR-based calibration for SI-traceable field reflectance retrievals. In Earth Observing Systems XXI; SPIE: Bellingham, WA, USA, 2016; Volume 9972, p. 99721U. [Google Scholar]
- International Vocabulary of Metrology—Basic and General Concepts and Associated Terms (VIM), 3rd ed. 2006. Available online: https://www.nist.gov/system/files/documents/pml/div688/grp40/International-Vocabulary-of-Metrology.pdf (accessed on 22 February 2022).
- Wyatt, C. Radiometric Calibration: Theory and Methods, 1st ed.; Elsevier: Amsterdam, The Netherlands, 1978. [Google Scholar] [CrossRef]
- Thome, K.; Markham, B.; Barker, J.; Slater, P.; Biggar, S. Radiometric calibration of Landsat. Opt. Sci. 1997, 63, 853–858. [Google Scholar]
- Brown, S.W.; Eppeldauer, G.P.; Lykke, K.R. Facility for spectral irradiance and radiance responsivity calibrations using uniform sources. Appl. Opt. 2006, 45, 8218–8237. [Google Scholar] [CrossRef] [PubMed]
- McAndrew, B. Goddard Laser for Absolute Measurement of Radiance. In Proceedings of the Surface Biology and Geology Community Workshop, Washington, DC, USA, 12–14 October 2019. [Google Scholar]
- Houston, J.M.; Rice, J.P. NIST reference cryogenic radiometer designed for versatile performance. Metrologia 2006, 43, S31–S35. [Google Scholar] [CrossRef]
- Aytac, Y.; Thome, K.; Wenny, B.N.; Angal, A.; Shuman, T.M.; McAndrew, B. Detector based calibration of a portable imaging spectrometer for CLARREO Pathfinder mission. In Earth Observing Systems XXIV; International Society for Optics and Photonics: Bellingham, WA, USA, 2019; Volume 11127, p. 111270A. [Google Scholar] [CrossRef] [Green Version]
- Folkman, M.A.; Pearlman, J.; Liao, L.B.; Jarecke, P.J. EO-1 Hyperion hyperspectral imager design, development, characterization, and calibration. Hyperspectral Remote. Sens. Land Atmos. 2001, 4151, 40–51. [Google Scholar] [CrossRef]
- Barnes, R.A.; Brown, S.W.; Lykke, K.R.; Guenther, B.; Butler, J.J.; Schwarting, T.; Turpie, K.; Moyer, D.; DeLuccia, F.; Moeller, C. Comparison of two methodologies for calibrating satellite instruments in the visible and near-infraed. Appl. Opt. 2015, 54, 10376–10396. [Google Scholar] [CrossRef] [PubMed] [Green Version]
- Thome, K.; McCorkel, J.; McAndrew, B. Demonstrating the error budget for the Climate Absolute Radiance and Refractivity Observatory through solar irradiance measurements. In Earth Observing Systems XX; International Society for Optics and Photonics: Bellingham, WA, USA, 2015; Volume 9607, p. 96071C. [Google Scholar] [CrossRef]
- Thome, K.; Aytac, Y. Independent calibration approach for the CLARREO Pathfinder Mission. In Imaging Spectrometry XXIII: Applications, Sensors, and Processing; International Society for Optics and Photonics: Bellingham, WA, USA, 2019; Volume 11130, p. 111300B. [Google Scholar] [CrossRef]
- Thome, K.; Wenny, B.; Anderson, N.; McCorkel, J.; Czapla-Myers, J.; Biggar, S. Ultra-portable field transfer radiometer for vicarious calibration of earth imaging sensors. Metrologia 2018, 55, S104–S107. [Google Scholar] [CrossRef] [PubMed] [Green Version]
- Salehi, F.; Thome, K.; Wenny, B.N.; Lockwood, R.; Wang, Z. Band averaged response sensitivity study of an imaging spectrometer for CLARREO Pathfinder mission. Remote Sens. 2022; submitted. [Google Scholar]
- Anderson, N.; Thome, K.; Czapla-Myers, J.; Biggar, S. Design of an ultra-portable field transfer radiometer supporting automated vicarious calibration. In Earth Observing Systems XX; SPIE: Bellingham, WA, USA, 2015; Volume 9607, p. 960709. [Google Scholar]
- Thome, K.; Czapla-Myers, J.; Wenny, B.; Andersonr, N. Calibration and use of an ultra-portable field transfer radiometer for automated vicarious calibration. In Earth Observing Systems XXII; International Society for Optics and Photonics: Bellingham, WA, USA, 2017; Volume 10402, p. 104020L. [Google Scholar]


| Laser Type | Wavelength Range (nm) |
|---|---|
| OPO_NIR_SHG | 385–550 |
| OPO_SWIR_SHG | 550–700 |
| OPO_NIR | 700–1100 |
| OPO_SWIR | 1100–1200 |
| OPO_NIR_Idler | 1200–2200 |
| CLT | 2000–2500 |
| ARGOS | 2185–2500 |
| Date | Wavelength Range (nm) | (nm) | Laser Type |
|---|---|---|---|
| 7 March 2019 | 770–1000 | 1 | NIR |
| 8 March 2019 | 770–920 | 1 | NIR |
| 12 March 2019 | 385–568 | 1 | NIR-SHG |
| 13 March 2019 | 568–700 | 1 | SWIR-SHG |
| 14 March 2019 | 700–780 | 1 | NIR |
| 29 April 2019 | 378–470 | 1 | NIR-SHG |
| 30 April 2019 | 467–572 | 1 | NIR-SHG |
| 30 April 2019 | 778–1012 | 1 | NIR |
| 1 May 2019 | 560–779 | 1 | SWIR-SHG |
| 7 May 2019 | 560–675 | 0.5 | SWIR-SHG |
| 8 May 2019 | 560–675 | 0.5 | NIR-SHG |
Publisher’s Note: MDPI stays neutral with regard to jurisdictional claims in published maps and institutional affiliations. |
© 2022 by the authors. Licensee MDPI, Basel, Switzerland. This article is an open access article distributed under the terms and conditions of the Creative Commons Attribution (CC BY) license (https://creativecommons.org/licenses/by/4.0/).
Share and Cite
Wang, Z.; Thome, K.; Lockwood, R.; Wenny, B.N. Absolute Radiometric Calibration of an Imaging Spectroradiometer Using a Laboratory Detector-Based Approach. Remote Sens. 2022, 14, 2245. https://doi.org/10.3390/rs14092245
Wang Z, Thome K, Lockwood R, Wenny BN. Absolute Radiometric Calibration of an Imaging Spectroradiometer Using a Laboratory Detector-Based Approach. Remote Sensing. 2022; 14(9):2245. https://doi.org/10.3390/rs14092245
Chicago/Turabian StyleWang, Zhipeng, Kurtis Thome, Ronald Lockwood, and Brian N. Wenny. 2022. "Absolute Radiometric Calibration of an Imaging Spectroradiometer Using a Laboratory Detector-Based Approach" Remote Sensing 14, no. 9: 2245. https://doi.org/10.3390/rs14092245