Article

Identification of Supercooled Cloud Water by FY-4A Satellite and Validation by CALIPSO and Airborne Detection

1
Meteorological Institute of Shaanxi Province, Xi’an 710016, China
2
Key Laboratory of Eco-Environment and Meteorology for the Qinling Mountains and Loess Plateau, Xi’an 710016, China
3
School of Atmospheric Sciences, Nanjing University, Nanjing 210023, China
4
Joint International Research Laboratory of Atmospheric and Earth System Sciences & Institute for Climate and Global Change Research, Nanjing University, Nanjing 210023, China
5
Center of Weather Modification of Shaanxi Province, Xi’an 710016, China
6
Shanxi Artificial Precipitation Enhancement and Lightning Protection Technical Center, Taiyuan 030032, China
*
Author to whom correspondence should be addressed.
These authors contributed equally to this work.
Remote Sens. 2023, 15(1), 126; https://doi.org/10.3390/rs15010126
Submission received: 23 November 2022 / Revised: 15 December 2022 / Accepted: 15 December 2022 / Published: 26 December 2022
(This article belongs to the Special Issue Remote Sensing of Aerosol, Cloud and Their Interactions)

Abstract

:
Cold clouds are the main operation target of artificial precipitation enhancement, and its key is to find a supercooled cloud water area where the catalyst can be seeded to promote the formation of precipitation particles and increase precipitation to the ground. Based on the multi-spectral characteristics of the Fengyun-4A (FY-4A) satellite, a methodology for identifying supercooled cloud water is developed. Superimposed by a cloud top brightness temperature of 10.8 µm, a combination of 0.46 µm, 1.6 µm, and 2.2 µm red–green–blue (RGB) composites are used to identify the cloud phase and to obtain the real-time supercooled cloud water distribution every 5 min and in a 2 km resolution for the whole coverage of China. Based on the RGB composition, the supervised machine learning method K-mean clustering was applied to classify the cloud top phase. The results were validated extensively with Cloud–Aerosol Lidar with Orthogonal Polarization (CALIOP). It is worthwhile to highlight that the corresponding hit rate reached 87% over the full disk domain for both the summer and winter seasons. Furthermore, on 29 November 2019, microphysical properties were measured, and the data of supercooled cloud droplets and ice crystals were obtained using YUN-12 transport aircraft in Taiyuan. After simultaneously matching the satellite with an airborne track, the cloud particle image data were obtained near the cloud top and within the clouds during the climb and descending stages of the flight. The phase obtained from the microphysical properties of supercooled cloud droplets and ice crystals was compared with cloud phase results identified by FY-4A and Moderate Resolution Imaging Spectroradiometer (MODIS) cloud phase products. The case study and comparison show that (1) the supercooled water clouds and ice particles identified by FY-4A are in good agreement with those from the airborne measurement at the cloud top and within the cloud and (2) the positions and shapes of water clouds and ice clouds identified by FY-4A correspond well with MODIS cloud phase products. However, there is a small deviation in the extent of ice clouds, which is mainly located in the transition area between ice clouds and water clouds. The extent of ice clouds identified by FY-4A is slightly larger than that of MODIS products. Combined with airborne detection, the comparison shows that the ice clouds identified by the FY-4A satellite are consistent with aircraft detection. The supercooled cloud water identified by FY-4A can meet the needs of the operational precipitation enhancement of cold clouds, improve operational effectiveness, and promote the application of satellite technology for weather modification.

Graphical Abstract

1. Introduction

Supercooled cloud water refers to liquid cloud droplets below 0 °C, and it is the main target for precipitation enhancement operations within cold clouds [1]. Precipitation enhancement has been addressed by local and central governments in China because it is important to alleviate the shortage of water resources and mitigate drought disasters. Cold clouds are one of the main seeding cloud bodies, and supercooled cloud water areas are critical to learning the distribution and evolution of supercooled cloud water for the rational design of operation schemes and the improvement of operational effects in advance [2,3,4,5]. However, supercooled cloud water has not been efficiently identified due to the limitations of the detection methodology. Rain radar can observe precipitation particles in clouds (raindrops, crystals, etc.) rather than cloud droplets. Cloud radar can detect cloud particles with a limited detection range because of electromagnetic waves attenuated by cloud rain. Aircraft can only detect supercooled cloud droplets along a flight route, while satellites can observe small cloud particles in a wide range of clouds with high spatial and temporal resolutions. Hence, it is urgent to develop a method to identify supercooled cloud water using the Fengyun-4A (FY-4A) satellite and apply it to cold cloud rain enhancement operations.
The key to identifying supercooled cloud water with satellites is the identification of the cloud phase, which is also related to the temperature of the cloud top. Because of the different characteristics of the satellite sensor, multiple identification algorithms of the cloud top phase have been proposed in many studies. Ackerman et al. [6] proposed a tri-spectral cloud phase identification algorithm by analyzing the spectral properties of cirrus clouds in the 8–12 µm channels. Zhou et al. [7] examined the effectiveness of the tri-spectral method for cloud phase identification using Moderate Resolution Imaging Spectroradiometer (MODIS) data. Baum et al. [8] simplified the tri-spectral method to a bi-spectral method with a difference of 8.5 µm and 11 µm brightness temperatures to identify the cloud phase. Rossow and Schiffer [9] identified the cloud top phase with a single-spectral threshold method using an 11 µm channel brightness temperature from the Advanced Very High-Resolution Radiometer (AVHRR) data of the polar-orbiting NOAA satellites. In addition to infrared (IR) identification algorithms, visible (VIS) and near-infrared (NIR) channels are also used to identify cloud phases. King et al. [10] identified the cloud phase using reflectance ratios of 1.6, 2.1, and 0.66 µm channels from MODIS data. Arking et al. [11] retrieved cloud parameters and the cloud phase using VIS, 3.7, and 11 µm channel data from AVHRR. Using the multispectral threshold method, Liu et al. [12,13] identified the cloud phase using VIS, NIR, or mid-infrared and IR channel data from the Fengyun-1C (FY-1C) and Fengyun-2 (FY-2) satellites separately. Fengyun-3A/VIRR cloud phase products can be obtained by using threshold methods for VIS, NIR, and IR data [14]. Miller et al. [15] described a physical basis for the detection of liquid-top mixed-phase clouds from passive satellite radiometer observations, and provided an algorithm which made use of reflected sunlight in narrow bands at 1.6 and 2.25 μm to optically probe below liquid-topped clouds and determined phase, and Noh et al. [16] applied this algorithm to the Himawari-8 satellite to identify the cloud phase of the middle and lower layers of a liquid top mixed-phase cloud and tested the algorithm. Wang et al. [17] developed an algorithm to identify supercooled water clouds from Advanced Himawari Imager (AHI) data which onboard the Himawari-8 satellite. Hu et al. [18] used the 1.6 and 2.2 µm channel data of the Geostationary Operational Environmental Satellite (GOES)-16 satellite to identify the cloud top phase by clustering methods. Gao et al. [19] carried out phase identification with the FY-4 satellite using the method of ensemble-learning-based cloud phase classification with image processing, and there have been many studies [20,21,22,23] using the Back Propagation Neural Network algorithm to identify the phase of MODIS images.
The FY-4A satellite is the newest generation of Chinese geostationary meteorological satellites, equipped with an Advanced Geosynchronous Radiation Imager (AGRI) with 14 spectral bands, including VIS and IR. The spatial resolution is 0.5–1 km in VIS, 2 km in NIR, and 4 km in the remaining IR spectral bands. The full-disk temporal resolution is 15 min before and after the hour, and 5 min in other time periods in China [24]. Compared with the first generation of Chinese geostationary meteorological satellites (FY-2), the channel number is expanded from 5 to 14, with the maximum spatial resolution increased from 1.25 km to 0.5 km, and the full disk temporal resolution is enhanced from 30 min to 15 min, which provides a new data source for the rapid identification of supercooled cloud water. In this study, these three bands are combined to identify cloud top phases based on the large differences in the absorption of solar radiation by water and ice at the 0.46, 1.6, and 2.2 µm channels. In addition, the methodological approach includes using the referred three bands jointly with a brightness temperature of 10.8 µm channel, featuring the possibility of achieving the distribution of supercooled cloud water with a temporal and spatial resolution of every 5 min and 2 km in China. The accuracy of the FY-4A cloud phase is validated with the cloud phase from Cloud–Aerosol Lidar with Orthogonal Polarization (CALIOP), aircraft observations, and MODIS cloud phase products.

2. Data

The FY-4A/AGRI level 1 data for 21 May 2020 and 29 November 2019 used in this study are from the Fengyun Satellite Remote Sensing Data Service Network, and the Earth Observing System (EOS) Aqua satellite-borne MODIS MOD06_L2 C6.1 cloud product data are from the NASA Atmospheric Data Service website.
CALIOP is a dual-wavelength (532 nm and 1064 nm) depolarization lidar onboard the Cloud–Aerosol Lidar and Infrared Pathfinder Satellite Observations (CALIPSO) satellite [25]. Hu et al. [26] demonstrated that backscatter depolarization could be used for cloud phase classification. The principle is that all water particles are spherical, while ice particles are irregular in shape and subsequently result in multiple degrees of depolarization [27]. Based on this assumption, the latest CALIOP cloud phase product applied the layer-integrated depolarization ratio method and added the spatial correlation of layer-integrated attenuated backscatter as a key parameter for differentiating anisotropic ice crystals from water particles, which improved overall ice clouds observation accuracy significantly by a magnitude of 20% [26]. In this study, the CALIOP Lidar Level 2 Vertical Feature Mask (VFM) Version 4.10 cloud phase product is used as the reference for evaluating the FY-4A retrievals of the cloud top phase. In accordance with the methodology of Marchant et al. [28], 333 m resolution data are included to keep as much detailed phase information as possible.
Besides the CALIOP and MODIS cloud phase products, aircraft measurements were used to further validate the cloud top phase retrieved by FY-4A. A weather system of stratiform cold clouds accompanied by light rain and snow on the ground occurred successively in most of Shanxi Province in China on 29 November 2019. The Shanxi Province Artificial Precipitation Enhancement and Lightning Protection Technology Center carried out cloud penetration detection in the Taiyuan area using a YUN-12 transport aircraft carried with cloud physical detection equipment from Droplet Measurement Technologies Inc. (DMT) and obtained cloud particle images and environmental meteorological data within the cloud and near the cloud top. The cloud particle image is measured with DMT’s Cloud Imaging Probe (CIP), with a measurement range from 25 to 1550 μm and a resolution of 25 μm [29]. It is mainly used to detect ice crystals and larger cloud droplets. If CIP didn’t detect existing ice particles, it could be speculated that supercooled clouds exist when the temperature is below zero degrees [30].

3. Methodology

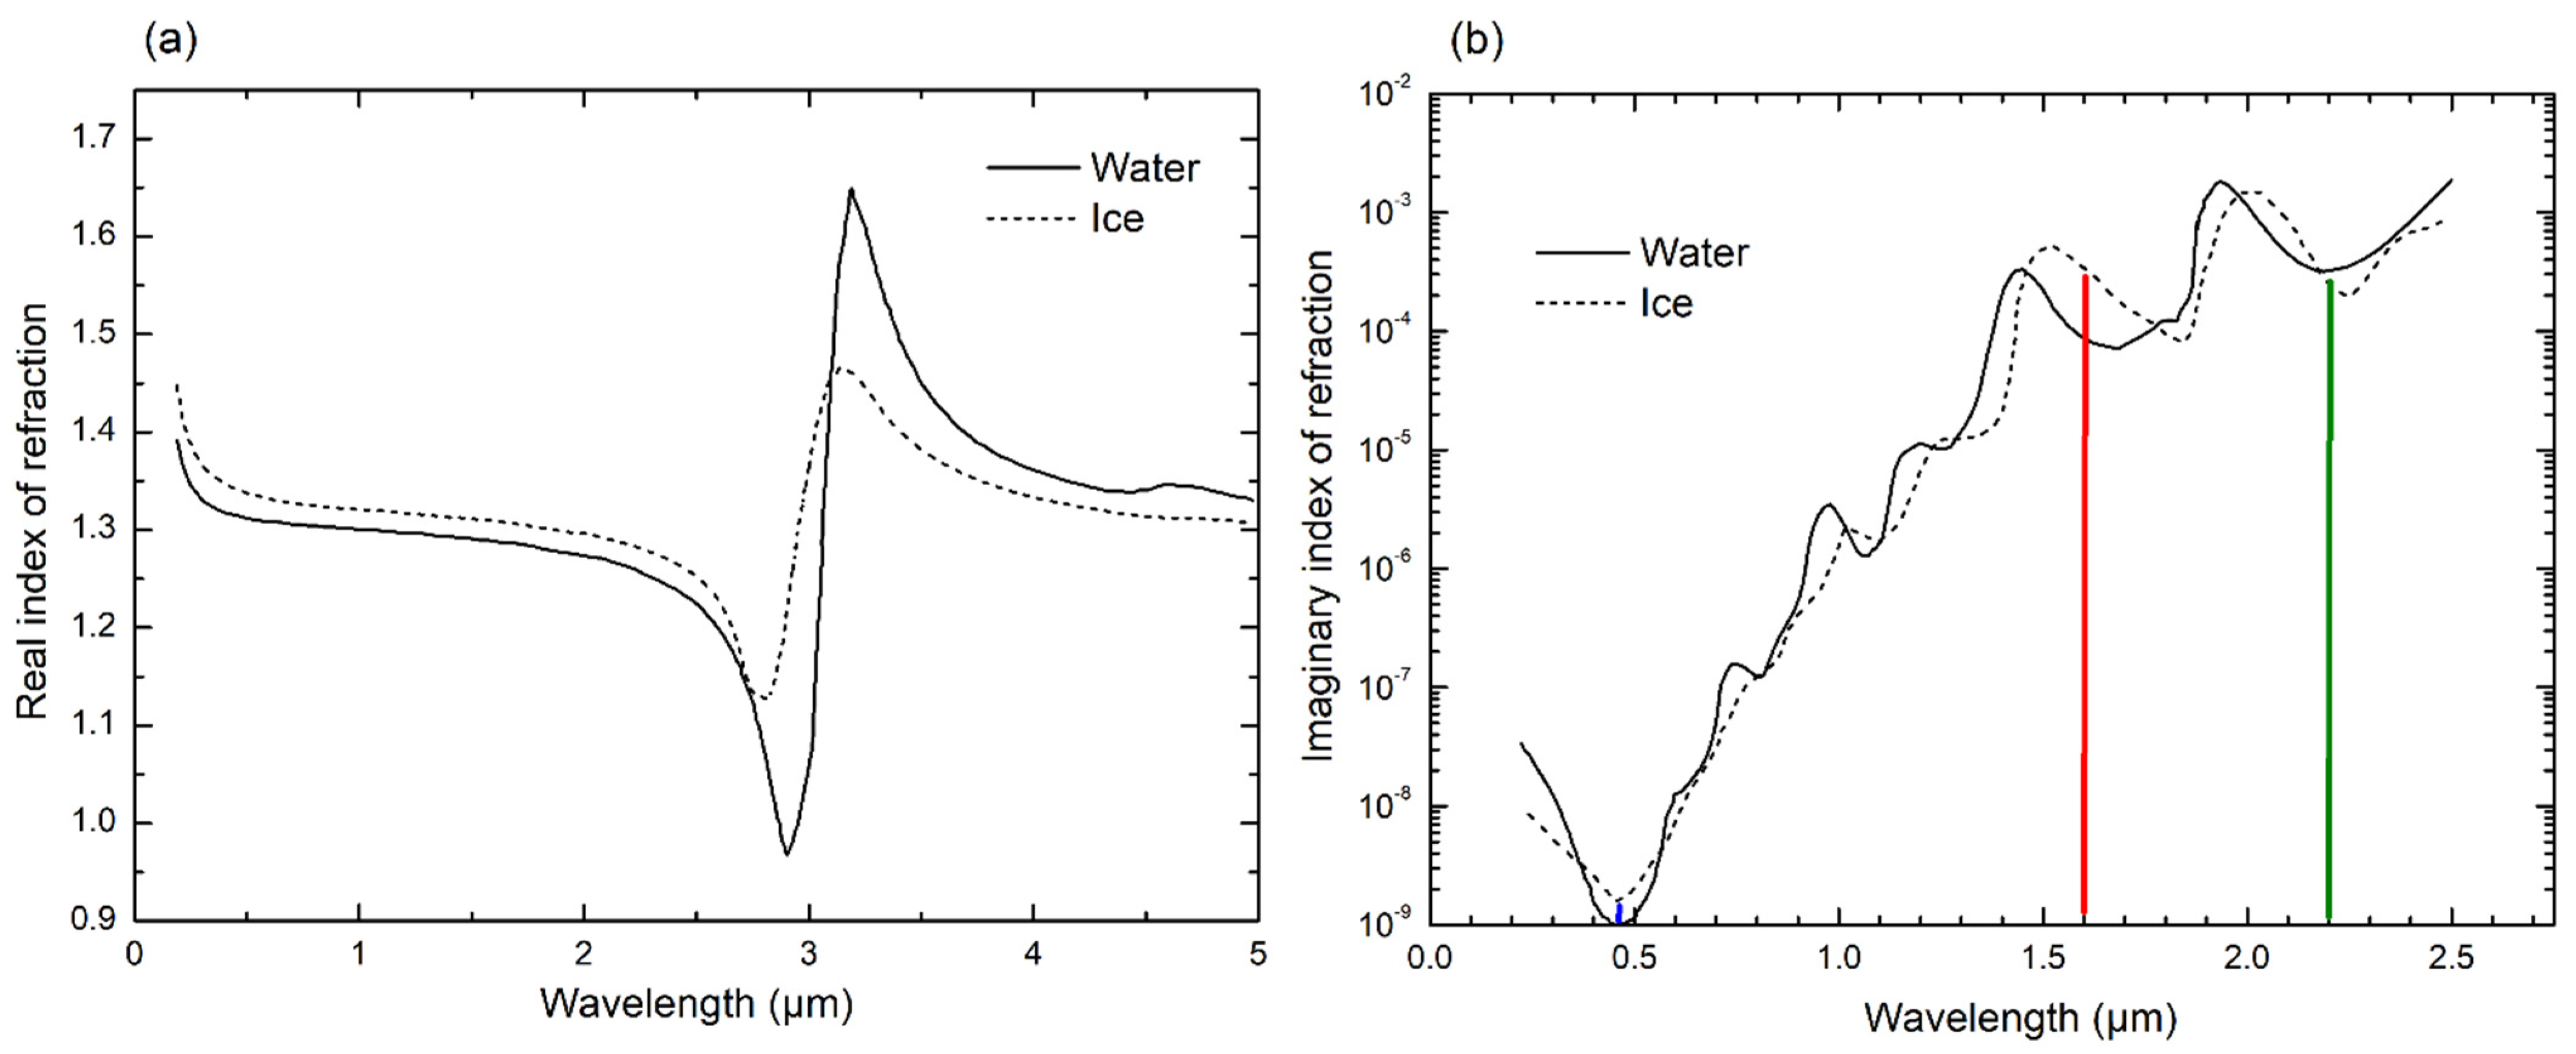
3.1. Multispectral Absorption Characteristics of Ice and Water

The radiative properties of clouds can be described using their geometric features and single-scattering properties. The single-scattering properties can be expressed using parameters such as refraction index, particle size distribution, and particle shape. If the shape, size, and density of water droplets and ice crystals are the same, the difference in solar radiation reflected by water and ice clouds is only related to the complex refraction index of water and ice. Kokhanovsky [31] showed that the real part of the complex refractive index of water and ice does not differ much in the VIS and NIR bands (Figure 1a), while Warren [32] indicated the large difference of the imaginary part in some spectral bands (e.g., 0.46 μm, 1.6 μm, 2.2 μm) (Figure 1b). The difference in absorption between ice and water in these channels affects the scattering ability of cloud particles, which, in turn, affects the reflected radiation from clouds, and less absorption by ice and water results in more reflection and a larger amount of reflected radiation received by satellites [33]. The cloud particle phase significantly affects the magnitude of cloud-reflected radiation. The cloud top particle phase can be retrieved using the reflectance of VIS and NIR bands [16,34,35,36].
Figure 1b shows the variation in the absorption of water and ice at the 0.25–2.5 µm bands, and the vertical lines in the figure correspond to FY-4A/AGRI 0.46 µm, 1.6 µm, and 2.2 µm channels. As shown in Figure 1b, the absorption of ice and water in some bands has significant differences, which are useful for distinguishing cloud phases. At 0.25–0.45 µm, the absorption of ice and water is very small; its value is less than 10−7. When the wavelength is greater than 0.45 µm, the absorption increases with the wavelength, up to about 10−3. At the 0.46 µm and 1.6 µm channels, the absorption of ice is more than 2 and 5 times that of water, respectively. At the 2.2 µm channel, water is slightly more absorptive than ice. The difference in radiation absorption by water and ice in these channels leads to the difference in their reflected radiation, which can be used to distinguish the thermodynamic phase of clouds.
Finally, according to the cloud top brightness temperature and cloud top phase, the clouds can be further classified into water clouds, supercooled clouds, and ice clouds. Therefore, this study uses a combination of the 0.46, 1.6, and 2.2 µm channels of FY-4A/AGRI to identify the cloud top phase and overlays with the brightness temperature of the cloud pixels. In this sense, a distribution map of supercooled cloud water with a temporal and spatial resolution of every 5 min and 2 km in China can be quickly obtained (Figure 2).

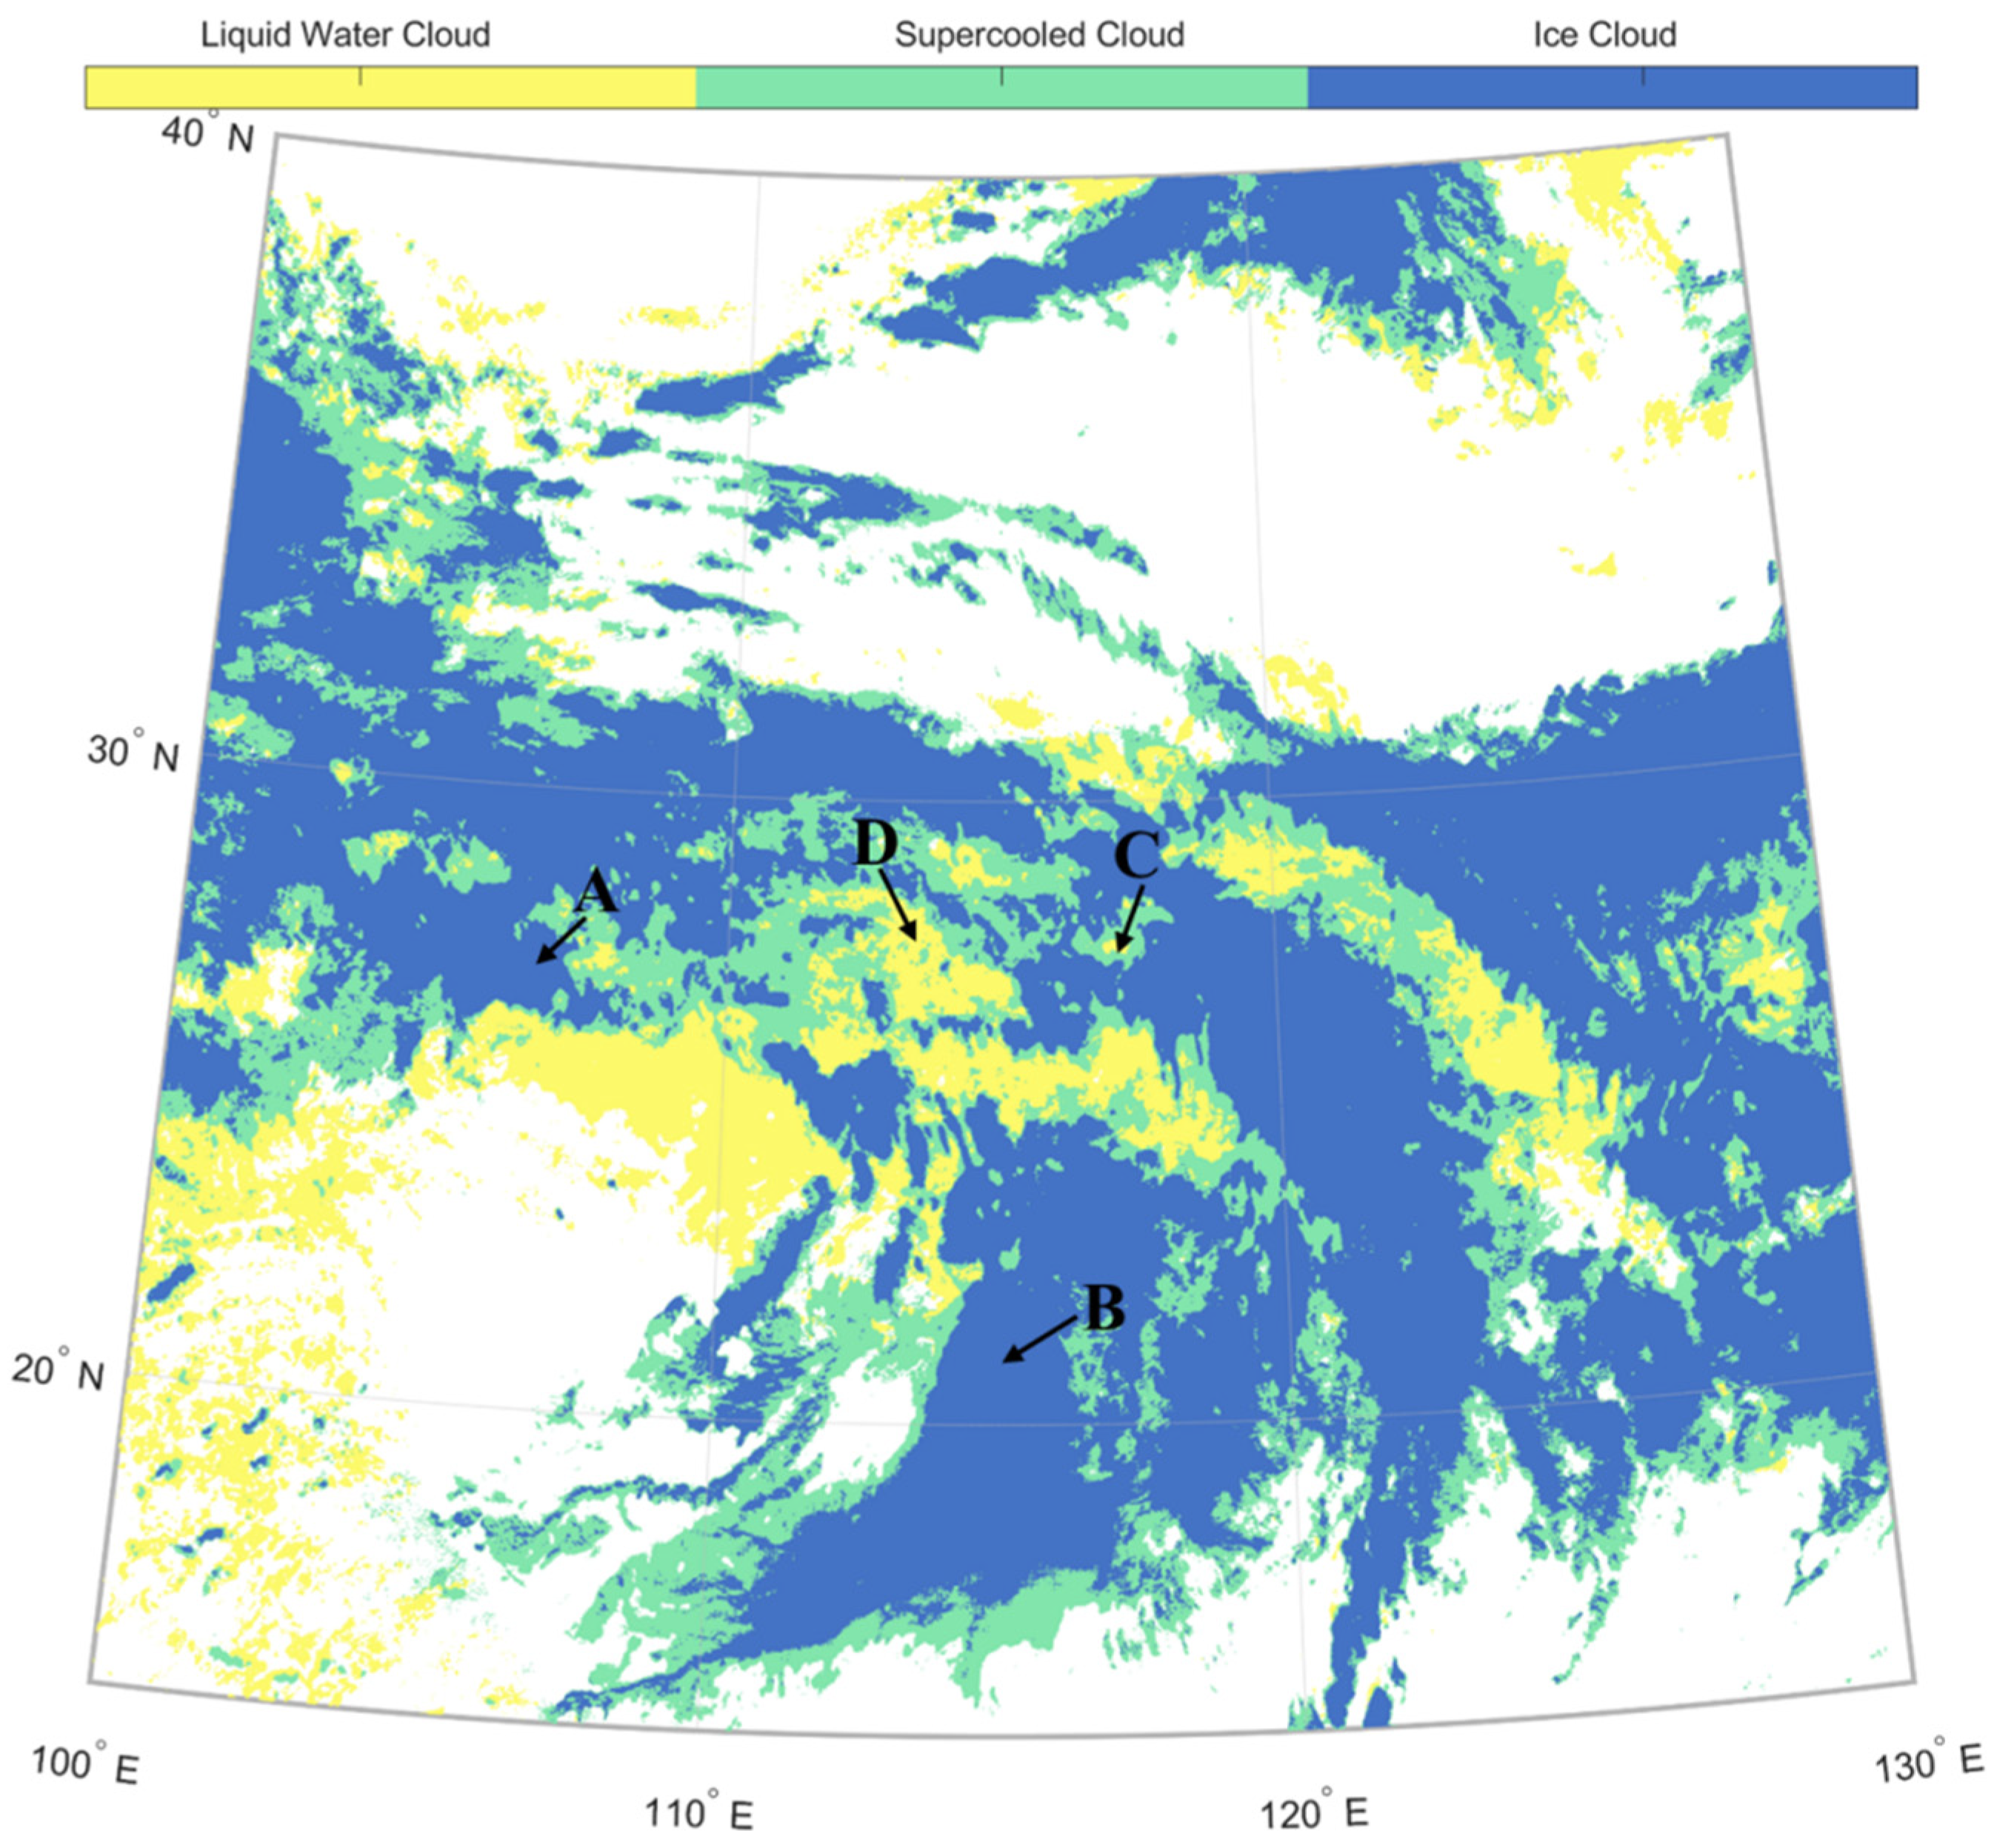
3.2. Multispectral Combined Cloud Phase Color Scheme

The reflectance at the 1.6, 2.2, and 0.46 μm channels is assigned to red (R), green (G), and blue (B), respectively, and combined to form an RGB color composition, i.e., a multispectral combined cloud phase; the color scheme was inherited from Lensky and Rosenfeld [37]. The color scheme is shown in Table 1, with 1.6 and 2.2 μm reflectance linearly normalized to 0–100% according to 0–40%, and for 0.46 μm reflectance, linearly normalized to 0–100% based on an observation value of 0–100%. Since the reflectance of ice and water is opposite in size in the 1.6 and 2.2 μm bands (Figure 1b), with 1.6 μm reflectance being red and 2.2 μm reflectance being green, the color difference between ice and water is obvious in the RGB composition, and the ice clouds and water clouds can be visually identified by color (Table 2). The 0.46 μm band is useful for cloud optical thickness identification, as well as the identification of clouds and other target objects (e.g., land, sea, desert). This RGB color composition is mainly focused on the cloud phase. Different RGB color schemes can be used to represent different physical information. Five kinds of main RGB compositions were proposed by Lensky and Rosenfeld [37], which are widely applied to the analysis of clouds and precipitation formation by satellite.
In this color scheme, deep ice clouds are mainly blue tones and appear as light blue, because ice crystals’ reflectance at 0.46 μm (blue) is larger than that of 1.6 (red) and 2.2 μm (green), and thin ice clouds appear gray-blue. Precipitation clouds with more red tones, fewer blue tones, and the least green tones appear pink because water has the highest reflectivity at 1.6 μm, followed by 0.46 μm, and the smallest at 2.2 μm. Nonprecipitating water clouds normally have small cloud drops at the cloud top and appear in light yellow due to high reflectance at 2.2 μm. The land appears brown because the reflectance at 1.6 μm is larger than that of 2.2 and 0.46 μm. The sea surface appears black because of the low reflectance in all three channels. The reflectance of each type of cloud, land, and sea in each channel after normalization and their RGB composition colors, are provided in Table 2.
Figure 2 shows the distribution of supercooled cloud water identified by the FY-4A satellite, and the water cloud area with a temperature lower than 0 °C is the supercooled cloud water area. Regions A, B, C, D, E, and F (Figure 2) represent deep ice clouds, thin ice clouds, precipitable clouds, water clouds, land, and sea, respectively. After the cloud top phase is identified by the FY-4A, the brightness temperature data of the 10.8 μm channel are interpolated from a 4 km to a 2 km resolution and superimposed on the cloud phase map. Finally, we can obtain the supercooled cloud water distribution map with a 2 km resolution.

3.3. Cloud Phase Classification Based on K-Mean

As discussed in Section 3.1, based on the RGB composition, the ice and water clouds can be distinguished based on color by the human eyes. In this work, the K-mean clustering process, which consists of an unsupervised classification method, was used to separate groups of targets and attribute each target to its closest cluster [38], which works analogously to how human eyes differentiate color groups. Based on the above considerations, the RGB composition was first converted to the L⋅a⋅b color space, which separates the luminosity layer, represented by “L”, and the chromaticity layers, “a” and “b” [39]. The K-mean clustering method is applied to the “a⋅b” color space where color information exists without involving the luminosity layer. After an initial run, the number of clustering attempts is limited to 20 to avoid the worst suboptimal local minima and false classifications [18]. All the above processes were performed by MATLAB functions as follows: “rgb2lab” and “imsegkmeans”.
After K-mean clustering, cloud pixels are segmented into clusters corresponding to the cloud top phases, which are the water or ice phases. On the other hand, it might be unfeasible to use clustering to distinguish supercooled water from water clouds because they have a similar color. The next step is taking into account the cloud top temperature and applying it to the clusters. The cloud top temperature uses a 10.8 µm brightness temperature (BT10.8), as described in Lensky and Rosenfeld [37]. In this way, the warm water clouds and supercooled water clouds can be easily identified by differentiating their cloud tops: BT10.8 at 273.15 K. The overall retrieval logic is shown in Figure 3. Complementarily, Figure 4 shows the K-mean clustering results of the same domain from Figure 2 after only selecting pixels with a 0.46 µm channel reflectance larger than 0.4 to focus on optically thick clouds [18], which are feasible for cloud seeding. The option has also been kept for users to apply their own thresholds and to limit their focus on optically thinner clouds. For the results of the present study, the full three-cluster approach was employed to objectively separate the unclassified optically thin clouds from the optically thick clouds, such as the thin clouds or cirrus.
The solar zenith angle (SolZ) is another important parameter that highly impacts satellite data quality. A larger SolZ will lead to more light scattered in the forward direction and a reduced zenith reflectance going to the satellite sensor, resulting in lower-quality data [40]. Therefore, the SolZ was further limited to less than 65°.
The regions A, B, C, and D in Figure 4 are the same as those in Figure 2. A and B are ice clouds, C is supercooled water clouds, and D is water clouds in Figure 4, which are consistent with the identification results in Figure 2.

4. Validation of Satellite-Retrieved Cloud Phase

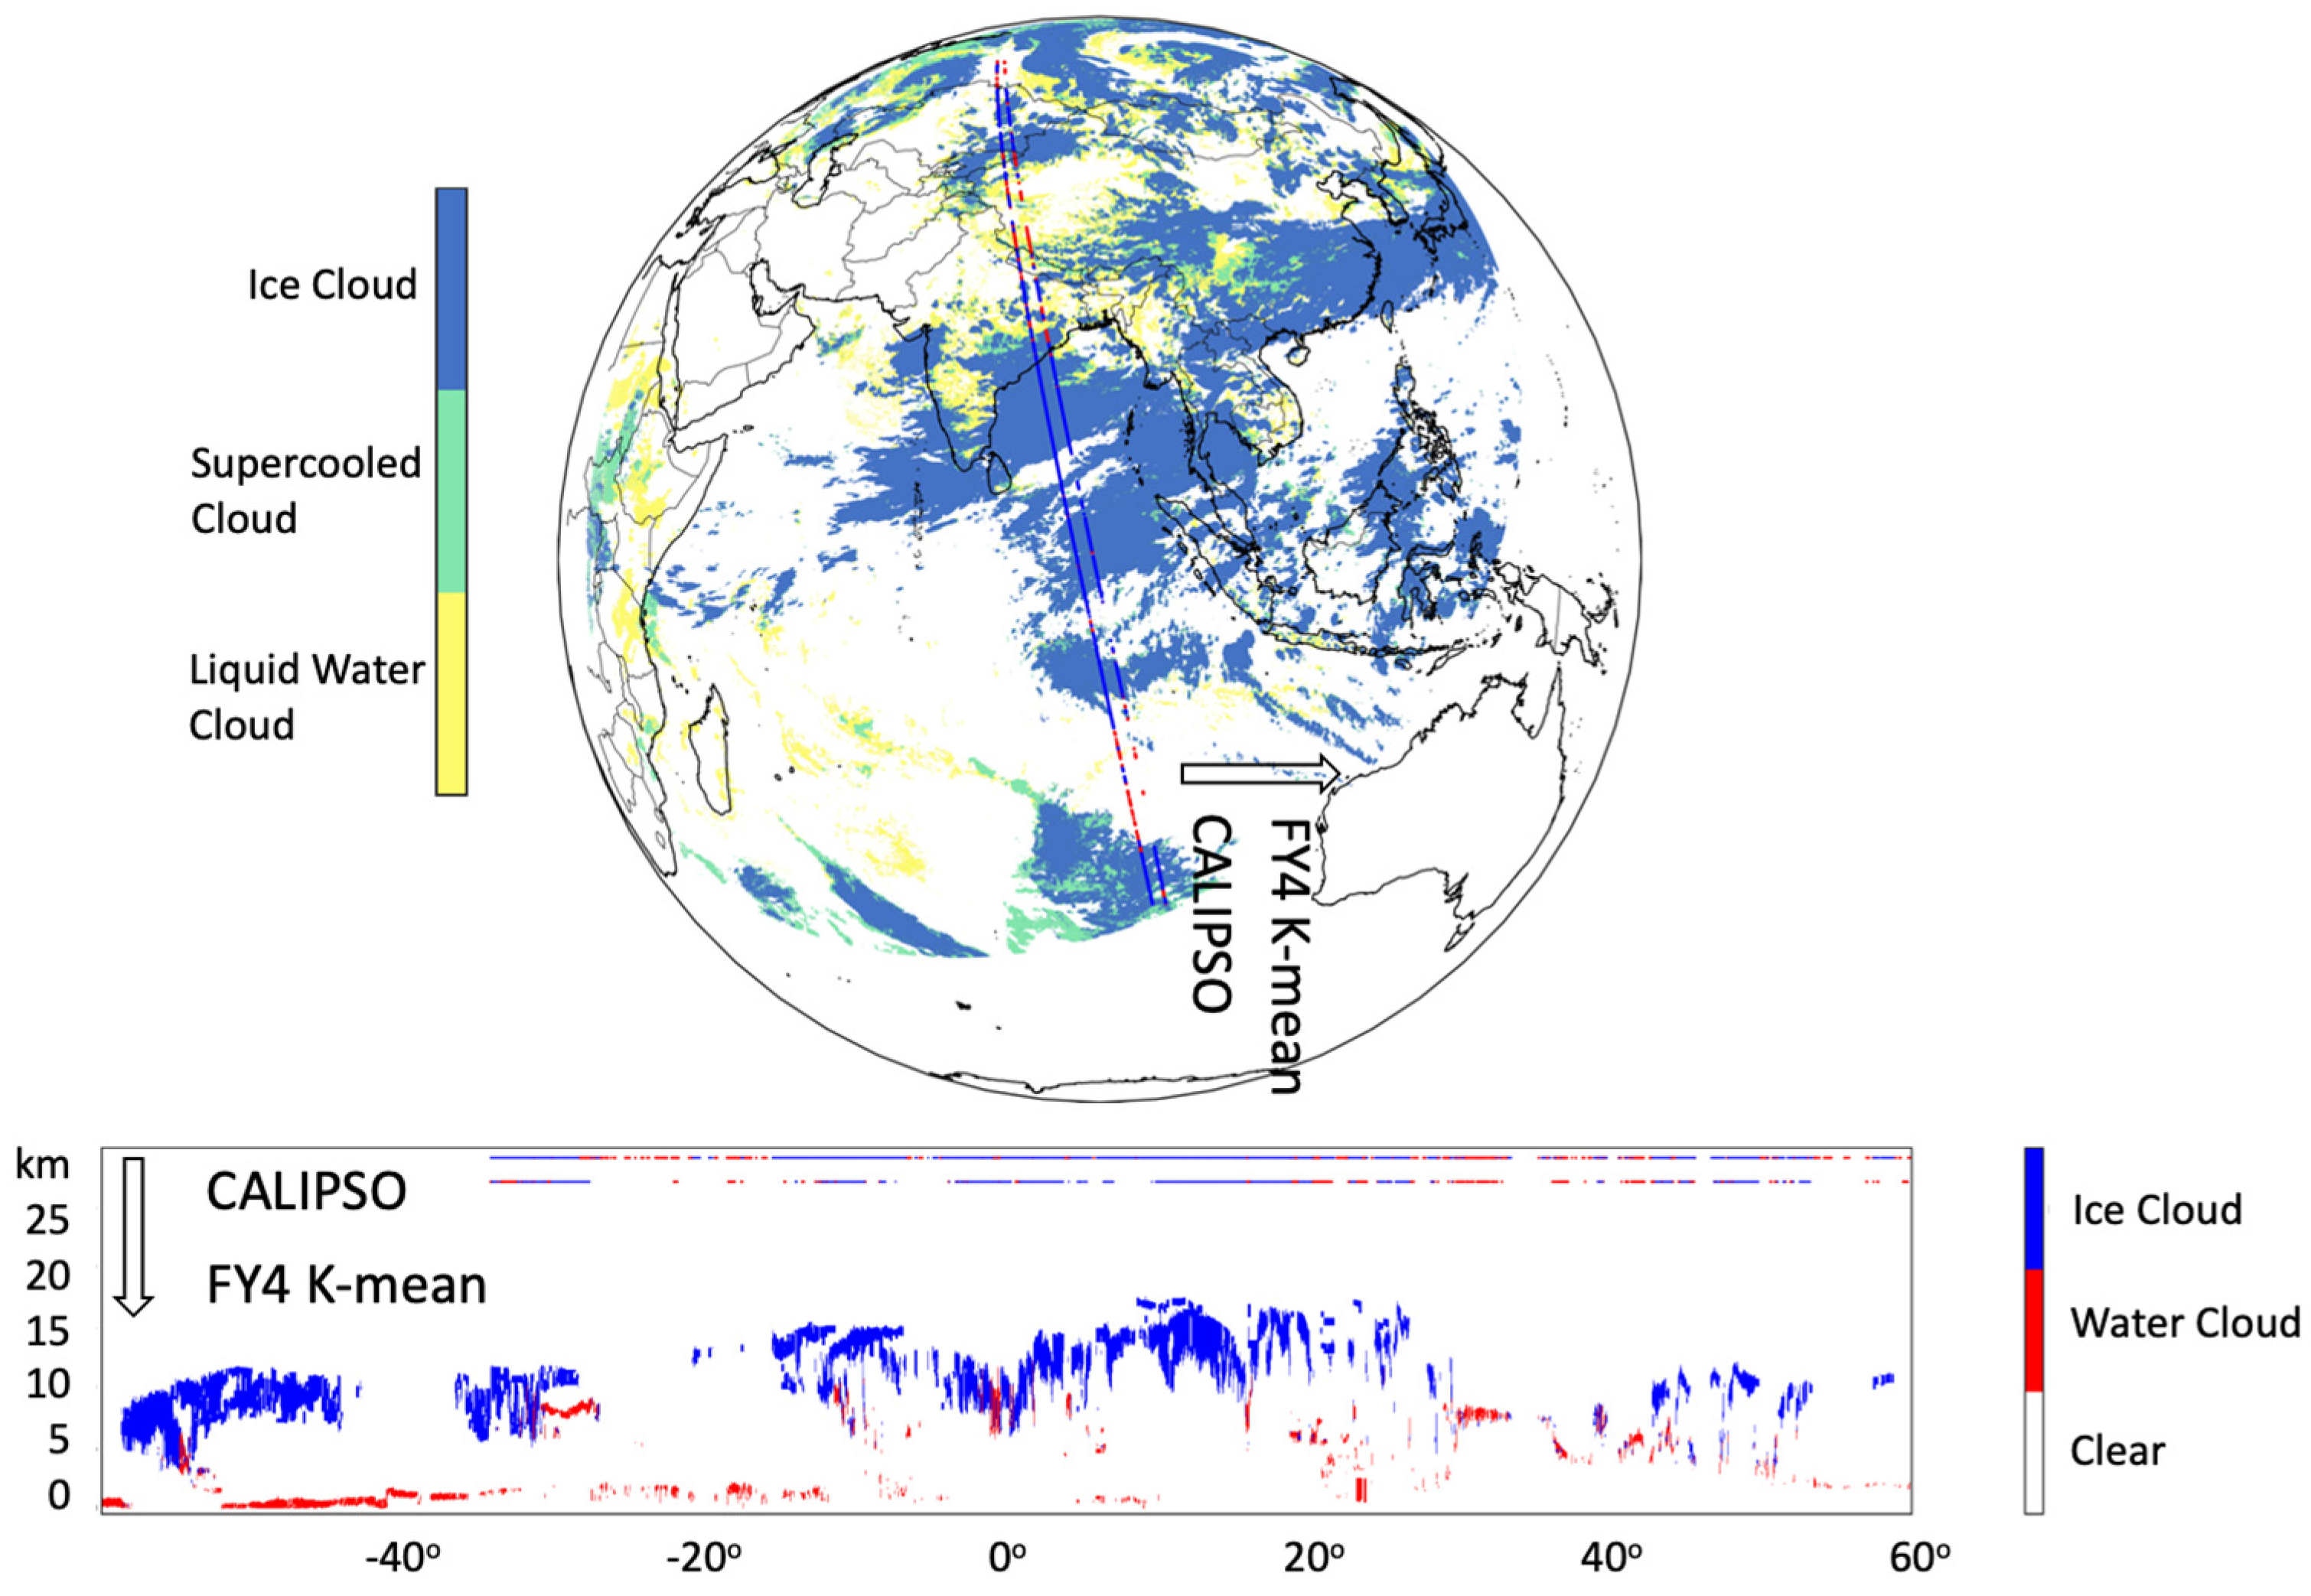
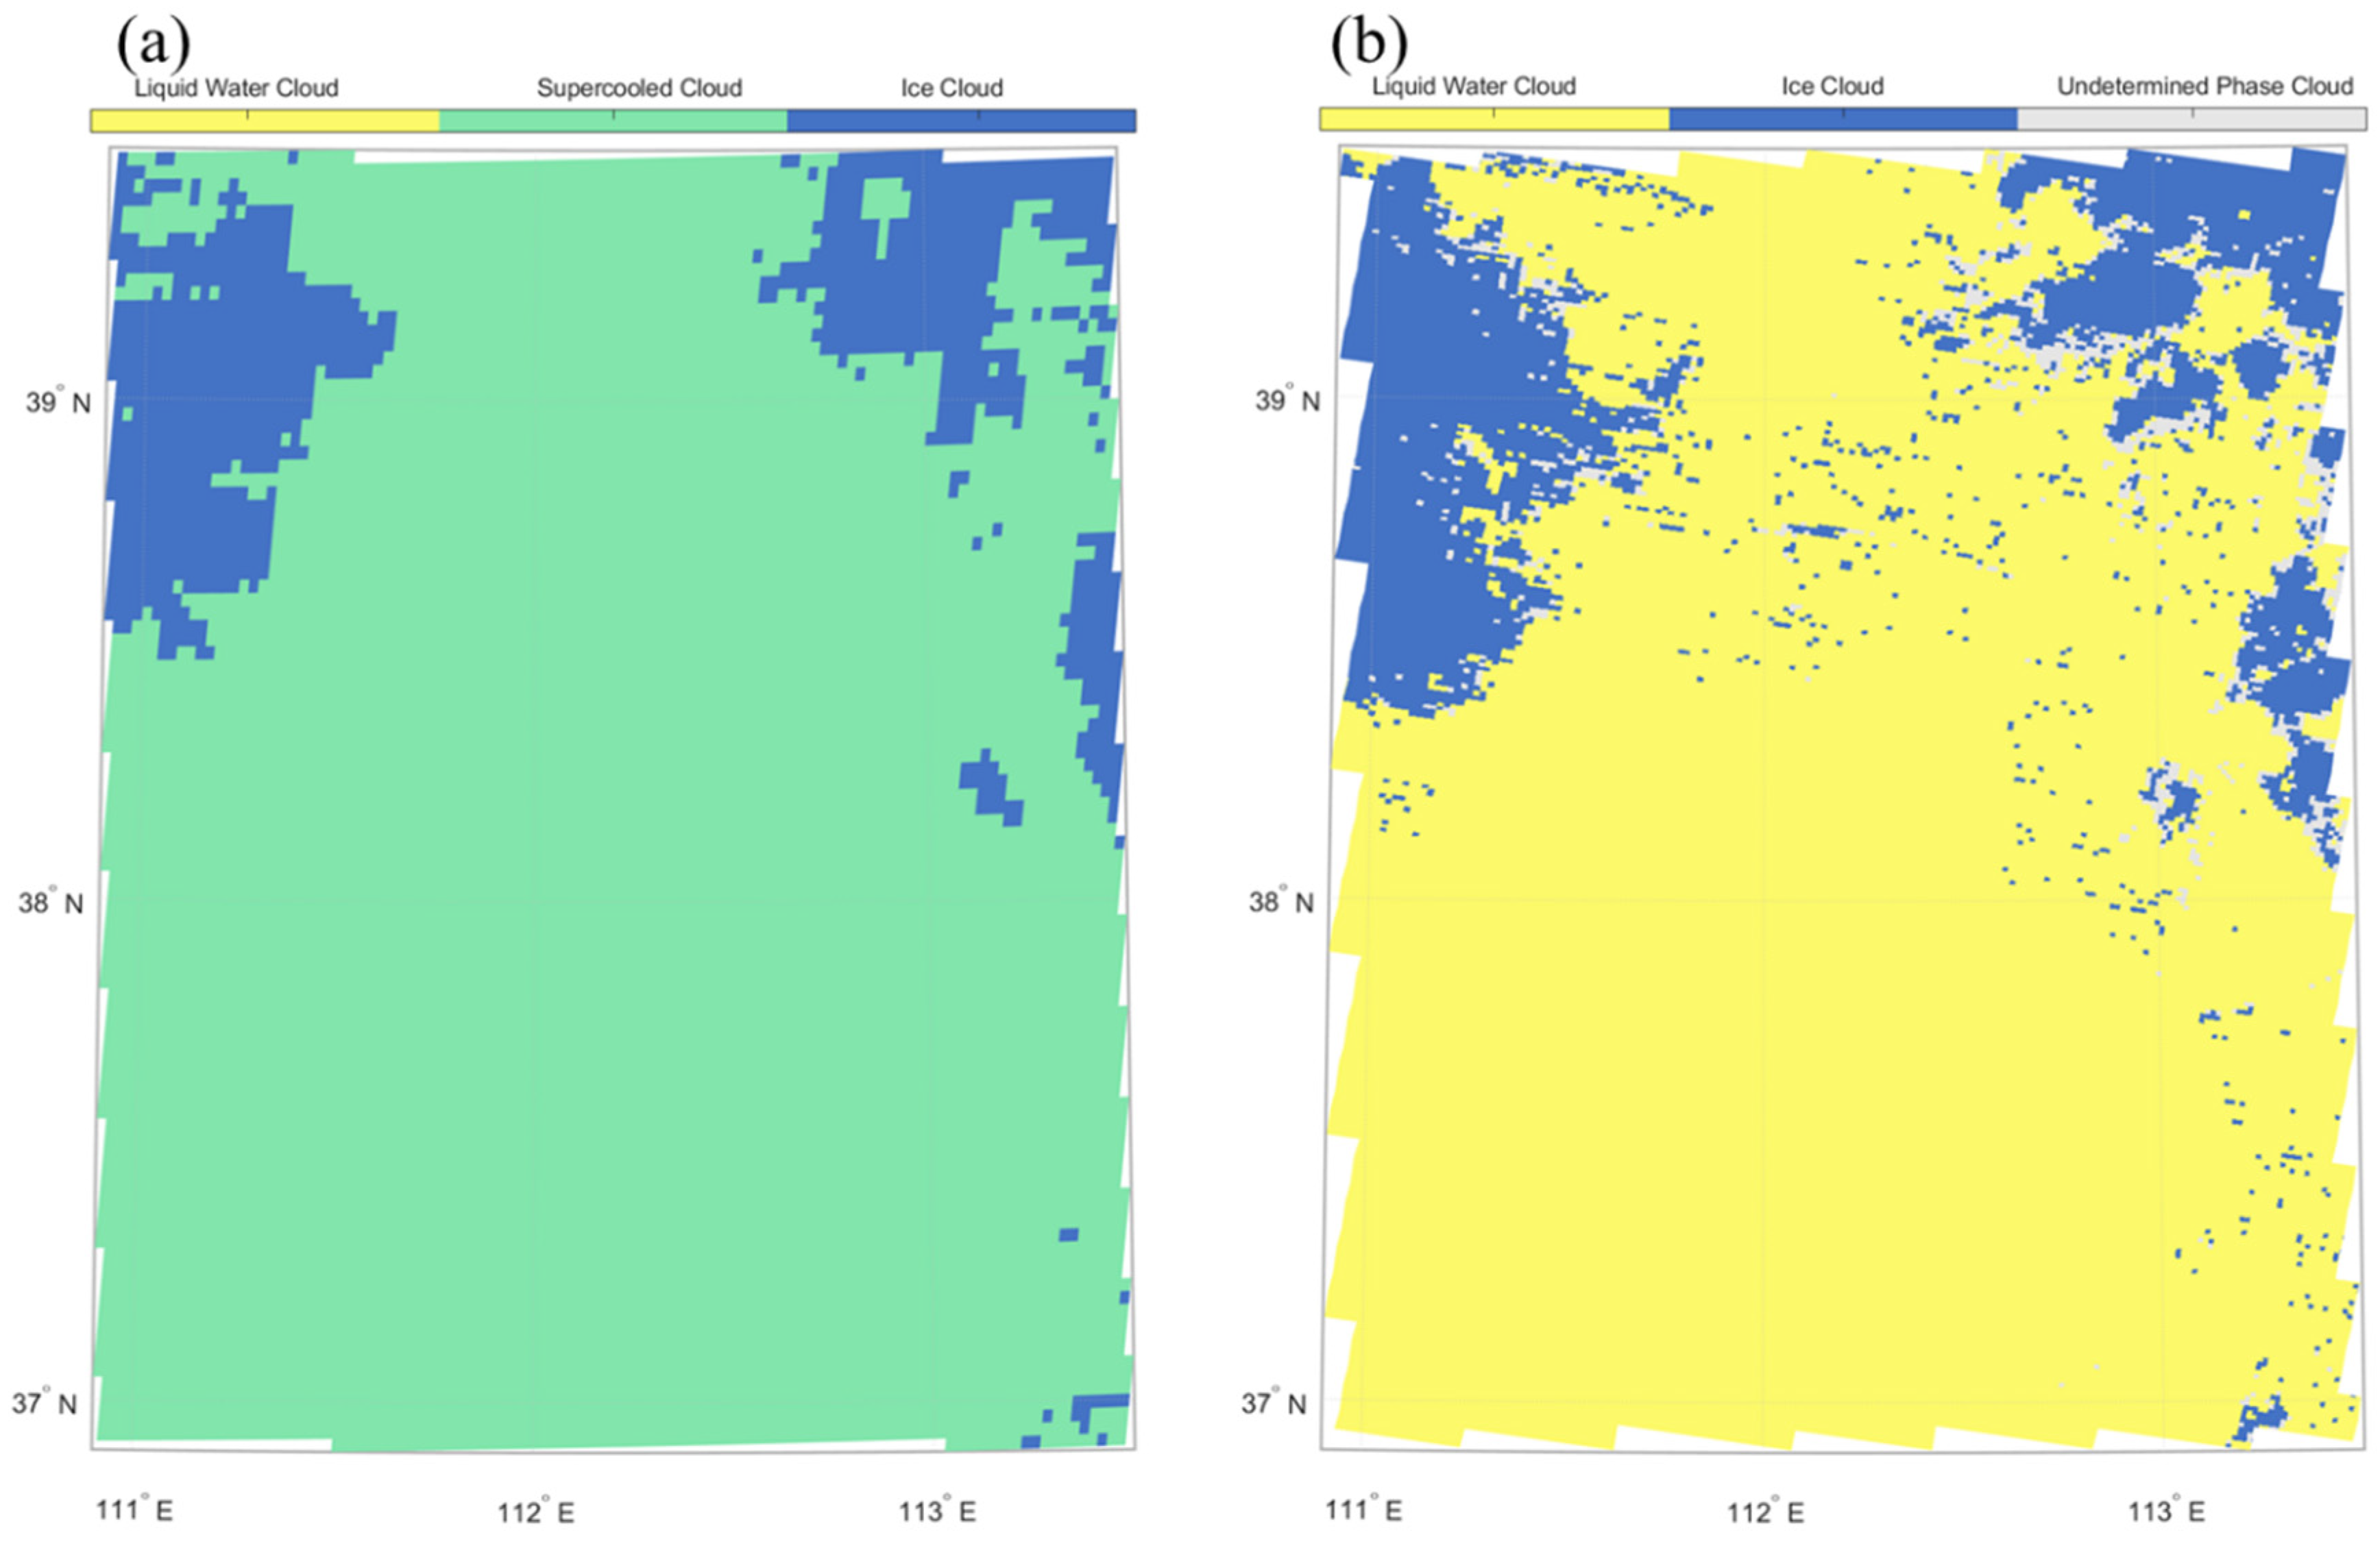
4.1. Validation against CALIPSO VFM Products

To evaluate the accuracy of the FY-4A retrievals of the cloud top phase, we have conducted a comparison of the cloud top phase FY-4A output against collocated cloud top phase retrievals from CALIOP. The latter serves as the benchmark for the evaluation. Furthermore, to test the overall performance and significance of FY-4A retrievals, we collected a total of 2245 FY-4A full-disk granules during the daytime from June 2017, which covers the summer in the northern hemisphere and winter in the southern hemisphere. All the coincident CALIOP cloud phases were collocated within a time difference of 5 min between CALIPSO and FY-4A overpasses. In total, 66 CALIPSO trajectories were found, and a total of 135,374 pixels were validated. Figure 5 demonstrates the validation method; the blue and red represent the ice and supercooled clouds derived from both the CALIPSO VFM and FY-4A cloud top phase, and the tracks are plotted on the upper panel. Since the VFM cannot provide supercooled water information, the phases were categorized into ice and water. Therefore, only the ice and water (supercooled and water) phases were validated with VFM. The lower panel shows the vertical profile of the VFM-detected cloud phase, and the upper lines indicate the phase along the track from both CALIPSO and FY-4A.
As demonstrated by Lensky and Rosenfeld [37], the brightness temperature difference (BTD) between 10 μm and 12 μm can identify thin cloud indicators. Therefore, in order to improve the retrieval accuracy, we also added an additional sensitivity test to the BTD between FY-4A 10.8 μm and 12 μm, associated with the hit rate to CALIOP, as shown in Figure 6. It is shown that when the BTD approaches 2.5 K—which means that the clouds have BTD < 2.5 K and will be identified as the ice phase—the overall hit rate is the highest at about 0.85.
Based on the above considerations, a statistical result based on the comparison between the FY-4A cloud top phase and the CALIOP cloud phase product is shown. The overall hit rate based on different conditions is shown in Table 3. The total hit rate increases with the added conditions, which optimized the methodology with an overall hit rate of 0.87. Figure 7 shows the boxplot of the hit rate based on the individual CALIPSO tracks. It can be seen that the water phase hit rate is generally high based on the K-mean, and the ice phase hit rate increases when pixels that have a SolZ greater than 65° are rejected. Further, when the influence of the thin clouds is considered both at high and low altitudes by adding the conditions of BTD and a reflectance of 0.46 μm (Refl0.46μm), the overall hit rate reaches 0.87 with a compromised water phase hit rate that decreased by about 10%. This is probably affected by the transition zone between ice and water, but, fortunately for the cloud seeding process, their targeting clouds are homogenous supercooled clouds. For this kind of cloud, this methodology has a very high hit rate when it is compared with aircraft measurements, which are described in the next section.

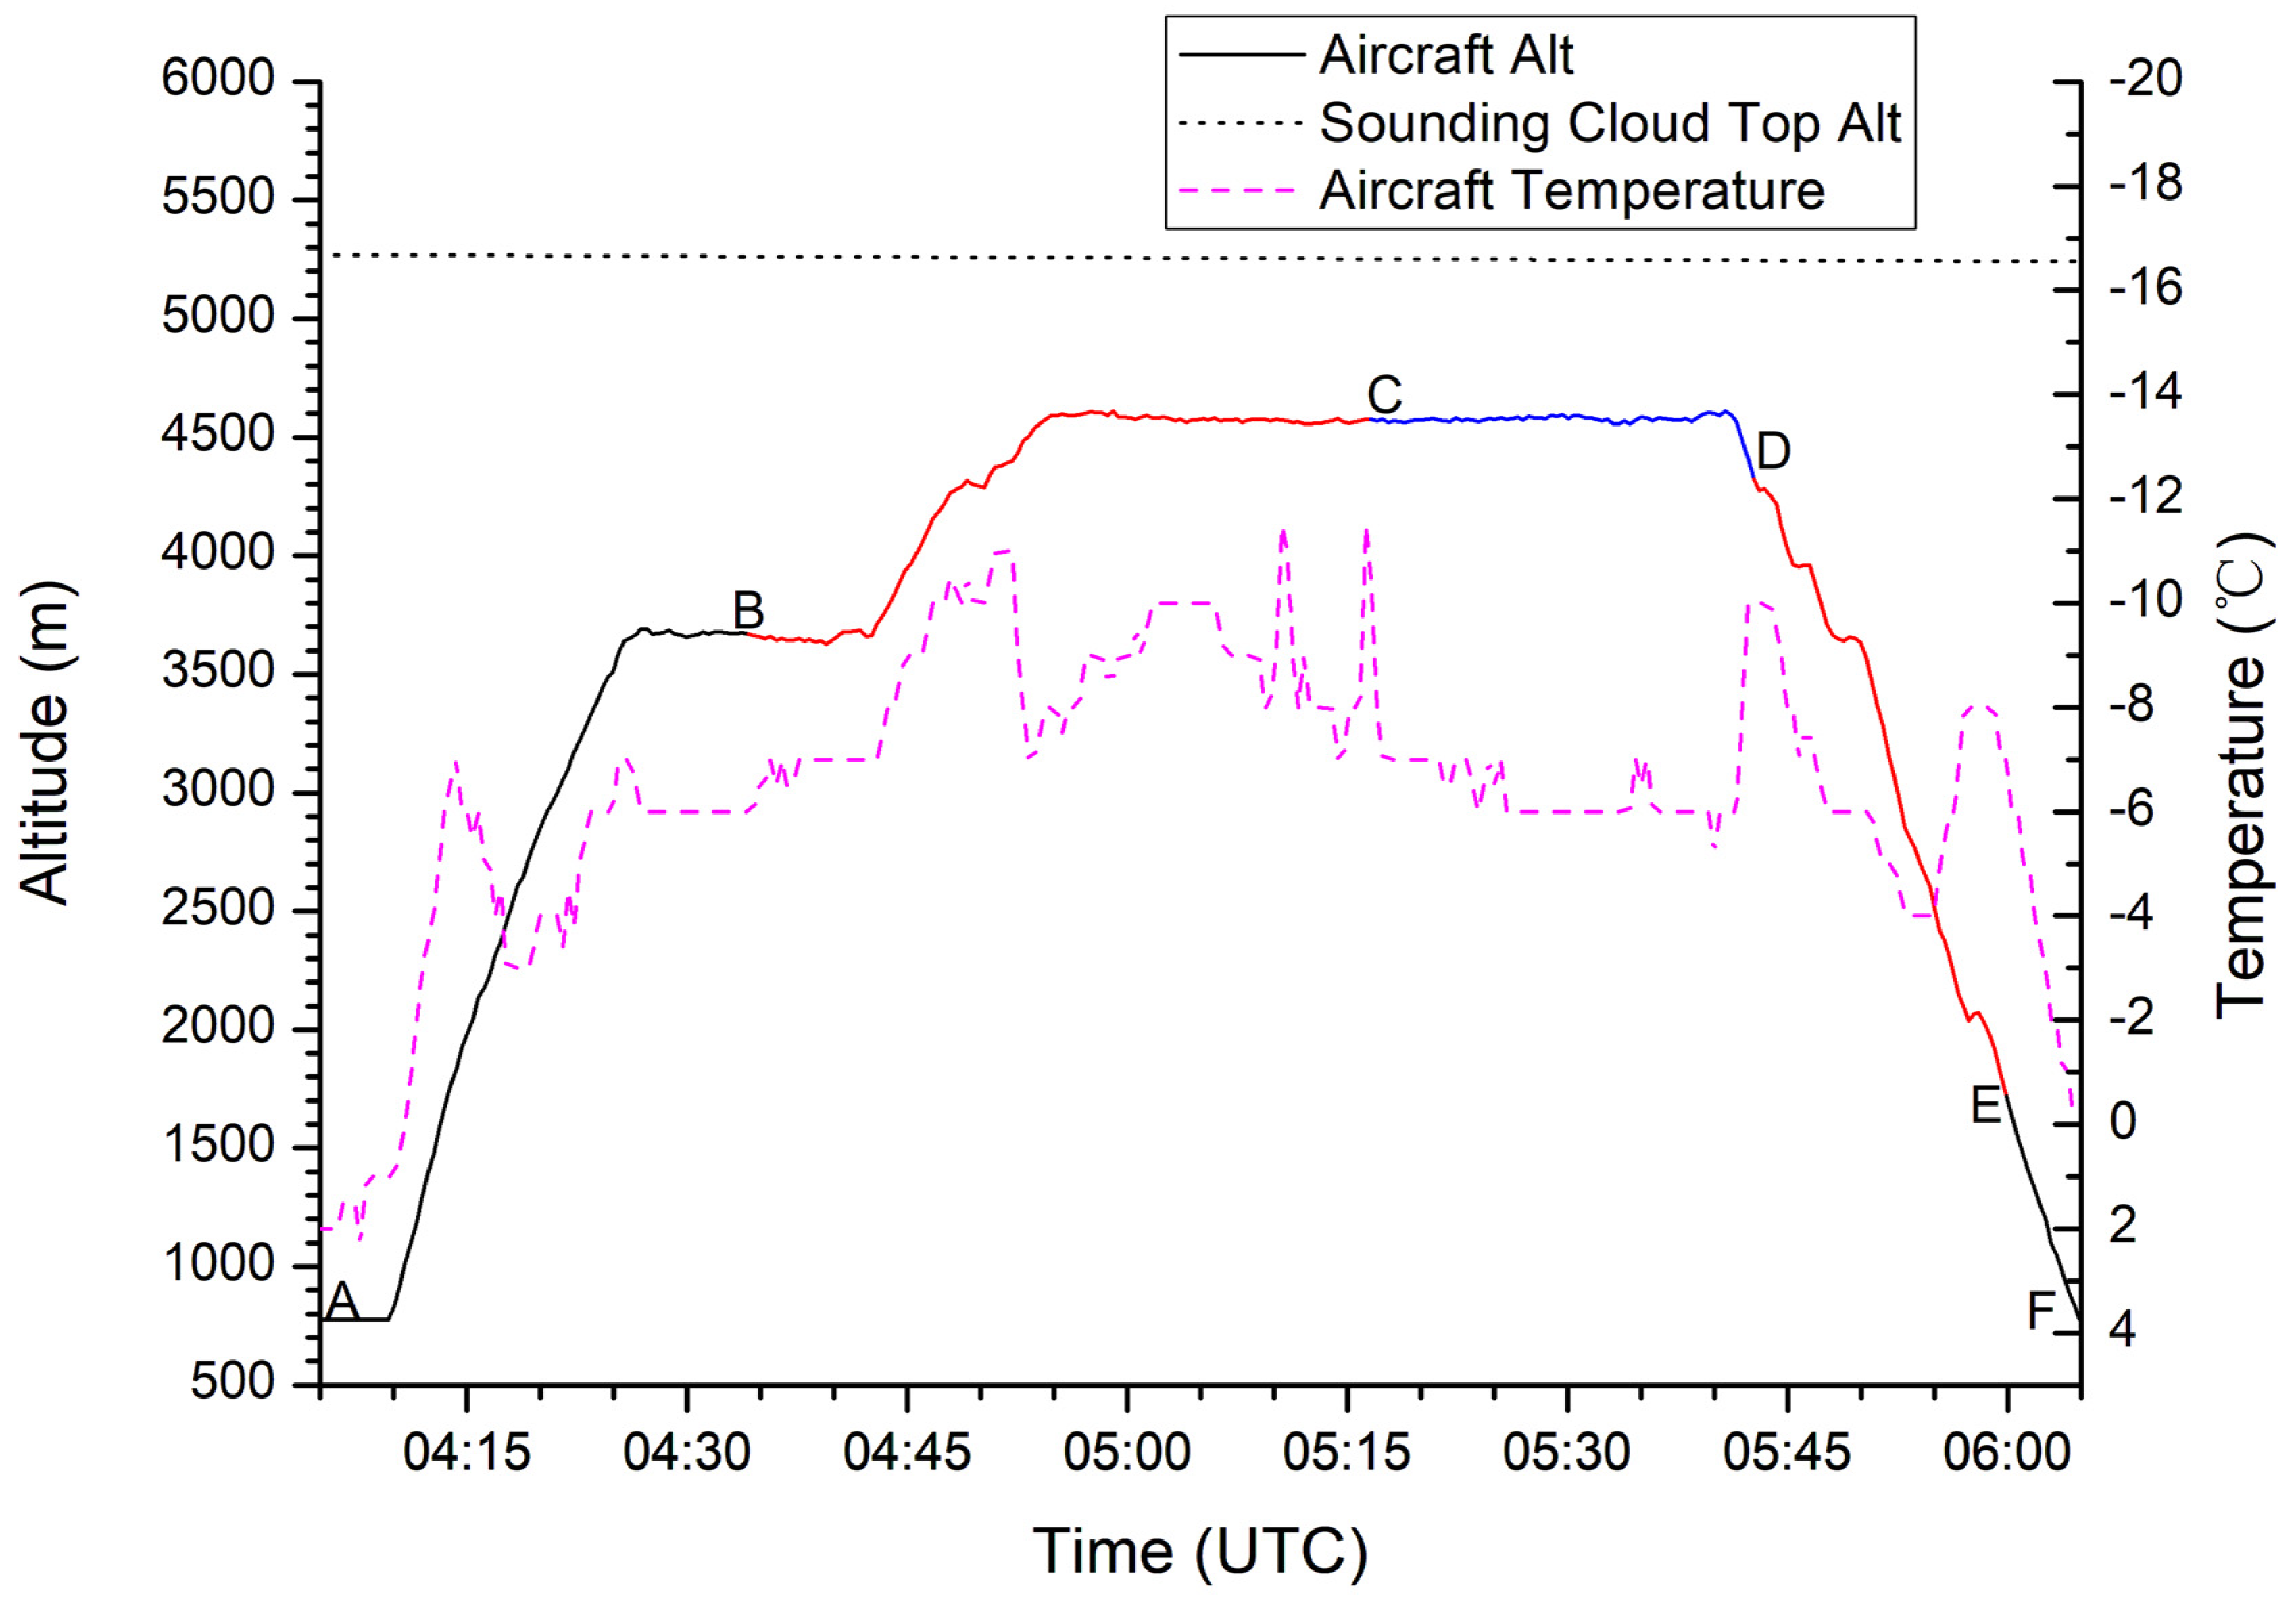
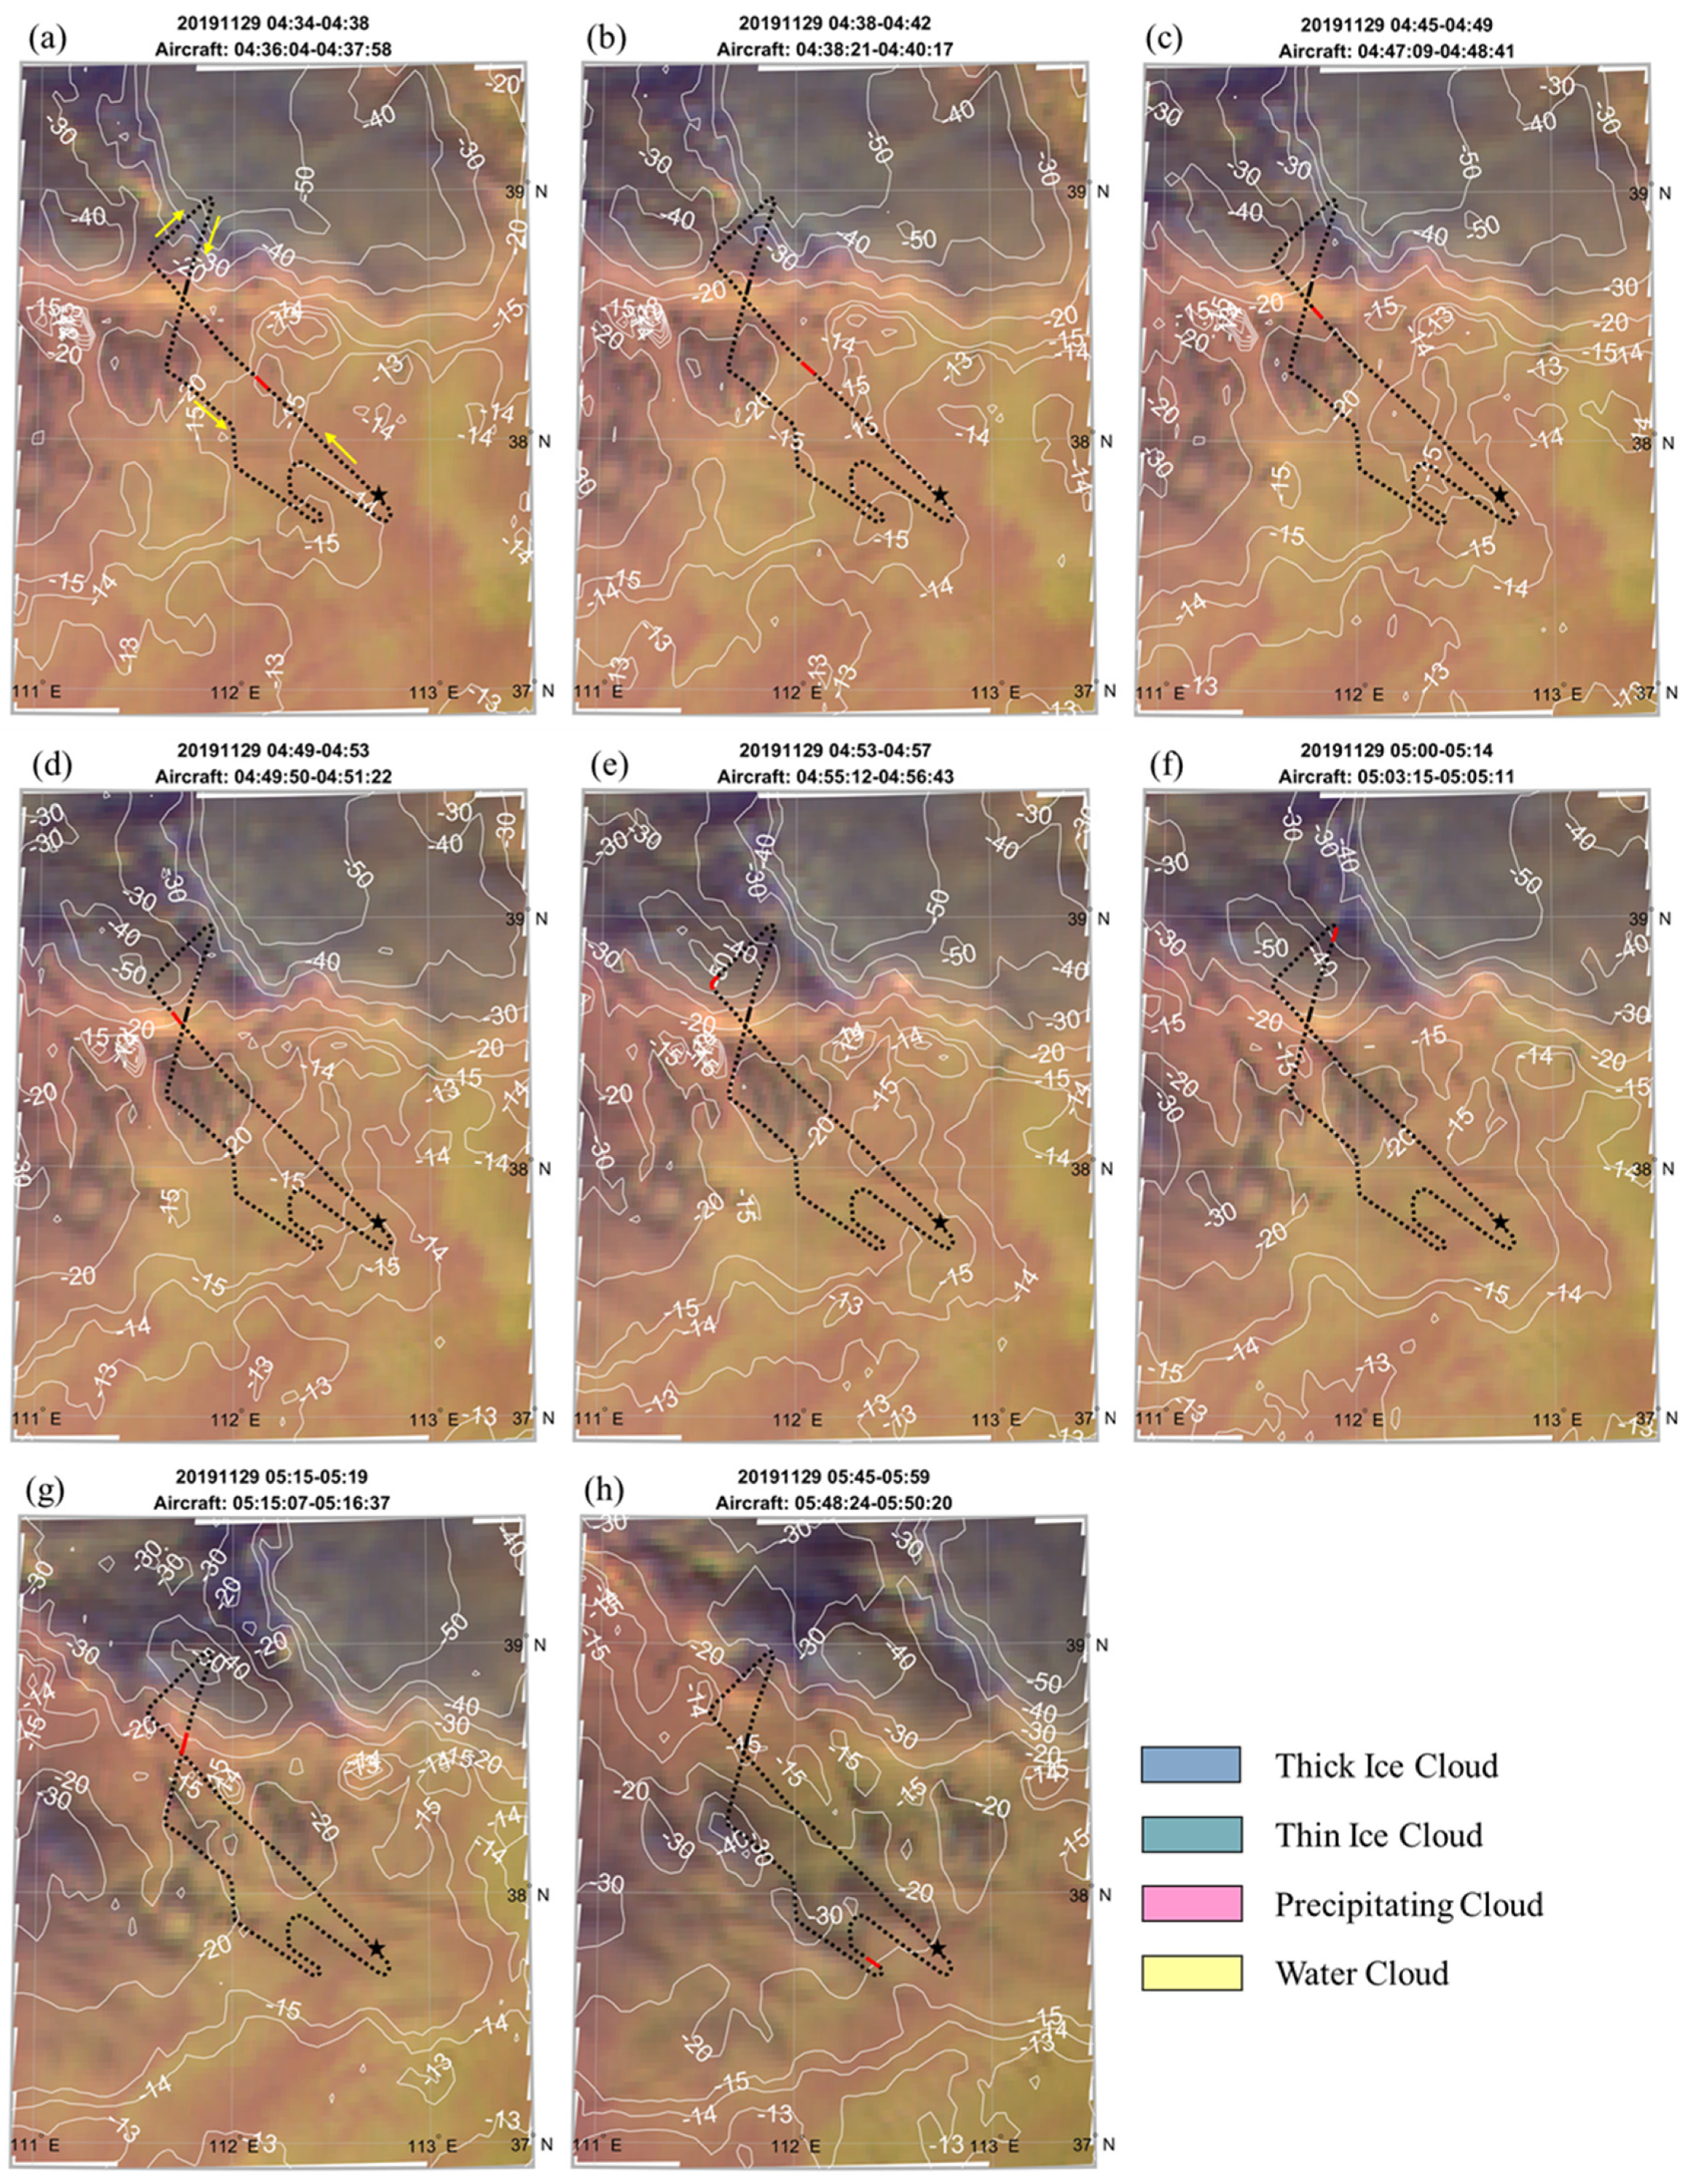
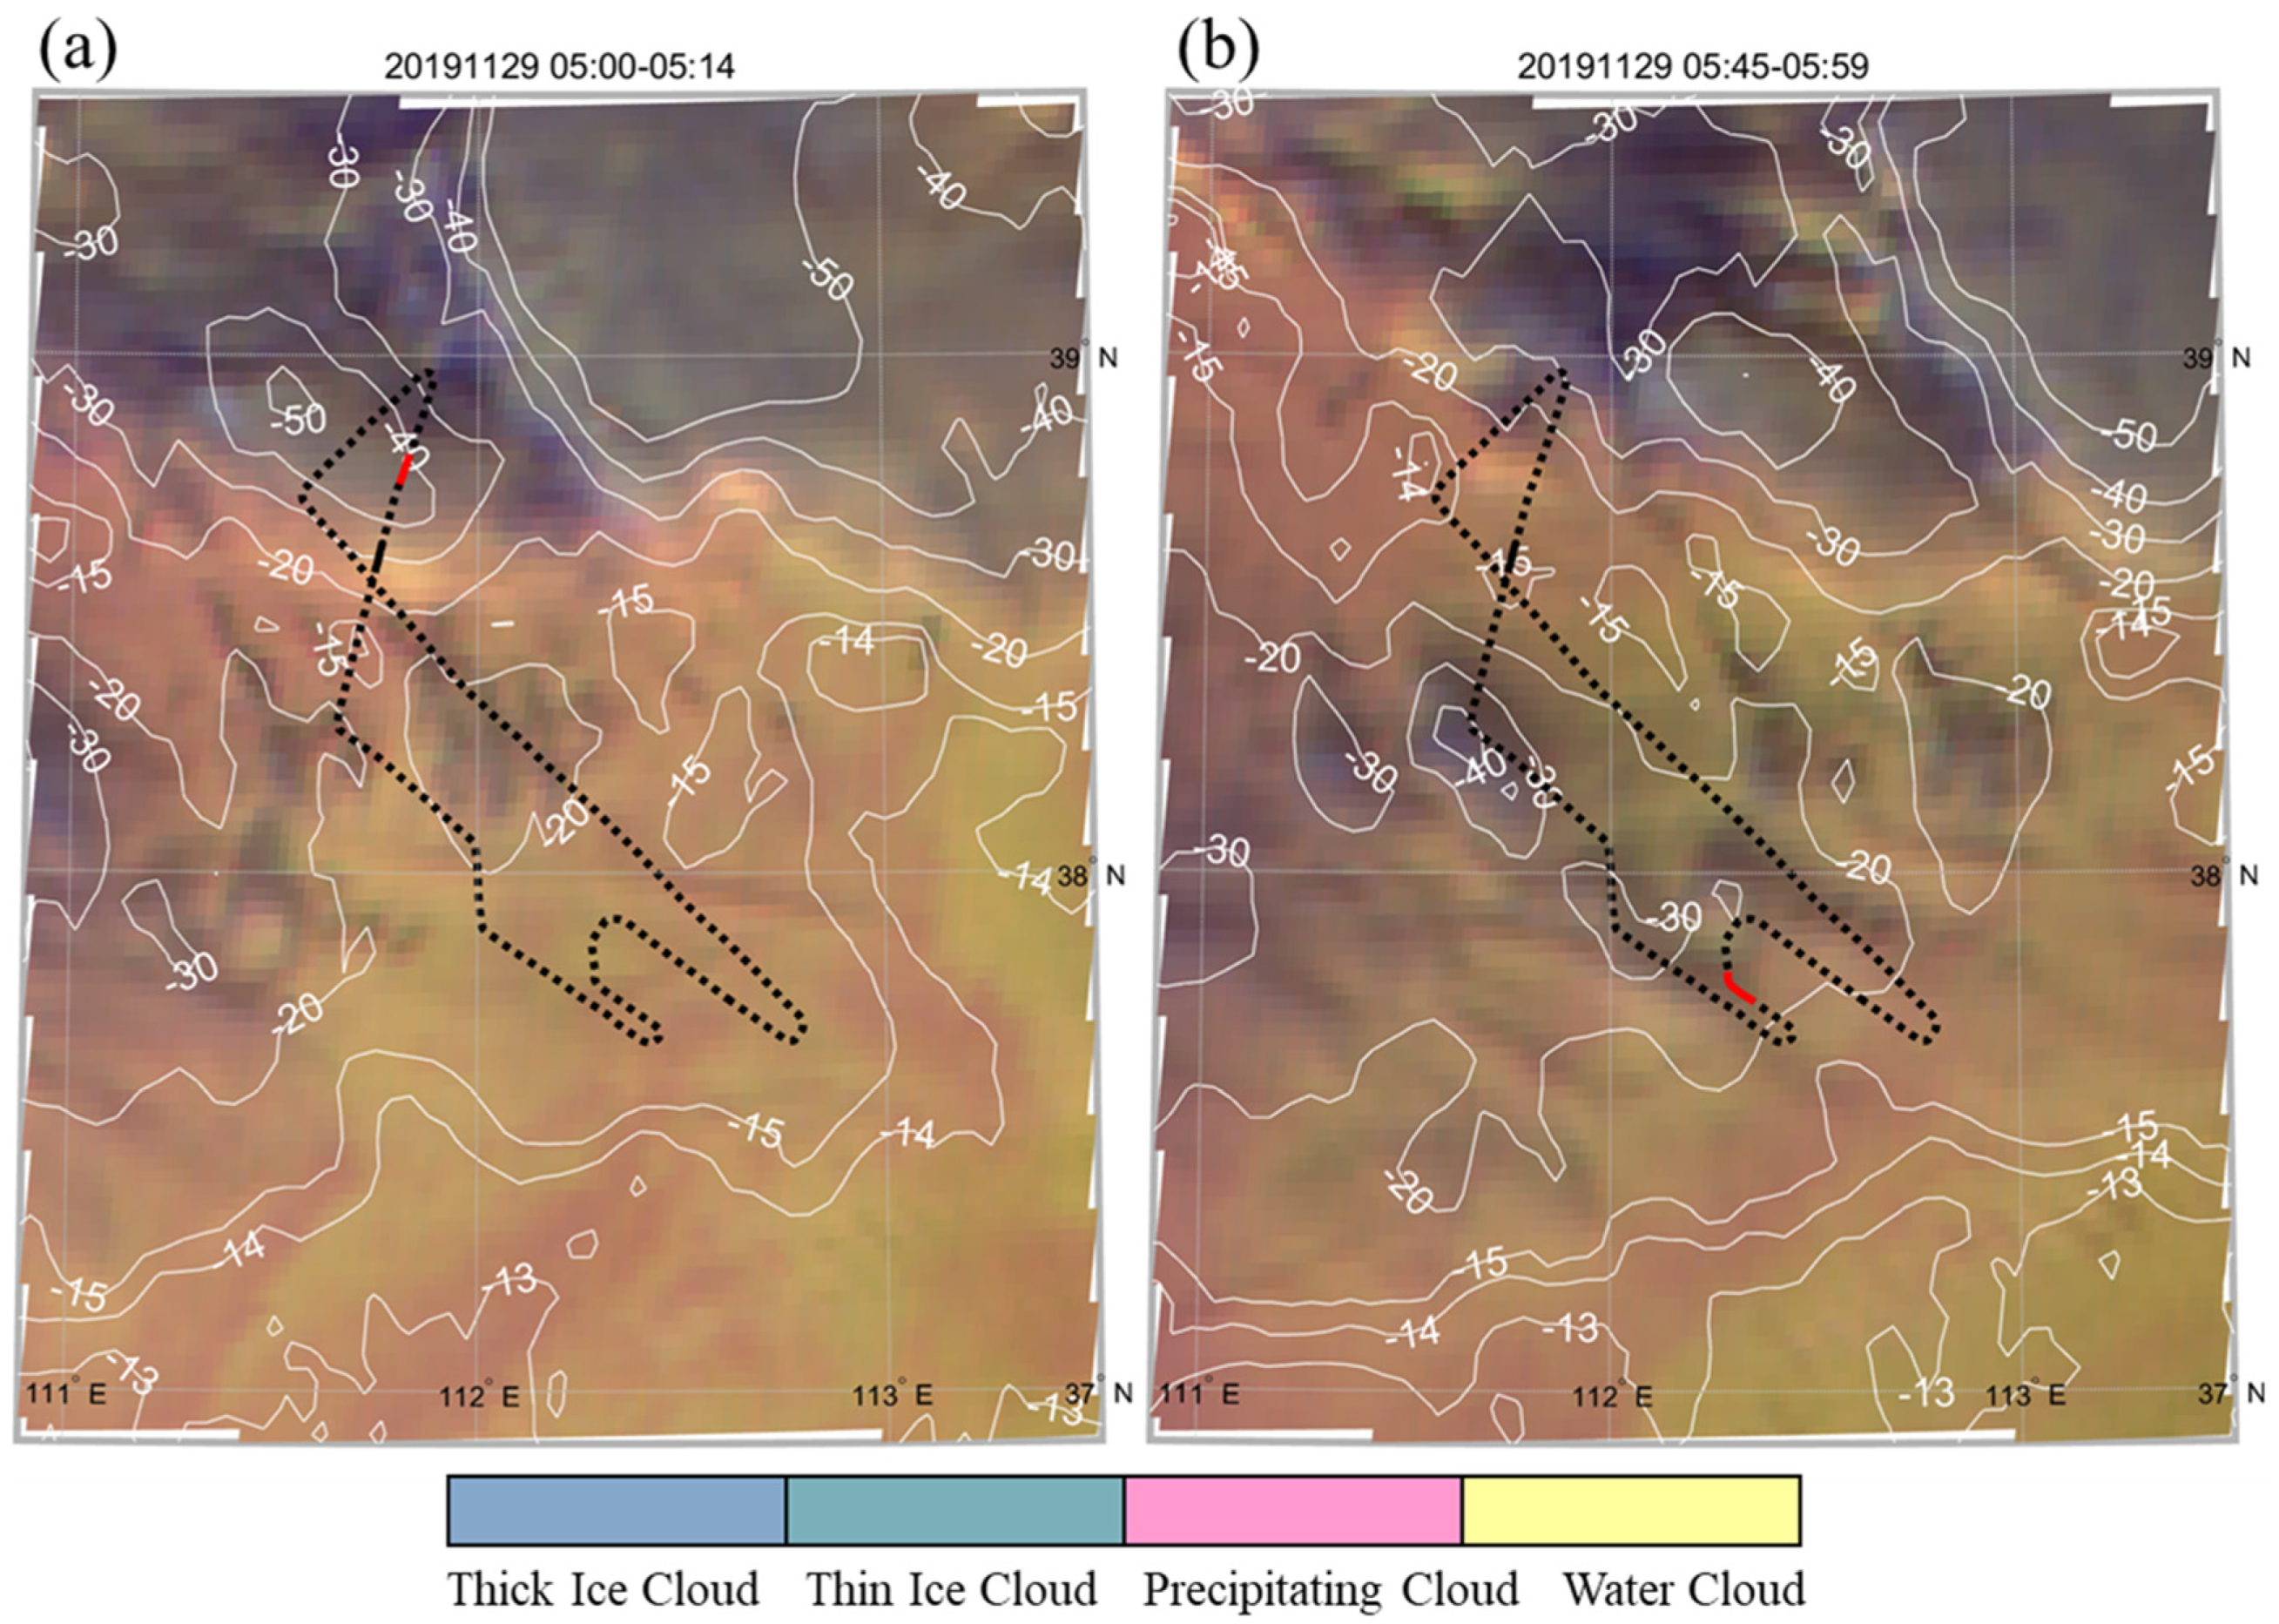
4.2. Validation against Aircraft Detections

Sounding profiles at Taiyuan sounding station (37.78°N, 112.55°E) at 00:00 UTC on 29 November 2019 show that there were two layers of clouds over this area. The cloud top and base heights were 5327 m and 4609 m for high-level clouds and 3906 m and 2071 m for low-level clouds, respectively. There was a single-layer cloud at 12:00 UTC, with the heights of the cloud top and base being 5159 m and 4223 m, respectively. After taking off from the Taiyuan Airport at 03:53 UTC, the aircraft climbed to a height of 3700 m and entered the clouds at 04:26 UTC, and kept the horizontal flight and microphysical measurements for 16 min. Then, the aircraft continued to climb for 10 min to a height of 4600 m near the cloud top and flew horizontally for 47 min. At 05:41 UTC, the aircraft descended. The whole flight lasted from 03:53 to 06:05 UTC. The microphysical measurements were carried out over a height of 0 °C isotherms from −5.2 to −11.5 °C (Figure 8), and it obtained cloud particle image data in the clouds near the cloud top. The cloud particles with a temperature below 0 °C and a round shape are identified as supercooled liquid cloud droplets, and the irregular shape is identified as ice crystals.
Due to the difference in spatial resolution between satellite and aircraft measurements, for each satellite granule corresponding to a different scanning period, a segment of the CIP cloud particle image data is selected on the airborne detection track (black dashed line in Figure 9). At the same time, the corresponding FY-4A is identified as a single phase (red solid line in Figure 9) were selected for validation. Therefore, the cloud phase retrieved from the FY-4A satellite can be validated against that of the in-situ aircraft measurement. In order to make the validation more representative, the aircraft measurements at different cloud penetration stages are chosen, which included flights in the clouds and near the cloud top as well as at periods of ascent and descent. Since the CD segment has no CIP data (Figure 8), by matching the satellite passing and aircraft measurement time, eight valid cases are obtained, which are located in the BC and DE segments of Figure 8. Figure 9 shows the cloud phase of FY-4A along the flight trajectory. The aircraft took off and landed at 37.76°N, 112.61°E (Figure 9) and flew from southeast to northwest; after 1 h, it flew to the northeast, then to the south, and, finally, to the southeast to land.
As seen in Figure 9a–g of the multispectral composition, from 04:30 to 05:19 UTC, the cloudy area north of 38.5°N is mainly blue tones, and the south is mainly red or yellow tones, indicating that the cloud area north of 38.5°N is mainly ice clouds, and the south is mainly water clouds. The cloud top brightness temperature is lower than 0 °C, indicating that the water cloud area is a supercooled cloud water area. Similarly, Figure 9h shows that from 05:45 to 05:59 UTC, the cloudy area north of 37.8°N is mainly ice clouds, and the south is mainly supercooled water clouds.
Table 4 shows the comparison of the cloud phase identified by the FY-4A satellite with the airborne CIP measurement, where the satellite cloud top height is calculated by combining the satellite cloud top temperature with final reanalysis data (FNL) produced by NCEP and NCAR of the United States.
The clouds along the red flight line appear pink and yellowish, respectively, in Figure 9a,b, and they are identified as supercooled water clouds by the satellite. Meanwhile, the aircraft flies level in the clouds at the height of nearly 3700 m (Table 4). The CIP images corresponding to the satellite scanning time in Figure 9a,b are 115 and 110 frames, respectively, and the percentage of supercooled cloud drops reaches 97% and 96% (Table 4), respectively, indicating that both are mainly supercooled water clouds. The cloud top phase identified by the satellite is consistent with the one measured by the aircraft within the clouds. Although the satellite detects the cloud top, while the aircraft measures in the clouds, the results of the cloud phase agree well.
The clouds near the red line appear mainly light yellow in Figure 9c,d, and the satellite identifies them as supercooled water clouds. The aircraft ascends from about 4100 m to 4400 m in the clouds (Table 4). The CIP images corresponding to satellite scanning time in Figure 9c,d both have 93 frames, with 99% water clouds (Table 4). This shows that the cloud particles phase measured by the aircraft ascending in the cold layer of clouds is consistent with the result of the cloud top detection by satellite.
The clouds near the red line appear gray-blue in Figure 9e,f, and they are identified mainly as ice clouds by the satellite. The aircraft measures in the clouds at the height of nearly 4600 m (Table 4). The CIP images corresponding to the satellite scanning time are 11 and 22 frames, respectively, and the proportion of ice clouds is 100% (Table 4). It shows that the detected results from the satellite and aircraft are consistent.
The clouds near the red line appear mainly yellowish in Figure 9g and are identified as supercooled water clouds by the satellite. The aircraft flies level near the cloud top at the height of 4600 m (Table 4). The CIP images corresponding to the satellite in Figure 9g are 41 frames, and the water clouds reach 99% (Table 4). This shows that the detected results by satellite and aircraft are consistent.
The clouds near the red flight line appear yellowish in Figure 9h and are identified mainly as supercooled water clouds by the satellite. The aircraft descends from 3700 m. The CIP images corresponding to Figure 9h are 113 frames, and the water clouds reach 94% (Table 4). This shows that the cloud phase in clouds measured by the aircraft during descending is consistent with the one at the cloud top detected by the satellite.
In summary, the accuracy of the cloud top phase identified by the satellite is verified by comparing the cloud phase observed by the aircraft within the clouds and near the cloud top. The case study shows that the cloud top phase identified by the satellite is in good agreement with the one detected by the airborne CIP. From this point of view, the cloud top phase identified by the satellite can characterize the overall phase of the cold layer in the clouds below the cloud top.

4.3. Comparison with MODIS Cloud Phase Products
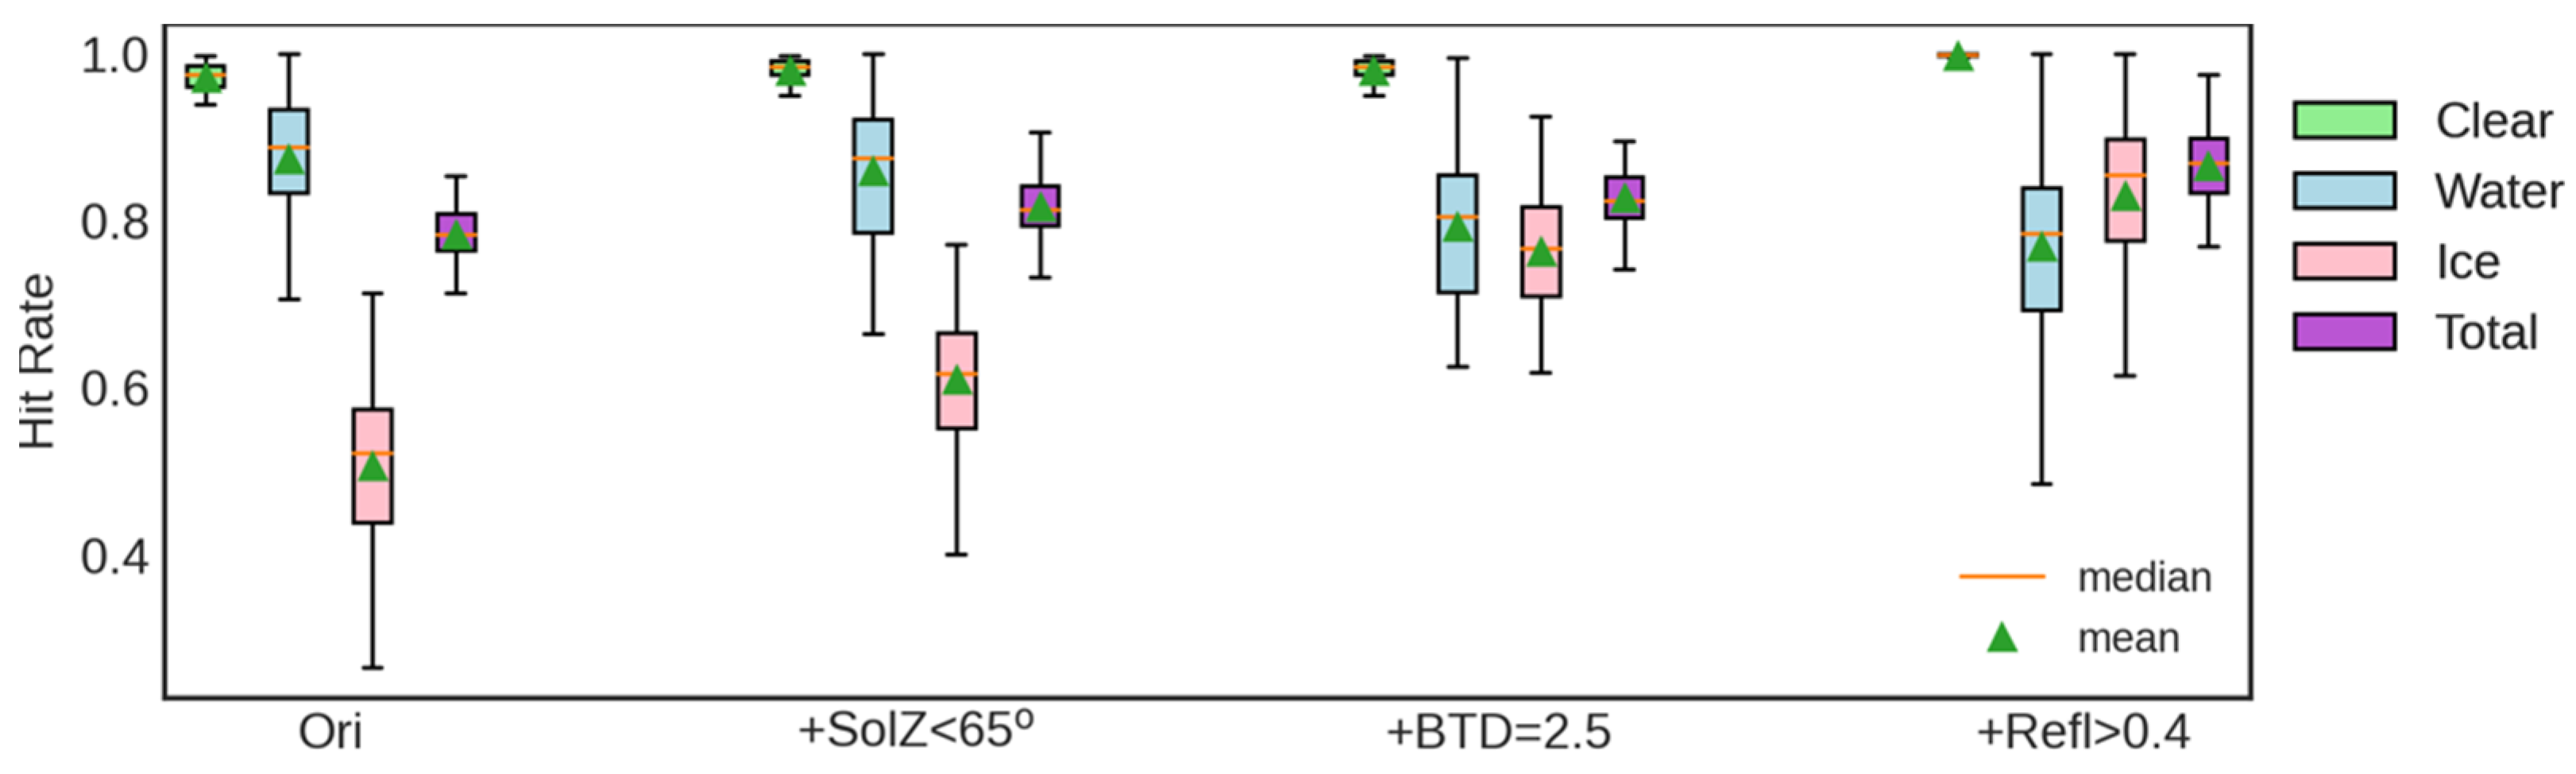
The comparison between the cloud top phase detected by the FY-4A satellite with the airborne measurement indicates the consistency of the cloud phase on the flight track. We also compared the FY-4A cloud phase with MODIS cloud phase products in this study. The overpass time of Aqua was 03:10 UTC on 29 November 2019, and the corresponding FY-4A scan time was 03:15 UTC. The difference of 5 min is negligible for large-scale layer clouds.
Figure 10a,b show the cloud phase distribution from the FY-4A satellite and the MODIS products. Only liquid and ice phases were determined for the MODIS products, while for FY-4A, the liquid phase was further separated into water and supercooled water. Overall, both phases from FY-4A and MODIS show consistent phase distributions. Due to the resolution differences, MODIS shows a more detailed phase distribution than FY-4A, as shown by the blue pixels in the large area of liquid clouds in Figure 10b. Furthermore, MODIS classified the pixels between liquid and ice as undetermined phases, which the method of this study cannot provide. Most evident differences are located at the boundary between the liquid and ice phases. Still, this slight difference does not influence the implication of FY-4A supercooled water detection for guiding rain enhancement operations. This is mainly because the operational rain enhancement process mainly targets supercooled clouds with large coverage and geometric thickness, which means the targeting clouds should have abundant cloud water. FY-4A shows the advantages of high temporal resolution and large coverage in this case. Compared with MODIS, which only has two daytime passes (Terra and Aqua) and cannot be applied for artificial rain enhancement operations, based on the method of this study, FY-4A can rapidly provide for the distribution of supercooled cloud water and dynamic updates in near real-time (every 5 or 15 min) to improve rain enhancement operational efficiency.
In summary, the positions and shapes of ice clouds and water clouds identified by FY-4A correspond to MODIS cloud products with high consistency. However, there are differences in the junction of ice clouds and water clouds. The extent of ice clouds identified by FY-4A is slightly larger, while MODIS results are uncertain phase or water clouds for this transition area. In this case, the accuracy of ice cloud identification by FY-4A was verified via airborne measurement. At the transition area between ice clouds and water clouds (Figure 11a,b), the FY-4A cloud phase were further validated. The satellite scanning time were from 05:00 to 05:14 UTC (Figure 11a) and from 05:45 to 05:59 UTC (Figure 11b), and the corresponding airborne detection periods were from 05:08 to 05:10 UTC and from 05:51 to 05:53 UTC. As shown in Figure 11a,b, at the transition of ice clouds to water clouds marked by the red line, the clouds all appear gray-blue, they are mainly ice clouds identified by FY-4A. For those two segments, the CIP images corresponding to Figure 11a are 74 frames, with 100% ice clouds, and corresponding to Figure 11b are 64 frames, with 91% ice clouds. In this case, the cloud phases identified by FY-4A are consistent with the aircraft measurement.

5. Discussion

In this study, a methodology is demonstrated that is applicable to distinguishing FY-4A cloud top phases by using machine learning based on a microphysical RGB composite (red: 1.6 µm; green: 2.2 µm; blue 0.46 µm). The results show that K-mean clustering can imitate the human eye in recognizing color to distinguish the cloud top phase. The comparisons with in situ measurements and MODIS products also show good consistency in the cloud top phase. K-mean clustering is also a high-efficiency algorithm with a small computing resource requirement; therefore, it is well suited for operational command in artificial weather modifications.
The validation statistics show that the FY-4A cloud phase based on K-mean clusters shows a hit rate of 87%, which is consistent with that of the study of Hu et al. [18]. The solar geometry also affects the phase detection accuracy. The high solar zenith angle indicates that the sun’s illumination intensity strongly influences the color and hue of the microphysical RGB composite. This will result in lower cloud top phase accuracy since the K-mean clustering works in a similar way to human eyes. In addition, the visible channel was used in the microphysical RGB composite, which limited the usage of this methodology during the nighttime. On top of that, the comparison between the FY-4A phase and MODIS phase product indicates that spatial resolution also plays a role when the cloud top phase is classified with finer details. All the limitations discussed above remind us that more efforts need to be made, such as correcting the SolZ, especially for the visible channels, and finding a replacement for the blue channel (0.46 µm) to further retrieve the cloud top phase during nighttime.

6. Conclusions

Based on the multispectral composite of FY-4A/AGRI and the cloud top temperature, a method to identify supercooled cloud water by using a machine-learning method, the “K-mean clustering process”, retrieved from the FY-4A cloud top phase was developed. The results were validated using the CALIPSO VFM product with an overall accuracy of 87% for cloud top phases. Further comparisons of the cloud top phase show good agreement identified by the FY-4A satellite with aircraft CIP measurement, which is comparable with MODIS cloud products. The supercooled water clouds and ice clouds of cold cloud tops identified by FY-4A show good consistency with the airborne measurement within the clouds and at the cloud top, and it is feasible to characterize the cloud phase within the cold layer clouds with the cloud top phase identified by FY-4A.
It is well known that the key to operational precipitation enhancement for cold clouds is finding supercooled cloud water. By using the data at the 0.46, 1.6, and 2.2 µm channels of the FY-4A satellite, the multispectral composite cloud phase image is derived. Combined with the cloud top temperature, the supercooled cloud water distribution can be obtained in real-time or near real-time with a spatial–temporal resolution of every 5 min and 2 km, which makes up for the current shortage of supercooled cloud water detection capability and meets the operational demand of rain enhancement for cold clouds. Moreover, it is important to improve the operational efficiency of rain enhancement. Compared with traditional aircraft detection, the FY-4A satellite has the advantage of real-time and continuous observation of the distribution and evolution of supercooled water for a wide range of cloud systems. However, the aircraft can only detect the cloud phase along the flight track after entering the cloud, and its spatial–temporal detection range is limited. Compared with a polar-orbiting satellite with only one daytime observation a day, the FY-4A satellite has the advantage of continuous observation and can meet the demands of operational applications. It also provides a new method for cold cloud supercooled water identification and benefits operational rain enhancement.

Author Contributions

Conceptualization, X.X., X.Y. and Y.Z. (Yannian Zhu); Methodology, X.X., Y.Z. (Yi Zeng), G.L., Z.Y. and Y.Z. (Yannian Zhu); Software, X.X., X.Y., G.L., Z.Y. and J.D.; Validation, X.X., Z.Y. and Y.Z. (Yannian Zhu); Formal analysis, Y.Z. (Yannian Zhu); Investigation, Q.F., P.L. and J.W.; Data curation, Y.Z. (Yi Zeng), G.L. and Z.Y.; Writing—original draft, X.X., J.D. and Y.Z. (Yannian Zhu); Project administration, X.Y.; Funding acquisition, X.Y. All authors have read and agreed to the published version of the manuscript.

Funding

The National Natural Science Foundation of China: 42275085; Innovation and Development Project of China Meteorological Administration: CXFZ2021J040; Key Research and Development Program of Shaanxi Province: 2021ZDLGY09-09.

Data Availability Statement

The FY-4A/AGRI level 1 data used in this study are from http://satellite.nsmc.org.cn/ (accessed on 1 December 2021), and the reference is https://doi.org/10.1175/BAMS-D-16-0065.1 (accessed on 1 December 2021); EOS Aqua satellite-borne MODIS MOD06_L2 C6.1 cloud product data are available at https://www.earthdata.nasa.gov/ (accessed on 1 January 2022), and the reference is dx.doi.org/10.5067/MODIS/MYD06_L2.006 (accessed on 1 January 2022); CALIPSO VFM data are available at https://www-calipso.larc.nasa.gov/products/ (accessed on 1 October 2022), and the reference is https://doi.org/10.5067/CALIOP/CALIPSO/LID_L2_VFM-STANDARD-V4-20 (accessed on 1 October 2022).

Acknowledgments

We also acknowledge support from the CMA Key Innovation Team (CMA2022ZD10).

Conflicts of Interest

The authors declare no conflict of interest.

References

  1. Schaefer, V.J. Production of ice crystals in a cloud of supercooled water droplets. Science 1946, 104, 457–459. [Google Scholar] [CrossRef] [PubMed]
  2. Lei, H.; Hong, Y.; Zhao, Z.; Xiao, H.; Guo, X. Advances in cloud and precipitation physics and weather modification in recent years. Chin. J. Atmos. Sci. 2008, 32, 967–974. [Google Scholar]
  3. Hong, Y. Research progress of stratiform cloud structure and precipitation mechanism and discussion on artificial precipitation problems. Clim. Environ. Res. 2012, 17, 937–950. [Google Scholar]
  4. Yang, W.; Zhou, Y.; Sun, J.; Wu, Z. Observational studies of distribution characteristics of supercooled cloud water during a westerly trough process. Acta. Meteor. Sinica. 2014, 72, 583–595. [Google Scholar]
  5. Yue, Z.; Yu, X.; Liu, G.; Wang, J.; Dai, J.; Li, J. Effect evaluation of an operational precipitation enhancement of cold cloud by aircraft. Acta Meteor. Sin. 2021, 79, 853–963. [Google Scholar]
  6. Ackerman, S.A.; Smith, W.L.; Spinhirne, J.D.; Revercomb, H.E. The 27-28 October 1986 FIRE IFO cirrus case study: Spectral properties of cirrus clouds in the 8-12 μm window. Mon. Wea. Rev. 1990, 118, 2377–2388. [Google Scholar] [CrossRef]
  7. Zhou, Z.; Bai, J.; Liu, J.; Ji, F.; Qi, L.; Li, W. The application of cloud phase recognition by MODIS spectral data. J. App. Meteor. Sci. 2005, 16, 678–684. [Google Scholar]
  8. Baum, B.A.; Soulen, P.F.; Strabala, K.I.; King, M.D.; Ackerman, S.A.; Menzel, W.P.; Yang, P. Remote sensing of cloud properties using MODIS airborne simulator imagery during SUCCESS: 2. Cloud thermodynamic phase. J. Geophys. Res. 2000, 105, 11781–11792. [Google Scholar] [CrossRef]
  9. Rossow, W.B.; Schiffer, R.A. Advances in understanding clouds from ISCCP. Bull. Amer. Meteor. Soc. 1999, 80, 2261–2287. [Google Scholar] [CrossRef]
  10. King, M.D.; Platnick, S.; Yang, P. Remote sensing of liquid water and ice cloud optical thickness and effective radius in the Arctic: Application of airborne multispectral MAS data. J. Atmos. Ocean. Technol. 2004, 21, 857–875. [Google Scholar] [CrossRef]
  11. Arking, A.; Childs, J.D. Retrieval of cloud cover parameters from multispectral satellite images. J. Appl. Meteor. 2003, 24, 322–333. [Google Scholar] [CrossRef]
  12. Liu, J.; Dong, C.; Zhu, Y.; Zhu, X.; Zhang, W. Thermodynamic phase analysis of cloud particles with FY-1C data. Chinese J. Atmos. Sci. 2003, 27, 901–908. [Google Scholar] [CrossRef]
  13. Liu, J.; Li, Y. Cloud phase detection algorithm for geostationary satellite data. J. Infrared Millim. Waves 2011, 30, 322–327. [Google Scholar] [CrossRef]
  14. Luo, S.; Liu, J.; Lu, N. Evaluation and analysis of the cloud phase product derived from FY-3A/VIRR. Meteor. Mon. 2013, 39, 623–632. [Google Scholar]
  15. Miller, S.D.; Noh, Y.-J.; Heidinger, A.K. Liquid-top mix-phase cloud detection from shortwave-infrared satellite radiometer observations: A physical basis. J. Geophys. Res. Atmos. 2014, 119, 8245–8267. [Google Scholar] [CrossRef]
  16. Noh, Y.-J.; Miller, S.D.; Heidinger, A.K.; Mace, G.G.; Protat, A.; Alexander, S.P. Satellite-based detection of daytime supercooled liquid-topped mixed-phase clouds over the southern ocean using the advanced Himawari imager. J. Geophys. Res. Atmos. 2019, 124, 2677–2701. [Google Scholar] [CrossRef]
  17. Wang, Z.; Letu, H.; Shang, H.; Zhao, C.; Li, J.; Ma, R. A Supercooled water cloud detection algorithm using Himawari-8 satellite measurements. J. Geophys. Res. Atmos. 2019, 124, 2724–2738. [Google Scholar] [CrossRef]
  18. Hu, J.; Rosenfeld, D.; Zhu, Y.; Lu, X.; Carlin, J. Multi-channel Imager Algorithm (MIA): A novel cloud-top phase classification algorithm. Atmos. Res. 2021, 261, 105767. [Google Scholar] [CrossRef]
  19. Gao, J.; Chen, J.; Tian, X. Ensemble-learning-based cloud phase classification method for Fengyun-4 remote sensing images. Infrared Technol. 2020, 42, 68–74. [Google Scholar] [CrossRef]
  20. Sheng, X.; Sun, L.; Zheng, Q. Simulated annealing optimized BP-ANN method for cloud thermodynamic phase retrieval. J. PLA Univ. Sci. Technol. 2008, 9, 98–102. [Google Scholar]
  21. Li, X.; Ma, J.; Liang, X. Retrieving cloud phase based on BP neural network. J. Atmos. Environ. Opt. 2010, 5, 299–304. [Google Scholar]
  22. Xiong, X.; Yang, C.; Ao, M.; Guo, J.; Zeng, D. A research on cloud phase detection based on BP neural network. Remote Sens. Technol. Appl. 2015, 30, 714–718. [Google Scholar]
  23. Jin, Z.; Zhang, L.; Liu, S.; Yi, F. Cloud detection and cloud phase retrieval based on BP neural network. Opt. Optoelectron. Technol. 2016, 14, 74–77. [Google Scholar]
  24. Yang, J.; Zhang, Z.; Wei, C.; Lu, F.; Guo, Q. Introducing the New Generation of Chinese Geostationary Weather Satellites, Fengyun-4. Bull. Am. Meteorol. Soc. 2017, 98, 1637–1658. [Google Scholar] [CrossRef]
  25. Hunt, W.H.; Winker, D.M.; Vaughan, M.A.; Powell, K.A.; Lucker, P.L.; Weimer, C. CALIPSO lidar description and performance assessment. J. Atmos. Ocean. Technol. 2009, 26, 1214–1228. [Google Scholar] [CrossRef]
  26. Hu, Y.; Winker, D.; Vaughan, M.; Lin, B.; Omar, A.; Trepte, C.; Flittner, D.; Yang, P.; Nasiri, S.L.; Baum, B.; et al. CALIPSO/CALIOP cloud phase discrimination algorithm. J. Atmos. Ocean. Technol. 2009, 26, 2293–2309. [Google Scholar] [CrossRef] [Green Version]
  27. Hu, Y.; Winker, D.; Yang, P.; Baum, B.; Poole, L.; Vann, L. Identification of cloud phase from PICASSO-CENA lidar depolarization: A multiple scattering sensitivity study. J. Quant. Spectrosc. Radiat. Transf. 2001, 70, 569–579. [Google Scholar] [CrossRef]
  28. Marchant, B.; Platnick, S.; Meyer, K.; Arnold, G.T.; Riedi, J. MODIS Collection 6 shortwave-derived cloud phase classification algorithm and comparisons with CALIOP. Atmos. Meas. Tech. 2016, 9, 1587–1599. [Google Scholar] [CrossRef] [Green Version]
  29. Cai, Z.; Cai, M.; Li, P.; Li, J.; Sun, H.; Gu, Y.; Gao, X. Aircraft observation research on macro and microphysics characteristics of continental cumulus cloud at different development stages. Chin. J. Atmos. Sci. 2019, 43, 1191–1203. [Google Scholar]
  30. Dong, X.; Zhao, C.; Huang, Z.; Mai, R.; Lv, F.; Xue, X.; Zhang, X.; Hou, S.; Yang, Y.; Yang, Y.; et al. Increase of precipitation by cloud seeding observed from a case study in November 2020 over Shijiazhuang, China. Atmos. Res. 2021, 262, 105766. [Google Scholar] [CrossRef]
  31. Kokhanovsky, A. Optical properties of terrestrial clouds. Earth-Sci. Rev. 2004, 64, 189–241. [Google Scholar] [CrossRef]
  32. Warren, S.G. Optical properties of ice and snow. Phil. Trans. R. Soc. A 2019, 377, 20180161. [Google Scholar] [CrossRef] [PubMed]
  33. Shi, G. Atmospheric Radiation, 1st ed.; Science Press: Beijing, China, 2007; pp. 134–141. [Google Scholar]
  34. Hansen, J.E.; Pollack, J.B. Near-infrared light scattering by terrestrial clouds. J. Atmos. Sci. 1970, 27, 265–281. [Google Scholar] [CrossRef]
  35. Curran, R.J.; Wu, M.-L.C. Skylab near-infrared observations of clouds indicating supercooled liquid water droplets. J. Atmos. Sci. 1982, 39, 635–647. [Google Scholar] [CrossRef]
  36. Pilewskie, P.; Twomey, S. Cloud phase discrimination by reflectance measurements near 1.6 and 2.2 μm. J. Atmos. Sci. 1987, 44, 3419–3420. [Google Scholar] [CrossRef]
  37. Lensky, I.M.; Rosenfeld, D. Clouds-aerosols-precipitation satellite analysis tool (CAPSAT). Atmos. Chem. Phys. 2008, 8, 6739–6753. [Google Scholar] [CrossRef] [Green Version]
  38. Arthur, D.; Vassilvitskii, S. K-Means++: The Advantages of Careful Seeding. In Proceedings of the Eighteenth Annual ACM-SIAM Symposium on Discrete Algorithms, New Orleans, LA, USA, 7–9 January 2007; pp. 1027–1035. [Google Scholar]
  39. Jain, A.K. Fundamentals of Digital Image Processing; Prentice Hall: Hoboken, NJ, USA, 1989. [Google Scholar]
  40. Grosvenor, D.P.; Wood, R. The effect of solar zenith angle on MODIS cloud optical and microphysical retrievals within marine liquid water clouds. Atmos. Chem. Phys. 2014, 14, 7291–7321. [Google Scholar] [CrossRef]
Figure 1. Real (a) and imaginary (b) index of refraction for water and ice with wavelengths ((a): reproduced from Kokhanovsky [31], (b): reproduced from Warren [32]); the vertical blue, red, and green lines correspond to absorption at 0.46, 1.6, and 2.2 µm, respectively.
Remotesensing 15 00126 g001
Figure 2. RGB composite image from FY-4A satellite at 06:30 UTC on 21 May 2020, superimposed with a 10.8 µm brightness temperature to obtain the distribution of supercooled cloud water. The white solid line is an isoline of the cloud top brightness temperature (°C) at the 10.8 µm channel of the satellite. A, B, C, D, E, and F represent deep ice clouds, thin ice clouds, precipitable clouds, water clouds, land, and sea, respectively.
Remotesensing 15 00126 g002
Figure 3. FY-4A cloud top phase retrieval algorithm general logic flowchart.
Remotesensing 15 00126 g003
Figure 4. Cloud phase of FY-4A satellite at 06:30 UTC on 21 May 2020 after K-mean cluster and combined with a 10.8 µm brightness temperature to obtain the distribution of water, supercooled water, and ice clouds. A, B, C, and D correspond to Figure 2.
Remotesensing 15 00126 g004
Figure 5. The FY-4A cloud top phase validated against CALIPSO VFM production at 07:00 UTC on 25 June 2017.
Remotesensing 15 00126 g005
Figure 6. Sensitivity test between the FY-4A phase hit rate and BTD.
Remotesensing 15 00126 g006
Figure 7. Boxplot of FY-4A cloud top phase hit rate validated against CALIPSO VFM.
Remotesensing 15 00126 g007
Figure 8. Evolution of flight height (black, red, and blue solid lines) and temperature (purple dotted line) from the aircraft and the cloud top altitude (black dotted line) from sounding on November 29, 2019. The black AB and EF segments represent airborne CIP data that are not matched well with satellites; the red BC (04:34–05:17 UTC) and DE (05:42–05:59 UTC) segments are compared with the satellite; and the blue CD (05:17–05:42 UTC) segment is a lack of measurement.
Remotesensing 15 00126 g008
Figure 9. Multispectral composite image of FY-4A satellite at different scanning times and aircraft measuring times marked on the top of A to H on 29 November 2019. The black dashed line is the aircraft flight trajectory (03:53–06:05 UTC) with the yellow arrow marking the flight direction, and the asterisk indicates the location of the airport. The red solid line is the time of the cloud phase obtained from the satellite and aircraft measurements at the same time. The white solid line is an isoline of the cloud top brightness temperature (°C) at the 10.8 µm channel of the satellite.
Remotesensing 15 00126 g009
Figure 10. FY-4A cloud phase based on RGB composition at 03:15 UTC (a) and cloud phase products at 03:10 UTC from MODIS (b) on 29 November 2019.
Remotesensing 15 00126 g010
Figure 11. Multispectral composite images of FY-4A satellite at 05:00–05:14 UTC (a) and at 05:45–05:59 UTC (b) on 29 November 2019; the others are the same as Figure 9.
Remotesensing 15 00126 g011
Table 1. The color scheme of RGB composition.
Wavelength1.6 µm (Red)2.2 µm (Green)0.46 µm (Blue)
Reflectivity range0–40%0–40%0–100%
Table 2. Reflectance and RGB colors for different types of clouds, land, and sea (A1.6, A2.2, and A0.4 represent the reflectance of 1.6, 2.2, and 0.46 μm after normalization, respectively).
TypeA1.6A2.2A0.4Color
Deep ice clouds0.520.660.79Remotesensing 15 00126 i001
Thin ice clouds0.480.690.73Remotesensing 15 00126 i002
Precipitation clouds10.600.8Remotesensing 15 00126 i003
Water clouds110.62Remotesensing 15 00126 i004
Land0.470.190.12Remotesensing 15 00126 i005
Sea0.030.020.12Remotesensing 15 00126 i006
Table 3. The hit rate under different conditions.
Hit RateK-MeanK-Mean
+SolZ < 65°
K-Mean
+SolZ < 65°
+BTD = 2.5
K-mean
+SolZ < 65°
+BTD = 2.5
+Refl0.46μm > 0.4
Clear0.970.980.981.0
Water0.870.860.790.77
Ice0.510.610.760.83
Total0.780.820.830.87
“+” indicates added conditions.
Table 4. FY-4A identified cloud phases validated against airborne measurements.
OrderSatellite Scanning Time (UTC)Airborne Detection Time (UTC)Satellite Cloud Top Height (m)Airborne Detection Height (m)Flight StatusCIP Image (Frame)Airborne Detected Phase (%)Satellite-Identified PhaseConsistency
A04:34–04:3804:36:04–04:37:5853253645Level flight115Water clouds 97, ice clouds 3 Water cloudsConsistent
B04:38–04:4204:38:21–04:40:1752723643Level flight110Water clouds 96, ice clouds 4Water cloudsConsistent
C04:45–04:4904:47:09–04:48:4154564186–4290ascending93Water clouds 99, ice clouds 1Water cloudsConsistent
D04:49–04:5304:49:50–04:51:2252274296–4379ascending93Water clouds 99, ice clouds 1Water cloudsConsistent
E04:53–04:5704:55:12–04:56:4388574593Level flight11Ice clouds 100Ice cloudsConsistent
F05:00–05:1405:03:15–05:05:1165504572Level flight22Ice clouds 100Ice cloudsConsistent
G05:15–05:1905:15:07–05:16:3754124568Level flight near cloud top41Water clouds 99, ice clouds 1Water cloudsConsistent
H05:45–05:5905:48:24–05:50:2057283649–3577Descending113Water clouds 94, ice clouds 6 Water cloudsConsistent
Disclaimer/Publisher’s Note: The statements, opinions and data contained in all publications are solely those of the individual author(s) and contributor(s) and not of MDPI and/or the editor(s). MDPI and/or the editor(s) disclaim responsibility for any injury to people or property resulting from any ideas, methods, instructions or products referred to in the content.

