Technical Note

Array Configuration Design for Mirrored Aperture Synthesis Radiometers Based on Dual-Polarization Measurements

1
China Academy of Space Technology (Xi’an), Xi’an 710100, China
2
School of Electronic Information and Communications, Huazhong University of Science and Technology, Wuhan 430074, China
*
Author to whom correspondence should be addressed.
Remote Sens. 2023, 15(1), 167; https://doi.org/10.3390/rs15010167
Submission received: 24 November 2022 / Revised: 24 December 2022 / Accepted: 25 December 2022 / Published: 28 December 2022

Abstract

:
In mirrored aperture synthesis (MAS), the antenna array determines the rank of the transformation matrix connecting the cross-correlations to the cosine visibilities. However, the transformation matrix is rank-deficient, resulting in errors in the reconstructed brightness temperature (BT) image. In this paper, the signal propagations for the vertically polarized wave and horizontally polarized wave are analyzed. Then, the optimization model of the antenna array based on dual-polarization is established. The optimal array configurations are presented, with the corresponding transformation matrices being almost column full ranks. Simulation results demonstrate the validity of the proposed optimization model.

1. Introduction

Microwaves can penetrate clouds and do not rely on the sun as the source of illumination. These features make microwave radiometry usable in all time and almost all weather conditions [1]. Therefore, microwave radiometry can provide information that visible and infrared detection cannot [2]. However, requirements of applications related to the acquisition of mesoscale and sub-mesoscale information cannot be met due to the existing microwave load capability [3]. With climate change and the intensification of human activities, high-resolution microwave remote sensing of the earth is urgently needed.
At present, two methods are available to improve the spatial resolution of microwave radiation measurement. The first method is to increase the antenna size, and the second is to use synthetic aperture technology [4]. According to the experience of existing systems such as SMAP [5] and GeoSTAR [6], a real aperture radiometer is limited by the size of the large aperture antenna, while an aperture synthesis (AS) radiometer presents high system complexity [7,8]. The principle of mirrored aperture synthesis (MAS) was proposed to reduce system complexity compared with AS [9,10,11]. Experimental results implied the validity of MAS [12].
The design of the antenna array is a key problem in radiometric imaging [13,14]. In MAS, the antenna array collects multiple signals, including the direct signals from the observation scene and the reflected signals from the reflectors. Therefore, there are multiple cosine visibilities related to cross-correlation. Unlike the visibilities for AS, obtained by antenna pairs [15,16], the cosine visibilities for MAS are acquired by solving the transformation equation. If the transformation matrix is rank-deficient, the solved cosine visibilities will exhibit errors and have an impact on the accuracy of the reconstructed BT image for earth observations. [17,18].
A maximum-rank array (MRA) with the maximum rank in all possible arrays has been proposed [19,20]. The reconstructed brightness temperature (BT) image of MRA is much better than those of other arrays. However, the transformation matrix of MRA is still rank-deficient, even a full array [21].
In this paper, the polarization of an electromagnetic wave is analyzed for one-dimensional MAS (1-D MAS) and two-dimensional MAS (2-D MAS). The optimization models of the antenna array based on the vertically polarized wave and horizontally polarized wave are established. Optimal arrays for 1-D MAS and 2-D MAS are presented. Simulations are performed to demonstrate the validity of the optimization models.

2. Polarization of Electromagnetic Wave

Regarding MAS, the phase of the reflected signal is different for different polarizations. Figure 1 depicts the plane wave incident at an oblique angle on the surface of an ideal conductor [1]. Metal plates with good electrical conductivity can be used as reflective surfaces with microwaves and millimeter waves. The vectors e i and e r represent the propagation directions of incident and reflected waves, respectively. An electromagnetic wave incident at any angle on the interface of different media is called an oblique incidence. Additionally, the plane formed by the wave vector of the incident wave and the normal vector of the surface is called the incident plane in the case of oblique incidence. In horizontal polarization, the electric field of the incident wave is parallel to the incident plane, and the magnetic field is perpendicular to the incident plane. In vertical polarization, the electric field is perpendicular to the incident plane, and the magnetic field is parallel to the incident plane.
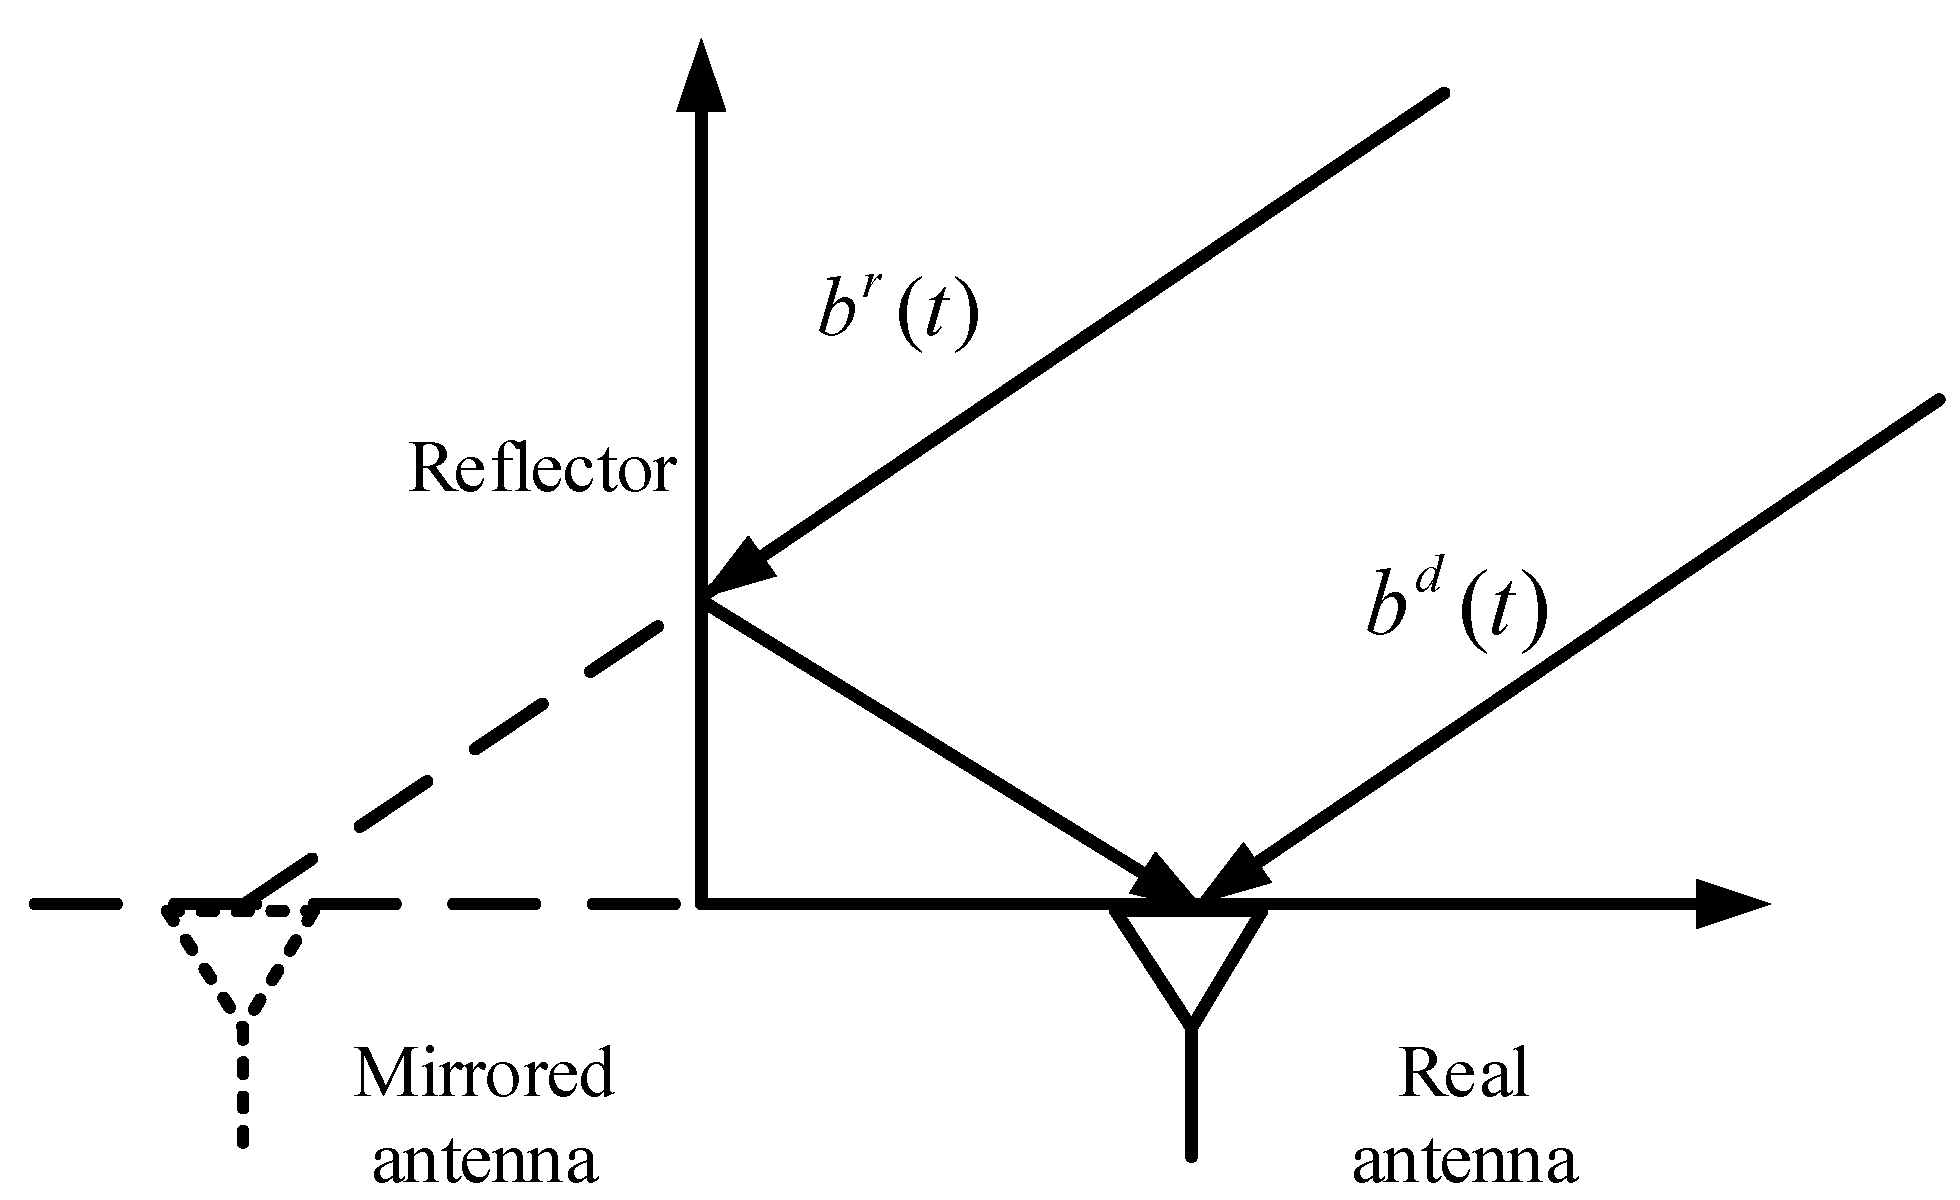
Figure 2 illustrates the signal propagation of 1-D MAS. Each antenna receives two types of signal. b d ( t ) and b r ( t ) indicate the signal from the observation scene and the signal reflected by the reflector, respectively. The process can be interpreted as one mirrored antenna and one real antenna that receive the signal from the observation scene, respectively.
b ( t ) = b d ( t ) + b r ( t )
where b d ( t ) is
b d ( t ) = 0 π 2 β ( θ ; t ) cos [ 2 π f c t k r d ( θ ) ] d θ
where β ( θ ; t ) denotes the baseband signal per steradian, f c represents the center frequency, and r d θ indicates the path length from the observation scene at θ to the antenna.
For vertical polarization, the phase of the reflected signal reverses 180 degrees.
b r ( t ) = 0 π 2 β ( θ ; t ) cos [ 2 π f c t k r r ( θ ) ] d θ
Concerning horizontal polarization, the phase of the reflected signal does not change.
b r ( t ) = 0 π 2 β ( θ ; t ) cos [ 2 π f c t k r r ( θ ) ] d θ
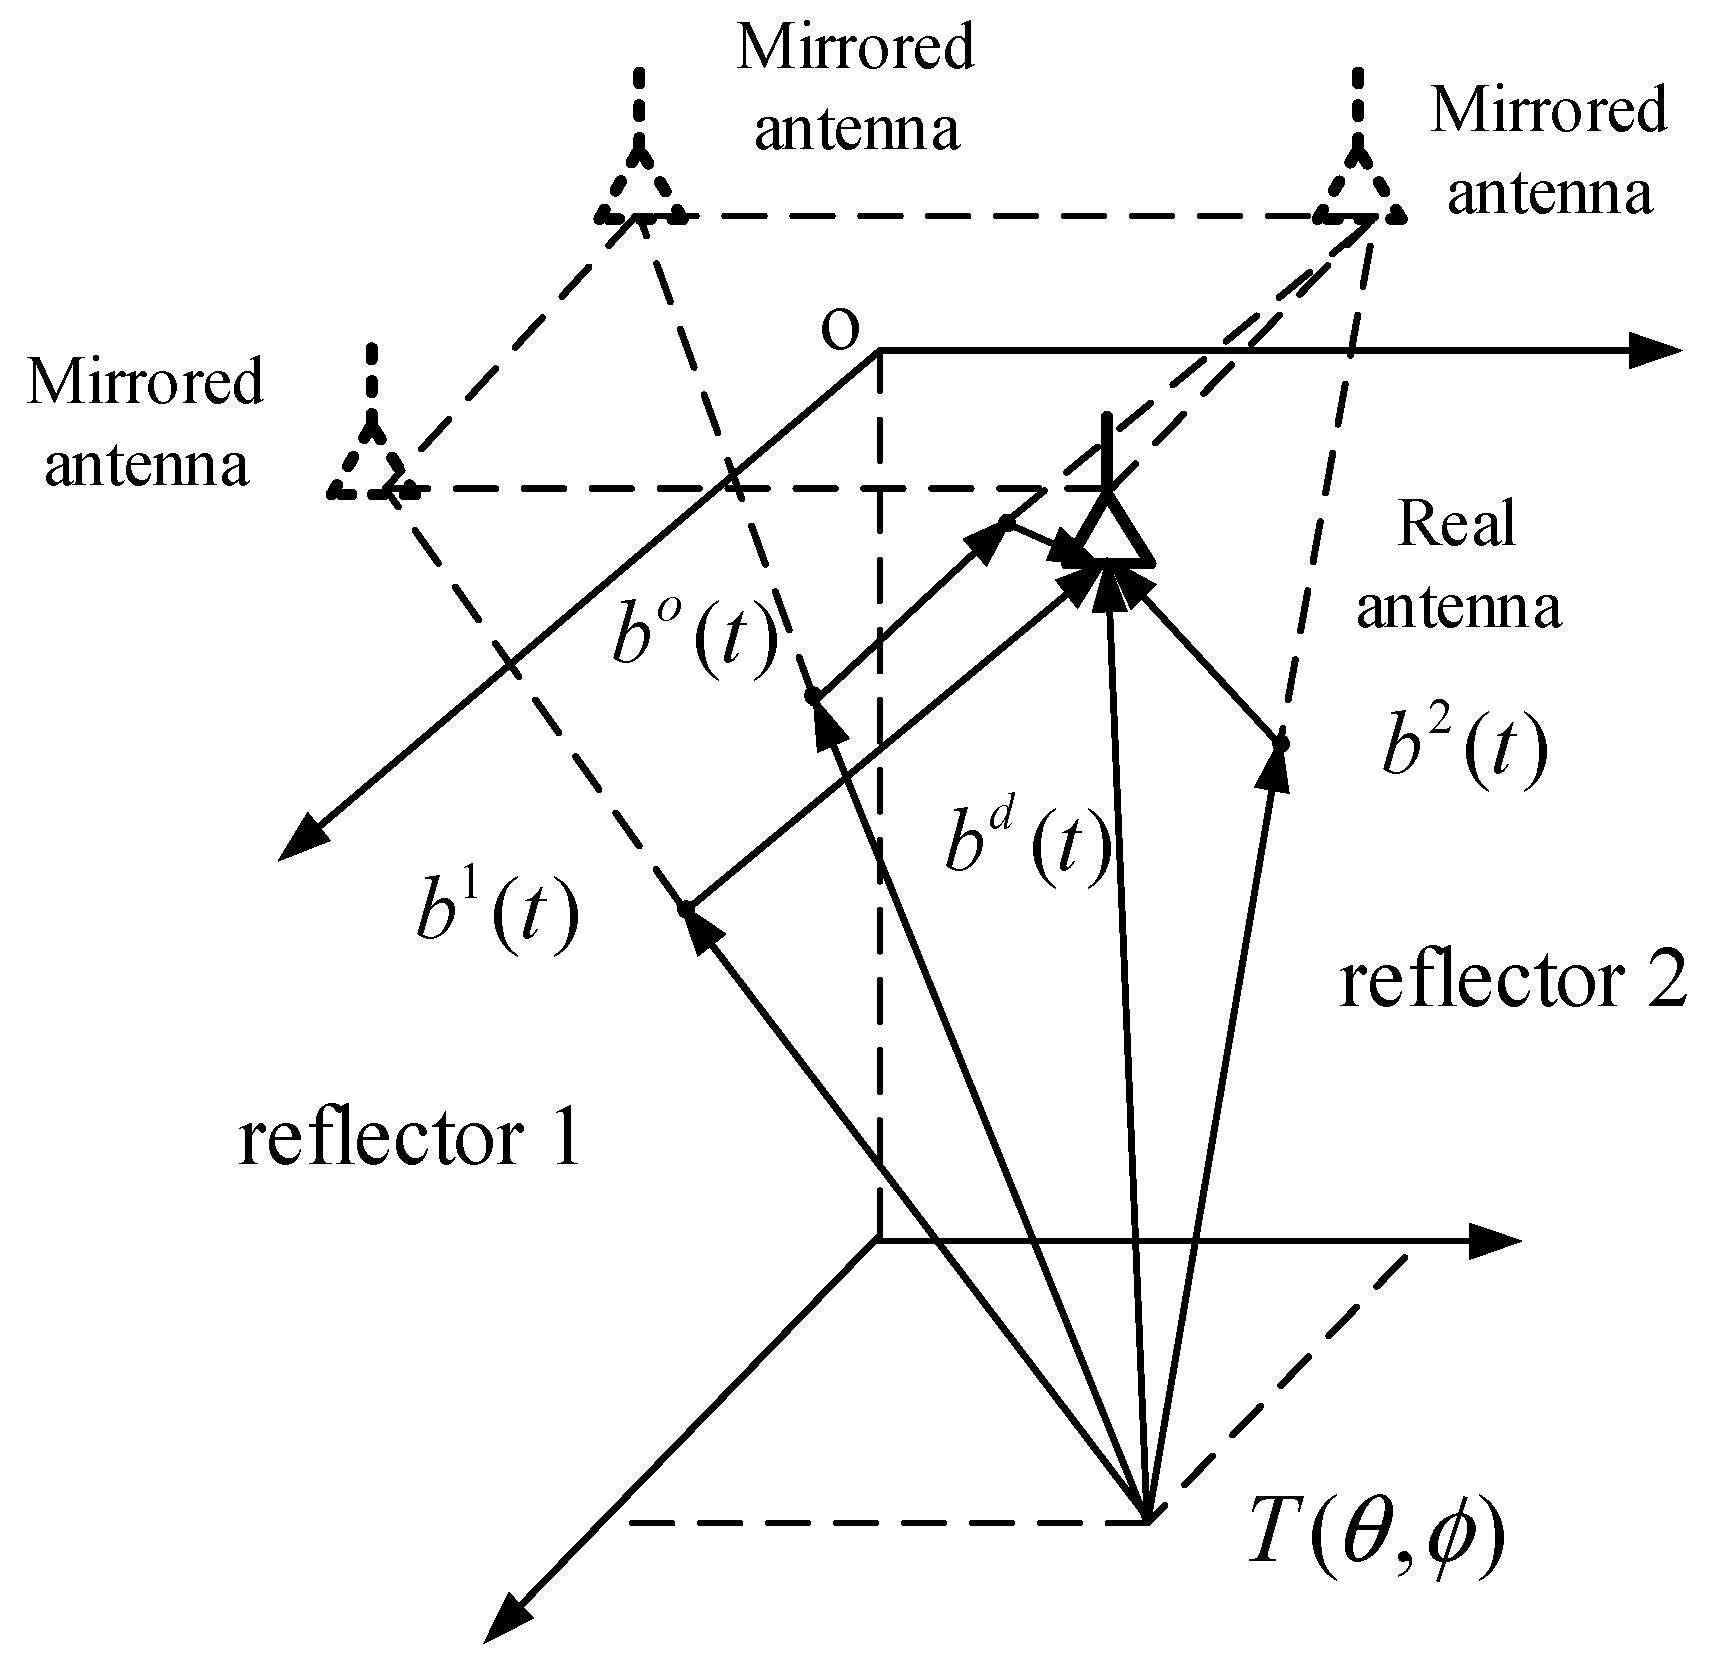
Figure 3 shows the signal propagation of 2-D MAS. Each antenna receives four types of signal b d ( t ) , b 1 ( t ) , b 2 ( t ) , and b o ( t ) indicate the signal directly from the source, the reflected signal with one reflection from reflector 1, the reflected signal with one reflection from reflector 2, and the reflected signal with double reflection from the two reflectors, respectively. The process can be interpreted as three mirrored antennas and one real antenna that receive the signal from the observation scene, respectively.
b ( t ) = b d ( t ) + b 1 ( t ) + b 2 ( t ) + b o ( t )
where b d ( t ) is
b d ( t ) = 0 π 2 0 π 2 β ( θ , ϕ ; t ) cos [ 2 π f c t k r d ( θ , ϕ ) ] sin θ d θ d ϕ
The case of the single reflection has been analyzed in the signal propagation of 1-D MAS. Concerning a double reflection, regardless of whether the wave is vertically or horizontally polarized, b o ( t ) is
b o ( t ) = 0 π 2 0 π 2 β ( θ , ϕ ; t ) cos [ 2 π f c t k r o ( θ , ϕ ) ] sin θ d θ d ϕ
where r o θ , ϕ represents the path length from the observation scene at θ , ϕ to the antenna.

3. Array Optimization for 1-D MAS

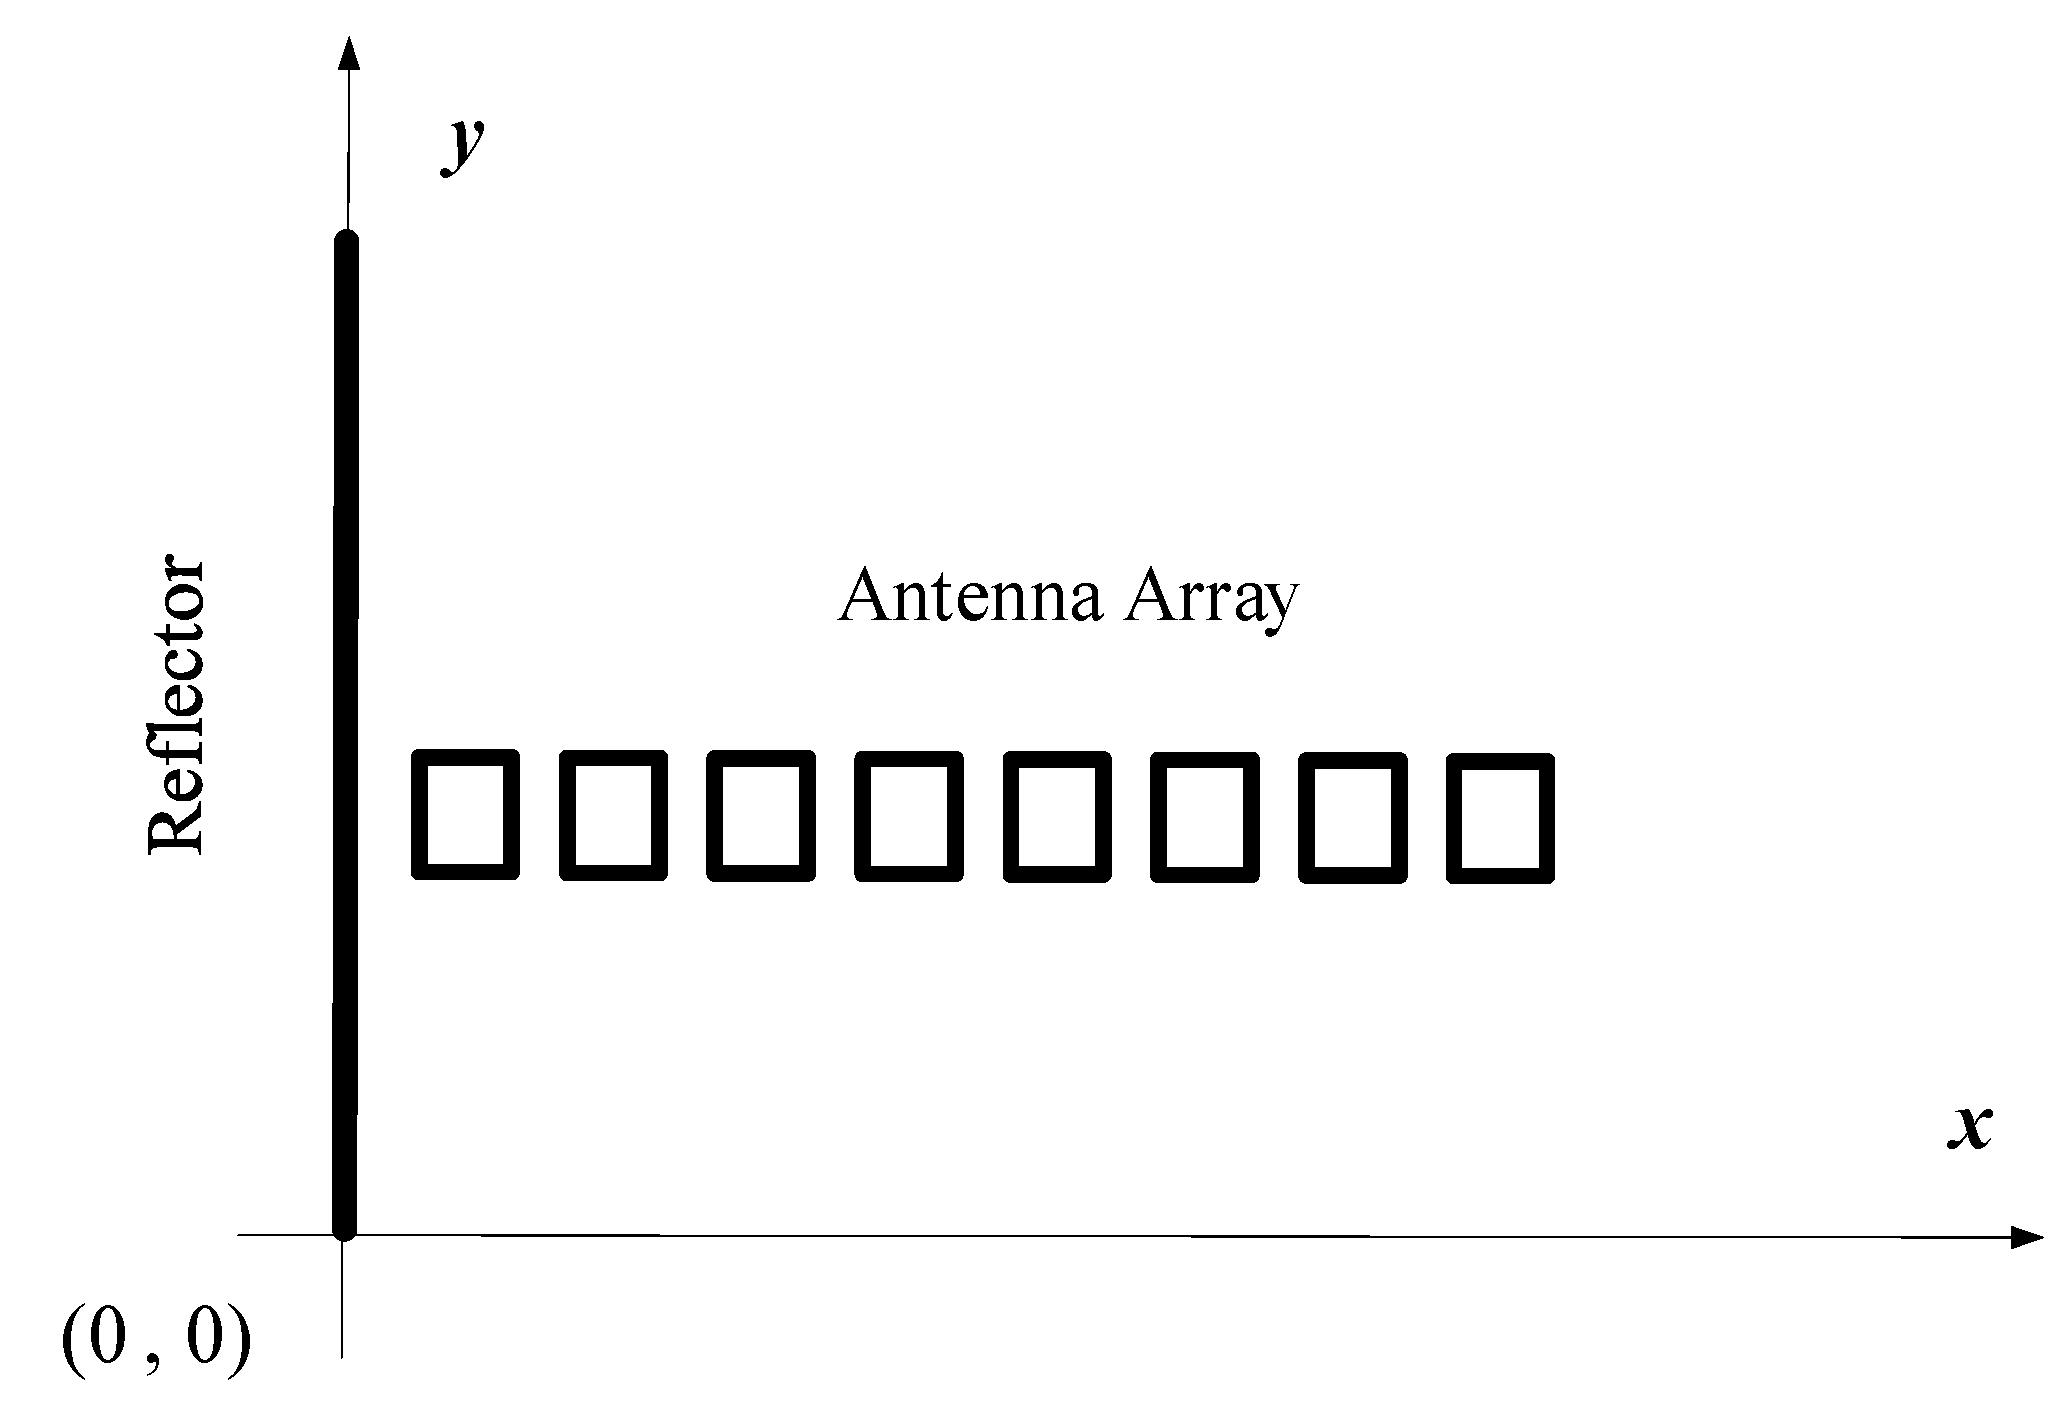
A 1-D MAS consisting of an antenna array and a reflector is illustrated in Figure 4. The cross-correlation of the two antennas is expressed in (8) when the polarization directions of the receiving antennas i and j are along the y-axis (y- polarization).
R i j 1 = < b i ( t ) b j ( t ) > = C v ( x j x i ) C v ( x j + x i )
where x i and x j represent the normalized coordinates with respect to wavelength (λ), and C v ( u ) refers to the 1-D cosine visibility.
C v ( u ) = 2 0 π 2 T Ω ( θ ) cos ( 2 π u sin θ ) d θ
When the polarization directions of the receiving antennas are along the x-axis (x-polarization), the cross-correlation is expressed as
R i j 2 = C v ( x j x i ) + C v ( x j + x i )
The transformation equation relating the cosine visibilities with the cross-correlations is
R = P C v
where P = [ P 12 ,   P 13 , , P i j , ,   P ( S 1 ) S ] T indicates the transformation matrix with each row P i j = [ P i j ( 1 ) ,   P i j ( 2 ) , , P i j ( m ) , ,   P i j ( M ) ] .
Regarding the antenna with x-polarization, the element P i j 1 ( m ) in the transformation matrix P 1 is calculated by
P i j 1 ( m ) = 1 , m = x i x j 1 , m = x i + x j 0 , o t h e r w i s e
Concerning the antenna with y-polarization, the element P i j 2 ( m ) in the transformation matrix P 2 can be calculated by
P i j 2 ( m ) = 1 , m = x i x j   1 , m = x i + x j 0 , o t h e r w i s e
In terms of any pair of antennas with x-polarization or y-polarization, a transformation equation similar to (11) can be obtained. The set of cross-correlations based on the dual-polarization is combined as
R 1 R 2 = P 1 P 2 C v
where R 1 and R 2 represent the cross-correlation vectors with x-polarization and with y-polarization, respectively.
For a given number of antennas, the optimization array design of 1-D MAS seeks a maximum rank array without a missing baseline. Considering dual-polarization, the following model is obtained as
min   N , s . t .   x N = H s . t .   R a n k ( P ) = 2 H 1
where N denotes the number of antennas, and H is the array size.
The antenna array based on dual-polarization is called the dual-polarization array (DPA). The simulated annealing (SA) optimization algorithm is a heuristic solution to simulate the annealing process under physical conditions. Additionally, the metropolis criterion is introduced to avoid the solution converging to the local optimal value of the objective function in a certain solution space. The SA optimization algorithm has been applied to many optimization problems, especially discrete solution space optimization problems, due to its easy implementation and stability. Therefore, this algorithm can be adopted to solve the antenna array optimization problem of 1-D MAS. The SA optimization algorithm is detailed as follows. (1) The SA optimization algorithm is used to construct an initial antenna array at random for a given number of antennas N and a given array size H; (2) if the initial antenna array does not satisfy (15), then the position of an antenna is randomly adjusted; if the initial antenna array satisfies (15), N is decreased, and procedure (1) is repeated until SA optimization algorithm cannot produce an acceptable solution. Some DPAs are listed in Table 1.
Table 2 provides the maximum baselines and ranks of 1-D DPAs. Compared with 1-D maximum rank arrays (MRAs) [7], 1-D DPAs can achieve longer maximum baselines with the same number of antennas. The transformation matrix becomes a column full rank matrix by combining the cross-correlations with different polarizations.
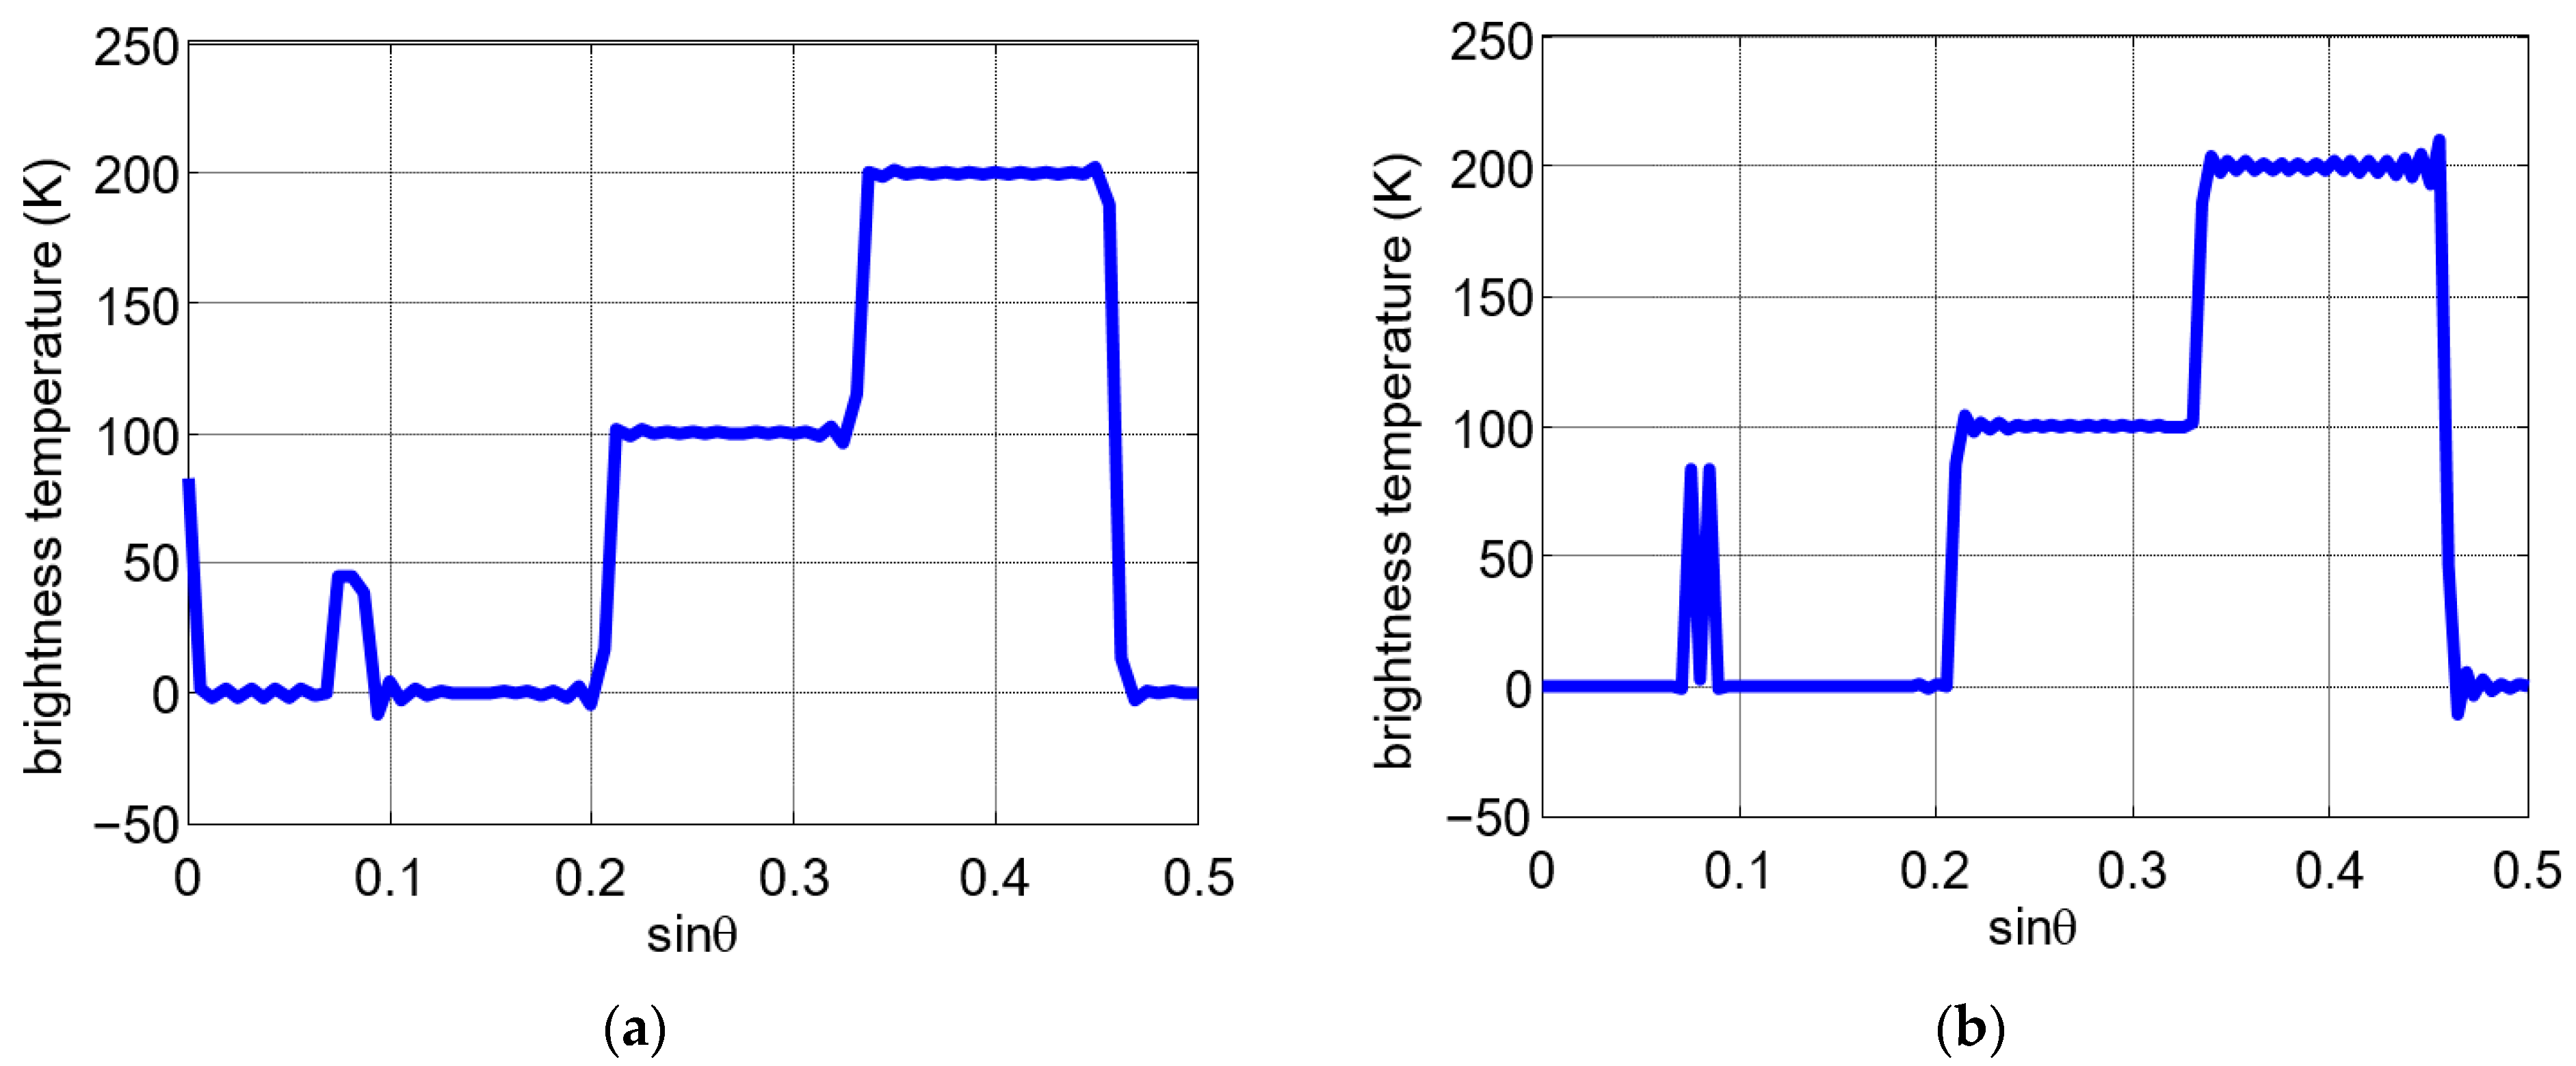
Simulations were conducted to demonstrate the validity of 1-D DPA. A test scene composed of two close point sources and extended sources is utilized in the simulations. Two types of arrays, 1-D MRA and 1-D DPA, are employed for comparison. The number of antennas for two arrays is the same (14). The minimum spacing between antenna elements is λ.
The reconstructed BT images are displayed in Figure 5. Figure 5a presents the result for a 1-D MRA with the array configuration {4.5, 6.5, 13.5, 14.5, 19.5, 23.5, 24.5, 30.5, 35.5, 36.5, 37.5, 38.5, 39.5, 40.5}. Figure 5b exhibits the result for a 1-D DPA with the array configuration {3.5, 10.5, 17.5, 24.5, 31.5, 38.5, 44.5, 50.5, 51.5, 52.5, 53.5, 54.5, 55.5, 56.5}. The reconstructed BT image of 1-D DPA is much better than that of 1-D MRA, and the two-point sources are distinguished in Figure 5b but not in Figure 5a. Compared with Figure 5b, there are large errors at image boundaries in Figure 5a, owing to the errors between the solved cosine visibilities and the ideal cosine visibilities. With the same number of antennas, the maximum baselines corresponding to the 1-D MRA and 1-D DPA are 80 and 112, respectively, and the ranks are 79 and 112, respectively. Therefore, the 1-D DPA with a full-rank transformation matrix has a larger maximum baseline than the 1-D MRA with a rank-defificient transformation matrix, contributing to providing higher image quality and spatial resolution.

4. Array Optimization for 2-D MAS

A 2-D MAS consisting of two reflectors and an antenna array is illustrated in Figure 6. The cross-correlation for the receiving antennas i and j with y-polarization is
R i j 1 = C v ( x j x i , y j y i ) + C v ( x j x i , y j + y i ) C v ( x j + x i , y j y i ) C v ( x j + x i , y j + y i )
where ( x i , y i ) and ( x j , y j ) are the normalized coordinates, C v ( u , v ) denotes the 2-D cosine visibility, and u , v are the spatial frequency determined by the spacing between the antenna positions.
C v ( u , v ) = 4 0 π 2 0 π 2 T Ω ( θ , ϕ ) cos ( u sin θ cos ϕ ) cos ( v sin θ sin ϕ ) sin θ d θ d ϕ
The cross-correlation for the receiving antennas i and j with x-polarization is
R i j 2 = C v ( x j x i , y j y i ) C v ( x j x i , y j + y i ) + C v ( x j + x i , y j y i ) C v ( x j + x i , y j + y i )
The transformation equation connecting the cosine visibilities to the cross-correlations is
R = P C v
where P = [ P 12 ,   P 13 , , P i j , ,   P ( S 1 ) S ] T indicates the transformation matrix with P i j = [ P i j ( 0 , 1 ) ,   P i j ( 0 , 2 ) , , P i j ( m , n ) , ,   P i j ( M , N ) ] .
The element P i j ( m , n ) for the antenna with x-polarization can be calculated by
P i j 1 ( m , n ) = 1 , ( m , n ) = (   | x i x j | ,   | y i y j |   ) 1 , ( m , n ) = (   | x i x j | ,   | y i + y j |   ) 1 , ( m , n ) = (   | x i + x j | ,   | y i y j |   ) 1 , ( m , n ) = (   | x i + x j | ,   | y i + y j | ) 0 , o t h e r w i s e
The element P i j ( m , n ) for the antenna with y-polarization can be calculated by
P i j 2 ( m , n ) = 1 , ( m , n ) = (   | x i x j | ,   | y i y j |   ) 1 , ( m , n ) = (   | x i x j | ,   | y i + y j |   ) 1 , ( m , n ) = (   | x i + x j | ,   | y i y j |   ) 1 , ( m , n ) = (   | x i + x j | ,   | y i + y j |   ) 0 , o t h e r w i s e
Concerning any pair of antennas with x-polarization or y-polarization, a transformation equation similar to (19) can be obtained. The set of cross-correlations based on the dual-polarization is combined as
R 1 R 2 = P 1 P 2 C v
The maximum rank of the antenna array based on the dual-polarization should be determined first, to obtain DPAs for 2-D MAS. Considering a full array with the array size of H x × H y , the coordinates of the antennas are divided into three cases depending on whether the antenna coordinates are odd or even multiples of 0.5:
(1)
The coordinates of each antenna along two dimensions are even multiples of 0.5.
(2)
The coordinates of each antenna along two dimensions are odd multiples of 0.5.
(3)
The coordinate of each antenna along one dimension is an even multiple of 0.5, and along the other dimension is an odd multiple of 0.5.
1
The first case
The ranks of the full arrays when the coordinates of each antenna along two dimensions are even multiples of 0.5 are presented in Table 3. The maximum rank is expressed as
Rank ( P H x H y ) = 4 H x H y + 2 H x + 2 H y 7
where H x 4 and H y 3 , or H x = 3 and H y 4 both hold.
2
The second case
The ranks of the full arrays when the coordinates of each antenna along two dimensions are odd multiples of 0.5 are provided in Table 4. The maximum rank is calculated by
Rank ( P H x H y ) = 4 H x H y + 2 H x + 2 H y 5
where H x 2.5 and H y 2.5 both hold.
3
The third case
The ranks of the full arrays when the coordinate of each antenna along one dimension is an even multiple of 0.5, and along the other dimension is an odd multiple of 0.5, are listed in Table 5. The maximum rank is obtained by
Rank ( P H x H y ) = 4 H x H y + 2 H x + 2 H y 5
where H x 3.5 and H y 3 , H x = 2.5 and H y 4 , H y 3.5 and H x 3 , or H y = 2.5 and H x 4 both hold.
The relationship between the rank and the array size in the second case is the same as in the third case. Therefore, the following model is obtained.
min   N s . t .   x N = H x s . t .   y N = H y s . t .   Rank ( P ) = 4 H x H y + 2 H x + 2 H y 7 , when   H x   and   H y   are   both   even   multiples   of   0.5 . 4 H x H y + 2 H x + 2 H y 5 , when   H x   is   an   odd   multiple   of   0.5 and   H y   is   an   even   or   odd   multiple   of   0.5 , or   H x   is   an   odd   multiple   of   0.5 and   H y   is   an   even   or   odd   multiple   of   0.5 .
where x N and y N denote the farthest distances from the antenna to the two reflectors, respectively.
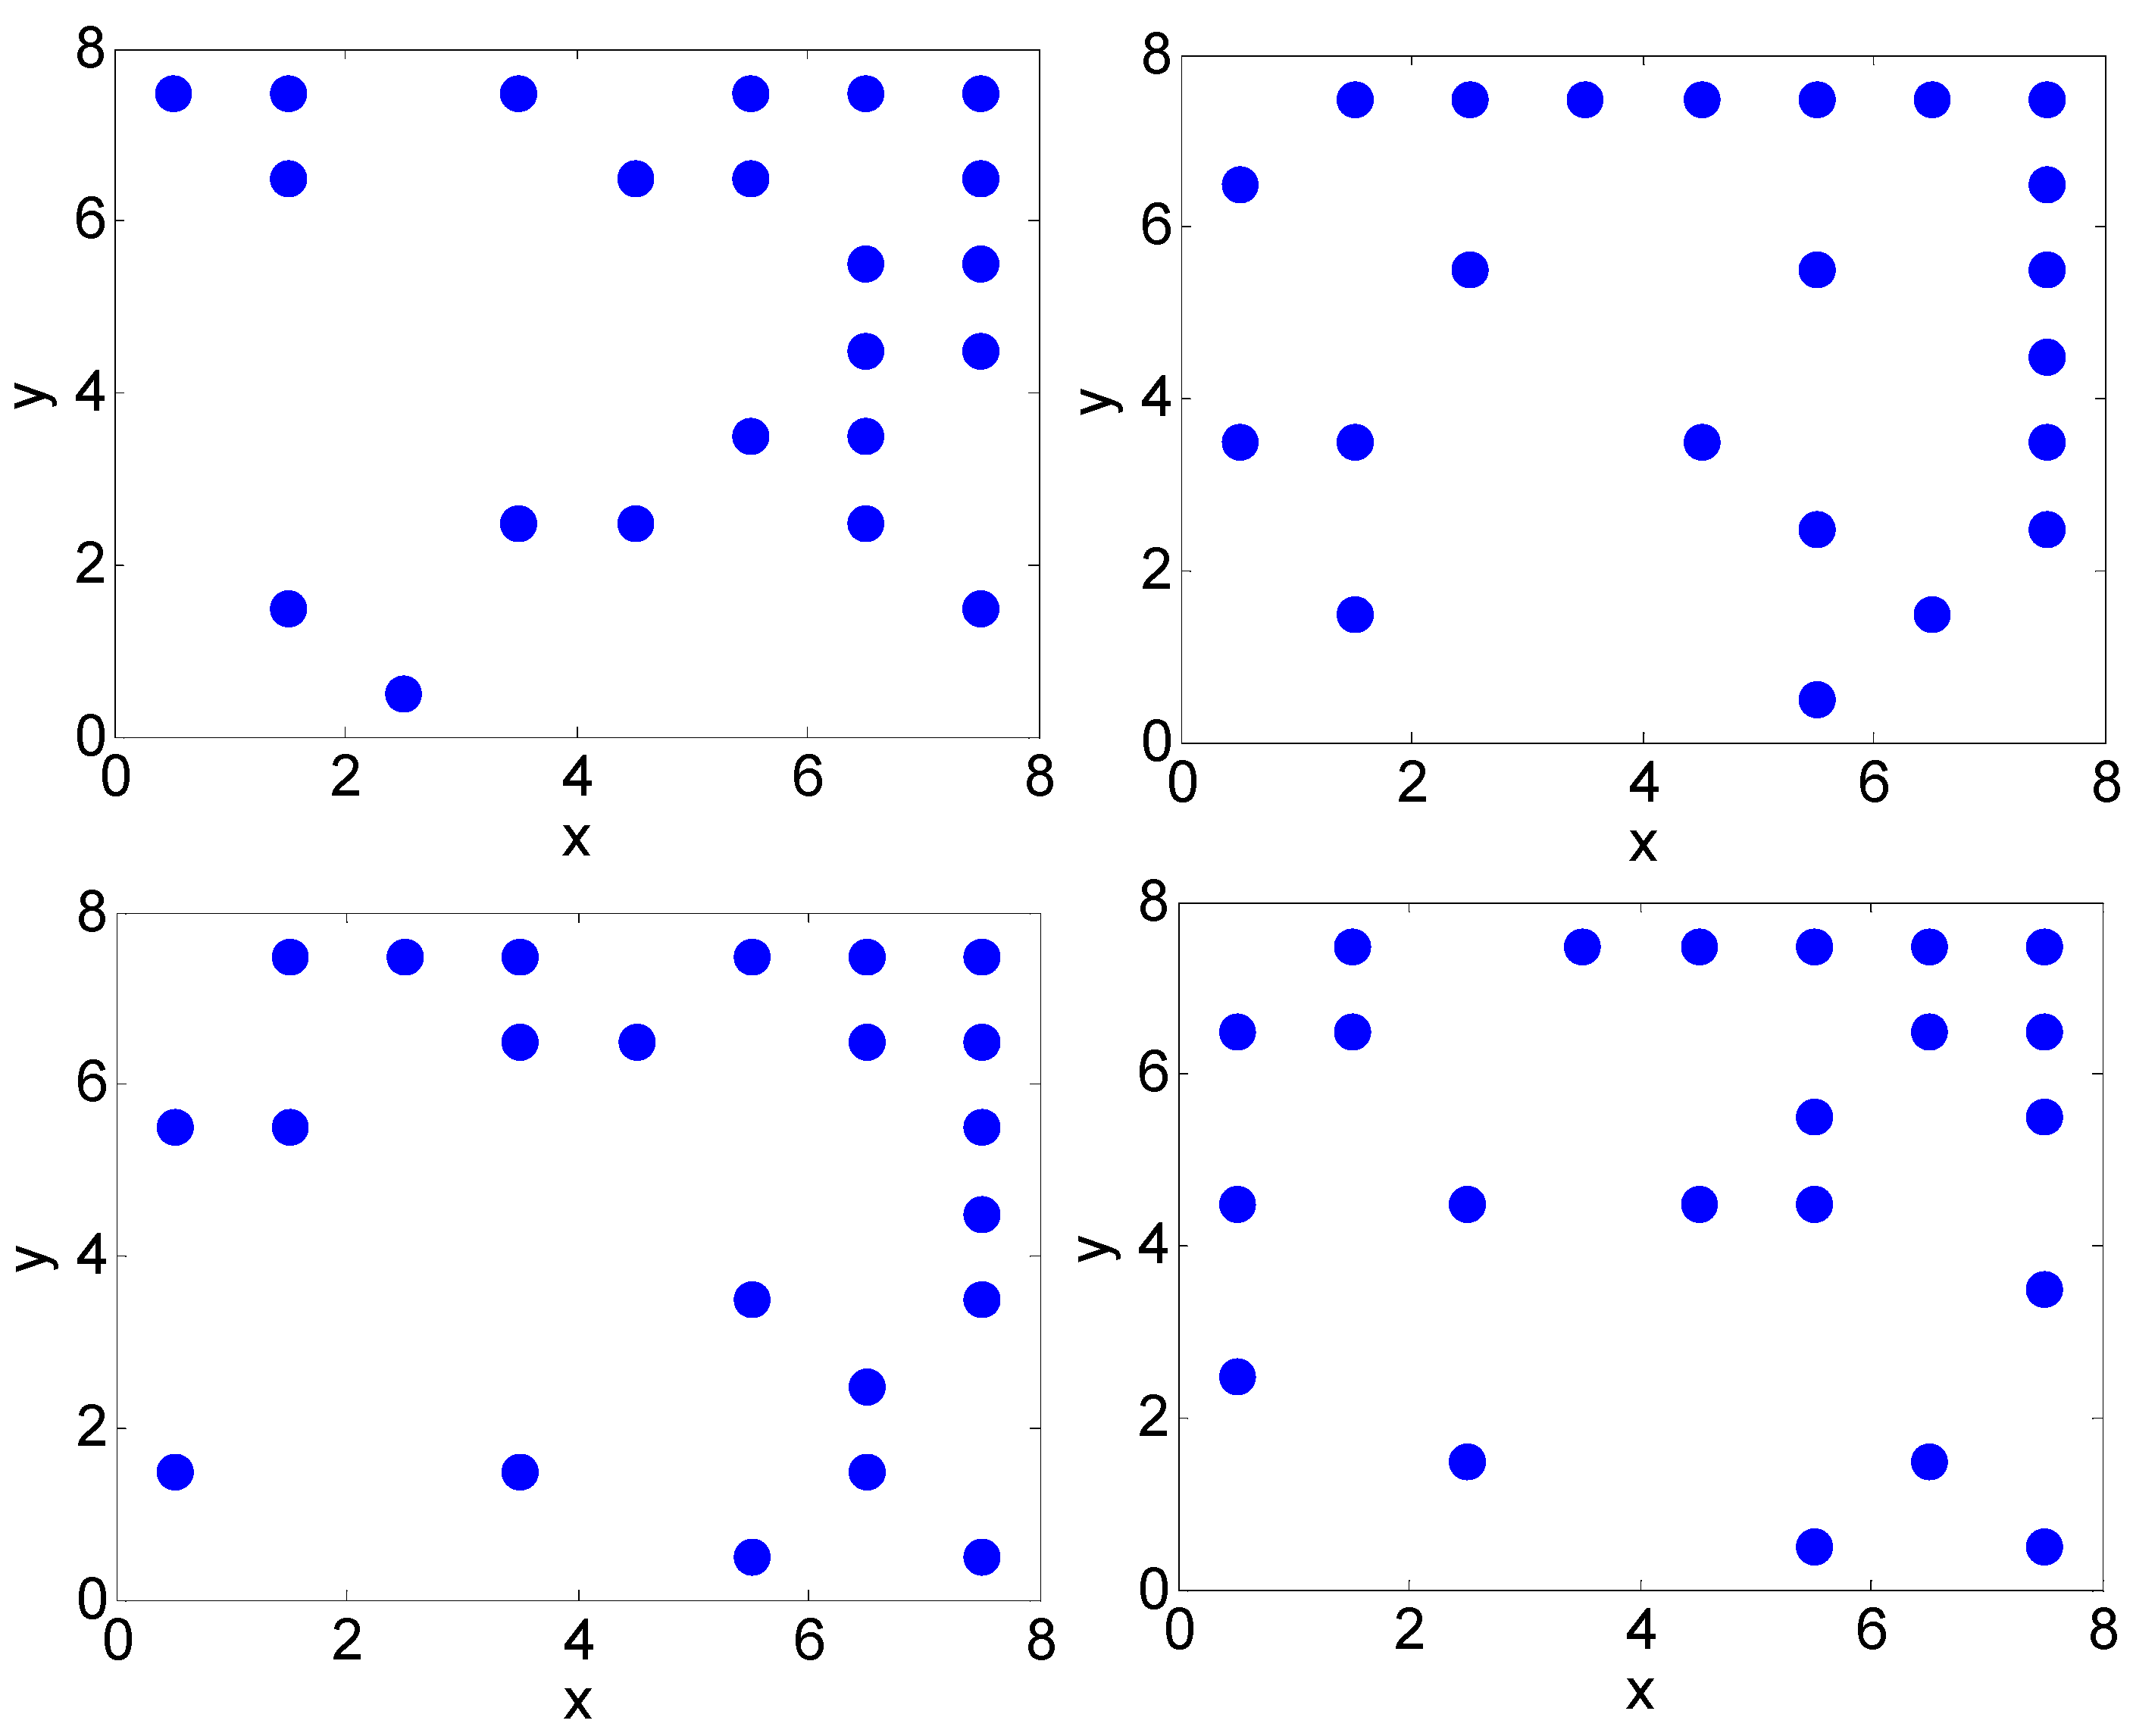
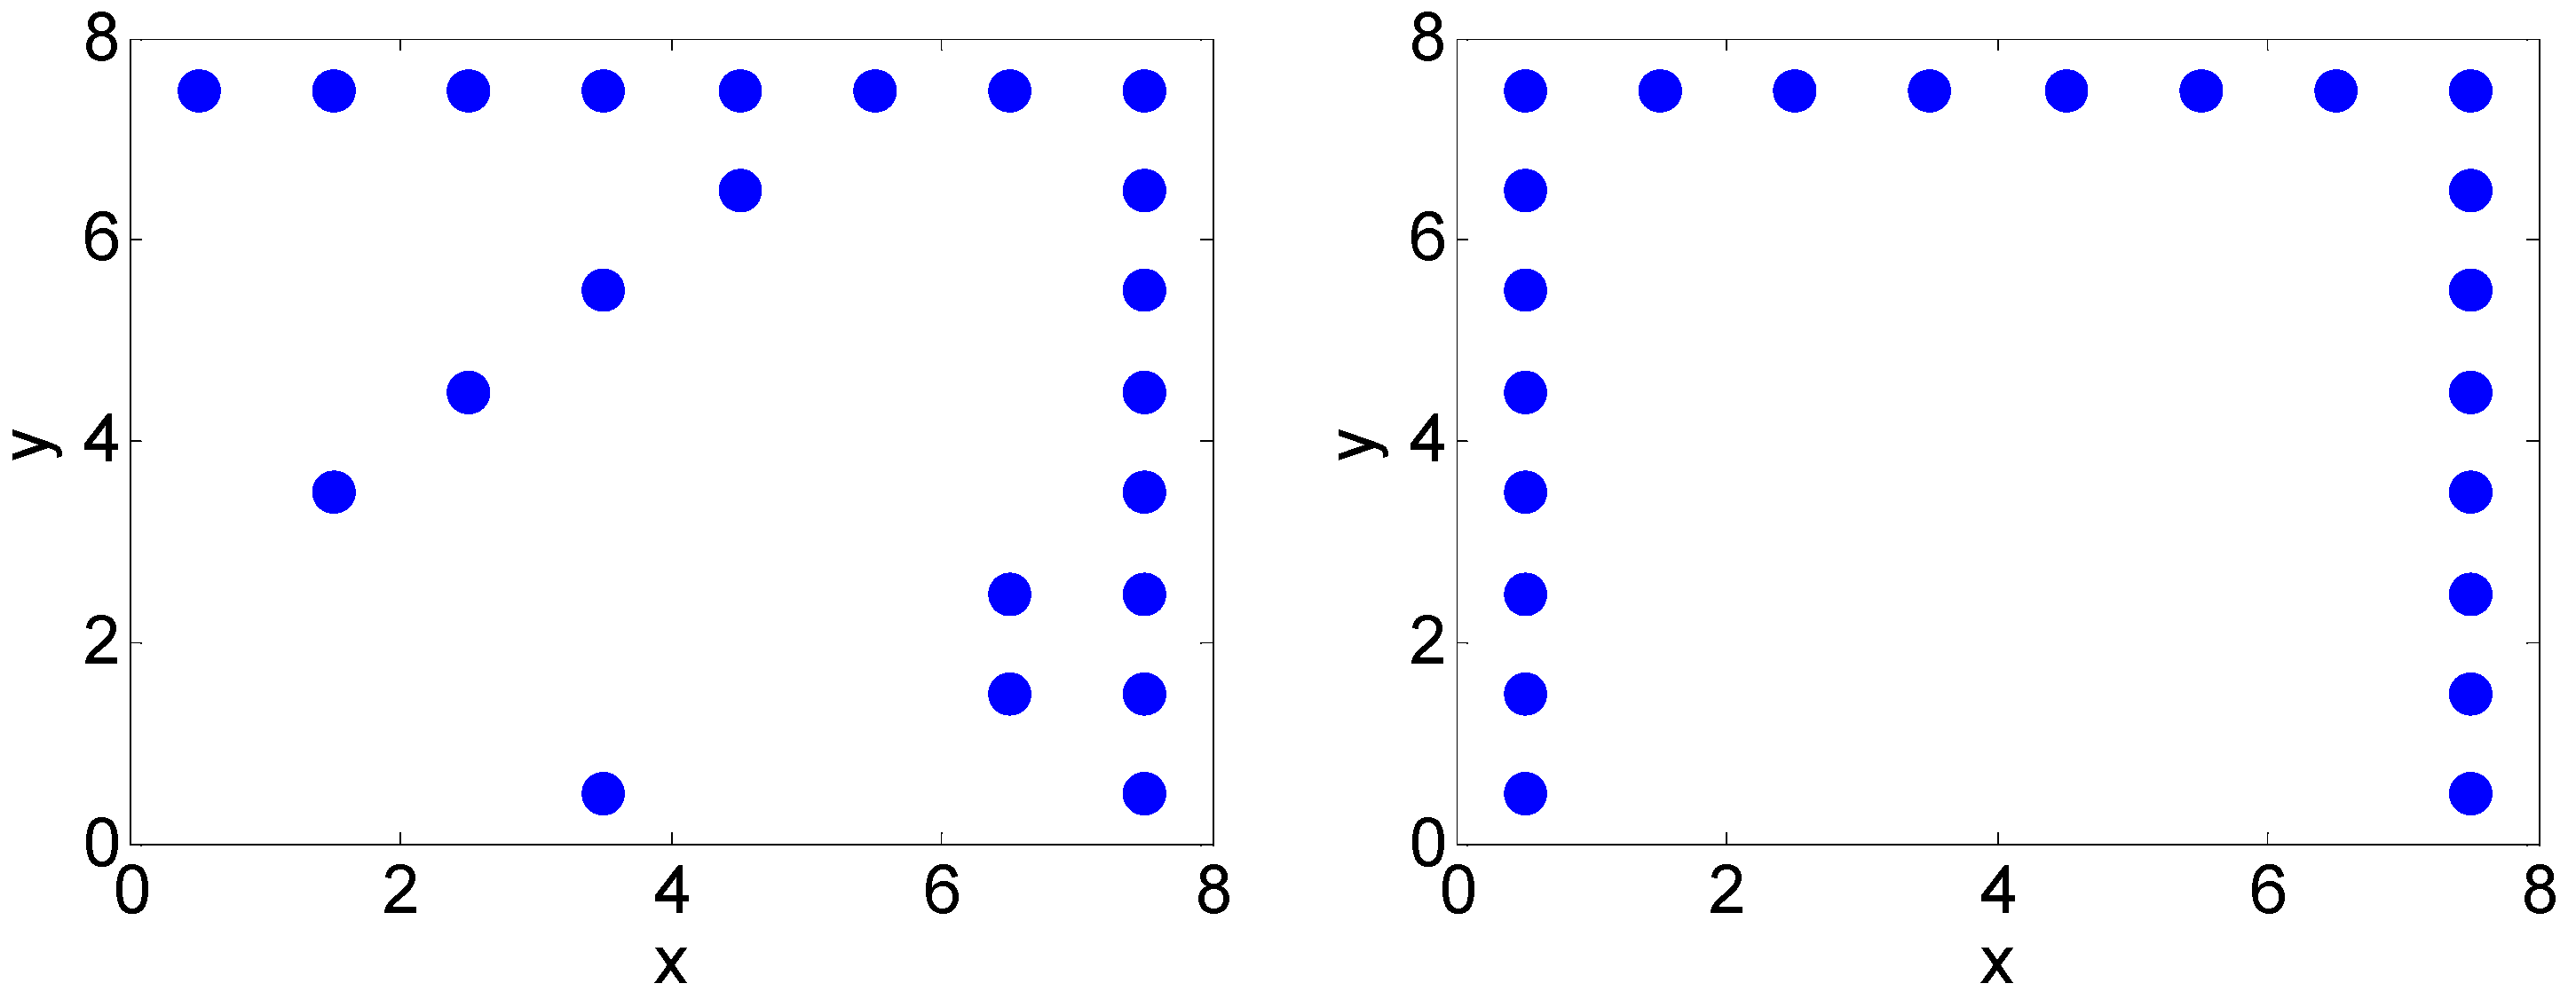
The simulated annealing optimization algorithm is also used to search for a 2-D DPA. Some 2-D DPAs are exhibited in Figure 7.
The array configurations in Figure 8 seem irregular. This type of array configuration can be found in lots of numerical simulations.
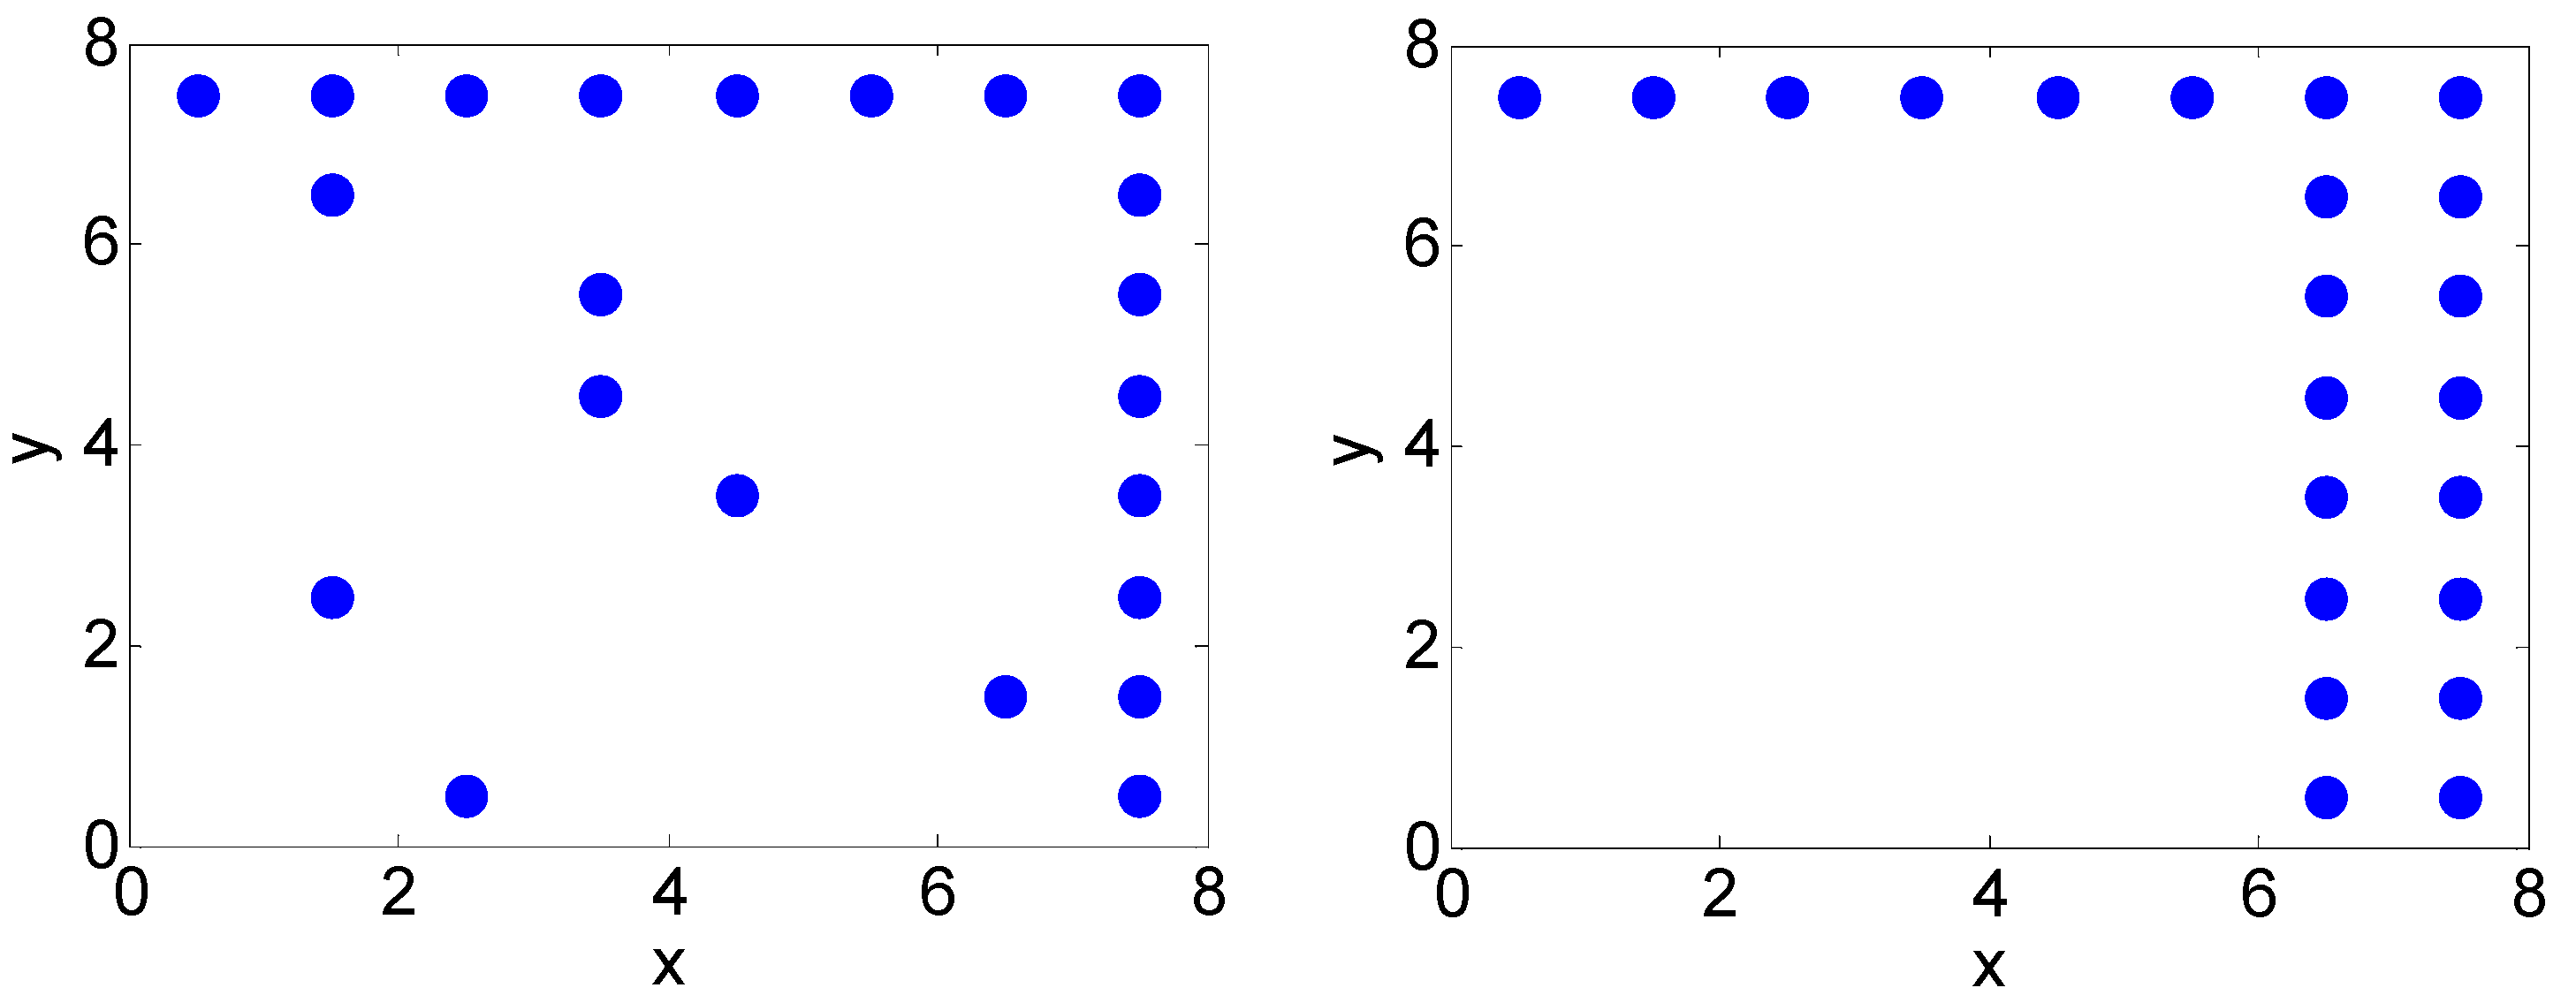
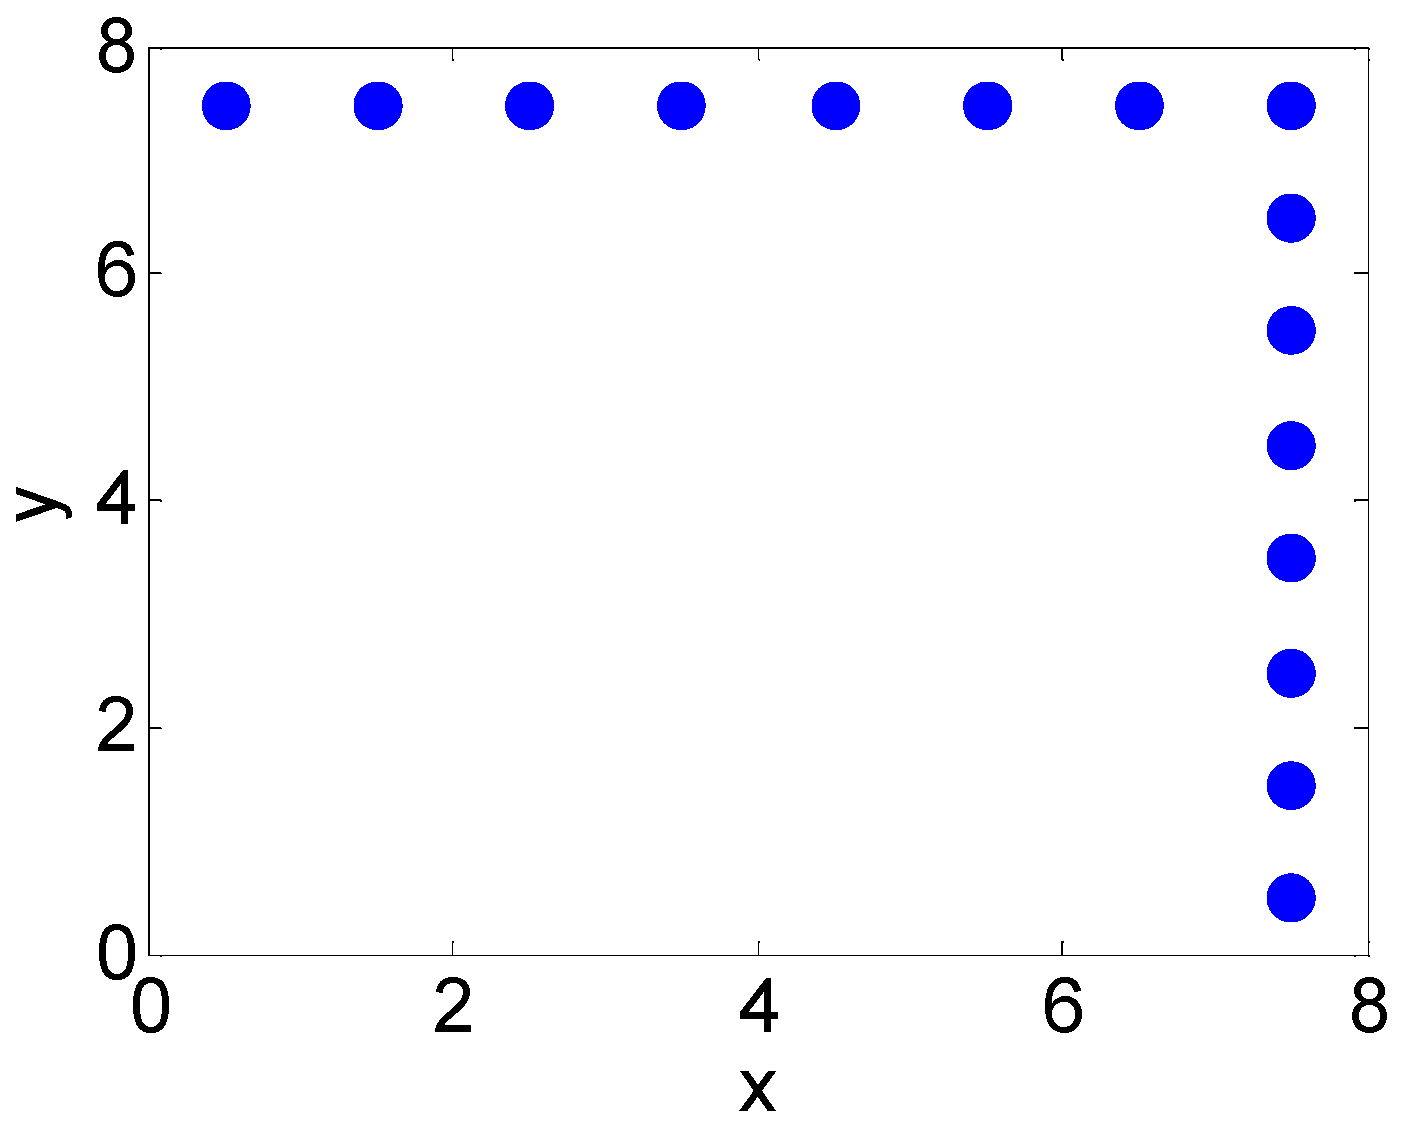
There is a similar structure among the four arrays presented in Figure 9. Two arms form an L shape on the edge of the array, and the rest of the antenna are distributed randomly in other positions. These arrays are called L-shaped arrays, owing to their L-shaped outline.
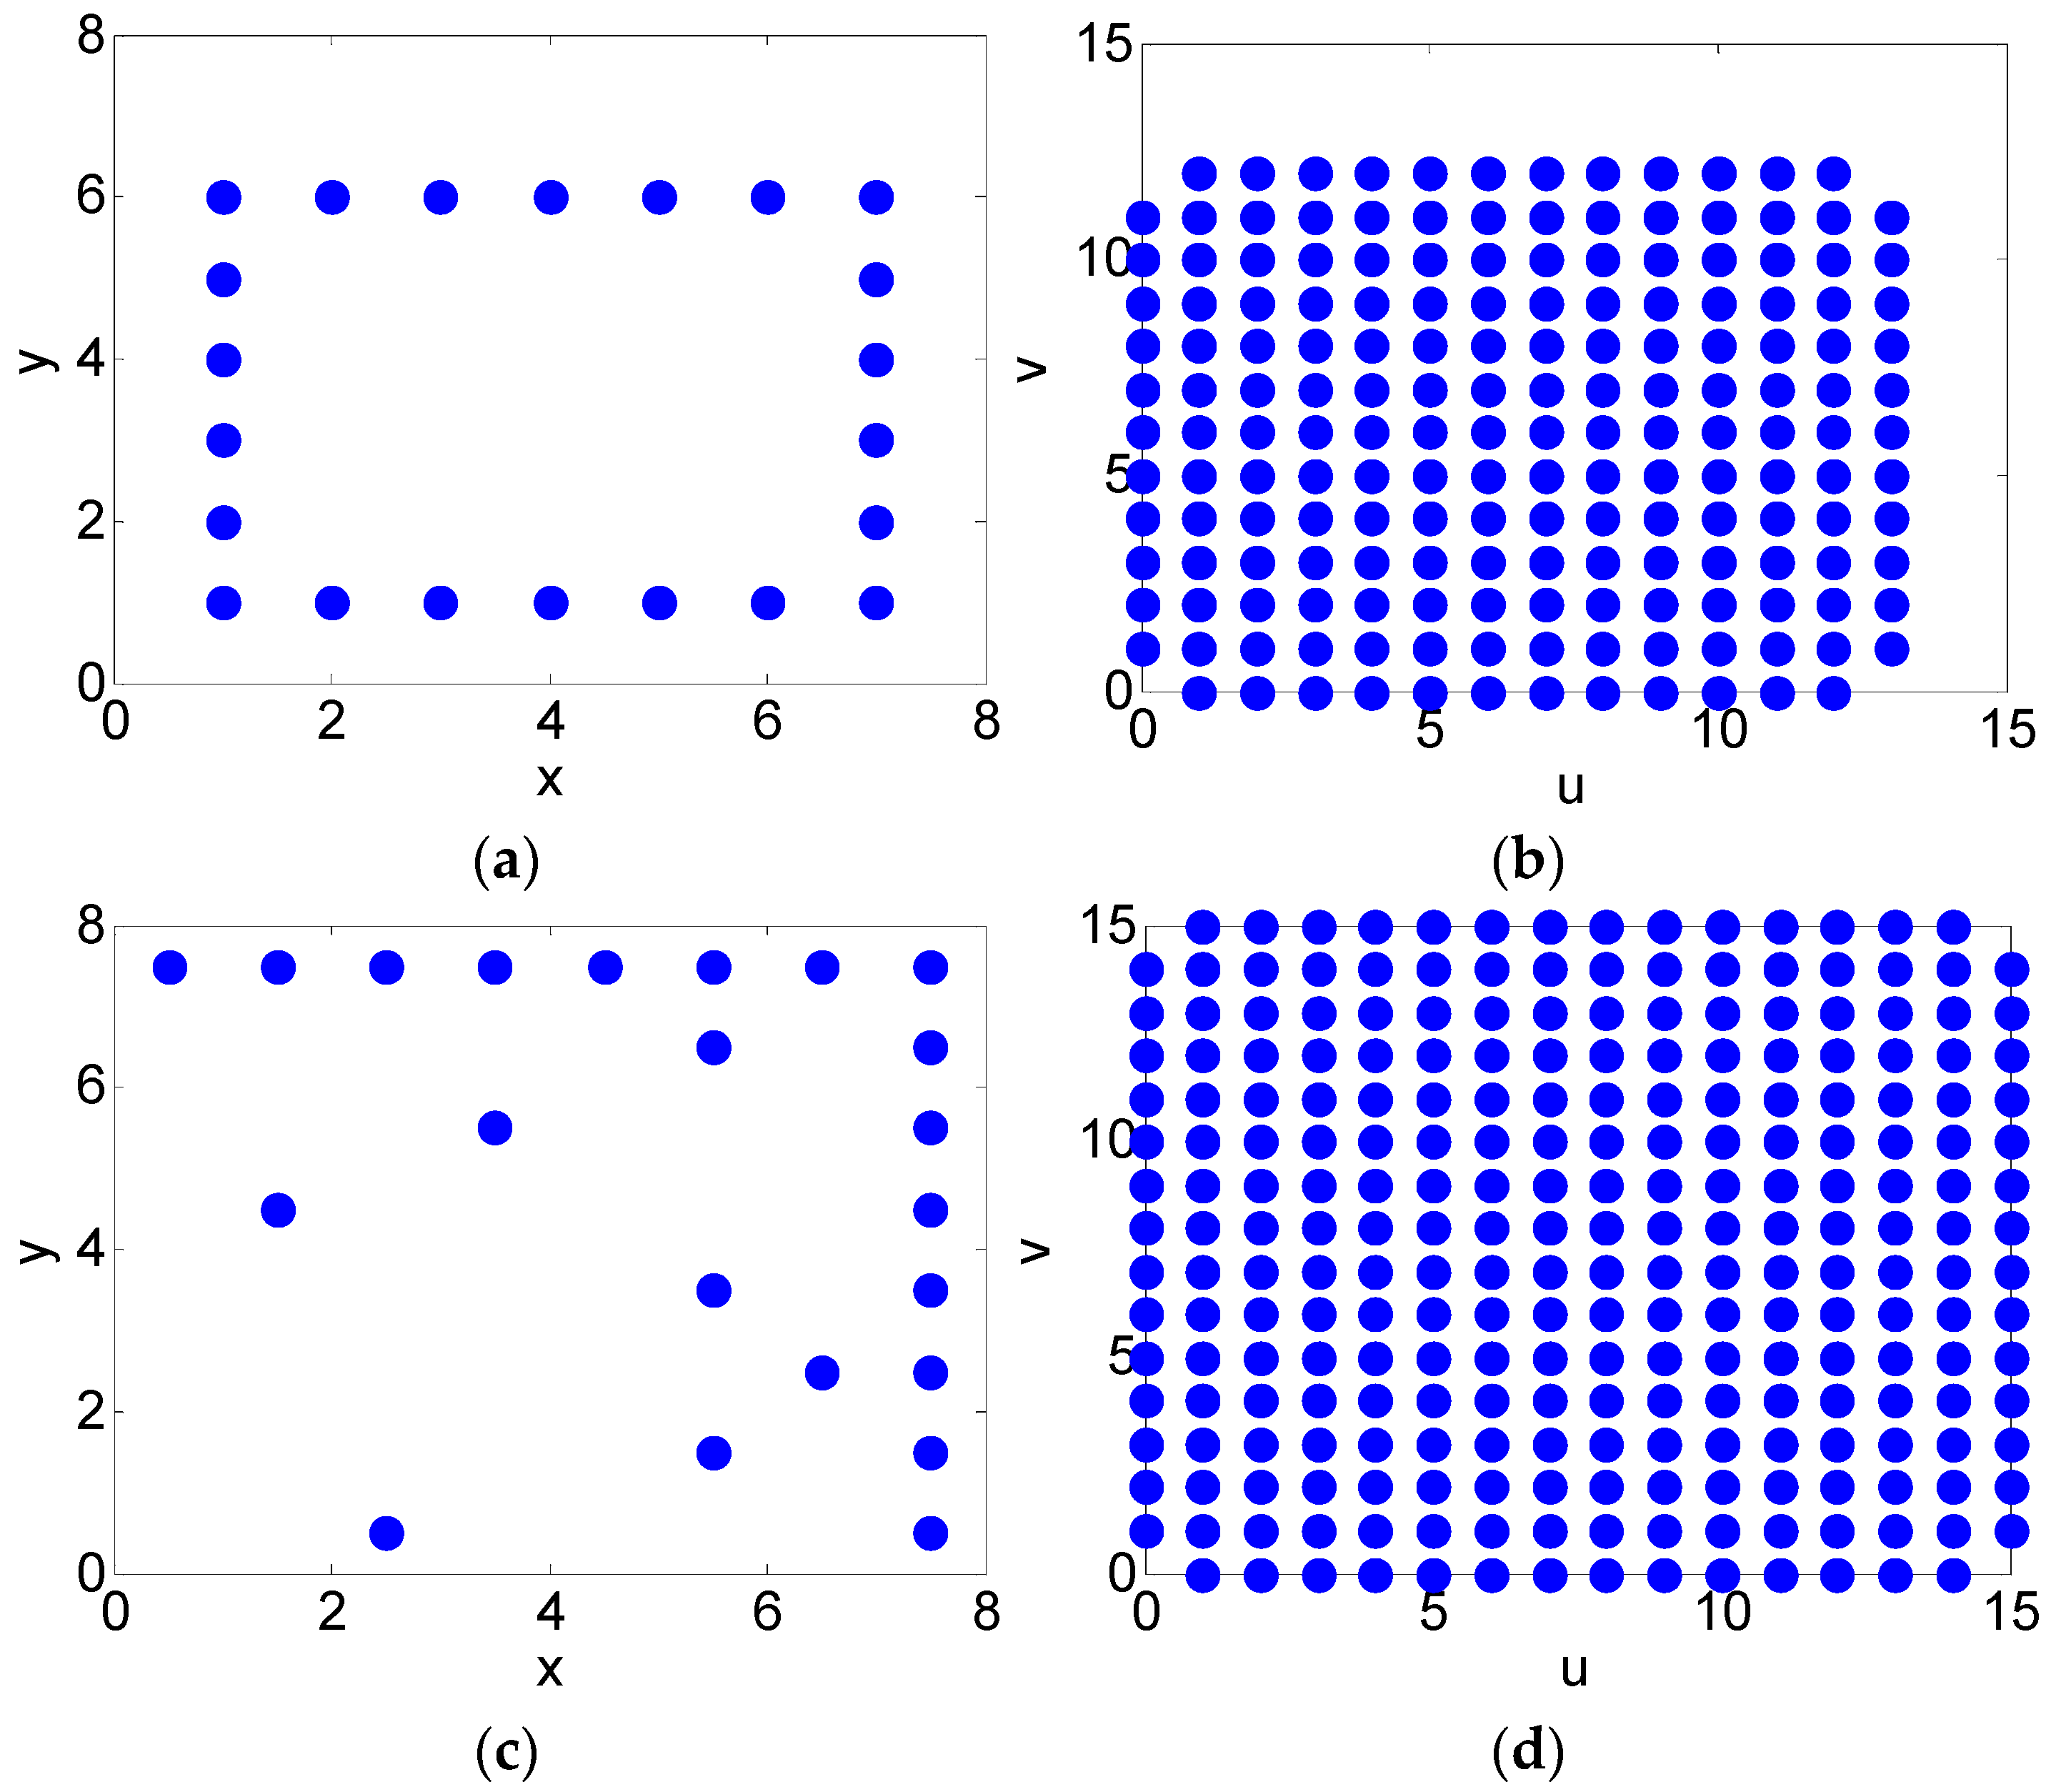
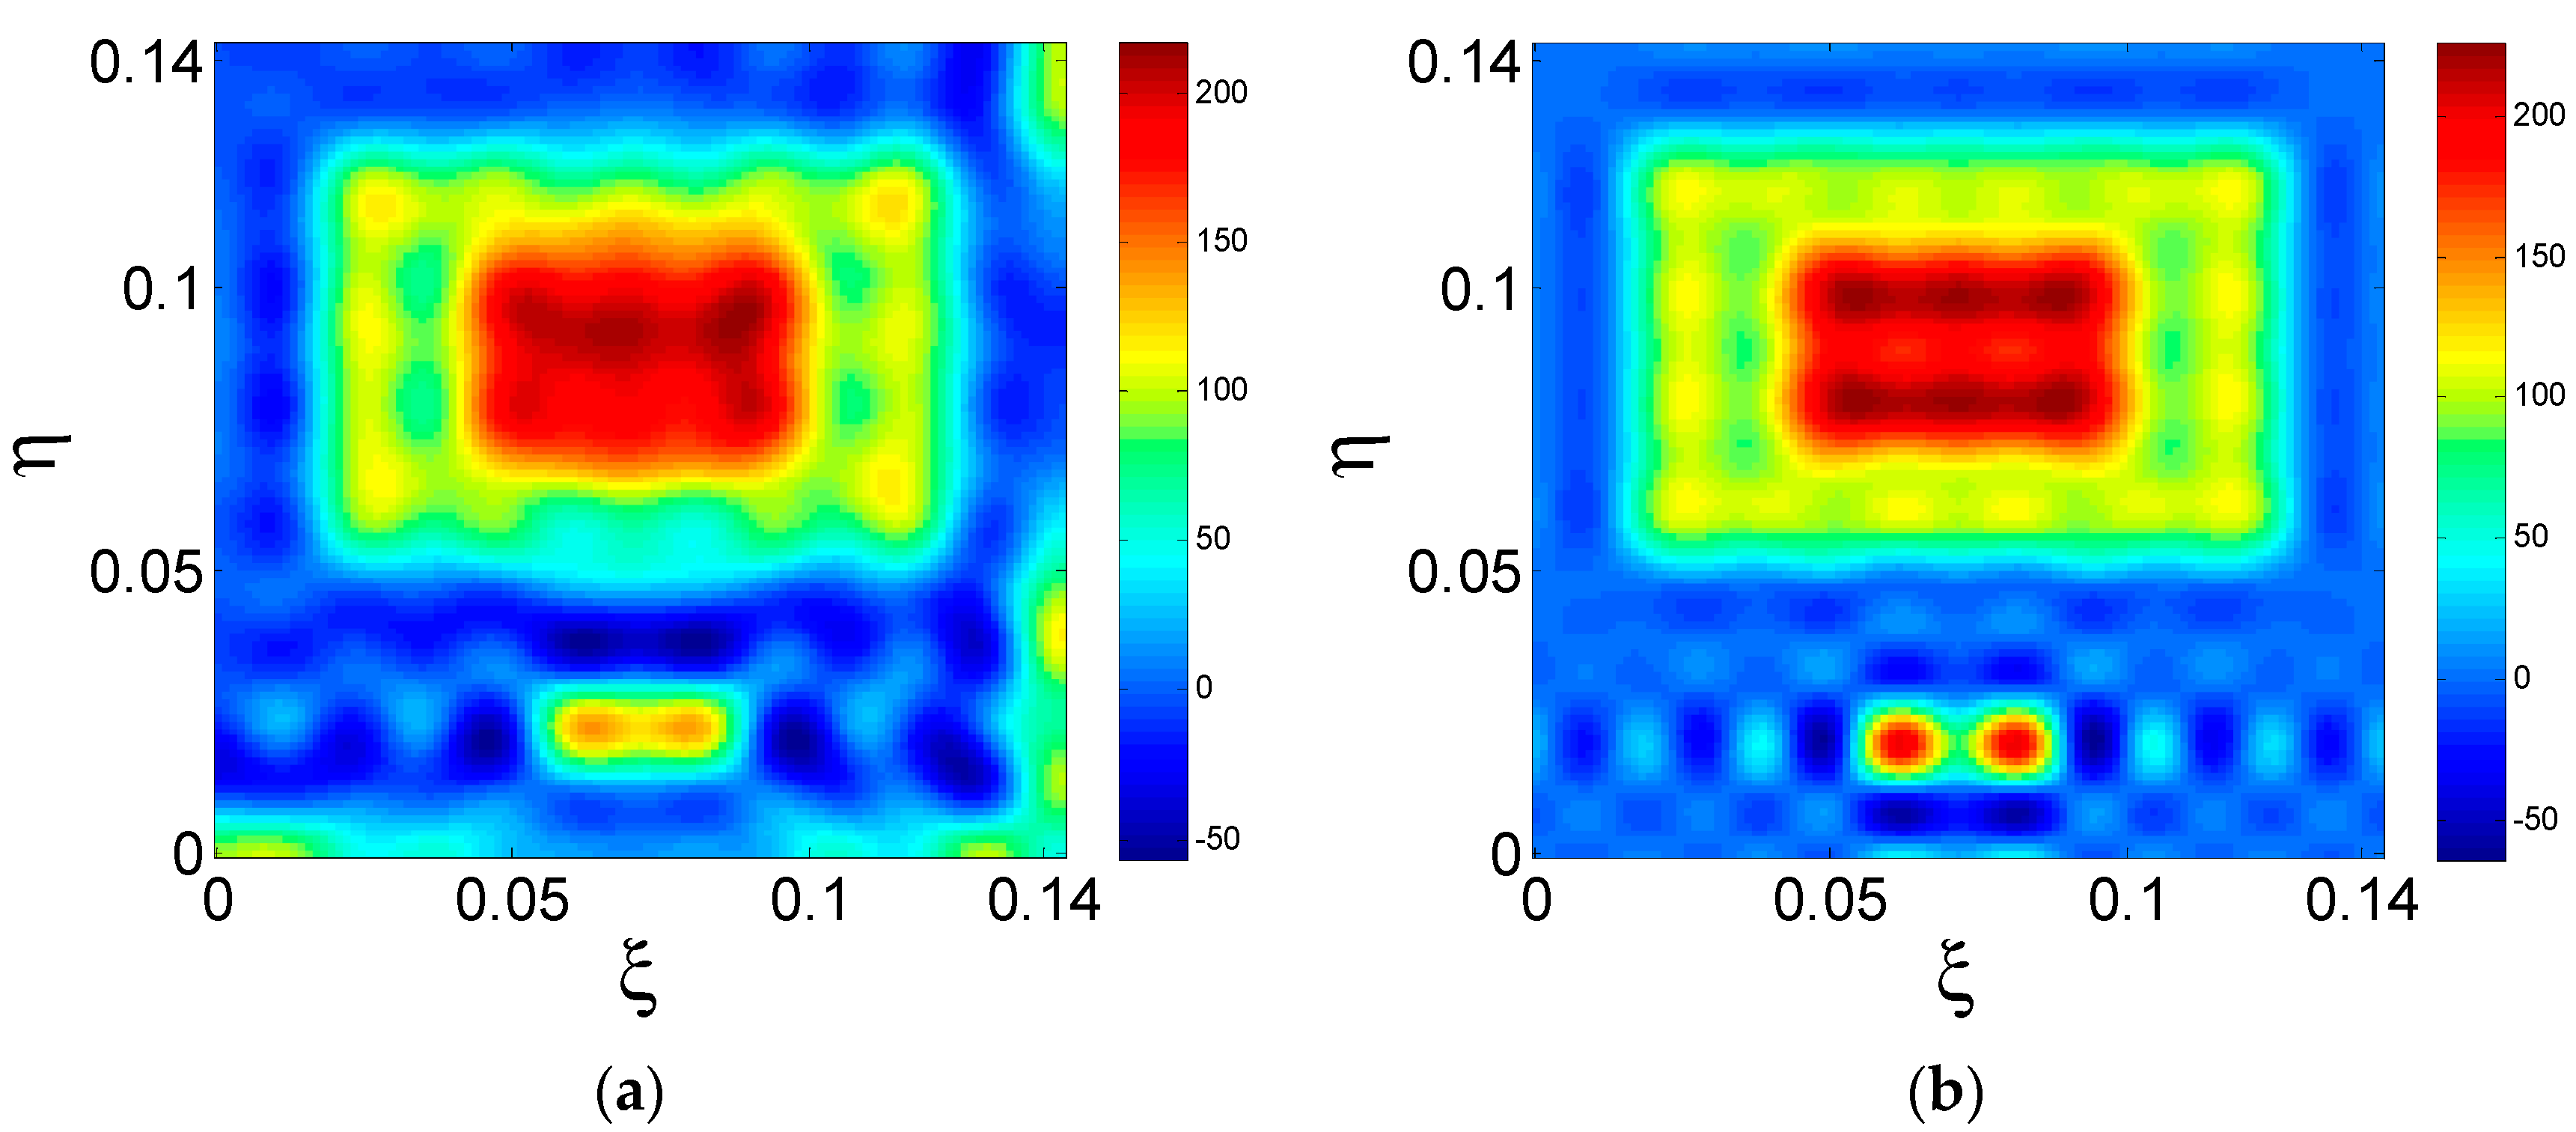
Simulations were performed to confirm the validity of the 2-D DPAs. In the test scene, four-point sources were used to test the spatial resolution, while the step extended source was used to simulate land, ocean, and cold sky. Two types of arrays, a rectangular array and an L-shaped array, were employed for comparison, as demonstrated in Figure 10a,c. The rectangular array is a 2-D MRA [15]. A test scene composed of two close point sources and extended sources was adopted in the simulations. The reconstructed images are displayed in Figure 11. Figure 11a,b present the result for a rectangular array and for an L-shaped array, both with the same antenna number of 22. The minimum spacing between antenna elements is λ.
The reconstructed BT image of the 2-D DPA is much better than that of the 2-D MRA. The two-point sources are distinguished in Figure 11b, but not in Figure 11a. With the same number of antennas, the maximum baselines corresponding to the 2-D DPA are 15 along two dimensions, and the maximum baselines corresponding to the 2-D MRA are 12 and 13 along two dimensions. The ranks are 250 and 145, respectively. Therefore, the 2-D DPA with an almost full-rank transformation matrix has a larger maximum baseline than the 2-D MRA with a rank-defificient transformation matrix, providing higher image quality and spatial resolution.
To compare the performances of the two arrays, the root-mean-square error (RMSE) of the BT is calculated as
R M S E = T r T i d a e l k
where k is the number of pixels, T r is reconstructed by solved cosine visibilities, and T i d e a l is reconstructed by ideal cosine visibilities.
The parameters of the arrays are listed in Table 6. The RMSEs of the BT images for the rectangular array and the L-shaped array are 5.3 K and 1.39 K, respectively. This result demonstrates that the L-shaped array has higher performance.

5. Conclusions

In this paper, first, the antenna arrays of 1-D MAS based on dual-polarization are presented. Then, a model based on dual-polarization is established for 2-D MAS, and a regular array called an L-shaped array is designed. Simulations are conducted to verify the DPAs. The results imply that the system with a DPA can achieve superior performance in image quality and spatial resolution, compared with the system with an MRA. Moreover, the transformation matrices of DPAs are almost full-rank column matrices. Therefore, the accuracy of the reconstructed brightness temperature image is improved.

Author Contributions

Conceptualization, H.L. and H.D.; methodology, H.L.; software, H.L.; validation, H.L., G.L. and H.D.; formal analysis, H.L.; writing—original draft preparation, H.L.; writing—review and editing, H.L., H.D. and G.L.; visualization, C.X. and Z.L.; supervision, H.L., G.L., H.D., C.X., Z.L., R.L., Y.L., Y.W., and G.S.; funding acquisition, H.D. All authors have read and agreed to the published version of the manuscript.

Funding

This work was supported in part by the Qian Xuesen Youth Innovation Fund (2020_QXSQNCXJJ-01) and in part by the Young Star of Science and Technology in Shaanxi Province (2021KJXX-68). The APC was funded by China Academy of Space Technology (Xi’an).

Conflicts of Interest

The authors declare no conflict of interest.

References

  1. Ulaby, F.; Long, D.G. Microwave Radar and Radiometric Remote Sensing; University of Michigan Press: Ann Arbor, MI, USA, 2014. [Google Scholar]
  2. Li, Y.; Liu, H.; Zhang, A. End-to-End Simulation of WCOM IMI Sea Surface Salinity Retrieval. Remote Sens. 2019, 11, 217. [Google Scholar] [CrossRef] [Green Version]
  3. Kilic, L.; Prigent, C.; Aires, F.; Heygster, G.; Pellet, V.; Jimenez, C. Ice Concentration Retrieval from the Analysis of Microwaves: A New Methodology Designed for the Copernicus Imaging Microwave Radiometer. Remote Sens. 2020, 12, 1060. [Google Scholar] [CrossRef] [Green Version]
  4. Kerr, Y.H.; Waldteufel, P.; Wigneron, J.P.; Martinuzzi, J.A.M.J.; Font, J.; Berger, M. Soil moisture retrieval from space: The Soil Moisture and Ocean Salinity (SMOS) mission. IEEE Trans. Geosci. Remote Sens. 2001, 39, 1729–1735. [Google Scholar] [CrossRef]
  5. Piepmeier, J.R.; Focardi, P.; Horgan, K.A.; Knuble, J.; Ehsan, N.; Lucey, J. SMAP L-band microwave radiometer: Instrument design and first year on orbit. IEEE Trans. Geosci. Remote Sens. 2017, 55, 1954–1966. [Google Scholar] [CrossRef] [PubMed] [Green Version]
  6. Tanner, A.B.; Wilson, W.J.; Lambrigsten, B.H.; Dinardo, S.J.S.; Brown, T.; Kangaslahti, P.P.; Gaier, T.C.; Ruf, C.S.; Gross, S.M.; Lim, B.H.; et al. Initial results of the geostationary synthetic thinned array radiometer (GeoSTAR) demonstrator instrument. IEEE Trans. Geosci. Remote Sens. 2007, 45, 1947–1957. [Google Scholar] [CrossRef]
  7. Ruf, C.S.; Swift, C.T.; Tanner, A.B.; Le Vine, D.M. Interferometric synthetic aperture radiometry for the remote sensing of the Earth. IEEE Trans. Geosci. Remote Sens. 1988, 26, 597–611. [Google Scholar] [CrossRef]
  8. Xiao, C.; Wang, X.; Dou, H.; Li, H.; Lv, R.; Wu, Y.; Song, G.; Wang, W.; Zhai, R. Non-Uniform Synthetic Aperture Radiometer Image Reconstruction Based on Deep Convolutional Neural Network. Remote Sens. 2022, 14, 2359. [Google Scholar] [CrossRef]
  9. Chen, L.; Li, Q.; Yi, G.; Zhu, Y. One-dimensional mirrored interferometric aperture synthesis: Performances, simulation, and experiments. IEEE Trans. Geosci. Remote Sens. 2013, 51, 2960–2968. [Google Scholar] [CrossRef]
  10. Xiao, C.; Li, Q.; Lei, Z.; Zhao, G.; Chen, Z.; Huang, Y. Image Reconstruction with Deep CNN for Mirrored Aperture Synthesis. IEEE Trans. Geosci. Remote Sens. 2022, 60, 5303411. [Google Scholar] [CrossRef]
  11. Lei, Z.; Dou, H.; Li, Q.; Li, H.; Chen, L.; Chen, K.; Gui, L.; Zhao, G.; Chen, Z.; Xiao, C.; et al. 2-D Mirrored Aperture Synthesis with Four Tilted Planar Reflectors. IEEE Trans. Geosci. Remote Sens. 2022, 60, 2004213. [Google Scholar] [CrossRef]
  12. Dou, H.; Gui, L.; Li, Q.; Chen, L.; Bi, X.; Wu, Y.; Lei, Z.; Li, Y.; Chen, K.; Lang, L.; et al. Initial results of microwave radiometric imaging with mirrored aperture synthesis. IEEE Trans. Geosci. Remote Sens. 2019, 57, 8105–8117. [Google Scholar] [CrossRef]
  13. Dong, J.; Li, Q.; Jin, R.; Zhu, Y.; Huang, Q.; Gui, L. A Method for Seeking Low-Redundancy Large Linear Arrays for Aperture Synthesis Microwave Radiometers. IEEE Trans. Antennas Propagat. 2010, 58, 1913–1921. [Google Scholar] [CrossRef]
  14. Dong, J.; Li, Q.; Shi, R.; Gui, L.; Guo, W. The Placement of Antenna Elements in Aperture Synthesis Microwave Radiometers for Optimum Radiometric Sensitivity. IEEE Trans. Antennas Propagat. 2011, 59, 4103–4114. [Google Scholar] [CrossRef]
  15. Camps, A.; Cardama, A.; Infantes, D. Synthesis of large low-redundancy linear arrays. IEEE Trans. Antennas Propagat. 2001, 49, 1881–1883. [Google Scholar] [CrossRef] [Green Version]
  16. Ruf, C.S. Numerical annealing of low-redundancy linear arrays. IEEE Trans. Antennas Propagat. 1993, 41, 85–90. [Google Scholar] [CrossRef]
  17. Chen, L.; Rao, Z.; Wang, Y.; Zhou, H. The Maximum Rank of the Transfer Matrix in 1-D Mirrored Interferometric Aperture Synthesis. IEEE Geosci. Remote Sens. Lett. 2017, 14, 1580–1583. [Google Scholar] [CrossRef]
  18. Dou, H.; Chen, K.; Li, Q.; Jin, R.; Wu, Y.; Lei, Z. Analysis and Correction of the Rank-Deficient Error for 2-D Mirrored Aperture Synthesis. IEEE Trans. Geosci. Remote Sens. 2021, 59, 2222–2230. [Google Scholar] [CrossRef]
  19. Yi, G.; Hu, F.; Jin, R.; Li, D.; Yang, H.; Dong, J. Array configuration design of 1-D mirrored interferometric aperture synthesis. IEEE Geosci. Remote Sens. Lett. 2012, 9, 1021–1025. [Google Scholar] [CrossRef]
  20. Dou, H.; Chen, K.; Li, Q.; Wu, Y.; Lei, Z. Maximum-Rank Arrays for Two-Dimensional Mirrored Aperture Synthesis. IEEE Geosci. Remote Sens. Lett. 2021, 18, 499–503. [Google Scholar] [CrossRef]
  21. Lei, Z.; Chen, L.; Li, Q.; Dou, H.; Chen, K. Rank-Full Arrays for 2-D Mirrored Aperture Synthesis. IEEE Geosci. Remote Sens. Lett. 2022, 19, 5003305. [Google Scholar]
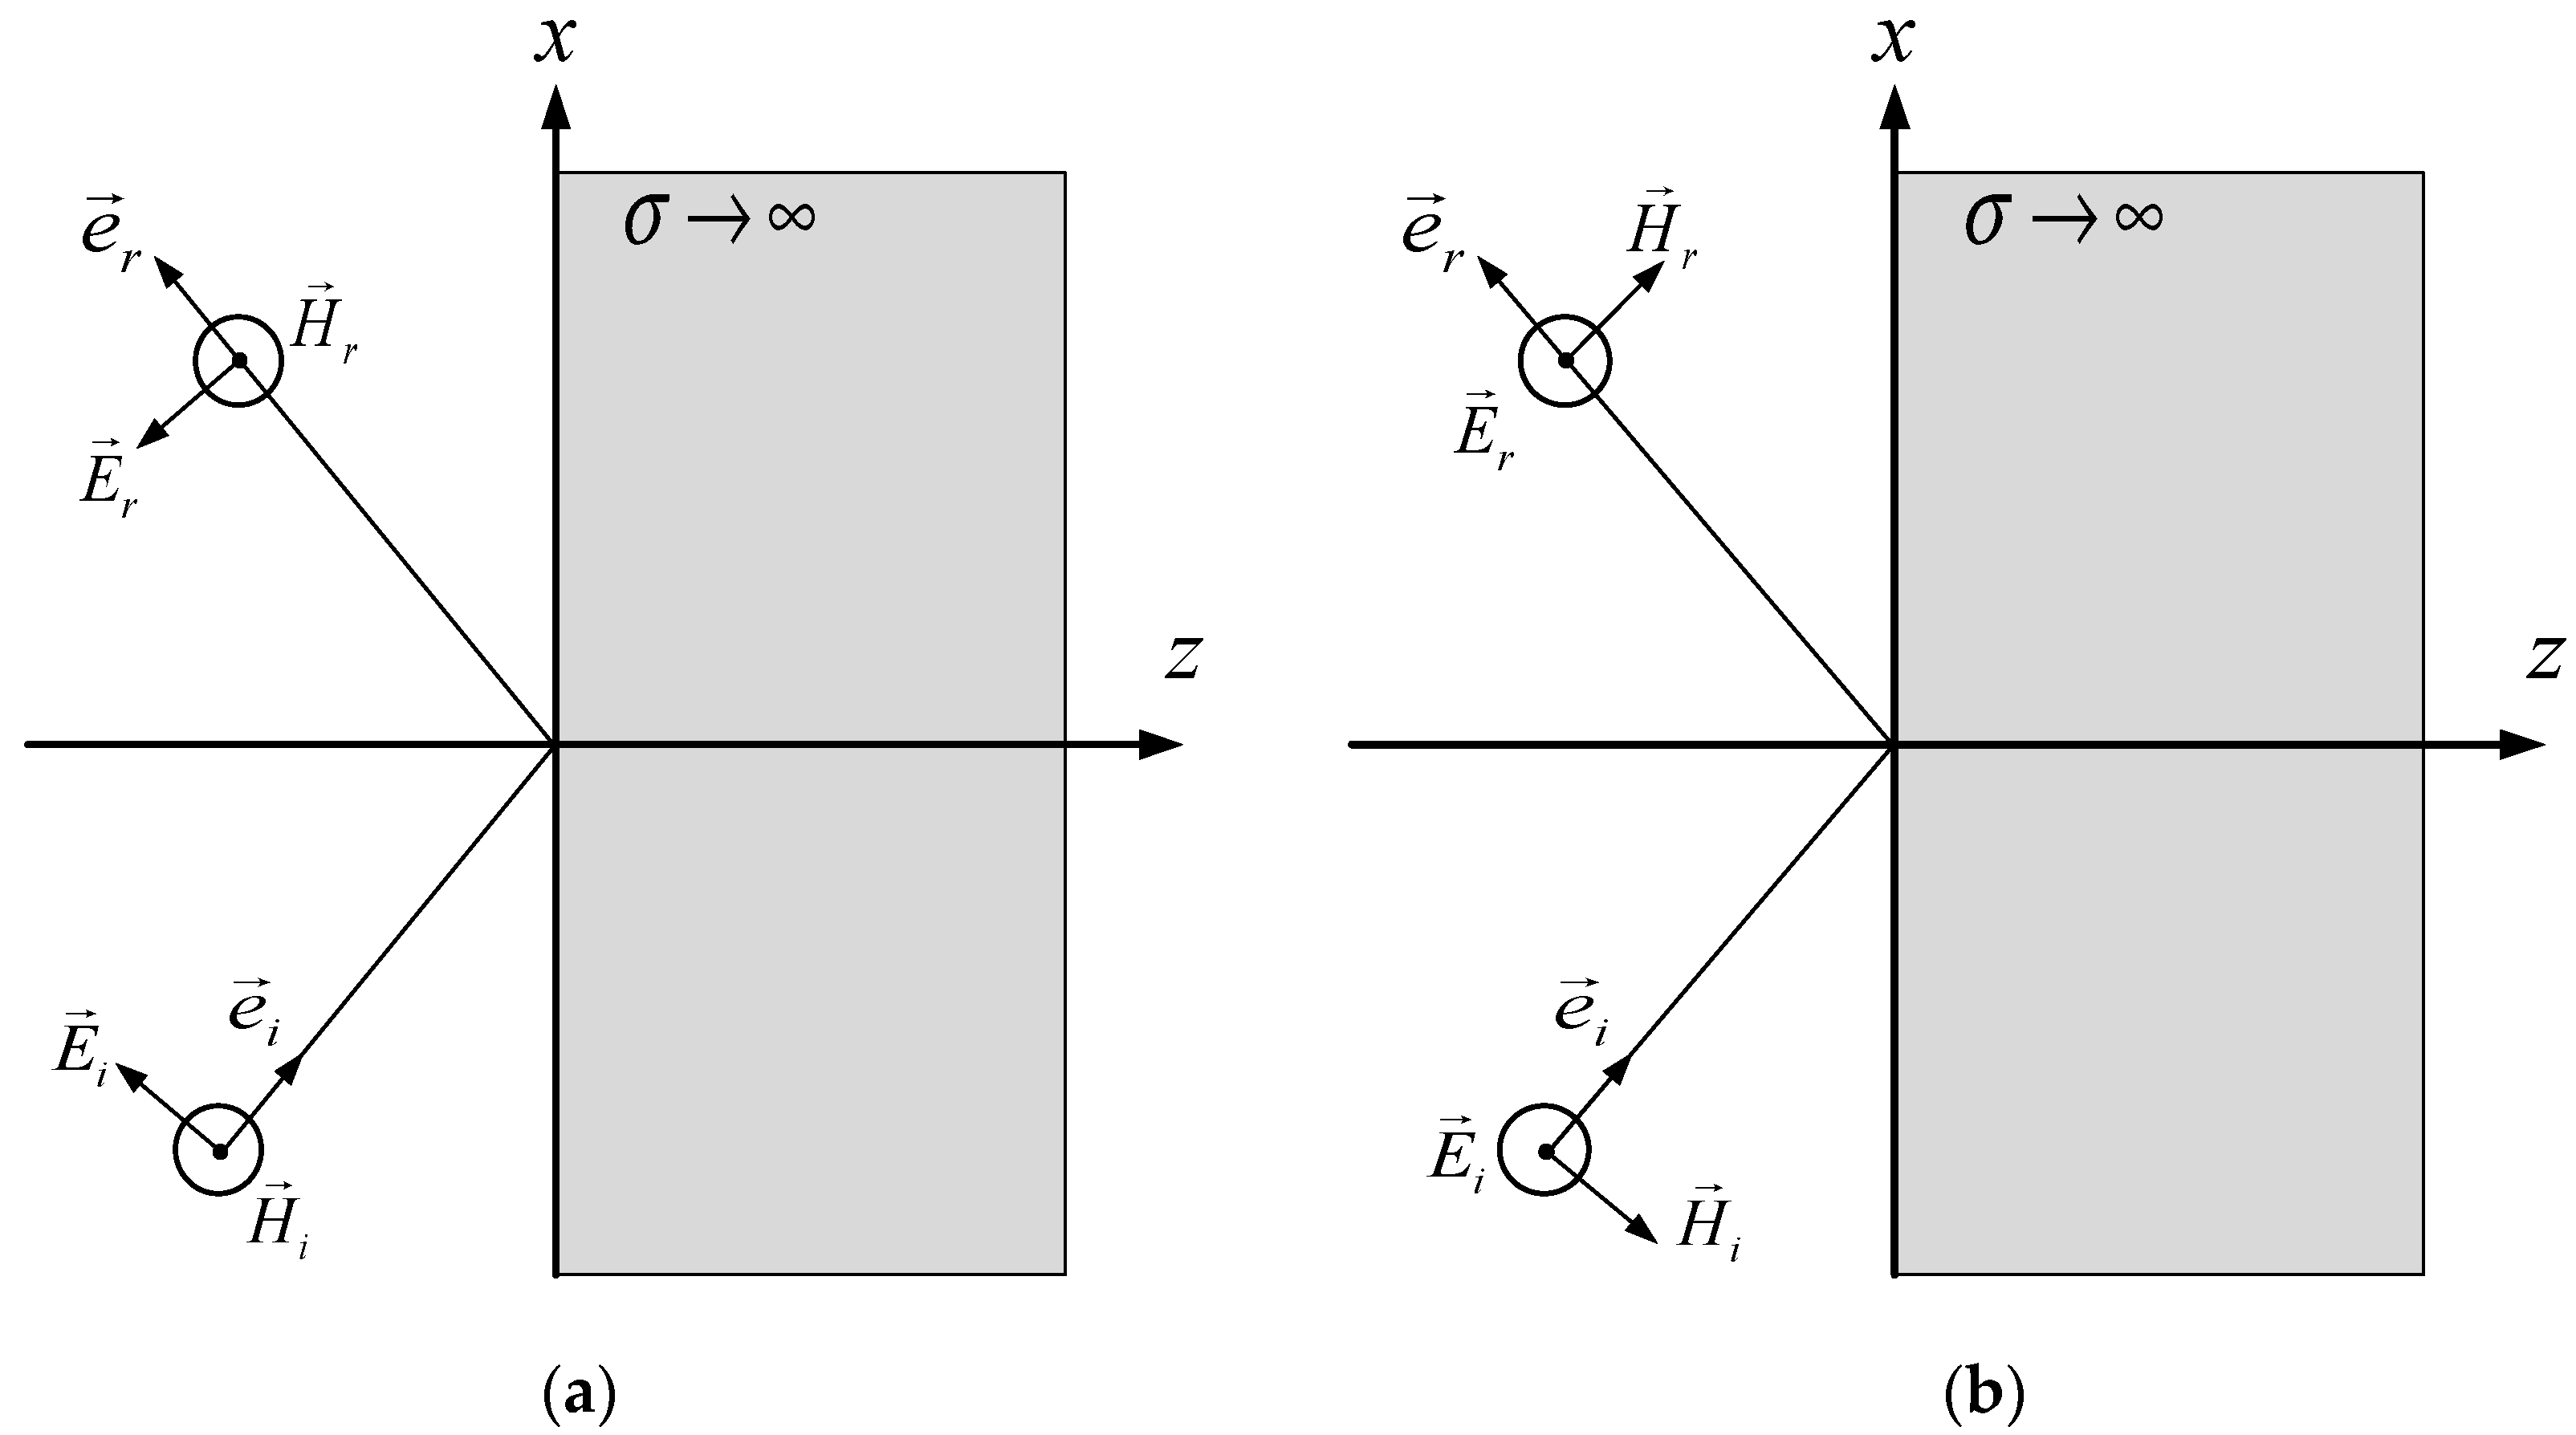
Figure 1. Oblique incidence for horizontally and vertically polarized waves. (a) The horizontally polarized wave. (b) The vertically polarized wave.
Remotesensing 15 00167 g001
Figure 2. Signal propagation of 1-D MAS.
Remotesensing 15 00167 g002
Figure 3. Signal propagation of 2-D MAS.
Remotesensing 15 00167 g003
Figure 4. Illustration of 1-D MAS.
Remotesensing 15 00167 g004
Figure 5. Simulation results for different 1-D arrays. (a) 1-D MRA. (b) 1-D DPA.
Remotesensing 15 00167 g005
Figure 6. Illustration of 2-D MAS.
Remotesensing 15 00167 g006
Figure 7. Irregular 2-D DPAs.
Remotesensing 15 00167 g007
Figure 8. Regular 2-D DPAs.
Remotesensing 15 00167 g008aRemotesensing 15 00167 g008b
Figure 9. L-shaped array.
Remotesensing 15 00167 g009
Figure 10. Two types of arrays. (a) Rectangular array. (b) UV sampling plane of rectangular array. (c) L-shaped array. (d) UV sampling plane of L-shaped array.
Remotesensing 15 00167 g010
Figure 11. Simulation results. (a) The rectangular array. (b) The L-shaped array.
Remotesensing 15 00167 g011
Table 1. Optimal array configurations for 1-D MAS.
NThe Coordinates of the Antennas
51.5 4.5 6.5 7.5 8.5
62 6 9 10 11 12
72 6 10 13 14 15 16
82.5 7.5 12.5 16.5 17.5 18.5 19.5 20.5
92.5 7.5 12.5 17.5 21.5 22.5 23.5 24.5 25.5
103 9 15 21 26 27 28 29 30 31
113.5 10.5 17.5 24.5 27.5 31.5 32.5 33.5 35.5 36.5 37.5
123.5 10.5 17.5 24.5 31.5 37.5 38.5 39.5 40.5 41.5 42.5 43.5
133.5 10.5 17.5 23.5 30.5 37.5 43.5 44.5 45.5 46.5 47.5 48.5 49.5
143.5, 10.5, 17.5, 24.5, 31.5, 38.5, 44.5, 50.5, 51.5, 52.5, 53.5, 54.5, 55.5, 56.5
Table 2. Performance comparison.
NMRADPA
Maximum BaselineRankMaximum BaselineRank
51191616
617152323
722213131
829274040
937355050
1046456161
1157557474
1264638686
1372719898
148079112112
Table 3. The Ranks of the First Case.
The size of the array3 × 33 × 43 × 53 × 6
The rank of P40556983
The size of the array4 × 34 × 44 × 54 × 6
The rank of P557391109
The size of the array5 × 35 × 45 × 55 × 6
The rank of P6991113135
The size of the array6 × 36 × 46 × 56 × 6
The rank of P83109135161
Table 4. The Ranks of the Second Case.
The size of the array2.5 × 2.52.5 × 3.52.5 × 4.52.5 × 5.5
The rank of P30425466
The size of the array3.5 × 2.53.5 × 3.53.5 × 4.53.5 × 5.5
The rank of P42587490
The size of the array4.5 × 2.54.5 × 3.54.5 × 4.54.5 × 5.5
The rank of P547494114
The size of the array5.5 × 2.55.5 × 3.55.5 × 4.55.5 × 5.5
The rank of P6690114138
Table 5. The Ranks of the Third Case.
The size of the array2.5 × 32.5 × 42.5 × 52.5 × 6
The rank of P35486072
The size of the array3.5 × 33.5 × 43.5 × 53.5 × 6
The rank of P49668298
The size of the array4.5 × 34.5 × 44.5 × 54.5 × 6
The rank of P6384104124
The size of the array5.5 × 35.5×45.5 × 55.5 × 6
The rank of P77102126150
Table 6. Parameter comparison of the arrays.
The Shape of the ArrayNRMSE (K)The Size of PThe Rank of P
Rectangular225.3231 × 178145
L-shaped221.39462 × 252250
Disclaimer/Publisher’s Note: The statements, opinions and data contained in all publications are solely those of the individual author(s) and contributor(s) and not of MDPI and/or the editor(s). MDPI and/or the editor(s) disclaim responsibility for any injury to people or property resulting from any ideas, methods, instructions or products referred to in the content.