Article

Enhanced Impact of Vegetation on Evapotranspiration in the Northern Drought-Prone Belt of China

1
Plateau Atmosphere and Environment Key Laboratory of Sichuan Province, College of Atmospheric Sciences, Chengdu University of Information Technology, Chengdu 610225, China
2
Key Laboratory of Arid Climatic Change and Disaster Reduction in Gansu Province, Key Open Laboratory of Arid Climatic Change and Disaster Reduction in CMA, Institute of Arid Meteorology, CMA, Lanzhou 730020, China
3
Hebei International Joint Research Center for Remote Sensing of Agricultural Drought Monitoring, School of Land Science and Space Planning, Hebei GEO University, Shijiazhuang 050031, China
*
Author to whom correspondence should be addressed.
Remote Sens. 2023, 15(1), 221; https://doi.org/10.3390/rs15010221
Submission received: 22 September 2022 / Revised: 24 December 2022 / Accepted: 28 December 2022 / Published: 30 December 2022

Abstract

:
Evapotranspiration (ET) is an essential component of the land–atmosphere water cycle. In this work, the trend of ET and its dominant factors during 1982 to 2011 are investigated in the northern drought-prone belt of China (NDPB) based on five datasets, including the gridded FLUXNET, using the Pearson correlation and linear regression methods. Specially, we focus on the increasing contribution of vegetation in the change of ET. During 1982–2011, summer ET significantly increased at the rate of 0.33 mm/year (p < 0.05) in the NDPB. However, similar to global-mean ET, the ET in NDPB also experienced a pronounced fluctuation during 1999 and 2002. The role of water supply differed remarkably before and after the fluctuation while the atmospheric demand maintained weak constraint on ET. Before the fluctuation (during 1982–2000), ET correlated significantly (p < 0.01) and positively with soil moisture, indicating ET was primarily limited by water supply. However, their correlation weakened remarkably after the fluctuation when soil moisture decreased to the lowest level for the past thirty years, indicating that neither moisture supply nor atmospheric demand dominated the ET during this period. In contrast, vegetation leaf area index (LAI) maintained consistent significant (p < 0.01) and positive correlation with ET before and after the fluctuation in the NDPB, and it reflected over 60% of the change in ET. Moreover, the LAI in NDPB increased by 19.6% which was more than double of the global-mean increase. The ET increase due to rising LAI offset the ET decrease due to reduction of soil moisture, and vegetation became the primary constraint on ET during 2001–2011. The expansion of vegetation may intensify the risk of drought and cause conflicting demands for water between the ecosystem and humans in the NDPB, especially in the case of weak summer monsoon.

1. Introduction

Evapotranspiration (ET), referring to the transport of water from the surface to the atmosphere, consists of canopy transpiration and soil evaporation. It is a key component of the hydrologic cycle, and closely associates with energy and carbon cycles. Consequently, ET is essential to understanding water cycle and land–atmosphere feedbacks in the Earth system, and has close interactions with weather and climate [1].
In classical hydrology, the terrestrial ET is primarily constrained by soil moisture and land surface net radiation, which correspond to two main ET regimes: the soil moisture-limited and energy limited regimes [1]. Theoretically, the conceptual framework of the two ET regimes performs well in wet or dry climate where the dominant factors for ET are relatively simple. In wet climate conditions, the influence of soil moisture is minimized due to the water being much greater than that net radiation can consume, and net radiation thus dominates the change of ET. In dry climate conditions, however, the net radiation is much larger than that needed for evaporation and transpiration, and soil moisture constrains the exchange of water vapor between the land and the atmosphere. However, soil moisture and net radiation compete for impact on ET in the transition zone between the wet and dry climate, in which the classical conceptual framework for ET regimes may not work and the change of ET is more complicated. Therefore, the dominant factors for ET and their couplings may differ significantly in transition climate from those in stable wet or dry climates. In fact, the typical transition climate zone is usually featured by a large spatial gradient of soil moisture, precipitation, and biome [2]. The ET in transition climate zone is not only affected by soil moisture and net radiation, but also significantly constrained by vegetation and other climatic and environmental conditions [3,4]. During the past decades, increase in vegetation greenness has been reported at regional and continental scales based on satellite measurements [5,6,7,8]. The greening land surface can enhance ET through canopy transpiration (e.g., [9,10]). That is because the increase in leaf area index (LAI) is expected to directly influence canopy conductance, aerodynamic properties, and the albedo of ecosystems, ultimately increasing the contribution of transpiration on the ET. However, most research on the main drivers and controls of ET has been devoted to exploring the impact of soil moisture on ET and their couplings, and the role of vegetation in the modulation of ET is often ignored or not taken seriously [1,6]. Consequently, more attention should be paid to the role of vegetation in ET, especially in the climate transition zones where the change in ET is more complicated and is not well understood.
The northern drought-prone belt of China (NDPB), located in the northern China, is a typical transition climate zone between the dry and wet climates (Figure 1). The NDPB, though narrow in space extent, is an ideal and critical natural experimental area for exploring regional climate changes and regional response to global changes due to its multiple roles, and it thus has been the research hotspot in recent years [2,11,12,13,14,15]. It is featured by a large gradient of soil moisture, precipitation, temperature, and biome. Its precipitation is highly dependent on the summer monsoon and has obvious temporal variability. Therefore, vegetation and other climatic and environmental conditions may exert significant influence on the ET in NDPB. With global warming, vegetation has observed an increasing trend at global scale. In addition, the afforestation programs launched since 1978 in China may also accelerate the greenness in NDPB [1,2]. However, on the other hand, the NDPB is faced with a rising threat of drought (e.g., [3,4]). In this work, we sought to answer two specific questions: (i) how does the ET change under the rising threat of drought in the NDPB? and (ii) what is the role of vegetation played in ET in the NDPB? To answer the two questions, we investigate the trend of ET and its dominant factors in NDPB during 1982 to 2011 based on five datasets including the grided FLUXNET dataset [16], which helps understand the drought and its trend in NDPB. Specially, we focus on the increasing contribution of vegetation in the change of ET.

2. Methodology

In this work, multiple datasets and methods are used. The details of data used, the approach to infer the primary ET regime, and study area are presented as follows.

2.1. Data

There are five datasets applied in this work, including the FLUXNET-based gridded ET [5], the ET simulation from Global Land Data Assimilation System (GLDAS, [6]), the NOAA Climate Data Record (CDR) of AVHRR Leaf Area Index (LAI, [7]), the European Centre for Medium-Range Weather Forecasts Interim Re-Analysis (ECMWF, ERA-Interim, [8]) soil moisture, and the Climatic Research Unit Timeseries (CRU TS) dataset [9]. All the datasets are global and cover a same period of 1982–2011, although they may have different spatial resolutions. The resolution needs to be unified when the comparison or correlation analysis is performed.
The FLUXNET-based ET is derived from continuous in situ measurements of FLUXNET, remote sensing, and meteorological observations based on model tree ensembles [5]. The dataset covers a period of 30 years (1982–2011) at 0.5° × 0.5° spatial and monthly temporal resolution. Cross-validation analyses show that ET performs well in representing among-site flux variability and seasonal patterns [5]. Moreover, the FLUXNET-based ET is evaluated by multiple in situ observations in NDPB and China, and it shows good agreement with observations [10,11]. Therefore, the FLUXNET-based dataset has been proven to be a good and reliable estimate of ET.
The Global Land Data Assimilation System (GLDAS) is a global terrestrial modelling system that ingests satellite- and ground-based observations to drive and constrain offline simulations from a suite of advanced land surface models [6]. GLDAS drives four LSMs: Common Land Model (CLM) version 2.0 [12], Noah version 2.7 [13], Variable Infiltration Capacity (VIC) model version 4.04 [14], and Mosaic [15]. The GLDAS ET, calculated from simulated latent heat flux, is provided at 1° (for all LSMs) spatial resolution, monthly temporal resolution at global scale. In this study, the monthly ET from Mosaic, CLM, and Noah is used, because the VIC currently only runs in water balance mode and does not provide surface ET product.
The NOAA CDR of AVHRR [7] contains gridded daily LAI derived from the NOAA AVHRR Surface Reflectance product. It provides a measurement of surface vegetation coverage, gridded at a spatial resolution of 0.05° and with a time span from 1982 to present. This dataset is one of the Land Surface CDR Version 4 products produced by the NASA Goddard Space Flight Center (GSFC) and the University of Maryland (UMD). To match the monthly temporal resolution and time span of ET, the daily LAI is averaged to monthly LAI and only the LAI in 1982–2011 period is used. Notably, the LAI is treated to the same spatial resolution as the FLUXNET-based ET dataset according to the latitude and longitude of grids, that is, picking the same grids as those of FLUXNET-based ET.
The ERA-Interim is a reanalysis of the global atmosphere, covering from 1979 to 2019 [8]. The product has improved the representation of the hydrological cycle, the quality of the stratospheric circulation, the treatment of biases and changes in the observing system, and other key aspects of ERA-40 [16]. The soil moisture data from ERA-Interim are provided at four depths (0–7, 7–28, 28–100, and 100–289 cm). This study used the monthly first-layer soil moisture at 0.5° × 0.5° spatial resolution, which is the volume of water at the depth of 7 cm. The ERA-Interim soil moisture has good performance in reproducing observed spatial and temporal characteristics [17]. On the regional scale, ERA-Interim also agrees well with observations in the interannual variations [18]. Notably, in the transition climate zone, ERA-Interim soil moisture is comparable to the retrievals from remote sensing in reproducing annual variations in the surface soil layer [19].
The CRU TS dataset, based on analysis of over 4000 individual weather station records, spans the period January 1901 to December 2016 at 0.5° × 0.5° spatial resolution and on monthly scale [9]. Harris et al. [9] compared the precipitation data from CRU to that from the Global Precipitation Climatology Center (GPCC) dataset, and found close agreement for precipitation was demonstrated between CRU and the GPCC dataset in many sub-continental regions. The CRU dataset has been used for drought assessments [20], climate change assessments [21,22], and climate trend [23]. In this work, the monthly precipitation and temperature from version CRU TS 4.01 is used to infer the ET regimes in China. The potential ET (PET) is also applied to investigate the dominant factors of ET.
These datasets have undergone preliminary quality control processing, and thus no more quality control except exclusion of invalid or unreasonable values is performed. During the data processing, average operation is applied to obtain summer average and regional average. The summer average refers to the mean of June, July, and August, and the regional mean is calculated by averaging all the points within NDPB which are determined by the latitude and longitude of grids. The calculated regional-mean summer ET is used for trend or correlation analysis. The correlation analysis is based on the Pearson correlation method and Student’s t test. The trend analysis is based on the linear regression and F-test.

2.2. Inferring ET Regimes in China

In order to evaluate the role of soil moisture and land surface net radiation in ET, we inferred the primary ET regimes in China by comparing the correlations between the growing-season averages of ET and growing-season averages of temperature and precipitation, following with Seneviratne et al. [24]. Here, the land surface 2 m air temperature servers as an indicator for atmospheric demand because temperature, net radiation, and vapor pressure deficit (VPD) are closely correlated [25]. The correlation between ET and precipitation (ρ(ET, P)) and the correlation between ET and temperature (ρ(ET, T)) are computed respectively, and then compared. The supply-limited ET regime refers to regions where ρ(ET, P) > ρ(ET, T) and demand-limited regime refers to regions where ρ(ET, P) < ρ(ET, T).

2.3. Study Area: The NDPB

The northern drought-prone belt of China (NDPB), located in the northern China, is a typical transition climate zone between the dry and wet climates (Figure 1). It spatially overlaps with the East Asian summer monsoon transition zone between the East Asian summer monsoon system and mid-latitude westerlies [26,27], and the ecological transition zone from southeast broad-leaved deciduous forest to northwest desert grassland [28]. The NDPB is thus featured by a large gradient of soil moisture, precipitation and biome. Its annual precipitation ranges roughly from 200 to 600 mm/y which is at the threshold for ecosystem and agriculture maintenance and development [29]. Moreover, precipitation in NDPB is highly dependent on the summer monsoon. The summer monsoon contributes most of the annual precipitation in the NDPB and exerts significant influences on the climate and ecosystem in this region [30]. These make the NDPB very sensitive to the changes in summer monsoon climates. Its precipitation thus has obvious temporal variability, which causes a high risk of drought events in this region. Moreover, the NDPB is more sensitive to global warming and has a faster warming rate relative other regions in China during the past 100 years [31]. Therefore, as presented in Figure 2, the NDPB is faced with a rising threat of drought, and its drying trends are the most significant in China in terms of precipitation, soil moisture, and drought frequency as a result of global warming, which leads to the intensification of the hydrological cycle (e.g., [3,4]). It is reported that the average annual drought days in NDPB exceeds 40 or even 60 days [32].

3. Results

3.1. Increase of ET in the NDPB

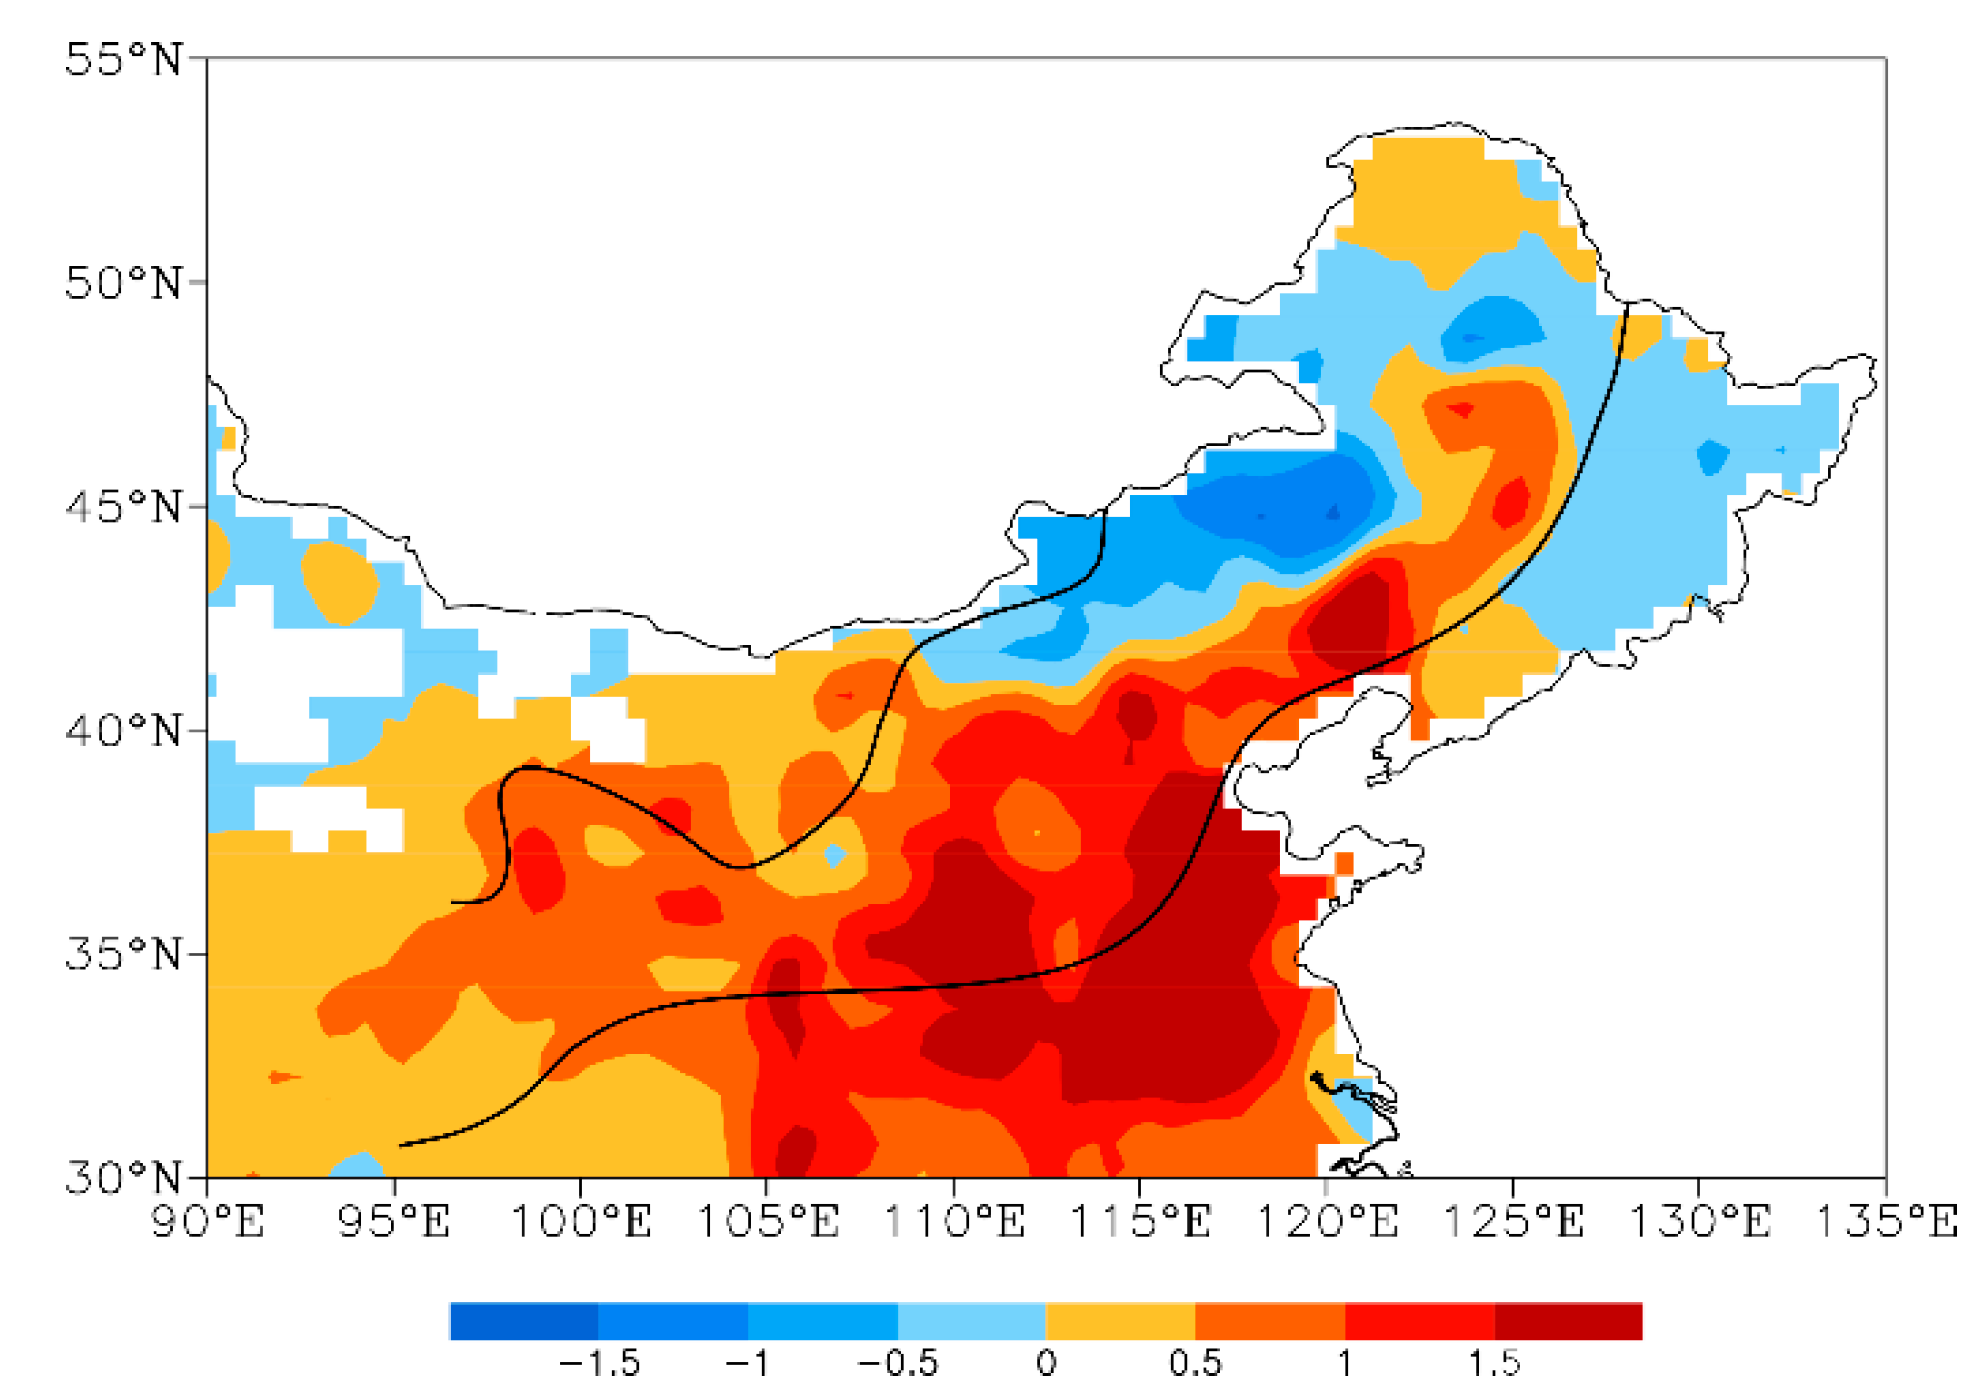
During 1982–2011, most of NDPB showed a positive trend of summer ET except the northeast (Figure 3), which resulted in a significant increase (p < 0.05) of regional-mean ET at the rate of 0.33 mm/year (Figure 4a). However, similar to global ET, the ET of NDPB experienced a pronounced fluctuation during 1999 and 2002, which matches in time with the strong El Niño event in 1998 [35]. This fluctuation divides the ET timeseries into two periods. In the first period (1982–2000), the summer ET in NDPB was observed to increase at the rate of 0.84 mm/year. However, the rising trend of ET ceased at the end of the first period and it returned to rapid increase at the rate of 3.69 mm/year during the second period, which is inconsistent with the substantial decline of global ET since the fluctuation due to the decrease in soil moisture reported by Jung et al. [35]. In NDPB, the ET increased with increasing soil moisture during 1982–2000, but they varied out of step in 2000–2011 with the ET increasing with decreasing soil moisture (Figure 4a). The difference in the relationship between ET and soil moisture before and after the fluctuation is more intuitively presented on an interdecadal scale (Figure 4b).

3.2. Increase of Vegetation in the NDPB

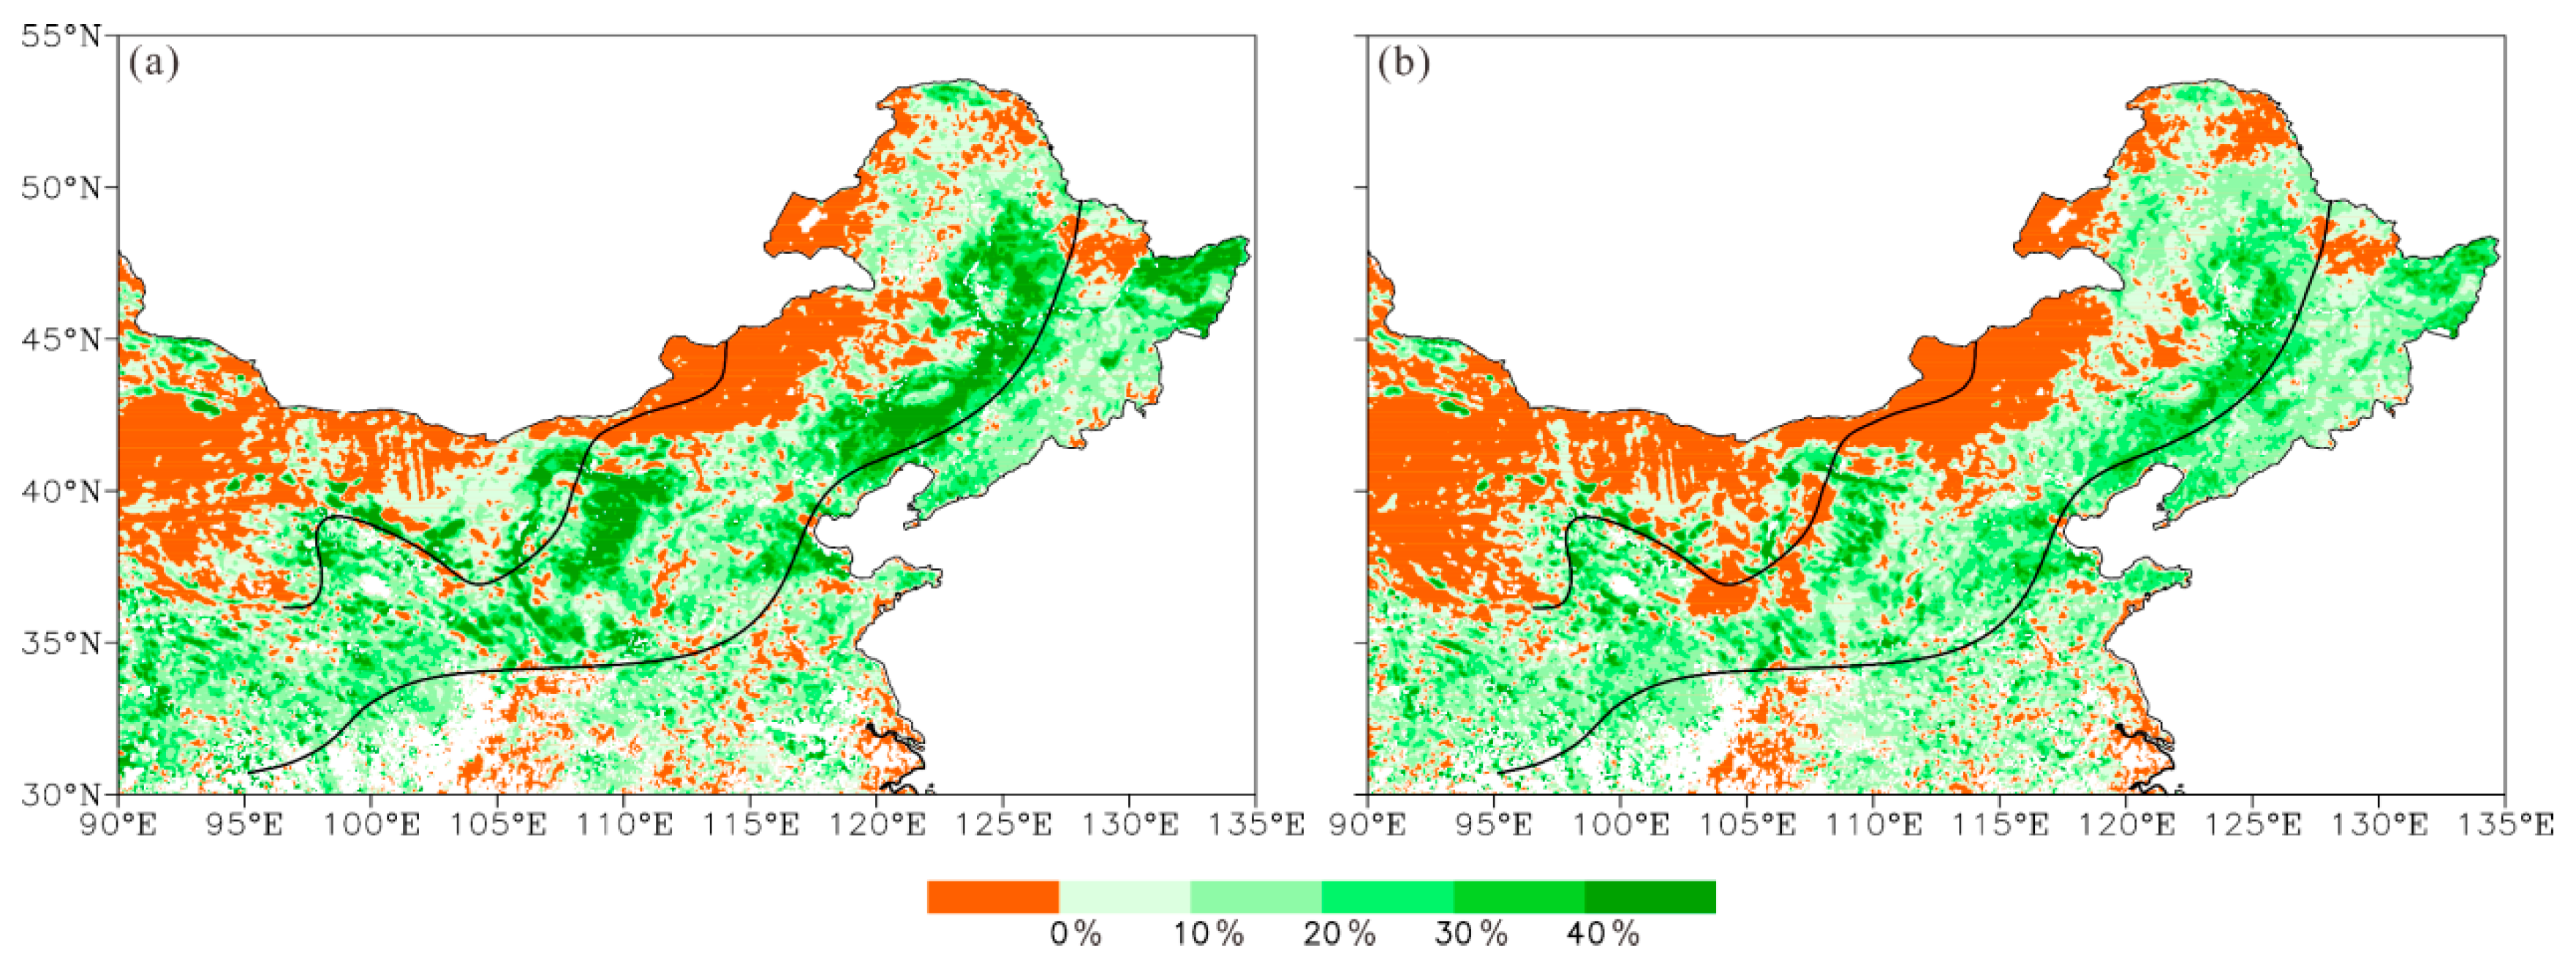
The NDPB experienced significant increase in LAI except the northeast during 1982–2011. As shown in Figure 5, 75.6% of the land surface of NDPB became greener during 2001–2011 than 1982–1990, and 74.0% land area was greener than 1991–2000. About 60% of the greening land surface increased by more than 10% in LAI, and about 40% has increased by more than 20% (Figure 6). On a regional scale, the regional average LAI increased by 19.6% and 16.2% in NDPB during 2001–2011 relative to 1982–1990 and 1991–2000, respectively.

4. Discussion

4.1. The Influence of Moisture Supply and Atmospheric Demand on ET

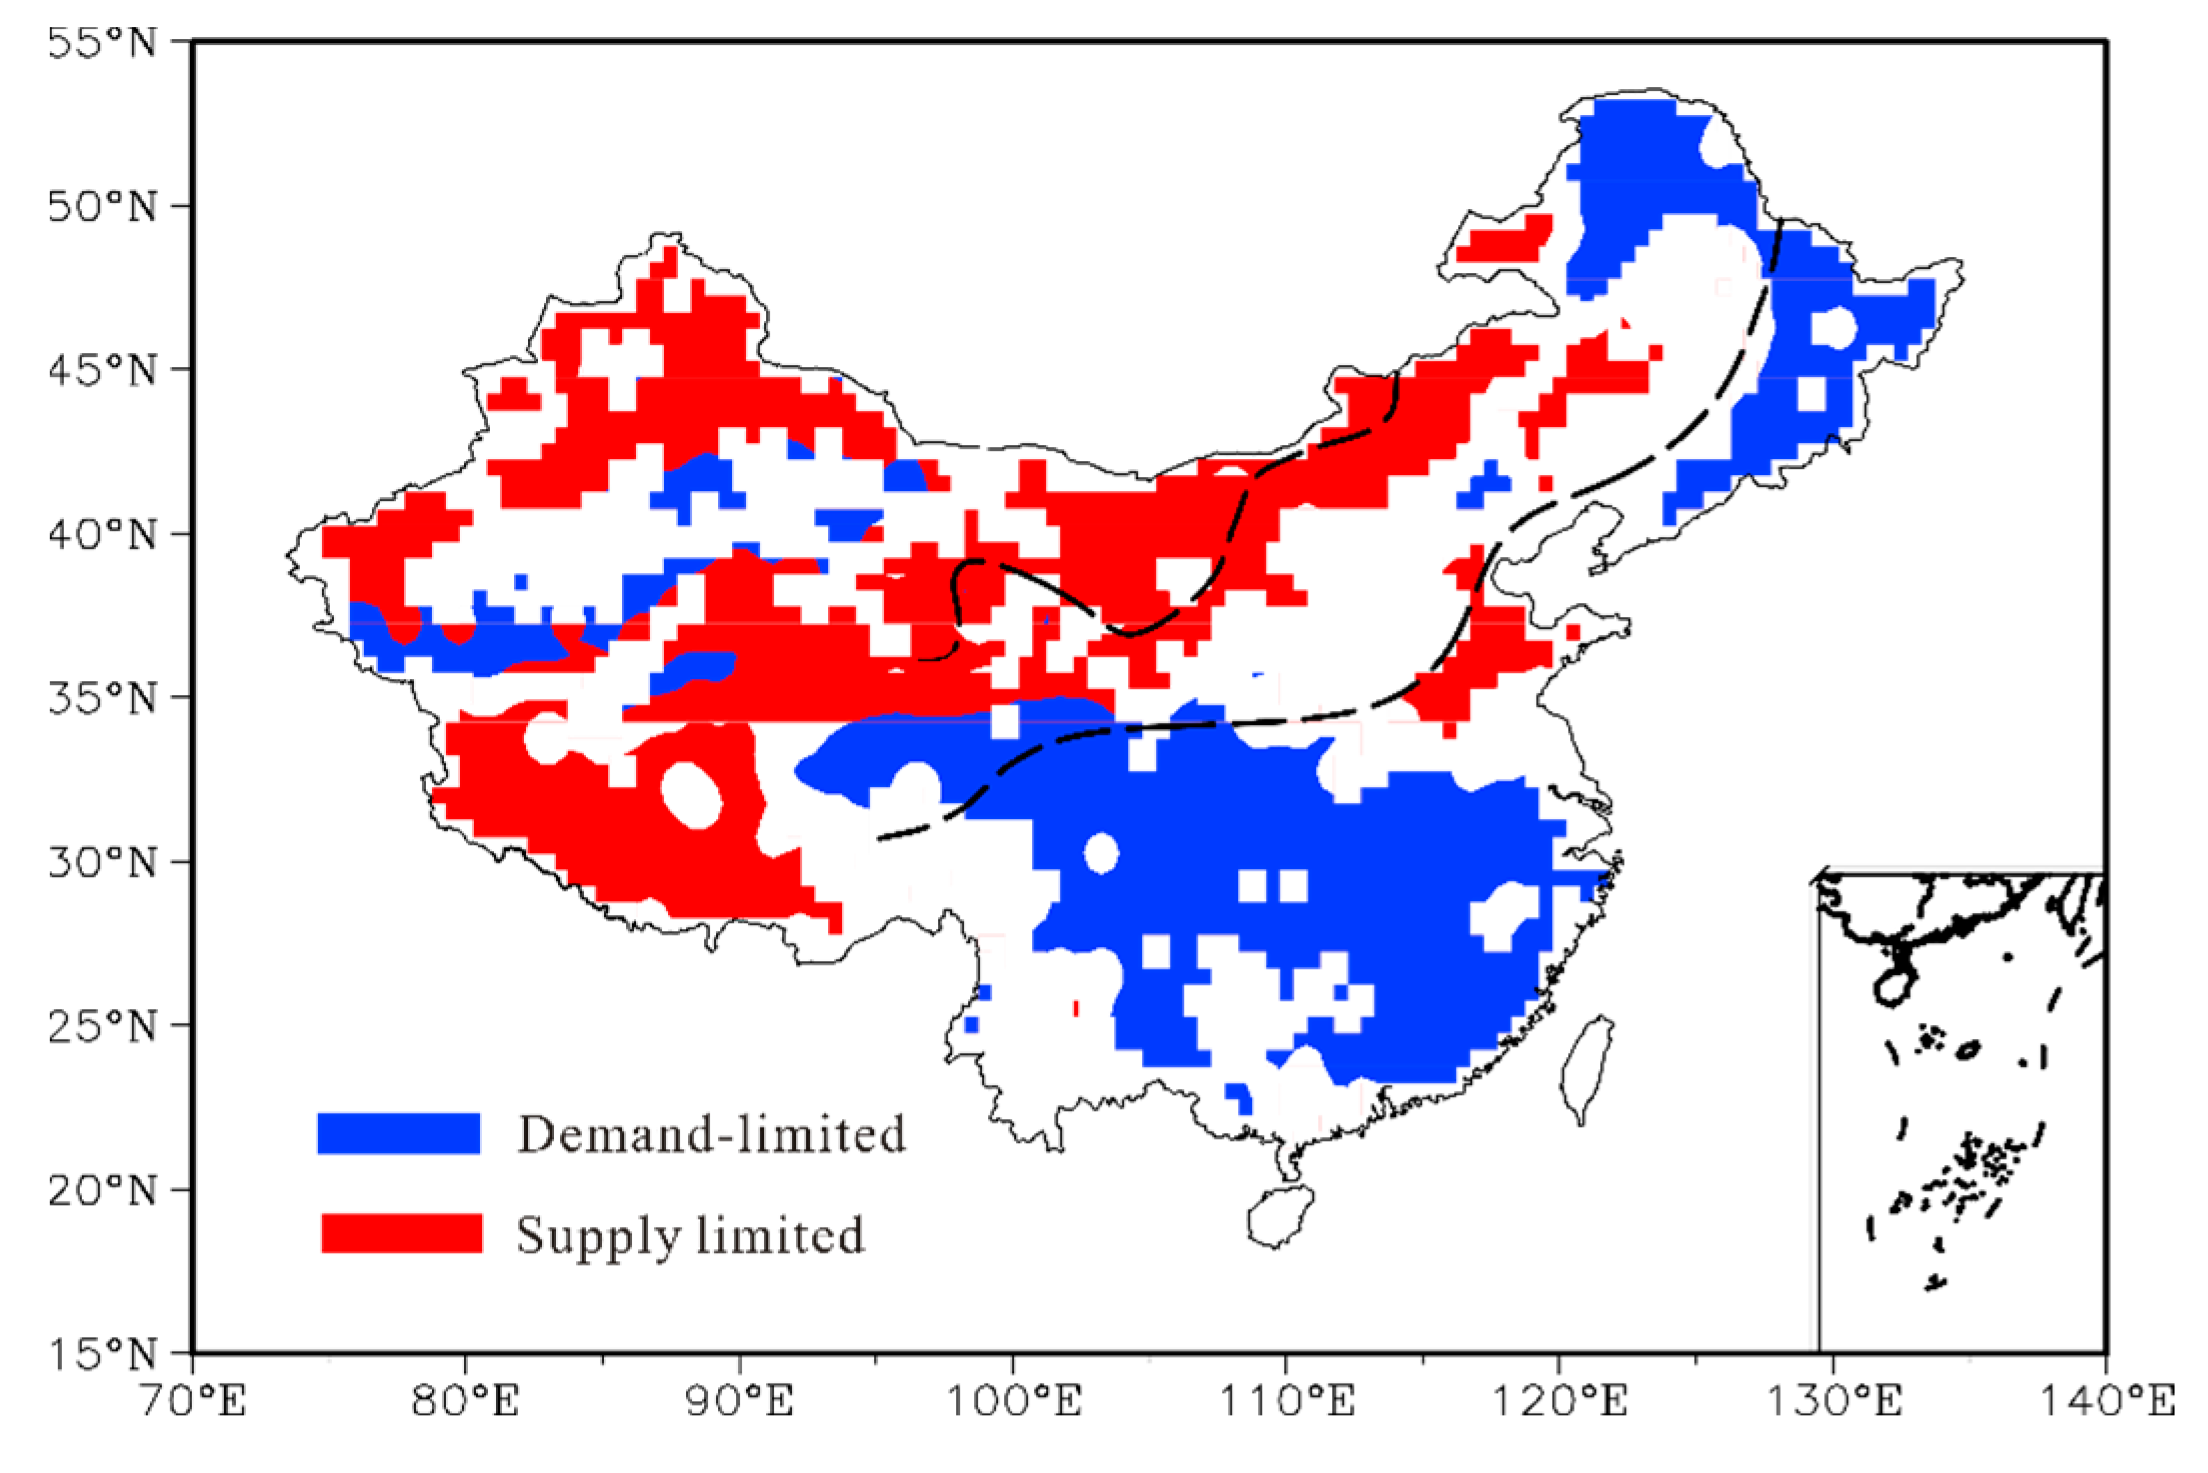
As presented in Figure 4, the increasing ET is in accord with previous reports on the acceleration of the hydrological cycle with global warming [36]. However, we find ET increases with decreasing soil moisture after the fluctuation (that is, during 2001–2011), and Jung et al. [35] attributed it to that the ET in NDPB is primarily demand-limited. In classical hydrology, ET is constrained by soil moisture (water supply) and radiation (water demand), and there are two ET regimes including the demand-limited and supply-limited regimes [24]. In the demand-limited regime, ET is sensitive to the atmospheric demand which is associated with radiation or vapor deficiency. In contrast, ET is constrained by soil moisture supply under water-stressed condition in supply-limited regime. To investigate the main drivers and control of ET, we infer the primary limitation for ET in China by comparing the correlation between LE and precipitation and the correlation between LE and temperature following Seneviratne et al. [24]. Figure 7 presents the spatial pattern of ET regimes in China. For regions to the north of NDPB, ET is primarily supply-limited, and ET is demand-limited to the south of NDPB. However, neither of the two regimes dominates in NDPB. In fact, it seems that NDPB servers as the transition zone between the supply-limited regime and the demand-limited regime, which is consistent with its roles as East Asian summer monsoon transition zone and ecological transition zone. This implies the complexity and uniqueness of the change in ET in NDPB, which is partly associated with the special climatic conditions in NDPB. As the transition zone between the East Asian summer monsoon and mid-latitude westerlies, the NDPB is affected by two air masses that have strong contrast in the wetness and temperature. Regionally, its soil moisture is significantly (p < 0.01) correlated with the summer monsoon intensity and monsoonal precipitation (Figure 8), with correlation coefficients of 0.65 and 0.88, respectively. In the case of weak summer monsoon, the NDPB is primarily controlled by mid-latitude westerlies and there are negative biases in precipitation and soil moisture. ET in NDPB thus tends to be supply-limited. In contrast, precipitation and soil moisture have positive biases during strong summer monsoon and ET is under demand-limited regime.
We further investigate the relations between ET and moisture supply and atmospheric demand (assessed by potential ET, PET) on regional scale. As shown by Figure 9a, ET in NDPB correlates significantly (p < 0.01) and positively with moisture supply during 1982–2000, but their correlation remarkably weakens during 2001–2011. A similar contrast is also observed in the correlation between ET and PET before and after the fluctuation, although the correlation between ET and PET is weaker than that between ET and moisture supply (Figure 9b). In contrast, the correlation between PET and moisture supply remains before and after the fluctuation (Figure 9c), and they are significantly and negatively correlated (p < 0.01). This suggests that the ET of NDPB is a supply-limited regime before the fluctuation, but neither moisture supply nor atmospheric demand dominates the ET since then. Consequently, it seems the moisture supply and atmospheric demand are not the primary causes for increasing ET with decreasing soil moisture after the fluctuation.

4.2. The Influence of Vegetation on ET

Most research on the main drivers and controls of ET has been devoted to exploring the effects of moisture supply and atmospheric demand on terrestrial ET (e.g., [1,24]). However, as shown above, moisture supply and atmospheric demand are not the primary drivers of ET in the NDPB, and neither of them can support the rising trend of ET during 2001–2011. This implies that there are other mechanisms that dominate the change in ET with decreasing soil moisture. Since the NDPB is a typical transition climate zone, its ET may be significantly constrained by vegetation and other climatic and environmental conditions [3,4]. Changes in vegetation are expected to influence canopy conductance and surface aerodynamic properties and albedo, which ultimately affect the ET and energy fluxes [37]. Therefore, we investigate the role of vegetation in the change of ET in NDPB.
The vegetation in NDPB includes primarily grassland and farmland and partly woodland [29]. Vegetation in the east of NDPB varies from grassland to woodland to a mix of farmland with partly grassland. For the rest of NDPB, vegetation also presents a general transition from grassland to farmland. There are a vast number of reports about the increase of vegetation greenness on the regional or continental scale [1,38,39,40]. Similar to these regions, the NDPB has also experienced significant increase in LAI during 1982–2011 (Figure 5 and Figure 6). On the regional scale, the LAI increases by as much as 19.6% in NDPB during 2001–2011 relative to 1982–1990, which is more than double the global-mean increase of 8% [41]. The rising trend of LAI with decreasing soil moisture probably associates with the warmer temperature and CO2 fertilization [42,43]. In addition, the afforestation programs launched since 1978 in China also accelerates the greenness in NDPB, including the ‘Three North’ Shelterbelt Development Program, the Beijing-Tianjin Sand Source Control Program, the Nature Forest Conservation Program, and the Grain to Green Program [1,2]. These programs conserve and expand the natural forests by planting trees, especially in the NDPB, aiming to mitigate land degradation and air pollution.
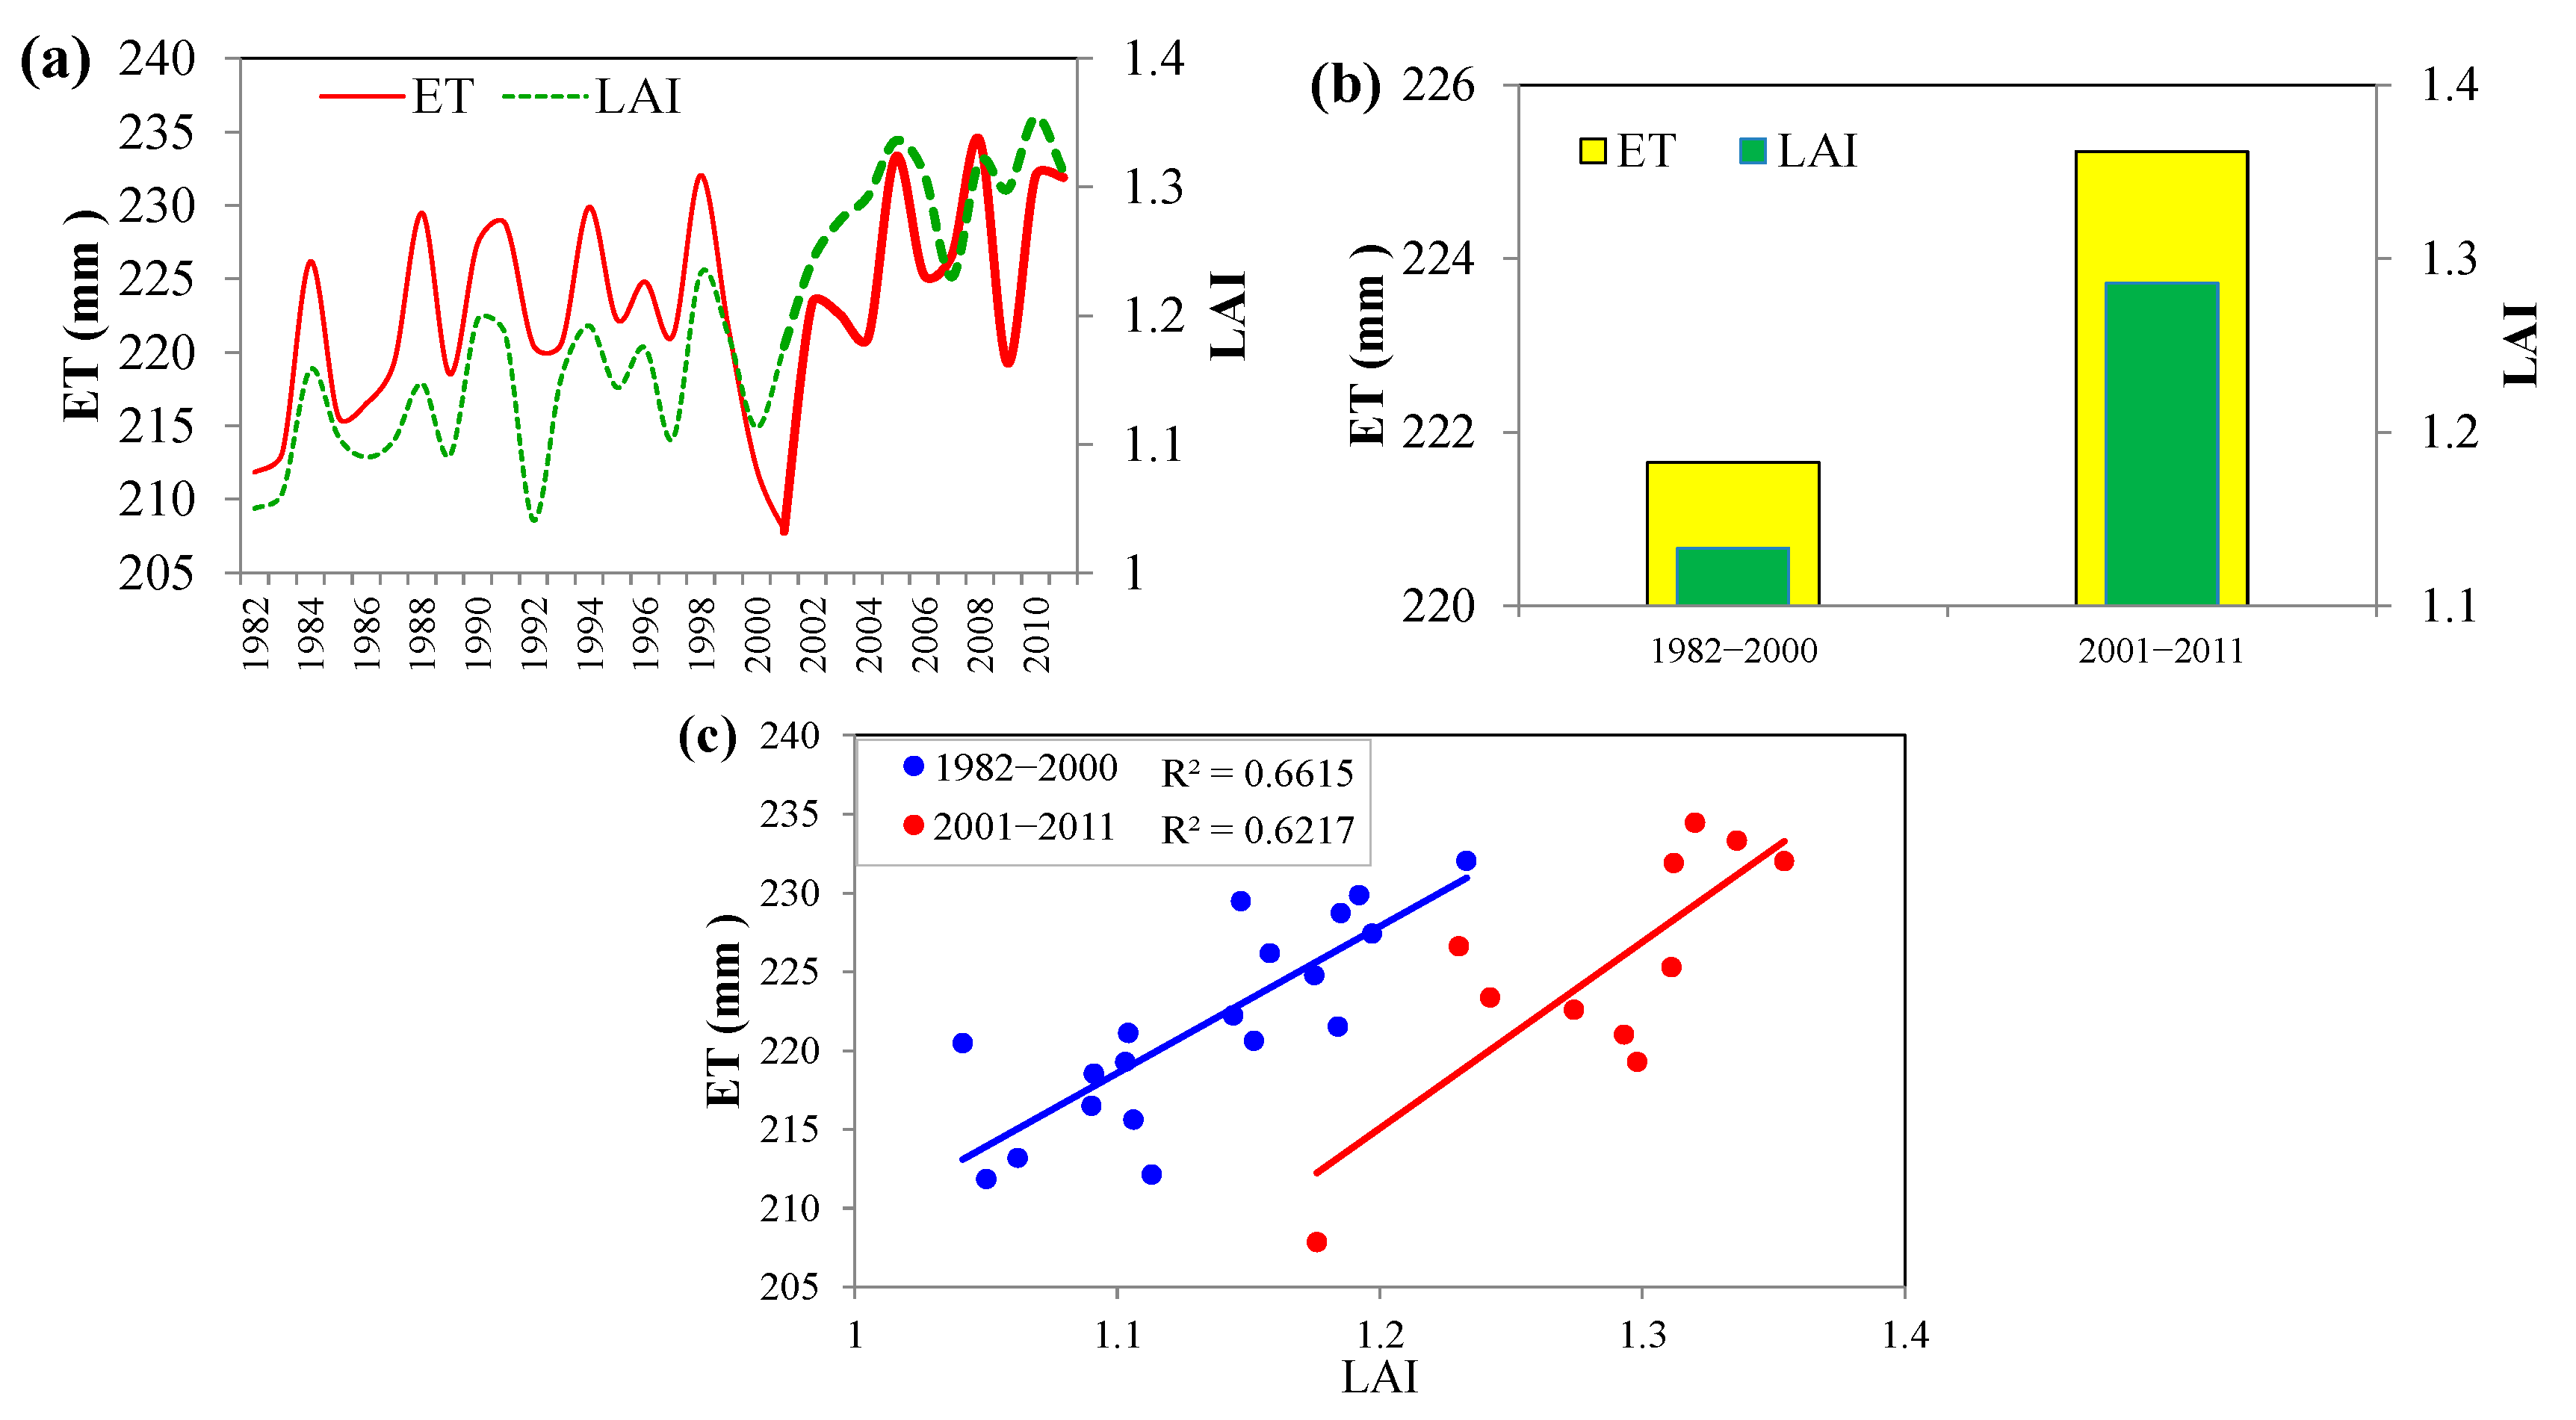
The remarkable increase in LAI has significant influence on the ET in NDPB. As shown in Figure 10, LAI is observed a positive trend over 72.5% of the NDPB, and about 87.3% of the increasing LAI is accompanied with an upward trend of ET, indicating the growth in vegetation may result in the increase of ET. On a regional scale, the interannual variations of summer LAI and ET are highly matched, especially the rising trends after the fluctuation of ET (that is, during 2001–2011) (Figure 11a). Moreover, their close linear correlation remains before and after the fluctuation of ET, although their linear relationship is different. We analyze the linear regressions between LAI and ET before and after the fluctuation, respectively. As presented by Figure 11c, LAI significantly (p < 0.05) and positively correlates with ET during both periods and their two linear fitting lines have similar slopes. However, their intercepts are different, and the intercept is larger before the fluctuation than after. This reflects the influence of soil moisture content on the relation between LAI and ET because higher soil moisture content is conducive to greater ET, that is, larger intercept. On a decadal scale, similar consistency between LAI and ET is also observed (Figure 11b). Consequently, LAI is closely related to the ET in NDPB, and is probably the primary cause for the increase in ET during 2001–2011. Before the fluctuation, LAI and soil moisture had consistent positive influence on ET and ET increases with soil moisture and LAI (Figure 9 and Figure 10c), although LAI might exert weaker influence on ET due to its low value (Figure 11b). However, their impacts on ET become opposite after the fluctuation, which was presented by the negative correlation between soil moisture and ET and the positive correlation between LAI and ET. Moreover, it seems the positive effect of increasing LAI completely offsets the negative influence of decreasing soil moisture, resulting an increase in ET. Therefore, vegetation has strong influence on the change of ET in NDPB, and it plays an increasingly important role in ET with increasing and larger LAI.
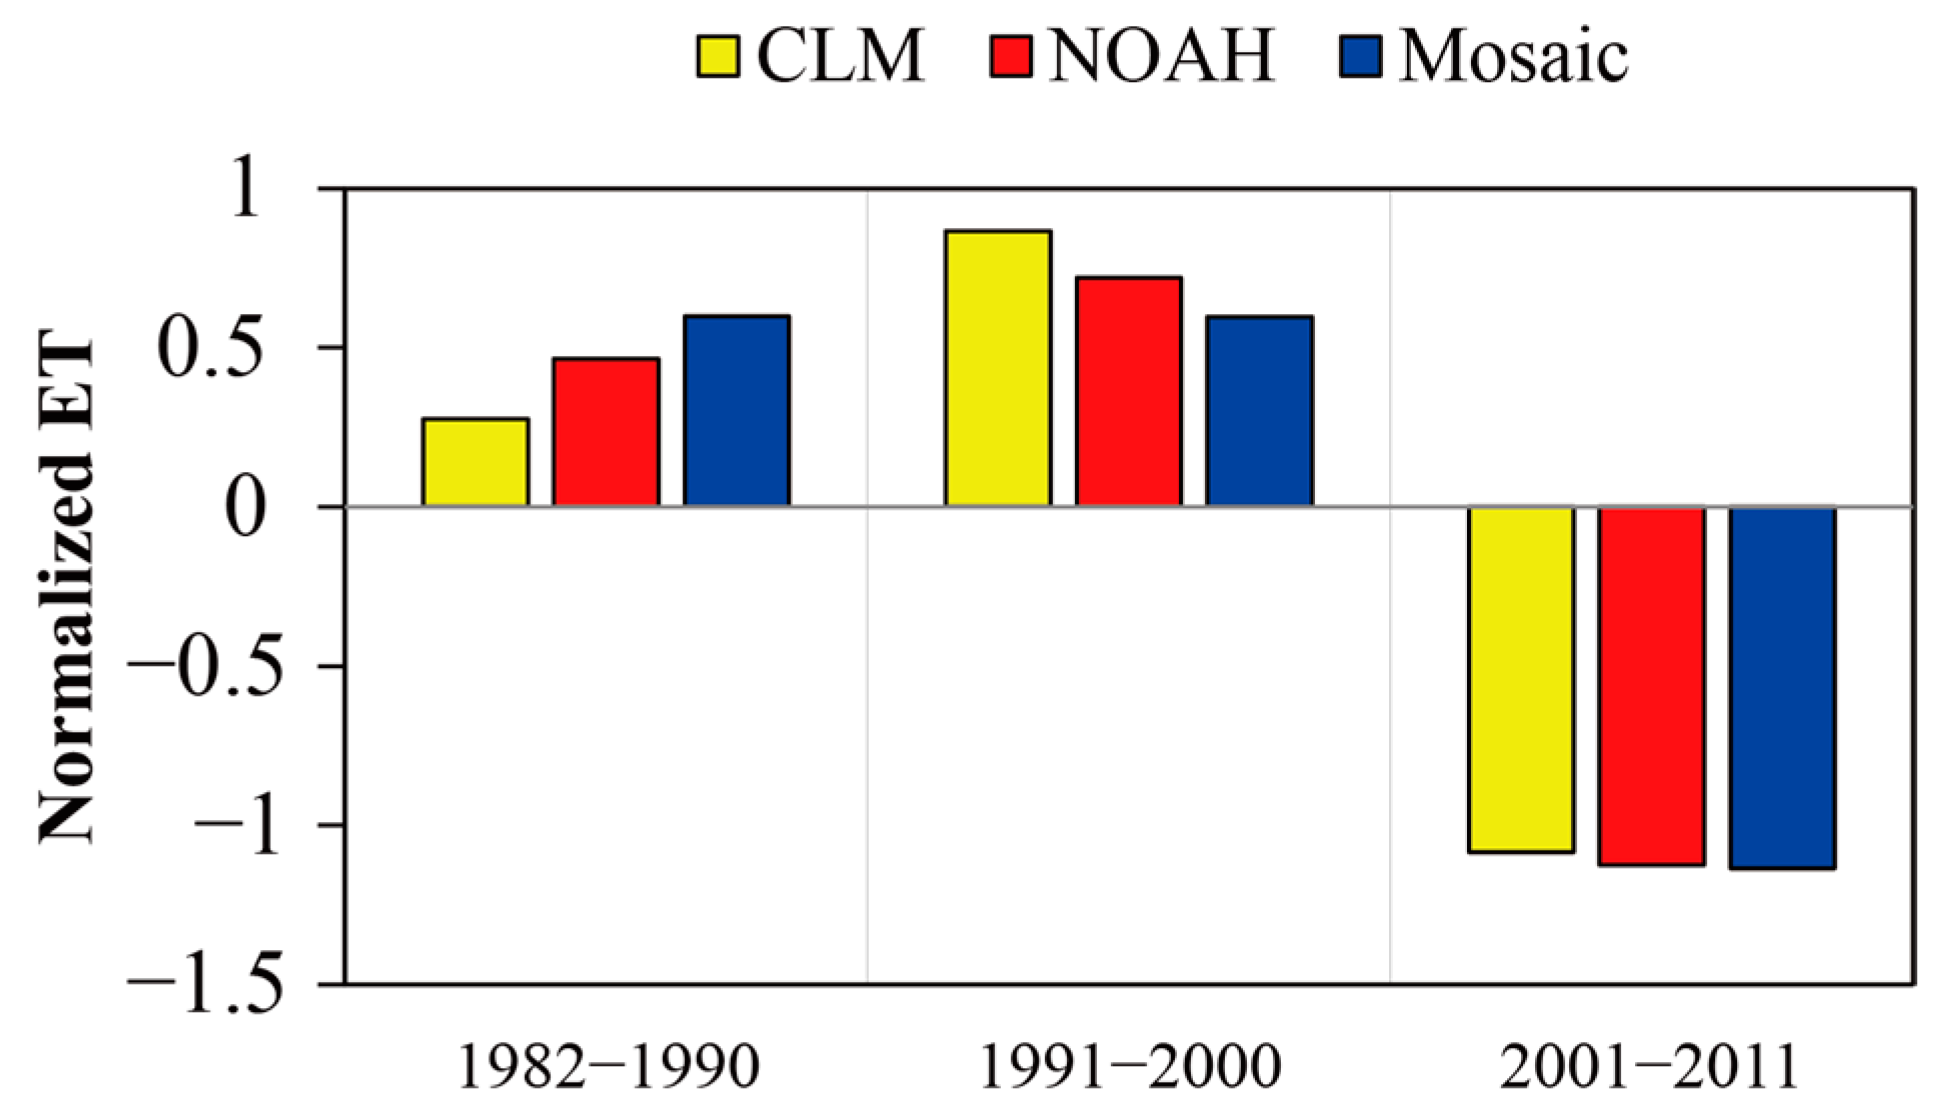
In order to confirm the influence of vegetation on ET, we made further effort to compare the gridded FLUXNET ET with that derived from the GLDAS [6]. GLDAS ET is simulated by three land surface models (CLM, Noah, and Mosaic) with the same climate forcings. As shown in Figure 11b and Figure 12, GLDAS and grid FLUXNET are consistent in the variation of ET before the fluctuation (1982–2000), with a rising trend in ET. However, the two datasets are not consistent after the fluctuation, and they have opposing ET trends. The gridded FLUXNET ET increases with decreasing soil moisture, while the ET from GLDAS shows a significant downward trend. Theoretically, it seems GLDAS is more reasonable because soil moisture generally has dominant control on ET in regions of water stress. However, the ET of GLDAS has possible biases. The primary reason is associated with that GLDAS forces the land surface models with static LAI. The static LAI can only partly describe the long-mean seasonal change of LAI but not the annual or decadal variation, which to some extent makes it difficult to take into account the long-term impact of vegetation on ET in GLDAS. As Figure 5 and Figure 6 presented, the LAI in NDPB has increased by as high as 40% and has a regional-mean increase of 19.2% during 1982–2011. The influence of vegetation on ET strengthens with increasing LAI. For instance, the global-mean LAI enhancement of 8% between the early 1980s and the early 2010s is simulated to have caused increases of about 55% ± 25% and 28% ± 6% of the observed increases in land ET and precipitation, respectively [44]. Therefore, it may cause serious bias in ET without considering the significant increase in LAI in NDPB by more than double of global enhancement. In fact, increasing LAI means enhanced transpiration, which gives more control of vegetation on the ET in NDPB. Consequently, GLDAS ET is mainly constrained by soil moisture, and it shows a rising trend with increasing soil moisture during 1982–2000 and a downward trend with decreasing soil moisture during 2001–2011. The inconsistency between GLDAS and FLUXNET further suggests that LAI may play a dominant role on ET during low soil moisture period (2001–2011) in NDPB, and that the impact of vegetation on ET has remarkably strengthened.
To some extent, the NDPB plays a role of transition zone of the demand-limited regime in the wet climate zone to supply-limited regime in the dry climate zone. Vegetation and other climatic and environmental factors exert significant control on ET. The change of ET is thus more complicated and has special characteristics. It is notable that the increase in vegetation-induced ET with low soil moisture happens at the price of more loss in soil moisture. Given a weak summer monsoon and thus negative bias in precipitation remained, the soil moisture loss in form of ET cannot be balanced by precipitation. Soil moisture will further decrease due to expansion of vegetation in NDPB, which may in turn cause a decrease in LAI and ET ultimately. In fact, the mean ratio of ET to precipitation has increased from 0.84 before the fluctuation of ET to 0.97 after the fluctuation in NDPB. Therefore, the rising trend with decreasing soil moisture may not be a long-lasting phenomenon. In this respect, the afforestation programs in semiarid and arid regions may thus become more challenging in future with weak summer monsoon.

5. Conclusions

In this paper, the trend of ET and its main drivers in NDPB are investigated based on a gridded FLUXNET dataset. Summer ET showed a significant increasing trend (p < 0.05) at the rate of 0.33 mm/year, but soil moisture experienced a remarkable decrease. This indicates soil moisture is not responsible for the increase of ET, especially during 2000 and 2011. In fact, further analysis shows neither water supply nor atmospheric demand regime dominates in the NDPB, which is different from the general cognition that ET is mainly constrained by water supply or atmospheric demand. This uniqueness of NDPB is consistent with its special roles as the transition zone for climate, summer monsoon, and ecology.
On the other hand, the land surface in NDPB had remarkably greened during 1982–2011. On regional scale, the regional-average LAI has increased by 19%. The transpiration part of ET associated with vegetation thus rise significantly due to the greening of land surface, which enables an enhanced impact of vegetation on the ET. The LAI maintained consistent significant (p < 0.01) and positive correlation with ET before and after the fluctuation of ET in the NDPB, and it can reflect over 60% of the change in ET. In contrast, the influence of water supply (assessed by soil moisture) on ET shows an evident decrease due to the weakening of the East Asian summer monsoon, especially during 2000 and 2011. Vegetation thus becomes the primary constraint for ET during 2001–2011 and it plays an increasing role in the variation of ET in NDPB with rising LAI.
Notably, the increasing ET means more consumption of soil moisture, leading to lower moisture content. Therefore, the rising trend with decreasing soil moisture may be a periodic phenomenon given a weak summer monsoon and thus negative bias in precipitation remained. The expansion of vegetation may intensify the risk of drought and cause conflicting demands for water between the ecosystem and humans in NDPB, especially in the case of a weak summer monsoon. In this respect, the afforestation programs in semiarid and arid regions may thus become more challenging in future.

Author Contributions

Conceptualization, J.Z., Q.Z. and P.Y.; formal analysis, J.Z., Z.Y. and H.L.; funding acquisition, Q.Z.; investigation, J.Z., Z.Y., P.Y., H.L., Y.Z., S.W. and L.Z.; project administration, S.W. and L.Z.; visualization, J.Z.; writing—original draft, J.Z.; writing—review and editing, J.Z., Q.Z., P.Y., Y.Z., Z.Y., S.W., L.Z. and H.L. All authors have read and agreed to the published version of the manuscript.

Funding

This research was funded by the National Natural Science Foundation of China (Grant No. 42230611, U2142208, 41875022, 41875020, and 42005071) and Natural Science Foundation of Hebei Province, China (Project No. D2022403013).

Institutional Review Board Statement

Not applicable.

Informed Consent Statement

Not applicable.

Data Availability Statement

The datasets used in this study are available online.

Conflicts of Interest

The authors declare no conflict of interest.

References

  1. Chen, C.; Park, T.; Wang, X.; Piao, S.; Xu, B.; Chaturvedi, R.K.; Fuchs, R.; Brovkin, V.; Ciais, P.; Fensholt, R.; et al. China and India lead in greening of the world through land-use management. Nat. Sustain. 2019, 2, 122–129. [Google Scholar] [CrossRef] [PubMed]
  2. Zhang, Y.; Peng, C.; Li, W.; Tian, L.; Zhu, Q.; Chen, H.; Fang, X.; Zhang, G.; Liu, G.; Mu, X.; et al. Multiple afforestation programs accelerate the greenness in the‘Three North’ region of China from 1982 to 2013. Ecol. Indic. 2016, 61, 404–412. [Google Scholar] [CrossRef]
  3. Chou, C.; Neelin, J.; Chen, C.-A.; Tu, J.-Y. Evaluating the “Rich-Get-Richer” Mechanism in Tropical Precipitation Change under Global Warming. J. Clim. 2009, 22, 1982–2005. [Google Scholar] [CrossRef]
  4. Piao, S.; Ciais, P.; Huang, Y.; Shen, Z.; Peng, S.; Li, J.; Zhou, L.; Liu, H.; Ma, Y.; Ding, Y.; et al. The Impacts of Climate Change on Water Resources and Agriculture in China. Nature 2010, 467, 43–51. [Google Scholar] [CrossRef]
  5. Jung, M.; Reichstein, M.; Bondeau, A. Towards global empirical upscaling of FLUXNET eddy covariance observations: Validation of a model tree ensemble approach using a biosphere model. Biogeosciences 2009, 6, 2001–2013. [Google Scholar] [CrossRef] [Green Version]
  6. Rodell, M.; Famiglietti, J.S.; Chen, J.; Seneviratne, S.I.; Viterbo, P.; Holl, S.; Wilson, C.R. Basin scale estimates of evapotranspiration using GRACE and other observations. Geophys. Res. Lett. 2004, 31, L20504. [Google Scholar] [CrossRef] [Green Version]
  7. Vermote, E.; Justice, C.; Csiszar, I.; Eidenshink, J.; Myneni, R.; Baret, F.; Masuoka, E.; Wolfe, R.; Claverie, M.; Program, N.C. NOAA Climate Data Record (CDR) of AVHRR Surface Reflectance, Version 4; National Centers for Environmental Information: Asheville, NC, USA, 2014. [CrossRef]
  8. Dee, D.P.; Uppala, S.M.; Simmons, A.J.; Berrisford, P.; Poli, P.; Kobayashi, S.; Andrae, U.; Balmaseda, M.A.; Balsamo, G.; Bauer, P.; et al. The ERA-Interim reanalysis: Configuration and performance of the data assimilation system. Q. J. R. Meteorol. Soc. 2011, 137, 553–597. [Google Scholar] [CrossRef]
  9. Harris, I.; Jones, P.D.; Osborn, T.J.; Lister, D.H. Updated high-resolution grids of monthly climatic observations—The CRU TS3.10 Dataset. Int. J. Climatol. 2014, 34, 623–642. [Google Scholar] [CrossRef] [Green Version]
  10. Zeng, J.; Qiang, Z. The trends in land surface heat fluxes over global monsoon domains and their responses to monsoon and precipitation. Sci. Rep.-UK 2020, 10, 5762. [Google Scholar] [CrossRef]
  11. Zhang, Q.; Yang, Z.; Hao, X.; Yue, P. Conversion features of evapotranspiration responding to climate warming in transitional climate regions in northern China. Clim. Dyn. 2019, 52, 3891–3903. [Google Scholar] [CrossRef]
  12. Dai, Y.J.; Zeng, X.B.; Dickinson, R.E.; Baker, I.; Bonan, G.B.; Bosilovich, M.G.; Denning, A.S.; Dirmeyer, P.A.; Houser, P.R.; Niu, G.Y.; et al. The Common Land Model. Bull. Am. Meteorol. Soc. 2003, 84, 1013–1023. [Google Scholar] [CrossRef] [Green Version]
  13. Chen, F.; Mitchell, K.; Schaake, J.; Xue, Y.K.; Pan, H.L.; Koren, V.; Duan, Q.Y.; Ek, M.; Betts, A. Modeling of land surface evaporation by four schemes and comparison with FIFE observations. J. Geophys. Res. Atmos. 1996, 101, 7251–7268. [Google Scholar] [CrossRef] [Green Version]
  14. Liang, X.; Lettenmaier, D.P.; Wood, E.F.; Burges, S.J. A Simple Hydrologically Based Model of Land-Surface Water and Energy Fluxes for General-Circulation Models. J. Geophys. Res. Atmos. 1994, 99, 14415–14428. [Google Scholar] [CrossRef]
  15. Koster, R.D.; Suarez, M.J. Energy and Water Balance Calculations in the Mosaic LSM; NASA Technical Memorandum; National Aeronautics and Space Administration: Washington, DC, USA, 1996; Volume 9, 76p.
  16. Berrisford, P.; Kallberg, P.; Kobayashi, S.; Dee, D.; Uppala, S.S.; Simmons, A.; Poli, P.; Sato, H. Atmospheric conservation properties in ERA-Interim. Q. J. R. Meteorol. Soc. 2011, 137, 1381–1399. [Google Scholar] [CrossRef]
  17. Albergel, C.; Rosnay, P.; Gruhier, C.; Muñoz Sabater, J.; Hasenauer, S.; Isaksen, L.; Kerr, Y.; Wagner, W. Evaluation of remotely sensed and modelled soil moisture products using global ground-based in situ observation. Remote Sens. Environ. 2012, 118, 215–226. [Google Scholar] [CrossRef]
  18. Liu, L.; Zhang, R.; Zuo, Z. Intercomparison of spring soil moisture among multiple reanalysis data sets over eastern China. J. Geophys. Res. Atmos. 2014, 119, 54–64. [Google Scholar] [CrossRef]
  19. Stillman, S.; Zeng, X.; Bosilovich, M.G. Evaluation of 22 Precipitation and 23 Soil Moisture Products over a Semiarid Area in Southeastern Arizona. J. Hydrometeorol. 2016, 17, 211–230. [Google Scholar] [CrossRef]
  20. Sheffield, J.; Wood, E.F.; Roderick, M.L. Little change in global drought over the past 60 years. Nature 2012, 491, 435–438. [Google Scholar] [CrossRef]
  21. Lawler, J.J.; Shafer, S.L.; White, D.; Kareiva, P.; Maurer, E.P.; Blaustein, A.R.; Bartlein, P.J. Projected climate-induced faunal change in the Western Hemisphere. Ecology 2009, 90, 588–597. [Google Scholar] [CrossRef]
  22. Rowhani, P.; Lobell, D.B.; Linderman, M.; Ramankutty, N. Climate variability and crop production in Tanzania. Agric. For. Meteorol. 2011, 151, 449–460. [Google Scholar] [CrossRef]
  23. Jones, P.D.; Harpham, C.; Harris, I.; Goodess, C.M.; Burton, A.; Centella-Artola, A.; Taylor, M.A.; Bezanilla-Morlot, A.; Campbell, J.D.; Stephenson, T.S.; et al. Long-term trends in precipitation and temperature across the Caribbean. Int. J. Climatol. 2016, 36, 3314–3333. [Google Scholar] [CrossRef] [Green Version]
  24. Seneviratne, S.I.; Corti, T.; Davin, E.L.; Hirschi, M.; Jaeger, E.B.; Lehner, I.; Orlowsky, B.; Teuling, A.J. Investigating soil moisture-climate interactions in a changing climate: A review. Earth-Sci. Rev. 2010, 99, 125–161. [Google Scholar] [CrossRef]
  25. Forzieri, G.; Miralles, D.; Ciais, P.; Alkama, R.; Ryu, Y.; Duveiller, G.; Robertson, E.; Kautz, M.; Martens, B.; Jiang, C.; et al. Increased control of vegetation on global terrestrial energy fluxes. Nat. Clim. Chang. 2020, 10, 356–362. [Google Scholar] [CrossRef]
  26. Qian, W.; Ding, T.; Hu, H.; Lin, X.; Qin, A. An overview of dry-wet climate variability among monsoon-westerly regions and the monsoon northernmost marginal active zone in China. Adv. Atmos. Sci. 2009, 26, 630–641. [Google Scholar] [CrossRef]
  27. Zeng, J.; Qiang, Z. A humidity index for the summer monsoon transition zone in East Asia. Clim. Dyn. 2019, 53, 5511–5527. [Google Scholar] [CrossRef]
  28. Fu, C. Transitional climate zones and biome boundaries: A case study from China. In Landscape Boundaries; Hansen, A.J., di Castri, F., Eds.; Ecological studies: Analysis and synthesis; Springer: New York, NY, USA, 1992; Volume 92, pp. 394–402. [Google Scholar]
  29. Zhang, J.Y.; Wang, W.C.; Wu, L.Y. Land-atmosphere coupling and diurnal temperature range over the contiguous United States. Geophys. Res. Lett. 2009, 36, L06706. [Google Scholar] [CrossRef]
  30. Zhang, Q.; Zeng, J.; Yue, P.; Zhang, L.; Wang, S.; Wang, R. On the land-atmosphere interaction in the summer monsoon transition zone in East Asia. Theor. Appl. Climatol. 2020, 141, 1165–1180. [Google Scholar] [CrossRef]
  31. Huang, J.; Guan, X.; Ji, F. Enhanced cold-season warming in semi-arid regions. Atmos. Chem. Phys. 2012, 12, 5391–5398. [Google Scholar] [CrossRef] [Green Version]
  32. Wang, A.; Lettenmaier, D.; Sheffield, J. Soil Moisture Drought in China, 1950–2006. J. Clim. 2011, 24, 3257–3271. [Google Scholar] [CrossRef]
  33. Han, L.Y.; Zhang, Q.; Jia, J.Y.; Wang, Y.H.; Huang, T. Drought Severity Frequency Duration and Regional Differences in China. J. Desert Res. 2019, 39, 1–10. [Google Scholar]
  34. Fu, C.B.; Ma, Z.G. Global Change and Regional Aridification. Chin. J. Atmos. Sci. 2008, 32, 752–760. [Google Scholar] [CrossRef]
  35. Jung, M.; Reichstein, M.; Ciais, P.; Seneviratne, S.; Sheffield, J.; Goulden, M.; Bonan, G.; Cescatti, A.; Chen, J.; de Jeu, R.; et al. Recent Decline in the Global Land Evapotranspiration Trend Due to Limited Moisture Supply. Nature 2010, 467, 951–954. [Google Scholar] [CrossRef] [PubMed] [Green Version]
  36. Held, I.; Soden, B. Robust Responses of the Hydrological Cycle to Global Warming. J. Clim. 2006, 19, 5686–5699. [Google Scholar] [CrossRef]
  37. Bonan, G. Forests and Climate Change: Forcings, Feedbacks, and the Climate Benefits of Forests. Science 2008, 320, 1444–1449. [Google Scholar] [CrossRef] [PubMed] [Green Version]
  38. Myneni, R.; Keeling, C.; Tucker, C.; Asrar, G.; Nemani, R. Increased Plant Growth in the Northern High Latitudes from 1981 to 1991. Nature 1997, 386, 698–702. [Google Scholar] [CrossRef]
  39. Los, S. Analysis of trends in fused AVHRR and MODIS NDVI data for 1982–2006: Indication for a CO2 fertilization effect in global vegetation. Glob. Biogeochem. Cycles 2013, 27, 318–330. [Google Scholar] [CrossRef]
  40. Piao, S.; Yin, G.; Tan, J.; Cheng, L.; Huang, M.; Li, Y.; Liu, R.; Mao, J.; Myneni, R.; Peng, S.; et al. Detection and attribution of vegetation greening trend in China over the last 30 years. Glob. Chang. Biol. 2014, 21, 1601–1609. [Google Scholar] [CrossRef]
  41. Zeng, Z.; Piao, S.; Li, L.; Wang, T.; Ciais, P.; Lian, X.; Yang, Y.; Mao, J.; Shi, X.; Myneni, R. Impact of Earth Greening on the Terrestrial Water Cycle. J. Clim. 2018, 31, 2633–2650. [Google Scholar] [CrossRef]
  42. Wang, X.; Piao, S.; Ciais, P.; Friedlingstein, P.; Myneni, R.; Cox, P.; Heimann, M.; Miller, J.; Peng, S.; Wang, T.; et al. A two-fold increase of carbon cycle sensitivity to tropical temperature variations. Nature 2014, 506, 212–215. [Google Scholar] [CrossRef]
  43. Zhu, Z.; Piao, S.; Myneni, R.; Huang, M.; Zeng, Z.; Canadell, J.; Ciais, P.; Sitch, S.; Friedlingstein, P.; Arneth, A.; et al. Greening of the Earth and its drivers. Nat. Clim. Chang. 2016, 6, 791–795. [Google Scholar] [CrossRef]
  44. Zeng, Z.; Piao, S.; Li, L.; Zhou, L.; Ciais, P.; Wang, T.; Li, Y.; Lian, X.; Wood, E.; Friedlingstein, P.; et al. Climate mitigation from vegetation biophysical feedbacks during the past three decades. Nat. Clim. Chang. 2017, 7, 432–436. [Google Scholar] [CrossRef]
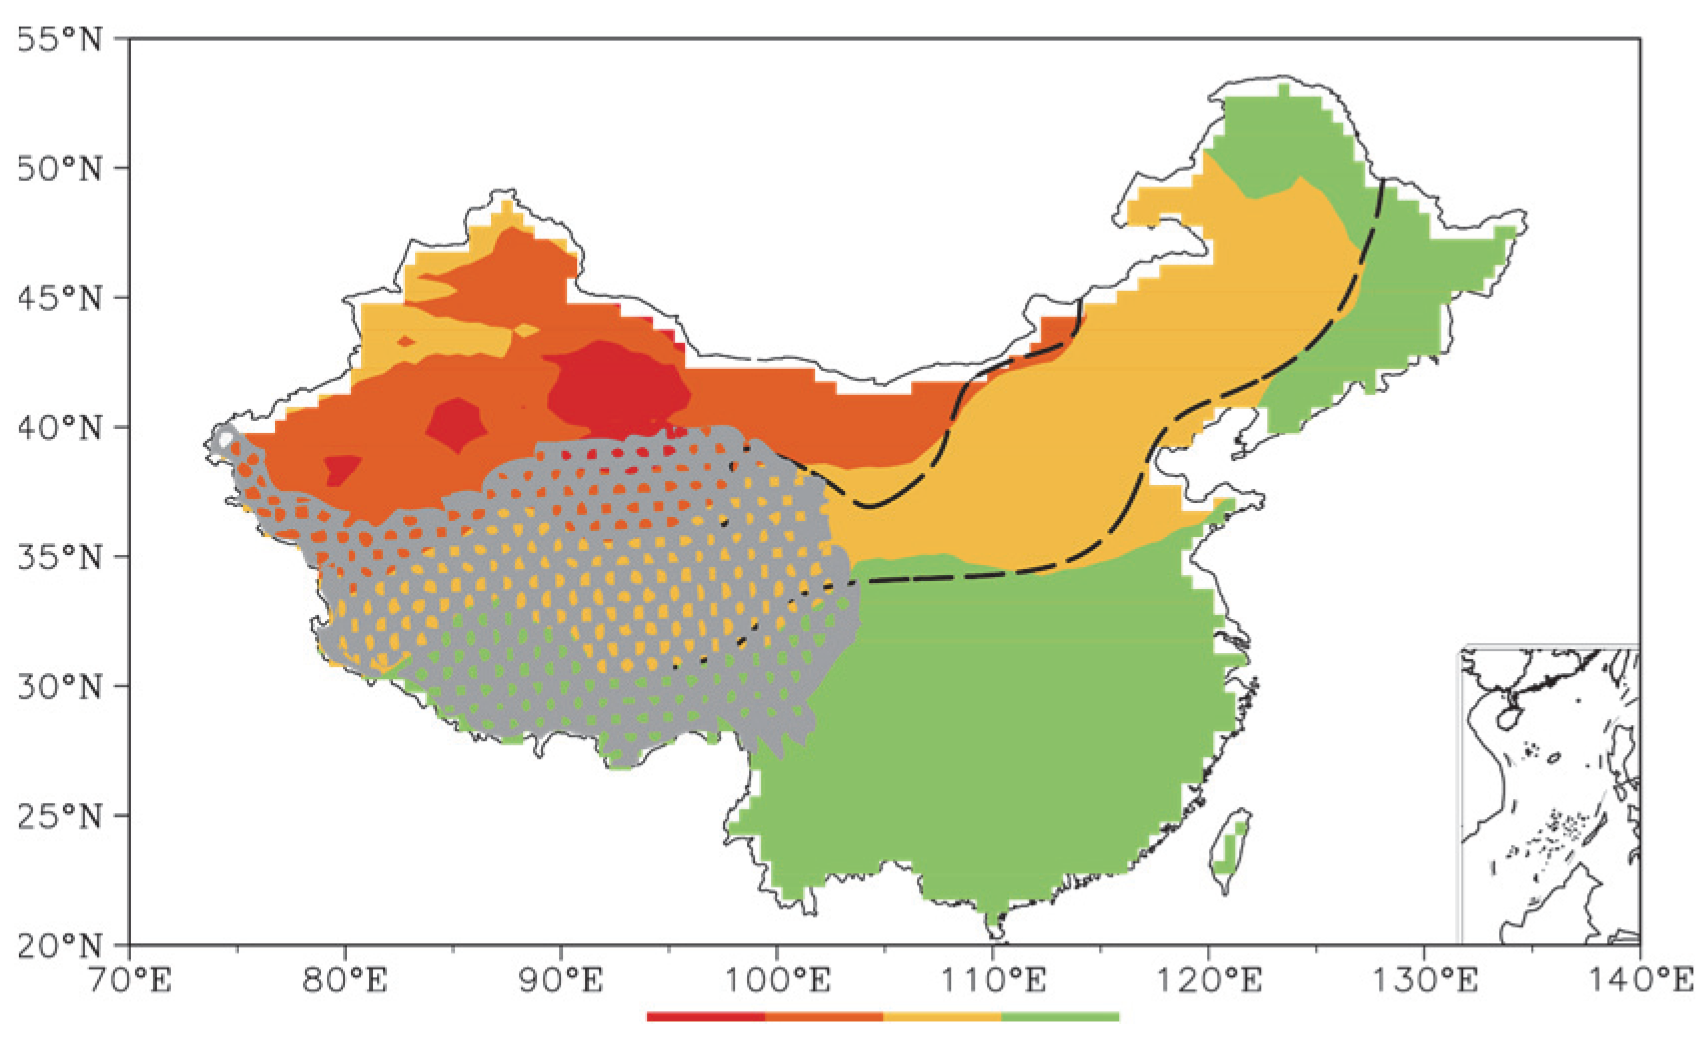
Figure 1. The spatial extent of NDPB and the aridity index in China. The aridity index (AI) is defined by the ratio of annual precipitation to the potential ET. According to the value of AI, arid climate has an AI less than 0.2 (AI < 0.2) and humid climate has an AI higher than 0.65 (AI ≥ 0.65). The NDPB has AI ranging between 0.2 and 0.65. The bold dashed lines mark the spatial extent of NDPB.
Remotesensing 15 00221 g001
Figure 2. The drought frequency (a) and drought trend (b) in NDPB. The spatial patterns of drought frequency (that is, days of drought) is modified from [33], and the trend of drought is modified from [34].
Remotesensing 15 00221 g002
Figure 3. The spatial pattern of summer ET trend (mm/year) in NDPB in China.
Remotesensing 15 00221 g003
Figure 4. The changes in regional-mean summer ET and soil moisture on interannual (a) and interdecadal (b) scales.
Remotesensing 15 00221 g004
Figure 5. The greening (increase in LAI) of NDPB for 2001–2011 relative to 1982–1990 (a) and 1991–2000 (b).
Remotesensing 15 00221 g005
Figure 6. The statistics of greening of NDPB for 2001–2011 relative to 1982–1990 (a) and 1991–2000 (b). Proportion stands for the percentages of different increase ranges of ET, while accumulation is for the accumulation of these percentages.
Remotesensing 15 00221 g006
Figure 7. The spatial pattern of ET regimes in China during 1982–2011.
Remotesensing 15 00221 g007
Figure 8. The variations in normalized regional-mean summer soil moisture, precipitation and Humidity Index (HI) during 1982–2011 in the NDPB in China on annual scale (a) and decadal scale (b). The HI is designed by Zeng and Zhang [27] to measure the summer monsoon intensity in NDPB, and higher HI indicates stronger summer monsoon.
Remotesensing 15 00221 g008
Figure 9. The scatter plots between regional-mean ET and soil moisture (a) and PET (b), and between PET and soil moisture (c).
Remotesensing 15 00221 g009aRemotesensing 15 00221 g009b
Figure 10. The trend patterns for ET and LAI in NDPB during 2001–2011. The plus sign (+) denotes an increasing trend and the minus sign (−) for a decreasing trend.
Remotesensing 15 00221 g010
Figure 11. The changes in regional-mean summer ET and LAI on interannual (a) and interdecadal (b) scales, and their scatter plot (c).
Remotesensing 15 00221 g011
Figure 12. The normalized regional-mean ET derived from GLDAS CLM, Noah, and Mosaic.
Remotesensing 15 00221 g012
Disclaimer/Publisher’s Note: The statements, opinions and data contained in all publications are solely those of the individual author(s) and contributor(s) and not of MDPI and/or the editor(s). MDPI and/or the editor(s) disclaim responsibility for any injury to people or property resulting from any ideas, methods, instructions or products referred to in the content.