Abstract
In this paper, a method for extracting the height of urban forest trees based on a smartphone was proposed to efficiently and accurately determine tree heights. First, a smartphone was used to obtain person–tree images, LabelImg was used to label the images, and a dataset was constructed. Secondly, based on a deep learning method called You Only Look Once v5 (YOLOv5) and the small-hole imaging and scale principles, a person–tree scale height measurement model was constructed. This approach supports recognition and mark functions based on the characteristics of a person and a tree in a single image. Finally, tree height measurements were obtained. By using this method, the heights of three species in the validation set were extracted; the range of the absolute error was 0.02 m–0.98 m, and the range of the relative error was 0.20–10.33%, with the RMSE below 0.43 m, the rRMSE below 4.96%, and the above 0.93. The person–tree scale height measurement model proposed in this paper greatly improves the efficiency of tree height measurement while ensuring sufficient accuracy and provides a new method for the dynamic monitoring and investigation of urban forest resources.
1. Introduction
The concept of an urban forest originated in the United States and Canada [1,2]. Such a forest is a biological community consisting of trees, flowers, wildlife, microorganisms, and architectural structures within a city, including parks, street and unit green spaces, vertical greenery, street trees, sparse lawns, patches of forest, forest strips, flower gardens, nurseries, orchards, vegetable patches, farmland, meadows, and water areas [3]. Urban forests mitigate the decline in environmental quality associated with urban development by influencing changes in the physical space and biological environment of cities and provide important functions in urban CO2 emission reduction, air purification, PM2.5 absorption, urban rainfall storage, flood control, water quality improvement, noise reduction, and microclimate improvement [4,5,6]. In particular, the carbon sequestration function of urban forests plays an important role in the establishment of green and low-carbon cities [7,8,9]. In recent years, the performance of smartphones has gradually improved, and they have been widely used to extract forest parameters. For example, we use smartphones to estimate the leaf area index (LAI) [10,11] and plant area index (PAI) [12] and classify tree species [13]. In the forest parameters, the height of trees is a key factor when accurately estimating the forest biomass carbon [14,15,16]. Therefore, rapid and intelligent monitoring of urban forest tree height is a key process in urban forest resource monitoring and carbon sink estimation [17].
For many years, the instrument most commonly used to measure the height of trees in field surveys was the Blume–Leiss height gauge [18]. When measuring tree height, at least two people were required to work together, and a tape measure was needed in addition to the gauge. Other traditional tree height measurement methods, such as total station and angle meter-based methods [19,20], involve height-measurement principles similar to that of the Blume–Leiss method. Therefore, traditional tree height measurement methods based on the the Blume–Leiss approach are characterized by low measurement efficiency and high labor intensity.
With the rapid development of remote sensing (RS) technology and intelligent forestry, some researchers have achieved success in research involving tree height measurement methods. The monitoring of forest resources in China has been transformed from relying on manual field survey methods to the use of various information technologies to achieve accurate and quantitative monitoring [21]. An increasing number of specialized and intelligent devices have been used for forest resource surveys [22,23,24]. Currently, technologies such as unmanned aerial vehicles (UAVs), photogrammetric systems, and light detection and ranging (LiDAR) systems have gradually become important in forest resource monitoring [25,26,27,28]. UAV-LiDAR systems can quickly and accurately obtain forest structure parameters [29,30]. However, there are many deficiencies associated with these systems, such as poor portability and large numbers of calculations [31,32,33]. For urban forests, many difficulties will be encountered when applying UAV-LiDAR systems in surveying tasks, such as flight permissions in urban centers and a sparse LiDAR point cloud density at high flight altitudes.
The high-definition cameras contained in smartphones can provide rapid images of single trees in urban areas, and tree height can be determined through imaging and photogrammetry principles. Compared with methods based on UAV-LiDAR and the Blume–Leiss height gauge, recently proposed methods [34,35] are much more efficient and broadly applicable. However, the method proposed by Chen et al. can only measure the height of trees on the same horizon as the measurer who use the smartphone, which limits its application in tree height measurement. Although the method proposed by Wu et al. overcomes this deficiency, their method still is insufficient in other ways. For example, the parameters of the rear camera of the smartphone must be calibrated. If the brand or model of the smartphone being used changes, recalibration is required. Additionally, in the image segmentation algorithm they used, considerable time is needed to extract the edges of trees, making this approach less convenient than methods based on target detection algorithms [21,36]. The methods proposed by Tian et al. [37] and Fan et al. [38] provide high accuracy but require special external tools, thus limiting their use by forestry investigators in daily practice.
Based upon the aforementioned limitations, an intelligent urban tree height extraction method based on monocular vision, using a smartphone is proposed and combined with You Only Look Once v5 (YOLOv5). YOLOv5 provides high target detection accuracy and a fast run speed [39,40,41]. With this approach, the smallest possible representative box can be established for trees, making real-time measurement of tree height a reality. The key contribution of this study is the use of a smartphone to measure the height of urban trees in real time, an approach with strong practicality and convenience. Data are accurately and efficiently obtained, thus reducing the field work intensity of forestry investigators.
2. Study Area and Methodology
2.1. Study Area and Data
2.1.1. Study Area
In this study, Cinnamomum camphora (CC), Ginkgo biloba (GB), and Yulania denudate (YD) in the eastern section of Wusu Street, Lin’an District, Hangzhou, Zhejiang Province, China, and the whole section of Ginkgo Road and Yulan Road, Zhejiang Agriculture and Forestry University, were used to carry out relevant studies. The locations are shown in Figure 1. GB is a deciduous tree species with a wide distribution, and it exists in a wild state in only the Tianmu Mountains, Zhejiang [42]. CC is a subtropical evergreen broad-leaved tree species [43]. YD is a deciduous tree species [44]. The three tree species are common street trees along all urban streets in Hangzhou.
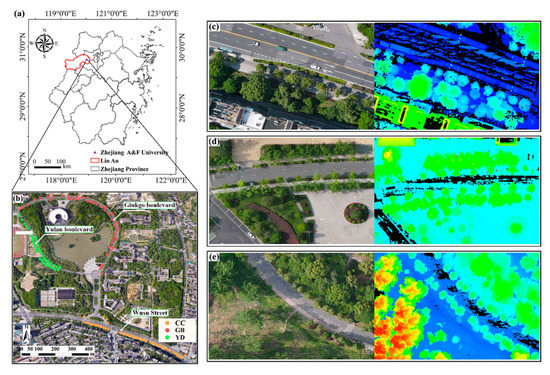
Figure 1.
Map of the study area. (a) Location in Zhejiang Province, (b) distribution of all samples of the three tree species in the study area, (c–e) on the left are parts of the visible light images of CC, GB, and YD, and on the right are the corresponding laser radar point cloud images.
2.1.2. Person–Tree Image Acquisition and Labeling
A total of 470 person–tree images were collected at a resolution of 3024 × 4032 by using smartphones to photograph street trees of the three species in the study area. A total of 396 images with high clarity and no motor vehicle obstruction were selected as the study dataset.
The constructed dataset was divided into a training set and a validation set at a ratio of 3:1 by using a random nonrepeat sampling method to train and validate the person–tree scale height measurement model. In the training set, there were 36 CCs, 33 GBs, and 30 YDs. There were 33 trees in the validation set. Each tree had three different photos. The 132 trees in the dataset were surveyed by using a traditional field survey method to obtain the measured height of trees. In addition, UAV-LiDAR was used to scan the trees from above. DSM and DEM data were used to calculate the tree height, which was used for the verification of the extraction results of the person–tree scale height measurement model. The UAV was a DJI Matrice 600Pro, the LiDAR device was a Velodyne Puck LITETM, the flight date was April 2022, and the flight altitude was 60 m. The standard deviation of the point cloud was 2.39 cm, which was less than 3.00 cm specified in the laser radar product manual; therefore, the relevant accuracy requirements were met. The image capture and tree height investigation processes are shown in Figure 2.
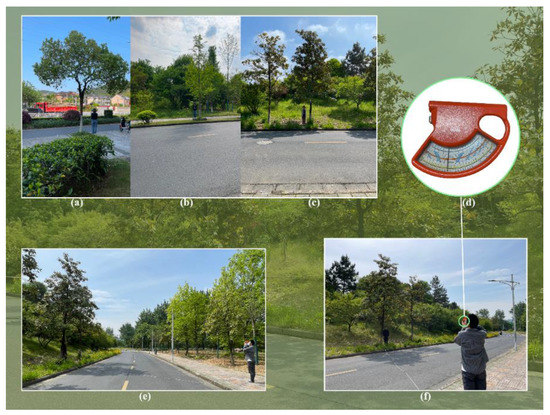
Figure 2.
Traditional field survey. (a–c) CC, GB, and YD trees to be measured. (d) Blume–Leiss gauge. (e,f) Measuring the tree heights using the Blume–Leiss gauge.
LabelImg software was used to label the images in the training set in YOLO format with “person” and “tree” categories. LabelImg generated a text file with the same name corresponding to each image when the labeling was completed. Finally, the label category, the ratio of the horizontal coordinate of the center of the label box to the width of the image, the ratio of the vertical coordinate of the center of the label box to the height of the image, the ratio of the width of the label box to the width of the image, and the ratio of the height of the label box to the height of the image were saved. The images obtained before and after labeling are shown in Figure 3.
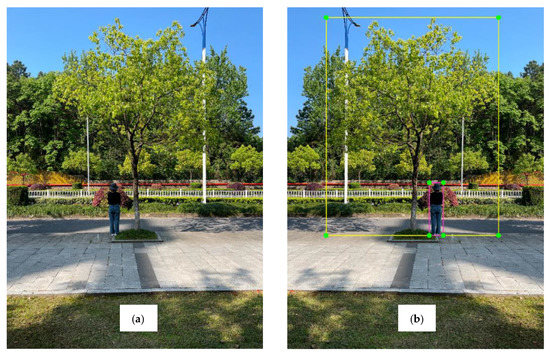
Figure 3.
(a) Image of a person and tree before labeling. (b) Image of a person and tree after labeling.
2.2. Person–Tree Scale Height Measurement Model
2.2.1. The Construction of Person–Tree Scale Height Measurement Model
The object detection algorithms can be divided into one-stage and two-stage detection algorithms [45]. YOLOv5 is the representative of one-stage detection algorithms, which balances speed and precision [40,46,47]. The network structure of YOLOv5 consists of four parts, namely, the input, backbone, neck, and head, which are represented in yellow, blue, purple and red, respectively, in Figure 4 [48,49,50].
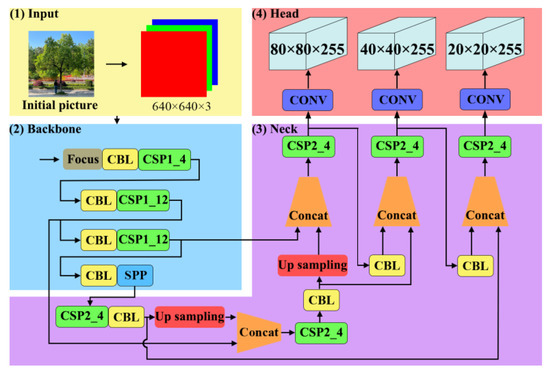
Figure 4.
YOLOv5x network structure.
The person–tree images input to the network will go through the adaptive image scaling of input [51], feature extraction of backbone [45,52,53,54], feature fusion of neck [50,51,55,56], and NMS (nonmaximum suppression) of head [57] in turn, and finally the coordinates of the upper left and lower right corners of the person and the tree are output to determine the corresponding prediction box for each target.
Among them, the head uses complete intersection over union (CIoU) [58] to calculate the CIoU loss and incorporates it into the bounding box (Bbox) [45] loss function, which integrates the overlap area, centroid distance and aspect ratio to perform box regression prediction. A schematic diagram of calculation is shown in Figure 5. Red box A represents the prediction box, and “a” is the center point of the prediction box. Purple box B represents the real box, and “b” is the center point of the real box. The smallest external box that can enclose the prediction box A and the real box B is denoted by C. The calculation of CIoULOSS is as follows,
where denotes the area of intersection between the prediction box and the real box. denotes the area of the merging region of the prediction box and the real box. is the Euclidean distance between the ”a” and “b” center points, “c” is the diagonal distance across C, is a balance scale parameter and is not involved in the gradient calculation, is a parameter associated with the consistency of the aspect ratio, and are the width and height of the real box, and and are the width and height of the prediction box, respectively.
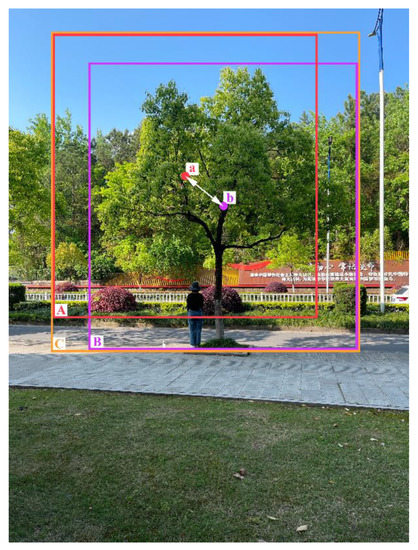
Figure 5.
Schematic diagram of CIoU_Loss calculation.
Based on the coordinates of the prediction box, principle of small-aperture imaging and scale, a person–tree scale height measurement model is constructed, as shown in Figure 6. By using a person as the scale, the real height is H1. The tree will be measured, and its real height is H2. The person and the root of the tree are located on the same axis and form plane α. The smartphone camera uses a rear camera lens group, and the light reflected from the person and the top and bottom of the tree passes through the optical center O of the lens group. ABCD is the imaging plane of the smartphone, and the pixel heights of the person and tree in the imaging plane are Pix_H1 and Pix_H2, respectively. They can be calculated from the pixel coordinates of the upper left point and the lower right point of the rectangular box containing the target object. The imaging plane ABCD, smartphone in the plane, and α plane are parallel to each other. From the principle of small-aperture imaging and the principle of scale, it is easy to obtain the height measurement formula for a target tree, as follows:
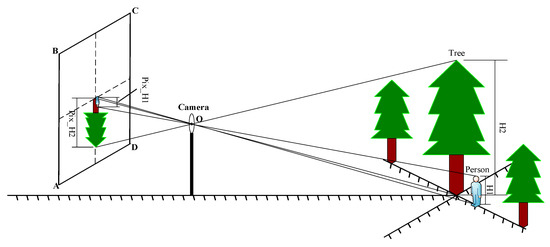
Figure 6.
Schematic diagram of the person–tree scale height measurement model.
In summary, the flow chart for extracting the height of urban forest trees based on a smartphone with the person–tree scale height measurement model as shown in Figure 7. The measured value of traditional field survey method is denoted as . The UAV-LiDAR value is denoted as . The predicted value of smartphone is denoted as .
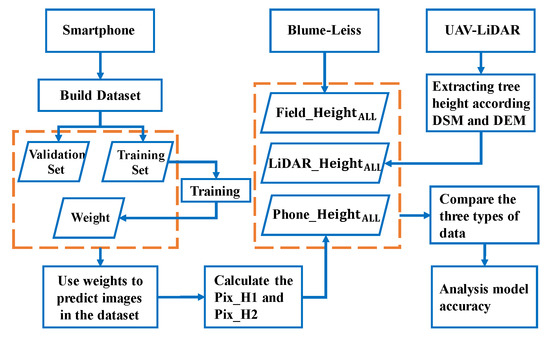
Figure 7.
Flow chart for extracting the height of urban forest trees based on a smartphone with the person–tree scale height measurement model.
2.2.2. Training of the Person–Tree Scale Height Measurement Model
The images in the constructed training set were labeled, and then the training of the person–tree scale height measurement model was performed. The hardware environment for the experiments was as follows. The CPU configuration was an Intel(R) Xeon(R) Gold 6154 CPU @ 3.00 GHz, the graphics card configuration was an NVIDIA RTX A6000, the video memory size was 47.5 GB, and the memory size was 64 GB. The software environment for the experiments was as follows. The operating system was Windows 10, the CUDA version was 11.1, the Python version was 3.9.7, and the PyTorch version was 1.8.1.
In this study, the model was trained based on Ultralytics LLC YOLOv5, and the small-hole imaging and scale principles were innovatively incorporated into the model. To prevent gradient explosion, the initial learning rate of the weights was set to 0.01, and the learning rate was dynamically reduced by using the cosine function. The momentum factor was set to 0.937, and the pretrained model was YOLOv5x.pt. The number of training epochs was set to 300, and the batch size of the model training was set to 16. The image input size was 1024 × 1024, the number of working cores was 32, and other parameters were set to the default values.
2.2.3. Evaluation Indexes for the Accuracy of the Person–Tree Scale Height Measurement Model
To evaluate whether the person–tree scale height measurement model can accurately achieve the detection of persons and trees, six evaluation indicators were used: precision (P), recall rate (R), mean average precision (mAP), box loss, object loss, and classification loss. The larger the P, R, and mAP are, the higher the precision of the person-tree scale height measurement model in detecting and recognizing persons and trees. The smaller the values of the box loss, object loss, and classification loss are, the better the performance of the person–tree scale height measurement model in detecting and recognizing persons and trees.
P is also known as the accuracy rate, which is based on the model results and indicates the proportion of the samples predicted to be positive that are true positive, as calculated with Equation (7):
R is also known as the check-all rate, which is based on the original samples and indicates the proportion of the samples predicted to be true positive in the original samples, as calculated with Equation (8):
TP, FP, and FN in Equations (7) and (8) denote the true positive samples, false-positive samples, and false-negative samples, respectively.
mAP@[0.5:0.95] represents dividing the IoU threshold range from 0.5 to 0.95 in steps of 0.05 and calculating accuracy statistics in different ranges to determine the average accuracy for different IoU threshold ranges. The corresponding formulae are shown in Equations (9) and (10), in which AP is the area under the accuracy-recall curve:
In addition, the box loss represents the ability of the model to locate the center of the target object and the extent to which the boundaries of the predicted box cover the target object. The object loss is essentially a measure of the probability that the target object is present in the proposed region of interest. If the objectivity is high, it means that the image window is likely to contain a target object. The classification loss provides a way for the model to predict the correct class of a given object.
2.3. Evaluation of the Tree Height Extraction Accuracy
Height measurement experiments were performed with the person–tree images in the dataset to obtain the corresponding model predictions for each tree. The was measured by using a band tape and a Blume–Leiss height gauge [59,60]. In addition, it has been noted that LiDAR can accurately extract single-tree height information [61,62,63]. Therefore, the was compared with the and the to determine the accuracy of the person–tree scale height measurement model. The absolute error (AE), relative error (RE), root mean square error (RMSE), relative root mean square error (rRMSE), and coefficient of determination R² between the three types of tree heights were calculated as indices to evaluate the accuracy of tree height extraction by using Equations (11)–(15),
where and are the values of different types for the tree, is the average of the values, and n is the number of trees.
3. Results and Analysis
3.1. Person–Tree Scale Height Measurement Model
Figure 8a shows the curves of P, R, and mAP@[0.5:0.95] for the model after 300 training epochs. As shown in Figure 8a, the values of the three indicators fluctuate and display a decreasing trend until the 60th training epoch, but as the number of training epochs increases and the learning rate of the cosine function is dynamically adjusted, the model gradually transitions to a convergence state. At the end of the last iteration, the accuracy rate, the recall rate, and the mAP indicate high accuracy.
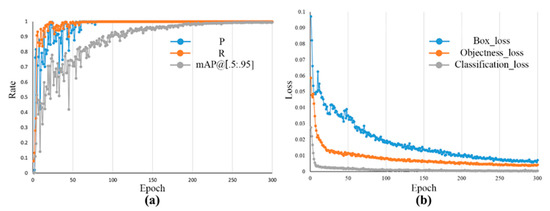
Figure 8.
(a) P, R, and mAP@[0.5:0.95] curves with the number of training epochs. (b) Plots of the box loss, object loss, and classification loss during training.
The curves of the box loss, object loss, and classification loss for the training set are shown in Figure 8b. Notably, the curves of the three metrics for the training set decrease sharply before the 50th training epoch. The curves of the box loss and object loss stabilize and decrease to less than 0.01 after approximately the 250th training epoch. The curve of the classification loss stabilizes and decreases to less than 0.0025 after approximately the 100th training epoch.
3.2. Tree-Height Extraction Results
The trained model was used to extract a total of 132 tree heights for the three tree species in the dataset. The model-labeled person–tree images are shown in Figure 9, and the corresponding stand labels for (a), (b), and (c) are GB36, CC18, and YD8, respectively. Figure 9 illustrates that the confidence level of the tree height measurement model for person and tree recognition is above 0.94, which is high.
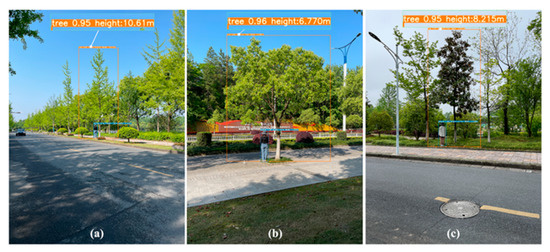
Figure 9.
Examples of the person-tree scale height measurement model. (a) Measurement result of a GB. (b) Measurement result of a CC. (c) Measurement result of a YD.
The Field_Height and Phone_Height, AE, and RE for the three tree species of validation set are shown in Table 1, Table 2 and Table 3. The distribution and fitting results for the Field_Height and Phone_Height of the three tree heights are shown in Figure 10a–d.

Table 1.
The Field_HeightGB, Phone_HeightGB and error analysis.
Table 2.
The Field_HeightCC, Phone_HeightCC and error analysis.
Table 3.
The Field_HeightYD, Phone_HeightYD and error analysis.
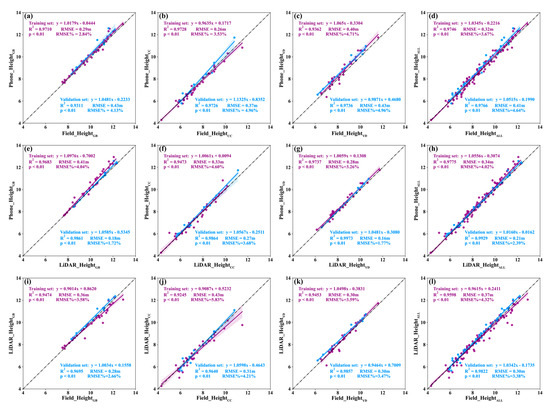
Figure 10.
Correlation during the Field_Height, Phone_Height and LiDAR_Height. Among them, the purple points represent the training set and the blue points represent the validation set. (a–d) Correlation between the Field_Height and the Phone_Height for three tree species. (e–h) Correlation between the LiDAR_Height and the Phone_Height for three tree species. (i–l) Correlation between the Field_Height and the LiDAR_Height for three tree species.
The based on the person–tree scale measurement height model are shown in Figure 10a. An analysis of Figure 10a indicates that the values of the model for the training set and validation set are 0.9710 and 0.9311, respectively. Additionally, the RMSEs are 0.29 m and 0.43 m, respectively, and the rRMSEs are 2.84% and 4.13%. The tree height predictions based on the validation set are further analyzed in Table 1. The minimum and maximum values of the are 8.43 m and 12.58 m, respectively, with a range of absolute error from 0.02 m to 0.98 m and a range of relative error from 0.20% to 8.68%.
The estimated by the height measurement model are shown in Figure 10b. An analysis of Figure 10b indicates that the accuracy () of the model for the training set and validation set is 0.9728 and 0.9726, respectively. The RMSEs are 0.26 m and 0.37 m, and the rRMSEs are 3.53% and 4.96%, respectively. The tree height predictions based on the validation set are further analyzed in Table 2. The minimum and maximum values of are 5.80 m and 11.74 m, respectively, with absolute errors ranging from 0.03 m to 0.94 m and relative errors ranging from 0.44% to 8.70%.
The estimated by the height measurement model are shown in Figure 10c. An analysis of Figure 10c indicates that the accuracy () of the model for the training set and validation set is 0.9362 and 0.9736, respectively. The RMSEs are 0.40 m and 0.43 m, respectively, and the rRMSEs are 4.71% and 4.96%, respectively. The based on the validation set are further analyzed in Table 3, and the minimum and maximum values are 6.58 m and 10.97 m, respectively, with absolute errors ranging from 0.03 m to 0.95 m and relative errors ranging from 0.29% to 10.33%.
The of the three tree species estimated by the tree height measurement model are shown in Figure 10d. As shown in Figure 10d, the accuracy () of the model for the training set and validation set is 0.9746 and 0.9766, respectively, the RMSEs are 0.32 m and 0.41 m, and the rRMSEs are 3.67% and 4.64%, respectively. In the validation set, the minimum and maximum values of predicted by the model are 5.98 m and 12.58 m, respectively, with absolute errors ranging from 0.02 m to 0.98 m and relative errors ranging from 0.20% to 10.33%.
The distribution and fitting results for the Phone_Height and the LiDAR_Height are shown in Figure 10e–h. Some tree point cloud data are shown in Figure 11.
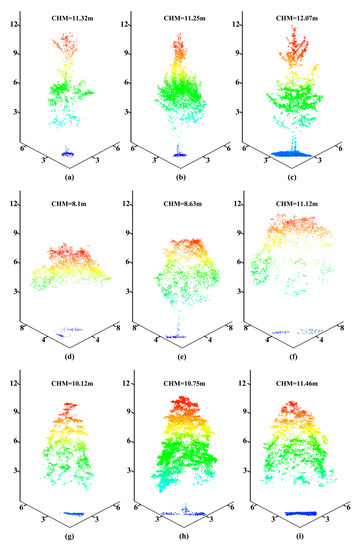
Figure 11.
Point cloud chart of single-tree points; among them, the tree numbers indicated by (a–i) are GB8, GB13, GB27, CC45, CC46, CC47 YD3, YD36, and YD37, respectively.
Based on Figure 10e–g, the range of the training set is 0.9473~0.9737, the RMSE range is 0.28~0.41 m, and the rRMSE range is 3.26~4.60%. The range of the validation set is 0.9861~0.9973, the RMSE range is 0.16~0.27 m, and the rRMSE range is 1.72~3.68%. Figure 10h is obtained from a comprehensive analysis of the trees in the dataset. The value of training set is 0.9775, the RMSE is 0.34 m, and the rRMSE is 4.02%. The value of validation set is 0.9929, the RMSE is 0.21 m, and the rRMSE is 2.39%.
The distribution and fitting results for the Field_Height and the LiDAR_Height are shown in Figure 10i–l. Based on Figure 10i–k, the range of the training set is 0.9245~0.9474, the RMSE range is 0.30~0.43 m, and the rRMSE range is 3.58~5.83%. The range of the validation set is 0.9640~0.9857, the RMSE range is 0.28~0.31 m, and the rRMSE range is 2.66~4.21%. Figure 10l is obtained from a comprehensive analysis of the trees in the dataset. The value of training set is 0.9598, the RMSE is 0.37 m, and the rRMSE is 4.32%. The value of validation set is 0.9822, the RMSE is 0.30 m, and the rRMSE is 3.38%.
Therefore, the results involving Field_Height, Phone_Height, and LiDAR_Height indicate that the height of the trees extracted by the person-tree scale height measurement model are relatively accurate. The person–tree scale height measurement model constructed in this study based on a smartphone combined with YOLOv5 predicts the tree height of GB, CC, and YD tree species with high accuracy and low errors, reflecting good performance.
4. Conclusions and Discussion
In this study, a person–tree scale height measurement model that combines a smartphone with YOLOv5 and uses the principles of small-aperture imaging and scale is proposed. These principles correspond to the ratio of the actual height of a person to the pixel difference associated with the person in the imaging plane to achieve accurate measurements of tree height in urban forests, with values exceeding 0.97 and low relative error at less than 10.33%. Further analysis of three tree height-extraction methods for three tree species shows that there is no significant difference (Figure 12). Thus, the person–tree scale height measurement model performs well in extracting tree height, which is no different from the tree height obtained by traditional field survey and UAV-LiDAR.
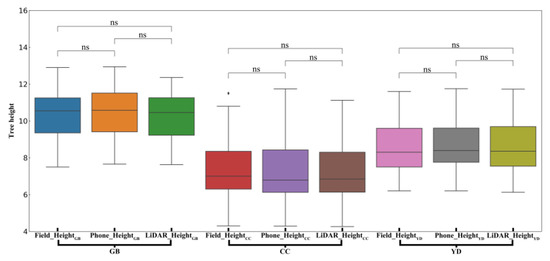
Figure 12.
Intergroup analysis of three tree species and three tree height-extraction methods. ns means nonsignificant.
By analyzing the tree height results for the validation set, it was found that the relative error was 8.00% or more for only 5 of the 33 trees in the validation set. Figure 13 shows the measurement results for YD4. The red boxes denote the main sources of error. The box used to encompass the tree in the model is a little large, resulting in Pix_H2 in Formula 6 being large. Weeds around the root of the tree block the image of the person, resulting in Pix_H2 in Formula 6 being small. Therefore, the measurement result for YD 4 is a little large.
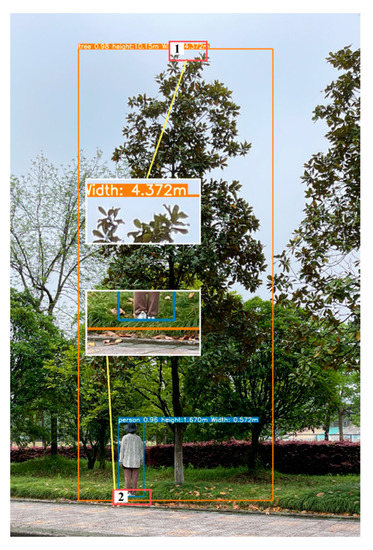
Figure 13.
The result for YD4. Box 1 and box 2 mark the main sources of error.
The main reasons for error are as follows. (1) When the person–tree images were acquired, the shooting distance was improper or the plane formed by the person and the tree to be measured was not parallel to the camera imaging plane. (2) The model did not accurately mark the person and the tree.
In other cases, the proposed altimetric model cannot successfully acquire a complete person–tree image in a limited space, and the measurement accuracy may be highly susceptible to the influence of the canopy when performing person–tree image acquisition [64]. In the actual measurement process, the location of a tree is most likely a street with a high traffic flow, and the tree height is likely large; therefore, the photographer must remain a certain distance from the target object to capture the entire tree. However, in the real space, this distance may not be achieved due to obstructions, and the acquisition of person-tree images will fail [65]. If the distance is achievable, the photographer may be located in the middle of the road, which increases the danger of operations. In addition, when acquiring a person–tree image, it is important to keep the plane formed by the person and the tree parallel to the camera imaging plane.
In addition, due to the hardware limitations of the monocular lens, the depth information cannot be effectively extracted in all cases, resulting in the height measurement model not being able to effectively distinguish between the tree to be measured and background trees. When creating the dataset, it was found that when capturing the 3D space in 2D images, the canopy of the tree to be measured and the canopy of background trees were similar in color, and it was difficult to distinguish their contours, which could not be marked effectively by using LabelImg, thus affecting the recognition accuracy of the trees in the altimetric model.
In summary, in future research on tree height extraction, a measuring distance function can be implemented for effective extraction of image depth information by using a binocular camera [66]. Additionally, YOLOv5 can be improved to use the extracted depth information to effectively exclude the interference from background trees when identifying trees and then process multiple tree images or videos to realize the fast and intelligent extraction of forest structure parameters such as tree height and crown canopy width without reference.
Author Contributions
Conceptualization, H.D.; data curation, J.X., F.M., D.Z. and Z.H.; formal analysis, J.X., H.D. and X.L.; funding acquisition, H.D., X.L. and F.M.; investigation, J.W., B.Z., Y.G., L.Z., C.X., J.C., Y.Z., C.C., C.T. and J.S.; supervision, G.Z., project administration, H.D., X.L. and G.Z.; Validation, X.L. and J.X.; writing—original draft preparation, J.X.; writing—review and editing, H.D. and X.L. All authors have read and agreed to the published version of the manuscript.
Funding
The authors gratefully acknowledge the support of the National Natural Science Foundation of China (U1809208, 32171785, 32201553), Leading Goose Project of Science Technology Department of Zhejiang Province (2023C02035).
Acknowledgments
The authors gratefully acknowledge the supports of various foundations. The authors are grateful to the editor and anonymous reviewers whose comments have contributed to improving the quality of this study.
Conflicts of Interest
The authors declare no conflict of interest.
References
- Rowntree, R.A. Ecology of the urban forest—Introduction to Part I. Urban Ecol. 1984, 8, 1–11. [Google Scholar] [CrossRef]
- Wang, C.; Cai, C.; Tao, K. The Concept, Range and Research Area of Urban Forest. World For. Res. 2004, 17, 23–27. [Google Scholar] [CrossRef]
- Wang, M.; Miao, R. The Conponents of Urban Forestry and Its Types. For. Res. 1997, 10, 531–536. [Google Scholar]
- Yang, J. Urban Forestry Planning and Management; China Forestry Publishing House: Beijing, China, 2012. [Google Scholar]
- Cai, S.; He, S.; Han, N.; Du, H. U-Net Neural Network Combined with Object-Oriented Urban Forest High-Score lmageInformation Extraction. Landsc. Archit. Acad. J. 2020, 28–37. [Google Scholar] [CrossRef]
- Qiu, Z.; Feng, Z.; Song, Y.; Li, M.; Zhang, P. Carbon sequestration potential of forest vegetation in China from 2003 to 2050: Predicting forest vegetation growth based on climate and the environment. J. Clean. Prod. 2020, 252, 119715. [Google Scholar] [CrossRef]
- Hu, Y.; Qi, R.; You, W.; Da, L. Ecological Service Functional Assessment on Forest Ecological System of Kunshan City. J. Nanjing For. Univ. 2005, 29, 111–114. [Google Scholar]
- Li, Z.; Zhong, J.; Sun, Z.; Yang, W. Spatial Pattern of Carbon Sequestration and Urban Sustainability: Analysis of Land-Use and Carbon Emission in Guang’an, China. Sustainability 2017, 9, 1951. [Google Scholar] [CrossRef]
- Iizuka, K.; Kosugi, Y.; Noguchi, S.; Iwagami, S. Toward a comprehensive model for estimating diameter at breast height of Japanese cypress (Chamaecyparis obtusa) using crown size derived from unmanned aerial systems. Comput. Electron. Agric. 2022, 192, 106579. [Google Scholar] [CrossRef]
- Fang, H.; Ye, Y.; Liu, W.; Wei, S.; Ma, L. Continuous estimation of canopy leaf area index (LAI) and clumping index over broadleaf crop fields: An investigation of the PASTIS-57 instrument and smartphone applications. Agric. For. Meteorol. 2018, 253, 48–61. [Google Scholar] [CrossRef]
- Qu, Y.; Wang, Z.; Shang, J.; Liu, J.; Zou, J. Estimation of leaf area index using inclined smartphone camera. Comput. Electron. Agric. 2021, 191, 106514. [Google Scholar] [CrossRef]
- Rudic, T.E.; McCulloch, L.A.; Cushman, K. Comparison of Smartphone and Drone Lidar Methods for Characterizing Spatial Variation in PAI in a Tropical Forest. Remote Sens. 2020, 12, 1765. [Google Scholar] [CrossRef]
- de Araújo Carvalho, M.; Junior, J.M.; Martins, J.A.C.; Zamboni, P.; Costa, C.S.; Siqueira, H.L.; Araújo, M.S.; Gonçalves, D.N.; Furuya, D.E.G.; Osco, L.P. A deep learning-based mobile application for tree species mapping in RGB images. Int. J. Appl. Earth Obs. Geoinf. 2022, 114, 103045. [Google Scholar]
- McRoberts, R.E.; Tomppo, E.O.; Næsset, E. Advances and emerging issues in national forest inventories. Scand. J. For. Res. 2010, 25, 368–381. [Google Scholar] [CrossRef]
- Wang, Y.; Lehtomäki, M.; Liang, X.; Pyörälä, J.; Kukko, A.; Jaakkola, A.; Liu, J.; Feng, Z.; Chen, R.; Hyyppä, J. Is field-measured tree height as reliable as believed—A comparison study of tree height estimates from field measurement, airborne laser scanning and terrestrial laser scanning in a boreal forest. ISPRS J. Photogramm. Remote Sens. 2019, 147, 132–145. [Google Scholar] [CrossRef]
- Song, J.; Zhang, X.; Song, W.; Chi, Z.; Yang, L.; Sun, H.; Li, Q. Measuring Standing Wood Height with Hemispherical Image. J. Northeast For. Univ. 2020, 48, 61–65. [Google Scholar]
- Ma, X.; Li, J.; Zhao, K.; Wu, T.; Zhang, P. Simulation of Spatial Service Range and Value of Carbon Sink Based on Intelligent Urban Ecosystem Management System and Net Present Value Models—An Example from the Qinling Mountains. Forests 2022, 13, 407. [Google Scholar] [CrossRef]
- Meng, X. Dendrometry; China Forestry Publishing House: Beijing, China, 2006. [Google Scholar]
- Husch, B.; Beers, T.W.; Jr, J.A.K. Forest Mensuration; John Wiley & Sons: Hoboken, NJ, USA, 2002. [Google Scholar]
- Laar, A.V.; Akça, A. Forest Mensuration; Springer Science & Business Media: Berlin/Heidelberg, Germany, 2007; Volume 13. [Google Scholar]
- Wang, Y.; Qin, Y.; Cui, J. Occlusion robust wheat ear counting algorithm based on deep learning. Front. Plant Sci. 2021, 12, 645899. [Google Scholar] [CrossRef]
- Zhang, X.; Zhang, J.; Duan, A. Tree-Height Growth Model for Chinese Fir Plantation Based on Bayesian Method. Sci. Silvae Sin. 2014, 50, 69–75. [Google Scholar]
- Liu, L.; Pang, Y.; Li, Z. Individual Tree DBH and Height Estimation Using Terrestrial Laser Scanning (TLS) in a Subtropical Forest. Sci. Silvae Sin. 2016, 52, 26–37. [Google Scholar]
- Wang, J.; Zhang, L.; Lv, C.; Niu, L. Tree Species Identification Methods Based on Point Cloud Data Using Ground-based LiDAR. Trans. Chin. Soc. Agric. Mach. 2018, 49, 180–188. [Google Scholar]
- Mikita, T.; Janata, P.; Surový, P. Forest stand inventory based on combined aerial and terrestrial close-range photogrammetry. Forests 2016, 7, 165. [Google Scholar] [CrossRef]
- Jaakkola, A.; Hyyppä, J.; Yu, X.; Kukko, A.; Kaartinen, H.; Liang, X.; Hyyppä, H.; Wang, Y. Autonomous collection of forest field reference—The outlook and a first step with UAV laser scanning. Remote Sens. 2017, 9, 785. [Google Scholar] [CrossRef]
- Noordermeer, L.; Bollandsås, O.M.; Ørka, H.O.; Næsset, E.; Gobakken, T. Comparing the accuracies of forest attributes predicted from airborne laser scanning and digital aerial photogrammetry in operational forest inventories. Remote Sens. Environ. 2019, 226, 26–37. [Google Scholar] [CrossRef]
- Luo, H.; Khoshelham, K.; Chen, C.; He, H. Individual tree extraction from urban mobile laser scanning point clouds using deep pointwise direction embedding. ISPRS J. Photogramm. Remote Sens. 2021, 175, 326–339. [Google Scholar] [CrossRef]
- Corte, A.P.D.; Rex, F.E.; Almeida, D.R.A.d.; Sanquetta, C.R.; Silva, C.A.; Moura, M.M.; Wilkinson, B.; Zambrano, A.M.A.; Neto, E.M.d.C.; Veras, H.F. Measuring individual tree diameter and height using GatorEye High-Density UAV-Lidar in an integrated crop-livestock-forest system. Remote Sens. 2020, 12, 863. [Google Scholar] [CrossRef]
- Xu, Z.; Liu, H.; Chen, Y.; Chen, Q.; Li, H.; Wang, J. Outer Upper Crown Profile Simulation and Visualization for Cunninghamia lanceolata Based on UAV-borne LiDAR Data. For. Res. 2021, 34, 40–48. [Google Scholar]
- Sankey, T.; Donager, J.; McVay, J.; Sankey, J.B. UAV lidar and hyperspectral fusion for forest monitoring in the southwestern USA. Remote Sens. Environ. 2017, 195, 30–43. [Google Scholar] [CrossRef]
- Liang, X.; Hyyppä, J.; Kaartinen, H.; Lehtomäki, M.; Pyörälä, J.; Pfeifer, N.; Holopainen, M.; Brolly, G.; Francesco, P.; Hackenberg, J. International benchmarking of terrestrial laser scanning approaches for forest inventories. ISPRS J. Photogramm. 2018, 144, 137–179. [Google Scholar] [CrossRef]
- Mohamed, N.; Al-Jaroodi, J.; Jawhar, I.; Idries, A.; Mohammed, F. Unmanned aerial vehicles applications in future smart cities. Technol. Forecast. Soc. Chang. 2020, 153, 119293. [Google Scholar] [CrossRef]
- Chen, X.; Xu, A. Height extraction method of multiple standing trees based on monocular vision of smart phones. J. Beijing For. Univ. 2020, 42, 43–52. [Google Scholar]
- Wu, X.; Xu, A.; Yang, T. Passive measurement method of tree height and crown diameter using a smartphone. IEEE Access 2020, 8, 11669–11678. [Google Scholar]
- Zhang, D.-Y.; Luo, H.-S.; Wang, D.-Y.; Zhou, X.-G.; Li, W.-F.; Gu, C.-Y.; Zhang, G.; He, F.-M. Assessment of the levels of damage caused by Fusarium head blight in wheat using an improved YoloV5 method. Comput. Electron. Agric. 2022, 198, 107086. [Google Scholar] [CrossRef]
- Tian, Y.; Feng, Z.; Chang, C. Research and Experiment of Dendrometer with Walking Stick. J. Agric. Sci. Technol. 2021, 23, 78–85. [Google Scholar] [CrossRef]
- Fan, G.; Dong, Y.; Chen, D.; Chen, F. New Method for Forest Resource Data Collection Based on Smartphone Fusion with Multiple Sensors. Mob. Inf. Syst. 2020, 2020, 5736978. [Google Scholar] [CrossRef]
- Redmon, J.; Farhadi, A. YOLO9000: Better, faster, stronger. In Proceedings of the IEEE Conference on Computer Vision and Pattern Recognition, Honolulu, HI, USA, 21–26 July 2017; pp. 7263–7271. [Google Scholar]
- Glenn, J. YOLOv5 Release v5.0. 2021. Available online: http://github.com/ultralytics/yolov5 (accessed on 13 May 2021).
- Zhu, X.; Lyu, S.; Wang, X.; Zhao, Q. TPH-YOLOv5: Improved YOLOv5 based on transformer prediction head for object detection on drone-captured scenarios. In Proceedings of the IEEE/CVF International Conference on Computer Vision, Montreal, QC, Canada, 10–17 October 2021; pp. 2778–2788. [Google Scholar]
- Singh, B.; Kaur, P.; Singh, R.; Ahuja, P. Biology and chemistry of Ginkgo biloba. Fitoterapia 2008, 79, 401–418. [Google Scholar] [CrossRef]
- Feng, Z.; Niu, J.; Zhang, W.; Wang, X.; Yao, F.; Tian, Y. Effects of ozone exposure on sub-tropical evergreen Cinnamomum camphora seedlings grown in different nitrogen loads. Trees 2011, 25, 617–625. [Google Scholar] [CrossRef]
- Isagi, Y.; Kanazashi, T.; Suzuki, W.; Tanaka, H.; Abe, T. Microsatellite analysis of the regeneration process of Magnolia obovata Thunb. Heredity 2000, 84, 143–151. [Google Scholar] [CrossRef]
- Bochkovskiy, A.; Wang, C.-Y.; Liao, H.-Y.M. Yolov4: Optimal speed and accuracy of object detection. arXiv 2020, arXiv:2004.10934. [Google Scholar]
- Yang, G.; Feng, W.; Jin, J.; Lei, Q.; Li, X.; Gui, G.; Wang, W. Face mask recognition system with YOLOV5 based on image recognition. In Proceedings of the 2020 IEEE 6th International Conference on Computer and Communications (ICCC), Chengdu, China, 11–14 December 2020; pp. 1398–1404. [Google Scholar]
- Long, Y.; Lei, R.; Dong, Y.; Li, D.; Zhao, C. YOLOv5 based on Aircraft Type Detection from Remotely Sensed Optical Images. J. Geo-Inf. Sci. 2022, 24, 572–582. [Google Scholar]
- Xu, R.; Lin, H.; Lu, K.; Cao, L.; Liu, Y. A forest fire detection system based on ensemble learning. Forests 2021, 12, 217. [Google Scholar] [CrossRef]
- Yan, B.; Fan, P.; Lei, X.; Liu, Z.; Yang, F. A real-time apple targets detection method for picking robot based on improved YOLOv5. Remote Sens. 2021, 13, 1619. [Google Scholar] [CrossRef]
- Gu, Y.; Wang, S.; Yan, Y.; Tang, S.; Zhao, S. Identification and Analysis of Emergency Behavior of Cage-Reared Laying Ducks Based on YoloV5. Agriculture 2022, 12, 485. [Google Scholar] [CrossRef]
- He, Y.; Chen, D.; Peng, L. Research on object detection algorithm of economic forestry pests based on improvedYOLOv5. J. Chin. Agric. Mech. 2022, 43, 106–115. [Google Scholar] [CrossRef]
- He, K.; Zhang, X.; Ren, S.; Sun, J. Spatial pyramid pooling in deep convolutional networks for visual recognition. IEEE Trans. Pattern Anal. Mach. Intell. 2015, 37, 1904–1916. [Google Scholar] [CrossRef] [PubMed]
- He, K.; Zhang, X.; Ren, S.; Sun, J. Deep Residual Learning for Image Recognition. In Proceedings of the IEEE Conference on Computer Vision Pattern Recognition, Las Vegas, NV, USA, 27–30 June 2016. [Google Scholar]
- Wang, C.-Y.; Liao, H.-Y.M.; Wu, Y.-H.; Chen, P.-Y.; Hsieh, J.-W.; Yeh, I.-H. CSPNet: A new backbone that can enhance learning capability of CNN. In Proceedings of the IEEE/CVF Conference on Computer Vision and Pattern Recognition Workshops, Seattle, WA, USA, 14–19 June 2020; pp. 390–391. [Google Scholar]
- Lin, T.-Y.; Dollár, P.; Girshick, R.; He, K.; Hariharan, B.; Belongie, S. Feature pyramid networks for object detection. In Proceedings of the IEEE Conference on Computer Vision and Pattern Recognition, Honolulu, HI, USA, 21–26 July 2017; pp. 2117–2125. [Google Scholar]
- Liu, S.; Qi, L.; Qin, H.; Shi, J.; Jia, J. Path aggregation network for instance segmentation. In Proceedings of the IEEE Conference on Computer Vision and Pattern Recognition, Salt Lake City, UT, USA, 18–23 June 2018; pp. 8759–8768. [Google Scholar]
- Neubeck, A.; Gool, L.V. Efficient non-maximum suppression. In Proceedings of the 18th International Conference on Pattern Recognition (ICPR’06), Hong Kong, China, 20–24 August 2006; pp. 850–855. [Google Scholar]
- Zheng, Z.; Wang, P.; Liu, W.; Li, J.; Ye, R.; Ren, D. Distance-IoU loss: Faster and better learning for bounding box regression. In Proceedings of the AAAI Conference on Artificial Intelligence, New York, NY, USA, 7–12 February 2020; pp. 12993–13000. [Google Scholar]
- Bragg, D.C. Accurately measuring the height of (real) forest trees. J. For. 2014, 112, 51–54. [Google Scholar] [CrossRef]
- Moe, K.T.; Owari, T.; Furuya, N.; Hiroshima, T. Comparing individual tree height information derived from field surveys, LiDAR and UAV-DAP for high-value timber species in Northern Japan. Forests 2020, 11, 223. [Google Scholar] [CrossRef]
- Imai, Y.; Setojima, M.; Yamagishi, Y.; Fujiwara, N. Tree-Height Measuring Characteristics of Urban Forests by LiDAR Data Different in Resolution; International Society for Photogrammetry Remote Sensing: Boca Raton, FL, USA, 2004; pp. 1–4. [Google Scholar]
- Sibona, E.; Vitali, A.; Meloni, F.; Caffo, L.; Dotta, A.; Lingua, E.; Motta, R.; Garbarino, M. Direct measurement of tree height provides different results on the assessment of LiDAR accuracy. Forests 2016, 8, 7. [Google Scholar] [CrossRef]
- Ganz, S.; Käber, Y.; Adler, P. Measuring Tree Height with Remote Sensing—A Comparison of Photogrammetric and LiDAR Data with Different Field Measurements. Forests 2019, 10, 694. [Google Scholar] [CrossRef]
- Yang, K.; Zhao, Y.; Zhang, J.; Chen, C.; Zhao, P. Tree height extraction using high-resolution imagery acquired from an unmanned aerial vehicle (UAV). J. Beijing For. Univ. 2017, 39, 17–23. [Google Scholar] [CrossRef]
- Zhao, F.; Feng, Z.; Gao, X.; Zhen, J.; Wang, Z. Measure method of tree height and volume using total station under canopy cover condition. Trans. Chin. Soc. Agric. Eng. 2014, 30, 182–190. [Google Scholar]
- Shen, T.; Liu, W.; Wang, J. Distance measurement system based on binocular stereo vision. Electron. Meas. Technol. 2015, 38, 52–54. [Google Scholar] [CrossRef]
Disclaimer/Publisher’s Note: The statements, opinions and data contained in all publications are solely those of the individual author(s) and contributor(s) and not of MDPI and/or the editor(s). MDPI and/or the editor(s) disclaim responsibility for any injury to people or property resulting from any ideas, methods, instructions or products referred to in the content. |
© 2022 by the authors. Licensee MDPI, Basel, Switzerland. This article is an open access article distributed under the terms and conditions of the Creative Commons Attribution (CC BY) license (https://creativecommons.org/licenses/by/4.0/).