1. Introduction
Satellite altimetry has the ability to periodically detect land and ocean changes with high accuracy. It has irreplaceable advantages in studying the global gravity field model, sea level changes and large-scale seabed topographies [
1,
2]. A satellite radar altimeter can directly measure the instantaneous distance from the satellite to the nadir point, which is important as, ideally, the sea surface height (SSH) can be obtained by subtracting the measured instantaneous distance from the satellite’s ellipsoidal height. However, an altimeter is a complex measuring system that can be affected by many errors. Satellite orbit determination errors have been the main error source for altimetry data in previous studies. With the development of precision orbit determination technology, the radial orbit accuracy provided by the Jason-2 satellite’s GDR data can currently reach 2 cm [
3]; however, the RMS of its sea state bias (SSB) is also approximately 2 cm [
4]. Therefore, SSB has become one of the largest error sources in satellite altimetry. Consequently, the precise SSB model developed, which can improve the accuracy of satellite altimetry, is of great significance in establishing a sea surface model and for determining marine geoid and bathymetry.
Previous scholars have studied the theoretical model and empirical model of SSB [
5,
6,
7,
8,
9,
10,
11]. They found that the parameters of the SSB theoretical model were difficult to obtain, and the process of deducing the SSB theoretical model was complicated. Therefore, the empirical model has been studied and explored. Based on the satellite and data sets, the parameters of the model have been proposed [
12,
13]. Passaro et al. (2018) considered that the SSB correction should be directly applied to the 20 Hz data to reduce the effect of noise [
14]. Peng et al. (2020) used two different retrackers to retrack the altimeter waveform and recalculate the SSB correction of high frequency to improve the accuracy of the regional parameter model [
15]. However, the model parameters were determined to minimize the variance of the SSH differences at crossover points or along collinear tracks. This difference proved to be the result of the inevitably imperfect specification of the model’s parametric form, which corrupted the calibration process when performed on the SSH differences rather than directly on the SSH measurements [
16].
To solve this problem, a non-parametric model was proposed. The calculation process of non-parametric models proposed earlier is very complex and inefficient, and the obtained results still show changes related to significant wave height [
16]. In order to improve it, different solutions were put forward [
17,
18,
19,
20,
21]. Jiang (2018) introduced the average wave period data of ERA-interim, which were taken from the European Centre for Medium-Range Weather Forecasts (ECMWF), to construct a three-dimensional non-parametric model of SSB [
22]. However, the calculation process of the three-dimensional SSB model was more complicated, which requires limiting the resolution of the wave model, and the obtained average wave period could only be used after interpolation in time and space, respectively. Therefore, it had not been widely used in satellite altimetry.
In order to improve computing efficiency, Zhong et al. (2018) introduced an effective and efficient linear model called LASSO to the SSB estimation [
23]. In ref. [
24], taking account of the data from multiple radar altimeters available, Zhong et al. (2020) introduced a multi-task learning method called trace-norm regularized multi-task learning (TNR-MTL) for SSB estimation. In order to weaken the influence of SSB, many scholars directly processed sea state signals [
25,
26,
27]. Until now, the non-parametric model commonly used in GDR data was constructed by collinear data. The kernel smoothing method was used to construct the non-parametric model to calculate the correction of SSB in GDR of the Jason-1/Jason-2 altimeter [
19]. Compared to the crossover data used in this paper, the amount of collinear data was enormous, and it contained redundant information.
In this study, the non-parametric regression estimation model was optimized by using the method of parameter replacement of ascending and descending tracks based on the crossover data. Compared with collinear data used in SSB’s conventional processing strategy (GDR data), the crossover point data in this paper can better eliminate some errors that did not change with time in a short time. This method used the significant wave height of Jason-2 altimeter during cycle 200–301 and wind speed from the ERA5 reanalysis data, combined with local linear regression, the Epanechnikov kernel function and local window width. On the basis of these data, we then used the Taylor series expansion to construct a polynomial model for SSB with six parameters. These two models were validated with the crossover SSHs and tide gauge records. They were then used to correct the data from the Jason-2 altimeter to estimate the global along-track geoid gradient and the sea level change rate more accurately.
2. Nonparametric Model Estimation
2.1. SSH Noise Processing
The sea surface height (SSH) can be measured by the altimeter. A raw SSH′, without SSB correction, contains the geoid height,
; dynamic ocean topography, η; and other altimeter errors,
. The
includes all instrumental and geophysical error corrections, except for SSB. The SSH′ can be expressed as follows:
Crossover SSH difference can eliminate the geoid height [
1] and part of the dynamic ocean topography. The SSH′ at the intersection can be expressed as follows:
where
is the time-varying dynamic ocean topography.
includes residual error terms for many height measurement error corrections but not for SSB. The altimetry errors are mainly instrument errors, tropospheric dry delay errors, tropospheric wet delay errors, ionospheric delay errors, ocean tide errors, polar tide errors, solid earth tide errors, loading tide errors and dynamic atmosphere errors.
2.2. Methodology
The SSB can be expressed as an arbitrary function [
16], as follows:
where
represents the
variables related to
SSB.
represents the two-dimensional variable of SWH and U, i.e.,
.
in Equation (2) can be expressed as a noise term,
, with zero mean values. Therefore, we can express it as follows:
where subscripts 1 and 2 represent observations on the ascending and descending orbits of crossover points, respectively. Then,
, Equation (4) can be rewritten as follows:
Under the given condition of
, the conditional expectation of y is as follows:
The regression function is , where is an arbitrary random scalar variable, jointly distributed with x.
Using the joint regression estimator, based on the crossover data
observed by the radar altimeter, Equation (6) can be rewritten as follows:
where
is the total number of crossover data; subscripts 1 and 2 still indicate crossover observations at epoch
and
; and subscript
represents the value at the
-th crossover point.
To estimate
,
can be substituted into Equation (7), to produce the following:
Equation (8) can be expressed as a matrix form, as follows:
where
is an
identity matrix,
is an
matrix with an element of
,
, and
.
Because is a singular matrix, cannot be solved in the linear system equation (Equation (9)).
To eliminate this uncertainty, we can set an arbitrary reasonable value for
, such as
. Equation (9) can be rewritten as follows:
in which
is constructed from
elements in
, that is,
.
and
are matrix divisions of
, in which
is the first column of Ι − A and
represents the remaining columns of Ι − A. Therefore, the n equations with n − 1 unknowns can be solved with the least squares method, as follows:
can be solved based on Equation (11), which can be plus to determine the crossover SSB measurement value of the ascending track.
To complete this, can be substituted into Equation (7) to obtain the non-parametric regression estimation of SSB under any SWH and wind speed.
2.3. Key Factors of Nonparametric Regression Estimation
The key factors of non-parametric regression estimation mainly include the selection of the regression estimator, the kernel function and the window width. This introduces the local linear regression estimation, the Epanechnikov kernel function and local window width.
- (1)
Local linear regression estimation
Assuming that
groups of observation data
are given, in which
contains
-related variables, and
obey the following relation [
28,
29,
30]:
where
is the random error, and
is a regression function of
, with respect to
.
Assuming that
has the derivative of order
at
, and
is in the local neighborhood of
, the Taylor series expansion of
is as follows:
where
represents the number of observation data, and
represents the number of variables related to
. A group
should be selected to generate the following:
in which
is the kernel function that describes the weight function
. Based on the locally weighted least squares theory, Equation (14) can be solved to obtain the following:
where
is a
diagonal-weighted matrix, that is,
;
, and
.
The local linear regression estimation of
is
, and the other components
are the estimations of the first-order partial derivative in Equation (13). Therefore, the LLR estimation is specifically expressed as follows:
where
is a
unit vector, that is,
.
There is a significant amount of altimetry data that leads to the complexity of the matrix operation and the need to solve large equations. The kernel function controls the number of data points used in non-parametric regression estimation operations and holds computational efficiency. If the measurement values of
and
are very far apart, the weight,
, is actually very small. In this case, other kernel functions, such as the Gaussian kernel, are not exactly zero, and so weight
will still participate in the calculation. In this case, the Gaussian kernel function will reduce the calculation efficiency of the matrix. The Epanechnikov kernel function can reduce the computational burden [
31,
32] and so was used in the study. The Epanechnikov kernel function is as follows:
where
is the number of measurement observations,
is the window width of wind speed, and
is the window width of SWH.
The determination of window width has an important influence on the non-parametric regression estimation. If the window width is too large, the result will be excessively smooth, causing excessive modeling deviation. If the window width is too small, a large number of wrong peaks will be caused, which would result in the data not being smooth enough [
33,
34].
The selection of window width depends on the specific distribution of altimetry data. The local window width, which changes with the location of the data points, was selected in this study. Combined with the Epanechnikov kernel function, the SWH and wind speed, which are the relevant variables of SSB, are present with a grid of (0.25, 0.25). The window width modulation is the density function at the grid point [
17], as follows:
where
refers to the reference window width,
is the number of satellite observations in the grid, and
is the average number of grid observations greater than one.
6. Conclusions
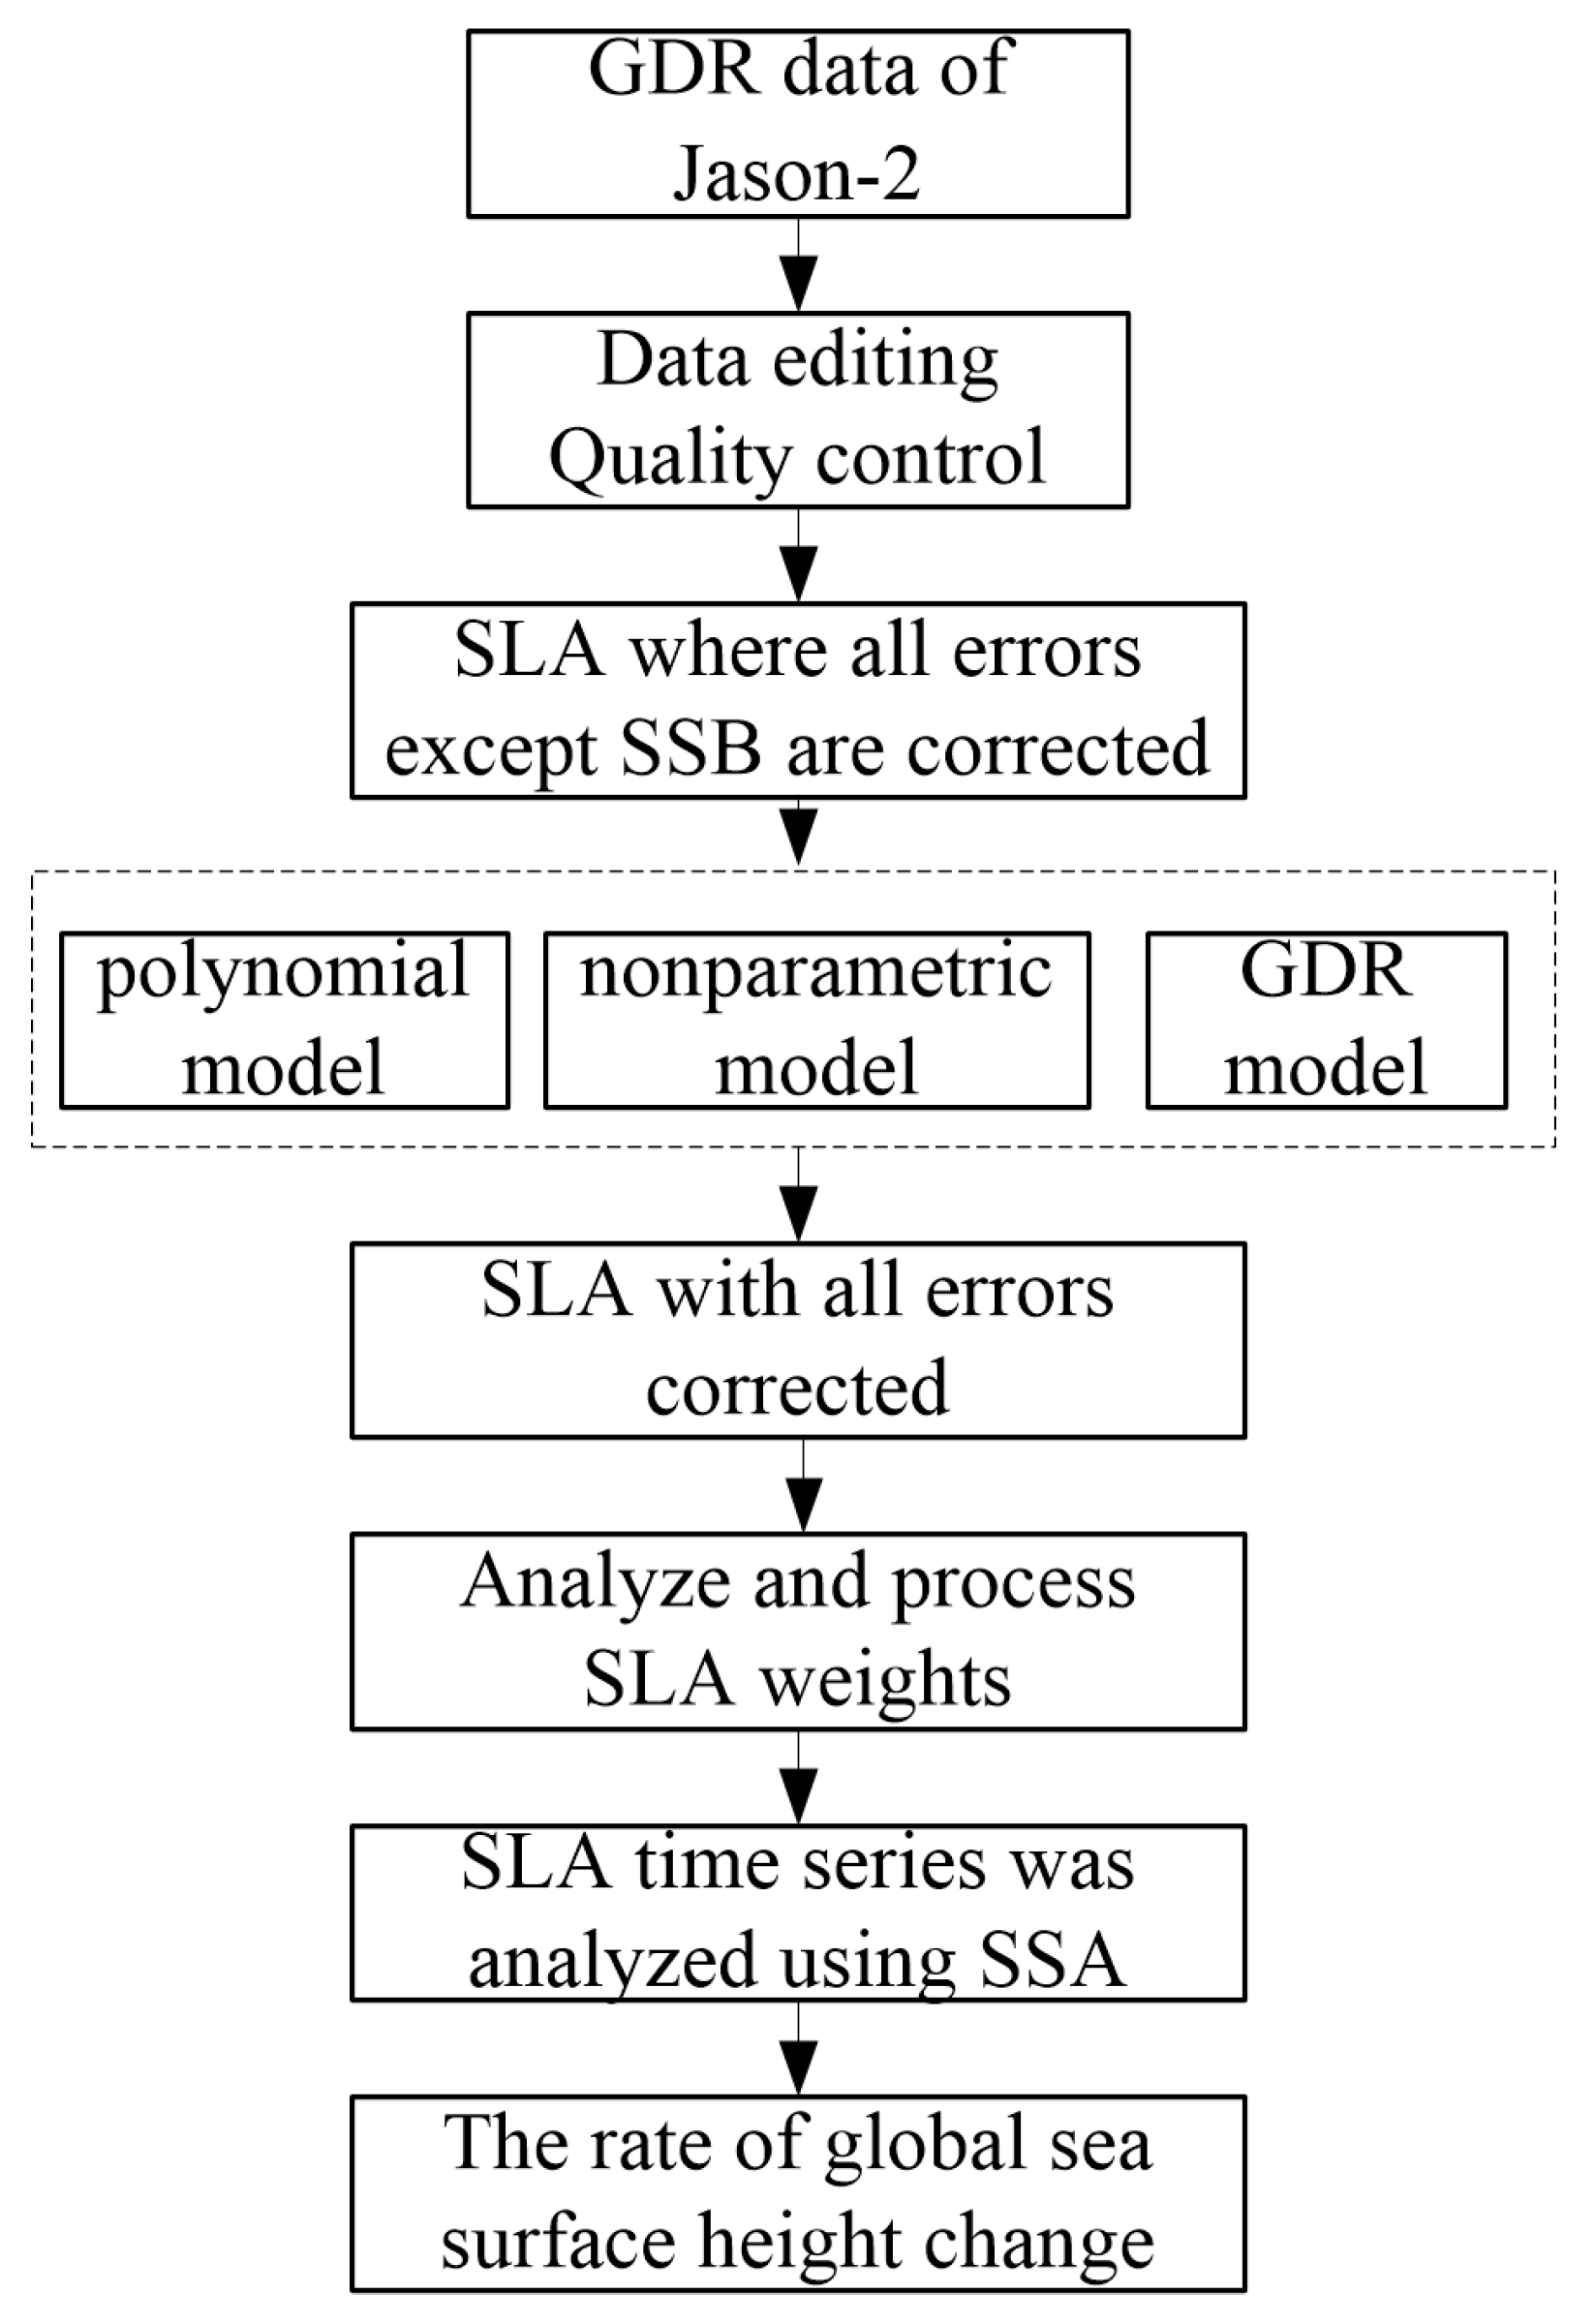
The Jason-2 GDR data and the ERA5 reanalysis data were used to study the SSB corrections based on crossover data. A parametric SSB model and a non-parametric SSB model for correcting the Jason-2 altimeter data were built in this study. The precision analysis and application of the two models were also determined in this study. The non-parametric regression estimation model, based on SWH and wind speed, improved the SSH accuracy of the Jason-2 altimeter’s data.
Based on the 1-Hz, Ku-band GDR data from cycle201 to cycle300 of the Jason-2 altimeter and the wind speed of ERA5, the LLR estimator, the Epanechnikov kernel function and the local window width were selected to construct the non-parametric regression estimation method.
Based on the Taylor expansion, 32 types of polynomial SSB models were constructed by using the 1-Hz GDR data from cycle201–cycle300 in the Ku band of the Jason-2 altimeter, with the SWH and wind speed as variables. These polynomial models were tested for the determination coefficient. The larger the determination coefficient, the higher the goodness of fit of the model. Among the 32 models, the polynomial model with six parameters had the largest determination coefficient, which indicated that the polynomial model with six parameters had the highest goodness of fit. Therefore, the optimal model was the polynomial model with six parameters.
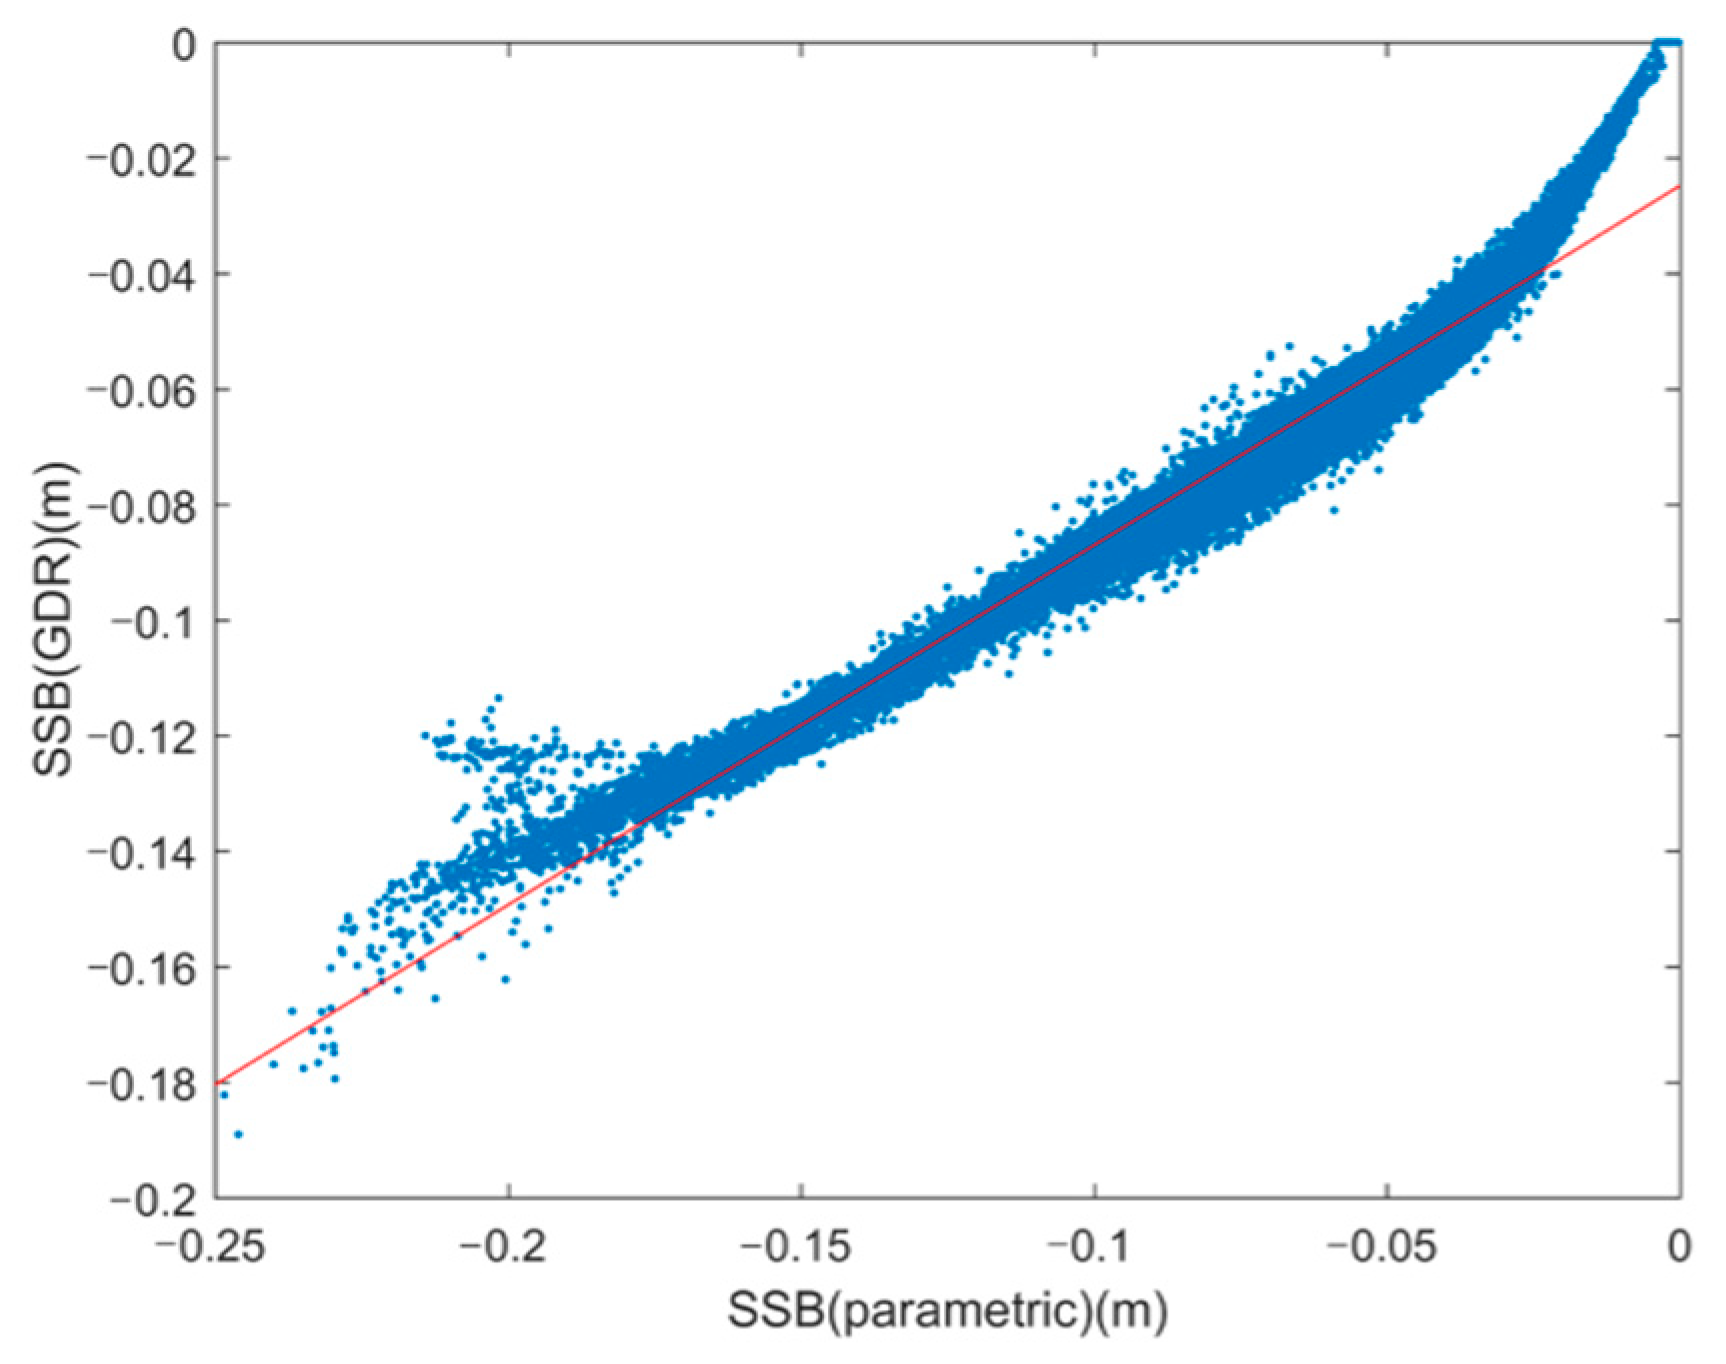
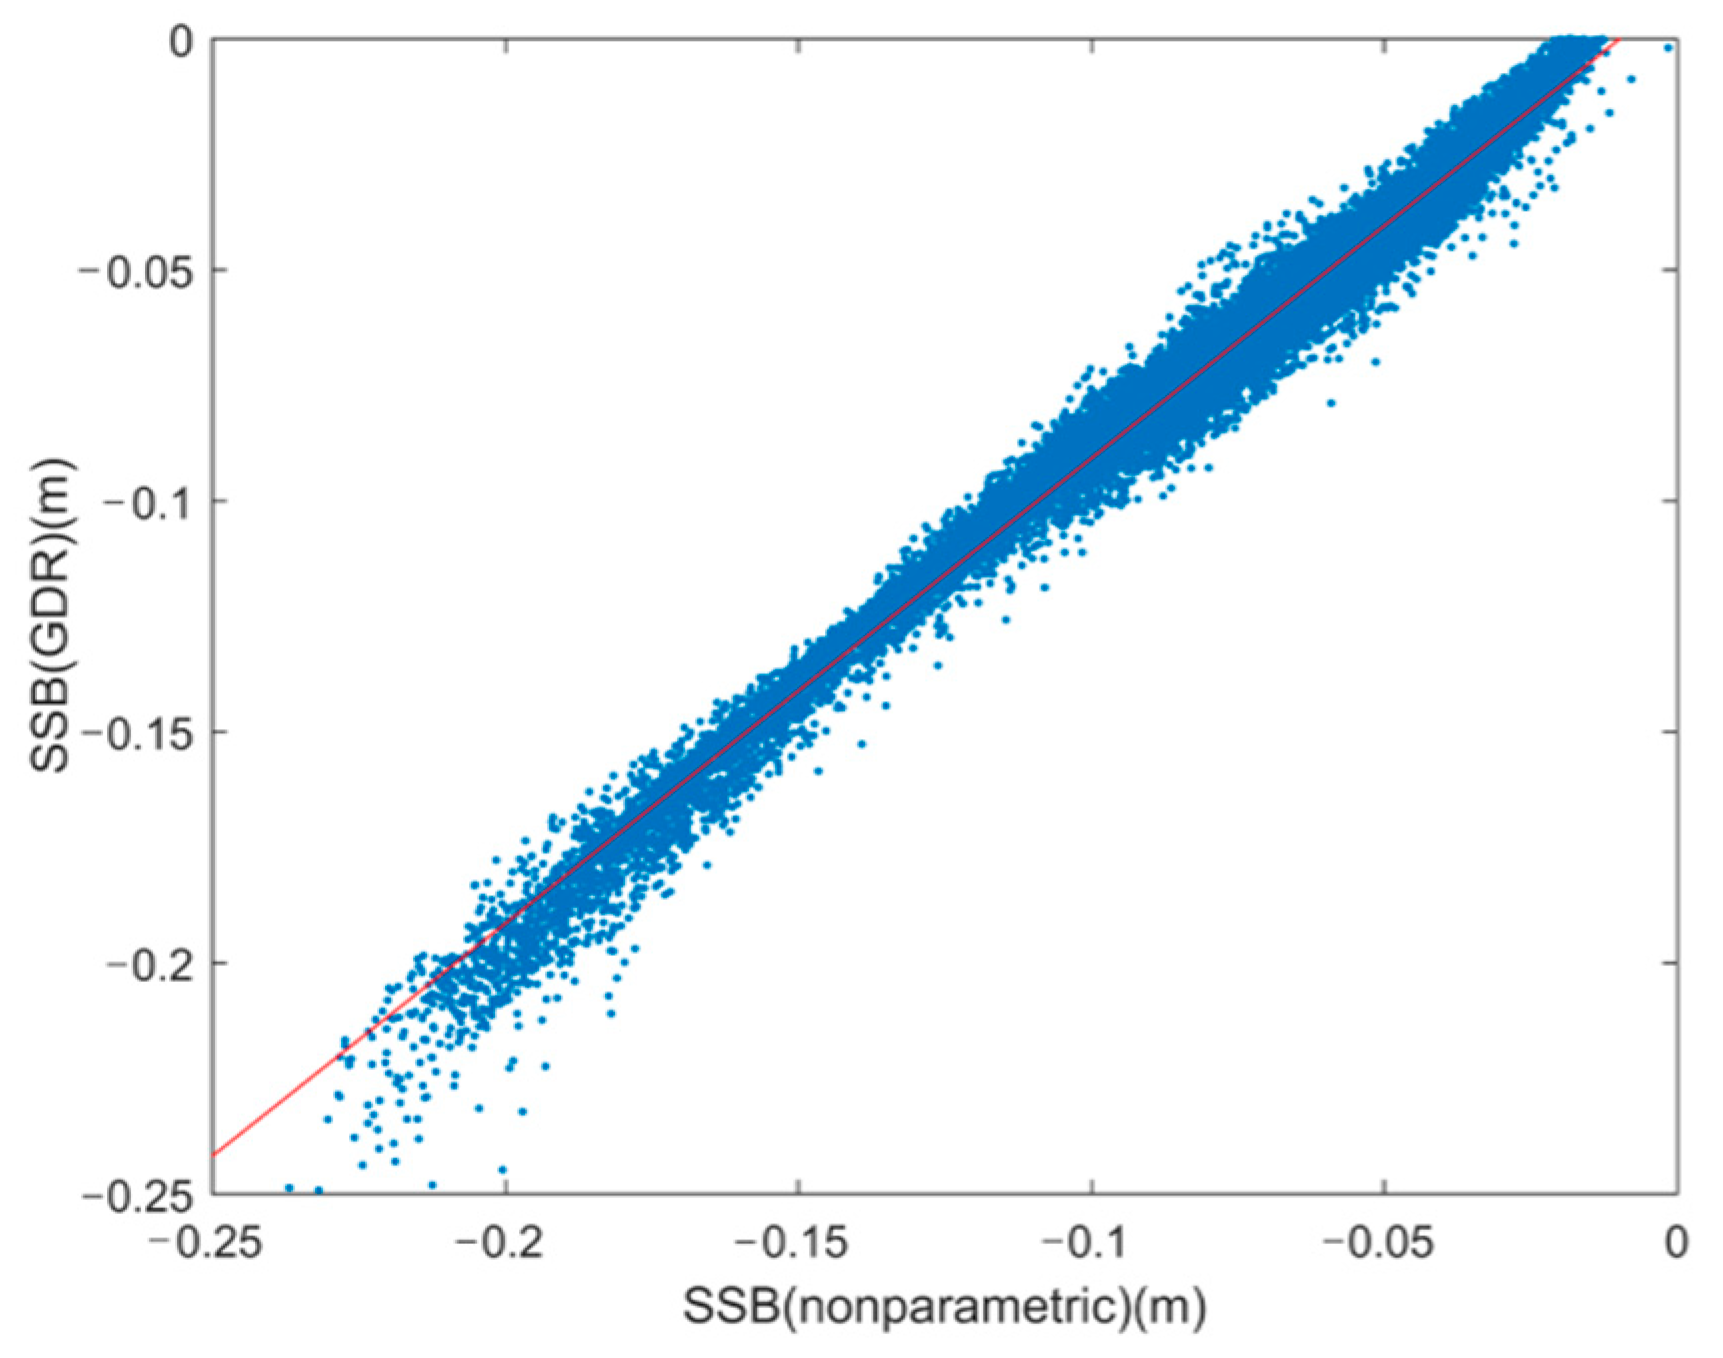
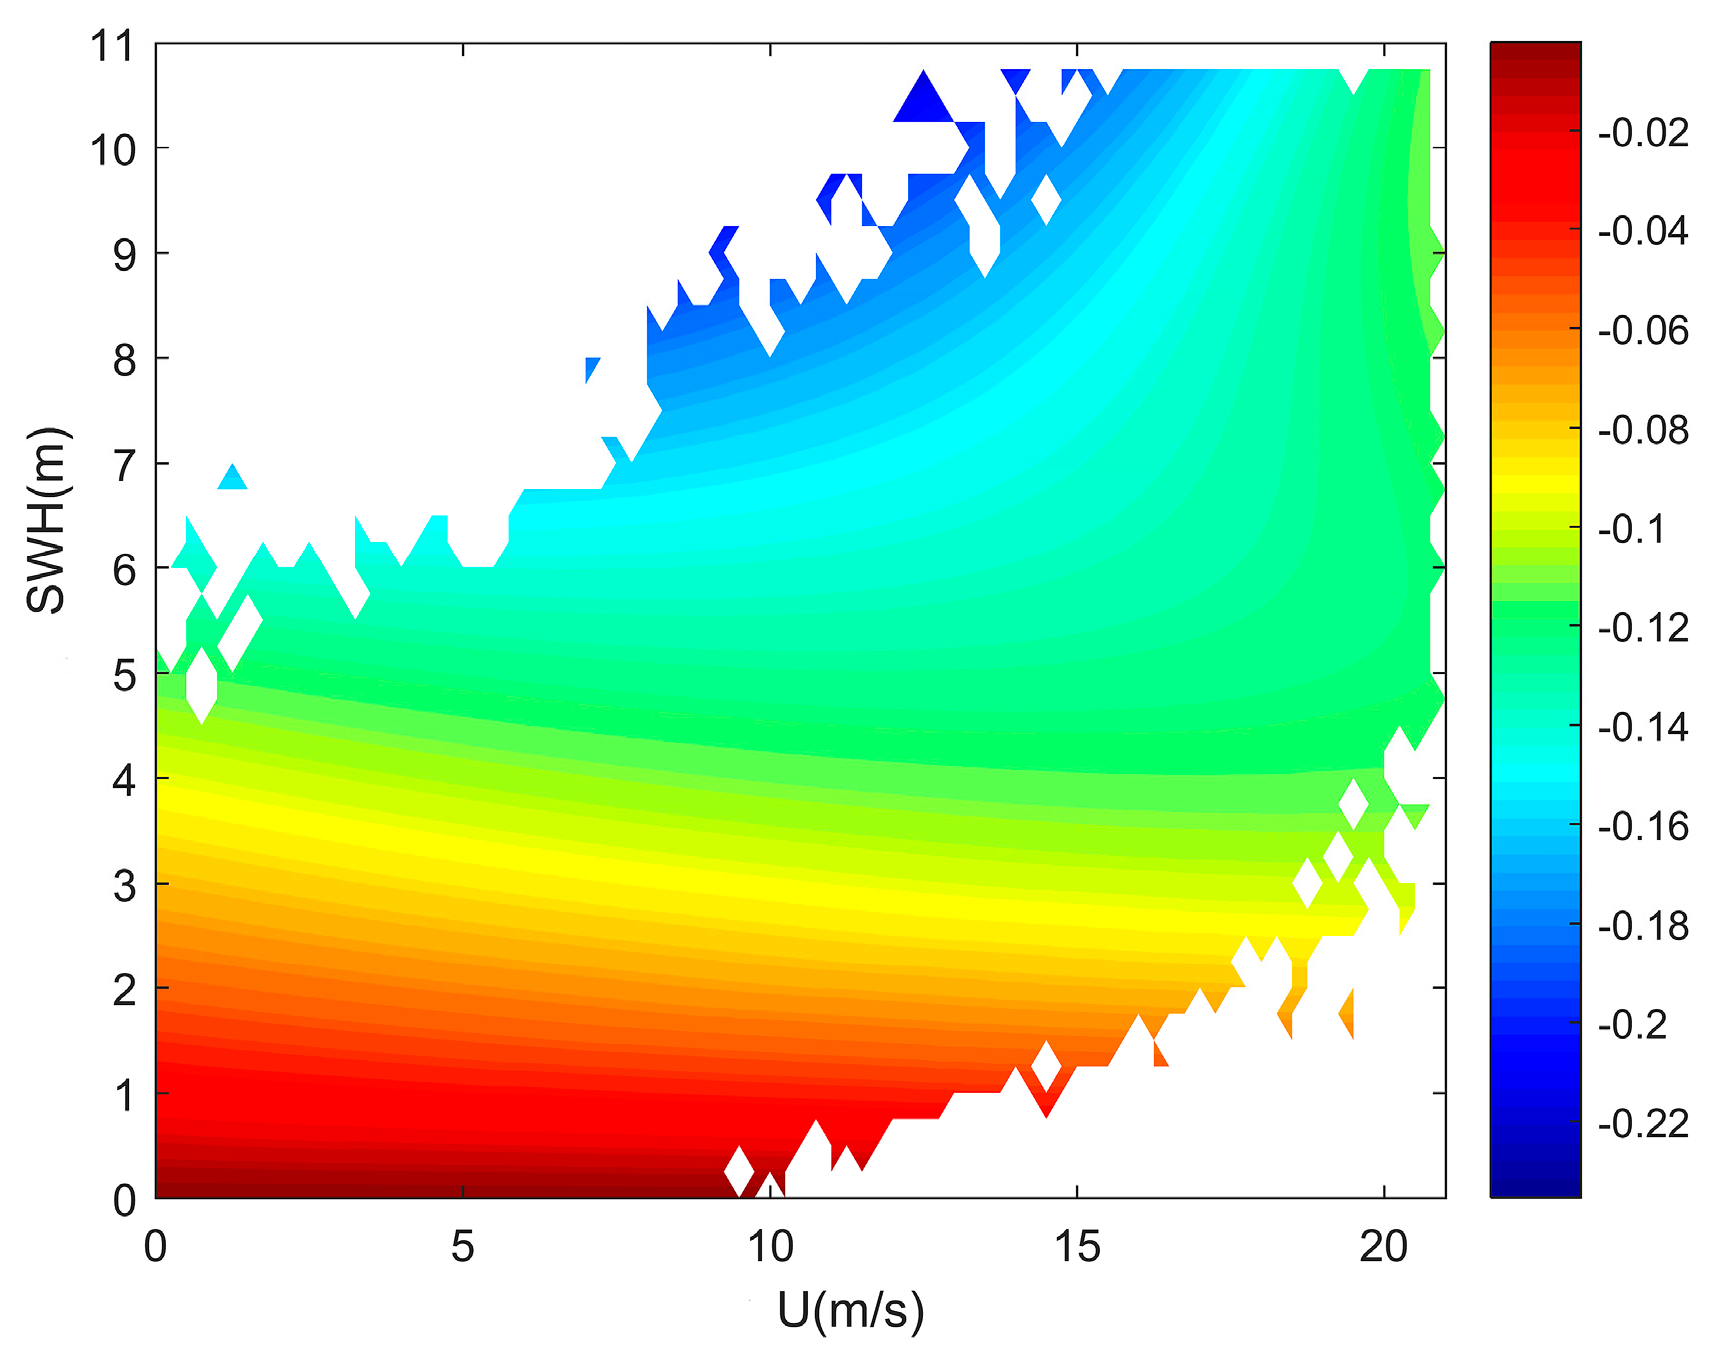
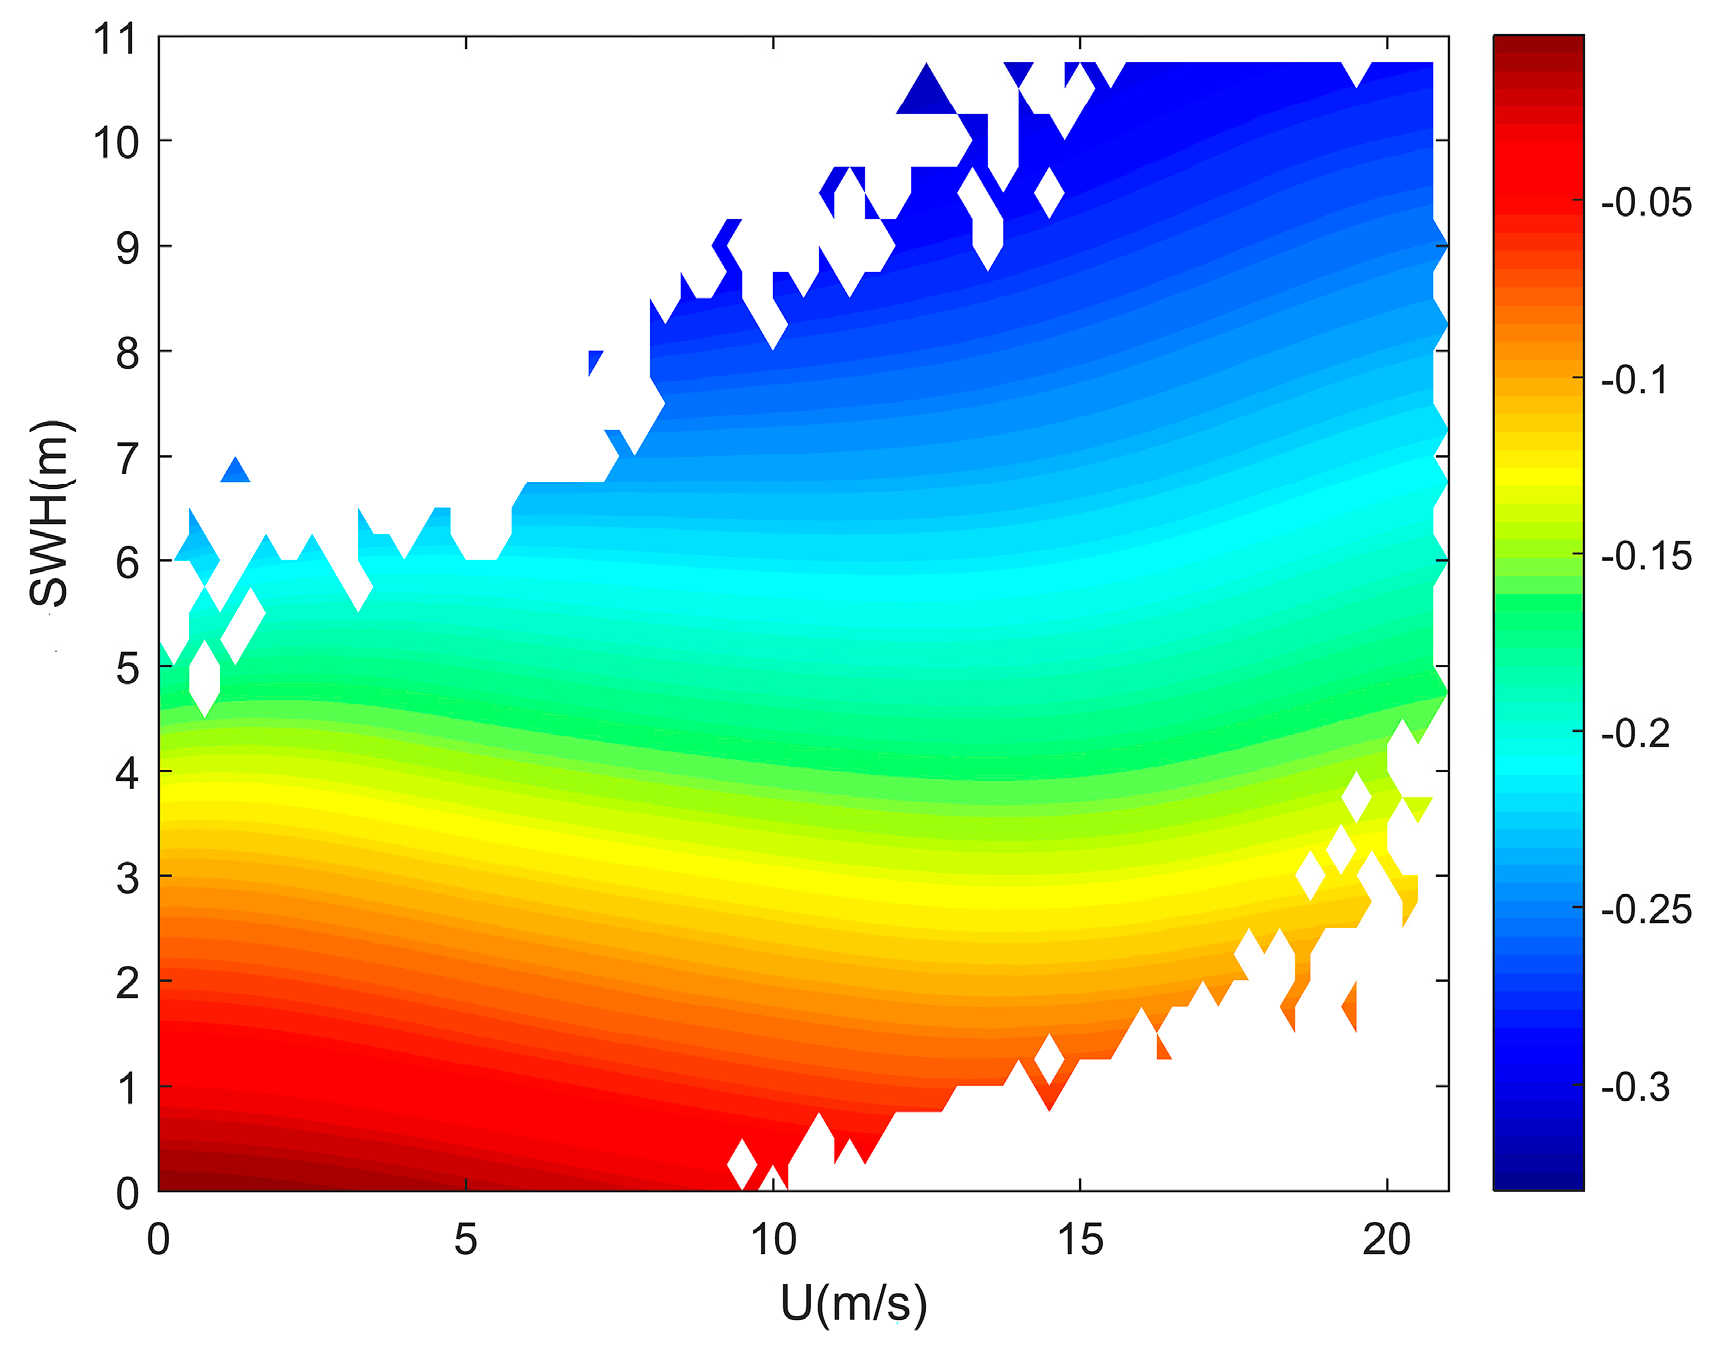
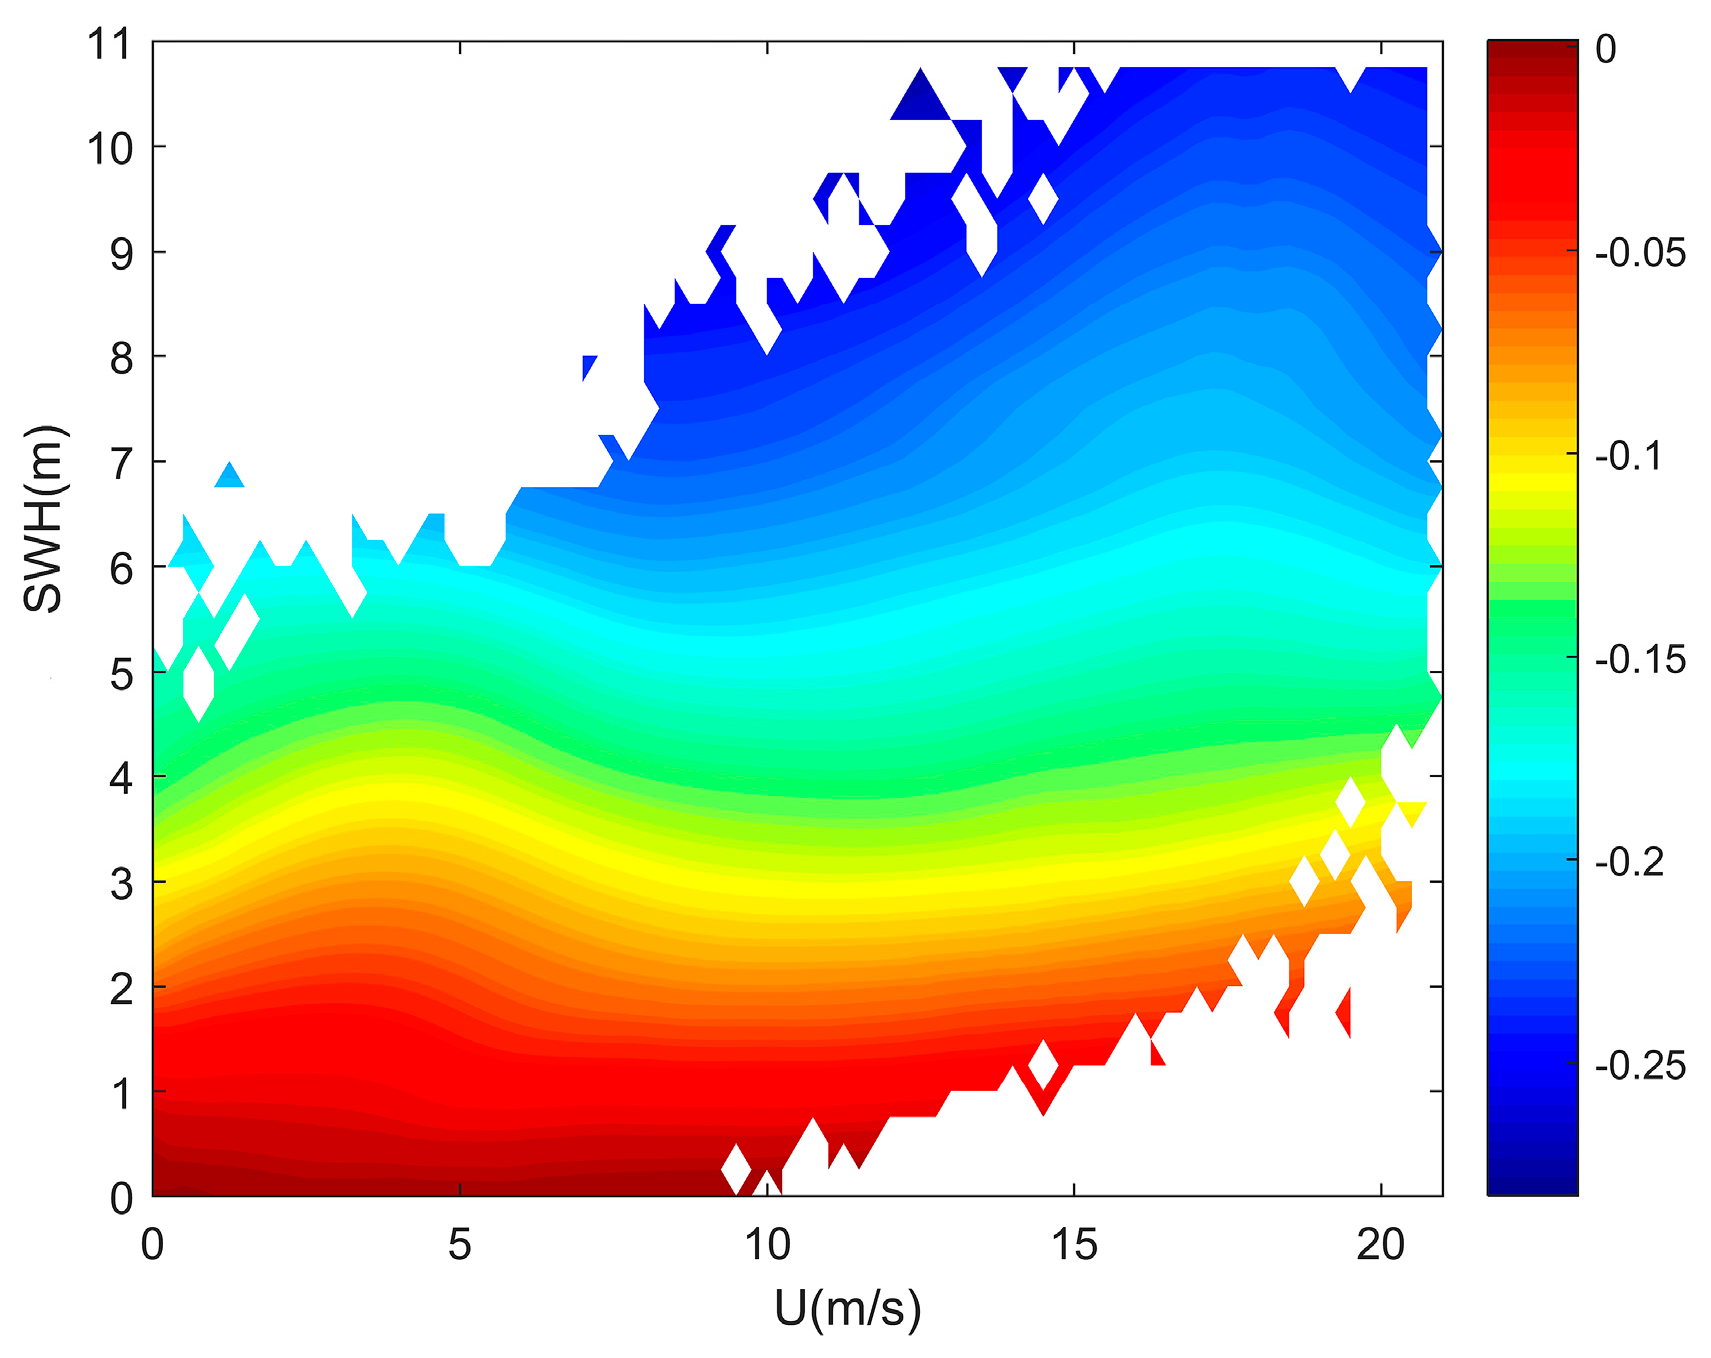
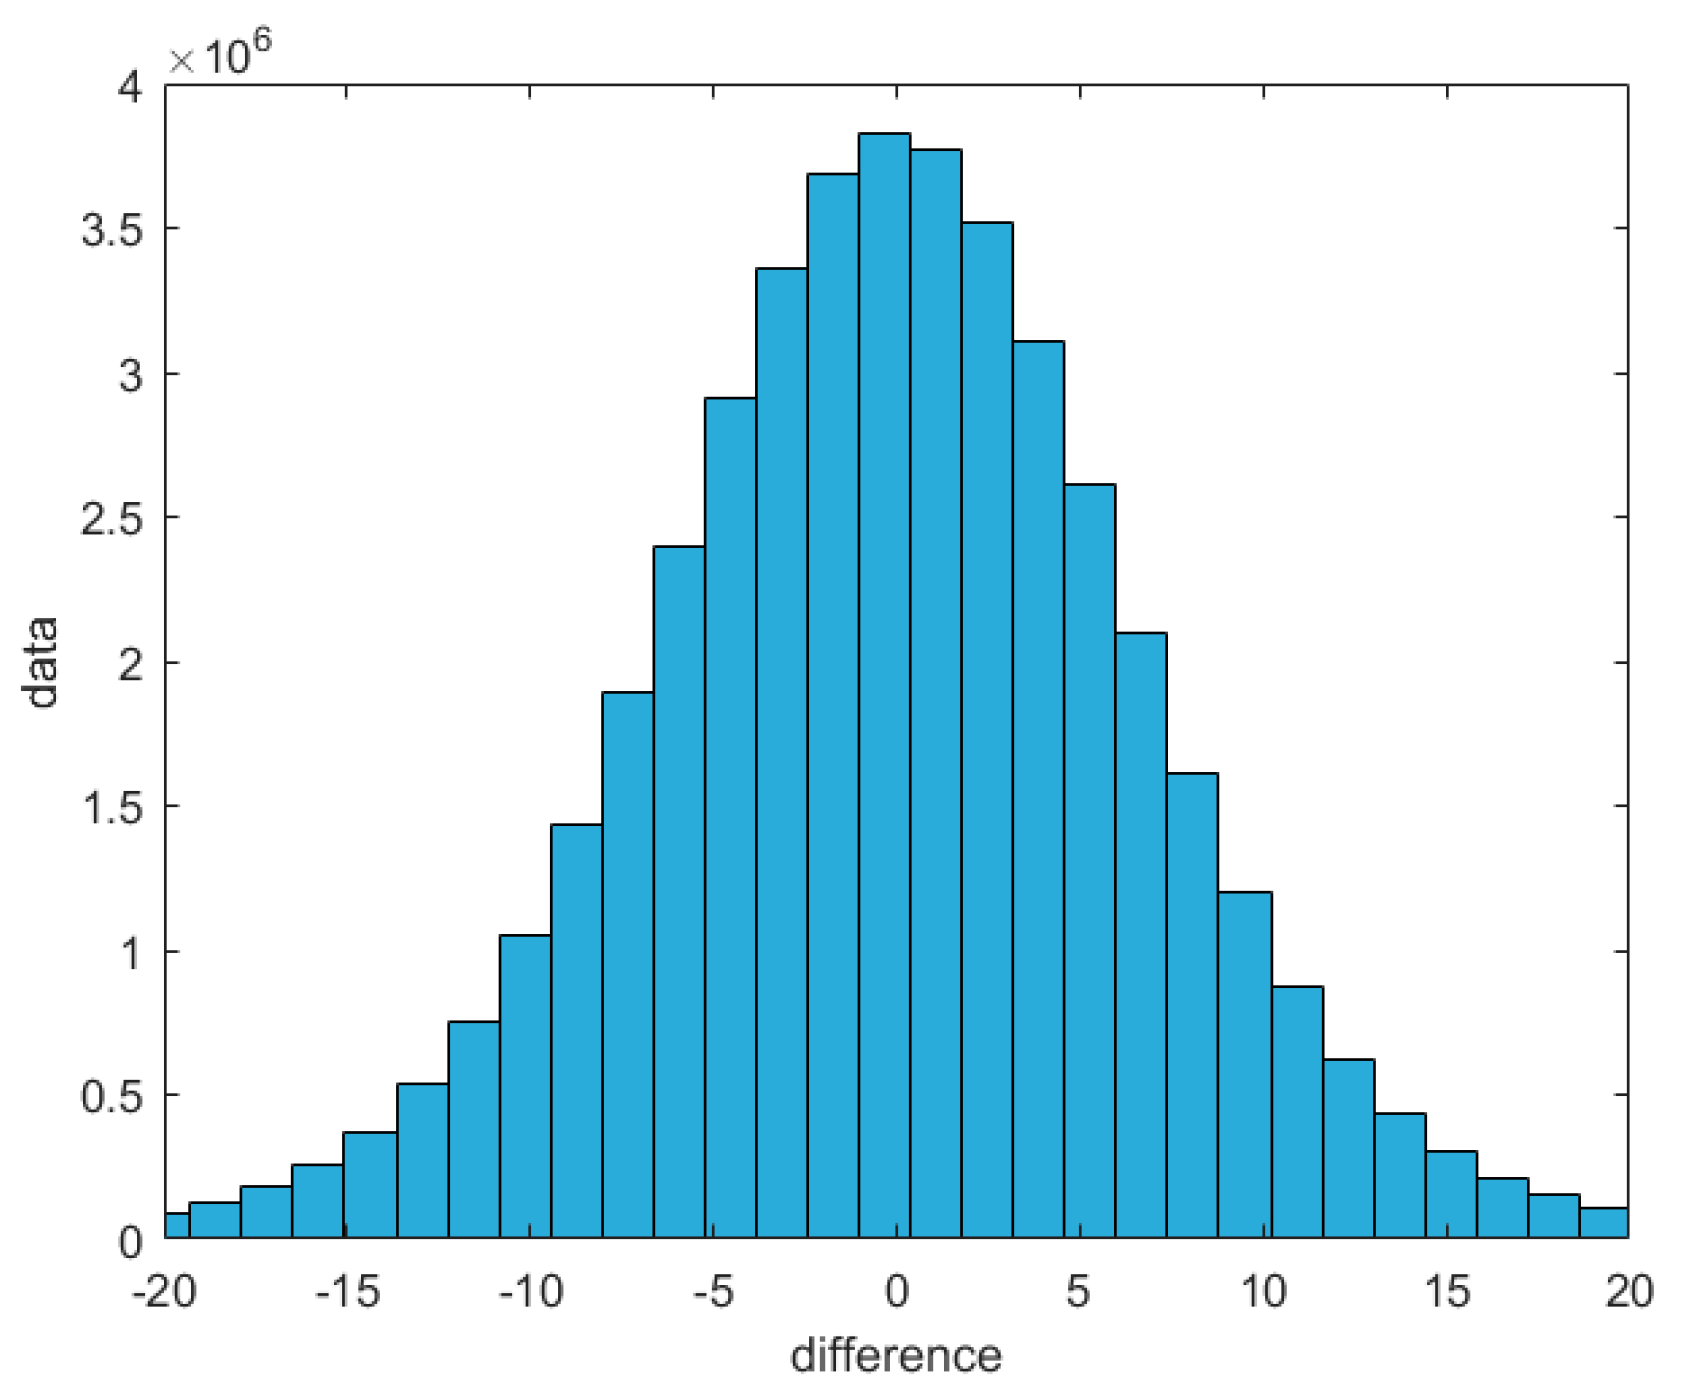
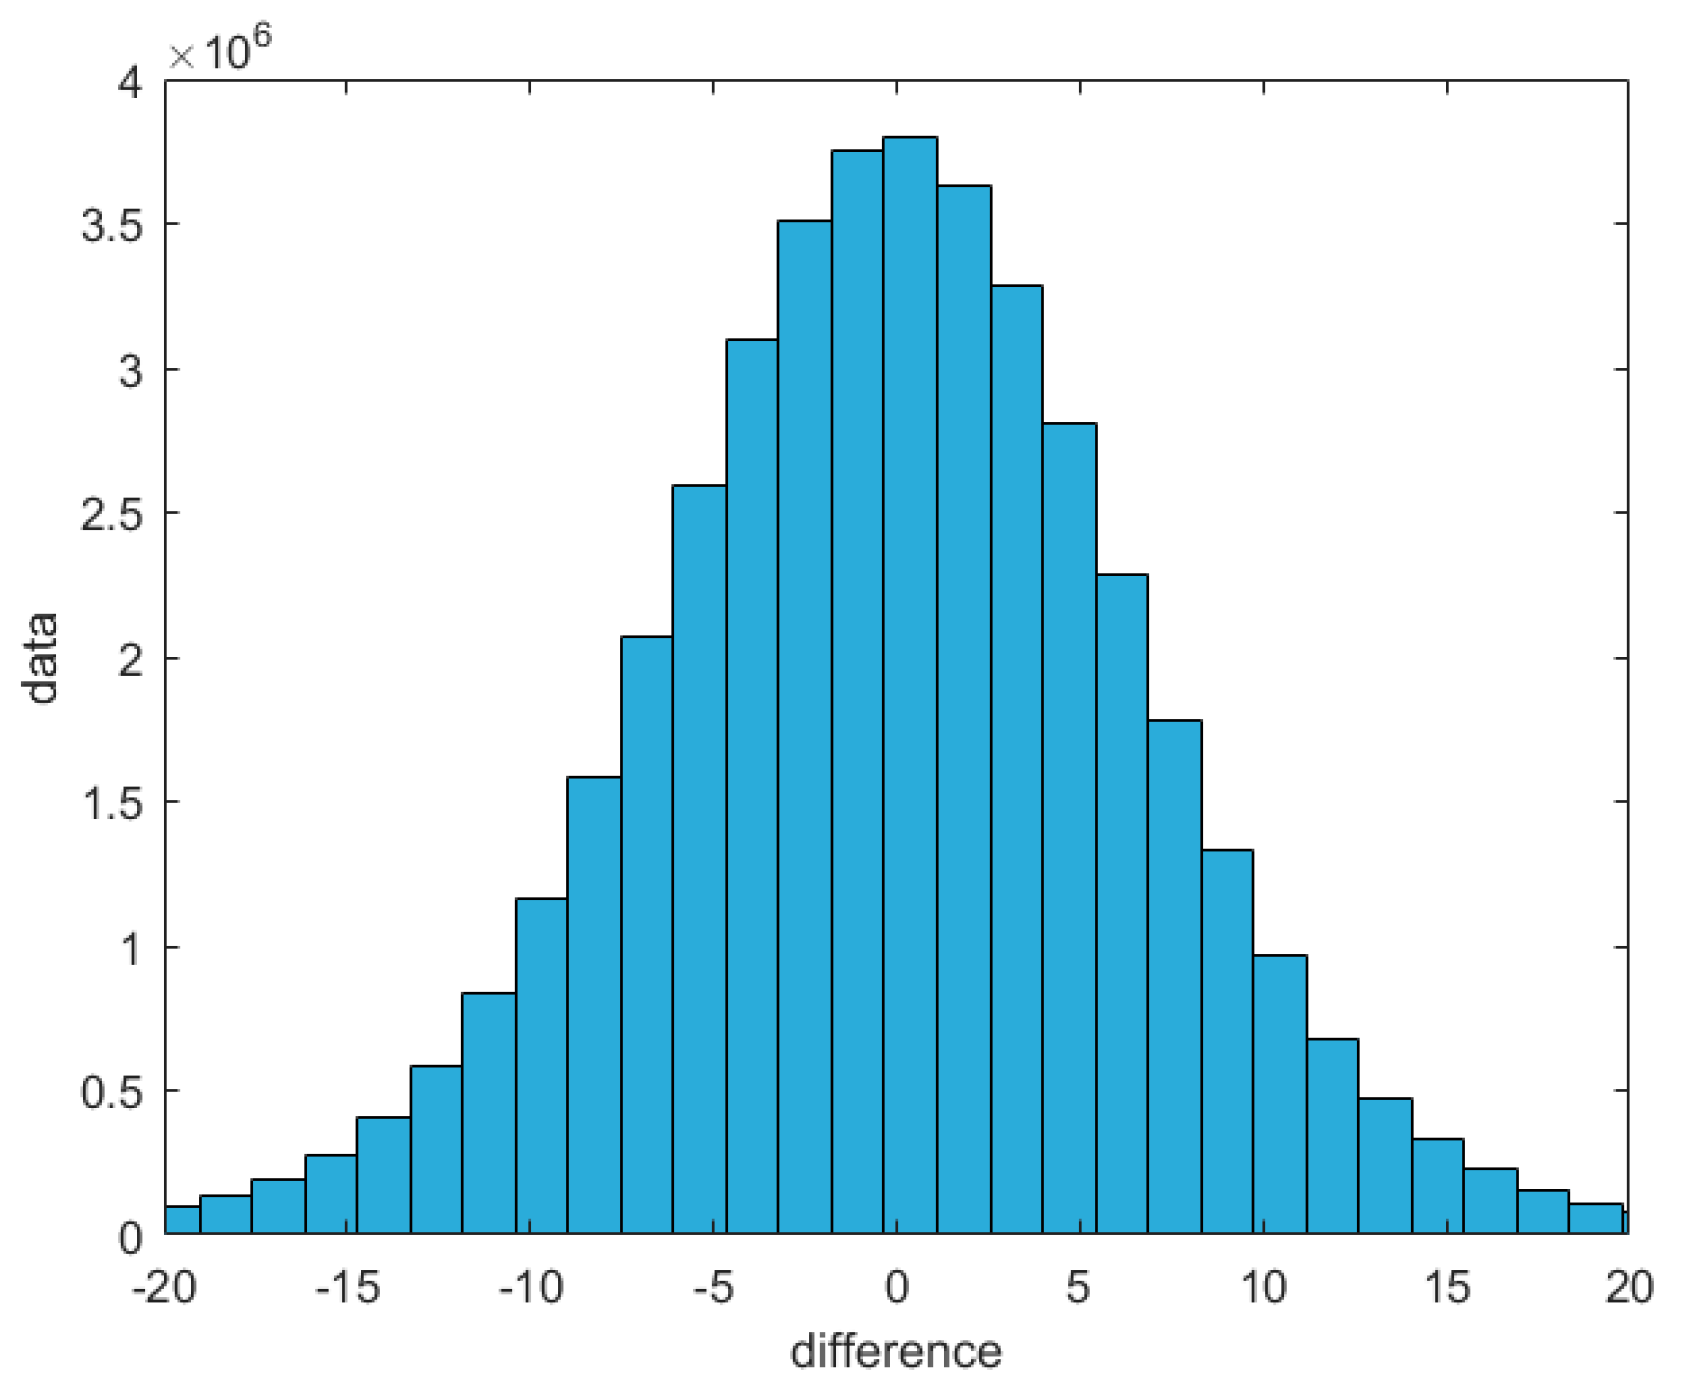
By comparing the SSBs obtained from the polynomial model and the non-parametric regression estimation model, using the GDR SSB, we saw that the RMSs of the differences between them were 2.0 cm and 1.1 cm, respectively. Therefore, the overall data fitting effect was good, and the results of the non-parametric regression estimation model and the GDR model were closer.
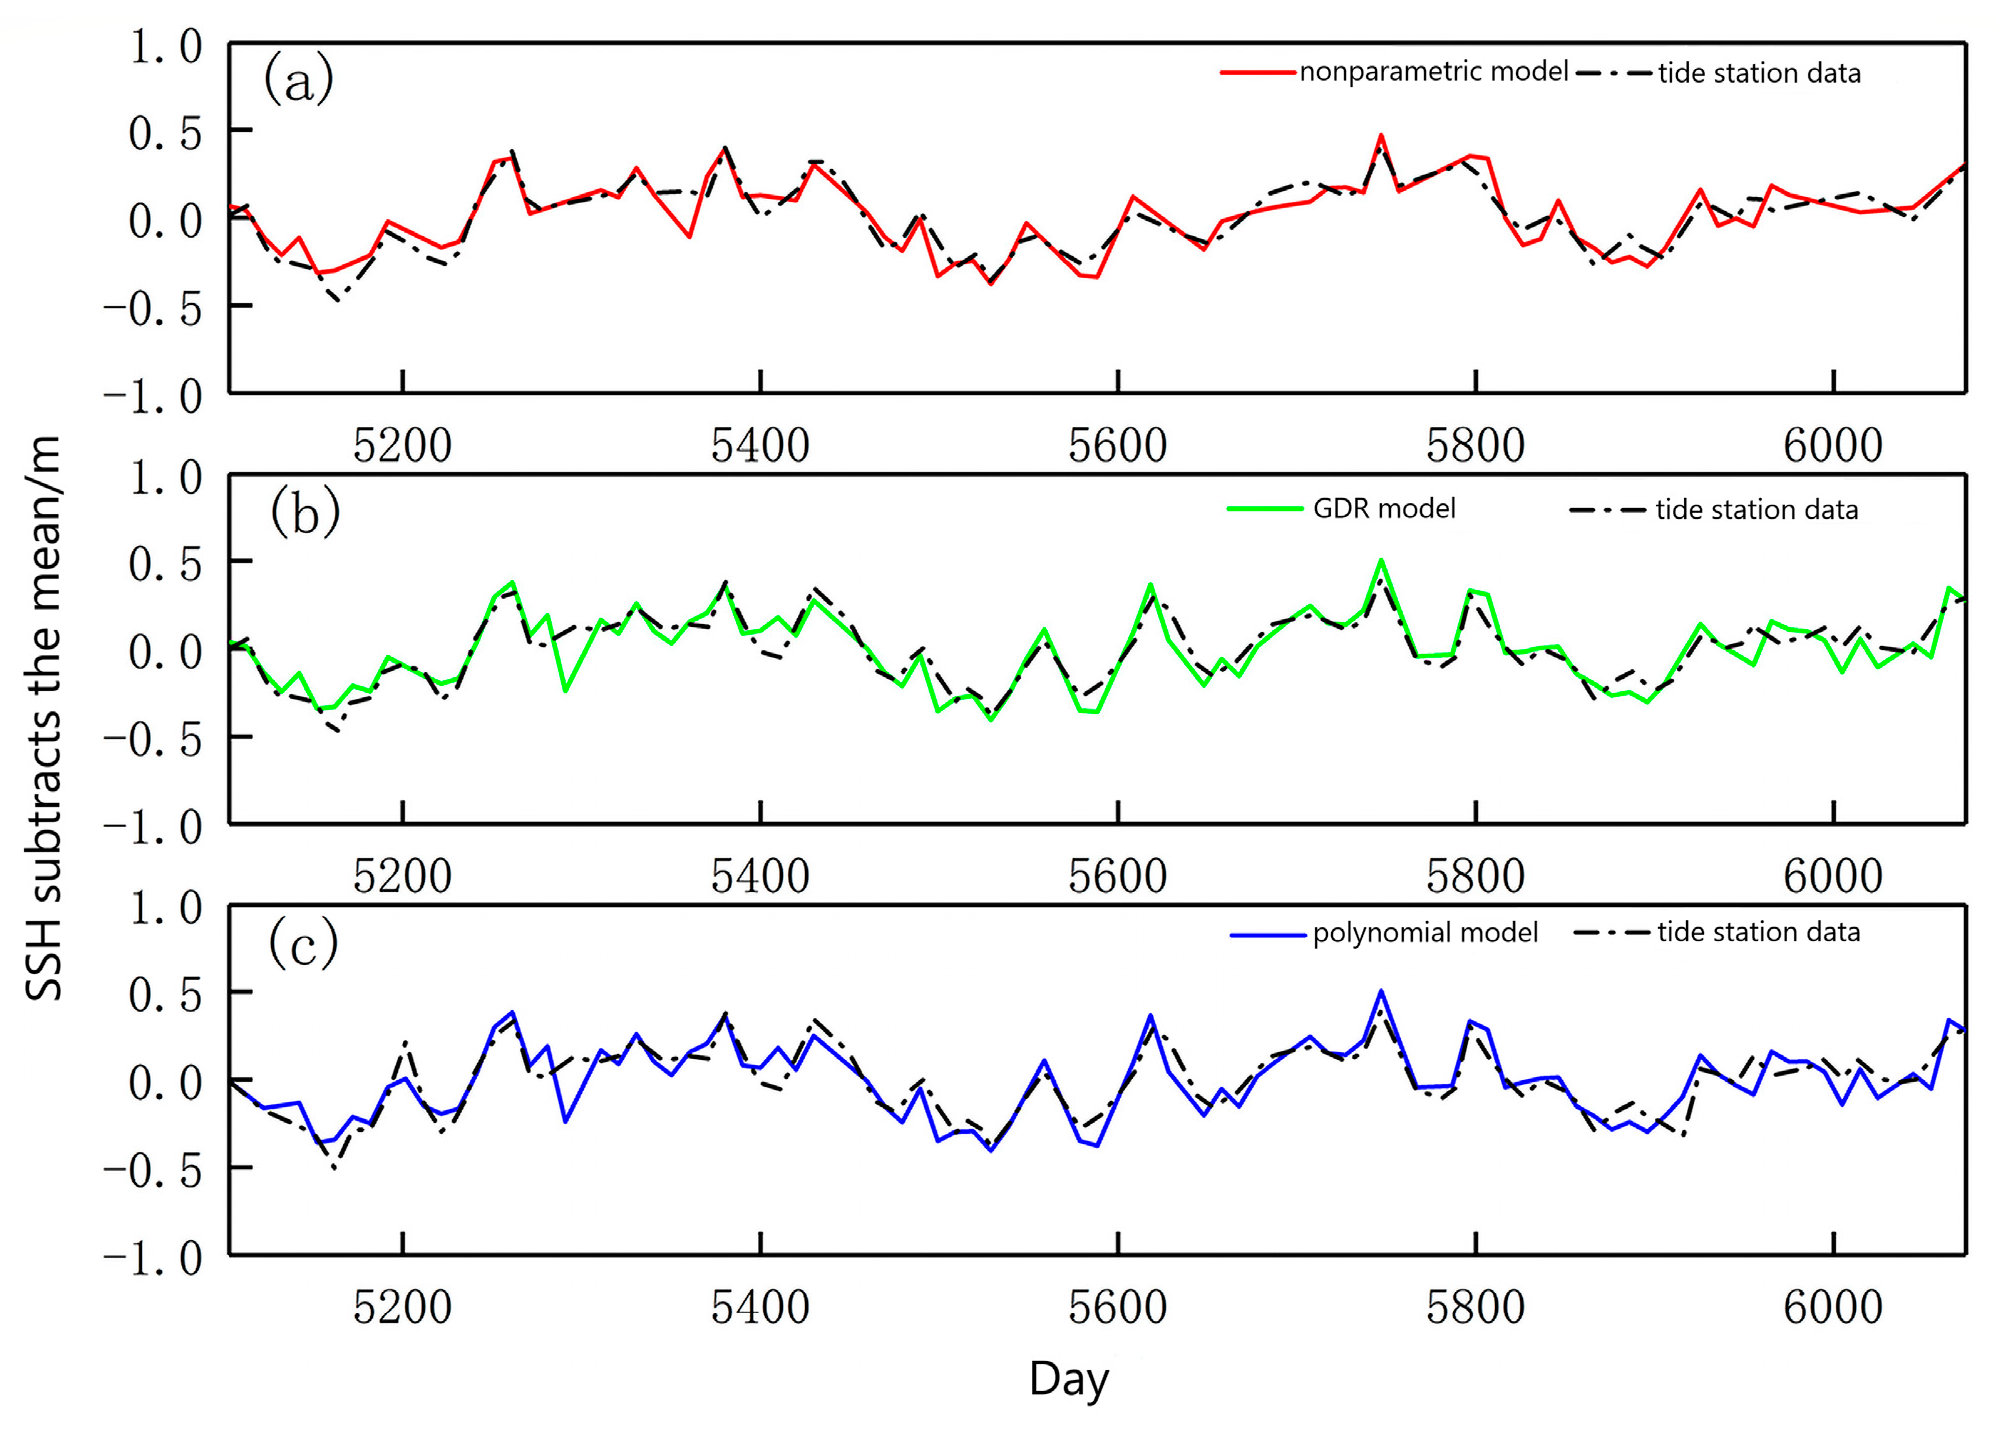
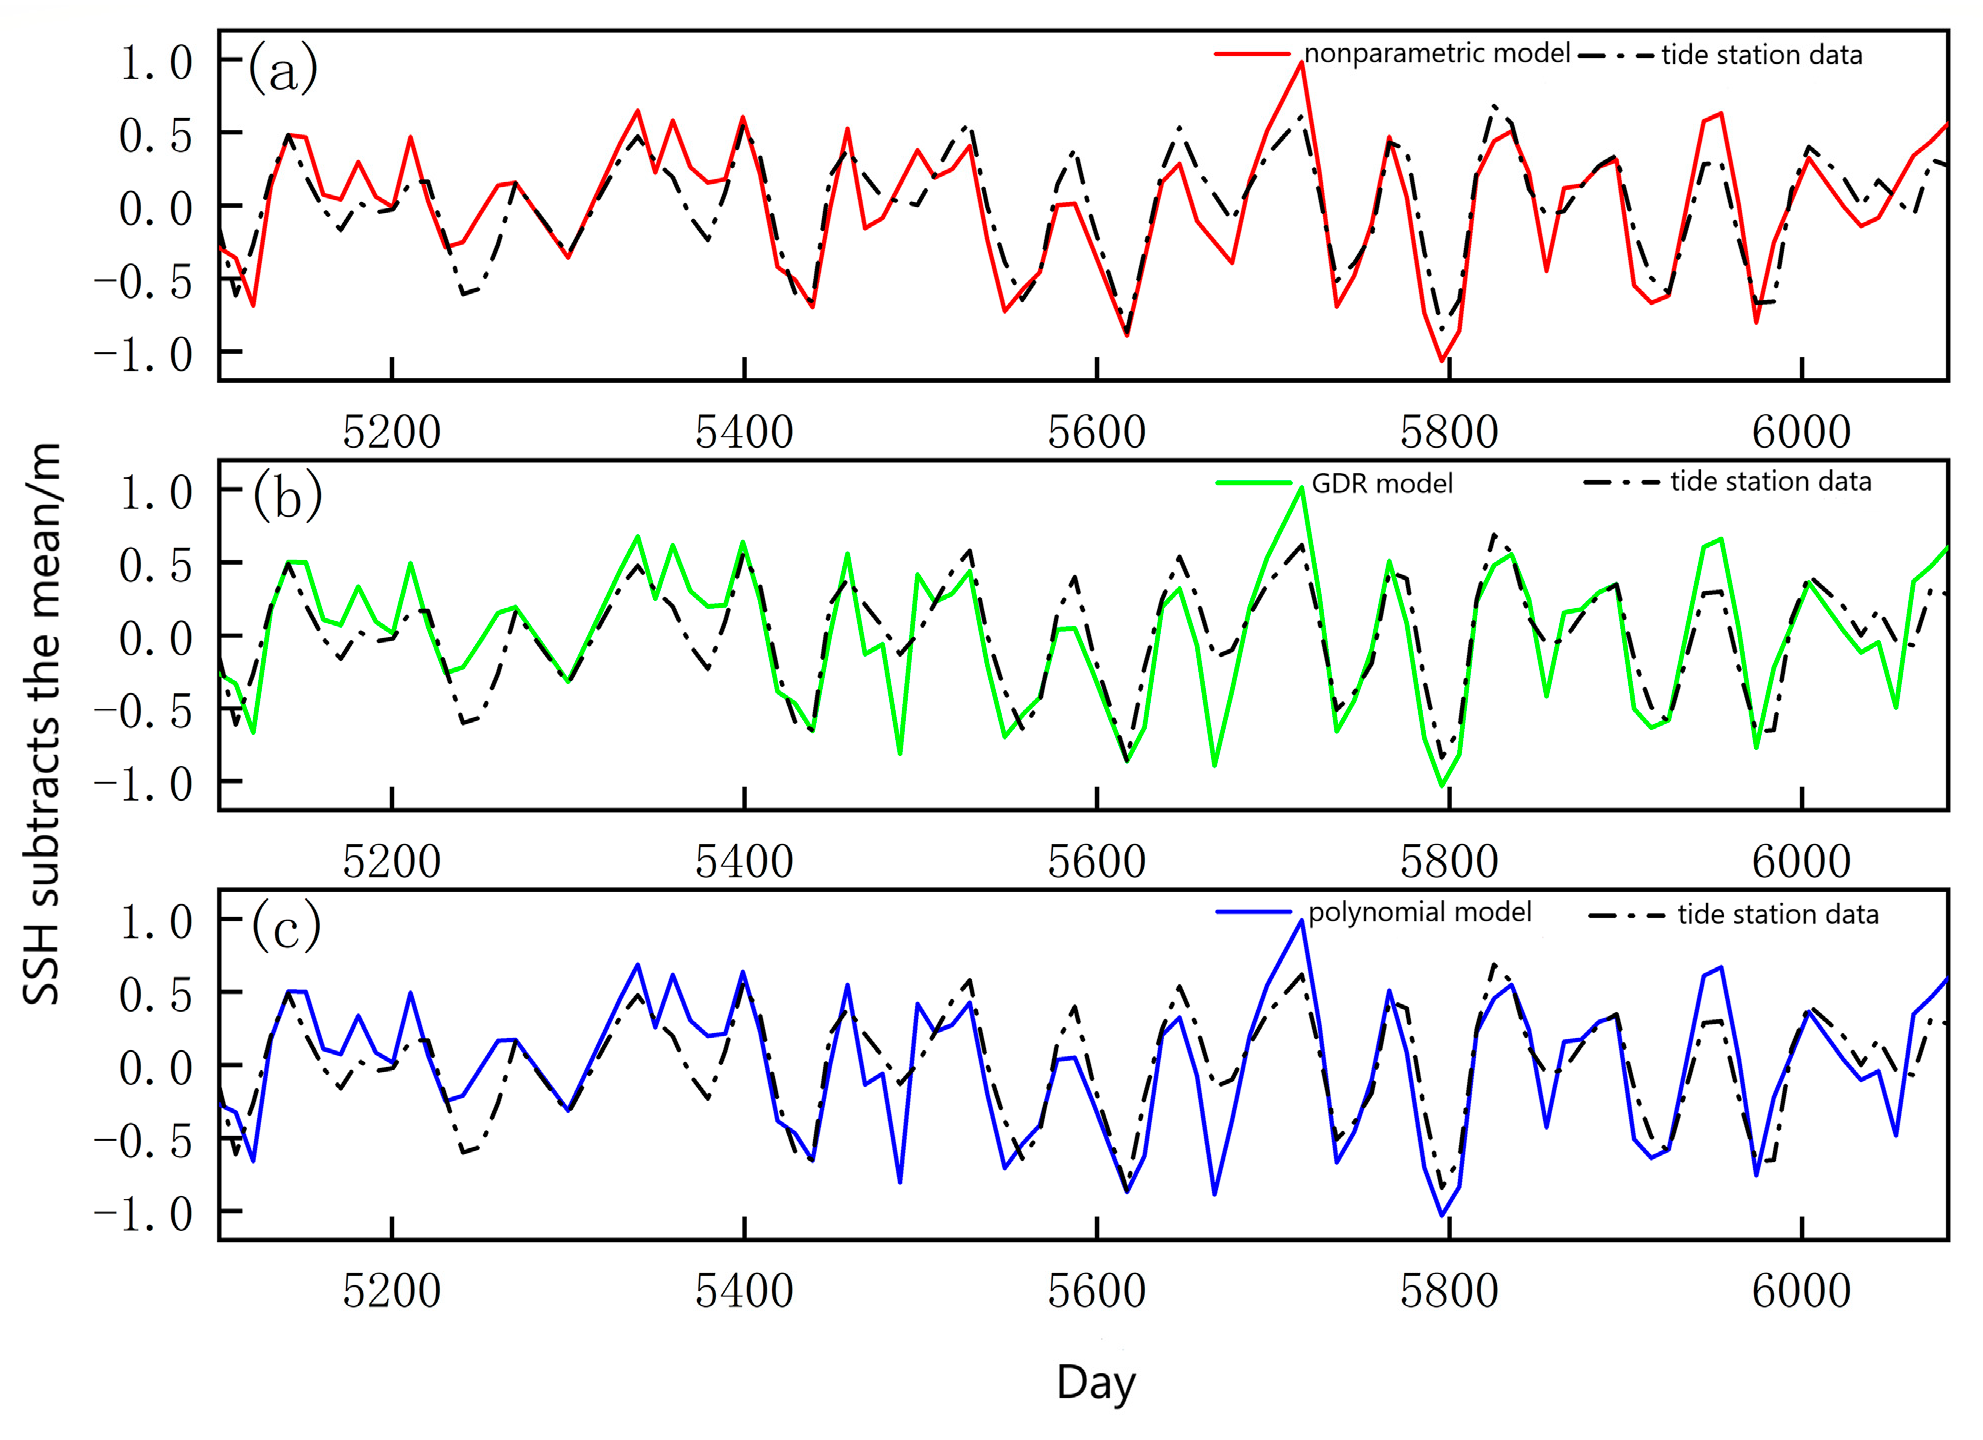
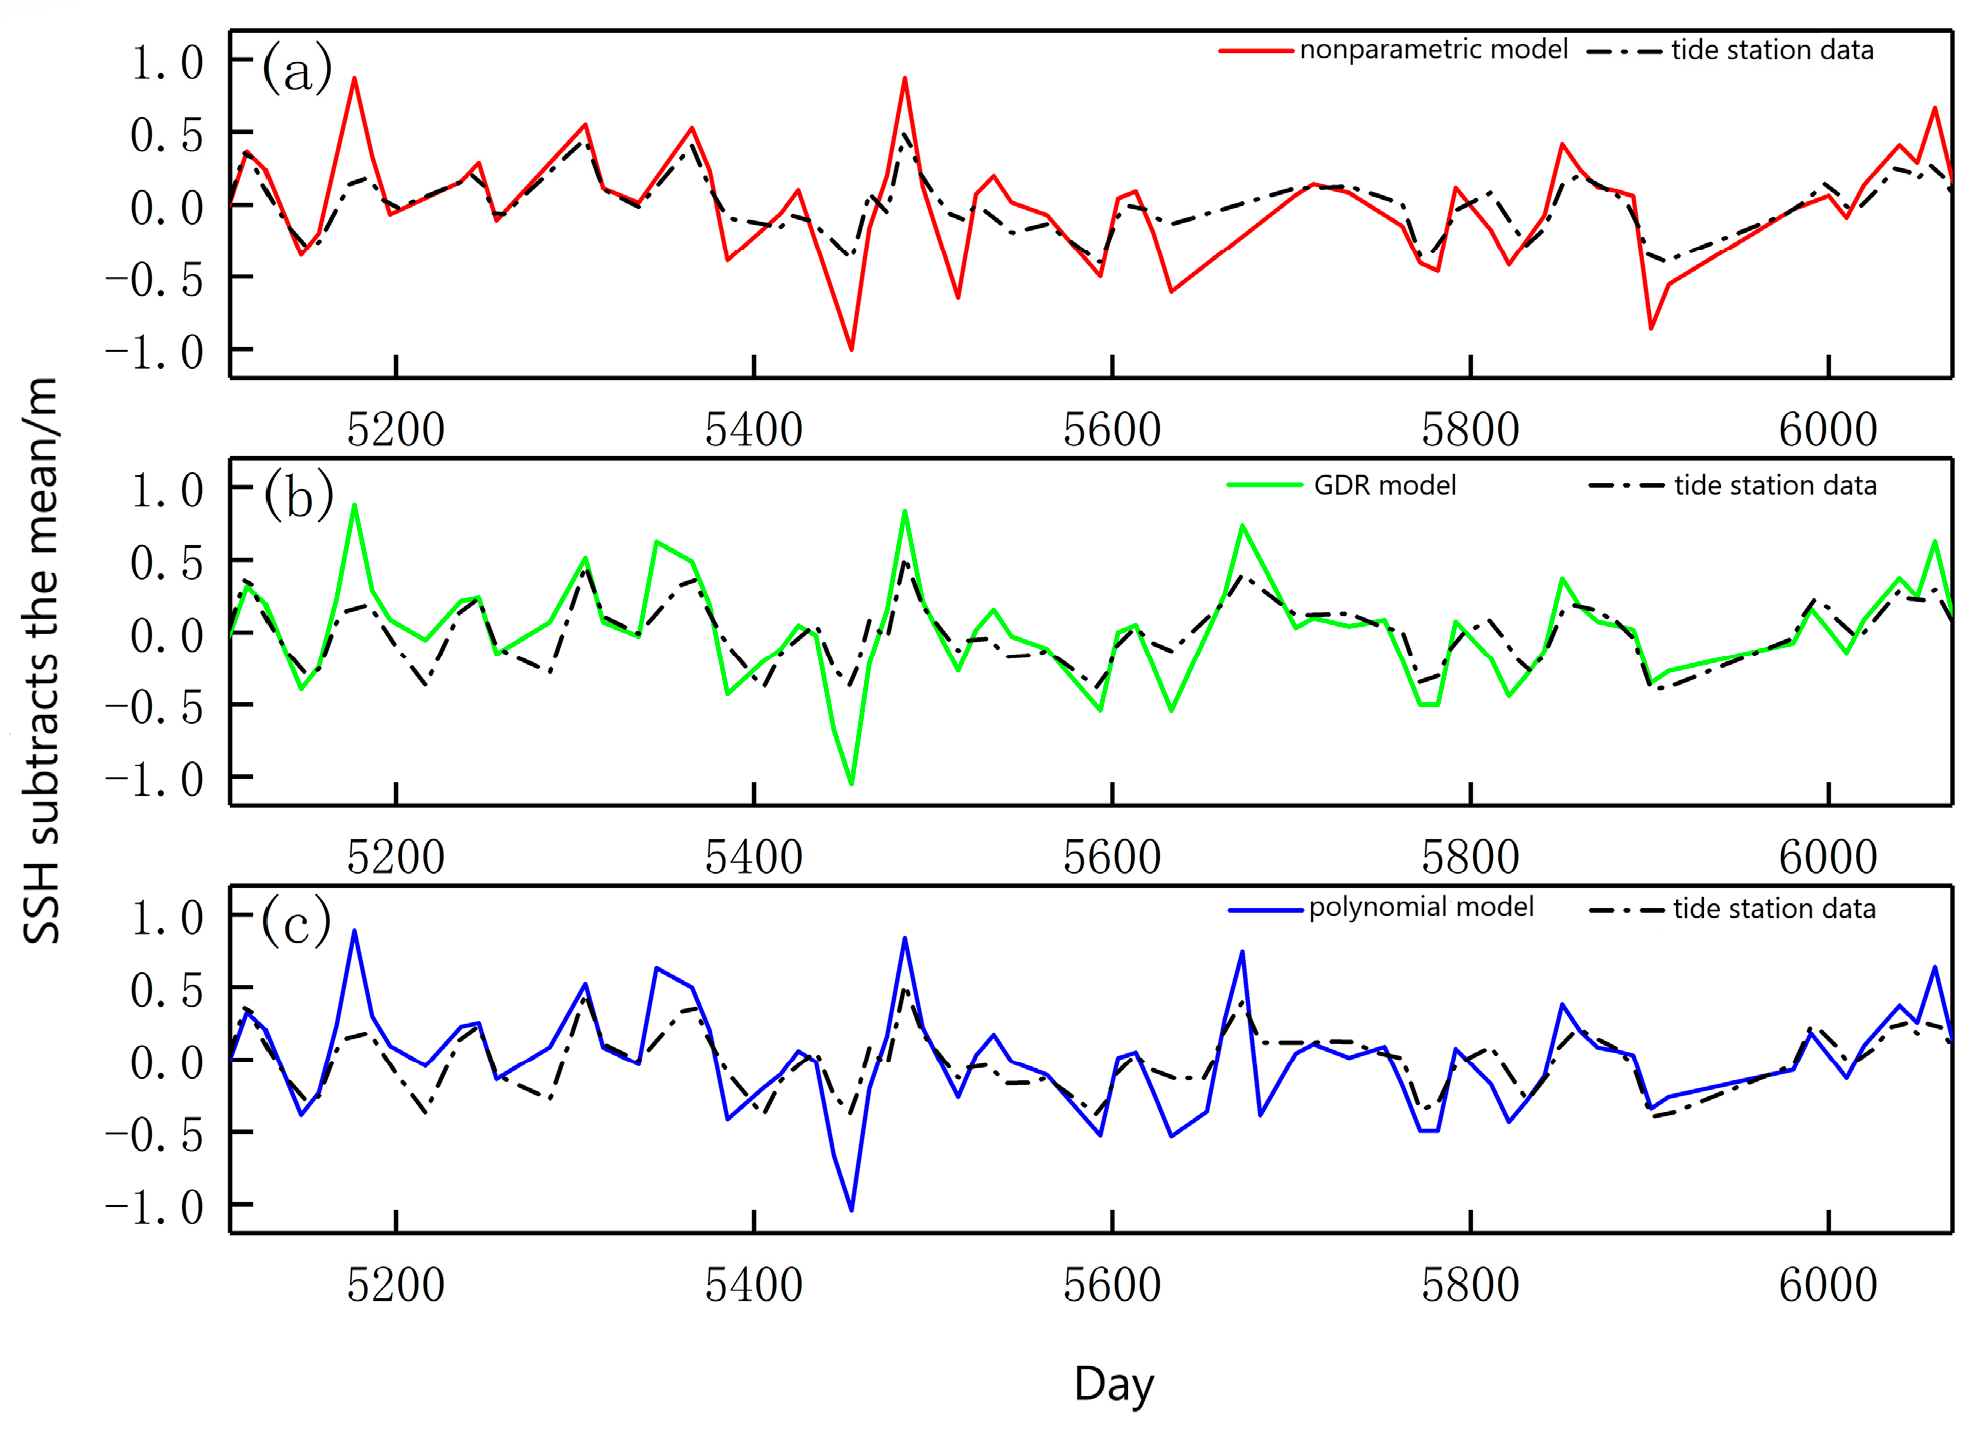
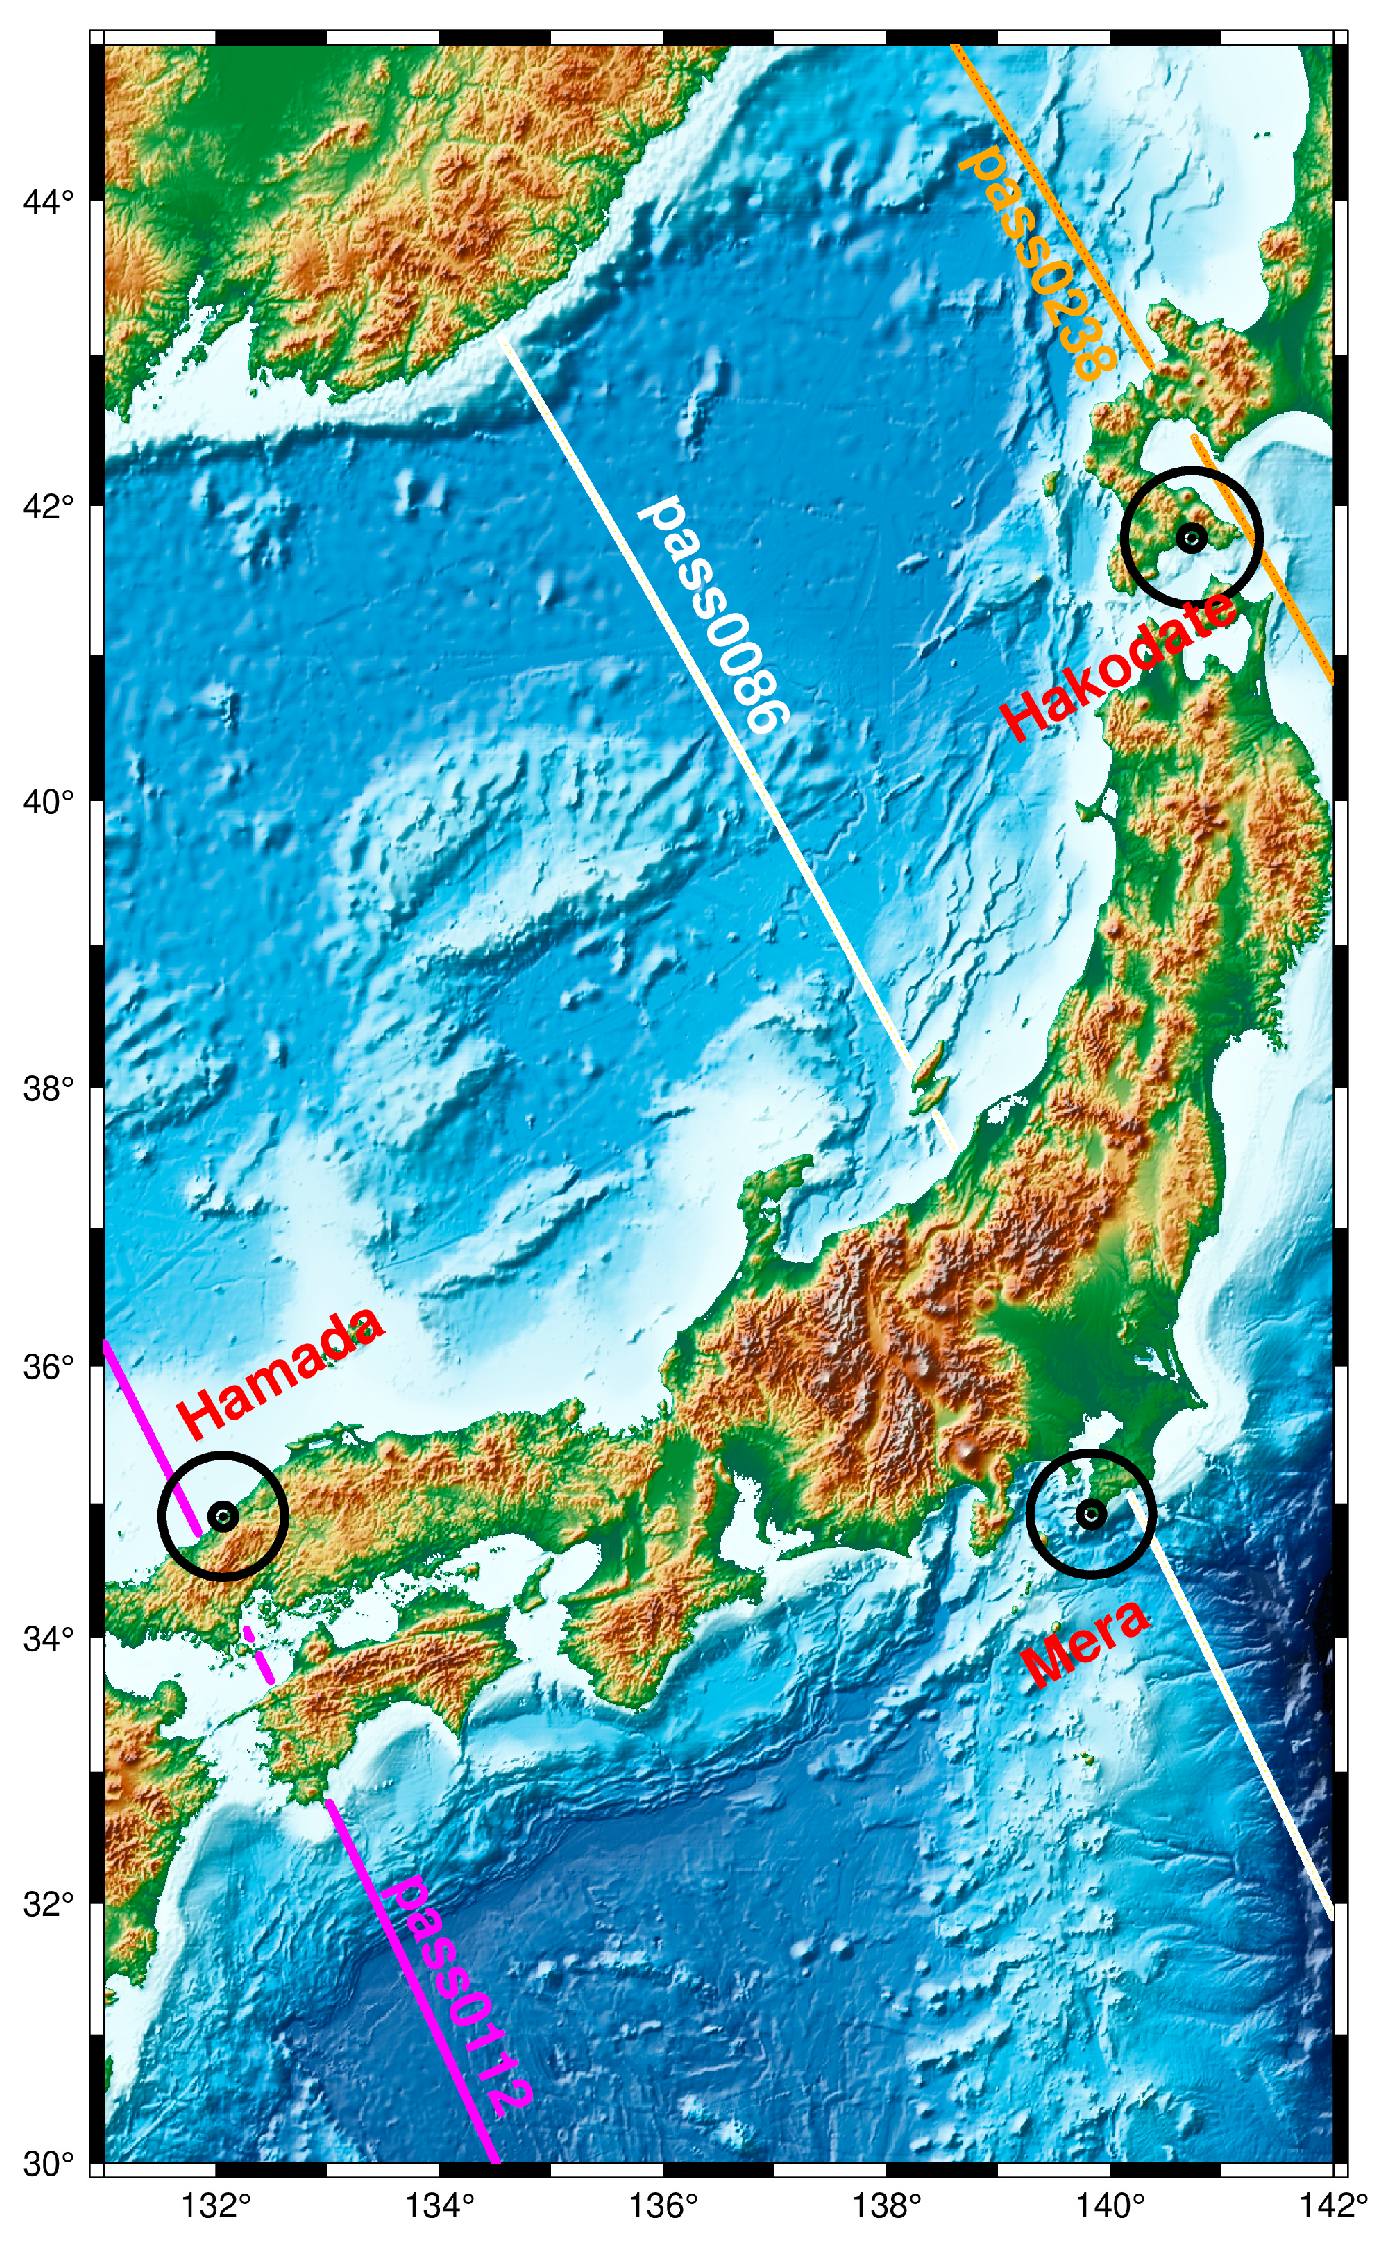
According to our analysis of the crossover SSHs and the tide gauge records—compared with the polynomial model and the GDR model—the RMS of the crossover discrepancies of SSH, which was calculated by the non-parametric regression estimation model, decreased by 7.9% and 4.1%, respectively. The STD of the differences between the corrected SSHs and the tide data decreased by 4.3–11.1% and 1.8–10.5%, respectively.
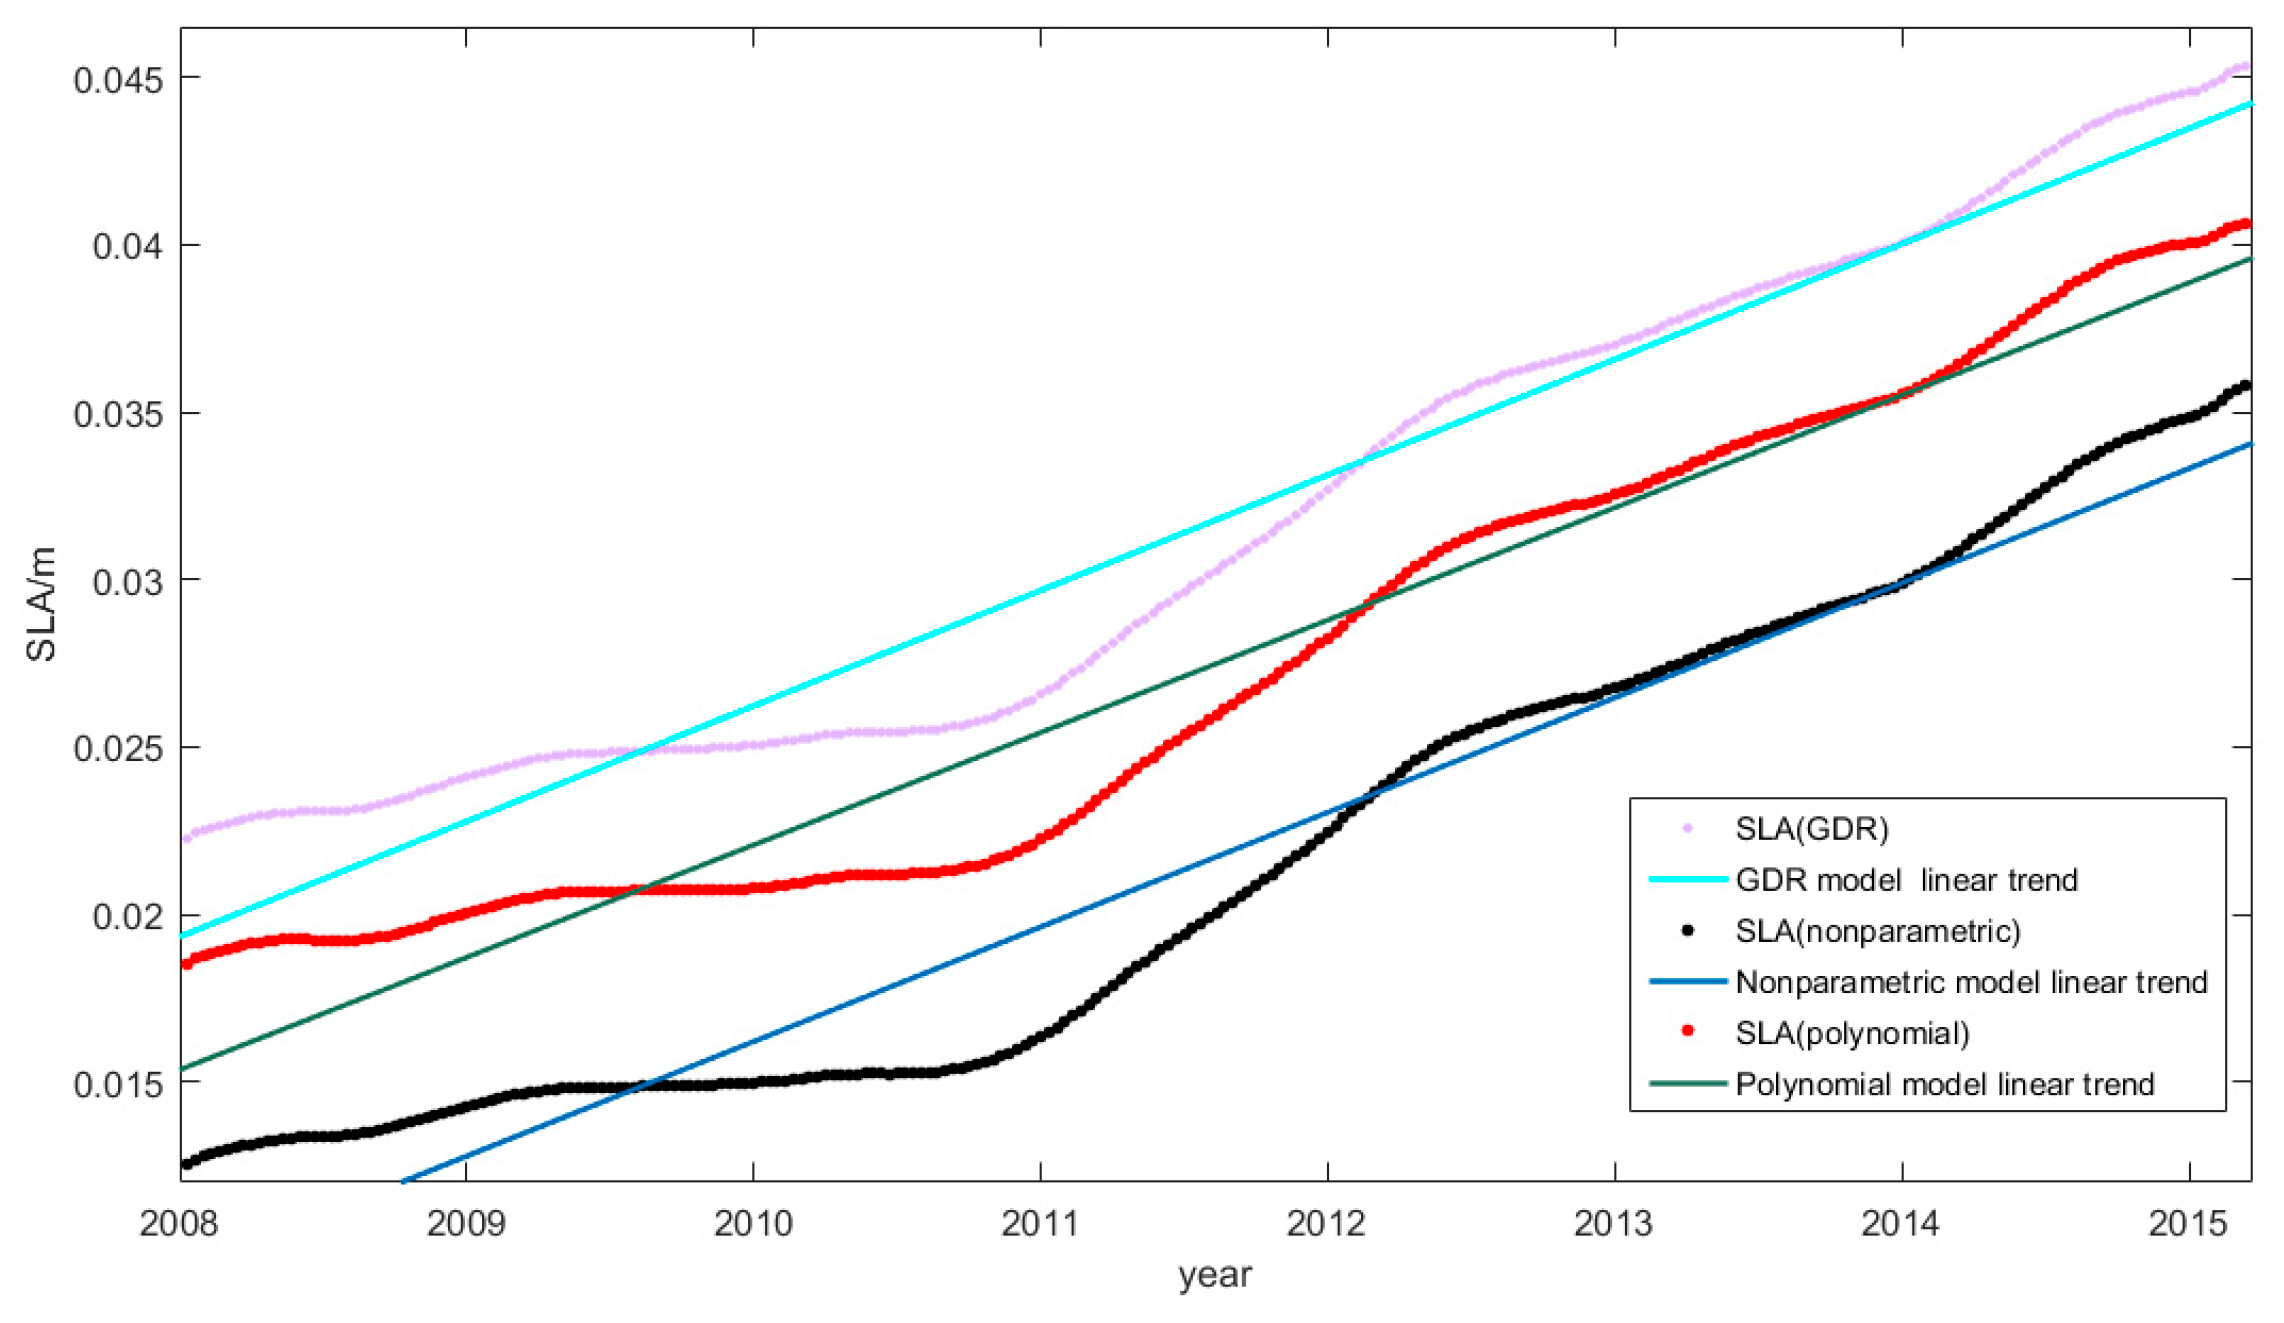
Based on the global along-track geoid gradient and the global sea-level change rate calculated by the two models constructed in this paper and compared with the calculation of the polynomial model and the GDR model, the RMS of the along-track geoid gradient difference calculated by the non-parametric regression estimation model and the vertical deviation model decreased by 2.8% and 2.4%, respectively. The along-track geoid gradient accuracy obtained by the non-parametric regression estimation model was the best. When it used SSA to analyze the 7-year time series of global sea level changes, the global sea-level change rate that was calculated by the three models was close to the average sea-level change rate published in the international literature.


