Abstract
This study was conducted to identify the fire weather conditions needed to assess future peatland fires under climate change. Recent peatland fires in Indonesia have resulted in globally significant environmental impacts. Nevertheless, diurnal fire weather in the peatlands has not been clarified. The objective of this study was to determine the fire weather conditions needed to assess future peatland fires under climate change. An analysis of fire weather using diurnal weather data during the most active fire period in 2015 showed a strong wind speed of 35.7 km h−1 at 3 p.m. that continued to blow for about two weeks, suggesting that peatland fires in 2015 became very active under these very strong wind conditions. The temperature increase rate (ΔT), the RH decrease rate (ΔRH), and the wind speed increase rate (ΔWS) during morning hours from 6:00 a.m. to 9:00 a.m. were 2.3 °C h−1, −10.3% h−1, and 5.2 (km h−1) h−1 respectively. These weather parameters will be used to predict occurrences of active fires. The results of this report may help to predict fire activity under high temperatures in the future based on predictions of global warming made by other researchers. The rapid air temperature increase rate from morning will be useful for fire forecast in Papua.
1. Introduction
Indonesia has one of the highest rates of deforestation and forest degradation in the world. The main causes are agricultural expansion and timber extraction, as well as an increasing incidence of forest fires [1,2,3,4]. Indonesian peatlands store an estimated 57 Gt of carbon, 55% of the world’s tropical peatland carbon [5,6]. Indonesia’s peatlands have been extensively degraded, and peatland fires are on the rise. Especially in Central Kalimantan (Borneo), where large-scale agricultural land development has taken place, peatland fires occur annually. The largest development one is Mega Rice Project (MRP) [7]. Recurring peatland fires throughout Central Kalimantan have resulted in severe economic and social impacts for local people, along with globally significant environmental impacts.
Under climate change, Indonesia is predicted to experience temperature increases of approximately 0.8 °C by 2030 and will exceed 1.5 °C in the near term (2021–2040) [8]. Moreover, rainfall patterns are predicted to change, with the rainy season ending earlier and the length of the rainy season becoming shorter [9]. Warming temperatures and rainfall trends in Indonesia have been reported to support this prediction. Estimates from the Berkeley Earth dataset suggest that annual mean temperatures in Indonesia were typically about 0.8 °C above the 1951–1980 baseline for the 2010–2017 period. Since 1960, hot days and nights have increased by 88 days and 95 nights per annum, respectively, especially during the summer months of July–September [10]. Studies have noted an overall decrease in average annual precipitation [11]. Rising sea temperatures could increase the frequency of El Niño events and intensify droughts [12]. Thus, fires in Indonesia will be more active under warmer conditions in the near future.
Nevertheless, fire weather in Indonesia has not been clarified during an active fire. There are few papers on fire weather. Most papers have explained activities of fire by using rainfall data to evaluate drought conditions related to groundwater level (GWL) and the El Niño–Southern Oscillation (ENSO). A. Sulaiman et al. analyzed the teleconnected relationship between groundwater levels (GWLs) and extreme climatic conditions, such as ENSO and positive Indian Ocean Dipole (IOD+). They showed that the dropped sea surface temperature anomaly induced by anomalously easterly winds along the southern Java–Sumatra occurs several weeks before the GWL drop to the lowest value [13]. Another study using rainfall data in Kalimantan proposed that seasonal precipitation forecasts should be central to Indonesia’s evolving fire management policy derived from their analysis of long up-to-date series observations on the burnt area, rainfall, and tree cover [9]. However, these studies only indirectly assess fires using mainly rainfall data.
Papua Island, in Indonesia’s easternmost region, spans about 400,000 km2 and is divided into two provinces [14,15]. These provinces include over 30% of Indonesia’s remaining forest, or about 360,000 km2 [16], ranging from mountains to lowland wetlands. It is worth noting that the forest cover comprises not only a main and secondary forest but also a production forest (or plantation forest). The peat swamp and mangrove, among other forms of lowland swamp forest, are widespread on the island, which covers over 80,000 km2 (or 38% of total Indonesian peatland) [17] and 14,000 km2 (or about 70% of total Indonesia Mangrove) [18], respectively. Following the 2015 fires, Papua Province was designated as one of two million hectares of priority locations for peatland restoration. Since the end of 2020, both Papua Province and West Papua Province have been part of a thousand-hectare priority region for mangrove restoration. In this condition, Papua can be considered Indonesia’s final frontier forest, as well as its future forest.
To assess future fire activities under climate change, fire weather conditions should be clearer by using fundamental weather parameters such as temperature, air pressure, wind speed, and direction. However, we could not clear fire weather conditions in Indonesia, including Papua, due to the large diurnal variations in the tropics and the lack of reliable and long-term hourly weather data at near-active fire regions. Recently, we could find hourly data for several locations in Indonesia on the web. We already analyzed the peatland fires in Sumatra and Central Kalimantan, using those data, and reported their fire weather conditions [19,20].
The objective of this study is to determine the fire weather in the fire-prone areas of Papua, Indonesia. For this purpose, a preliminary analysis using weather data (temperature, relative humidity, wind speed, and wind direction) every 3 h, from 12 a.m. to 9 p.m., measured at one local airport weather station in Merauke was carried out to clarify fire weather conditions in Papua. We also used 10 years (2012–2021) of satellite-observed fire (hotspot) data to discuss the peatland fires occurrence in Papua. This report will be the first comprehensive analysis of fire weather and maritime phenomena in Papua. This report’s results may help to assess future fire activities under higher temperatures.
2. Materials and Methods
2.1. Study Area and Vegetation (Fuel)
The study area covers the latitude range from 0 to 9°S (south latitude) and the longitude range from 130 to 141.1°E. The island state of Papua has a land area of 312,224 km2, and West Papua has a land area of 102,946 km2. The distribution of peatland and histosols (organic soils) in Figure 1 shows the distribution of the organic soils classified as peat and histosols, which extend throughout not only the southern and northern coastal lowlands but also the mountains of Central Papua. According to Hooijer et al. [21], lowland peat areas in Papua are classified into FAO soils 20–40% of peat, FAO histosol, and WI peatlands. In Indonesia, the largest peatland is located in the province of Papua. Additionally, Papua is home to 50% of all mangrove forests in Indonesia. This demonstrates that Papua is crucial for carbon sequestration. In Papua, five of eleven grids located above the peatland areas of the northern part of Merauke City have high HSs (>50 HSs yr.–1), as shown in Figure 1c.
Papua’s forest areas cover roughly 80% of the total land area. It is possible to interpret the type of fuel as forest vegetation supported not only by the presence of peat but also by quite extensive savanna (light green), as seen in Figure 1c. Dryland forest (dark green) and swamp forest (green with dashed lines), which is covered with peatland (orange), are the common land-cover types. The Coral Triangle Marine Protected Area, which borders the mangrove forest, is located in the northwestern section of Papua (green with dashed lines). There is, however, evidence of forest changes over the last nine years (2011–2019), as pointed out with the light red color. Referring to Runtuboi et al. [14], extensive forest conversion to plantations [22] has recently started to occur in Papua. Primary forest loss increased proportionally, and almost all clearing of primary forests took place within degraded types, indicating that logging came before the conversion processes. According to Gavaeu et al. [22], plantations and roads grew quickly after 2011 and reached their peak in 2015–16, including in the lowland of Papua.
The climate in the one of the world’s biodiversity hotspots of Papua as shown in Figure 1b, with abundant rainfall (1500–3500 mm yr.–1) and consistent temperatures, 27–32 °C. The northwest season, which runs from January through April, brings the most rain to many parts of Papua, while the southeast season, which runs from May through August, brings the least [23]. According to the Koppen–Geiger climate classification [24,25], most of Papua belongs to Af (tropical rainforest climate), the same as Kalimantan and Sumatra. Only the southern part of Papua belongs to Am (tropical monsoon climate) and Aw (tropical wet and dry climate or savanna climate). These two climate zones coincide with the high fire areas depicted in Figure 1b. Merauke is located at 8.52°S and 140.41°E, and it is one of local cities in the Southern Papua (Figure 1c). High fire areas (>500 HSs yr.–1) around Merauke belong to Aw, the same as Northern Australia. During the winter, there is an extended dry season. Rainfall during the wet season is less than 1000 mm, with most of it falling during the summer. The majority of locations with this climate can be found on the tropical zone’s periphery [26].


Figure 1.
Peatland, climate, forest cover, and fire distribution. (a) Peatland distribution in Indonesia (extracted from [27,28]). (b) Köppen–Geiger climate classification in Indonesia (extracted from [24,25]). (c) Map of Papua with land-cover and fire distribution (latitude and longitude, 1° × 1° resolution). Forest cover from MoEF. Fire data (hotspots) from NASA MODIS. Numbers in each grid show average number of ten years).


2.2. Hotspot (Fire) and Weather Data
Hotspot (HS) data of 10 years from 2012 to 2021 detected by Moderate Imaging Resolution Spectroradiometer (MODIS) on the Terra and Aqua satellites were used to evaluate wildfires in Papua. MODIS HS data were obtained from the NASA Fire Information for Resource Management System (https://firms.modaps.eosdis.nasa.gov/download, accessed on 10 September 2021), with a pixel resolution of 1 km. The number of daily HSs is used to identify the fire season, active fire period, and the dates of major HS peaks during the fire periods.
Various daily weather maps, such as pressure; wind; temperature at 500 hPa, 850 hPa, and 925 hPa; sea surface temperature (SST); and each of those anomalies, were obtained from the NCEP/NCAR 40-year reanalysis data (https://psl.noaa.gov/data/composites/day/, accessed on 15 January 2023). We analyzed these to find fire–weather conditions during active fire periods, fire-related synoptic-scale circulation patterns, rainy conditions, STT, etc. The coverage and spatial resolution of the NCEP reanalysis data are the geographic longitude and latitude, 0.0–358.125°E and 88.542–88.542°N; spatial resolution, about 2.5° × 2.5°; and period and temporal resolution, 1 January 1948 to present. Long-term means (climatologies) are based on 1991–2020.
Daily rainfall data for Merauke area (set at 8.5°S, 140.5°E) for 10 years, from 2012 to 2021, were obtained from the JAXA (https://sharaku.eorc.jaxa.jp/GSMaP_CLM/index.htm, accessed on 15 January 2023). The JAXA rainfall data are generated with information from multiple precipitation-observing satellites and geostationary meteorological satellites.
Diurnal weather data (temperature, relative humidity, wind speed, and wind direction) of every 3 h in Merauke (Mopah Airport Station (8.52°S, 140.41°E) can be obtained from the weather underground (https://www.wunderground.com/history/daily/id/merauke/WAKK/date/2021-10-25, accessed on 15 January 2023).
Niño 3.4 data (region: 5°N–5°S, 170°–120°W, one of the ENSO indices) were obtained from the NOAA website (https://www.cpc.ncep.noaa.gov/data/indices/, accessed on 15 January 2023).
Active fire occurrences and weather conditions were also confirmed by checking the satellite imagery (corrected reflectance, true color, and MODIS on Terra) of Worldview https://worldview.earthdata.nasa.gov (accessed on 15 January 2023). Worldview provides various fire-related information such as surface conditions, cloud distribution, etc. We also checked the satellite imagery of the Japanese weather observation satellite Himawari (https://himawari8.nict.go.jp/ja/himawari8-image.htm, accessed on 15 January 2023).
The 2019 land-cover map was created by updating the 2018 land-cover map with the 2019 Landsat imagery mosaic (Landsat image acquisition in the period July 2018 to June 2019). According to the Regulation of the Director General of Forestry Planning Number P.1/VII-IPSDH/2015 concerning Guidelines for Monitoring Land Cover, land cover is classified into 23 land-cover classes. Thematic spatial data of the Indonesian land-cover scale 1:250,000 are available on the Ministry of Environment and Forestry’s website, at https://sigap.menlhk.go.id/sigap/peta-interactive, accessed on 12 June 2021.
2.3. Analysis Methods
MODIS hotspot (HS) data from 1 January 2012 to 31 December 2021 were used to clarify the spatiotemporal structure of wildland fires in Papua. The distribution of fires was determined by setting the 1-degree grid cell (1° × 1°, latitude and longitude), as shown in Figure 1c, and the 0.1-degree grid cell (0.1° × 0.1°, latitude and longitude). Daily hotspot (HS) data were used to show the fire activities, annual fire history, fire-prone areas, fire season, and active fire period in Papua.
Daily rainfall data of ten years (2012–2021) at Merauke were obtained from the abovementioned website and were used to define dry and wet seasons. An analysis using various composite weather maps at various air levels (1000, 925, 850, and 500 hPa) and surfaces was carried out to confirm fire–weather conditions during the active fire periods. The composite weather maps were used to identify the presence and location of high pressure, low pressure, sea surface temperature, wind speed and direction, wind vector, and their anomalies (1991–2020 climatology).
ENSO (El Niño–Southern Oscillation) indices such as the Niño 3.4 index were obtained from the abovementioned website and were used to show a correlation with fires in Papua. One of the strongest El Niño events of the last decade, 2015, has been studied in detail. The Niño 3.4 index SST anomaly reached 3.0 °C at its peak in November 2015 and could correlate with the hotspot in Southern Papua.
3. Results
3.1. Annual Rainfall and Fires
Figure 2a shows the annual rainfall in Merauke (8.52°S, 140.41°E) in the bottom and annual averaged value of the sea surface temperature anomaly (SSTA) in Niño 3.4 (region: 5°N–5°S, 170–120°W, one of the ENSO indices) in the upper part. The lowest rainfall was about 940 mm in 2015, under moderate El Niño (annual mean SSTA = 1.37). The highest rainfall was about 2260 mm in 2013. Rainfall in 2021 under La Niña (SSTA = −0.56) was an average value (1790 mm). There is about an 850 mm difference between 2015 and 2021. The red-color bar graph at the bottom of Figure 2a shows the rainfall of the dry season (five months from June to October; see Figure 3a). The lowest dry season rainfall (33 mm) in 2015 occurs under moderate El Niño conditions, and 323 mm rainfall in 2021 is under La Niña conditions. There is about a 10-times difference between 2015 and 2021.
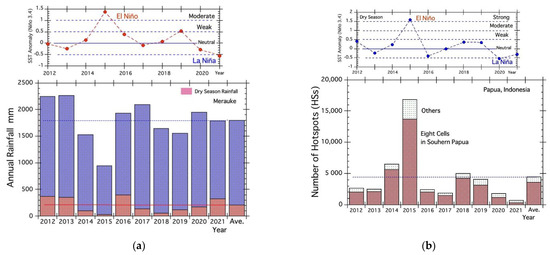
Figure 2.
(a) Annual rainfall and dry season rainfall in Merauke (bar graph) and annual mean SSTA in Niño 3.4 (line graph). (b) Annual hotspots (HSs) in Papua (bar graph) and dry season SSTA in Niño 3.4 (line graph).
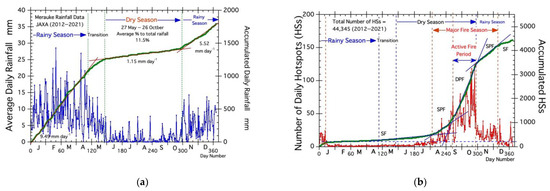
Figure 3.
Average dry and fire season. (a) Average dry season in Merauke (Aw). (b) Average fire season in Papua. SF, surface fire; SPF, shallow peatland fire; DPF, deep peatland fire.
Figure 2b shows the recent fire history by using accumulated daily HSs from 2012 to 2021 and the averaged value of dry season STT anomaly (five months, from June to October, in Figure 3a). The largest number of fires (about 16,800 HSs) was detected in 2015, under El Niño. The bar graph in Figure 3b shows the annual total number of HSs. The lowest number of fires (about 690 HSs) occurred in 2021 under quasi La Niña conditions (mean SSTA = −0.31). There is about a 24-times difference between 2015 and 2021.
The red bar graph in Figure 2b shows that most fires occurred in Southern Papua (lower than 6°S, ten grid cells in Figure 1c). The lowest number of fires (about 280 HSs) occurred in 2021, under quasi La Niña conditions (mean SSTA = −0.31). There is about a 49-times difference between 2015 and 2021.
The correlation equation between the annual total number of HSs and SST anomalies (annual mean shown in the attached diagram at the top of Figure 2a) is Equation (1). Equation (2) is the correlation equation between the annual total number of HSs and SST anomalies (dry season of five months shown in the attached diagram at the top of Figure 2b).
where HSs is the number of HSs, and [Niño] is the Niño 3.4 index.
HSs = 2737.8 + 4047.4[Niño] + 4242.8[Niño]2 (R2 = 0.86724)
HSs = 2739.8 + 3622.8[Niño] + 3296.3[Niño]2 (R2 = 0.92475)
3.2. Dry Season and Fire
The blue-line curve in Figure 3a shows the average daily rainfall for the recent 10 years (2012–2021) in Merauke. The accumulated rainfall curve is shown by a thick green curve in Figure 3a. The annual average rainfall is 1794 mm. The gradients of three straight red lines (three rainfall rates (mm day−1) of 9.49, 1.15, and 5.52 mm day−1) could divide two seasons, or the dry and wet season. Two distinct seasons are one of the characteristics of the climate, or tropical wet and dry climate (Aw). The average dry season starts on May 27 and lasts until October 26 (153 days or 5.1 months). The total amount of rainfall and rainfall rate during the dry season are 206 mm (11.5% of annual average rainfall) and 0.88 mm day−1, respectively. This pattern is longer (dry season period: 148 days) and drier (dry season rainfall: 4.1 mm day−1; rain season rainfall: 9.9 mm day−1 than that of Palangka Raya (Central Kalimantan), which has the most severe fires in the tropical rainforest climate (Af) [23].
The red-line curve in Figure 3b shows the average daily number of HSs (fires) for the recent 10 years (2012–2021) in Papua. The accumulated HS curve is shown by a thick green curve in Figure 3b. The total annual average number of HSs is about 4430. From four blue straight lines on the daily accumulated HS curve in Figure 3b, we could define their fire rates (HSs day−1). The gradients of four blue straight lines (fire rates (HSs day−1)) from late April are roughly 2.2, 14.2, 51.5, and 18.5 HSs day−1. As their rates are typical peatland fire rates that depend on the groundwater level (GWL) [29,30], we could classify them. Namely, they are surface fires (SFs; GWL = 0 to −300 mm), shallow peatland fires (SPFs; GWL = −300 to −500 mm), and deep peatland fires (DPFs; GWL = lower than −500 mm). Figure 3b shows that a SF begins around late April, which is when the rainy season ends. Then, an SPF starts around early August, and a DFP begins around 10 September and ends on around 21 October. As the rainy-season rains raise the GWL, fires gradually decrease from late October.
3.3. Fire Distribution
3.3.1. Papua Province (1° × 1° Resolution)
A grand total of 44,345 hotspots (HSs; average annual HSs = 4435) were detected from 2012 to 2021 in Papua. Figure 1c shows their spatial distribution throughout the Papua Province. A large number of HSs were found in Southern Papua. Their number of eleven grid cells (1° × 1°) shown in Figure 1c were 37,018 HSs (about 90% in Papua). The highest number of HSs per year was 815 in the most southeastern grid cell (8–9°S, 140–141°E). Merauke is located at 8.52°S and 140.41°E in the highest grid cell. The second highest HSs cell (HSs = 794, 7–8°S, 138°–139°E) had 3137 HSs in 2015 (El Niño year), and it is four times larger than average (=3137/794). This number is also larger than 2223 (average number of HSs from 2002 to 2011) in Central Kalimantan. This grid cell (2.5–3.5°S, 113.5–114.5°E) covers the Mega Rice Project (MRP) peatland area and had 5382 HSs in 2006 (the highest number of HSs in Indonesia from 2002 to 2011) [31]. This comparison of the number of HSs indicates that fire activity in Southern Papua is not as weak. We must pay closer attention to active fires in Southern Papua.
3.3.2. Southern Papua (0.1° × 0.1° Resolution, Lower Than 6.6°S)
A map of the fire distribution for 2015 (El Niño year) that was made by using fine grid cells (0.1° × 0.1° resolution) is shown in Figure 4a. The peatland in Southern Papua is shown in Figure 4b. Figure 4a clearly shows active fire occurrences in 2015 under El Niño, with hotspot numbers (HSs > 10) in many grid cells. As there is about 111 times of area difference between 1° × 1° and 0.1° × 0.1° resolution grid cells, HSs in many grid cells in Figure 4a are larger than the largest number (>7.3 (=815/111)) in Figure 1c.
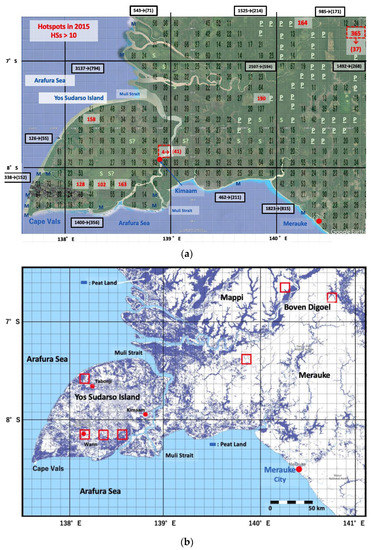
Figure 4.
Fire distribution and vegetation map. (a) Fire distribution map using high-resolution grid cell (0.1° × 0.1°) in the Southern Papua (6.6–8.6°S, 137.6–140.8°E). Eleven fire grid cells (lower than 6.0°S) in Figure 1c. The 10-year average HSs (1° × 1° resolution in Figure 1c) of the 11 grid cells are shown, with values in 2015 such as “3137→(794)” at their appropriate locations. Blank cells show weak fire areas (HSs number = 1–9). Grid cells without fire (HS = 0) are indicated by M for mangrove forest, S for savannah, and P for primary dryland forest, taking the initials of forest cover. (b) Peatland map in Southern Papua. Base map: “Global peatland extent”. Accessed through Global Forest Watch (https://www.globalforestwatch.org, accessed on 3 May 2023).
The red numbers in Figure 4a show seven cells where the number of HS is greater than 100, and their locations are shown with red-line rectangles in Figure 4b. Among seven cells with red numbers in Figure 4a, four cells are on Yos Sudarso Island, and the other three cells are in the northeastern part of the map or inland of Papua. The highest number of HSs of 365 is located in the most northeastern cell (6.7–6.8°S, 140.7–140.8°E). Most of the HSs in this cell were detected only in 2015 and 2016. Thus, the annual average of ten years is just 37 (=372/10). This fire occurrence suggests that fires may mainly be related to human activities. Similar trends were found for the other two inland fires or HSs cells of 190 (7.3–7.4°S, 139.8–139.9°E) and 164 (6.6–6.7°S, 140.2–140.3°E) in Figure 4a,b. On the contrary, as Yos Sudarso Island has all four cells with HSs more than 100 and a small number of blank cells (HSs < 10), we may say that most of the fuels are peat and will be burnable under dry conditions made by El Niño. On the other hand, the number of HSs of one cell (7.8–7.9°S, 138.9–139.0°E)) in the northeast of Kimaan in 2015 is only 4, but annual average of ten years is 41. This fire-occurrence trend suggests that fires are occurring regardless of the weather or fires may mainly be related to activities of Kimaan inhabitant [28]. Fire-free grid cells (HSs = 0) in Figure 4a are indicated by M for mangrove forest, S for savannah, and P for primary dryland forest, taking the initials of forest cover. The P distribution in Figure 4a may indicate primary forest area to be conserved.
3.4. Various Fire Weather Conditions
From here, we discuss about various fire weather conditions in 2015 under El Niño (most active fire year) and 2021 under La Niña (weakest fire year).
3.4.1. Rainfall and Fire in 2015 and 2021
Figure 5 shows the rainfall and fire occurrence in 2015 (El Niño year) and 2021 (La Niña year). Figure 5a shows that a long drought in 2015 started from the end of April (transition period) and lasted until the middle of December. The total amount of rainfall during this long drought of about eight months (232 days) was only about 58 mm (0.25 mm day−1). As the average rainfall rate in Figure 3a is 0.88 mm day−1, we may say that the dry season in 2015 was very dry. On the contrary, in 2021, the rainfall rate during the transition and dry period from the end of April to the end of October (the green straight line in Figure 5a) was 2 mm day−1. Thus, the dry season in 2021 was very wet.
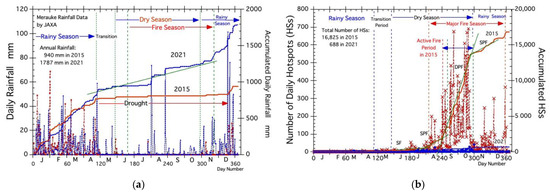
Figure 5.
(a) Rainfall in 2015 (El Niño year) and 2021 (La Niña Year) 2 mm/day. (b) Fire occurrence in 2015 (El Niño Year) and 2021 (La Niña year). SF, surface fire; SPF, shallow peatland fire; DPF, deep peatland fire.
Figure 5b shows active fires in 2015 and weak fires in 2021. In 2015, under El Niño, the very active fire period with a high fire rate of 224 HSs day−1 (about four times higher than average) began in late August about 2 weeks earlier than normal. This high fire rate suggests the occurrence of a deep peatland fire (DPF). The total number of HSs during about 2 months was about 12,000 (72% of total HSs in 2015). Those active fires occurred under the abovementioned strong drought conditions due to El Niño, as shown in Figure 5a. On the contrary, fires in 2021 were very weak due to rainfall in August (the middle of dry season; see Figure 5a).
3.4.2. Weather Conditions in 2015 and 2021
- Diurnal change of temperature and humidity
Since fires are usually more active at higher temperatures, the positive relationship between fire and temperature can be shown by using NOAA’s daily average temperature map. We already reported that fires in high latitudes, such as in Alaska and Sakha, were activated in the presence of warm air masses (cT: continental Tropical) that moved northward from the midlatitude high-pressure zone [32,33,34,35,36]. Subtropical fires in Southeastern Bangladesh were also active under above-normal temperatures [37].
Figure 6 shows the diurnal temperature and relative humidity (RH) in Merauke. The x-axis in Figure 6 is the time of day, and thirteen temperature and humidity data are averaged: the average air temperatures and RH during October 7–19 (same period of Figure 6 and Figure 7) in 2015 and 2021. Figure 6 shows that air temperatures at noon were 29.4 °C in 2015 (El Niño) and 30.5 °C in 2021 (La Niña). There are diurnal temperature variations of about 7 °C in 2015 and 5 °C in 2021. Their RHs at noon were about 65% in 2015 and 73% in 2021. Although there were cooler temperatures in 2015, the temperature increase rate (ΔT) and the RH (ΔRH) from 6:00 a.m. to 9:00 a.m. were 2.3 °C h−1 and −10.3% h−1, and they were greater than those values of 1.4 °C h−1 and −6.5% h−1 in 2021. These large values during the morning hours in 2015 suggest active fire outbreaks and will be important indicators of fire weather. Actually, the ΔT and ΔRH values during each active fire period in Central Kalimantan and South Sumatra in 2015 were 2.7 °C h−1 and −12.6% h−1 [20] and 2.2 °C h−1 and −10.4% h−1 [19], respectively.
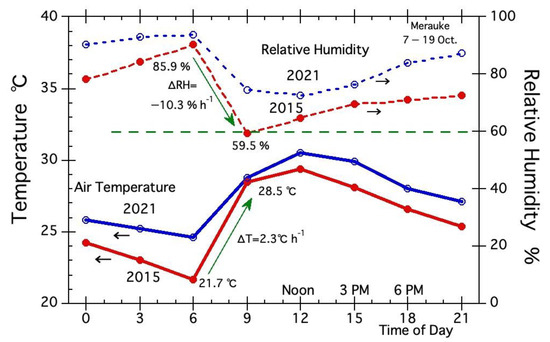
Figure 6.
Averaged wind speed and wind direction of three-hourly data from 7 to 19 October in 2015 and 2021. Total numbers of missing data (temperature and humidity) in 2015 and 2021 are 5 and 0, respectively.
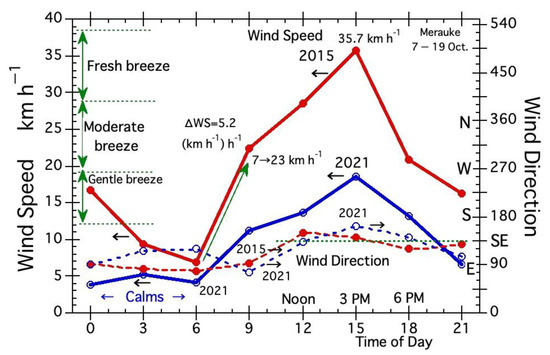
Figure 7.
Averaged wind speed and wind direction of three-hourly data from October 7 to 19 in 2015 and 2021. Total numbers of missing and omitted data (wind speed) in 2015 and 2021 are 4 and 0, respectively. Two omitted data in 2015 are 150 and 143 km h−1. Total number of missing data (wind direction) in 2015 and 2021 are 3 and 0, respectively.
- 2.
- Diurnal change of wind speed and direction
To clarify the inverse trend of fire activity with air temperature (active fires in 2015 under lower air temperature), as described above, Figure 7 shows wind conditions at Merauke, using data every three hours from 7 to 19 October in 2015 and 2021. In 2015, active fires of more than 80 HSs continued from 7 to 19 October. The total number of HSs during this period was 3835 (23% of total HSs) in 2015 and 84 (12% of total HSs) in 2021.
The thirteen days’ average trend of wind speed and direction in Figure 7 showed that the maximum average wind speed was 35.7 km h−1 at 3 p.m. (lowest and highest wind speeds were 24 and 44 km h−1). In other words, a very fast wind speed of 35.7 km h−1 at 3 p.m. continued to blow for about two weeks during the active fire period in 2015. Thus, peatland fires in 2015 became very active under these very strong wind conditions. The diurnal wind speed range for 2015 is larger than that for 2021. In 2015, the wind speed changed from 6.8 km h–1 (lowest wind speed) at 6 a.m. to 35.7 km h–1 (highest wind speed, and classified as “fresh breeze”) at 3 p.m. In comparison, the highest and lowest wind speeds in 2021 were from 3.8 km h–1 at 0 a.m. to 18.6 km h−1 at 3 p.m. Totally, there were 15 calm conditions during 0 to 6 a.m. in 2021, shown by “Calms” at the bottom of Figure 7. Calm conditions were observed only in 2021 and may have occurred mainly due to a smaller temperature difference between sea and land. The wind speed increase rate (ΔWS) in 2015 and 2021 during the morning hours from 6:00 a.m. to 9:00 a.m. was 5.2 and 2.4 (km h−1) h−1, respectively.
In Central Kalimantan, the wind speed increased from 4 km h−1 at 9 a.m. to 28 km h−1 at 4 p.m. on 22 September 2015, and the average ΔWS was 3.4 (km h−1) h−1 [20]. In South Sumatra, the wind speed increased from 9 km h−1 at 7:30 a.m. to 19 km h−1 at 9:30 on 30 August 2015, and the average ΔWS was 5 (km h−1) h−1 [19]. Thus, a relatively high ΔWS in the morning will be a sign of an active fire day.
The diurnal wind direction range in Figure 7 also showed the following: The similar wind direction of both years suggests that their wind directions are prevailing wind direction in this period (from 20 to 24 October) in Papua. This condition is due to (i) the differences in physical properties between the ocean and the continent cause monsoon winds; the ocean has a higher heat capacity than the continent; and (ii) the trade winds from the southeast and northeast, as well as the equatorial or monsoon westerlies, affect Papua [38,39].
3.5. Various Fire Related Index
From here, we discuss various indices related to ENSO, El Niño and La Niña.
3.5.1. Synoptic-Scale Sea Surface Temperature Anomaly (SSTA)
Among the various NOAA weather maps, we present the SSTA map as the best chart for assessing fire activity in Papua Province. Figure 8 shows the sea surface anomaly (SSTA) in 2015 under El Niño and 2021 under La Niña. The period was set for 7–19 October, one of the very active fire periods in 2015. Total temperature number of HSs during this period were 3835 (23% of total HSs) in 2015 and 84 (12% of total HSs) in 2021.
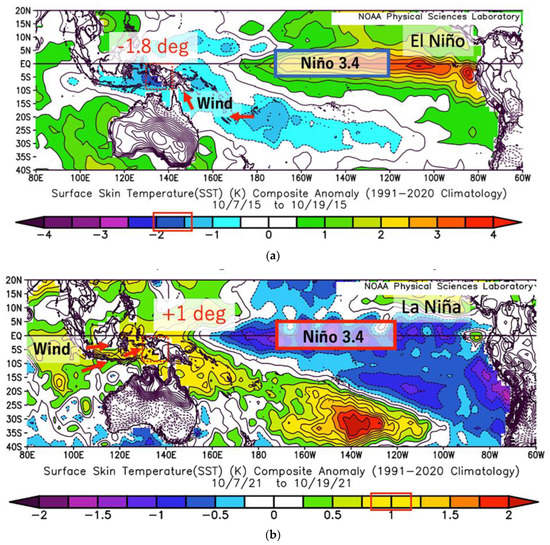
Figure 8.
Average sea surface temperature during 7 to 19 October in 2015 and 2021 (20°N–40°S, 80–300°E). Note: A few arrows with red color show major wind vector derived from Figure 7. (a) Average sea surface temp. from 7 to 19 October in 2015. (b) Average sea surface temp. from 7 to 19 October in 2021 (wet year).
In Figure 8, we focus on SST anomalies near Papua or the Northern Arafura Sea. The SSTAs in 2015 and 2021 were −1.8°K and +1°K, respectively. As there is a high potential to be used as an indicator, SSTA for other years were also determined from the SSTA maps. We named this new index “N. Arafura”.
The correlation equation between annual total number of HSs and SST anomalies is as follows:
where HSs is the number of HSs, and [N. Arafura] is the index N. Arafura.
HSs = 2976.2 − 3715.1 [N. Arafura] + 2125.4 [N. Arafura]2 (R2 = 0.95737)
The strongest correlation among three correlation equations (Equations (1)–(3)) suggests that the SST anomalies at the Northern Arafura Sea (N. Arafura) may be the best index to evaluate fire activities for Papua.
3.5.2. Synoptic-Scale Wind Conditions
Figure 9 shows vector wind anomaly at surface in 2015 (El Niño Year) and 2021 (La Niña Year). In western (Northern Arafura Sea) and Southern Papua, Figure 9a shows easterly winds, and Figure 9b shows westerly winds. In the Southern Papua, the prevailing wind direction tends to be easterly in the dry season and westerly in the rainy season [40]. In 2015, the dry season was longer, as shown in Figure 5a, as a result of continued easterly winds from the Southern Pacific. In contrast, in 2021, westerly winds from the Indian Ocean resulted in more rainfall during the dry season, as shown in Figure 5a. Figure 8 indicates that the easterly winds in 2015 blew where SSTs were lower, and the westerly winds in 2021 blew where SSTs were higher. The high temperature in 2021 may be one of causes of rainfall during the dry season in 2021. As we known, the Indonesian seas become crucial passageways for the Asian–Australian monsoon (AAM) system in terms of atmospheric circulation. The AAM system is also referred to as the northwest monsoon (NWM), which peaks from December to February, and the southeast monsoon (SEM), which peaks from June to August, due to its wind characteristics. This condition drives the dry and rain season in most of Indonesia [41,42].
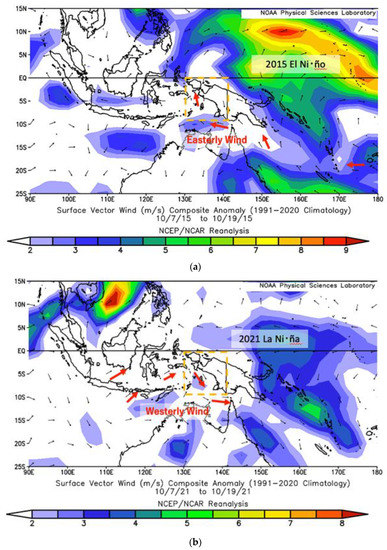
Figure 9.
(a) Surface Vector Wind Composite Anomaly from 7 to 19 October in 2015. (b) Surface Vector Wind Composite Anomaly from 7 to 19 October in 2021 (15°N–25°S, 90°–180°E).
4. Discussion
This study was conducted to identify the fire weather conditions needed to assess future peat fires under climate change in Indonesia. Due to the lack of diurnal weather data, many studies have indirectly evaluated active peatland fire weather by using meteorological indices such as Niño 3.4, ground water level (GWL), and sea surface temperature anomaly (SSTA). To assess future peat fires under climate change, fire weather conditions should be identified clearly. Namely, hourly data are required for fire weather analysis. However, hourly data were very difficult to find, and as there is only a list of hourly data in day-by-day data, the process of converting these data into consecutive daily data for analysis was time-consuming. However, we are able to analyze the fire weather conditions in three peatlands in Indonesia by using the available hourly data. Two reports on peatland fires in Sumatra and Central Kalimantan are already published [19,20]. The main results of fire weather conditions in this report are compared below.
4.1. Diurnal Weather Data
We are now analyzing fire weather conditions for four major peatland fires in Indonesia. They are in Southern Papua, Central Kalimantan [20], and South and North Sumatra [19]. We found four weather stations which have diurnal weather data near four major peatlands. Table 1 shows their locations, data type, and data deficit percentages during each fire period. However, no other stations have diurnal weather data. For future weather analyses, Indonesia needs to have such data and store them as national natural science data.

Table 1.
List of available diurnal weather data *1 in Indonesia and Malaysia.
4.2. Morning Weather Change
As shown in Figure 6 and Figure 7, there is a relatively large increase in temperature and wind speed (WS) and a drop in the relative humidity (RH) during the morning time. The temperature increase rate (ΔT, °C h−1), RH decrease rate (ΔRH, % h−1), and WS increase rates (ΔWS, (km h−1) h−1) during the morning time are summarized in Table 2, along with their corresponding values in Kalimantan [20] and Sumatra [19].
Table 2.
List of morning weather changes.
Most of the ΔT, ΔRH, and ΔWS values are larger than those values in the comparison year. This morning-time trend may be one of fire weather conditions and will be used for the forecast.
4.3. Maximum and Minimum Values of Weather Data
Maximum and minimum values of temperature (Tmax), wind speed (WSmax), and relative humidity (RHmin) during each active fire period are summarized in Table 3. The highest value of WSmax (35.7 km h−1, see Figure 7) among six active fire periods in Table 3 shows the following: Fires in October 2015 in Southern Papua became very active due to strong wind even if the temperature was lower than 30 °C and the RH is higher than 60%. Other active fires in Central Kalimantan [20] and in North and South Sumatra [19] occurred under a high temperature of more than 33 °C, an RH less than about 50%, and a strong wind higher than about 15 km h−1.
Table 3.
List of maximum and minimum values of weather data during each active fire period.
5. Conclusions
The objective of this study was to determine the fire weather conditions needed to assess future peatland fires under climate change. Analyses using diurnal meteorological data revealed the weather conditions during active fire periods, namely the fire weather conditions in Papua. In particular, we compared the weather conditions of active fires in 2015 under El Niño with those in 2021 under La Niña, showing important differences. The main conclusions are summarized below.
- The average active fire period (fire rate, 51.5 HSs day−1) from 10 September to 21 October (42 days) occurred at the end of the dry season or just before the rainy season (Figure 3). A high fire rate suggests the occurrence of deep peatland fires (DFPs).
- In 2015, under El Niño, the very active fire period with a high fire rate of 224 HSs day−1 (about 4 times higher than average) began in late August about 2 weeks earlier than normal (Figure 5b).
- Active fires in 2015 occurred under the long period of drought (about eight months (232 days) from late April) and strong drought conditions (total rainfall was about 58 mm (0.25 mm day−1)) due to El Niño (Figure 5a).
- During active fire period in 2015, the temperature increase rate (ΔT), the RH decrease rate (ΔRH), and the wind speed increase rate (ΔWS) during morning hours from 6:00 a.m. to 9:00 a.m. were 2.3 °C h−1, −10.3% h−1, and 5.2 (km h−1) h−1, respectively (Figure 6 and Figure 7). These values suggest active fire outbreaks and will be important indicators of fire weather conditions.
- As a very fast wind speed of 35.7 km h−1 at 3 p.m. continued to blow for about two weeks during the active fire period in 2015, we may say 2015 fires can be described as wind-driven fires (Figure 7).
- We showed a relatively large difference in sea surface temperature anomaly (SSTA) in the Northern Arafura Sea between −1.8°K in 2015 and +1°K in 2021 (Figure 8).
- We named SSTA in Northern Arafura Sea “N. Arafura”. A new index, “N. Arafura”, has strong correlation with annual total number of HSs (Equation (3) and Figure 8) and will be used to predict future fire activity in Papua.
Finally, the results of this report may help to predict fire activity under high temperatures in the future based on predictions of global warming performed by other researchers. The rapid air temperature increase rate from morning will be useful for fire forecast in Papua.
Author Contributions
Conceptualization, N.Y. and H.H.; methodology, H.H.; software, N.Y.; validation, N.Y and H.H.; formal analysis, N.Y. and H.H.; writing—original draft preparation, N.Y.; writing—review and editing, N.Y. and H.H.; visualization. N.Y. and H.H.; supervision, H.H. All authors have read and agreed to the published version of the manuscript.
Funding
This research received no external funding.
Data Availability Statement
This study used MODIS hotspot data obtained from the NASA Fire Information for Resource Management System (FIRMS; MODIS Collection 6, https://firms.modaps.eosdis.nasa.gov/download/, accessed on 10 September 2021). SST anomalies were obtained from the NCEP/NCAR 40-year reanalysis data, https://psl.noaa.gov/data/composites/day/(accessed on 15 January 2023). Thematic spatial data of Indonesian land-cover scale 1:250,000 can be found on the Ministry of Environment and Forestry’s website, https://sigap.menlhk.go.id/sigap/peta-interactive (accessed on 12 June 2021).
Acknowledgments
We thank our colleagues from Papua Region of APIK Indonesia Network, Indonesia Expert Network on Climate Change and Forestry, who supported the information regarding Papua Province. The “NCEP/NCAR 40-Year Reanalysis Project” deserves our gratitude.
Conflicts of Interest
The authors declare no conflict of interest.
References
- Langner, A.; Miettinen, J.; Siegert, F. Land cover change 2002–2005 in Borneo and the role of fire derived from MODIS imagery. Glob. Chang. Biol. 2007, 13, 2329–2340. [Google Scholar] [CrossRef]
- Hoscilo, A.; Page, S.E.; Tansey, K.J.; Rieley, J.O. Effect of repeated fires on land-cover change on peatland in southern Central Kalimantan, Indonesia, from 1973 to 2005. Int. J. Wildland Fire 2011, 20, 578–588. [Google Scholar] [CrossRef]
- Miettinen, J.; Shi, C.; Liew, S.C. Deforestation rates in insular Southeast Asia between 2000 and 2010. Glob. Chang. Biol. 2011, 17, 2261–2270. [Google Scholar] [CrossRef]
- Hooijer, A.; Page, S.; Jauhiainen, J.; Lee, W.A.; Lu, X.X.; Idris, A.; Anshari, G. Subsidence and carbon loss in drained tropical peatlands. Biogeosciences 2012, 9, 1053–1071. [Google Scholar] [CrossRef]
- Page, S.E.; Rieley, J.O.; Banks, C.J. Global and regional importance of the tropical peatland carbon pool. Glob. Chang. Biol. 2011, 17, 798–818. [Google Scholar] [CrossRef]
- Dargie, G.C.; Lewis, S.L.; Lawson, I.T.; Mitchard, E.T.A.; Page, S.E.; Bocko, Y.E.; Ifo, S.A. Age, extent and carbon storage of the central Congo Basin peatland complex. Nature 2017, 542, 86–90. [Google Scholar] [CrossRef]
- Rieley, J. Mega Rice Project (MRP) Central Kalimantan. Available online: https://peatlands.org/is-indonesia-heading-for-another-mega-rice-project-disaster/ (accessed on 3 May 2023).
- Pörtner, H.-O.; Roberts, D.C.; Tignor, M.; Poloczanska, E.S.; Mintenbeck, K.; Alegría, A.; Craig, M.; Langsdorf, S.; Löschke, S.; Möller, V.; et al. (Eds.) IPCC, 2022: Summary for Policymakers. In Climate Change 2022: Impacts, Adaptation and Vulnerability. Contribution of Working Group II to the Sixth Assessment Report of the Intergovernmental Panel on Climate Change; Cambridge University Press: Cambridge, UK; New York, NY, USA, 2022; pp. 3–33. [Google Scholar]
- Oktaviani, R.; Amaliah, S.; Ringler, C.; Rosegrant, M.W.; Sulser, T.B. The Impact of Global Climate Change on the Indonesian Economy; IFPRI Discussion Paper 1148; International Food Policy Research Institute: Washington, DC, USA, 2011; Available online: http://ebrary.ifpri.org/cdm/ref/collection/p15738coll2/id/126762 (accessed on 3 May 2023).
- WBG Climate Change Knowledge Portal (CCKP, 2021). Available online: https://climateknowledgeportal.worldbank.org/country/indonesia/climate-data-historical (accessed on 2 April 2023).
- Aldrian, E. Decreasing Trends in Annual Rainfalls over Indonesia: A Threat for the National Water Resource? Geophysics and Meteorology Agency, Jakarta, Indonesia. 2007. Available online: https://www.researchgate.net/publication/284944836_Decreasing_trends_in_annual_rainfalls_over_Indonesia_A_threat_for_the_national_water_resource (accessed on 3 May 2023).
- Wang, B.; Luo, X.; Yang, Y.-M.; Sun, W.; Cane, M.A.; Cai, W.; Yeh, S.-W.; Liu, J. Historical change of El Niño properties sheds light on future changes of extreme El Niño. Proc. Natl. Acad. Sci. USA 2019, 116, 22512–22517. [Google Scholar] [CrossRef]
- Sulaiman, A.; Osaki, M.; Takahashi, H.; Yamanaka, M.D.; Susanto, R.D.; Shimada, S.; Kimura, K.; Hirano, T.; Wetadewi, R.I.; Sisva, S.; et al. Peatland Groundwater Level in the Indonesian Maritime Continent as an Alert for El Niño and Moderate Positive Indian Ocean Dipole Events. Sci. Rep. 2023, 13, 939. [Google Scholar] [CrossRef]
- Runtuboi, Y.Y.; Permadi, D.B.; Sahide, M.A.K.; Maryudi, A. Oil Palm Plantations, Forest Conservation and Indigenous Peoples in West Papua Province: What Lies Ahead? For. Soc. 2021, 5, 23–31. [Google Scholar] [CrossRef]
- Sloan, S.; Campbell, M.J.; Alamgir, M.; Engert, J.; Ishida, F.Y.; Senn, N.; Huther, J.; Laurance, W.F. Hidden Challenges for Conservation and Development along the Trans-Papuan Economic Corridor. Environ. Sci. Policy 2019, 92, 98–106. [Google Scholar] [CrossRef]
- Krisnawati, H.; Imanuddin, R.; Adinugroho, W.C.; Hutabarat, S. National Inventory of Greenhouse Gas Emissions and Removals on Indonesia’s Forests and Peatlands; Ministry of Environment and Forestry, Research, Development and Innovation Agency: Bogor, Indonesia, 2015; ISBN 9789798452642. [Google Scholar]
- Bambang, H.W.S.; Hasyim, B. Sebaran Lahan Gambut, Luas Dan Cadangan Karbon Bawah Permukaan Tanah Di Papua; Wetland Internasional: Bogor, Indonesia, 2006; ISBN 9789791641203. [Google Scholar]
- Kartikasari, S.N.; Marshall, A.J.; Beehler, B. Ekologi Papua, Seri Ekologi Indonesia, Jilid VI; Yayasan Pustaka Obor Indonesia: Jakarta, Indonesia, 2012; ISBN 9789794617960. [Google Scholar]
- Hayasaka, H. Peatland Fire Weather Conditions in Sumatra, Indonesia. Climate 2023, 11, 92. [Google Scholar] [CrossRef]
- Usup, A.; Hayasaka, H. Peatland Fire Weather Conditions in Central Kalimantan, Indonesia. Fire 2023, 6, 182. [Google Scholar] [CrossRef]
- Hooijer, A.; Silvius, M.; Woesten, H.; Page, S. PEAT-CO2 Assessment of CO2 Emissions from Drained Peatlands in SE Asia; Delft Hydraulics: Delft, Netherlands, 2006; p. 41. [Google Scholar]
- Gaveau, D.L.A.; Santos, L.; Locatelli, B.; Salim, M.A.; Husnayaen, H.; Meijaard, E.; Heatubun, C.; Sheil, D. Forest loss in Indonesian New Guinea (2001–2019): Trends, drivers and outlook. Biol. Conserv. 2021, 261, 109225. [Google Scholar] [CrossRef]
- Putra, E.I.; Hayasaka, H. The Effect of the Precipitation Pattern of the Dry Season on Peat Fire Occurrence in the Mega Rice Project Area, Central Kalimantan, Indonesia. Tropics 2011, 19, 145–156. [Google Scholar] [CrossRef]
- Peel, M.C.; Finlayson, B.L.; McMahon, T.A. Updated World Map of the Köppen-Geiger Climate Classification. Hydrol. Earth Syst. Sci. 2007, 11, 1633–1644. [Google Scholar] [CrossRef]
- Beck, H.E.; Zimmermann, N.E.; McVicar, T.R.; Vergopolan, N.; Berg, A.; Wood, E.F. Present and Future Köppen-Geiger Climate Classification Maps at 1-Km Resolution. Sci. Data 2018, 5, 180214. [Google Scholar] [CrossRef]
- Kottek, M.; Grieser, J.; Beck, C.; Rudolf, B.; Rubel, F. World Map of the Köppen-Geiger Climate Classification Updated. Meteorol. Z. 2006, 15, 259–263. [Google Scholar] [CrossRef]
- Eko Cahyono, W.; Setyawati, W.; Hamdi, S.; Cholianawati, N.; Yudha Kombara, P.; Julian Sari, W. Observations of Aerosol Optical Properties during Tropical Forest Fires in Indonesia. Mater. Today: Proc. 2022, 63, S445–S450. [Google Scholar] [CrossRef]
- Resubun, I. Beberapa Data Etnografis Manusia Dan Pulau Kimaam, Di Pantai Selatan Papua. Limen J. Agama Dan Kebud. 2020, 10, 56–80. [Google Scholar]
- Hayasaka, H.; Usup, A.; Naito, D. New Approach Evaluating Peatland Fires in Indonesian Factors. Remote Sens. 2020, 12, 2055. [Google Scholar] [CrossRef]
- Hayasaka, H.; Putra, E.I. Reassessment of Peatland Fires in Central Kalimantan. IOP Conf. Series Earth Environ. Sci. 2022, 959, 012053. [Google Scholar] [CrossRef]
- Yulianti, N.; Hayasaka, H.; Usup, A. Recent Forest and Peat Fire Trends in Indonesia The Latest Decade by MODIS Hotspot Data. Glob. Environ. Res. 2012, 16, 105–116. [Google Scholar]
- Hayasaka, H.; Tanaka, H.L.; Bieniek, P.A. Synoptic-Scale Fire Weather Conditions in Alaska. Polar Sci. 2016, 10, 217–226. [Google Scholar] [CrossRef]
- Hayasaka, H.; Sokolova, G.V.; Ostroukhov, A.; Naito, D. Classification of Active Fires and Weather Conditions in the Lower Amur River Basin. Remote Sens. 2020, 12, 3204. [Google Scholar] [CrossRef]
- Hayasaka, H.; Yamazaki, K.; Naito, D. Weather Conditions and Warm Air Masses in Southern Sakha During Active Forest Fire Periods. J. Disaster Res. 2019, 14, 641–648. [Google Scholar] [CrossRef]
- Hayasaka, H. Rare and Extreme Wildland Fire in Sakha in 2021. Atmosphere 2021, 12, 1572. [Google Scholar] [CrossRef]
- Hayasaka, H.; Yamazaki, K.; Naito, D. Weather Conditions and Warm Air Masses during Active Fire-Periods in Boreal Forests. Polar Sci. 2019, 22, 100472. [Google Scholar] [CrossRef]
- Farukh, M.A.; Islam, M.A.; Hayasaka, H. Wildland Fires in the Subtropical Hill Forests of Southeastern Bangladesh. Atmosphere 2023, 14, 97. [Google Scholar] [CrossRef]
- Tjasyono, H.B.T.; Gernowo, R.; Sri Woro, B.H.; Ina, J. Characteristics of Cloud and Rainfall in the Indonesian Monsoonal Areas. 2008. Available online: http://file.upi.edu/Direktori/SPS/PRODI.PENDIDIKAN_IPA/BAYONG_TJASYONO/Characteristics_of_Cloud.pdf (accessed on 19 May 2023).
- Wheeler, M.C.; McBride, J.L. Australian-Indonesian Monsoon. In Intraseasonal Variability in the Atmosphere-Ocean Climate System; Lau, W.K.M., Waliser, D.E., Eds.; Springer Praxis Books; Springer: Berlin/Heidelberg, Germany, 2005; pp. 125–173. ISBN 978-3-540-27250-2. [Google Scholar]
- Yamanaka, M.D. Physical Climatology of Indonesian Maritime Continent: An Outline to Comprehend Observational Studies. Atmos. Res. 2016, 178–179, 231–259. [Google Scholar] [CrossRef]
- Griffiths, M.L.; Drysdale, R.N.; Gagan, M.K.; Zhao, J.X.; Ayliffe, L.K.; Hellstrom, J.C.; Hantoro, W.S.; Frisia, S.; Feng, Y.X.; Cartwright, I.; et al. Increasing Australian-Indonesian Monsoon Rainfall Linked to Early Holocene Sea-Level Rise. Nat. Geosci. 2009, 2, 636–639. [Google Scholar] [CrossRef]
- Wirasatriya, A.; Susanto, R.D.; Kunarso, K.; Jalil, A.R.; Ramdani, F.; Puryajati, A.D. Northwest Monsoon Upwelling within the Indonesian Seas. Int. J. Remote Sens. 2021, 42, 5437–5458. [Google Scholar] [CrossRef]


Disclaimer/Publisher’s Note: The statements, opinions and data contained in all publications are solely those of the individual author(s) and contributor(s) and not of MDPI and/or the editor(s). MDPI and/or the editor(s) disclaim responsibility for any injury to people or property resulting from any ideas, methods, instructions or products referred to in the content. |
© 2023 by the authors. Licensee MDPI, Basel, Switzerland. This article is an open access article distributed under the terms and conditions of the Creative Commons Attribution (CC BY) license (https://creativecommons.org/licenses/by/4.0/).