Abstract
Gorgonians play a fundamental role in the deep sea (below 200 m depth), composing three-dimensional habitats that are characterized by a high associated biodiversity and playing an important part in biogeochemical cycles. Here we describe the use of a benthic lander to monitoring polyps activity, used as a proxy of gorgonian feeding activity of three colonies of Placogorgia sp. Images cover a period of 22 days with a temporal resolution of 30 min. In addition, this seafloor observatory is instrumented with oceanographic sensors that allows continuous monitoring of the hydrographic conditions in the site. Deep-learning is used for automatic detection of the state of the polyps registered in the images. More than 1000 images of 3 large specimens of gorgonians are analyzed, annotating polyps as extended or retracted, using the semantic segmentation algorithm ConvNeXt. The segmentation results are used to describe the feeding patterns of this species. Placogorgia sp. shows a daily pattern of feeding conduct, depending on the hours of day and night. Using a Singular Spectrum Analysis approach, feeding activity is related to currents dynamics and Acoustic Doppler Current Profile (ADCP) return signal intensity, as proxy of suspended matter, achieving a linear correlation of 0.35 and 0.11 respectively. This is the first time that the behavior of the Placogorgia polyps, directly related to their feeding process, is described.
1. Introduction
As cosmopolitan animals, deep-sea gorgonians are found in a wide variety of geographical locations and depth ranges, settling primarily on rocky substrates such as continental shelves, slopes, canyons, and seamounts [1]. Their typical fan shape adds an important three-dimensional component to the ecosystem, adding complexity to the seascape, attracting numerous epibenthic species and thus concentrating a high level of biodiversity [2,3]. However, gorgonians are highly vulnerable to impacts caused by fishing gear due to their fragility, low recovery capacity, and low growth rates [4,5,6]. As a result, they are included in the EU Habitats Directive as components of the 1170 Reefs and are cataloged as Vulnerable Marine Ecosystems (VME).
Gorgonians are passive suspension feeders and play an important role in biogeochemical cycles by transferring energy from the water column to the benthos [7,8]. The activity of the polyps, which includes expansion and retraction, depends mainly on food availability and local currents [9,10]. Octocorals are suspension feeders that primarily filter small organic particles from the water, including phytoplankton, ciliates, bacterioplankton [11,12], and mesozooplankton [13]. Although corals are known to feed on zooplankton and other particulate material, further studies are necessary to elucidate the specific natural prey per species.
Their fans may exceed one meter in height and are usually located perpendicular to the direction of the prevailing current [14,15]. This orientation strategy maximizes the volume of water flowing through the polyps, increasing their access to food.
The feeding behavior of deep-sea corals is influenced by environmental factors and food supply. Gorgonians seem to benefit from the acceleration of the current flow [16]. Some studies show that the optimal feeding rates for gorgonians are at moderate flow velocities. Feeding rates initially increase with flow velocity, reach a peak in the range of 8 to 15 cm·s−1, and then decrease with low and high flow velocities [17,18,19]. However, the optimal feeding speeds vary according to the species evaluated, and these types of studies are scarce.
The study of deep ecosystems is complex due to the difficulty of accessing them. Methodologies that require the extraction and death of specimens from the seafloor must be limited to avoid damage to these valuable ecosystems. For this reason, image-based studies are essential for increasing knowledge of deep marine ecosystems. Within this approach, the use of underwater Remotely Operated Vehicles (ROVs) or Remotely Operated Towed Vehicles (ROTVs) is a common practice. However, remotely operated vehicles record data at a specific time, and their use requires large oceanographic vessels with high costs and time-consuming operations.
Monitoring the activity rhythms of deep-sea coral species can provide information about basic biology, such as feeding and reproduction processes. Identifying the relationships between this activity and physical variables enables the replication of the behavior of the target species and modeling of their response to future conditions. The activity rhythms of gorgonian polyps during feeding processes are not well understood in most deep-sea species. Several similar studies have focused on cold-water coral reefs (CWC) dominated by Madrepora oculata Linnaeus, 1758, and Desmophyllum pertusum (Linnaeus, 1758). These reefs can be found at moderate depths in northern latitudes and are transferable to captive experiments due to their survival in aquariums. These factors facilitate the study of polyp activity or rhythms in the CWC [20,21,22]. In deeper areas, the feeding rhythm of the Paragorgia arborea and its relationship with hydrographic conditions have been studied in detail [23,24,25].
In order to understand the dynamics and behaviors of deep-sea species, it is necessary to develop methodologies that allow the capture of data from deep-sea habitats over long periods of time. This approach can be achieved with deep multiparameter observatories or oceanographic landers. This tactic is useful for evaluating benthic species and habitat characterization in Marine Protected Areas (MPAs) and VME using underwater cameras [26,27,28]. It is a technological challenge to achieve systems with numerous sensors that work at great depths and remain in operation for long periods of time. Moreover, reducing the costs will make it possible to have more sampling sites and increase our observation capacity.
As our ability to observe deep habitats advances, the need to develop image-processing methodologies based on automation techniques becomes more evident. Deep-learning-based techniques have boosted ocean data processing. Using these algorithms, image annotation can be carried out automatically, achieving the automatic identification and classification of species that inhabit the deep sea [29,30,31], and even advancing in the mapping of deep-sea habitats [32,33,34,35]. The use of a deep learning model for the semantic segmentation of images, also known as pixel-level classification, is a task in computer vision that involves classifying each pixel in an image into one of several predefined classes. This technique seems useful for applications such as self-driving cars and medical image analysis, but its application in underwater images is still scarce. However, this technique has proven to be a significant advance in the process of automating the labeling of underwater images [36,37,38].
Marine Protected Areas are important conservation tools to mitigate the effects of climate change and other anthropic pressures on marine ecosystems, as well as to protect biodiversity, emphasizing VME characteristic species, as cold water corals and sponges grounds. Studies on deep-sea corals help us better understand their biology and the role they play in ecosystems. Given their high vulnerability to anthropogenic impacts, such as deep-sea mining or fishing, this information is essential to understand in detail the effects of these human activities on them [39]. Therefore, the aims of this study are to (1) describe the activity of the gorgonian Placorgia sp. polyps, (2) to develop an automatic methodology to monitor feeding activity using deep learning, and (3) to relate gorgonian behavior to environmental conditions and food availability.
2. Materials and Methods
2.1. Study Area
Le Danois Bank, also known as “El Cachucho”, the first offshore Marine Protected Area (MPA) in Spain [40], is located in the Cantabrian Sea, off the northern coast of Spain. It is a large offshore bank and seamount surrounded by slopes and a complex system of channels and canyons (Figure 1a). This MPA was later included in the OSPAR Network of MPAs in 2009 and the Natura 2000 Network as a Special Area of Conservation (SAC) in 2011. The management plan includes specific measures for fishing activities, oil exploration, minerals and military activity. The bank and its intra-slope basin cover an area of 234,000 hectares, with depths ranging from 425 to 4000 m. The main circulation patterns show the presence of anticyclonic flow at the seamount summit. However, the entire system is affected by strong and variable along-slope currents, making it a complex and dynamic environment [41]. These characteristics make the MPA a crucial biodiversity hotspot in the Cantabrian Sea [42].
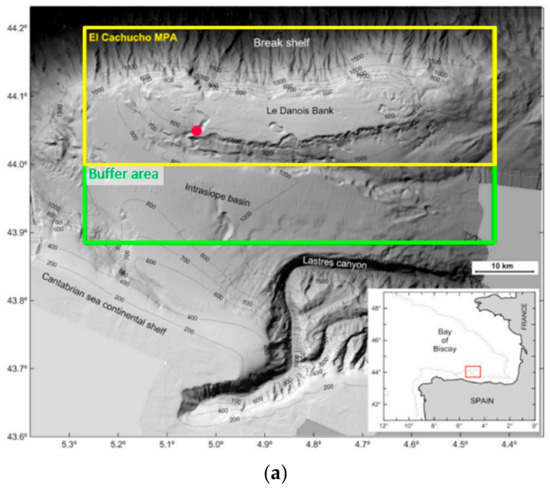
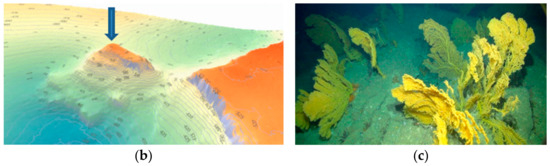
Figure 1.
(a) Location map of El Cachucho MPA. The red circle shows the location of the gorgonian forest, yellow square is MPA limits and green square is the buffer area; (b) 3D bathymetric detailed map of the zone and the arrow indicates location of the lander deployment site; (c) Some of Placogorgia sp. colonies settled in the rocky substrate of the gorgonian forest.
The area is home to deep gorgonian forests, which were crucial in its designation as MPA. The gorgonian Placogorgia sp. forest, where this study is focused, is located in a hard bottom seamount in the southwest of the bank, with a bathymetric range of 500 to 600 m and a surface area of 2.88 hectares (Figure 1b). The gorgonian colonies in this area are fan-shaped and grow at different densities, curvatures, and with varying numbers of branches (Figure 1c).
2.2. Placogorgia sp. Colonies Morphometric Characterization
The use of photogrammetric techniques has greatly advanced the study of benthic species by enabling three-dimensional reconstructions of marine habitats. This approach provides a precise measurement of the size and orientation of specific specimens and allows for accurate evaluation of the habitat’s three-dimensional component, which is directly related to the biodiversity associated with it [43,44,45]. Estimation of gorgonian population structure (i.e., maximum height, density), morphometrics (i.e., maximum width, fan area), and biomass are valuable data for description of gorgonian forests [46,47]. It has also been useful in studying basic aspects of the biology of sessile species, such as growth rates and degradation suffered in coral reefs [48,49,50,51,52,53].
In 2019, a detailed characterization of the 3D sizes of this gorgonian population was carried out [47], generating valuable information about the group of gorgonians that inhabit this area, being for the moment the only aggregation of this species present in the entire protected area. The study was carried out through the analysis of the video transects obtained at the Le Danois Bank, using the Politolana underwater towed vehicle during the July 2017 ECOMARG survey. Video-sections were decomposed in thousands of geo-positioned overlapping images processed using photogrammetric Pix4D Mapper Pro software (Pix4D SA, Prilly, Switzerland). This software carries out an advanced automatic triangulation based purely on image content and an optimization technique. The triangulation algorithm is based on binary local key points, searching for matching points by analyzing all images. Those matching points, as well as approximate values of image position and orientation provided by the Politolana telemetry system, are used in a bundle adjustment to reconstruct the most probable position and orientation of the camera for every acquired image. For this study, the focal length, principal point and radial/tangential distortions were set as initial theoretical values, while the final internal and exterior orientation parameters of the camera were determined by bundle adjustment processing. The distance between parallel lasers beams (separated 20 cm) is used as reference scale. Using three-dimensional reconstructions, the size and orientation of each of the three specimens were calculated by digitizing the contour of the fan in the point cloud. The orientation and surface area covered by the fan were directly related to the specimens’ ability to capture food and withstand the existing currents in the area.
2.3. Image and Oceanographic Data Registration
In May 2022, a lander was deployed in a gorgonian forest at a depth of 515 m using a new vehicle called LanderPick [54]. The LanderPick concept (Figure 2a) consists of a specific towed vehicle that deploys and recovers lightweight oceanographic landers. The system allows the lander to be positioned with high accuracy at the desired geographical point using the Super Short Base Line (SSBL) system and the Dynamic Positioning System of the oceanographic vessel. LanderPick uses a real-time video camera, lasers, and thrusters to choose its orientation and facing camera to the specific target (Figure 2b). It also allows the recovery of landers without the need for automatic releases or abandoning material at the bottom. The low-cost design makes it possible to reduce the price of deployments operations, thereby increasing the observation capabilities of deep-sea ecosystems.
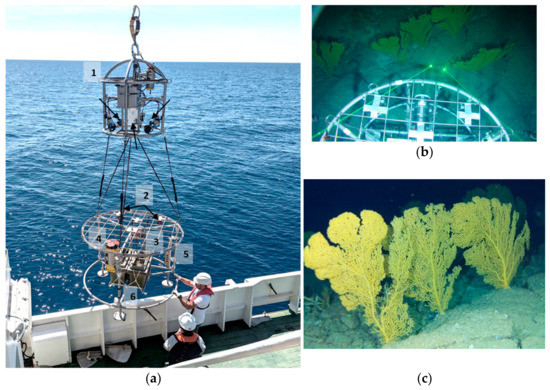
Figure 2.
Description of the data acquisition (a) Moment of the maneuver on the vessel starboard deck with the LanderPick vehicle. Design and equipment of the lander system: 1. Landerpick: deploy/recovery system, 2. Flashes (2), 3. High definition camera, 4. ADCP, 5. CTD, 6. Batteries; (b) Positioning and facing operation of the lander with the LanderPick vehicle in front of the 3 colonies of gorgonians; (c) view of the registered images.
The camera system is based on a Raspberry Pi4 computer with a HQ Sony IM477 12.3 megapixels sensor. For data storage an external USB 3.0 250 Gb SSD was chosen. The time-lapse controller is based on an Arduino Pro Mini. This programmable module maintains the low-cost concept. The programming language is Python for the Rapsberry and C for the Arduino-based time-lapse PLC controller. For lighting, it was necessary to develop a system of spotlights based on high luminosity COB LED chips experimentally adjusted to 40 W to maintain low power consumption. To power the system two independent 12 v 150 Ah AGM batteries mounted in fiberglass containers flooded with dielectric oil with an elastic pressure compensation membrane were used. The camera was located 0.8 m above the sea floor with an angle of 30° and configured in time-lapse mode with an interval of 30 min. To describe the hydrographical conditions, the lander is equipped with an upward-looking Acoustic Doppler Current Profiler (ADCP) RDI Workhorse Sentinel 300 kHz recording the vertical structure of the currents every 20 min, a SeaBird37 CTD (Conductivity-Temperature-Depth) recording at 20-min intervals, and an RBR solo-T thermistor with a high sampling rate of 5 s.
The camera was placed 1.5 m away from a group of colonies of Placogorgia sp. The three complete specimens selected for this study are recorded in the camera’s Field Of View (FOV) (Figure 2c). From 6 to 29 May 2022, photographs were taken every 30 min, generating a dataset of 1074 images. On the other hand, the oceanographic variables were recorded from 6 May to 22 October 2022, corresponding to the total duration of the deployment.
2.4. Image Processing
In this section, a semantic segmentation model is employed to assign each pixel of the images to specific classes. The selected model is based on ConvNeXt [55], a neural network architecture that has demonstrated its effectiveness in segmentation tasks, similar to the one being addressed in this study. The pre-defined classes are class 1, which corresponds to active polyps, and class 2, which includes inactive polyps, including intermediate polyp states where the polyps are partially contracted. Therefore, class 1 only comprises the part of the scene where the polyps are fully expanded, enabling the observation of gorgonian behavior at different spatial scales: overall scene, per gorgonian, and intra-specimens (apical, central, and basal zone of the gorgonian fan).
2.4.1. Training and Test Dataset
To perform this task, it was decided to work with approximately one-fifth of the total images, given that gorgonians are static elements and do not exhibit significant changes across the image set. Therefore, a 70-image dataset was selected for training (50 images) and validation (20 images), while a set of 30 randomly selected images was used to test the best model. Evaluation of the model’s performance was carried out using metrics such as precision and the Jaccard index or IoU (Intersection-Over-Union) [56].
2.4.2. Data Augmentation
To expand the data variability and improve the model’s generalization capacity [57,58], data augmentation techniques were applied to the training and validation dataset. Given the small number of samples and the similarity between them, brightness and contrast variation, rotation, and cropping were selected as data augmentation methods. A preliminary visual analysis of the image set revealed differences in gorgonian position due to movement, as well as in illumination and blur, primarily due to water turbidity and camera configuration.
2.4.3. Model
ConvNeXt is a deep learning backbone that is used for semantic segmentation. It is an up-to-date convolutional network and an adaptation of old convolutional networks such as Resnet, with newer techniques like vision transformers. This adaptation enables ConvNext to become one of the most powerful tools for image segmentation. ConvNeXt is a convolutional neural network or CNN-type neural network architecture that differs from other architectures because it uses Convolution blocks with channel groups, improving the network’s learning capacity [59,60].
The ConvNeXt architecture consists of several Convolution blocks with channel groups, followed by pooling layers and fully connected layers. The Convolution blocks with channel groups are an improvement to conventional Convolution layers, as they divide the input channels into groups and only connect them to a subset of the output channels, reducing the number of parameters in the network and improving its learning capacity. The ConvNeXt architecture is characterized by having Convolution blocks with channel groups and a residual Convolution block structure, improving the network’s learning capacity and reducing overfitting. Moreover, it can have multiple Convolution blocks with channel groups followed by pooling layers and fully connected layers, achieving better performance in computer vision tasks.
The ConvNeXt block is illustrated in Figure 3, with the convolution layer being followed by Linear Normalization and Gaussian Error Linear Unit (GELU). To obtain the best model, the selected model was trained with different variations of the training parameters.
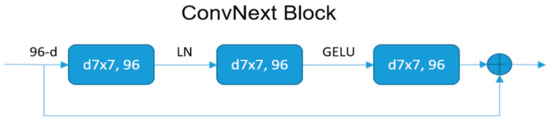
Figure 3.
ConvNeXt block architecture with the different layers: convolution layer, Linear Normalization (LN) and Gaussian Error Linear Unit (GELU).
The block above applies a mathematical operation called convolution, which is a process of multiplying a small matrix, called a kernel or filter, over a section of the input image. This operation is performed at all possible positions of the image, generating a new image called a feature map.
After the convolutional layer, the ConvNeXt network applies the Linear Normalization layer, which normalizes the activations of the feature map using the Frequency Division Normalization (FDN) technique. This layer helps to reduce the covariance between channels of the previous layer and improve the generalization ability of the network.
Finally, the network applies the Gaussian Error Linear Unit (GELU) activation layer, which is a non-linear function used to introduce non-linearities in the network. Where is the input to the activation function and is the cumulative distribution function of the standard normal distribution. It is a mathematical function that assigns a cumulative probability to a given value of the standard normal random variable, also known as the error function.
2.5. Temporal Dynamics Analysis
The annotated images obtained through automatic segmentation have been analyzed according to predefined categories. The data on polyp activity have been independently analyzed for each gorgonian specimen to determine whether there are any differences in behavior among the three specimens or if they exhibit a common pattern. The temporal patterns of extension and retraction, as well as the duration of each period, have been compared. By using a semantic segmentation model, an analysis of the states of the polyps within each gorgonian specimen has been conducted to identify any differences in activity based on their location within the specimen. Each specimen has been divided into three sections (apical, central, and basal), and the activity of each zone has been described and compared.
The feeding activity of the Placogorgia sp. forest has been defined by analyzing time series that describe the activity of the polyps and integrating the percentage of extended/retracted polyps from the overall scene. This method allows for a more accurate description of the feeding activity and also enables the behavior of the specimens to be related to the unique environmental variables recorded in the area.
Two temporal scales have been used to explore the existence of patterns in polyp activity and its relation to the environmental dynamics; (1) the behavior of the polyps based on the time of day (diel), that is, the averaged percentage of active polyps over 30-min sampling periods throughout the day, and (2) the half-hourly behavior over the whole period covering a time series of 22 days.
To address this analysis, a Singular Spectrum Analysis (SSA) approach was used. SSA is a time series analysis method that decomposes and forecasts time series data using tools from time series analysis, multivariate statistics, dynamical systems, and signal processing, and employs the singular value decomposition as its main mathematical tool [61]. SSA decomposes the original time series into a trend component and oscillatory components that can be associated with periodicity and noise. Time series data is analyzed using a trajectory matrix constructed from lagged vectors. The matrix is a Hankel matrix and can be decomposed into eigenvectors and eigenvalues. By selecting a certain number of eigenvectors, a lower-dimensional subspace can be defined, onto which the data is projected, the resulting matrix is an approximation to the original trajectory matrix [62]. It should be noted that is a model-free method, meaning it can be applied to all types of time series data and is not restricted to monthly or quarterly data, unlike some other methods that have only been programmed for monthly or quarterly series [63]. SSA analysis was implemented using the Rssa library [64] in R [65].
3. Results
3.1. Placogorgia sp. Colonies Morphometric Characterization
The size of the three colonies was measured in three-dimensional space, and the height, width, and fan surface area covered by each specimen were selected as suitable parameters of colony size (Figure 4). The fan surface area, with an average of 0.33 m2, is a more representative parameter of biophysical characteristics, such as biomass, age, number of polyps, and feeding capacity. The geometry size of each colony was calculated using a complete three-dimensional digital model of the gorgonians, and the irregular perimeter of each colony was manually digitized on the 3D point cloud. The main data on the 3D point cloud densification and geometry size of each colony are presented in Table 1 and Table 2.
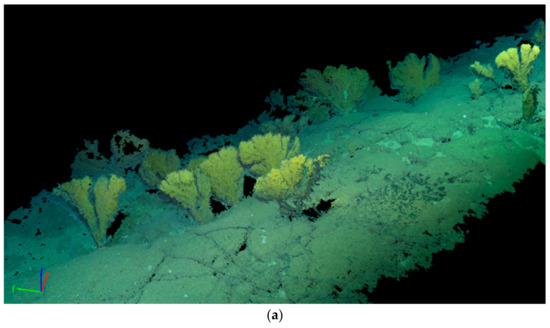
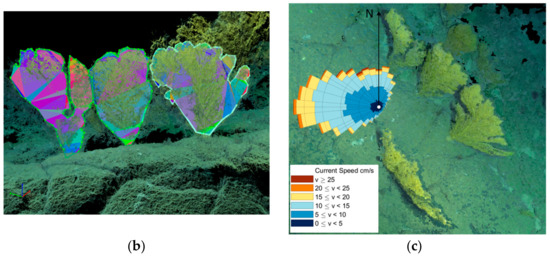
Figure 4.
Three-dimensional point cloud reconstruction of study site. (a) General view of the zone; (b) Zoom in the digitalized perimeter of colonies with the perimeter enclosed area forming with successive planar triangles (colors used to distinguish different triangles); (c) Three-dimensional point cloud with current representation (speed and direction).

Table 1.
Data on the 3D point cloud densification.
Table 2.
Data on the geometry size of each colony.
3.2. Hydrographic Dynamics
Regarding the hydrographic conditions registered at the deployment site (Figure 5), from May to October, it could be observed that the general current cycle is a pulse towards the West during low tide. This current rotates north and weakens, practically disappearing towards the NE phase. During June, warmer waters entered the site, and stronger currents were recorded in autumn. In May, which comprises the lander image acquisition, the environmental data registered matched the general current regime, and no anomalous event stood out. Relating to the specific geometry of these three gorgonian colonies with the environmental data registered at the site, it can be seen how these specimens are settled with the concave side facing the prevailing current flows, although not strictly perpendicular (Figure 4c).
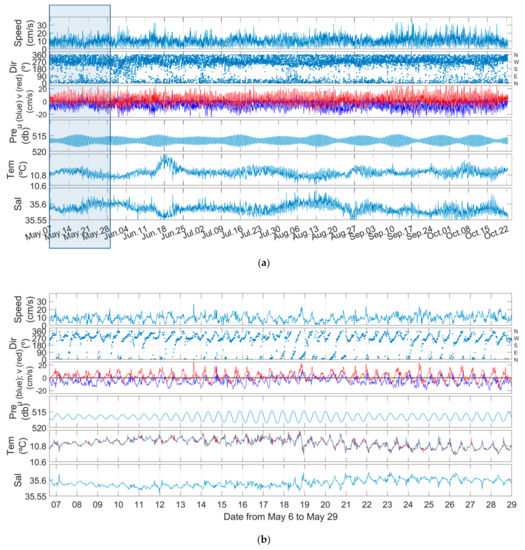
Figure 5.
Environmental variables registered at site. From top to down: current speed, current direction, current (u, v) components, pressure, temperature and salinity. (a) Environmental variables records from the lander over the duration of the deployment, 7 May–22 October 2022. Blue rectangle indicates photo registration period; (b) Environmental variables records from the lander over the photo registration, 6 May–29 May 2022.
3.3. Semantic Segmentation Model Performance
The application of the semantic segmentation model results in the classification of each pixel image into predefined classes, namely background, active polyps, and retracted polyps. From the 1074 images in the enclosed dataset, 50 images were used for training, 20 for validation, and 30 for testing. A data augmentation strategy was applied, increasing the initial training set from 50 images to over 250. Several pre-trained weights of ConvNeXt are available, but in this study, ConvNeXt-B pre-trained with the ADE20K dataset was chosen. Transfer learning was applied, changing a few parameters of the pipeline to adapt the model to this specific task.
Due to the high resolution of the images a batch size of 4 was chosen, a smaller batch size reduces the amount of memory required to train the model and help prevent overfitting, along with an AdamW optimizer, using a βs value of (0.9, 0.999). A learning rate of 0.0001 ensured a slow and steady learning process allowing the model to converge to a good solution without overshooting. To add regularization to the model and prevent overfitting the weight decay was set to a value of 0.05, together with a dropout value of 0.1. Finally, through experimentation on the validation set, the best epoch was found to be 40. This value represents the point at which the model achieved the best performance without overfitting to the training data.
The results obtained for the test set of 30 images were functional, with an average precision of 99% and an IoU of 96.4%. This means that the model can correctly classify 99% of the pixels in the test images and has a 96.4% form similarity with the true labels. Table 3 and Table 4 present the results of evaluations on 30 different random images with a percentage of class presence close to 1/5, indicating that for each closed gorgonian, about four open gorgonians can be found, which resembles the behavior observed by experts in the biology of the species. In addition to these metrics, visual tests were performed to assess the quality of the segmentations generated by the model. The results showed a high degree of precision in the identification of objects and areas of interest in the images (Figure 6).
Table 3.
Mean accuracy and IoU over test dataset.
Table 4.
Accuracy and IoU over classes.
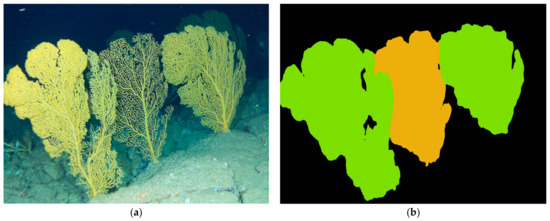
Figure 6.
Results of the segmentation generated by the implemented model (a) An original image, center colony appears with retracted polyps; (b) Result of the automatic segmentation with the areas of interest colored by category (green: active, orange: retracted).
3.4. Temporal Behavior of Polyps and Its Relation with Environmental Dynamics
Direct visual observation of the image data series revealed that the periods in which the Placogorgia sp. gorgonians remain with the polyps extended in the feeding process are always greater than the periods in which the polyps remain retracted. Figure 7 shows the total percentage of open polyps in the image during the 22 days of sampling in 30-min intervals. Yellow tones represent 100% of active polyps in the scene, while purple or blue colors represent retracted polyps moments.
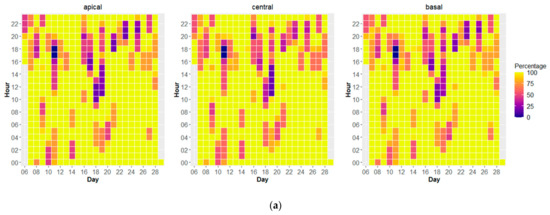
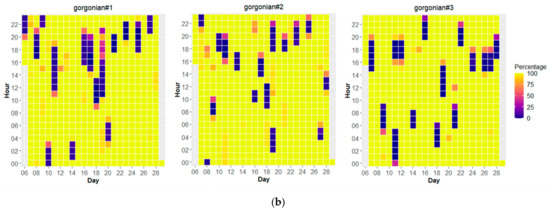
Figure 7.
Total percentage of open polyps in the image during the 22 days of sampling in intervals of 30 min. Yellow tones represent 100% of extended polyps in the scene (a) Three sections (lower, middle and upper), purple tones show retracted polyps moments; (b) Total percentage of open polyps for each colony (left, center, right), blue tones show retracted polyps moments.
To study the variations of polyps activity within each colony, the gorgonians were divided into three distinct sections: lower, middle, and upper. A mesh with a variable grid size was implemented to detect the activity state in each section. Within each specimen, all the polyps on the colonies open and close in synchrony regardless of the area where they are located. Therefore, there is no difference in the behavior of polyps within each colony, and in general, polyps are all extended or all retracted (Figure 7a).
An analysis based on each entire colony revealed that there are small differences between the three specimens that appear in the scene (Figure 7b). The three colonies do not have total synchrony, so the polyps in each specimen do not extend and retract at the same time. The three Placogorgia colonies are located very close to each other and therefore, they are subject to the same environmental variables. But there may be differences in behavior due to differences in their size or morphometry or the existence of elements that modify the micro-current flows.
Table 5 shows the basic statistics of the time that each of the gorgonians remains open or closed throughout the 22 days of observation. It can be seen how the gorgonians have similar behavior patterns (Figure 8). Colony 1 (left) and colony 2 (center) have very similar behavior while colony 3 (right) differs from the other two specimens. Colonies 1 and 2 have maximum times in which the polyps remain open, around 2.5 days (60 h). While colony 3 never exceeds 40 h remaining with extended polyps. With the exception of this parameter, the rest of the statistics of the feeding activity follow similar characteristics throughout the 22 days. The duration of the polyps extended periods varies remarkably, with a minimum of 0.5 h to a maximum of 63.5 h. But the duration of the closed event is more uniform. The time that the gorgonians remain retracted is always less than 12 h, with a mean value of approximately 3.5 h.
Table 5.
Basic statistics of the time (hours) that each of the gorgonian colony remain open or closed through-out the 22 days of lander observation.
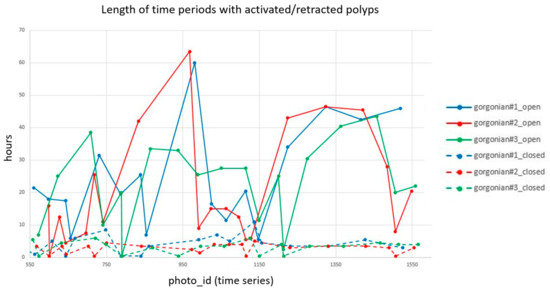
Figure 8.
Time of the <90% percentage of open polyps (continuos lines) and time of the >90% percentage of open polyps (discontinuos lines) in the image during the 22 days of sampling.
Many scleractinian corals exhibit diel cycles of polyp expansion and contraction, which are regulated by diel sunlight patterns. However, these temporal patterns are largely unknown in most species of deep environments. In this study, the time series of the percentage of active polyps at the scene over 22 days was averaged along the day in 30-min sampling periods. Figure 9 shows the active polyps percentage with black bars for each time interval (half hour). The x-axis represents the hours of the day, and the horizontal blue lines indicate the means of open polyps percentage for each half hour. This plot enables the underlying hourly pattern to be seen clearly, which is especially useful in identifying changes within specific times. The orange stripe marks the daylight hours. The graph reveals greater feeding activity (active polyps) during daylight hours, with a higher likelihood of finding gorgonians in a retracted state at night.
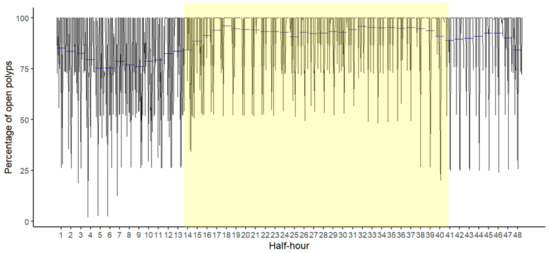
Figure 9.
Percentage of active polyps (black bars) for each time interval (half hour). The hours of the day are represented in x-axis, and the horizontal blue lines indicate the means of open polyps percentage for each half hour. The orange stripe highlights the hours of the day.
The SSA analysis of the different variables time series (percentage of active polyps, current speed, current direction, and ADCP return signal intensity series) showed the enormous weight of the first component, always greater than 85% of variance explained, which, by looking at the behavior of the eigenvectors, is interpretable as the trend in all the cases. This behavior was expected given the short number of available records, which makes it difficult to obtain a clear signal of periodicity. Table 6 offers an outlook of the first 6 components, noting the great percent of variability explained by the eigenvectors of the first component, characteristic, as we have already said, of the trend. This is why the reconstructed series, considered to compare the behavior of the polyps with environmental variables, only considered the trend. Figure 10 shows the time series of the different variables with the red line showing the reconstructed series based on the trend obtained for these data with SSA.
Table 6.
Variance explained by eigenvectors for the % of active polyps and selected environmental variables.
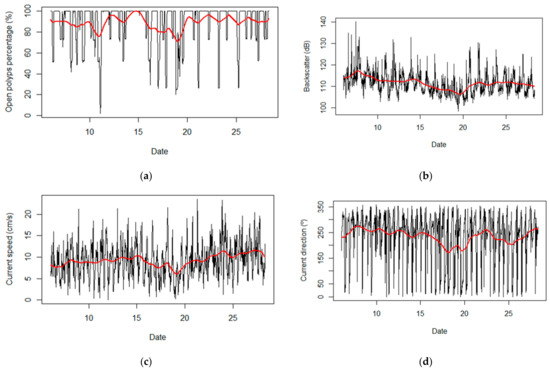
Figure 10.
Original variables time series (black line) with the reconstructed series (red line) based on trend obtained for SSA analysis. X-axis indicates day of May. (a) Percentage of polyps activity; (b) ADCP return signal intensity; (c) Current speed; (d) Current direction.
This decomposition and reconstruction approach was applied to the polyps activity and the main environmental variables that can directly influence gorgonian feeding (current speed and direction, and ADCP return signal intensity) (Figure 11). While the different curves show some similarity in behavior over time, differences can also be observed. The level of fit for these reconstructed trend series was assessed using linear regressions, resulting in an R2 score of 0.37 for current speed and 0.11 for current direction and ADCP return signal intensity.
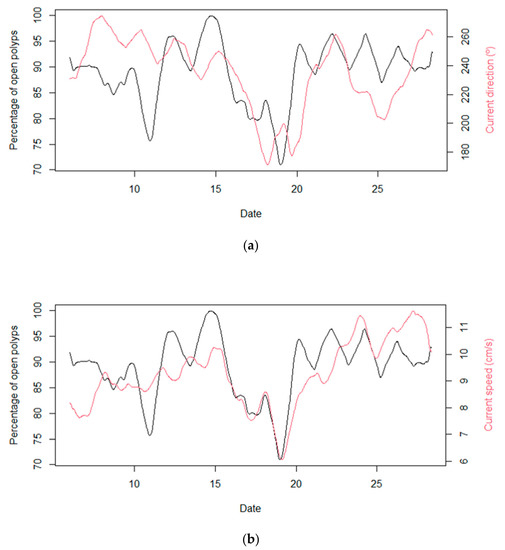
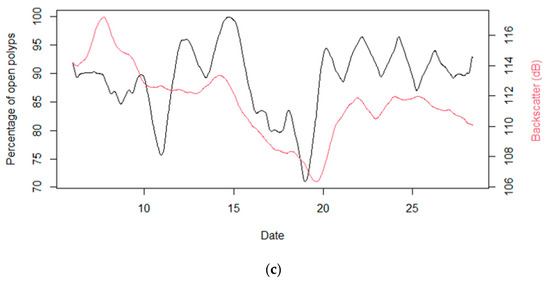
Figure 11.
Reconstructed time data series using trend. X-axis indicates day of May. (a) Percentage of polyps activity and current speed; (b) Percentage of polyps activity and current direction; (c) Percentage of polyps activity and ADCP return signal intensity.
4. Discussion
Octocorals are vulnerable components of deep-sea benthic communities, however their natural diets and feeding conduct are little known due to the difficulty of accessing them. Gorgonians are passive filter feeders and their polyps have a very limited ability to capture food and because of this, they depend mainly on environmental conditions that favor their feeding. The environmental conditions that determine the availability of food for octocorals in deep-sea are mainly the conditions of currents. In this regard, it is known that the feeding process is optimal when currents of moderate speed occur in the area and in a perpendicular direction to its fan-shaped body. Very slow currents do not bring food to their polyps, while very strong currents do not allow the polyps to capture that food. For this reason, in this study the behavior of polyps has been analyzed against the available environmental data in search of evidence that corroborates these statements.
Differences in polyp activity can be produced due to changes in temperature and current speed, but especially in response to increasing nutritional stimuli [9]. The gorgonians remain with open polyps, that is, in active mode while they are feeding. The tentacles of the polyps catch passing particles and carry them to the stomach where they are digested. After digestion, the polyp expels the remains through the same opening. When gorgonians contract, it is mainly because there are not optimal conditions for feeding, that is, there is less availability of food or environmental conditions are not favorable for trapping the particles on which they feed [66,67].
Precisely defining the fan-shaped growth, i.e., the size, shape and orientation of the gorgonian can provide information about the local current near the seafloor, due to the existence of a relationship of growth with hydrodynamic conditions. Thanks to the very high resolution three-dimensional reconstruction, the specific geometry of these 3 gorgonian colonies can be related to the recorded oceanographic data. It can be seen how these three specimens are arranged with their concave side facing the prevailing current flows in the site. This is contrary to what was stated in [47], given that although the geometric data of the gorgonian population was available, there was no record of environmental data at the site. Gorgonians grow by forming a concave side that helps them create small micro-currents and turbulence in the path of the water flow. These small turbulences help in the feeding process of the polyps that are located mainly on that side of the fan.
The semantic segmentation model presented in this work shows high performance in terms of accuracy and IoU and can generate accurate and detailed image segmentations. One of the main advantages of semantic segmentation is that it allows for a more fine-grained understanding of an image, compared to traditional object detection methods. This is because it not only detects objects in an image, but also segments them into their individual parts and classifies each part according to its semantic content. This model has immense potential to be used in modeling applications. Thanks to the segmentation model implemented, it has been possible to extract the conduct data of the gorgonians according to the state of their polyps automatically. Therefore, a robust methodology has been established for the image data processing of future long time photo-landers.
All the polyps in the colonies, regardless of the area where they are located, open and close in synchrony. This agrees with previous studies carried out in Paramuricea clavata [10]. But it must be taken into account that the low temporal resolution, one photo every 30 min, may mean that the existing data is not the most suitable for studying this phenomenon.
There are different processes within the water column related to the time of day, for example the migratory movements of zooplankton to surface waters to feed at night and their return to the deep layers during daylight hours. These patterns mean that species have developed differential strategies to optimize their feeding and protection against predators. The biological processes that occur in shallow waters depending on the periods of light and darkness are well known, however little is known about the daily cycles in the deep-sea environment. Placogorgia sp. has been found to be most active in feeding during the day, probably in this hours the food concentrations are highest, and remain least active at night. Research in this area is ongoing to better understand of the trophic ecology of gorgonians and their role in benthic−pelagic coupling processes [68].
As passive suspension-feeders, gorgonians are highly dependent on prevalent currents to flow water through the colony. Several studies show that to optimise the feeding process the moderate currents are needed. For example for Pseudopterogorgia acerosa colonies the colony-feeding rates are highest during moderate flow velocities (10–15 cm·s−1), and reduced at low (0–5 cm·s−1) and high (20–25 cm·s−1) velocities [17]. The polyp activity data obtained for Placogorgia have been analyzed throughout the entire time series. These data show times when gorgonians remain active for longer periods of time, and also show other times when gorgonians contract more frequently. In addition, it can be observed how the periods of time in which the gorgonians remain with their retracted polyps are stable throughout the series. Digestion time is dependent upon temperature but in this case the temperate are very constant along the sampling period around 10.8–11.0 Celsius degree. The average length of polyp retracted periods is 3.4 h very similar to digestion time of other species of gorgonians [10].
To address the relation between current dynamics and food availability with the gorgonian feeding behaviour, the SSA approach has been used. The percentage of active polyps of the trend reconstructed time series are compared with the same reconstructed series for current speed, current direction and ADCP return signal intensity. ADCP return signal intensity is used here like an approximation of backscatter. The concentration of suspended sediment is assumed to be directly proportional to acoustic intensity (voltage recorded by the ADCP) and logarithmically proportional to acoustic attenuation due to water and sediment concentration. Linear regressions analyses revealed low correlations between the number of open colonies and all environmental variables (current speed 0.37 and direction and acoustic backscatter 0.11). But the graphs (Figure 11) show that feeding activity was positively correlated with all of them. It should be noted, for example, in the middle of the observation period, especially low values are recorded in the activity of polyps, from May 17 to 20, which correspond to days in which very low current speeds (mean 7.4 cm·s−1 and mode 4.3 cm·s−1) of the observation periods are recorded, and which also coincide with infrequent current directions (values from 45° to 90° deg). In these days ADCP return signal intensity also registered low values.
Both the reconstructed time series of the percentage of active polyps and the selected environmental variables exhibit a sharp decrease at a specific point in time (between May 18th to 20th). This suggests a decline in food availability on those dates and a possible relationship between the low food availability and the prevailing environmental conditions at that time.
The number of open polyps of the Placogorgia sp. colonies, indicative of active feeding, do not show any seasonal pattern, since the short period of time observed does not allow recording seasonal changes in environmental variables.
5. Conclusions
This study shows that deep-sea octocoral Placogorgia sp. feeding based on their polyps activity is related to environmental variables and depending of local current dynamics. The information obtained on the feeding behavior of this species of gorgonian helps to better understand its biology and therefore to establish early protection measures. Achieving the registration of images together with environmental values in long periods of time will allow us not only to model but also to predict the feeding activity and health of this valuable forest animal. The methodology here presented highlights the potential of deep-learning based methods for fast and reliable monitoring of behavior of gorgonians and the capacity of three-dimensional point cloud to describe in detail morphometry of gorgonian forests.
Author Contributions
Conceptualization, E.P. and A.A.-U.; deep-learning methodology, R.R. and S.S.; oceanography, C.G.-P., R.G. and E.A.; fauna identification and taxonomy, J.C. and P.R.; instrumental design, J.M.R. and F.S.; review and editing, C.R.-C., L.M., A.R.-B.; project administration, E.P., C.G.-P. and F.S. All authors have read and agreed to the published version of the manuscript.
Funding
This research has been carried out in the scope of the LIFE IP INTEMARES project, coordinated by the Biodiversity Foundation of the Ministry for the Ecological Transition and the Demographic Challenge. This research was funded by the European Union’s LIFE program (LIFE15 IPE ES 012). This work was funded by the Biodiversity Foundation of the Ministry for Ecological Transition and Demographic Challenge, through the Pleamar Programme co-financed by the European Maritime and Fisheries Fund (Projects LanderPick, LanderPick-2 and LanderPick-3).
Data Availability Statement
Not applicable.
Acknowledgments
The authors would like to thank all the participants and crew of the R/V Ángeles Alvariño and Ramón Margalef for their collaboration in achieving the objectives during the INTEMARES-C2.1 and LanderPick surveys.
Conflicts of Interest
The authors declare no conflict of interest. The funders had no role in the design of the study; in the collection, analyses, or interpretation of data; in the writing of the manuscript; or in the decision to publish the results.
References
- Rossi, S.; Bramanti, L.; Gori, A.; Orejas, C. An overview of the animal forests of the world. In Marine Animal Forests: The Ecology of Benthic Biodiversity Hotspots; Rossi, S., Bramanti, L., Gori, A., Orejas, C., Eds.; Springer: Cham, Switzerland, 2017; pp. 1–28. [Google Scholar]
- Buhl-Mortensen, L.; Vanreusel, A.; Gooday, A.J.; Levin, L.A.; Priede, I.G.; Buhl Mortensen, P.; Gheerardyn, H.; King, N.J.; Raes, M. Biological structures as a source of habitat heterogeneity and biodiversity on the deep ocean margins. Mar. Ecol. 2010, 31, 21–50. [Google Scholar] [CrossRef]
- Bongiorni, L.; Mea, M.; Gambi, C.; Pusceddu, A.; Taviani, M. Deep-water corals promote higher diversity in deep-sea meiofaunal assemblages along continental margins. Biol. Conserv. 2010, 143, 1687–1700. [Google Scholar] [CrossRef]
- Rooper, C.N.; Etnoyer, P.J.; Stierhoff, K.L.; Olson, J.V. Effects of fishing gear on deep-sea corals and sponges in U.S. Waters. In The State of DeepSea Coral and Sponge Ecosystems of the United States; Hourigan, T.F., Etnoyer, P.J., Cairns, S.D., Eds.; NOAA Technical Memorandum NMFS-OHC-4; NOAA: Silver Spring, MD, USA, 2017; p. 36. [Google Scholar]
- Betti, F.; Bavestrello, G.; Bo, M.; Ravanetti, G.; Enrichetti, F.; Coppari, M.; Cappanera, V.; Venturini, S.; Cattaneo-Vietti, R. Evidences of fishing impact on the coastal gorgonian forests in-side the Portofino MPA (NW Mediterranean Sea). Ocean. Coast. Manag. 2020, 187, 105105. [Google Scholar] [CrossRef]
- Sherwood, O.A.; Edinger, E.N. Ages and growth rates of some dep-sea gorgonians and antipatharian corals of Newfoundland and Labrador. Can. J. Fish. Aquat. Sci. 2009, 66, 142–152. [Google Scholar] [CrossRef]
- Coppari, M.; Zanella, C.; Rossi, S. The importance of coastal gorgonians in the blue carbon budget. Sci. Rep. 2019, 9, 13550. [Google Scholar] [CrossRef]
- Gili, J.M.; Coma, R. Benthic suspension feeders: Their paramount role in littoral marine food webs. Trends. Ecol. Evol. 1998, 13, 316–321. [Google Scholar] [CrossRef] [PubMed]
- Rossi, S.; Rizzo, L.; Duchêne, J.C. Polyp expansion of passive suspension feeders: A red coral case study. PeerJ 2019, 7, e7076. [Google Scholar] [CrossRef]
- Coma, R.; Gili, J.M.; Zabala, M.; Riera, T. Feeding and prey capture cycles in the aposymbiontic gorgonian Paramuricea clavata. Mar. Ecol. Prog. Ser. 1994, 115, 257–270. [Google Scholar] [CrossRef]
- Fabricius, K.; Alderslade, P. Soft Corals and Sea Fans—A Comprehensive Guide to the Tropical Shallow-Water Genera of the Central-West Pacific, the Indian Ocean and the Red Sea; Australian Institute of Marine Science: Townsville, Australia, 2001. [Google Scholar]
- Orejas, C.; Gili, J.M.; Arntz, W. The role of the small planktonic communities in the diet of two Antarctic octocorals (Primnoisis antarctica and Primnoella sp.). MEPS 2003, 250, 105–116. [Google Scholar] [CrossRef]
- Sebens, K.P.; Vandersall, K.S.; Savina, L.A.; Graham, K.R. Zooplankton capture by two scleractinian corals, Madracis mirabilis and Montastrea cavernosa, in a field enclosure. Mar. Biol. 1996, 127, 303–317. [Google Scholar] [CrossRef]
- Wainwright, S.A.; Dillon, J.R. On the orientation of sea fans (Genus Gorgonia). Biol. Bull. 1969, 136, 136–139. [Google Scholar] [CrossRef]
- Grigg, R.W. Orientation and growth form of sea fans. Limnol. Oceanogr. 1972, 17, 185–192. [Google Scholar] [CrossRef]
- Genin, A.; Dayton, P.; Lonsdale, P.F.; Spiess, F.N. Corals on seamount peaks provide evidence of current acceleration over deep-sea topography. Nature 1986, 322, 59–61. [Google Scholar] [CrossRef]
- Sponaugle, S.; La Barbera, M. Drag-induced deformation: A functional feeding strategy in two species of gorgonians. J. Exp. Mar. Biol. Ecol. 1991, 148, 121–134. [Google Scholar] [CrossRef]
- Sponaugle, S. Flow patterns and velocities around a suspension-feeding gorgonian polyp: Evidence from physical models. J. Exp. Mar. Biol. Ecol. 1991, 148, 135–145. [Google Scholar] [CrossRef]
- Chang-Feng, D.; Ming-Chao, L. The effects of flow on feeding of three gorgonians from southern Taiwan. J. Exp. Mar. Biol. Ecol. 1993, 173, 57–69. [Google Scholar] [CrossRef]
- Liu, H.; Büscher, J.V.; Köser, K.; Greinert, J.; Song, H.; Chen, Y.; Schoening, T. Automated Activity Estimation of the Cold-Water Coral Lophelia pertusa by Multispectral Imaging and Computational Pixel Classification. J. Atmos. Ocean. Technol. 2021, 38, 141–154. [Google Scholar] [CrossRef]
- Osterloff, J.; Nilssen, I.; Järnegren, J.; Buhl-Mortensen, P.; Nattkemper, T.W. Polyp Activity Estimation and Monitoring for Cold Water Corals with a Deep Learning Approach. In Proceedings of the 2016 ICPR 2nd Workshop on Computer Vision for Analysis of Underwater Imagery (CVAUI), Cancun, Mexico, 4 December 2016; pp. 1–6. [Google Scholar]
- Osterloff, J.; Nilssen, I.; Järnegren, J.; Van Engeland, T.; Buhl-Mortensen, P.; Nattkemper, T.W. Computer vision enables short and long-term analysis of Lophelia pertusa polyp behaviour and colour from an underwater observatory. Sci. Rep. 2019, 9, 6578. [Google Scholar] [CrossRef]
- Zuazo, A.; Grinyó, J.; López-Vázquez, V.; Rodríguez, E.; Costa, C.; Ortenzi, L.; Flögel, S.; Valencia, J.; Marini, S.; Zhang, G.; et al. An Automated Pipeline for Image Processing and Data Treatment to Track Activity Rhythms of Paragorgia arborea in Relation to Hydrographic Conditions. Sensors 2020, 20, 6281. [Google Scholar] [CrossRef]
- Girard, F.; Litvin, S.Y.; Sherman, A.; McGill, P.; Gannon, A.; Lovera, C.; DeVogelaere, A.; Burton, E.; Graves, D.; Schnittger, A.; et al. Phenology in the deep sea: Seasonal and tidal feeding rhythms in a keystone octocoral. Proc. R. Soc. B 2022, 289, 20221033. [Google Scholar] [CrossRef]
- Johanson, A.; Flögel, S.; Dullo, W.C.; Linke, P.; Hasselbring, W. Modeling Polyp Activity of Paragorgia arborea Using Supervised Learning. Ecol. Inform. 2017, 39, 109–118. [Google Scholar] [CrossRef]
- Aguzzi, J.; Iveša, N.; Gelli, M.; Costa, C.; Gavrilović, A.; Cukrov, N.; Cukrov, N.; Cukrov, M.; Omanovic, D.; Štifanić, M.; et al. Ecological video monitoring of Marine Protected Areas by underwater cabled surveillance cameras. Mar. Policy 2020, 119, 104052. [Google Scholar] [CrossRef]
- Sánchez, F.; González-Pola, C.; Rodríguez-Basalo, A.; Rodríguez, J.M.; Prado, E.; Módica, L.; Rodríguez-Cabello, C. Faunal behavior in response to near bottom water dynamics in a marine protected area (Cantabrian Sea, southern Bay of Biscay). Estuar. Coast. Shelf Sci. 2022, 277, 108078. [Google Scholar] [CrossRef]
- D’Onghia, G.; Capezzuto, F.; Carlucci, R.; Carluccio, A.; Maiorano, P.; Panza, M.; Ricci, P.; Sion, L.; Tursi, A. Using a benthic lander to explore and monitor vulnerable ecosystems in the Mediterranean Sea. ACTA IMEKO 2018, 7, 45–49. [Google Scholar] [CrossRef]
- Beijbom, O.; Edmunds, P.J.; Kline, D.; Mitchell, B.G.; Kriegman, D. Automated annotation of coral reef survey images. In Proceedings of the 2012 IEEE Conference on Computer Vision and Pattern Recognition (CVPR), Providence, RI, USA, 16–21 June 2012; pp. 1170–1177. [Google Scholar]
- Mahmood, A.; Bennamoun, M.; An, S.; Sohel, F.; Boussaid, F.; Hovey, R.; Kendrick, G.; Fisher, R. Automatic annotation of coral reefs using deep learning. In Proceedings of the OCEANS 2016 MTS/IEEE Monterey, Monterey, CA, USA, 19–23 September 2016; pp. 1–5. [Google Scholar]
- Šiaulys, A.; Vaičiukynas, E.; Medelytė, S.; Olenin, S.; Šaškov, A.; Buškus, K.; Verikas, A. A fully-annotated imagery dataset of sublittoral benthic species in Svalbard. Arct. Data Brief 2021, 35, 106823. [Google Scholar] [CrossRef]
- Wicaksono, P.; Aryaguna, P.A.; Lazuardi, W. Benthic Habitat Mapping Model and Cross Validation Using Machine-Learning Classification Algorithms. Remote Sens. 2019, 11, 1279. [Google Scholar] [CrossRef]
- Al-AbdulKader, K.A.; Farrand, W.H.; Blundell, J.S. Marine Habitat Mapping Using High Spatial Resolution Multispectral Satellite Data. In Proceedings of the SPE International Conference on Health, Safety and Environment in Oil and Gas Exploration and Production, Kuala Lumpur, Malaysia, 20–22 March 2002. [Google Scholar]
- Pillay, T.; Cawthra, H.C.; Lombard, A.T.; Sink, K. Benthic habitat mapping from a machine learning perspective on the Cape St Francis inner shelf, Eastern Cape, South Africa. Mar. Geol. 2021, 440, 106595. [Google Scholar] [CrossRef]
- Abad-Uribarren, A.; Prado, E.; Sierra, S.; Cobo, A.; Rodríguez-Basalo, A.; Gómez-Ballesteros, M.; Sánchez, F. Deep learning-assisted high resolution mapping of vulnerable habitats within the Capbreton Canyon System, Bay of Biscay. Estuar. Coast. Shelf Sci. 2022, 75, 107957. [Google Scholar] [CrossRef]
- Liu, F.; Fang, M. Semantic Segmentation of Underwater Images Based on Improved Deeplab. J. Mar. Sci. Eng. 2020, 8, 188. [Google Scholar] [CrossRef]
- Islam, M.J.; Edge, C.; Xiao, Y.; Luo, P.; Mehtaz, M.; Morse, C.; Enan, S.S.; Sattar, J. Semantic Segmentation of Underwater Imagery: Dataset and Benchmark. In Proceedings of the 2020 IEEE/RSJ International Conference on Intelligent Robots and Systems (IROS), Las Vegas, NV, USA, 24 October 2020–24 January 2021; pp. 1769–1776. [Google Scholar]
- King, A.; Bhandarkar, S.M.; Hopkinson, B.M. A Comparison of Deep Learning Methods for Semantic Segmentation of Coral Reef Survey Images. In Proceedings of the IEEE Conference on Computer Vision and Pattern Recognition (CVPR) Workshops, Salt Lake City, UT, USA, 18–22 June 2018; pp. 1394–1402. [Google Scholar]
- Purser, A. A Time Series Study of Lophelia pertusa and Reef Megafauna Responses to Drill Cuttings Exposure on the Norwegian Margin. PLoS ONE 2015, 10, e0134076. [Google Scholar] [CrossRef]
- BOE. Real Decreto 1629/2011, de 14 de Noviembre, por el que se Declara Como Área Marina Protegida y como Zona Especial de Conservación el Espacio Marino de El Cachucho, y se Aprueban las Correspondientes Medidas de Conservación; Ministry of the Environment, Rural and Marine Affairs: Madrid, Spain, 2011; pp. 130084–130138.
- González-Pola, C.; Díaz del Río, G.; Ruiz-Villarreal, M.; Sánchez, R.F.; Mohn, C. Circulation patterns at Le Danois Bank, an elongated shelf-adjacent seamount in the Bay of Biscay. Deep Sea Res. I Oceanogr. Res. Pap. 2012, 60, 7–21. [Google Scholar] [CrossRef]
- Sánchez, F.; Serrano, A.; Parra, S.; Ballesteros, M.; Cartes, J.E. Habitat characteristics as determinant of the structure and spatial distribution of epibenthic and demersal communities of Le Danois Bank (Cantabrian Sea, N. Spain). J. Mar. Syst. 2008, 72, 64–86. [Google Scholar] [CrossRef]
- Figueira, W.; Ferrari, R.; Weatherby, E.; Porter, A.; Hawes, S.; Byrne, M. Accuracy and Precision of Habitat Structural Complexity Metrics Derived from Underwater Photogrammetry. Remote Sens. 2015, 7, 16883–16900. [Google Scholar] [CrossRef]
- Price, D.M.; Robert, K.; Callaway, A.; Lo Lacono, C.; Hall, R.A.; Huvenne, V.A. Using 3D photogrammetry from ROV video to quantify cold-water coral reef structural complexity and investigate its influence on biodiversity and community assemblage. Coral Reefs 2019, 38, 1007–1021. [Google Scholar] [CrossRef]
- Fukunaga, A.; Burns, J.H.R.; Pascoe, K.H.; Kosaki, R.K. Associations between benthic cover and habitat complexity metrics obtained from 3d reconstruction of coral reefs at different resolutions. Remote Sens. 2020, 12, 1011. [Google Scholar] [CrossRef]
- Palma, M.; Rivas-Casado, M.; Pantaleo, U.; Pavoni, G.; Pica, D.; Cerrano, C. SfMbased method to assess gorgonian forests (Paramuricea clavata (Cnidaria, octocorallia)). Remote Sens. 2018, 10, 1154. [Google Scholar] [CrossRef]
- Prado, E.; Sánchez, F.; Rodríguez-Basalo, A.; Altuna, A.; Cobo, A. Analysis of the population structure of a gorgonian forest (Placogorgia sp.) using a photogrammetric 3D modeling approach at Le Danois Bank, Cantabrian Sea. Deep. Sea Res. Part I Oceanogr. Res. Pap. 2019, 153, 103124, reprinted in Front. Mar. Sci. 2019, 8, 612613. [Google Scholar] [CrossRef]
- Rossi, P.; Castagnetti, C.; Capra, A.; Brooks, A.J.; Mancin, F. Detecting change in coral reef 3D structure using underwater photogrammetry: Critical issues and performance metrics. Appl. Geomat. 2020, 12 (Suppl. 1), S3–S17. [Google Scholar] [CrossRef]
- Lange, I.D.; Perry, C.T. A quick, easy and non-invasive method to quantify coral growth rates using photogrammetry and 3D model comparisons. Methods Ecol. Evol. 2020, 11, 714–726. [Google Scholar] [CrossRef]
- Bennecke, S.; Kwasnitschka, T.; Metaxas, A.; Dullo, W.C. In situ growth rates of deep-water octocorals determined from 3d photogrammetric reconstructions. Coral Reefs 2016, 35, 1227–1239. [Google Scholar] [CrossRef]
- Ferrari, R.; Figueira, W.F.; Pratchett, M.S.; Boube, T.; Adam, A.; Kobelkowsky-Vidrio, T.; Doo, S.S.; Atwood, T.B.; Byrne, M. 3D photogrammetry quantifies growth and external erosion of individual coral colonies and skeletons. Sci. Rep. 2017, 7, 16737. [Google Scholar] [CrossRef] [PubMed]
- Burns, J.H.J.; Weyenberg, G.; Mandel, T.; Ferreira, S.B.; Gotshalk, D.; Kinoshita, C.K.; Marshall, M.J.; Del Moral, N.A.V.; Murphy, S.J.; Pascoe, K.H.; et al. A Comparison of the Diagnostic Accuracy of in-situ and Digital Image-Based Assessments of Coral Health and Disease. Front. Mar. Sci. 2020, 7, 304. [Google Scholar] [CrossRef]
- Prado, E.; Cristobo, J.; Rodríguez-Basalo, A.; Ríos, P.; Rodríguez-Cabello, C.; Sánchez, F. In situ growth rate assessment of the hexactinellid sponge Asconema setubalense using 3D photogrammetric reconstruction. Front. Mar. Sci. 2021, 8, 612613. [Google Scholar] [CrossRef]
- Gonzalez-Pola, C.; Sánchez, F.; Rodriguez Cobo, L.; Graña, R.; Rodriguez, J.M.; Valdiande-Gutierrez, J.; Hernandez-Urbieta, D.; Aierbe, E. LanderPick, a Remote Operated Trawled Vehicle to cost-effectively deploy and recover lightweight oceanographic landers. In Proceedings of the EGU General Assembly 2022, Vienna, Austria, 23–27 May 2022. EGU22-11921. [Google Scholar]
- Liu, Z.; Mao, H.; Wu, C.Y.; Feichtenhofer, C.; Darrell, T.; Xie, S. A convnet for the 2020s. In Proceedings of the IEEE/CVF Conference on Computer Vision and Pattern Recognition, New Orleans, LA, USA, 18–24 June 2022; pp. 11976–11986. [Google Scholar]
- Fletcher, S.; Islam, M.Z. Comparing sets of patterns with the Jaccard index. Australas. J. Inf. Syst. 2018, 22. [Google Scholar] [CrossRef]
- Han, F.; Yao, J.; Zhu, H.; Wang, C. Underwater Image Processing and Object Detection Based on Deep CNN Method. J. Sens. 2020, 2020, 6707328. [Google Scholar] [CrossRef]
- Moreno-Barea, F.J.; Jerez, J.M.; Franco, L. Improving Classification Accuracy Using Data Augmentation on Small Data Sets. Expert Syst. Appl. 2020, 161, 113696. [Google Scholar] [CrossRef]
- Wang, Q.; Wu, B.; Zhu, P.; Li, P.; Zuo, W.; Hu, Q. ECA-Net: Efficient Channel Attention for Deep Convolutional Neural Networks. In Proceedings of the 2020 IEEE/CVF Conference on Computer Vision and Pattern Recognition (CVPR), Seattle, WA, USA, 13–19 June 2020; pp. 11531–11539. [Google Scholar]
- Xu, Q.; Zhang, M.; Gu, Z.; Pan, G. Overfitting Remedy by Sparsifying Regularization on Fully-Connected Layers of CNNs. Neurocomputing 2019, 328, 69–74. [Google Scholar] [CrossRef]
- Golyandina, N.; Zhigljavsky, A. Singular Spectrum Analysis for Time Series; Springer: Berlin/Heidelberg, Germany, 2013. [Google Scholar]
- Zhigljavsky, A. (Ed.) Statistics and Its Interface, Special Issue on the Singular Spectrum Analysis for Time Series; Springer: Berlin/Heidelberg, Germany, 2010. [Google Scholar]
- Cheng, D. Time Series Decomposition Using Singular Spectrum Analysis. Master’s Thesis, East Tennessee State University, Johnson City, TN, USA, 2014. Paper 2352. [Google Scholar]
- Golyandina, N.; Korobeynikov, A.; Shlemov, A.; Usevich, K. Multivariate and 2D Extensions of Singular Spectrum Analysis with the Rssa Package. J. Stat. Softw. 2015, 67, 1–78. [Google Scholar] [CrossRef]
- R Core Team. R: A Language and Environment for Statistical Computing; R Foundation for Statistical Computing: Vienna, Austria, 2018; Available online: https://www.R-project.org/ (accessed on 13 March 2023).
- Lu, J.; Behbood, V.; Hao, P.; Zuo, H.; Xue, S.; Zhang, G. Transfer learning using computational intelligence: A survey. Knowl. Based Syst. 2015, 80, 14–23. [Google Scholar] [CrossRef]
- Orejas, C.; Gori, A.; Rad-Menéndez, C.; Last, K.S.; Davies, A.J.; Beveridge, C.M.; Sadd, D.; Kiriakoulakis, K.; Witte, U.; Roberts, J.M. The effect of flow speed and food size on the capture efficiency and feeding behaviour of the cold-water coral Lophelia pertusa. J. Exp. Mar. Biol. Ecol. 2016, 481, 34–40. [Google Scholar] [CrossRef]
- Elias-Piera, F.; Rossi, S.; Gili, J.M.; Orejas, C. Trophic ecology of seven Antarctic gorgonian species. MEPS 2013, 477, 93–106. [Google Scholar] [CrossRef]


Disclaimer/Publisher’s Note: The statements, opinions and data contained in all publications are solely those of the individual author(s) and contributor(s) and not of MDPI and/or the editor(s). MDPI and/or the editor(s) disclaim responsibility for any injury to people or property resulting from any ideas, methods, instructions or products referred to in the content. |
© 2023 by the authors. Licensee MDPI, Basel, Switzerland. This article is an open access article distributed under the terms and conditions of the Creative Commons Attribution (CC BY) license (https://creativecommons.org/licenses/by/4.0/).