Article

A GRACE/GFO Empirical Low-Pass Filter to Extract the Mass Changes in Nicaragua

1
Department of Geodesy and Geomatics Engineering, School of Civil and Transportation Engineering, Guangdong University of Technology, Guangzhou 510006, China
2
Guangzhou Urban Planning & Design Survey Research Institute, Guangzhou 510060, China
3
South Surveying & Mapping Technology Co., Ltd, Guangzhou 510665, China
*
Author to whom correspondence should be addressed.
Remote Sens. 2023, 15(11), 2805; https://doi.org/10.3390/rs15112805
Submission received: 23 March 2023 / Revised: 25 May 2023 / Accepted: 26 May 2023 / Published: 28 May 2023

Abstract

:
Among the Gravity Recovery and Climate Experiment (GRACE) and GRACE Follow-on temporal gravity products, the north–south stripe noise in the spherical harmonic coefficients (SHCs) products contaminates the inversion of the Earth’s mass field. In this study, GRACE SHCs products are adopted to estimate the mass changes in Nicaragua. To improve this estimation, we propose an empirical low-pass filter to suppress stripe noise. After only using our filter, the Nicaragua regional uncertainty diminishes from 123.26 mm to 69.11 mm, and the mean signal-to-noise ratio of all available months (2002–2021) improves from 1.67 to 1.8. Subsequently, our filter is employed to estimate the basin terrestrial water storage (TWS) change in Nicaragua. In the end, TWS change estimations are compared with various observations such as mascon products, hydrological models, and in situ groundwater observation. The main conclusions are as follows: (1) After using the wavelet coherent analysis, there is a negative resonance between TWS and the climate factor (El Nino–Southern Oscillation) with a period of 2~4 years; (2) The significant ~3.8-year periodic signal in groundwater storage change estimation is contributed by GRACE aliasing error. Our work can provide new knowledge and references for mass change in small areas.

1. Introduction

Since March 2002, a novel opportunity to estimate large-scale terrestrial water storage (TWS) [1,2,3,4,5,6] and groundwater storage (GWS) [7,8,9] has been made available from satellite gravity missions called Gravity Recovery and Climate Experiment (GRACE) and the GRACE Follow-On (GFO) [10]. The GRACE/GFO space mission measured the Earth’s temporal gravity for about 20 years, except for the mission-free year from July 2017 to May 2018.
The GRACE/GFO products for hydrologic research have been extensively used, including the GRACE/GFO level-3 gridded mass field and level-2 spherical harmonic coefficients (SHCs) products. Among the former, the Mascon products are being widely used since it significantly improves spatial accuracy and operates friendly to the user. Nonetheless, Zhang et al. [11] pointed out that Mascon products perform poorly and may remove signal in the small-scale region (smaller than 3° × 3°). On the contrary, the GRACE/GFO SHCs products are still recommended for revealing small-scale basin mass change after the rational post-processing method.
There are mainly three official Scientific Data Centers (SDCs) that provide the GRACE/GFO SHCs solutions, including the Center for Space Research (CSR) at the University of Texas in Austin, the Geoforschungs Zentrum Potsdam (GFZ), and the Jet Propulsion Laboratory (JPL). We here show the original mass field in terms of equivalent water height (EWH) derived from the three SDCs (Figure 1a–c). Although the pre-processing procedures in GRACE/GRO SHCs products at each SDC differ [12], all the inversions are contaminated by global north–south stripe noise.
Hence, the post-processing method is an essential step to remove the noise in the mass field inversion. We here classify the post-processing algorithm into multi-month and single-month methods according to the length of available data. The former include the principal component analysis/empirical orthogonal function [13,14], stochastic filter [15], Kalman filter [16], multichannel singular spectrum analysis [17], and so on. Among these methods, observation availability, prior information, and temporal–spatial statistical properties are considered and lead to high computational performance requirements. Among the latter, the Gaussian filter is the most commonly used [18]. Its variants include the Han filter [19], the Fan filter [20], and the iterative filter [21]. Additionally, there are also optimal filters designed using statistical criteria and prior information, for instance, the RMS filter, the Wiener filter, and the DDK filter [22,23,24].
However, in the case of the Gaussian filter only applied in GRACE/GFO SHCs data, a large average radius is needed to suppress the noise level but will overly smooth the mass field. To overcome it, considering the stripe noise due to irrational patterns in SHCs with specific degrees (odd or even), Swenson and Wahr [25] proposed the de-striping method that subtracts the fitted value from the original SHCs using a 2nd-order polynomial in a moving window. After that, this empirical de-striping method was developed into the PnMl method with different parameters (degree of the polynomial, fitting range of order, and length of window), such as the P4M6 [26,27,28,29]. However, there is still obvious north–south stripe noise covering the low latitude after adopting the de-striping method (e.g., Figure 1d–f; the P4M6 method).
Moreover, considering the spatial high-frequency property of the stripe noise, some scholars processed the GRACE/GFO mass field in the planar domain. Zhan et al. [30] and Yang et al. [31] designed a low-pass filter to remove stripe noise for the GRACE/GFO mass field along the longitude direction and confirm the filter parameter in experience or prior information. However, they did not consider the correlation along the latitude direction of the signal. After that, Yi and Sneeuw [32] separated the stripe noise through a complicated method, which is based on correlation in the two spherical orthogonal directions (longitude and latitude). Considering the correlation of two planar orthogonal directions, we propose a novel empirical low-pass (ELP) filter to further suppress residual stripe noise in the low latitude of the mass field, which is due to only adopting the P4M6 method.
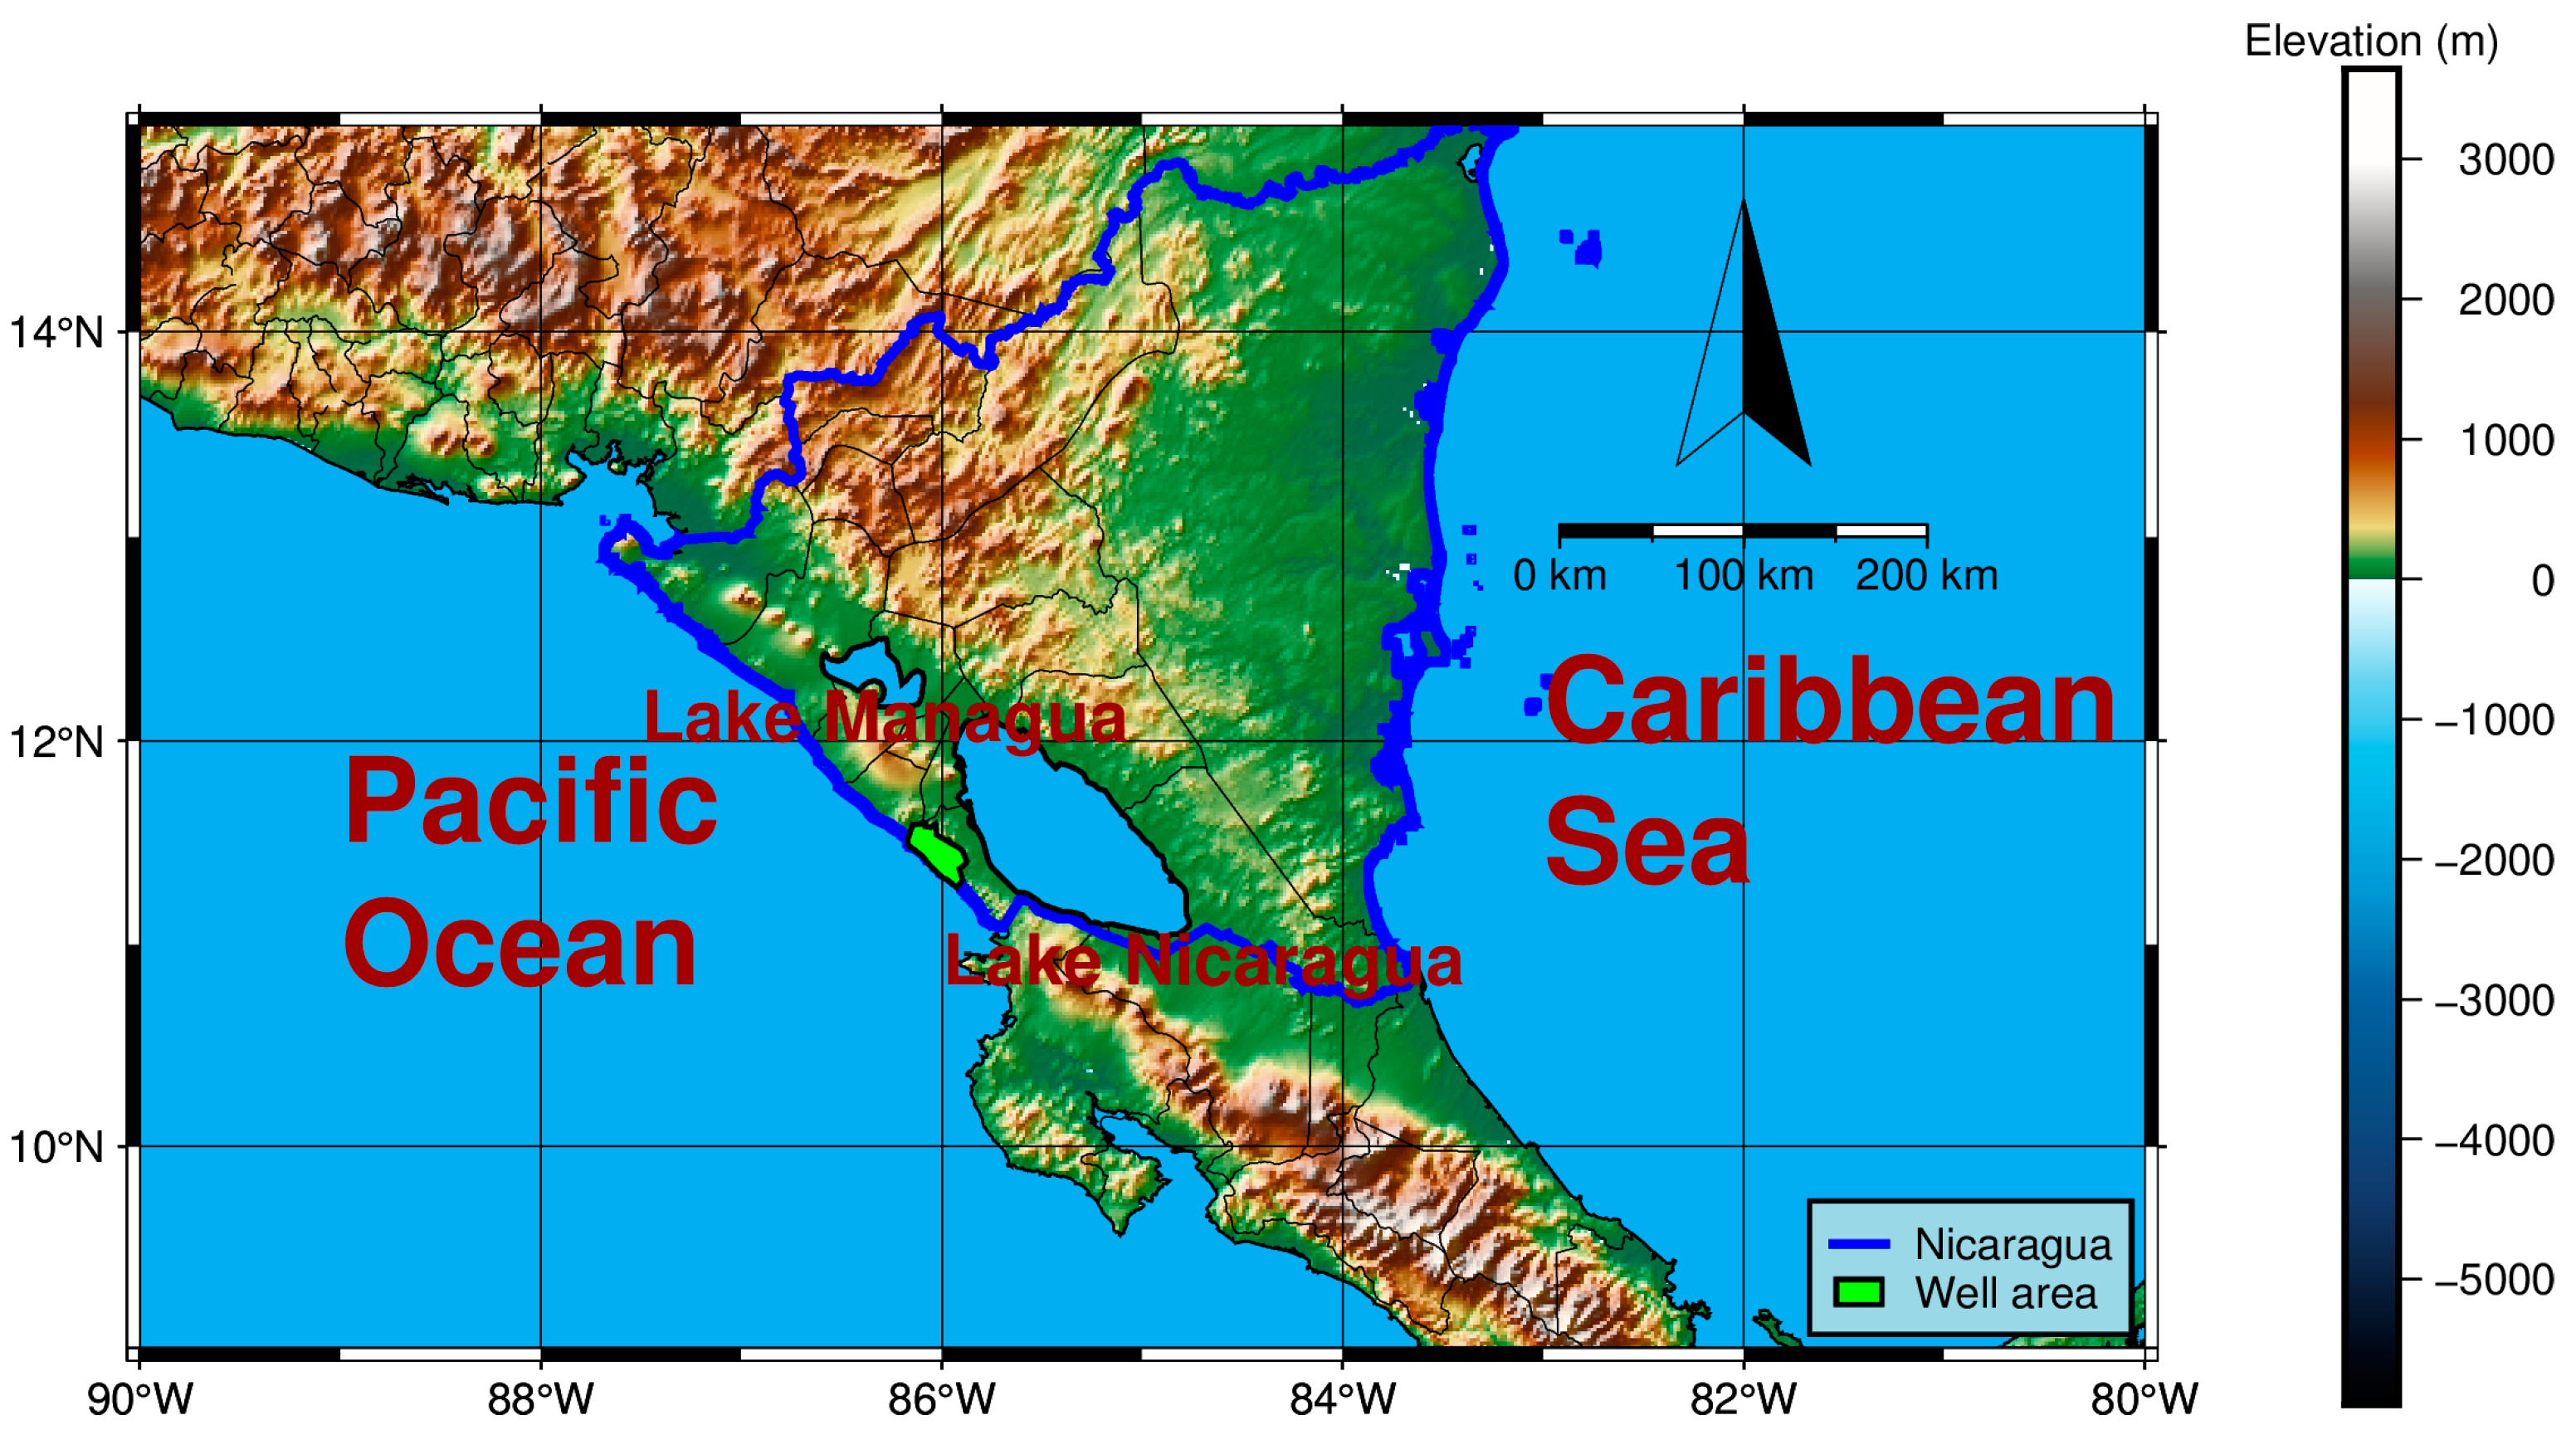
Nicaragua (Figure 2) is located in a tropical region on the Pacific Coast of Central America [33]. Jian et al. [34] studied the Nicaragua mass change with GRACE/GFO data in the general method (the P4M6 method and Gaussian filter). Following that, we try to improve the mass change estimation in Nicaragua by combining the ELP filter. To this end, the performance of the ELP filter is investigated in the temporal–spatial domain and spherical harmonic domain with the real GRACE/GFO and simulated mass fields. Subsequently, the signal-to-noise ratio (SNR) index and three-cornered hat (TCH) method are adopted to assess the improvement of the ELP filter. In the end, we study the mechanisms of mass change (TWS and GWS) in Nicaragua by combining in situ groundwater observations.

2. Study Area and Materials

2.1. Topography in Study Area

The Central Highlands, the Caribbean Coastal Lowlands on the east coast, and the Pacific Coastal Lowlands on the west coast make up Nicaragua’s three main regions (https://en.wikipedia.org/wiki/Nicaragua, accessed on 1 December 2022). The eastern coast is near the Caribbean Sea, with a coastline of about 540 km. The interior consists of plateaus and mountains. In western Nicaragua, there are two of the largest freshwater lakes in Central America: Lake Nicaragua and Lake Managua [35]. The west coast is near the Pacific Ocean, the most densely populated area in the country, but there are many active volcanoes and earthquakes [36,37,38].

2.2. Climate in Study Area

There are three primary climates in Nicaragua [39]. Tropical monsoon and tropical rainforest climates coexist in the Caribbean coastal lowlands on the east coast. Additionally, a tropical savanna climate predominates in the Central Highlands and West Coast of the Pacific coastal lowlands [40,41].
Furthermore, the rainfall in Nicaragua varies greatly. The Caribbean lowlands receive between 2500 and 6500 mm of rain per year [40]. The Pacific lowlands and the western slopes of the central highlands receive significantly less annual rainfall since the peaks of the central highlands isolate the Caribbean trade winds. In Nicaragua, the yearly precipitation is characterized by a robust bimodal distribution (the midsummer drought) [42]. This distribution is controlled by the Caribbean low-level jet stream and the sea surface temperature of the eastern Pacific Ocean. It is characterized by precipitation peaks in the periods from May to June and from late August to early October, respectively.

2.3. GRACE/GFO SHCs and Mascon Products

In the following estimation, the GSM Release 06 products from three SDCs (CSR, JPL, and GFZ) are employed, which are SHCs truncated at degree 60. As usual, the SHCs of each available month (April 2002–April 2021) are replaced: (1) first-degree terms and (2) C20/C30 SHCs. The former is determined by the combination of GRACE/GFO observation and ocean models [43]. The latter is derived from satellite laser ranging results [44,45]. After that, the glacial isostatic adjustment corrections [46] are implemented by the ICE-6G_D model. The monthly treated SHCs are relative to the GRACE/GFO mean gravity field from January 2004 to December 2009.
Moreover, we implement the GRACE/GFO level-3 product (CSR-RL06M v02, named CSR M in this work) [47], which is the monthly global mass field (0.25° × 0.25°) in terms of EWH. To be claimed specifically for CSR-M, all the corrections and replacements are the same as the SHCs product, excluding the ellipsoid corrections. The ellipsoid correction is not considered in the SHCs products on account of its minor impact on Nicaragua’s mass change [48].

2.4. Satellite Altimetry and Hydrological Model

For the surface water storage in Nicaragua, the water-level time series are collected from the Database for Hydrological Time Series over Inland Waters (DAHITI: https://dahiti.dgfi.tum.de, accessed on 5 December 2022), which includes Lake Nicaragua and Managua. The process strategy for datasets is proposed by Schwatke et al. [49].
The Global Land Data Assimilation System (GLDAS) was jointly developed by the Goddard Space Flight Center and the National Centers for Environmental Prediction, which includes four models: NOAH, MOSAIC, VIC, and CLM [50]. The GLDAS models output global soil moisture, snow water equivalent, canopy water, and other surface variables. In this work, the soil moisture (0.25° × 0.25°) storage derived from the GLDAS2.1-NOAH025 model is employed to follow the previous selections that have been successfully applied to hydrological and climate research [51,52,53,54,55]. Moreover, for ease of expression, soil moisture storage plus surface water storage is referred to as SWS, which is the major component of TWS.

2.5. In Situ Groundwater Observation and Specific Yield

Aiming to analyze and validate the basin GWS estimation, the in situ groundwater level time series were collected from Adamson et al. [56]. The contributors requested that the specific location of the well be kept secret (green patch in Figure 2) [56]. The in situ GWS observation includes the average groundwater observation of hand-dug wells (monthly observation) and a drilling well named MW-01 (yearly observation). After multiplying the groundwater level with a specific yield [57], we can obtain the in situ GWS observation. The median porosity (0.0168) in this area is given by Adamson et al. [56] as a substitute for specific yield.

2.6. Climate Data and Climate Index

The ERA5-land outputs include the surface flux and variables of the water-energy cycle [58], which are available on the ECMWF (European Centre for Medium-Range Weather Forecasts). Because of the hightemporal–spatial resolution, long period, and consistency of the fields produced, the dataset (ERA5-Land) is valuable for researchers to study hydrological processes, weather prediction, and climate mode [59]. The monthly precipitation is analyzed in this study (0.1° × 0.1°) to study the mechanism of TWS and GWS change.
The major climate pattern in Nicaragua originates from the surrounding oceans. Among them, ENSO (El Nino–Southern Oscillation) teleconnections between coupled ocean-atmosphere and land systems lead to extreme events such as drought or flood [55]. ENSO is the main factor causing the TWS changes in Nicaragua [34]. To further analyze the mass change (TWS and GWS) in Nicaragua, the Niño 3.4 index is adopted to measure ENSO strength (Figure 3), which equals the regional sea surface temperature anomaly within Niño 3.4 area [60,61].

3. Methods

3.1. Global Mass Change and Signal Variance

Global mass field Δh can be derived from SHCs in GRACE/GFO level-2 products as follows [18]:
Δ h θ , λ = a ρ e 3 ρ w n = 0 n m a x 2 n + 1 1 + k n m = 0 n P n m cos θ W n m × [ Δ C n m c o s m λ + Δ S n m s i n m λ ] ,
where θ and λ are the co-latitude and longitude, respectively. n m a x is 60 in this paper. A denotes the mean Earth radius. ρ e and ρ w are the Earth’s mean density and freshwater density, respectively. Δ C n m and Δ S n m are monthly residual SHCs in each month. W n m represents the spatial smooth (Gaussian filter). k n is the load Love numbers. P n m denotes the normalized Legendre function of degree n and order m. Moreover, signal variance σ n per degree of the GRACE/GFO mass field reflected signal power in the spherical harmonic domain as follows:
σ n = m = 0 n W n m 2 × Δ C n m 2 + Δ S n m 2 2 .

3.2. The PnMl Method and the ELP Filter

There is an irrational correlation between SHCs of the specific degree (odd or even) for an order m [62]. Some studies used the PnMl (e.g., P4M6) method to remove the noise for the mass estimation of ice caps [26], mountain glaciers [63], and TWS [64]. For instance, in the case of the P4M6 method, this algorithm reserves the SHCs of low degrees (0~6). It subsequently identifies the correlated error in SHCs using a 4th-order polynomial within a given order from 7 to 50 (nmax − 10). However, after using the P4M6 method, the residual stripe noise is still significant due to the insufficient decorrelation in the high-degree zone. To overcome it, we analyze the residual stripe noise in the planar spectrum and suppress the noise with a planar filter.
The Fourier spectrum Y of a planar data X (i.e., GRACE/GFO global mass field) can be described as follows [65]:
Y p , q = j = 1 a k = 1 b f a ( j 1 ) ( p 1 ) f b ( k 1 ) ( q 1 ) × X j , k .
where f a = e 2 π i / a and f b = e 2 π i / b . i is the imaginary unit. a and b are the length of sequences of longitude index j ( 1 j a ) and latitude index k ( 1 k b ), respectively. p , q denotes the frequency sequence of longitude and latitude direction, respectively ( 1 p a , 1 q b ).
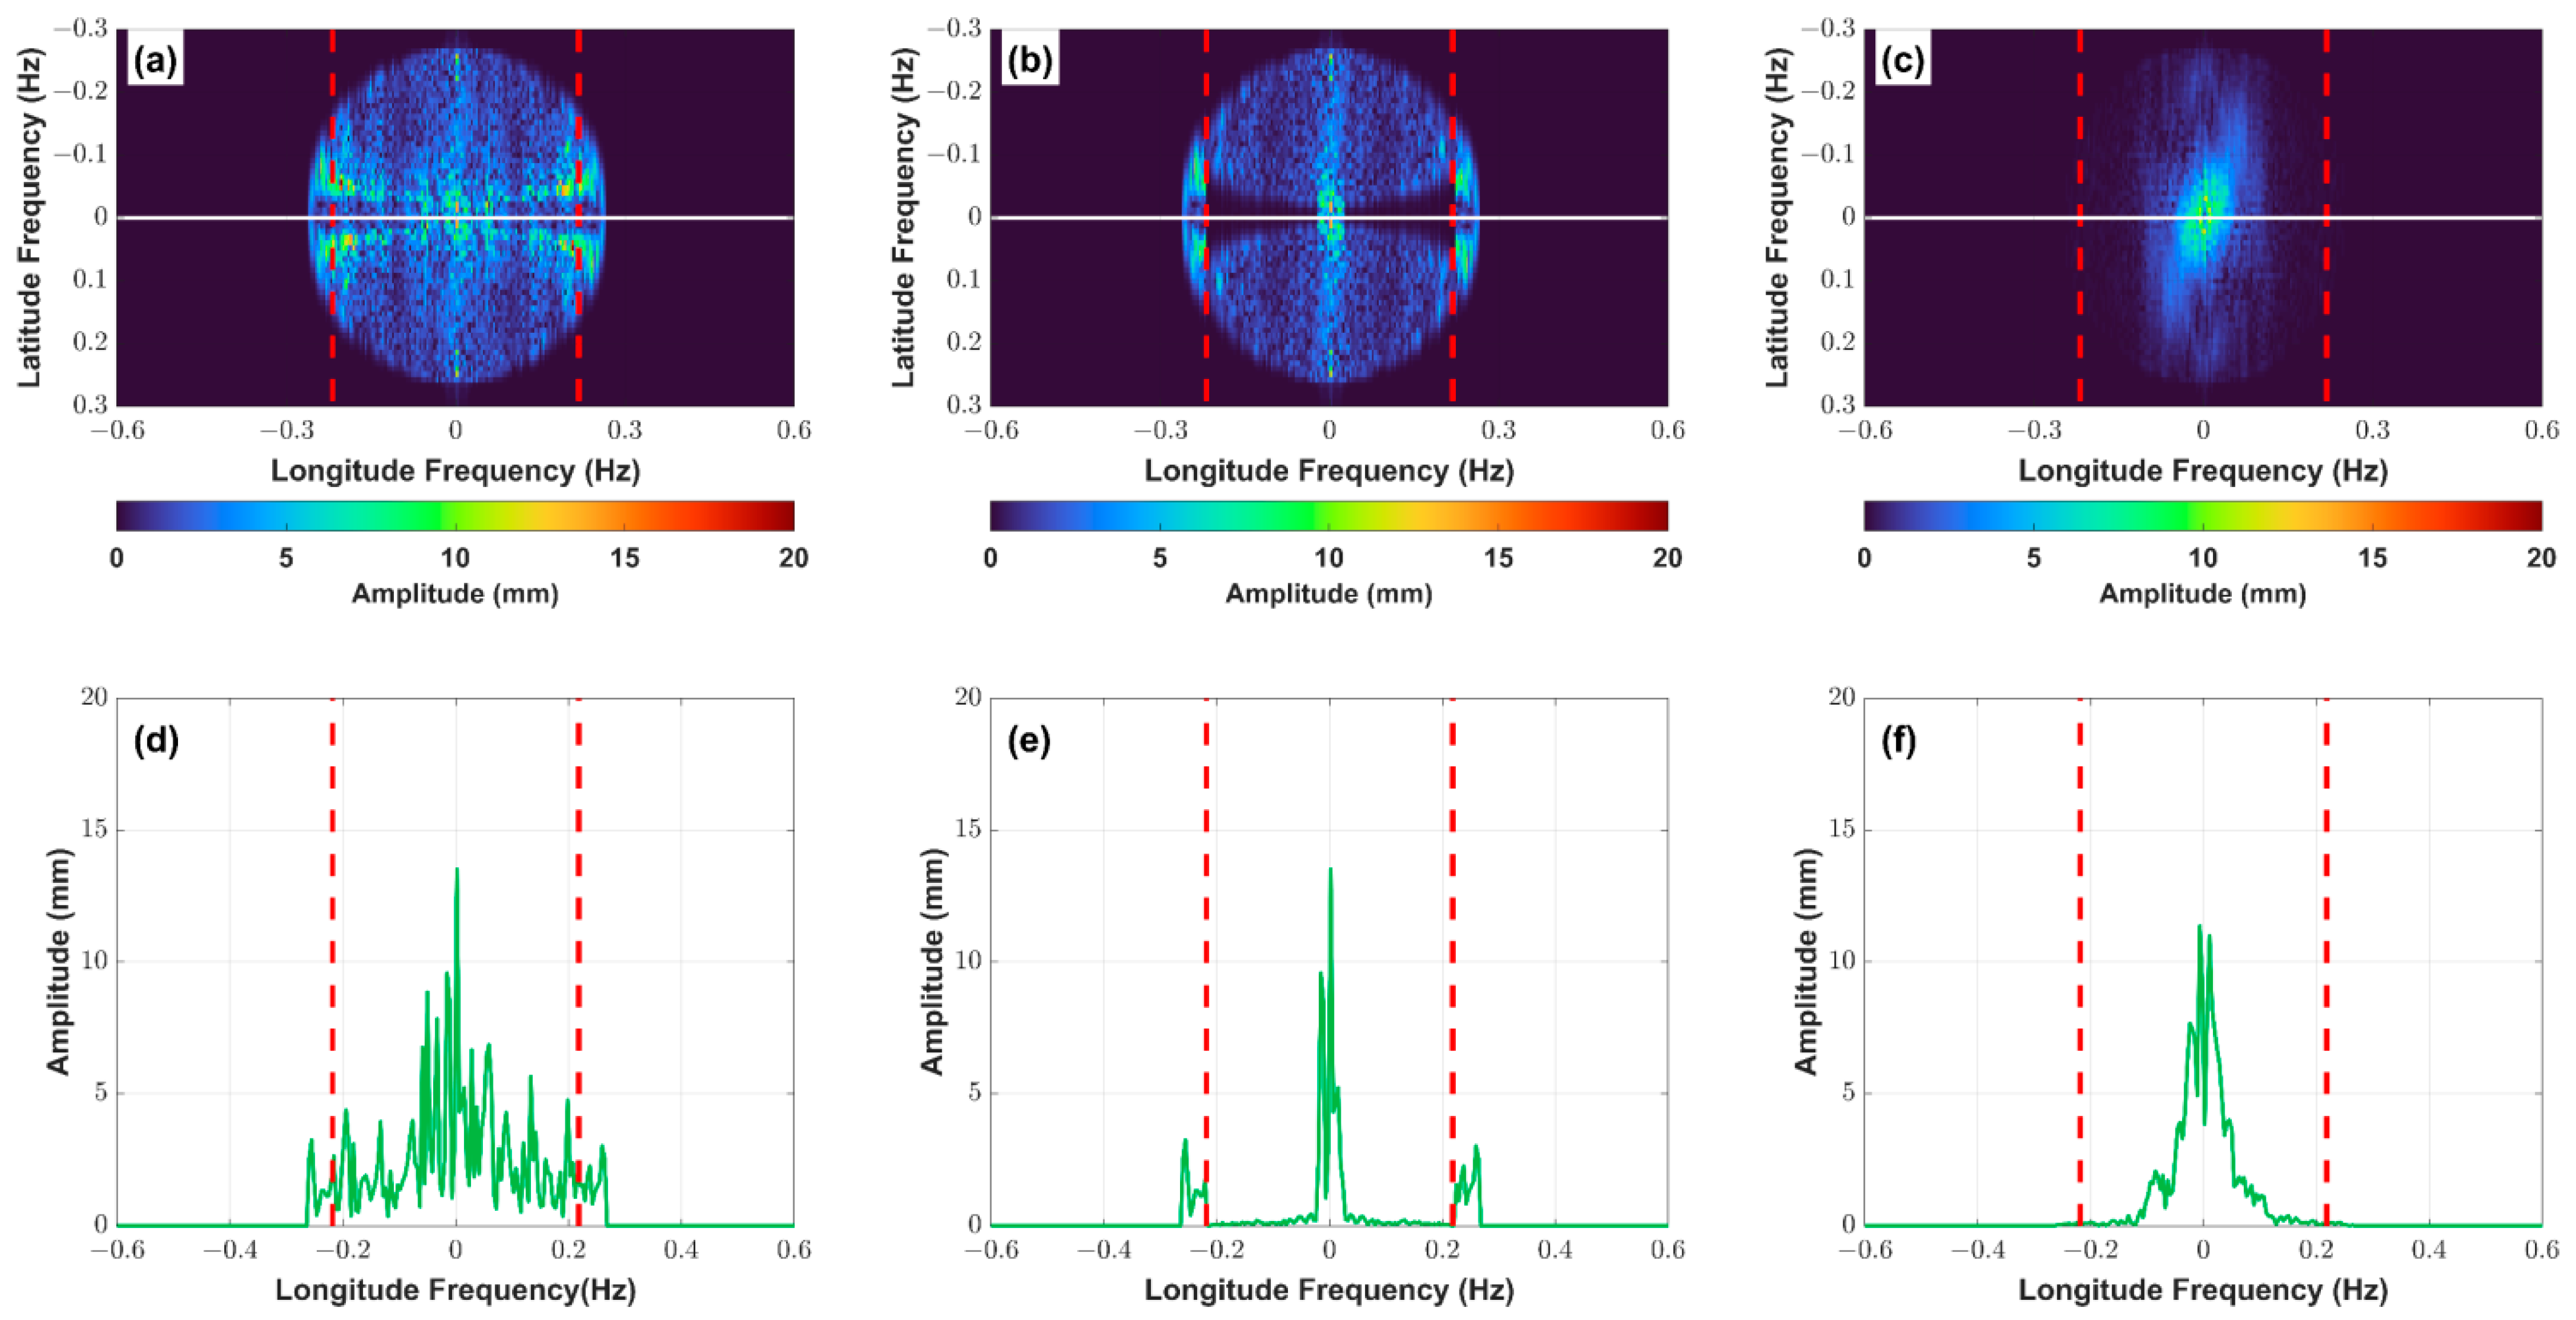
After the Fourier transforms, we can obtain the Fourier spectrum (Figure 4) of the GRACE/GFO (without or with the P4M6 method) and GLDAS mass field (soil moisture plus snow water equivalent). After adopting the P4M6 method, the spectrum power reduces obviously within a special region (longitude frequency within ±0.22). However, the outside is still evidently strong, as is the spectrum in the raw mass field. Moreover, there is only weak power outside this region in the GLDAS spectrum. Consequently, we believe the residual stripe noise is mainly due to this outside region in the spectrum domain.
To suppress this residual noise, we designed the ELP filter. The workflow of the ELP filter is shown in Figure 5. The ELP filter is defined in the Fourier spectral domain as follows:
F p , q = 1 , p < N c 0 , p < N c ,
where N c is the specific index in p that represents the cut-off longitude frequency (±0.22 Hz). After filtering Y by F in the spectral domain, we execute an inverse Fourier transform to Y E L P and obtain the filtered mass field X E L P [65].
Y E L P = Y F .
X E L P j , k = 1 a j = 1 a 1 b k = 1 b f a ( j 1 ) ( p 1 ) × f b ( k 1 ) ( q 1 ) × Y E L P p , q .

3.3. SNR Index and TCH Method Assessment

Assuming both GRACE/GFO land and ocean errors are approximately at the same level, Chen et al. [23] defined a land–ocean RMS (root mean square) ratio from GRACE/GFO estimated mass fields as the SNR index. To reduce the leakage of signals from land, we use a 300 km buffer zone.
S N R = R M S L a n d m a s s   +   E r r R M S O c e a n m a s s   +   E r r
Err represents the error. Landmass and Oceanmass are the true mass fields over land and ocean, respectively. The RMS (Err) keeps between zero and a much larger positive value (much larger than RMS(Landmass)). Moreover, RMS(Landmass) is expected to be larger than RMS(Oceanmass) at any error level. Accordingly, we can deduce that SNR falls between one and R M S L a n d m a s s R M S O c e a n m a s s . In this work, the SNR index is adopted to assess the mass field after using the ELP filter.
In addition, the uncertainty of the mass field is estimated via the TCH method. Chen et al. [66] pointed out that the TCH method provides an alternative technique for assessing the approximate uncertainty of the GRACE/GFO mass field when the true signal is unknown. The TCH method toolbox is provided by Xu et al. [67,68].

4. Results

4.1. Performance of the ELP Filter

We first investigate the performance of the ELP filter in the spatial domain. The GRACE/GFO mass fields in April and October 2002 from CSR SHCs products (random SDCs) are selected to test the four strategies (Figure 6a–h) because water storage annual cycles achieve a local peak/valley value in April/October each year, which can emphasize the improvement by a relatively significant SNR.
The original result (Figure 6a,e) covers significant north–south stripe noise. After only applying the ELP filter, the stripe noise is mainly suppressed in the low latitudes (Figure 6b,f). After only applying the P4M6 method, the stripe noise in the high-latitude region can be suppressed (Figure 6c,g). Additionally, the combination of the P4M6 method and the ELP filter can efficiently suppress noise (Figure 6d,h).
Nonetheless, there are still weak stripes and random noise in the filtered result with this combination. The 300 km Gaussian filter can further suppress the residual noise in each strategy (Figure 6i–p). Among the results with the Gaussian filter, the result with the ELP filter and the P4M6 method is significantly less stripe noise over the ocean, which is the best (Figure 6l,p).
We subsequently check the signal variance of the mass field. The original signal variance (Figure 7) presents an irrational rebound after degree 30, which can be suppressed via the P4M6 method. However, the signal variance in the high-degree zone (51~60) is still larger because of the insufficient process in the P4M6 method, which can be addressed with the ELP filter. Additionally, the application of the 300 km Gaussian filter leads to a more clean filtered result by further diminishing the noise in the high-degree SHCs.
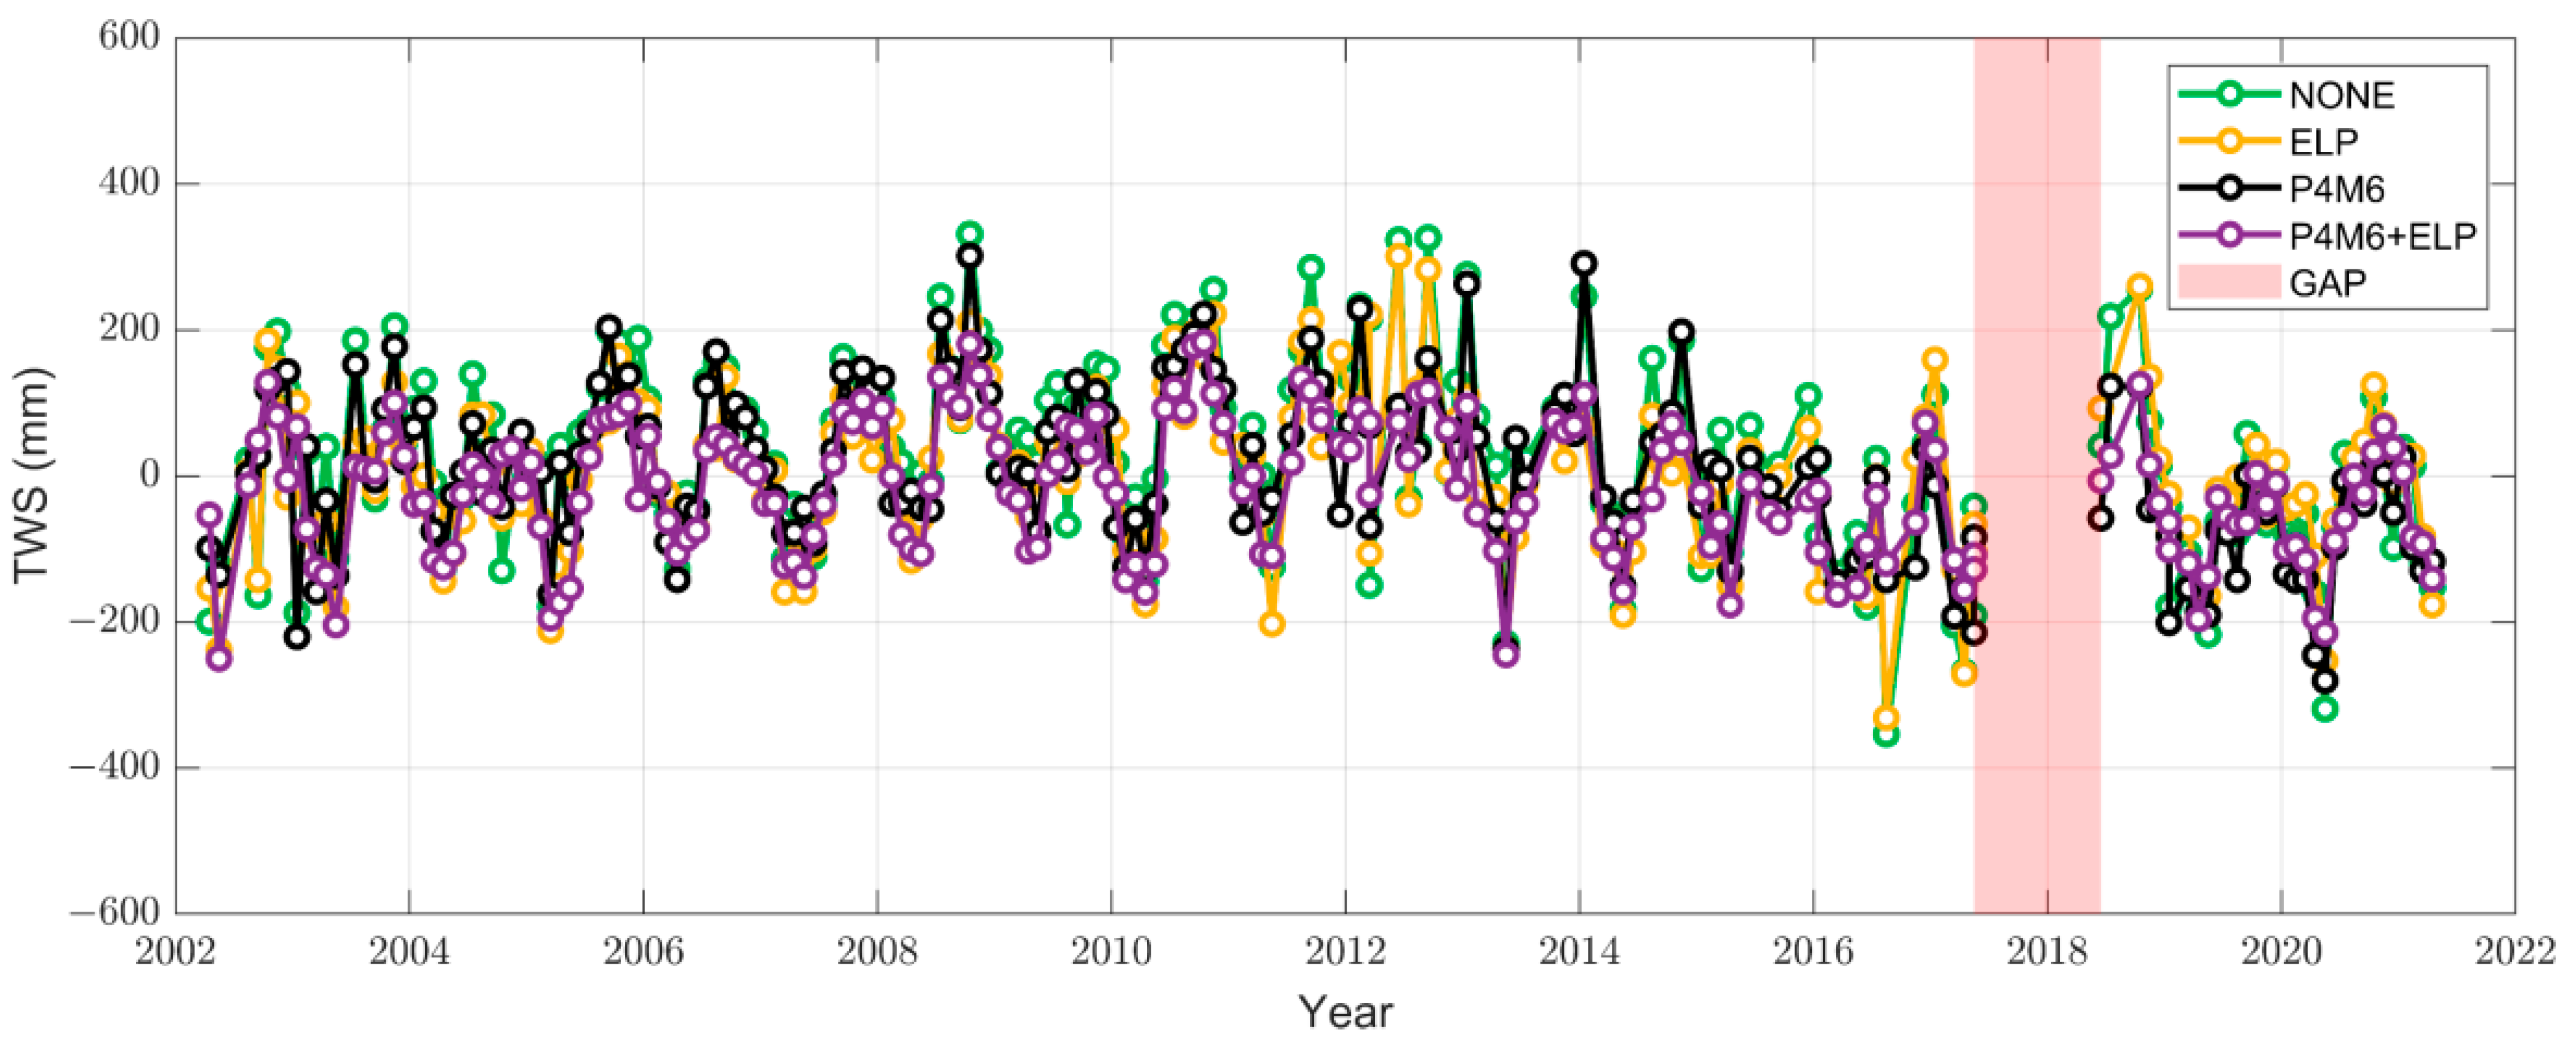
In the end, the ELP filter is checked in the time domain. For separating the contribution of the Gaussian filter, the TWS change in Nicaragua (Figure 8) is computed via the four strategies without the Gaussian filter. Among the four strategies, the combination of the ELP filter and the P4M6 method performs better. Its corresponding time series becomes more seasonal, and the unreal peak signals are removed.

4.2. Assessment of the ELP Filter

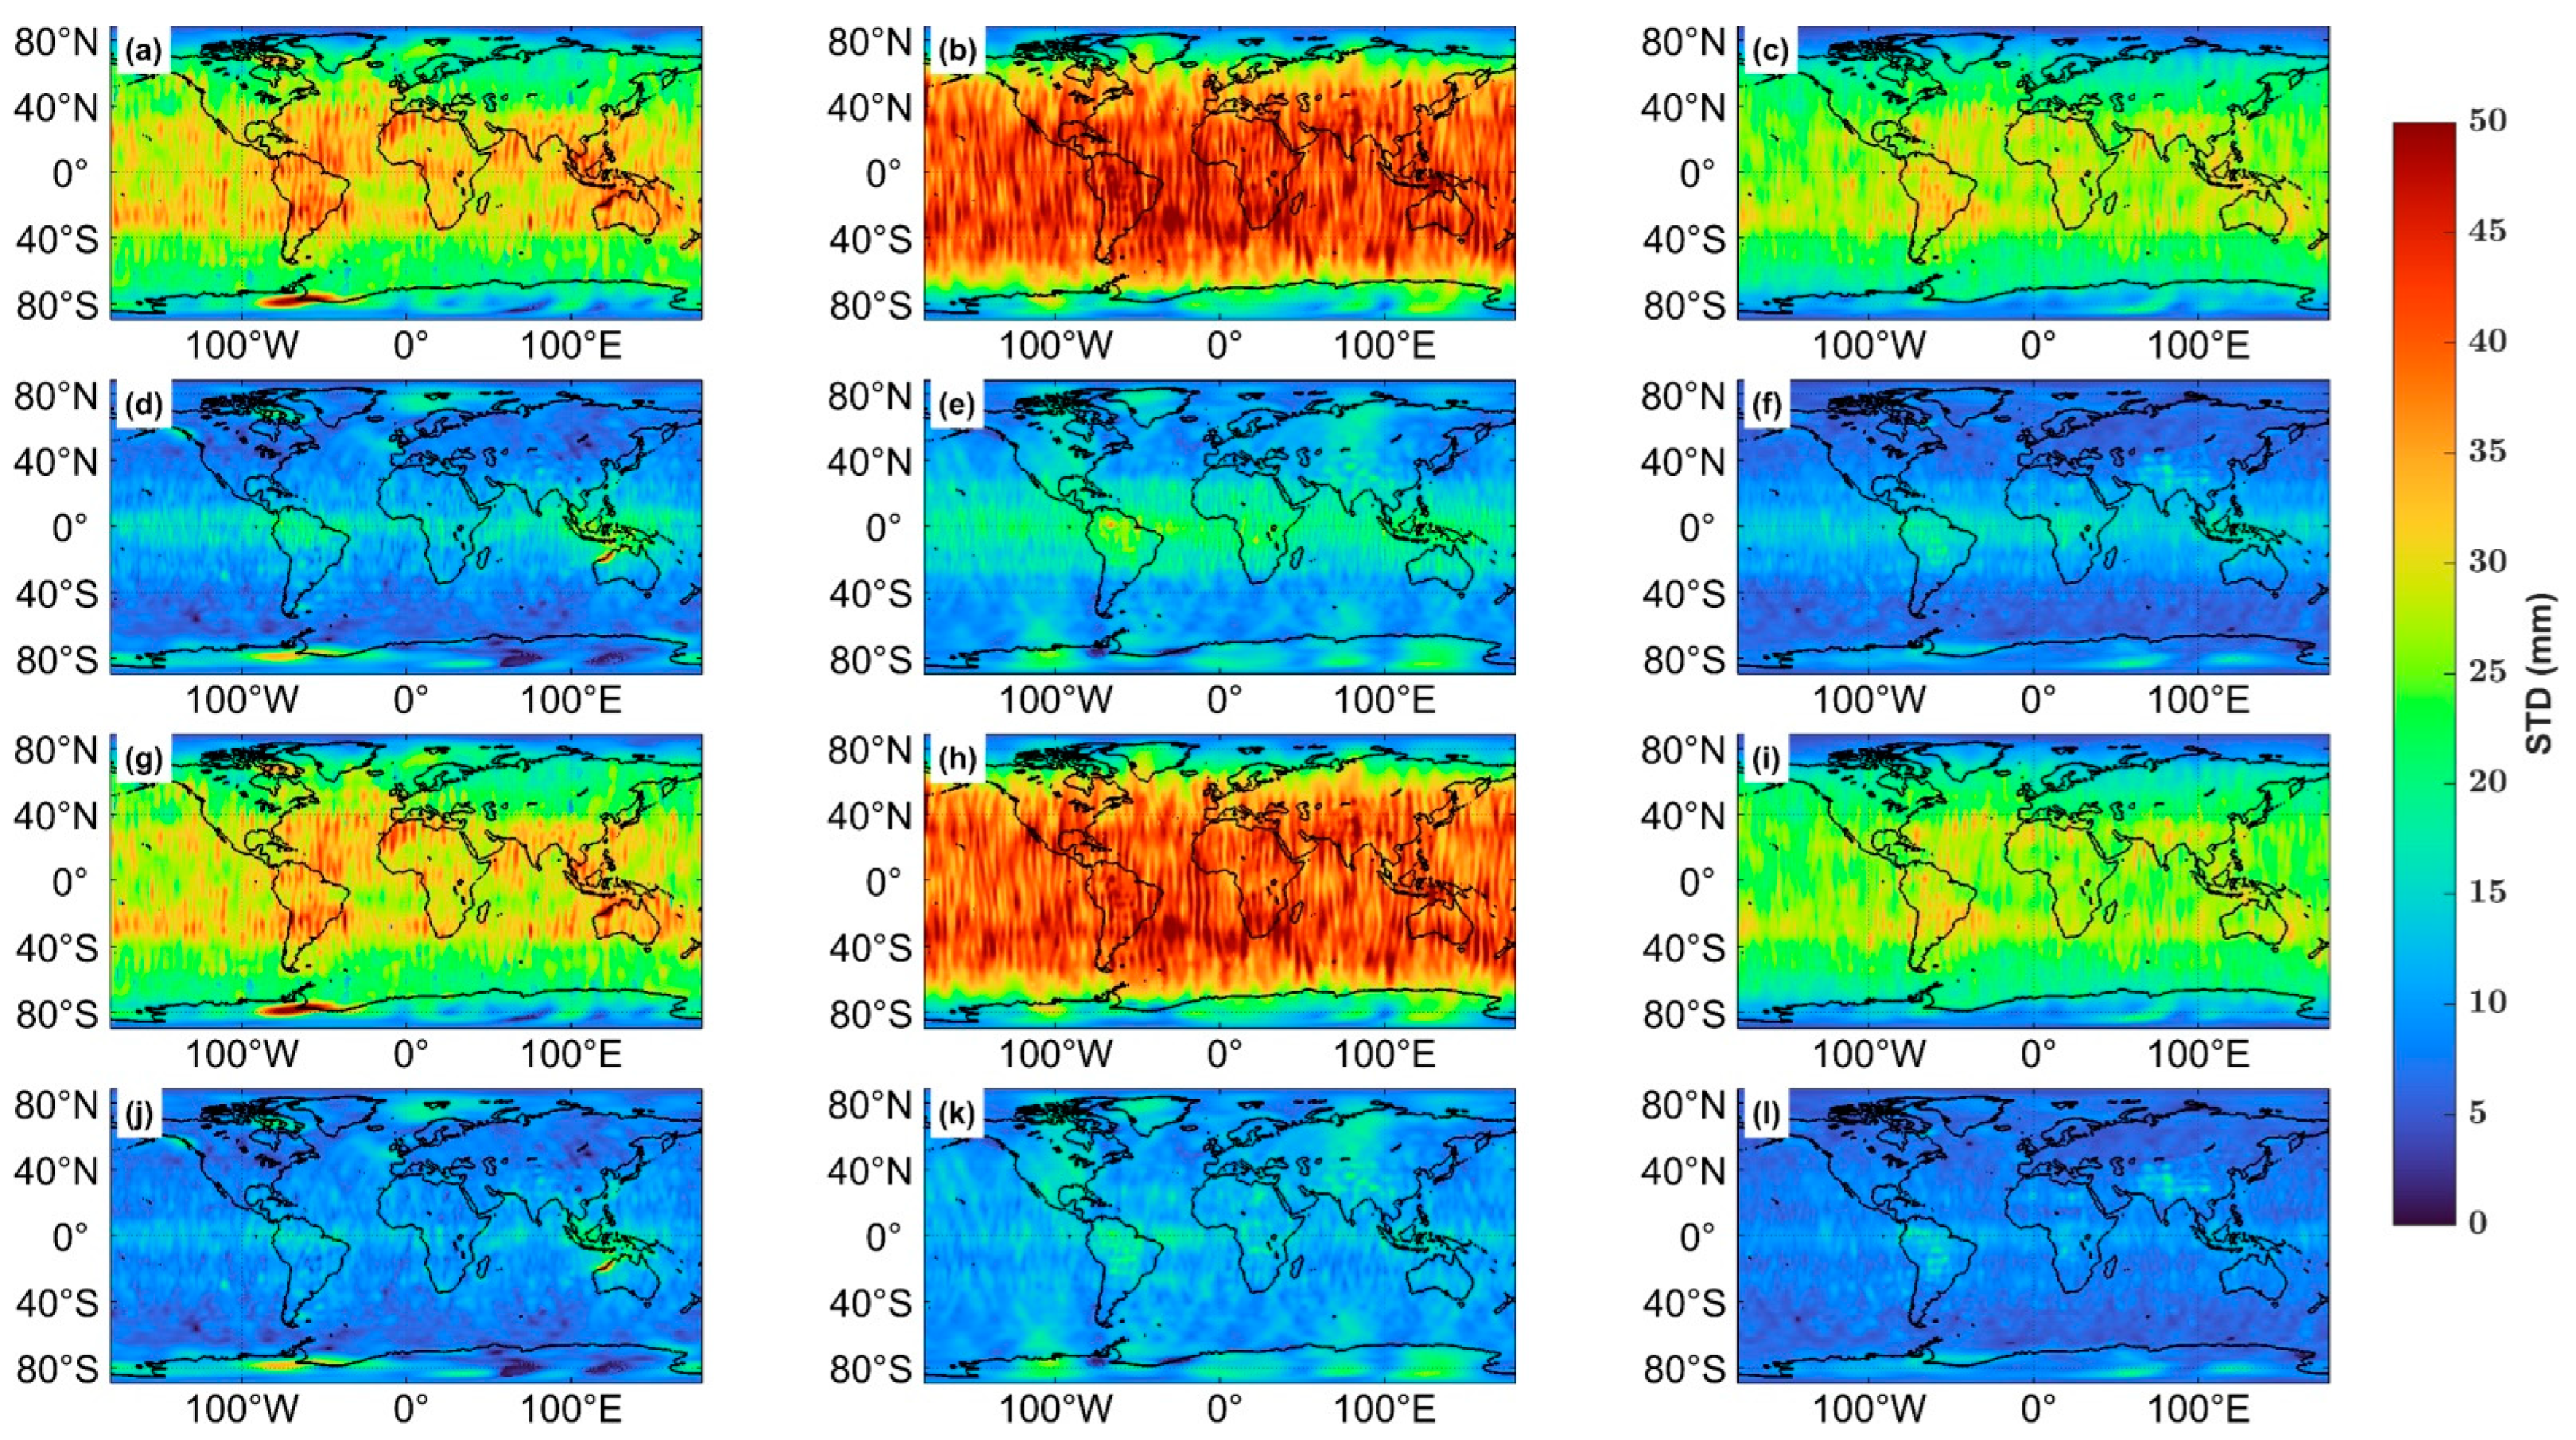
To quantify the uncertainty of the ELP filter, the mass field of each SDC is computed via four strategies (NONE, P4M6, ELP, and P4M6 + ELP) without Gaussian filters. Subsequently, the mass field with the same strategy from three SDCs is input into the TCH method, which outputs the uncertainty grid of each SDC in terms of standard deviation (STD). In the case of the ELP filter, the global gridded STD of three SDCs (Figure 9) presents an evident diminishment in low latitude (30°S~30°N). Since there is residual stripe noise and random noise in the mass fields with four strategies, a Gaussian filter is necessary. The uncertainty results (Figure 10) of the above four strategies plus a 300 km Gaussian filter are also estimated via the TCH method. The application of the Gaussian filter further diminishes the uncertainty.
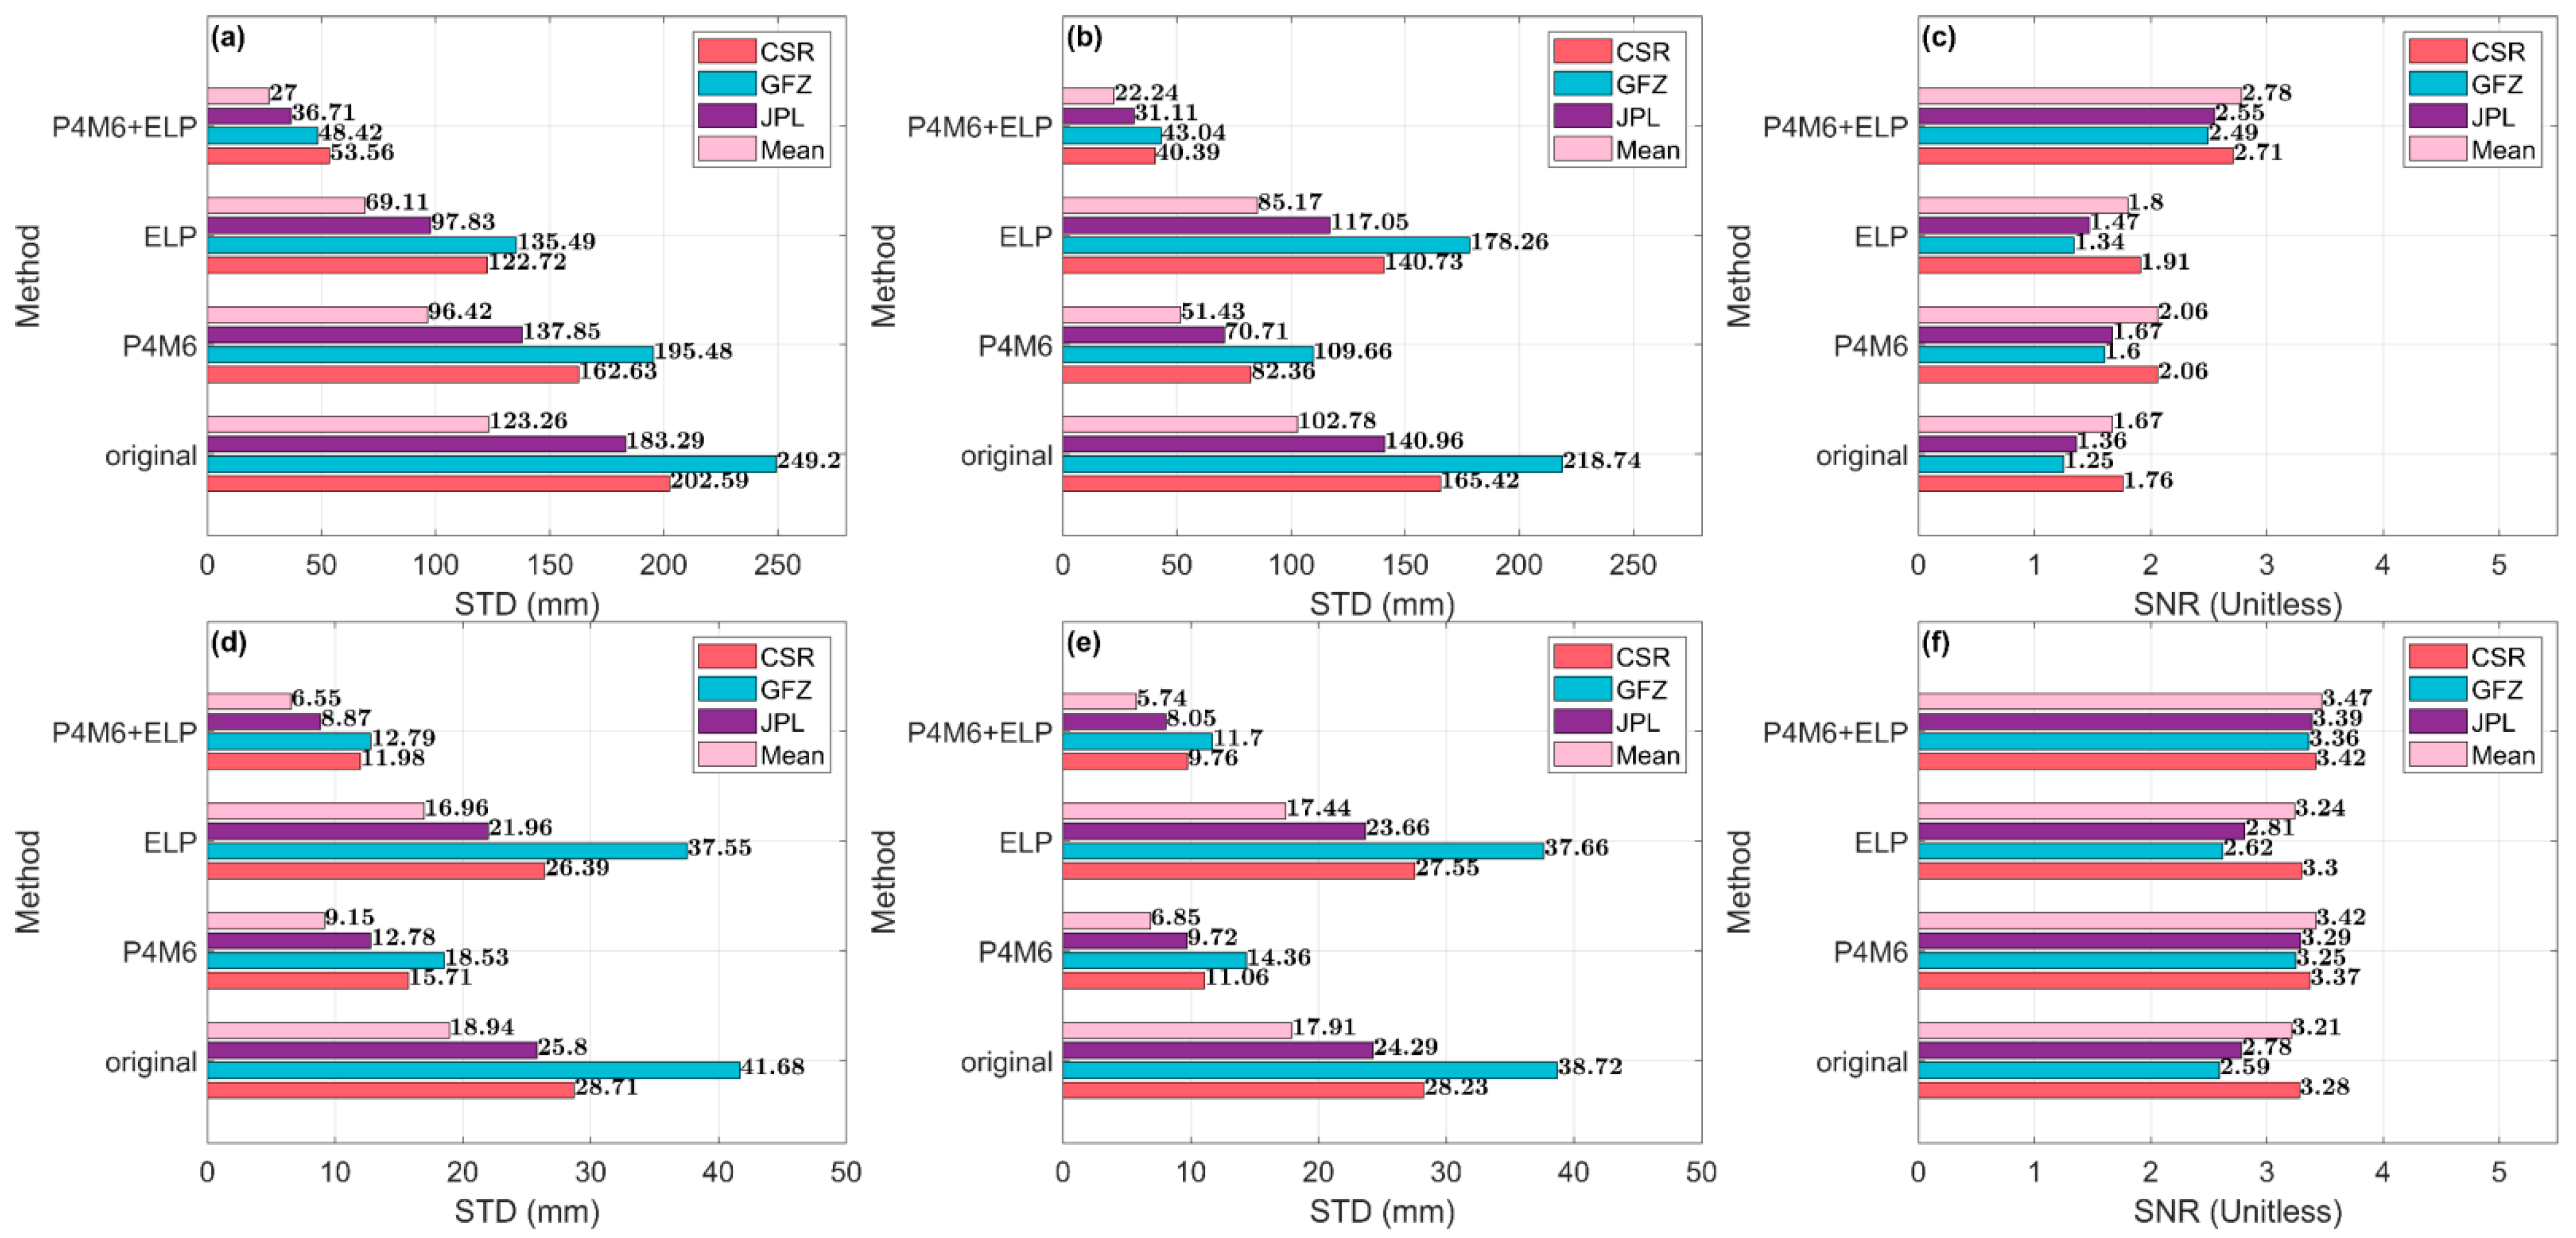
Afterward, the global and Nicaragua average STDs in Figure 9 and Figure 10 are computed (Figure 11). Additionally, the SNR of each SDC is also computed via the previous eight strategies. The SNR in Figure 11 is the average of each monthly mass field. Moreover, the SNR and regional STD of the mean mass field (three SDCs) are also estimated in Figure 11.
To separate the contributions of the Gaussian filter, we first focus on the improvement in the case without any Gaussian filter (Figure 11a–c). All Nicaragua or global STDs are improved after adopting the ELP filter. Among Nicaragua STDs, the STD of the mean mass field (Figure 11a) diminishes from 123.26 mm to 69.11 mm after only using the ELP filter. Moreover, there is a significant increment in the SNR of the mean mass field from 1.67 to 1.8 (Figure 11c) after adopting the ELP filter. Even in the case of the 300 km Gaussian filter (Figure 11d–f), there are also slight improvements after applying the ELP filter. Furthermore, the combination of the P4M6 method and the ELP filter achieves better performance than the single method.

4.3. Mass Change in Nicaragua

Except for the P4M6 method and the ELP filter, an additional 300 km Gaussian filter is employed to suppress residual noise in the GRACE/GFO mass field. After that, we adopt the forward modeling technique to restore the leakage signal. The input of the technique is the mean filtered mass field from three SDCs in each month.
In Figure 12, the Nicaragua basin TWS is calculated via the cosine latitude weighted average of the outputs (i.e., the monthly global mass field from the forward modeling technique), which is named SHCs TWS. We also compute other time series in Nicaragua, including the TWS from CSR-M, SWS, and precipitation. The long-term mass change in Nicaragua accords with the annual precipitation. Subsequently, the Nicaragua basin GWS subtracts the SWS from GRACE/GFO-derived TWS in Nicaragua. The two in situ GWS observations (MW01 and Hand Dug) are used to validate the basin GWS.
The medium positive correlation (0.44 and 0.5) between two GWS estimations (SHCs and CSR-M) and in situ observation of the Hand Dug well indicates that GWS estimation is rational in a way. Compared with the SHCs GWS, the RMS of the difference between the CSR M GWS and two in situ observations is smaller (Table 1).

5. Discussion

5.1. Potential Signal Distortion

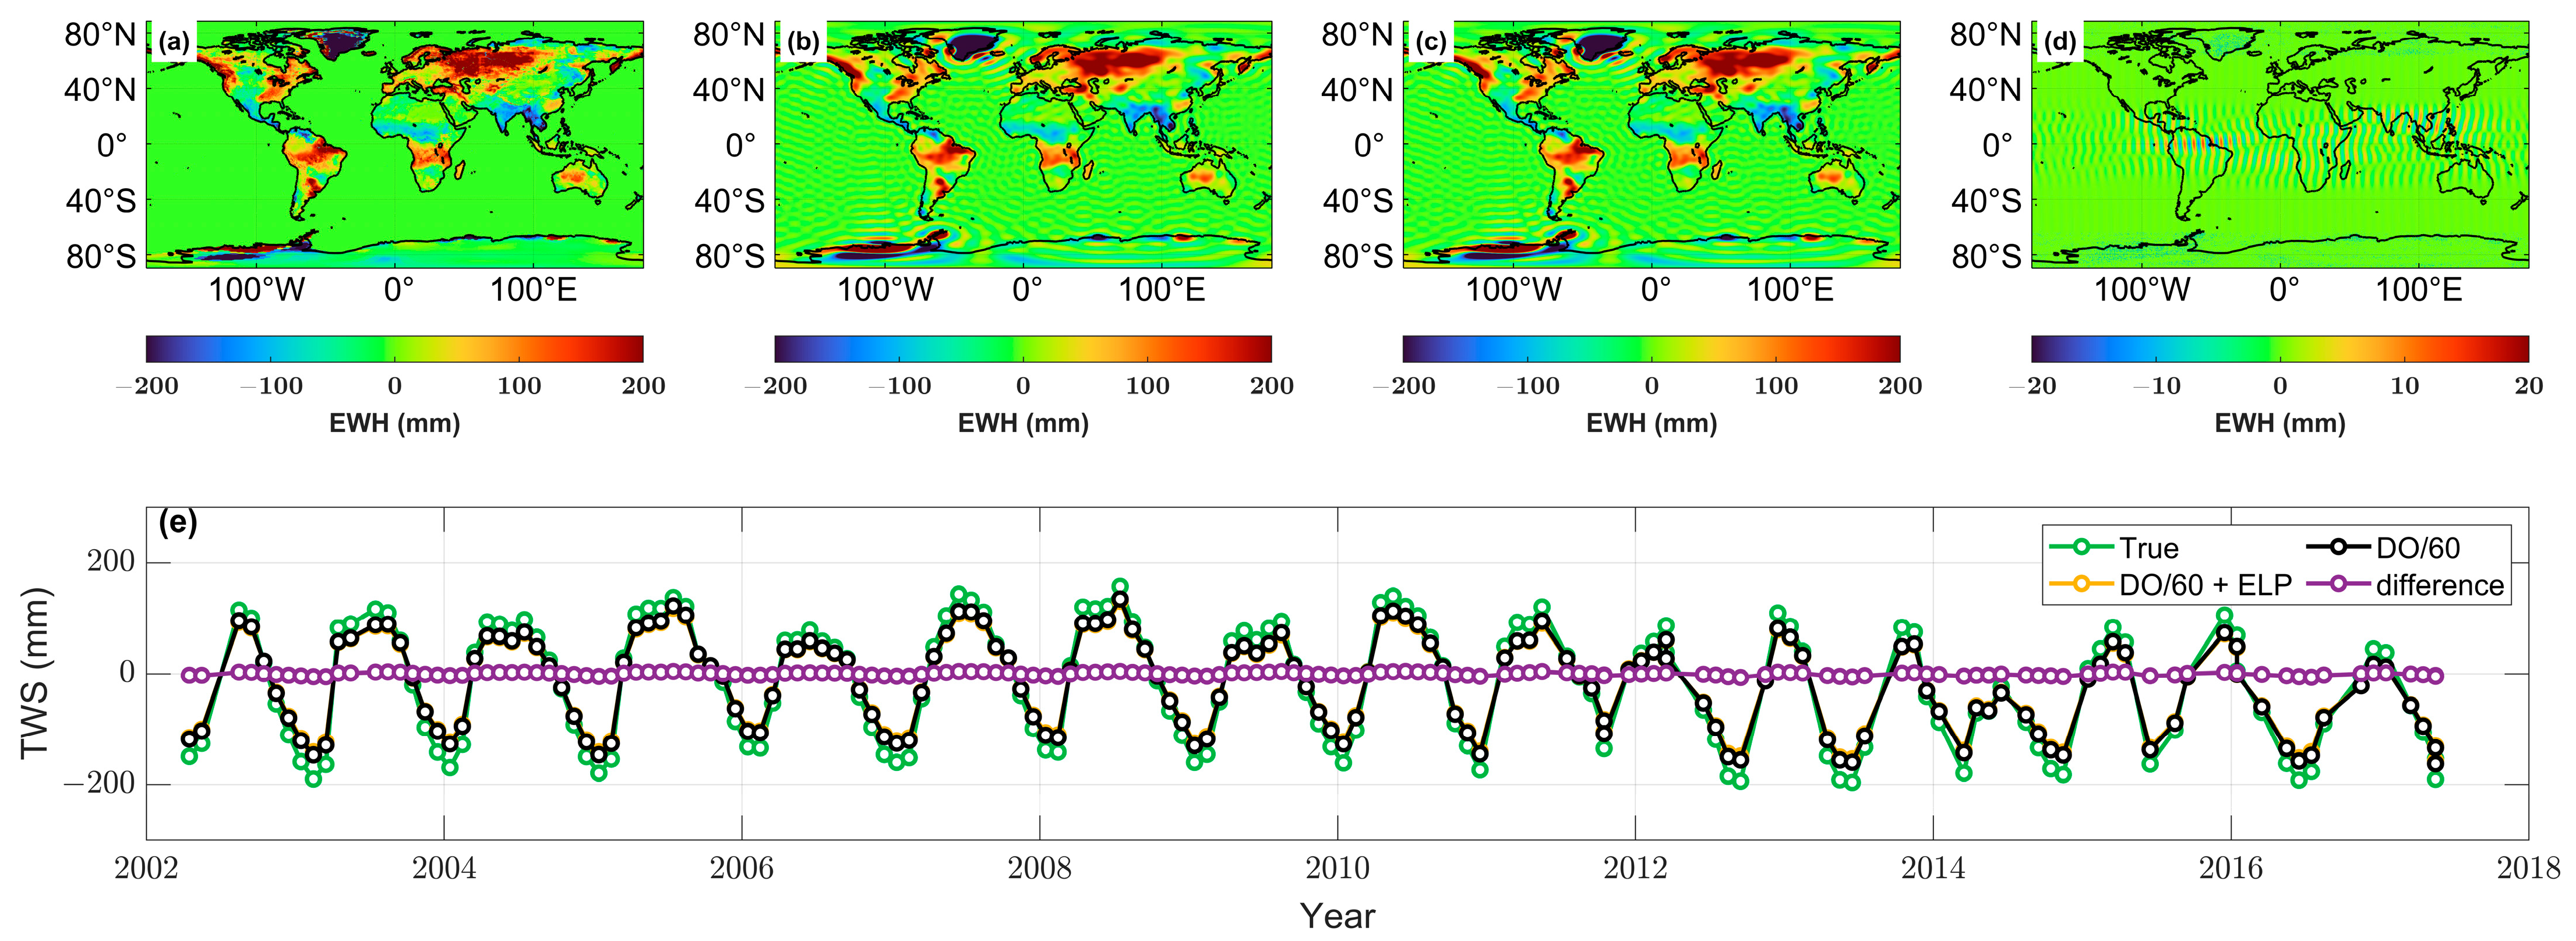
A simulation is used to test the signal distortion of the ELP filter. A simulated true mass field consists of GLDAS soil moisture and snow water storage over land and the CSR M mass field over Antarctica. To keep the Earth’s mass balanced, the ocean mass must be uniform and equal to the negative land mass. The simulated true mass field (Figure 13a) is transformed into a noisy-free observation (Figure 13b) with a truncated degree and orders up to 60 (termed DO/60). The filtered observation (Figure 13c) is filtered by the ELP filter from the simulated observation.
After using the ELP filter in the simulated observation, the signal loss (Figure 13d) is minor. The maximum and minimum values in Figure 13d are 13.94 mm and −13.94 mm, respectively. The RMS of the time series difference (i.e., signal loss due to the ELP filter) in Nicaragua (Figure 13e) is about 2.84 mm, which is 3.3% and 2.7% of observation (84.68 mm) and true (105.93 mm) separately. Consequently, the ELP filter removes the real signal slightly, which is acceptable.

5.2. Signal Leakage in Different Truncation

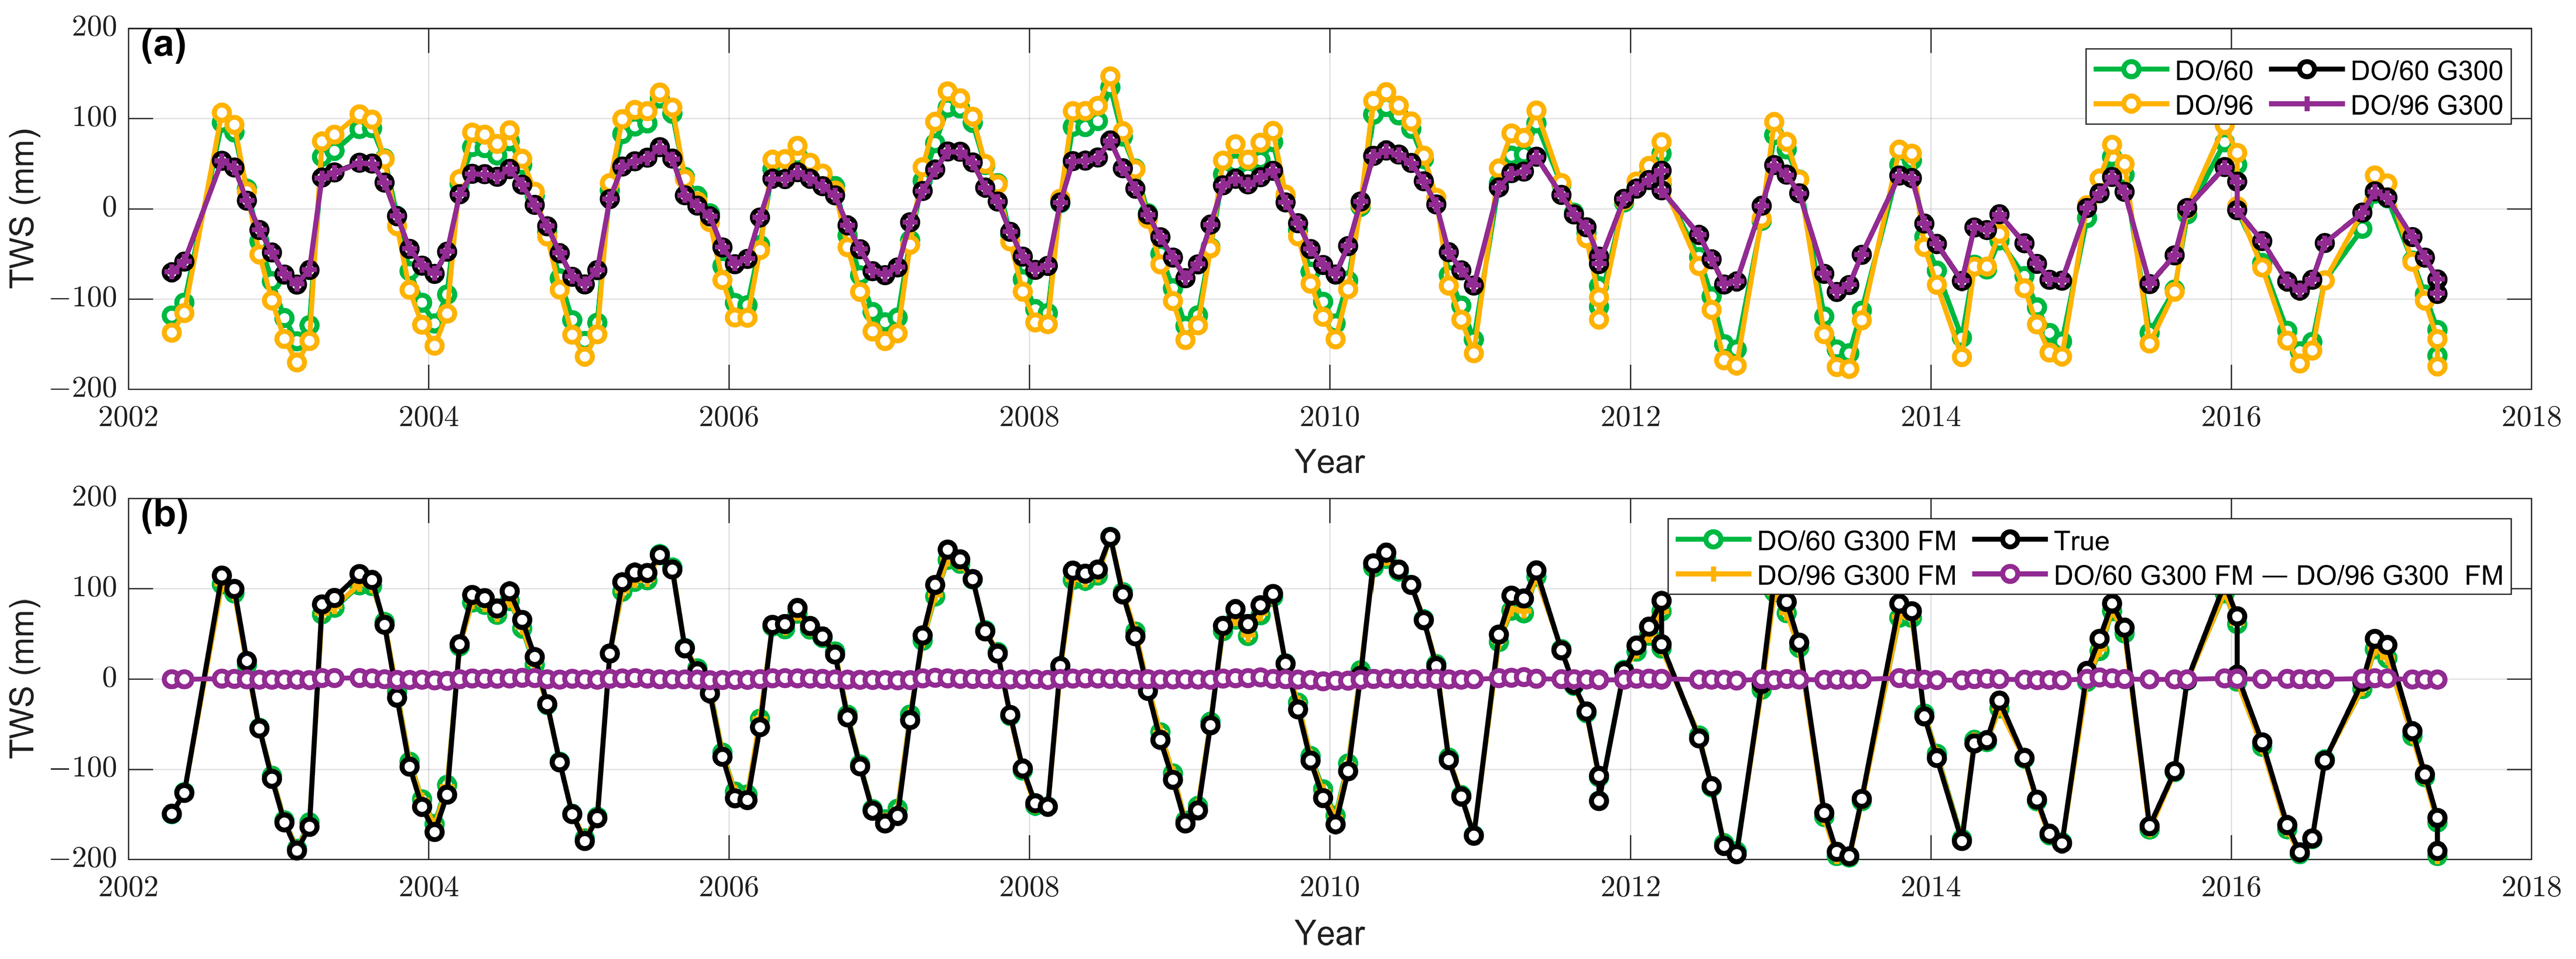
Different truncations lead to different strengths of signal leakage in the basin signal. To investigate the influence in Nicaragua of different truncations, the noisy-free observation with DO/60 and DO/96 is derived from the simulated true mass field (Figure 14a). A 300 km Gaussian filter is used to smooth the two kinds of observations. After that, the forward modeling technique is adopted to restore the signal leakage in observation (Figure 14b).
The RMS of the leakage signal (i.e., the difference between true and smooth time series) from DO/60 and DO/96 with a 300 km Gaussian is 57.86 mm and 57.51 mm, respectively. After using the forward modeling technique, the RMS of the difference between the two recovered signals is 0.8 mm. Although different truncations lead to different strengths of signal leakage, the recovered signals are almost close. Moreover, the RMS of the unrecovered component (i.e., the difference between the true and recovered signals) is about 6.0–6.5 mm (5.7% of the RMS of the true signal). Consequently, we confirm that leakage in Nicaragua can be addressed with the forward modeling technique, which concentrates the leakage signal into the constrained region by iteration with an acceptable loss.

5.3. Analysis of Long-Term Periodic Signal

The previous result shows that the long-term mass change in Nicaragua accords with the annual precipitation. We here investigate the connection between the Nicaragua mass change and ENSO via wavelet coherent analysis (Figure 15). There is a significant negative resonance with a period of 2~4 years between precipitation and ENSO, which is similar to the TWS-ENSO resonance both in SHCs and CSR-M. Additionally, SWS-ENSO negative resonance also presents a relatively weak intensity. These negative resonances are consistent with the previous study that ENSO regulates long-term precipitation to influence TWS and SWS changes [33,34,69,70,71,72,73]. However, only the SHCs GWS shows a similar weak resonance (insignificant) with ENSO before 2012, rather than the CSR M GWS. We deduce that CSR M may influence the long-term variation since there are relatively strong constraints on time information in the regularization.
We can find its suppression of CSR M in the aliasing signal (~3.74-year). The influence of aliasing error is great in the coastal area (e.g., Nicaragua coast), which is caused by the imperfect data processing in GRACE/GFO data [74]. Two basin GWS estimations show a ~3.8-year periodic signal (Figure 16), which should be the aliasing signal rather than the real hydrological signal because ENSO is without this significant 3.8-year periodic signal. The amplitude of this ~3.8-year periodic signal in CSR M GWS (~14 mm) is two times smaller than that of SHCs GWS (~30 mm). This difference may indicate that CSR M achieves a relatively intensive constraint in time information, and the forward modeling technique in the SHCs inversion may move the residual ocean signal to the coast.

5.4. Limitation and Outlook

Compared with the DO/60 (~333 km) truncation, the truncation of DO/96 (~208 km) simultaneously leads to a high numerical spatial resolution and potentially involves more potential high-frequency error from high-degree SHCs in the results. This residual noise may lead to unpredictable noise accumulation in the iteration of the forward modeling technique [75]. However, our concern is with the basin average signal rather than the spatial detail variation in the mass field. Consequently, we here use the SHCs product with DO/60 instead of DO/96, although the former has a lower spatial resolution in numerical terms.
This work also uses CSR M products, but its resolution is not necessarily higher than SHCs product with a truncation of DO/60. Compared with the SHCs product, the regularization for the CSR M product appears to have a high spatial resolution (~200 km) [47]. However, indeed, the resolution of these GRACE/GFO products is still limited by GRACE’s fundamental spatial resolution limitation, which is roughly equivalent to Gaussian smoothing of a 300 km radius.
Compared to the GRACE practical resolution (300 km), Nicaragua appears small in area, but its spatial span (11°N–14°N, 83°W–88°W) and signal strength (annual amplitude ~100 mm) is sufficient for the study of regional average mass change. It can be seen from the results (Figure 12) that the TWS changes of the two products are close to the SWS (the major component of the TWS), and both capture the regional quality change signal of Nicaragua.
To validate the two GRACE/GFO estimations, we try to indirectly analyze the TWS changes by comparing the basin GWS estimation with the in situ GWS observation. However, since there is limited in situ GWS observation and multiple uncertain sources from signal separation in GWS estimation, the mass change in Nicaragua cannot be validated effectively. In future work, we hope to obtain more independent measurements across longer periods and regular observations to compare and analyze the mass change in Nicaragua.

6. Conclusions

Here, we put forward the ELP filter dedicated to further removing stripe noise. This filter was developed based on the Fourier spectral domain. The real and simulated mass fields are used to investigate the ELP filter. Additionally, the TCH method and SNR index are adopted to assess the ELP filter. The following can be concluded:
  • The ELP filter mainly performs in the tropical region and slightly removes the true signal in Nicaragua, which is acceptable;
  • The ELP filter mainly removes the noise in the SHCs from degrees 51 to 60;
  • Unreal peaks in mass change time series can be further suppressed;
  • In the case of the mean mass field, the Nicaragua regional STD diminishes from 123.26 mm (original) to 69.11 mm (the ELP filter), and the SNR improves from 1.67 to 1.8.
Subsequently, aiming to estimate the Nicaragua regional mass changes, the ELP filter, the P4M6 method, a 300 Gaussian filter, and the forward modeling technique are adopted to process the mean mass field from three SDCs. Finally, the GRACE/GFO-derived TWS and GWS are combined with other hydrological observations to analyze and verify the mass changes. Correspondingly, the major conclusions are divided into two aspects:
  • There is a negative resonance between TWS and ENSO with a period of 2~4 years in Nicaragua, which is linked with the interannual precipitation;
  • The ~3.8-year periodic signal in Nicaragua basin GWS is significant on account of aliasing error, which is an imperfect pre-process in GRACE/GFO level-2 data.
In this work, we know that GRACE/GFO products have the potential to reveal changes in the mass change in Nicaragua, but the inversion and verification of mass changes are still challenging. Our study can provide a reference for investigating mass change in Nicaragua. Additionally, we expect new gravity satellite missions to be able to observe the Earth’s gravity field with higher resolution and accuracy.

Author Contributions

Conceptualization, G.J. and C.X.; methodology, G.J.; software, G.J.; validation, J.L., C.X., G.J. and N.W.; formal analysis, C.X.; investigation, G.J.; resources, G.J.; data curation, J.L. and G.J.; writing—original draft preparation, G.J.; writing—review and editing, C.X. and G.J.; visualization, G.J. and M.L.; supervision, C.X.; project administration, C.X.; funding acquisition, C.X. All authors have read and agreed to the published version of the manuscript.

Funding

This research was funded by the National Natural Science Foundation of China (Grant no. 41974014, 42274004) and the Natural Science Foundation of Guangdong Province, China (Grant no. 2022A1515010396).

Data Availability Statement

No new data are created or analyzed in this study. Data sharing is not applicable to this article.

Acknowledgments

The authors are grateful for the comments provided by the Editor and three anonymous reviewers, which were used to improve the quality of our work. We are grateful to three SDCs (CSR, GFZ, and JPL) for providing the GRACE/GFO level-2 and level-3 products. The Nino 3.4 index is provided by National Centers for Environmental Information (https://www.ncei.noaa.gov/ accessed on 1 April 2022). The GLDAS model is provided by the EARTHDATA (https://disc.gsfc.nasa.gov accessed on 1 April 2022). The Nicaragua boundary shapefile used in this study is provided by the Database of Global Administrative Areas (https://gadm.org accessed on 4 May 2022). The ERA5-land climate model is provided by ECMWF (https://cds.climate.copernicus.eu access on 1 May 2022). The water level data is provided by DAHITI (https://dahiti.dgfi.tum.de accessed on 12 April 2022).

Conflicts of Interest

The authors declare no conflict of interest.

References

  1. Ray, R.D.; Ponte, R.M. Barometric tides from ECMWF operational analyses. Ann. Geophys. 2003, 21, 1897–1910. [Google Scholar] [CrossRef]
  2. Nerem, R.S.; Wahr, J.M.; Leuliette, E.W. Measuring the distribution of ocean mass using GRACE. Space Sci. Rev. 2003, 108, 331–344. [Google Scholar] [CrossRef]
  3. King, M.A.; Padman, L. Accuracy assessment of ocean tide models around Antarctica. Geophys. Res. Lett. 2005, 32, l23608. [Google Scholar] [CrossRef]
  4. Han, S.C.; Shum, C.K.; Jekeli, C.; Alsdorf, D. Improved estimation of terrestrial water storage changes from GRACE. Geophys. Res. Lett. 2005, 32, L07302. [Google Scholar] [CrossRef]
  5. Swenson, S.; Wahr, J. Monitoring changes in continental water storage with GRACE. Space Sci. Rev. 2003, 108, 345–354. [Google Scholar] [CrossRef]
  6. Swenson, S.; Wahr, J.; Milly, P.C.D. Estimated accuracies of regional water storage variations inferred from the Gravity Recovery and Climate Experiment (GRACE). Water Resour. Res. 2003, 39, 1223. [Google Scholar] [CrossRef]
  7. Voss, K.A.; Famiglietti, J.S.; Lo, M.; de Linage, C.; Rodell, M.; Swenson, S.C. Groundwater depletion in the Middle East from GRACE with implications for transboundary water management in the Tigris-Euphrates-Western Iran region. Water Resour. Res. 2013, 49, 904–914. [Google Scholar] [CrossRef] [PubMed]
  8. Mohamed, A.; Al Deep, M.; Othman, A.; Taha, A.I.; Alshehri, F.; Abdelrady, A. Integrated Geophysical Assessment of Groundwater Potential in Southwestern Saudi Arabia. Front. Earth Sci. 2022, 10, 937402. [Google Scholar] [CrossRef]
  9. Othman, A.; Abdelrady, A.; Mohamed, A. Monitoring Mass Variations in Iraq Using Time-Variable Gravity Data. Remote Sens. 2022, 14, 3346. [Google Scholar] [CrossRef]
  10. Swenson, S.; Wahr, J. Methods for inferring regional surface-mass anomalies from Gravity Recovery and Climate Experiment (GRACE) measurements of time-variable gravity. J. Geophys. Res.-Solid Earth 2002, 107, ETG-3. [Google Scholar] [CrossRef]
  11. Zhang, L.; Yi, S.; Wang, Q.; Chang, L.; Tang, H.; Sun, W. Evaluation of GRACE mascon solutions for small spatial scales and localized mass sources. Geophys. J. Int. 2019, 218, 1307–1321. [Google Scholar] [CrossRef]
  12. Chambers, D.P. Evaluation of new GRACE time-variable gravity data over the ocean. Geophys. Res. Lett. 2006, 33, 5. [Google Scholar] [CrossRef]
  13. Crossley, D.; Hinderer, J.; Boy, J.P.; Pierce, D.W. Empirical orthogonal function (EOF) software. Geophys. J. Int. 2005, 161, 257–264. [Google Scholar] [CrossRef]
  14. Rangelova, E.; van der Wal, W.; Braun, A.; Sideris, M.G.; Wu, P. Analysis of Gravity Recovery and Climate Experiment time-variable mass redistribution signals over North America by means of principal component analysis. J. Geophys. Res.-Earth Surf. 2007, 112, F03002. [Google Scholar] [CrossRef]
  15. Wang, L.; Davis, J.L.; Hill, E.M.; Tamisiea, M.E. Stochastic filtering for determining gravity variations for decade-long time series of GRACE gravity. J. Geophys. Res.-Solid Earth 2016, 121, 2915–2931. [Google Scholar] [CrossRef]
  16. Zaitchik, B.F.; Rodell, M.; Reichle, R.H. Assimilation of GRACE terrestrial water storage data into a Land Surface Model: Results for the Mississippi River basin. J. Hydrometeorol. 2008, 9, 535–548. [Google Scholar] [CrossRef]
  17. Shen, Y.; Wang, F.; Chen, Q. Weighted multichannel singular spectrum analysis for post-processing GRACE monthly gravity field models by considering the formal errors. Geophys. J. Int. 2021, 226, 1997–2010. [Google Scholar] [CrossRef]
  18. Wahr, J.; Molenaar, M.; Bryan, F. Time variability of the Earth’s gravity field: Hydrological and oceanic effects and their possible detection using GRACE. J. Geophys. Res.-Solid Earth 1998, 103, 30205–30229. [Google Scholar] [CrossRef]
  19. Han, S.C.; Shum, C.K.; Jekeli, C.; Kuo, C.Y.; Wilson, C.; Seo, K.W. Non-isotropic filtering of GRACE temporal gravity for geophysical signal enhancement. Geophys. J. Int. 2005, 163, 18–25. [Google Scholar] [CrossRef]
  20. Zhang, Z.Z.; Chao, B.F.; Lu, Y.; Hsu, H.T. An effective filtering for GRACE time-variable gravity: Fan filter. Geophys. Res. Lett. 2009, 36, L17311. [Google Scholar] [CrossRef]
  21. Pu, L.; Fan, D.; You, W.; Yang, X.; Nigatu, Z.M.; Jiang, Z. Extracting terrestrial water storage signals from GRACE solutions in the Amazon Basin using an iterative filtering approach. Remote Sens. Lett. 2022, 13, 14–23. [Google Scholar] [CrossRef]
  22. Sasgen, I.; Martinec, Z.; Fleming, K. Wiener optimal filtering of GRACE data. Stud. Geophys. Geod. 2006, 50, 499–508. [Google Scholar] [CrossRef]
  23. Chen, J.L.; Wilson, C.R.; Seo, K.W. Optimized smoothing of gravity recovery and climate experiment (GRACE) time-variable gravity observations. J. Geophys. Res.-Solid Earth 2006, 111, 11. [Google Scholar] [CrossRef]
  24. Klees, R.; Revtova, E.A.; Gunter, B.C.; Ditmar, P.; Oudman, E.; Winsemius, H.C.; Savenije, H.H.G. The design of an optimal filter for monthly GRACE gravity models. Geophys. J. Int. 2008, 175, 417–432. [Google Scholar] [CrossRef]
  25. Swenson, S.; Wahr, J. Post-processing removal of correlated errors in GRACE data. Geophys. Res. Lett. 2006, 33, 4. [Google Scholar] [CrossRef]
  26. Chen, J.L.; Wilson, C.R.; Tapley, B.D.; Blankenship, D.; Young, D. Antarctic regional ice loss rates from GRACE. Earth Planet. Sci. Lett. 2008, 266, 140–148. [Google Scholar] [CrossRef]
  27. Klees, R.; Liu, X.; Wittwer, T.; Gunter, B.C.; Revtova, E.A.; Tenzer, R.; Ditmar, P.; Winsemius, H.C.; Savenije, H.H.G. A Comparison of Global and Regional GRACE Models for Land Hydrology. Surv. Geophys. 2008, 29, 335–359. [Google Scholar] [CrossRef]
  28. Duan, X.J.; Guo, J.Y.; Shum, C.K.; van der Wal, W. On the postprocessing removal of correlated errors in GRACE temporal gravity field solutions. J. Geod. 2009, 83, 1095–1106. [Google Scholar] [CrossRef]
  29. Chambers, D.P.; Bonin, J.A. Evaluation of Release-05 GRACE time-variable gravity coefficients over the ocean. Ocean Sci. 2012, 8, 859–868. [Google Scholar] [CrossRef]
  30. Zhan, J.-G.; Wang, Y.; Shi, H.-L.; Chai, H.; Zhu, C.-D. Removing correlative errors in GRACE data by the smoothness priors method. Chin. J. Geophys.-Chin. Ed. 2015, 58, 1135–1144. [Google Scholar] [CrossRef]
  31. Yang, T.; Yu, H.; Wang, Y. An efficient low-pass-filtering algorithm to de-noise global GRACE data. Remote Sens. Environ. 2022, 283, 113303. [Google Scholar] [CrossRef]
  32. Yi, S.; Sneeuw, N. A novel spatial filter to reduce north-south striping noise in GRACE spherical harmonic coefficients. J. Geod. 2022, 96, 23. [Google Scholar] [CrossRef]
  33. Munoz-Jimenez, R.; Giraldo-Osorio, J.D.; Brenes-Torres, A.; Avendano-Flores, I.; Nauditt, A.; Hidalgo-Leon, H.G.; Birkel, C. Spatial and temporal patterns, trends and teleconnection of cumulative rainfall deficits across Central America. Int. J. Climatol. 2019, 39, 1940–1953. [Google Scholar] [CrossRef]
  34. Jian, G.; Xu, C.; Li, J.; Zhang, X.; Feng, L. Terrestrial Water Storage Component Changes Derived from Multisource Data and Their Responses to ENSO in Nicaragua. Remote Sens. 2022, 14, 6012. [Google Scholar] [CrossRef]
  35. Bundschuh, J.; Winograd, M.; Day, M.; Alvarado, G.E. Geographical, social, economic, and environmental framework and developments. In Central America, Two Volume Set, 1st ed.; CRC Press: Boca Raton, FL, USA, 2007. [Google Scholar]
  36. Rodgers, M.; Roman, D.C.; Geirsson, H.; LaFemina, P.; McNutt, S.R.; Munoz, A.; Tenorio, V. Stable and unstable phases of elevated seismic activity at the persistently restless Telica Volcano, Nicaragua. J. Volcanol. Geotherm. Res. 2015, 290, 63–74. [Google Scholar] [CrossRef]
  37. Suarez, G.; Munoz, A.; Farraz, I.A.; Talavera, E.; Tenorio, V.; Novelo-Casanova, D.A.; Sanchez, A. The 10 April 2014 Nicaraguan Crustal Earthquake: Evidence of Complex Deformation of the Central American Volcanic Arc. Pure Appl. Geophys. 2016, 173, 3305–3315. [Google Scholar] [CrossRef]
  38. Tanioka, Y.; Cabrera, A.G.; Arguello, G.J.; Yamanaka, Y. Tsunami hazard in the Caribbean coast of Honduras due to large earthquakes occurred along the Cayman Trough at the northwest boundary of Caribbean plate. Coast. Eng. J. 2020, 62, 405–412. [Google Scholar] [CrossRef]
  39. Beck, H.E.; Zimmermann, N.E.; McVicar, T.R.; Vergopolan, N.; Berg, A.; Wood, E.F. Present and future Koppen-Geiger climate classification maps at 1-km resolution (vol 5, 180214, 2018). Sci. Data 2020, 7, 274. [Google Scholar] [CrossRef]
  40. Rudolph, J.D. Nicaragua, a Country Study, 2nd ed.; Foreign Area Studies; The American University: Washington, DC, USA, 1982; Volume 550. [Google Scholar]
  41. Perez-Brignoli, H. A Brief History of Central America, 1st ed.; University of California Press: Berkeley, CA, USA; Los Angeles, CA, USA, 1989. [Google Scholar]
  42. Zhao, Z.J.; Han, M.; Yang, K.; Holbrook, N.J. Signatures of midsummer droughts over Central America and Mexico. Clim. Dynam. 2022, 1–20. [Google Scholar] [CrossRef]
  43. Swenson, S.; Chambers, D.; Wahr, J. Estimating geocenter variations from a combination of GRACE and ocean model output. J. Geophys. Res.-Solid Earth 2008, 113, B08410. [Google Scholar] [CrossRef]
  44. Loomis, B.D.; Rachlin, K.E.; Wiese, D.N.; Landerer, F.W.; Luthcke, S.B. Replacing GRACE/GRACE-FO C-30 With Satellite Laser Ranging: Impacts on Antarctic Ice Sheet Mass Change. Geophys. Res. Lett. 2020, 47, e2019GL085488. [Google Scholar] [CrossRef]
  45. Cheng, M.; Tapley, B.D.; Ries, J.C. Deceleration in the Earth’s oblateness. J. Geophys. Res.-Solid Earth 2013, 118, 740–747. [Google Scholar] [CrossRef]
  46. Peltier, W.R.; Argus, D.F.; Drummond, R. Comment on “An Assessment of the ICE-6G_C (VM5a) Glacial Isostatic Adjustment Model” by Purcell et al. J. Geophys. Res.-Solid Earth 2018, 123, 2019–2028. [Google Scholar] [CrossRef]
  47. Save, H.; Bettadpur, S.; Tapley, B.D. High-resolution CSR GRACE RL05 mascons. J. Geophys. Res.-Solid Earth 2016, 121, 7547–7569. [Google Scholar] [CrossRef]
  48. Li, J.; Chen, J.; Li, Z.; Wang, S.-Y.; Hu, X. Ellipsoidal Correction in GRACE Surface Mass Change Estimation. J. Geophys. Res.-Solid Earth 2017, 122, 9437–9460. [Google Scholar] [CrossRef]
  49. Schwatke, C.; Dettmering, D.; Bosch, W.; Seitz, F. DAHITI—An innovative approach for estimating water level time series over inland waters using multi-mission satellite altimetry. Hydrol. Earth Syst. Sci. 2015, 19, 4345–4364. [Google Scholar] [CrossRef]
  50. Rodell, M.; Houser, P.; Jambor, U.; Gottschalck, J.; Mitchell, K.; Meng, C.-J.; Arsenault, K.; Cosgrove, B.; Radakovich, J.; Bosilovich, M. The global land data assimilation system. Bull. Am. Meteorol. Soc. 2004, 85, 381–394. [Google Scholar] [CrossRef]
  51. Syed, T.H.; Famiglietti, J.S.; Rodell, M.; Chen, J.; Wilson, C.R. Analysis of terrestrial water storage changes from GRACE and GLDAS. Water Resour. Res. 2008, 44, W02433. [Google Scholar] [CrossRef]
  52. Landerer, F.W.; Swenson, S.C. Accuracy of scaled GRACE terrestrial water storage estimates. Water Resour. Res. 2012, 48, W04531. [Google Scholar] [CrossRef]
  53. Lenczuk, A.; Weigelt, M.; Kosek, W.; Mikocki, J. Autoregressive Reconstruction of Total Water Storage within GRACE and GRACE Follow-On Gap Period. Energies 2022, 15, 4827. [Google Scholar] [CrossRef]
  54. Phillips, T.; Nerem, R.S.; Fox-Kemper, B.; Famiglietti, J.S.; Rajagopalan, B. The influence of ENSO on global terrestrial water storage using GRACE. Geophys. Res. Lett. 2012, 39, L16705. [Google Scholar] [CrossRef]
  55. Ni, S.; Chen, J.; Wilson, C.R.; Li, J.; Hu, X.; Fu, R. Global Terrestrial Water Storage Changes and Connections to ENSO Events. Surv. Geophys. 2018, 39, 1–22. [Google Scholar] [CrossRef]
  56. Adamson, J.K.; LaVanchy, G.T.; Stone, B.; Clark, J.A.; Dykstra, S.J.; Taylor, M.J. Geological and hydrogeological assessment of the Brito Formation: Municipio de Tola, Nicaragua. Hydrogeol. J. 2021, 29, 2285–2304. [Google Scholar] [CrossRef]
  57. Chen, Z.W.; Zhang, X.F.; Chen, J.H. Monitoring Terrestrial Water Storage Changes with the Tongji-Grace2018 Model in the Nine Major River Basins of the Chinese Mainland. Remote Sens. 2021, 13, 1851. [Google Scholar] [CrossRef]
  58. Olauson, J. ERA5: The new champion of wind power modelling? Renew. Energy 2018, 126, 322–331. [Google Scholar] [CrossRef]
  59. Munoz-Sabater, J.; Dutra, E.; Agusti-Panareda, A.; Albergel, C.; Arduini, G.; Balsamo, G.; Boussetta, S.; Choulga, M.; Harrigan, S.; Hersbach, H.; et al. ERA5-Land: A state-of-the-art global reanalysis dataset for land applications. Earth Syst. Sci. Data 2021, 13, 4349–4383. [Google Scholar] [CrossRef]
  60. Rayner, N.A.; Parker, D.E.; Horton, E.B.; Folland, C.K.; Alexander, L.V.; Rowell, D.P.; Kent, E.C.; Kaplan, A. Global analyses of sea surface temperature, sea ice, and night marine air temperature since the late nineteenth century. J. Geophys. Res.-Atmos. 2003, 108, 4407–4428. [Google Scholar] [CrossRef]
  61. Trenberth, K.E. The definition of EL Nino. Bull. Am. Meteorol. Soc. 1997, 78, 2771–2778. [Google Scholar] [CrossRef]
  62. Feng, W. GRAMAT: A comprehensive Matlab toolbox for estimating global mass variations from GRACE satellite data. Earth Sci. Inf. 2019, 12, 389–404. [Google Scholar] [CrossRef]
  63. Zou, F.; Tenzer, R.; Jin, S.G. Water Storage Variations in Tibet from GRACE, ICESat, and Hydrological Data. Remote Sens. 2019, 11, 1103. [Google Scholar] [CrossRef]
  64. Chen, J.L.; Wilson, C.R.; Tapley, B.D.; Save, H.; Cretaux, J.F. Long-term and seasonal Caspian Sea level change from satellite gravity and altimeter measurements. J. Geophys. Res.-Solid Earth 2017, 122, 2274–2290. [Google Scholar] [CrossRef]
  65. Frigo, M.; Johnson, S.G.; IEEE. FFTW: An adaptive software architecture for the FFT. In Proceedings of the IEEE International Conference on Acoustics, Speech and Signal Processing (ICASSP 98), Seattle, WA, USA, 12–15 May 1998; pp. 1381–1384. [Google Scholar]
  66. Chen, J.; Tapley, B.; Tamisiea, M.E.; Save, H.; Wilson, C.; Bettadpur, S.; Seo, K.-W. Error Assessment of GRACE and GRACE Follow-On Mass Change. J. Geophys. Res.-Solid Earth 2021, 126, e2021JB022124. [Google Scholar] [CrossRef]
  67. Koot, L.; de Viron, O.; Dehant, V. Atmospheric angular momentum time-series: Characterization of their internal noise and creation of a combined series. J. Geod. 2006, 79, 663–674. [Google Scholar] [CrossRef]
  68. Xu, L.; Chen, N.; Moradkhani, H.; Zhang, X.; Hu, C. Improving Global Monthly and Daily Precipitation Estimation by Fusing Gauge Observations, Remote Sensing, and Reanalysis Data Sets. Water Resour. Res. 2020, 56, e2019WR026444. [Google Scholar] [CrossRef]
  69. Amador, J.A. The Intra-Americas Sea Low-level Jet Overview and Future Research. In Trends and Directions in Climate Research; Gimeno, L., GarciaHerrera, R., Trigo, R.M., Eds.; Annals of the New York Academy of Sciences: San Lorenzo de El Escorial, Spain, 2008; Volume 1146, pp. 153–188. [Google Scholar]
  70. Herrera, D.; Ault, T. Insights from a New High-Resolution Drought Atlas for the Caribbean Spanning 1950–2016. J. Clim. 2017, 30, 7801–7825. [Google Scholar] [CrossRef]
  71. Hidalgo, H.G.; Alfaro, E.J.; Quesada-Montano, B. Observed (1970–1999) climate variability in Central America using a high-resolution meteorological dataset with implication to climate change studies. Clim. Chang. 2017, 141, 13–28. [Google Scholar] [CrossRef]
  72. Sanchez-Murillo, R.; Esquivel-Hernandez, G.; Corrales-Salazar, J.L.; Castro-Chacon, L.; Duran-Quesada, A.M.; Guerrero-Hernandez, M.; Delgado, V.; Barberena, J.; Montenegro-Rayo, K.; Calderon, H.; et al. Tracer hydrology of the data-scarce and heterogeneous Central American Isthmus. Hydrol. Process. 2020, 34, 2660–2675. [Google Scholar] [CrossRef]
  73. Amador Astúa, J.A. A Climate Feature of the Tropical Americas: The Trade Wind Easterly Jet. Top Meteor. Oceanogr. 1998, 5, 91–102. [Google Scholar]
  74. Abrykosov, P.; Sulzbach, R.; Pail, R.; Dobslaw, H.; Thomas, M. Treatment of ocean tide background model errors in the context of GRACE/GRACE-FO data processing. Geophys. J. Int. 2022, 228, 1850–1865. [Google Scholar] [CrossRef]
  75. Zhou, H.; Dai, M.; Wang, P.; Wei, M.; Tang, L.; Xu, S.; Luo, Z. Assessment of GRACE/GRACE Follow-On Terrestrial Water Storage Estimates Using an Improved Forward Modeling Method: A Case Study in Africa. Front. Earth Sci. 2022, 9, 1322. [Google Scholar] [CrossRef]
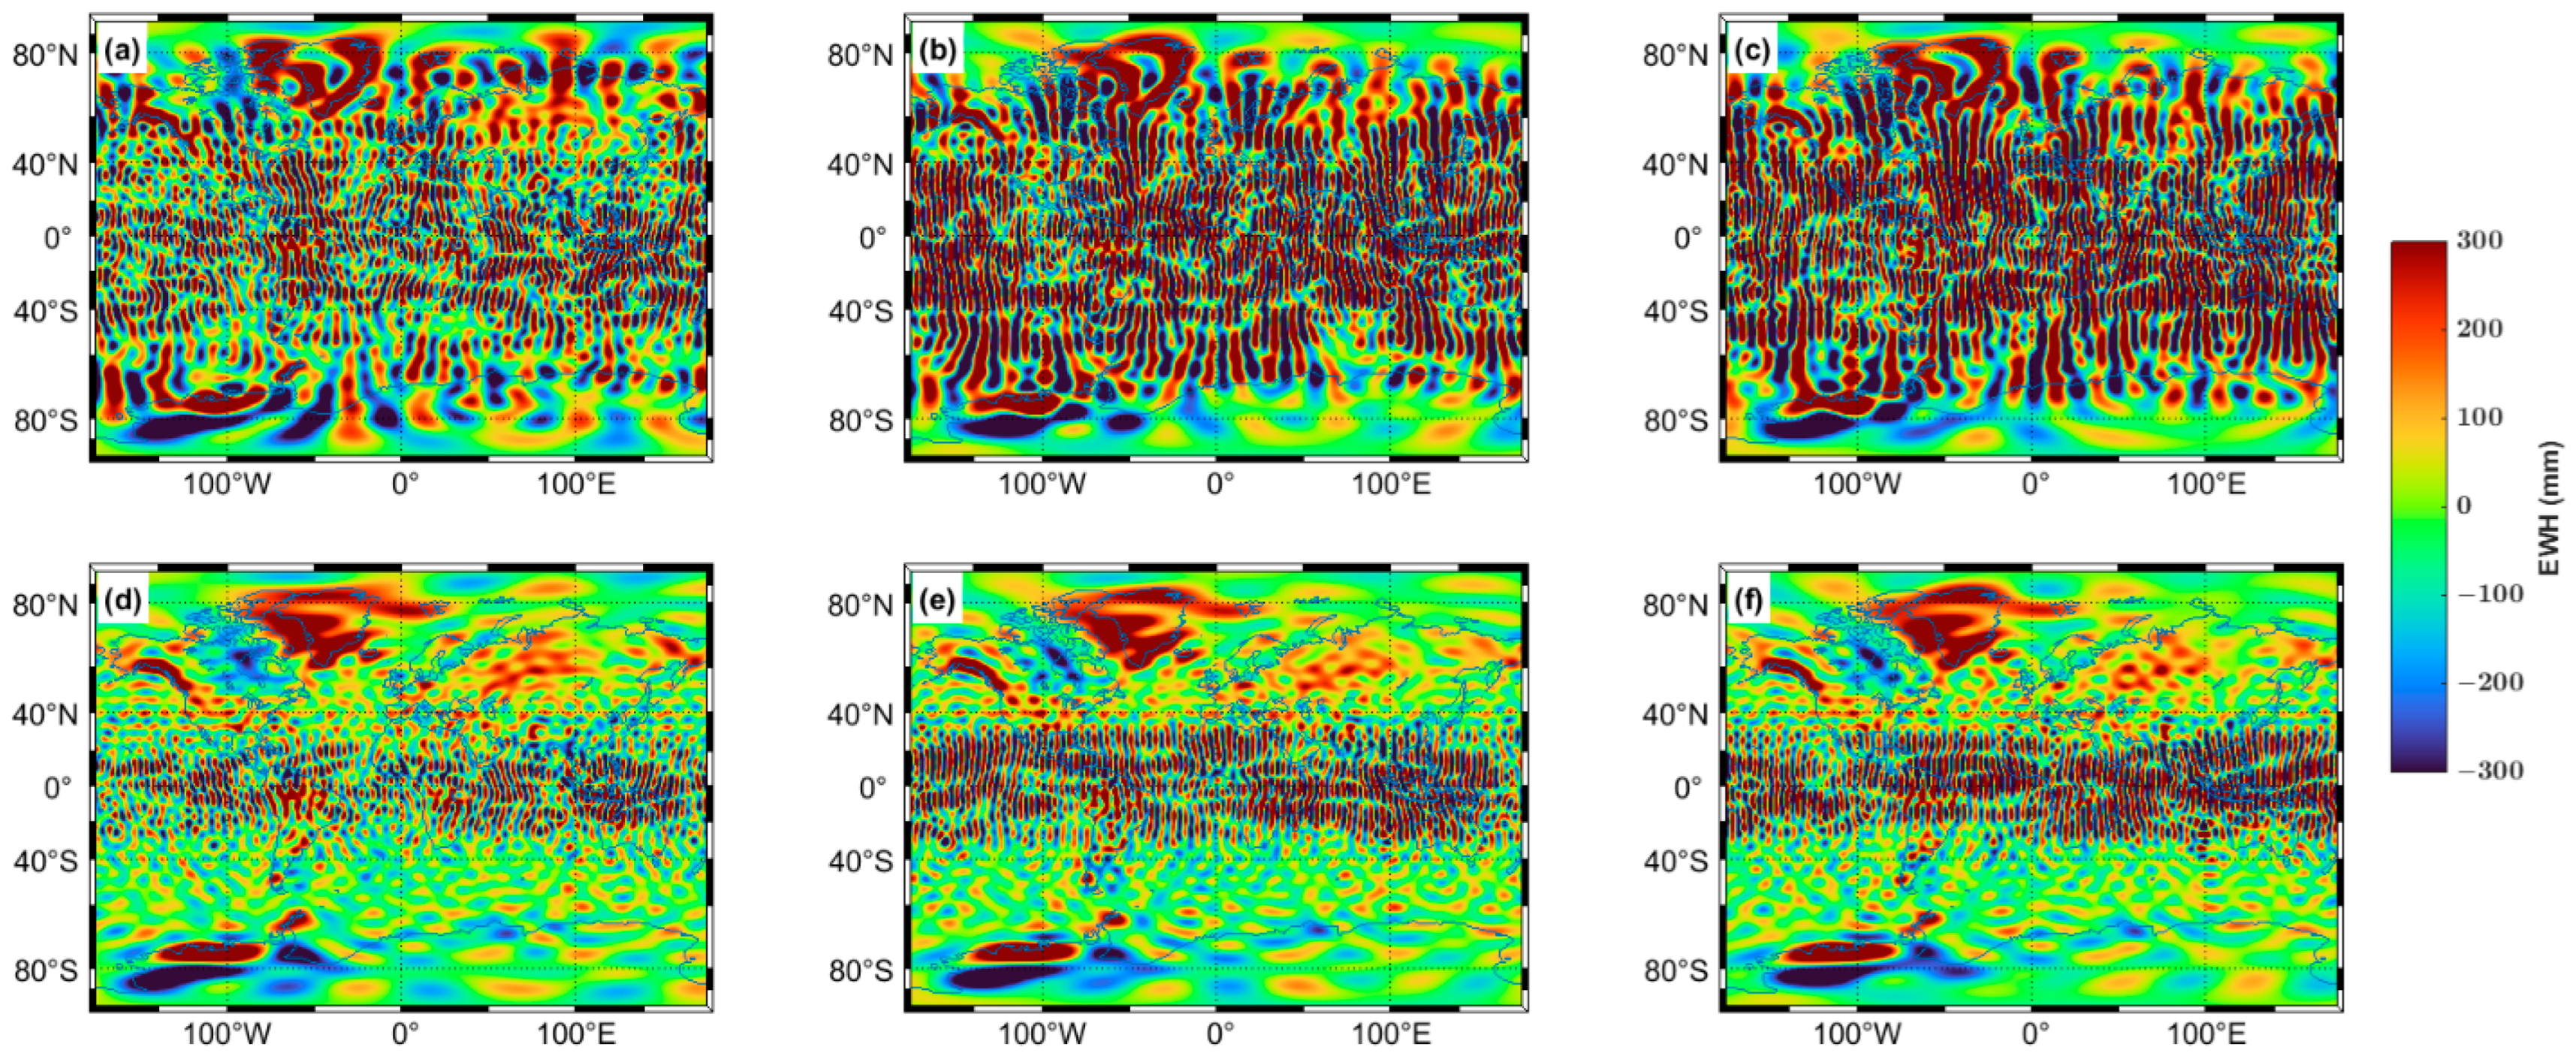
Figure 1. GRACE/GFO mass field in April 2002 without processing (top), and only with the P4M6 method (down). (a,d) from CSR. (b,e) from GFZ. (c,f) from JPL.
Remotesensing 15 02805 g001
Figure 2. Map of Nicaragua.
Remotesensing 15 02805 g002
Figure 3. The ENSO index time series.
Remotesensing 15 02805 g003
Figure 4. The Fourier spectrum of the GRACE/GFO mass field in April 2002 without processing (a) and only with the P4M6 method (b). The Fourier spectrum of the GLDAS mass field in April 2002 (c). (df) are the slices of a, b, and c (white solid line), respectively. The red dotted line represents the longitude frequency of ±0.22.
Remotesensing 15 02805 g004
Figure 5. Workflow of the ELP filter.
Remotesensing 15 02805 g005
Figure 6. Comparison of results using four strategies with or without 300 km Gaussian filter in April 2002 (ad,il) and October 2002 (eh,mp). NONE denotes the mass field without the ELP filter or the P4M6 method. Additionally, note that the second color bar has a shorter range.
Remotesensing 15 02805 g006
Figure 7. The signal variance per degree of the GRACE/GFO mass field in April 2002 (a,c) and October 2002 (b,d).
Remotesensing 15 02805 g007
Figure 8. TWS time series in Nicaragua via four strategies without the Gaussian filter. The gap year between GRACE and GFO mission is covered with a pink patch.
Remotesensing 15 02805 g008
Figure 9. Global gridded STD of three SDCs (ac) without process, (df) with the P4M6 method, (gi) with the ELP filter, and (jl) with the P4M6 method plus the ELP filter. (left) from CSR. (middle) from GFZ. (right) from JPL. Gaussian filtering is not used.
Remotesensing 15 02805 g009
Figure 10. Global gridded STD of three SDCs (ac) with 300 km Gaussian filter, (df) with the P4M6 method and 300 km Gaussian filter, (gi) with the ELP filter and 300 km Gaussian filter, and (jl) with the P4M6 method plus the ELP filter and 300 km Gaussian filter. (left) from CSR. (middle) from GFZ. (right) from JPL.
Remotesensing 15 02805 g010
Figure 11. The basin STD in Nicaragua (a,d), global STD (b,e), and SNR (c,f) of the GRACE/GFO mass field from three SDCs and mean mass field (average of three SDCs). (top) without any Gaussian filter. (down) with the 300 km Gaussian filter.
Remotesensing 15 02805 g011
Figure 12. (a) The mass changes (TWS and SWS), precipitation, and annual precipitation time series in Nicaragua. (b) The basin GWS estimation and in situ GWS observation. To accomplish the continuous time series analysis, the missing value in the monthly time series is interpolated via Singular Spectrum Analysis iterative interpolation.
Remotesensing 15 02805 g012
Figure 13. (a) A simulated true mass field in April 2002; (b) simulated noise-free observation with a truncated degree and order up to 60 (i.e., DO/60), (c) simulated observation via the ELP filter, (d) difference between b and c (i.e., (b,c)), and (e) Nicaragua TWS change time series, same as the method in sub-figures (ad). Notice that the range of the graph has been narrowed down in d to show small differences.
Remotesensing 15 02805 g013
Figure 14. The TWS time series in Nicaragua from simulation. (a) comparison between the truncated and smooth time series. (b) comparison between the recovered and the true time series.FM denotes the recovered result with the forward modeling technique. G300 denotes the smooth result with the 300 km Gaussian filter. DO/60 and DO/96 denote the observation with a truncated degree and order up to 60 and 96, respectively.
Remotesensing 15 02805 g014
Figure 15. The wavelet coherence (WTC) between ENSO and SHCs TWS (a), CSR-M TWS (b), SWS (c), SHCs GWS (d), CSR-M GWS (e), plus precipitation (f). The solid red lines denote the edge of the influence cone. The 5% significance level against red noise is exhibited as thick black lines. The relative phase relationship is denoted by black arrows with directions. The right/left direction corresponds to the in-phase/antiphase. The arrow pointing straight down means the time series (mass changes or precipitation) is leading ENSO by 90°.
Remotesensing 15 02805 g015
Figure 16. The Fourier spectrum of the basin GWS (CSR M and SHCs), precipitation, and normalized ENSO index.
Remotesensing 15 02805 g016
Table 1. Pearson correlation coefficients and RMS of the difference between two groundwater estimations. The correlations are computed at the 95% confidence level. * denotes p > 0.05.
GWSHand DugMW01
correlationRMS (mm)correlationRMS (mm)
SHCs0.596.680.4 *56.93
CSR-M0.4446.420.26 *52.32
Disclaimer/Publisher’s Note: The statements, opinions and data contained in all publications are solely those of the individual author(s) and contributor(s) and not of MDPI and/or the editor(s). MDPI and/or the editor(s) disclaim responsibility for any injury to people or property resulting from any ideas, methods, instructions or products referred to in the content.