Abstract
As a representative city located in the Loess Plateau region of China, Lanzhou is affected by various environmental and engineering factors, such as precipitation, earthquake subsidence, and building construction, which all lead to frequent geological disasters. Obtaining information on land subsidence over a long time series helps us grasp the patterns of change in various types of ground hazard. In this paper, we present the results of using Interferometric Synthetic Aperture Radar (InSAR) to monitor land subsidence in the main urban area of Lanzhou from 26 October 2014 to 12 December 2021. The main influential factors leading to subsidence were analyzed and combined via machine learning simulation to assess the land subsidence risk grade distribution of a building unit. The results show that the annual average deformation rate in Lanzhou ranged from −18.74 to 12.78 mm/yr. Linear subsidence dominated most subsidence areas in Lanzhou during the monitoring period. The subsidence areas were mainly distributed along the Yellow River, the railway, and villages and towns on the edges of urban areas. The main areas where subsidence occurred were the eastern part of Chengguan District, the railway line in Anning District, and the southern parts of Xigu District and Qilihe urban area, accounting for 38.8, 43.5, 32.5, and 51.8% of the area of their respective administrative districts, respectively. The random forest model analysis results show that the factors influencing surface subsidence in Lanzhou were, in order of importance, precipitation, the distribution of faults, the lithology of strata, high-rise buildings, and the distance to the river and railway. Lanzhou experienced excessive groundwater drainage in some areas from 2015 to 2017, with a 1 m drop in groundwater and 14.61 mm surface subsidence in the most critical areas. At the same time, extensive subsidence occurred in areas with highly compressible loess ground and most railway sections, reaching a maximum of −11.68 mm/yr. More than half of the super-tall building areas also showed settlement funnels. The area at a very high risk of future subsidence in Lanzhou covers 22.02 km2, while the high-subsidence-risk area covers 54.47 km2. The areas at greatest risk of future subsidence are Chengguan District and Qilihe District. The city contains a total of 51,163 buildings in the very high-risk area, including about 44.57% of brick-and-timber houses, 51.36% of old housing, and 52.78% of super-tall buildings, which are at especially high risk of subsidence, threatening the lives and properties of the population. The deformation results reveal poor building safety in Lanzhou, providing an essential basis for future urban development and construction.
1. Introduction
Land subsidence is a gently variable geohazard caused by the consolidation, shrinkage, and compacting of loose subsurface soil under the influence of natural or engineering activities [1]. Today, land subsidence has become a prevalent and non-negligible environmental and geological problem related to urbanization on a global level. China ranks second place in the world, following India, in terms of the spatial extent and population threat of subsidence [2]. Urban land subsidence hazards in China began in the 1920s, and their scope and extent have expanded with the acceleration of economic development and urbanization [3]. Among all urban land subsidence types, the Loess Plateau cities are unique in terms of their loose soil structure and topographic gullies. Due to the shortage of flat urban construction land in such cities, local governments often adopt earthworks, such as digging mountains and filling valleys, to expand urban land [4]. However, large-scale urban expansions may lead to land subsidence [5,6]. As the largest loess accumulation area in the world, Lanzhou, Gansu Province, China, has been experiencing severe ground collapse, building cracking, and tilting incidents due to land subsidence, with approximately 298 incidents occurring due to various types of land subsidence between 2013 and 2020 [7].
The traditional land subsidence monitoring method is based on point measurement, using tools such as bedrock markers [8], layerwise marks [9], levels [10], the Electronic Total Station [11], and the Global Positioning System [12] to measure deformation. These methods require selecting specific reference points for specific areas or even establishing observation stations to complete the monitoring of long time series. This approach is also related to high monitoring costs, sparse monitoring points, and a small range of single monitoring. The Time Series Interferometric Synthetic Aperture Radar (TS-InSAR) technique has the advantage of all-day, wide-coverage, and low-cost monitoring, with a high temporal resolution and a low engagement level of human resources. It can provide millimeter-level accuracy by processing multiple SAR images, and is widely used in many fields, such as urban subsidence monitoring [13,14,15,16,17], landslide monitoring [18,19,20,21], seismic deformation research [22,23,24,25], mine deformation monitoring [25,26,27,28], and the safety monitoring of water conservancy projects [29,30,31,32]. Among them, the Permanent Scatterer (PS) technique [33,34,35] proposed by Ferreti et al. and the Small Baseline Subset (SBAS) technique [36,37] proposed by Berardino et al. are the most mature and widely used approaches [38,39,40,41,42].
Previous studies have shown that most land subsidence events are caused by fluctuations in the water table [43,44,45,46,47], railway loading [48,49,50], geological faults [51,52,53], urban sprawl [54,55,56], and the lithology of the ground [57,58,59]. Chen et al. [60] used InSAR to monitor the spatial and temporal evolution of surface subsidence in Lanzhou New District from 2003 to 2016. They found that significant subsidence of 0–55 mm/yr occurred during 2015 to 2016, and the changes were mainly governed by spatial heterogeneity in land creation and urban expansion. Li et al. [61] used SBAS-InSAR to monitor surface subsidence in Lanzhou from 2014 to 2016, concluding that land deformation in Lanzhou showed a nonlinear downward trend, with deformation gradually expanding in the east–west direction. The main identified drivers of subsidence in Lanzhou were loess, rail traffic, and urbanization. Moreover, only a few studies have been carried out on the analysis of subsidence hazards using buildings as units, and the factors that influence subsidence in Lanzhou were less comprehensively discussed in these. Herein, we systematically discuss the influencing factors of land subsidence in Lanzhou for the first time, including information on the structural units of buildings and land subsidence dynamic monitoring to accurately estimate the risk of ground settlement for each building, making hazard classification more precise.
We monitor and analyze the urban subsidence changes in Lanzhou from October 2014 to December 2021 over a long time series. The main objectives of this study are to: (1) determine the current status of land subsidence in Lanzhou; (2) analyze the main influencing factors of land subsidence in Lanzhou; (3) combine machine learning and structural building units to classify land subsidence hazard areas and classes, and give accurate information about future subsidence areas; and (4) estimate future hazard trend changes in the city under building units.
2. Study Area
Lanzhou is located in the central part of Gansu Province, China, also representing a geometric center of the land area of mainland China, and is geographically located between 35°34′~37°07′N and 102°35′~104°34′E (Figure 1). Regarding its geological background, Lanzhou is located in the transition area from the Tibetan Plateau to the Loess Plateau, in the Qinling-Kunlun Mountains geological tectonic belt and the Lanzhou-Tianshui seismic belt, one of the major seismic belts in China; therefore, it undergoes active neotectonic movements, extensive crustal uplift, and strong gravity erosion. Seven major measured faults are located in the study area [62], mostly in villages within the main urban area, with four significant active faults in the urban area: the Jinchengguan Fault, the Siergou Fault, the Xizincun Fault, and the Retan River Fault. Lanzhou’s most widely distributed strata are the Quaternary loess, Lower Cretaceous, and Neogene red stratum. The lithology mainly comprises loess, sandstone, claystone, conglomerate, and fine sandstone. The most widely distributed Quaternary loose wet sediment sink loess exhibits a loose structure and pore development characteristics. The soil structure is rapidly destroyed upon wetting under certain pressure; this produces large additional subsidence and a rapid strength reduction, forms cavities, and causes surface collapse, landslides, mudslides, and other geological disasters. In terms of urban construction, Lanzhou has four major urban areas—Chengguan District, Qilihe District, Anning District, and Xigu District—and a total of 12 railway lines in the city, including one open and one completed metro line. Lanzhou is expanding relatively quickly, and the expansion mode is developing from horizontal to vertical. After 2015, the four main urban areas of Lanzhou rapidly developed, gradually forming a spatial pattern that is dominated by the four districts at the center of expansion and supplemented by urban land [63]. During this period, the rate of horizontal expansion in Lanzhou slowed down, and the rate of vertical expansion sharply increased. Vertical expansion first occurred in the core area where horizontal expansion was complete; then, it tended to occur simultaneously with horizontal expansion, and continued after horizontal expansion [64]. Regarding groundwater extraction, the primary water sources for urban residents in Lanzhou are water from the Yellow River and groundwater from the banks of the Yellow River. This groundwater, especially in the riverine part of the Lanzhou Fracture Basin, is a rich water source, and usually, there are no issues related to the over-extraction of groundwater. However, the water used by rural residents in the southern mountainous areas of Lanzhou mainly originates from bedrock fracture water in these areas, and the groundwater is mainly formed via infiltration and recharging from atmospheric precipitation, so the amount of water is relatively small. Zhang [65] provided a partial list of ground hazard events in the central city of Lanzhou, as shown in Table 1. The main hazards comprise ground collapse, road collapse, and subsidence of residential buildings, resulting in pedestrian falls and even death, transport damage, and gas pipeline rupture.
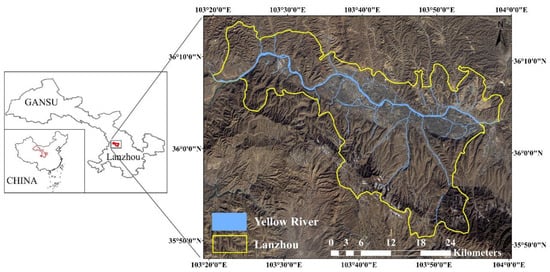
Figure 1.
Location of the study area.

Table 1.
Ground hazard event statistics for selected central urban areas of Lanzhou, 2015–2020. QLH, CG, AN, and XG denote Qilihe District, Chengguan District, Anning District, and Xigu District, respectively.
3. Materials and Methods
The four main urban areas of Lanzhou, Gansu Province, China, were used as the study area. The vegetation cover in these areas is low, and C-band data could be effectively used to meet our research needs. We selected 150 scenes covering the study area from 26 October 2014 to 12 December 2021, Sentinel-1A Descending Single-Look Complex (SLC) as the dataset (25 December 2022, https://search.asf.alaska.edu); the imaging mode was Interferometric Wide Swath (IW), and the polarization was VV polarization. In addition, topographic phase removal, using 30m resolution SRTM DEM data published by NASA, was used in the experiment; the used SAR image parameters are listed in Table 2. The precision orbit data were removed using POD precision orbiting ephemeris data published by the European Space Agency (ESA). Digitized 1:500,000 Chinese geological maps, Chinese road and river network vector data (10 March 2023, https://kmap.ckcest.cn/), and (10 March 2023, http://data.cma.cn/) annual precipitation raster data for Gansu Province provided by the National Meteorological Science Data Centre were collected during classification of the spatial risk level of ground subsidence in Lanzhou. Relevant data on the groundwater level in Lanzhou were obtained via digitization from the article “Impact from subway project on groundwater environment in Lanzhou fault basin” [66]. This study used the trial version of ENVI 5.6 SARscape for time series deformation analysis.
Table 2.
Parameters of the used SAR data.
3.1. SBAS-InSAR Technology
In this study, data were processed using SBAS-InSAR, a method proposed by Berardino et al. to fill in the gaps of the PS-InSAR method. While the PS-InSAR method is suitable for non-urban or densely vegetated areas, the SBAS-InSAR method is more suitable for complex terrain. The SBAS-InSAR method is applied for distributed target analysis and is based on the principle of the phase analysis of coherent targets to obtain temporal distortion. The principle of processing flow can be described as follows:
N+1 SLC images were sorted in temporal order (t0, t1, …, tN), the SAR images were aligned and divided into sets according to the spatio-temporal baseline, and differential interference is performed on the images between the sets to obtain M interferometric relative, with M [36] satisfying:
In this study, we obtained 596 differential interferometric pairs (Figure 2). The yellow dot is the super primary image, the green dot is the secondary image, and the red dot is the image outside the constraints. However, since the absence of some time periods in the pre-2016 images previously resulted in low relative coherence, we removed these low-coherence and poorly spread interferometric pairs, yielding final time series results with a significantly larger time series interval before 2016 than after 2016.
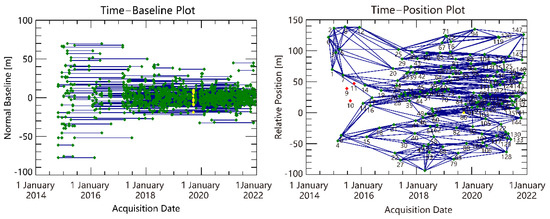
Figure 2.
Spatiotemporal baseline combination of the SBAS-InSAR method.
The phase composition equation for the image element x is:
where is the deformation phase, is the terrain phase, is the flat earth phase, is the system thermal noise, is the atmospheric delay phase, is the phase due to orbital error, h is the elevation error, is the vertical baseline length, R is the line-of-sight to slope distance, is the radar wavelength, and is the angle of incidence.
The POD data were used to reduce systematic errors due to orbital errors, and to subtract the terrain phase modeled by the DEM to produce a de-flattened differential interferogram, so that the differential interferometric phase of the image element is:
where is the differential interference phase, is the topographic residual phase, and is the DEM error.
The deformation phase consists of the linear deformation phase and the non-linear deformation phase :
where is the average deformation rate, and is the monitoring period.
The differential interference phase model can be rewritten as:
where is the residual differential phase, consisting of the system thermal noise, nonlinear deformation, and atmospheric delay phase:
The Goldstein filter was used for phase filtering, and Delaunay 3D and MCF were used for phase unwrapping [67]. can be calculated based on manually selected high-coherence control points for the orbit and phase offset to remove orbit residuals and phase ramps; v was solved using the least squares parity method.
was solved using the singular value decomposition method, and then, the single-point deformation phase equation was determined, the elevation error solved, and the deformation rate obtained [68]. Finally, the atmospheric phase and nonlinear deformation were retrieved via the residual phase, the deformation time series in the monitoring period was solved, and the vertical surface deformation information of Lanzhou was obtained.
3.2. PS-InSAR Technology
PS-InSAR uses statistical methods to select the permanent scatterer (PS) computational points capable of maintaining high coherence and strong scattering over long periods, and to model the time series of the image element phases of all PS points to obtain deformation displacement values and deformation rates. In contrast to the continuous surface results of SBAS-InSAR, this method gives non-continuous points.
Using the acquisition of N+1 SAR images of the same area at the monitoring time, a primary image was selected based on maximizing the relative correlation of interferences; the primary image was aligned with the secondary image, and N interferometric pairs were generated. In this study, image 20190226 was selected as the primary image, and 149 interferometric pairs were generated, as shown in Figure 3, and we removed the interferometric pairs with low coherence and poor spread.
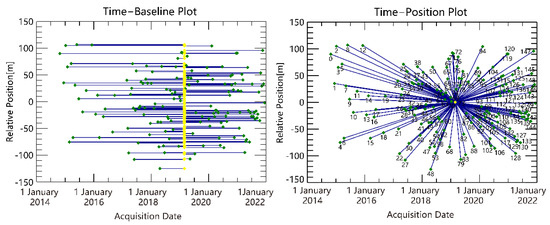
Figure 3.
Spatiotemporal baseline combination of the PS-InSAR method.
The interference phase of a particular SAR image pixel in PS-InSAR is:
where is the deformation phase, is the residual topographic phase, is the phase of the reference ellipsoid, is the atmospheric delay phase, and is the noise phase.
The terrain phase was simulated using SRTM DEM to remove the flat earth phase and generate a differential interferogram to calculate the amplitude departure index.
where represents the DEM error, and can be subdivided into linear and non-linear deformation phases:
where is the linear deformation phase, is the non-linear phase, is the linear deformation rate, and is the time interval from the main image.
A threshold value of 0.75 was set based on the amplitude departure index to obtain 452619 PS candidate points. The phase obtained at the PS point according to the Delaunay triangulation network is expressed as:
where is the value of the unwinding phase. Assuming that t < , the joint calculation of multiple differential interferograms yields the incremental elevation error and linear deformation rate; the expression is as follows:
where values are in the range [0, 1] and represent an indicator for judging PS points, N − 1 is the number of interferograms, and is the phase of PS points on a given interferogram. The mean displacement rates of the PS candidates were estimated with DEM correction factors, the atmospheric phase was removed, and the final mean displacement rates and cumulative surface deformation variables were calculated and geocoded.
3.3. Random Forest Model
In this study, we used a random forest model for spatial hazard classification. The random forest model is a supervised integrated machine learning model developed based on the weak assessor CART decision tree. This decision tree is based on the core idea of constructing multiple mutually independent assessors, and then, averaging or applying the majority voting principles of their predictions to determine the outcome of the integrated assessors [69,70].
Evaluation factors must be screened and quantified to construct a quantitative land subsidence hazard evaluation map. We analyzed the land subsidence influential factors according to the land subsidence monitoring result in Lanzhou and selected eight indicators as evaluation factors: average settlement rate, cumulative settlement, lithology, building height, distance from railway, distance from rivers, distance from faults, and average annual precipitation, in combination with expert opinions [71,72]. The natural break method was used to divide the original continuous evaluation factors into subclasses [73] and construct input variables for the land subsidence hazard evaluation model; afterward, the FR algorithm was used to analyze and calculate the influence of each subclass of condition factors on land subsidence [74,75]. As a bivariate statistical method, the method reflects the correlation between land subsidence and each predicted layer, as shown in Equation (17) [76]. Table 3 lists the values calculated in this study.
where %Subsidence (+) refers to the ratio of the settlement area in each sub-category of evaluation factors, and %domain (+) refers to the ratio of each sub-category of evaluation factors to the total area.
Table 3.
Evaluation of the spatial relationship between thematic factors and land subsidence using FR methods. Where in the in the Class column of the Geology, 1 for Loess, 2 for Sandstone, conglomerate, sandstone and conglomerate, muddy siltstone and mudstone, clay, 3 for Clayey sandy soil, sandy clay interbedded with sand, sand and gravel layer lenses, 4 for Metamorphic rock, 5 for Granite, 6 for Red mudstone with sandstone, 7 for Red massive sparse sandstone, grey–white fine conglomerate, sandy conglomerate, 8 for Alluvial gravel layer and flooded micro-colluvial gravel layer interspersed with chalky clay, 9 for Conglomerate, sandstone interbedded with mudstone, shale, 10 for Sandstone, shale, carbonaceous shale interbedded with coal seam, conglomerate, sandstone interbedded with mudstone, 11 for Diorite.
4. Results and Discussion
4.1. Land Subsidence Monitoring
4.1.1. The Spatial Distribution of Land Subsidence Monitoring
Figure 4 shows the annual average vertical deformation velocity obtained using SBAS-InSAR for the main urban area of Lanzhou from October 2014 to December 2021. Positive values (blue) indicate that the target moves along the ground in the vertical bulge direction. Conversely, negative values (red) indicate that the target moves vertically downward along the ground, representing land subsidence. During the study period, extensive land subsidence occurred in the main urban area of Lanzhou, with an average annual deformation rate ranging from −18.74 to 12.78 mm/yr. According to the technical standard of the China Geological Survey (DD2014-11) (DD2014-11, 2014), it belongs to a lower degree of land subsidence, and therefore, the surface subsidence in the main urban area of Lanzhou is relatively stable overall.
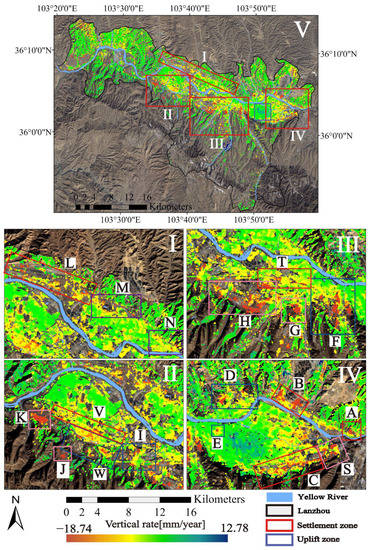
Figure 4.
Maps of the average displacement velocity in the study area. (V) A vertical displacement velocity map of Lanzhou from October 2014 to December 2021, with blue boxes representing the uplifted areas and red boxes representing the subsidence areas according to administrative divisions. (I–IV) Enlarged detailed views of the red boxes in figure (V). Boxes of different colors marked by letters represent division of the settlement area due to the different causes of primary control, as analyzed in Section 4.1.3.
The land subsidence pattern in Lanzhou is uneven; there is a northwest–southeast directional subsidence zone, with no large subsidence funnels but several small spread-out subsidence funnels. Subsidence mostly occurs along the Yellow River, railway lines, and villages and towns at the edge of urban areas. The deformation situation can be summarized as one uplifted area and four subsidence areas, namely, subsidence area Ⅰ along the railway in Anning District, subsidence area Ⅱ in the south of Xigu District, subsidence area Ⅲ in the urban area of Qilihe District, subsidence area Ⅳ in the eastern part of Chengguan District, and the uplifted area in the western part of Chengguan District. The area share of deformation by the administrative district is shown in Table 4. Among the above four subsidence areas, the area share of the subsidence areas is ranked as follows: Ⅲ Qilihe District > Ⅰ Anning District > Ⅳ Chengguan District > Ⅱ Xigu District. The largest and most severe subsidence area occurs in III Qilihe District. The most severe subsidence mainly occurs at the edges of the four urban areas, mainly in the following locations: Baidaooping Village (Figure 4 (B)), Shangping Village (Figure 4 (B)), Guchengping Village (Figure 4 (S)), Taoshuping Village (Figure 4 (S)), Shajinping Village (Figure 4 (A)), Caochang Street (Figure 4 (D)), Central Plaza (Figure 4 (E)) in Area IV, Pengjiaping Village (Figure 4 (H)), Jiangjiaping Village (Figure 4 (H)), Renjiazhuang (Figure 4 (H)), Wangjiabao Xinzhuang (Figure 4 (H)), Yanjiaping Village (Figure 4 (G)), Hualin Road (Figure 4 (F)), Fulongping Village (Figure 4 (F)), Liuquan Town (Figure 4 (K)), Xinghutai Village (Figure 4 (J)), southern Xigu (Figure 4 (W)), along the Zhongchuan Intercity Line and Lanxin Line Railway (Figure 4 (V)), Fanping Village (Figure 4 (I)), Lanzhou North Railway Station (Figure 4 (L)), the north of Anning (Figure 4 (M)), and the east of Anning (Figure 4 (N)) in Zone I.
Table 4.
The average deformation rate statistics in the administrative districts of Lanzhou.
4.1.2. Land Subsidence Time Series Results
Figure 5 shows the time series of cumulative surface subsidence in Lanzhou from 26 October 2014 to 12 December 2021. The subsidence in Lanzhou is developed via vertical expansion accompanied by horizontal expansion, manifesting as a near-linear increase in the subsidence amplitude in the main subsidence areas over time and gradual expansion of the scale of subsidence in all directions, with a maximum cumulative subsidence of −140.8 mm. More significant subsidence occurred in the urban part on 24th of May 2016, mainly in Baidaoping (Box B in Figure 3), Liuquan Town (Box K in Figure 3), and along the railway, and its range has been increasing since then. By 14th of May 2018, the lateral expansion of subsidence almost ceased, but the related deformation continued in the subsidence areas. At the same time, an uplift occurred on the western side of Ⅳ Chengguan District and the northern part of the Ⅱ Xigu urban area. We selected cross-sectional points located in the four administrative regions of severe deformation in Figure 6 to study their time series deformation sequences. Figure 7a–d show the time series deformation plots for these cross-sectional points, and Figure 7e–h show the point line plots of the time series change for some subsidence points. Overall, the time series results for the non-subsidence areas of Lanzhou show smooth seasonal fluctuations, while most time series deformation characteristics of subsidence areas show uniform subsidence. However, there are still several subsidence sites with slightly different time series subsidence patterns. For example, during the monitoring period, the subsidence rate at points in Ⅰ Anning District slowed down after May 2017, while the subsidence rate at some points in Ⅳ Chengguan District increased after March 2017, which might be related to the subsidence mechanism of each point.
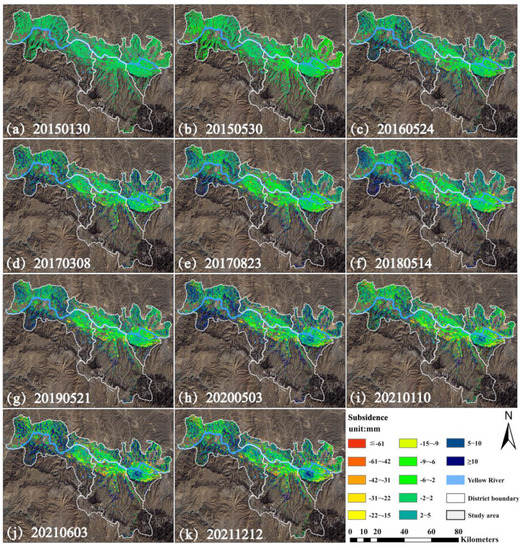
Figure 5.
Time series of cumulative subsidence in the vertical direction. In total, 11 representative images were selected out of 145 view images for temporal comparison.
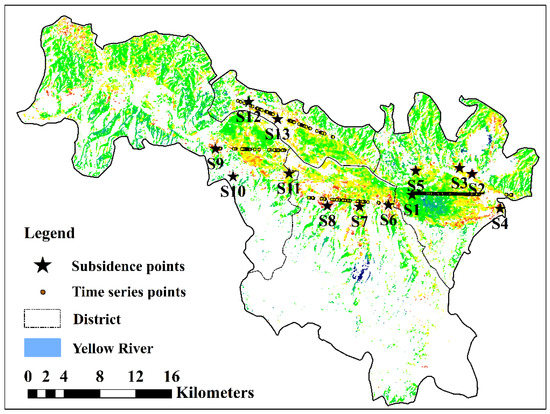
Figure 6.
Locations of the cross-sectional time series point plots analyzed in Figure 7.
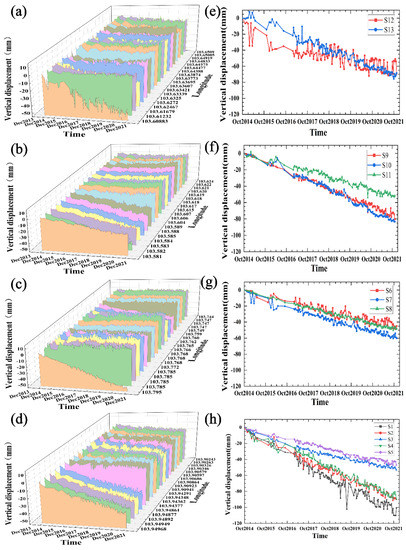
Figure 7.
(a–d) Time series plots of subsidence along the west–east cross-section in the four main urban areas, and (e–h) time series point line plots of certain subsidence points in the four main urban areas. (a–e) Ⅰ Anning District, (b–f) Ⅱ Xigu District, (c–g) Ⅲ Qilihe District, and (d–h) Ⅳ Chengguan District.
4.1.3. Discussion of the Causes of Land Subsidence in Different Regions
Details of the area of significant subsidence in Lanzhou are shown in Figure 4. Factors contributing to subsidence include groundwater extraction, river erosion, lithology, fault distribution, underground pressure, and pressure from high-rise buildings. The significant subsidence in areas S, H, J, K, and G is mainly due to the lithology of loose Quaternary deposits—loess. Due to the large void structure of the loess, the loess undergoes collapse deformation upon exposure to wet loads because the volume of hydraulic consolidation is reduced. This process leads to excessive deformation and instability of the foundation [77,78]. Fortunately, the area is situated at a low building height, mostly between 1 and 18 m. Thus, to prevent excessive loading of the building on the loess, buildings taller than 20 m are unsuitable for the site, as this could aggravate the ground settlement and cause disasters such as foundation collapse. Areas A, B, C, E, T, V, L, and S have railways and subways passing through them, all of which have undergone major or minor deformation. Railways are prone to roadbed deformation due to differences between the power of the track superstructure and the intensive dynamic loads of railway transport or adverse effects, such as climatic and engineering geological factors [79]. The deformation in this area can be caused by the railway construction, especially by the large subsidy of Lanzhou West Railway Station and Lanzhou North Railway Station. Station settlement is more likely to occur due to the dense population and the number of tracks and trains arriving and departing daily. Lanzhou West Station is much larger than Lanzhou North Station, and the subsidence in this area is also more significant, with a maximum deformation of −6.18 mm/yr; so, extra attention has to be paid to monitoring the condition of roadbed deformation in this section and predicting its development in time. In addition, the western part of Chengguan District, where A, B, C, and S are located, has become the second largest area of subsidence in Lanzhou due to the influence of railways, faults, rivers, and buildings, with a maximum settlement rate of −11.68 mm/yr. This area needs special attention from the railway department regarding repair and maintenance, and is not suitable for building buildings that are too tall. D, E, F, W, and I are all located in areas with great building height and density, and all of these areas have experienced significant subsidence or formed subsidence funnels. Commonly, surface construction loads cause compressive land subsidence [54]. The construction of dense building clusters and underground cross-river tunnels, and the fact that the soil layer is mostly soft, can cause an engineering disturbance phenomenon in the soil, and the stress balance of the foundation soil layer can be easily disrupted, leading to vertical deformation. These areas are mostly located in commercial zones or upcoming residential developments in the central city, with a tendency to build high-rise buildings. Therefore, the government should control the construction of floors in these areas; otherwise, they are prone to collapse due to unstable foundations. Areas M, N, and F are located on one side of the fault. Subsidence in this area is characterized by subsidence on one side of the fault and an uplift on the other side, especially in the eastern part of area F where most of the urban area is uplifted; it is assumed that the subsidence in this area is mainly caused by geological and tectonic movement.
4.2. Accuracy Evaluation of Land Subsidence Monitoring
This study also verifies the experimental accuracy of Land Subsidence Monitoring by comparing the vertical directional variable results obtained using the SBAS-InSAR and PS-InSAR processing methods, indicating that the deformation point results obtained using these two methods are consistent in most areas. To better compare the results of the two methods, we used all the points of the same name obtained for the sedimentation rate, and generated a histogram, Figure 8. At the same time, considering the coarse differences in the reference data, and based on the trend of the subsidence field reflected in the InSAR monitoring results, we removed some points with significant differences, and selected 7729 subsidence rate points that were evenly distributed throughout the study area for ‘point-by-point’ comparison of the observations; finally, we constructed a correlation which is shown in Figure 9.
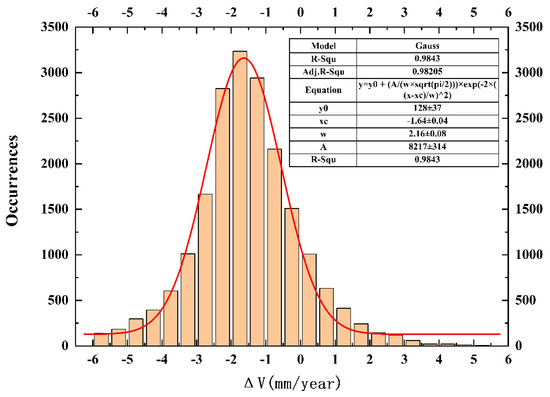
Figure 8.
A histogram of the rate difference between PS-InSAR and SBAS-InSAR methods.
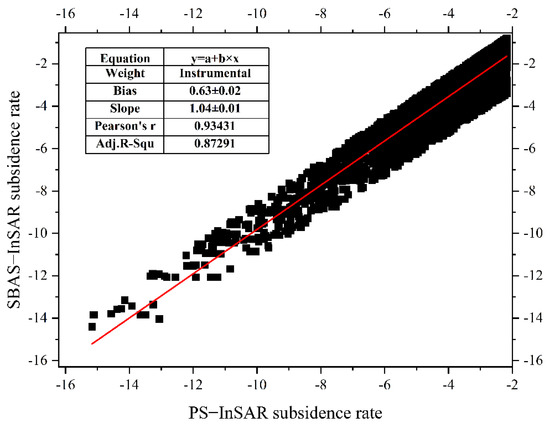
Figure 9.
Comparison of the vertical velocity correlation estimated using PS-InSAR and SBAS-InSAR methods.
A Gaussian fit was used in the histogram in Figure 8. We found that the mutual differences between the two datasets conform to a normal distribution with a mean value of −1.64 mm/yr. However, PS-InSAR generally gives slightly lower values, probably due to the different spatial resolutions of the two. The R-Squ values represent the goodness of fit, and the Adj. R-Squ values represent the adjusted goodness of fit, measuring the degree of merit of the Gaussian regression. The closer the value to 1, the better the fit result. The final fitted equation of the normal function obtained is:
The parameters in Equation (18) are = 128 37, = −1.64 0.04, = 2.16 0.08, = 8217 .
Figure 9 shows the linear correlation regression analysis of the two datasets. The linear regression equation y = a + bx is obtained, where a = 0.63 ± 0.02 and b = 1.04 ± 0.01, with a correlation coefficient = 0.9343. The closer the correlation coefficient to 1, the higher the correlation between PS-InSAR and SBAS-InSAR, and the correlation between them in this study reached 93.43%. If the effect of “b” is not considered, the magnitude of “a” indicates the overall deviation between the two datasets. A significant linear correlation exists between the monitoring results obtained from PS-InSAR and SBAS-InSAR measurements.
Regarding statistical significance, the data obtained using the SBAS-InSAR and PS-InSAR processing methods are highly consistent, with a mean error of 1.51 mm/yr. The validation results prove the reliability of the sedimentation rate results obtained in this study.
4.3. The Response of Subsidence to Influential Factors
4.3.1. The Response of Subsidence to Groundwater Level Changes
Water level data from the three groundwater level monitoring points were taken to analyze the relationship between the groundwater level and land deformation. Overall, the time series of surface displacement at the three monitoring points shows a nearly linear distribution, proving that subsidence in the study area was mainly inelastic subsidence, which agrees with the findings of Mathu et al. [80]. The three monitoring points are all located in areas with insignificant subsidence rates and with the water table buried at depths of 9.72–10.01 m at Q62, 43.02–44.31 m at Q96, and 66.65–71.77 m at Q20. The relationship between the water table and land subsidence is plotted in Figure 10. The land subsidence at the three monitoring sites is more related to the decline in the groundwater level, showing that during the groundwater drawdown phase before September 2016 and September 2017, the land also experienced varying degrees of accelerated subsidence.
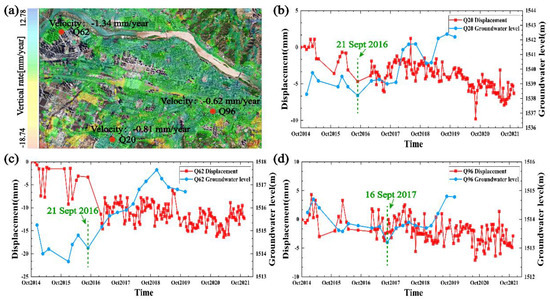
Figure 10.
Groundwater level monitoring point data versus surface deformation. (a) The superimposed locations and their subsidence rates for the three selected groundwater level monitoring points. (b–d) Fold plots of the surface deformation and groundwater level time series for monitoring points Q20, Q62, and Q96, respectively.
The land subsidence at Q62 is more significant and highly affected by the groundwater table. The groundwater level change curve at Q20 is almost synchronous with the time series curve of surface deformation at this point, while the overall surface deformation at Q96 is small, and its groundwater level is also less variable.
It is worth noting that the magnitude of land subsidence before the completion of the groundwater table decline phase (green straight lines in Figure 10b–d) is arranged in the order Q62 > Q20 > Q96. The difference in the magnitude of subsidence is perhaps related to the groundwater table burial depth and surface building loads. Generally, the shallower the water table depth, the more susceptible the land to water table deformation [81]. This is demonstrated by the fact that the ground settlement rate is also more significant when the water table drops rapidly at Q62, and it is much greater than at Q20 and Q96. However, the time series deformation diagrams for Q96 and Q20 do not conform to this pattern. It can be noted that the difference in the water table burial depth between points Q96 and Q20 is not significant compared to Q62. However, there is a massive difference in the height of the surface buildings at Q96 and Q20, i.e., the height of the surface buildings at Q20 is 60 m. In comparison, the surface buildings at Q96 are only 11 m high, so the settlement at Q20 is greater than at Q96 during groundwater level fall. In addition, the subsidence is severe in the southern part of Qilihe District, located in the Lanzhou fault basin. The Lanzhou Downfaulte basin is an essential water source for the urban area to supply tap water with groundwater due to the abundance of phreatic water containing loose rock types, and it is also a key area for groundwater extraction. However, the groundwater richness of this fault basin gradually decreases from north to south, so the subsidence in the southern part of the region may be due to the weaker groundwater richness and groundwater over-exploitation. The severe decline in groundwater levels during the pre-2018 phase was due to the large amount of groundwater extracted in Lanzhou because of the construction of Metro Line 1; consequently, the rate of surface subsidence in some areas was significantly greater before 2018 than after 2018. Therefore, the relevant authorities should strictly control the groundwater level in the future to prevent severe surface subsidence in Lanzhou, which could damage buildings and underground pipelines.
4.3.2. The Response of Subsidence to Geological Faults and Lithology
The distribution of geological formations and lithology in Lanzhou is shown in Figure 11. Several linear boundaries can be observed in the subsidence rate map of Lanzhou, implying a potential link between subsidence and geological faults. The Leitan River Fault and the Jinchengguan Fault in the study area move in opposite directions on either side of the fault. Figure 12 shows the subsidence rates for eight profiles near the Leitan River Fault and the Jinchengguan Fault. It is evident from Figure 12b,d that subsidence is relatively severe in the western part of the Jinchengguan Fault and the Leitan River Fault, with subsidence rates varying from about −8 to −2 mm/year. In the eastern part of the Jinchengguan Fault and the Leitan River Fault, ground uplift rates vary from 1 to 2 mm/year, suggesting an influence of fault traces on subsidence. Particularly in the eastern part of the Leitan River Fault, we can see a clear blue zone of abnormal uplift, which we can attribute to geological faults.
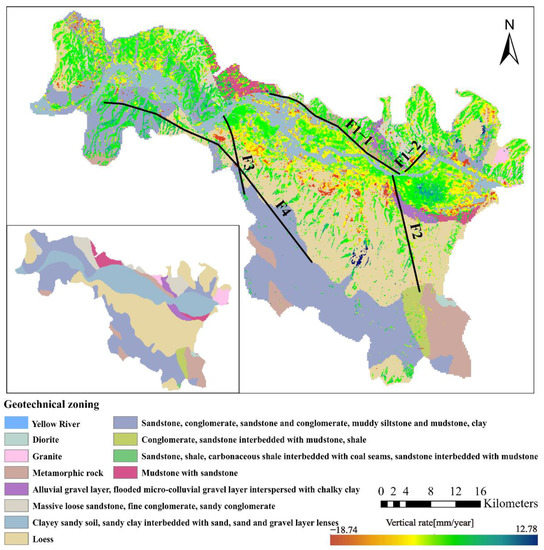
Figure 11.
An overlay of a vertical displacement velocity map of Lanzhou geotechnical zoning between 2014 and 2021. F1 to F4 on the map are faults, F1–1 and F1–2 represent the Jinchengguan Fault, F2 is the Leitan River Fault, F3 is the Siergou Fault, and F4 is the Xijincun Fault.
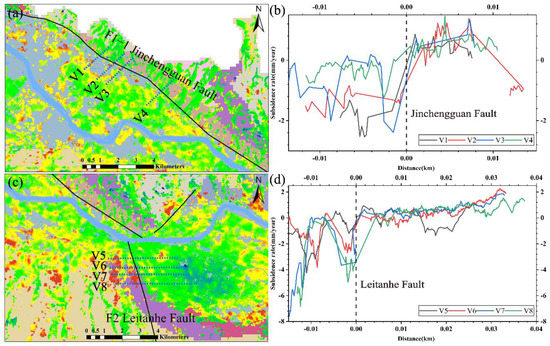
Figure 12.
Subsidence rate maps for eight profiles near the Leitan River Fault and the Jinchengguan Fault. (a,c) Subsidence rate maps and fault locations; (b,d) subsidence rate profiles from V1 to V8.
These findings lead us to several conclusions: (1) The subsidence of the Jinchengguan Fault and the Leitan River Fault has changed dramatically. (2) Spatial subsidence distribution is location-dependent and varies along the same fault. For example, the subsidence on the eastern and western sides of the northern part of the Leitan River Fault is similar. This may be due to the discontinuity in force conductivity associated with the fault structure and different vertical compactions of the non-homogeneous thickness of the compressible soils deposited on either side of the fault [82,83]; (3) The Jinchengguan Fault and the Leitan River Fault may currently be active. These faults should be considered in future urban planning, and technical solutions should be applied to avoid infrastructure damage due to subsidence discrepancies.
The statistical relationship between lithology and subsidence is shown in Table 5. Surface geological features, such as lithology, are essential factors influencing subsidence [84], and apparent lithological control of the spatial subsidence distribution in Lanzhou was detected. As shown in Figure 11, the significant small-scale subsidence funnels in Lanzhou are mainly located in the loess-covered area (Table 5, Number 1), with a maximum deformation rate of −18.74 mm/yr. There is also a small amount of significant subsidence in sandstone, conglomerate, sand, gravel, muddy siltstone, mudstone, and clay areas (Table 5, Number 2), with a maximum deformation rate of −15.28 mm/yr. Medium-amplitude large-area subsidence occurs mainly in areas with clayey sandy soil, sandy clay interbedded with sand, and gravel layer lenses (Table 5, Number 3), with a maximum deformation rate of −7.63 mm/yr. Wet sink loess is the most widespread deposit in Lanzhou, accounting for 82.92% of the total area, mainly occurring in the central part of Qilihe District, the northern and southern parts of Chengguan District, and the eastern and northwestern parts of Xigu District, where the land cover mainly originates from towns and agricultural areas. About 26.94% of the loess has subsided, mostly in the form of small funnels; moreover, all buildings areas of loess have subsided, mainly in Qilihe District and Xigu District. This happens because the soil structure is rapidly destroyed when wet sinking loess is wetted by water under pressure, producing additional subsidence and a rapid strength reduction, so the loess is less stable and has a weaker bearing capacity as a building foundation, becoming prone to subsidence [78]. The main urban area of Lanzhou is mainly composed of moderately compressible soils (Table 5, Number 3), distributed over 2.09% of the total area. This type of soil subsidence mainly comprises large areas of medium amplitude and occurs over an area of approximately 43.81%. In addition, areas with clay, sandstone, mudstone, or conglomerate geology experience moderate or significant subsidence, with rates ranging from −7.63 to −15.28 mm/yr in areas with urban and agricultural land cover.
Table 5.
Lithological observations for 11 types of strata: number (column 1), geology type (column 2), the degree of compressibility (column 3), maximal subsidence rate (column 4), relation with land use (column 5; agri: agricultural), the proportion of the lithological area of each stratum (column 6), and the proportion of the subsidence area in various types (column 7).
4.3.3. The Response of Subsidence to Rail Transit
A 1000 m buffer zone was established for the railway transit in Lanzhou, and the deformation information within the buffer zone was extracted, as shown in Figure 13. Linear boundaries along the railway line are visible on the Lanzhou subsidence map, particularly in Figure 13 (A,B,D,E), suggesting a possible link between subsidence and railway construction. The combination of static load originating from the weight of trains and dynamic load, due to the dynamic response during traveling, exerts continuous pressure on the railway [85]. Table 6 shows the level of railway subsidence in Lanzhou, ranking the severity of railway subsidence according to location, length, and the percentage of subsidence. The railway exhibits a severe subsidence effect in the case of the following scenarios: high subsidence value, passing through a densely populated area, or when subsidence accounts for a high proportion of the railway. During the monitoring period, all railways in Lanzhou experienced a certain degree of settlement at specific sections. The railways with more severe subsidence are the Baolan Railway (A), the Longhai Railway (B), the Lanyu Railway (B), and the Lanzhou North Ring Road (C), while the rest of the railways have fewer subsidence sections and less subsidence. The Longhai and Lanyu Railways in B show the most severe subsidence. It is subsided in the eastern part of Chengguan District, with maximum subsidence rates of −11.68 and −10.67 mm/yr. The Lanzhou North Ring Road (Figure 13 (C)), passing through Chengguan, Anning, and Xigu Districts, is also severely subsided. This route passes through the extremely severe subsidence of Baidao Ping, Shangping Village, and Lanzhou North Railway Station, with a maximum subsidence rate of −6.18 mm/yr; the remaining sections do not experience severe subsidence. Lanzhou Metro exhibits an uneven deformation pattern, with alternating subsidence and deformation. The subsidence amplitude is more significant than the uplift amplitude, with subsidence accounting for 49.71% of the deformation. The most severe area settles at a rate of −4.13 mm/yr. Figure 13 shows a positive correlation between the distance to the railway and subsidence. If the subsidence level exceeds the maximum allowed for the railway, the elastic deformation of trains at high speed combined with the deformation of the roadbed can be directly reflected in the track, potentially severely affecting the safety of railway operation [86]. Therefore, the railway construction department should consider and monitor quantitative subsidence, especially on the Longhai Railway, Lanyu Railway, and Baolan Railway in the eastern part of Chengguan District, and the Lanzhou North Ring Road in Anning District, to prevent track deformation from threatening the safety of high-speed trains.
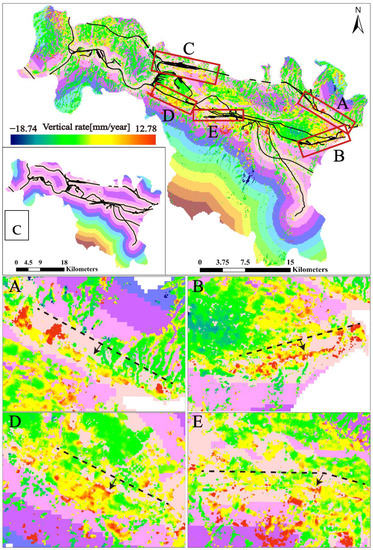
Figure 13.
A railway buffer zone map overlaid with a ground deformation map. The four bottom maps, A, B, D, E, enlarge the four areas in red boxes above, where the black dashed lines are the linear intervals of settlement along the railway line after the offset.
Table 6.
Railway subsidence in Lanzhou.
4.3.4. The Response of Subsidence to Building Loads
Information on building heights and structures [87] in Lanzhou is based on digitizing Gaofen satellite images and field measurements. A detailed table of building heights and structures in Lanzhou is shown in Table 7. Buildings in Lanzhou are predominantly low-rise and multi-rise, which account for 74.19% of all buildings; high buildings are dominantly mid-rise and high-rise, and account for 25.12%, while super high-rise buildings account for the lowest percentage of 0.69%. The high-rise buildings in Lanzhou are mainly located in Chengguan District, the eastern part of Qilihe Urban District, the southern part of Xigu District, and the eastern part of Anning District. The building structures in Lanzhou are shown in Figure 14; brick-and-mortar houses and frame houses account for 98.15% of the total number of buildings, and the corresponding building structure distribution includes 0.18% old houses, 33.33% frame houses, 64.82% brick-and-mortar houses, 1.66% brick-and-timber houses, and 0.00% civil engineering houses. The FR value is calculated using Equation (17) in Section 3.2. The FR reflects the correlation between the subsidence and each building structure, with a higher FR representing a higher probability of subsidence occurring under a particular building structure, i.e., old housing (FR = 1.43), frame houses (FR = 0.89), brick-and-mortar houses (FR = 1.07), brick-and-timber houses (FR = 0.52), and civil engineering houses (FR = 1.89). Thus, civil engineering houses and old houses are most susceptible to subsidence, although brick-and-mortar and frame houses also exhibit a certain level of subsidence susceptibility. This can be explained by the poor construction of old and civil engineering houses, which are prone to structural instability upon exposure to external forces. While brick-and-mortar houses have the highest density, frame houses correspond more to high-rise buildings. As shown in Figure 15, most large, high-rise, and super high-rise buildings have undergone subsidence, since the amplitude of the load imposed on the ground by the building is another factor contributing to the consolidation and high displacement rates [88]. Previous studies showed that taller buildings are more susceptible to subsidence, but a high factor of influence was also found in groups of buildings between 9 and 17 m in height, which is perhaps related to building density (this category has the highest building density). Underground space development and the excavation of building pits are severe in areas with high building density. The extraction of underground liquid support and the excavation of solid support may induce a stress disbalance in geotechnical soil, readily leading to surface deformation [89]. In summary, building structure, height, and density all influence the subsidence phenomenon. When a settlement exceeds the bearing limit of the building, wall cracking, house water seepage, house tilt collapse, and other disasters that threaten human lives and property safety may readily appear [90].
Table 7.
List of building heights and building structure percentages in Lanzhou.
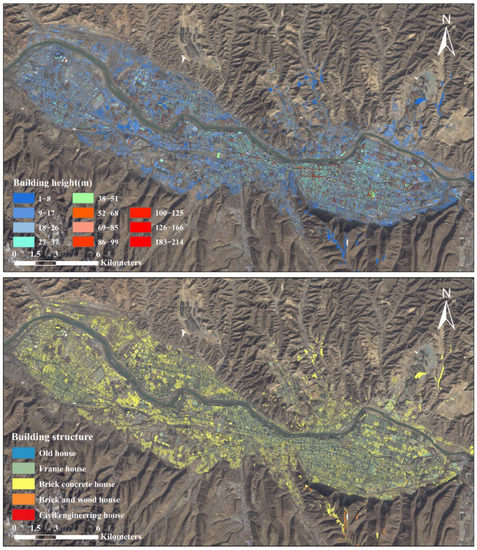
Figure 14.
Lanzhou building height and building structure information maps.
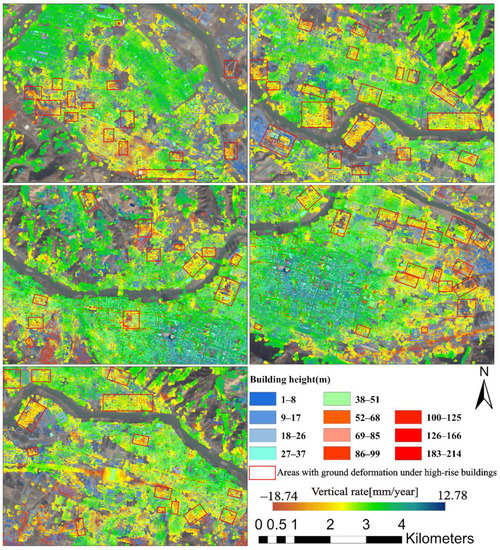
Figure 15.
A superimposed deformation map of the Lanzhou building height; red boxes are areas of severe subsidence, and the surface building height is greater than 100 m.
4.4. Future Land Subsidence Risk Assessment
The weights of factors calculated using the random forest model are 0.498 for the land subsidence rate, 0.213 for cumulative land subsidence, 0.054 for lithology, 0.062 for the distance to faults, 0.035 for the distance to rivers, 0.026 for the distance to railways, 0.036 for building height, and 0.076 for precipitation. The higher the weight, the more influence the factor has in terms of land subsidence. The ArcGIS spatial analysis method was used to superimpose the factors and obtain a comprehensive subsidence risk evaluation score. The evaluation score was divided into five categories of very low, low, medium, high, and very high sensitivity, according to the natural breakpoint method, to obtain the hazard zoning map shown in Figure 16. Here, we obtain static hazard zoning, assuming that the city will not expand in the future, the building density does not change, and groundwater abstraction does not increase. However, the building density and groundwater abstraction in Lanzhou are expected to increase with population, which could exacerbate the risk in the area. According to the risk map, the total areas of very high, high, medium, low, and very low risk are 22.02, 54.46, 97.54, 114.95, and 53.00 km2, respectively. The possible very high-risk areas for subsidence are distributed along the railway line in Ⅰ Anning District, Ⅱ Southern Xigu, Ⅲ Qilihe urban area, and Ⅳ Eastern Chengguan District, which is almost consistent with our subsidence monitoring results in Lanzhou from 2014 to 2021. This may be related to the greater weighting of the two influencing factors—the land subsidence rate and cumulative land subsidence. In addition, new settlements will be generated by lateral expansion based on the current settlement in the future.
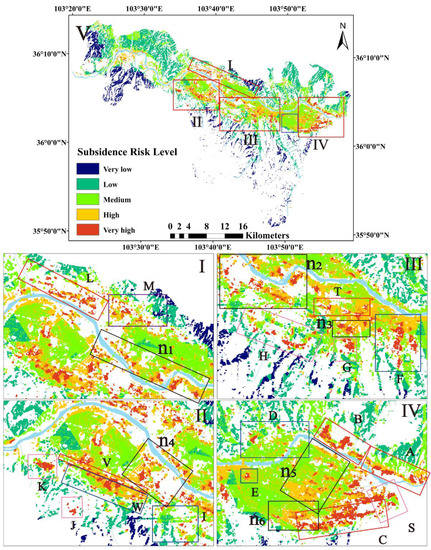
Figure 16.
Subsidence risk maps of the main urban area of Lanzhou. (I–IV) Detailed views of the enlarged red boxes in (V). Except for the new black boxes, the other boxes correspond to those in (I–IV) in Figure 3, indicating that subsidence is caused by different causes. The letters beside the boxes are the markings of the boxes. The five new black boxes n1–n5 are new risk areas for possible subsidence after comparing the results of subsidence monitoring in Lanzhou.
The statistic data for risk level in each administrative district are shown in Figure 17. The areas at very high risk of subsidence in each administrative district are ranked as follows: Ⅳ Chengguan District > Ⅱ Xigu District > Ⅲ Qilihe District > Ⅰ Anning District. The areas at very high risk and high risk for subsidence in Chengguan District are larger than in other districts, making Chengguan District the place at greatest risk of future subsidence. As the population of Chengguan District is as high as 1.484 million, almost 2–7 times that of the other districts, this finding is of great significance for the state’s subsidence management in this area. Specific very high subsidence risk locations are shown in Table 8. Our subsidence risk maps and risk tables for the investigated districts are an important resource for developing the most effective low-risk management strategies and future urban development plans [51]. Policymakers can use this when assessing subsidence hazard zones in urban development to identify very high-risk and high-risk hazard-prone areas within each district.
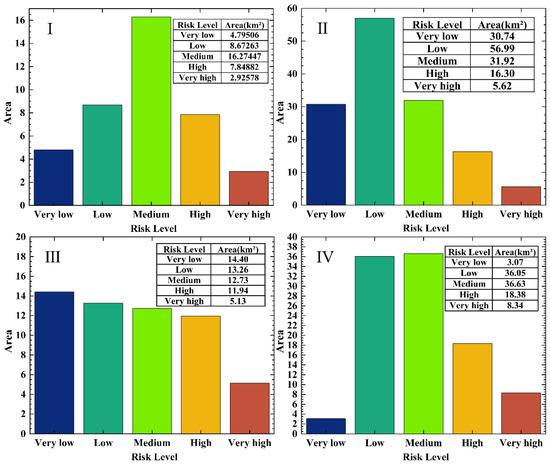
Figure 17.
Statistical maps of risk levels by administrative district: (Ⅰ) for Anning District, (Ⅱ) for Xigu District, (Ⅲ) for Qilihe District, and (Ⅳ) for Chengguan District.
Table 8.
The list of sites at very high risk of subsidence in Lanzhou.
We counted a total of 51,163 houses in the very high-risk area. According to the administrative division, 6383 houses in Anning District, 20,068 houses in Chengguan District, 15,553 houses in Qilihe District, and 9171 houses in Xigu District are at very high risk of subsidence, accounting for 12.48, 39.22, 30.40, and 17.93% of the number of houses at very high risk of subsidence, respectively. According to the classification of building structures, 1 civil house, 213 brick-and-timber houses, 43,180 brick-and-mortar houses, 7325 frame houses, and 435 old houses are located in very high-risk areas. About 44.47% of brick-and-timber houses and 51.36% of old houses are located in very high-risk areas. These two types of house are structurally unstable, and land subsidence can aggravate the impact on them, highlighting the need for them to be demolished and rebuilt or strengthened. According to the building height classification, 3242 high-rise buildings and 730 super high-rise buildings are in very high-risk areas. About 14.09% of high-rise buildings and 52.78% of super high-rise buildings are at very high risk of subsidence. Lanzhou is not suitable for further super-tall buildings, and the government needs to focus on assessing whether these super-tall buildings are cracking or leaning.
Upon comparing the Lanzhou subsidence risk map (Figure 16) with the Lanzhou subsidence monitoring map (Figure 4), we found differences between the two, and we added six new high- and very high-risk zones from n1 to n6. In addition, there are several risk assessment areas where errors exist. The predicted subsidence area in part H was significantly smaller than the actual monitoring results because no monitoring points were identified at this location, resulting in no subsidence rate or cumulative settlement factor values included in the calculation, ultimately resulting in lower predicted values; in reality, it this area should have an extremely high value. The western part of Chengguan District (n6) was assessed as a high-risk subsidence area, contrary to the current deformation monitoring results. In Section 4.3.2, we discussed that the uplift in the western part of Chengguan District near n6 might be due to the fault’s movement. We cannot predict the trend in the fault movement from these data, but it is worth noting that the area in the transition between the uplifted area in the western part of Chengguan District and the subsidence area in the east may lead to damage to and the collapse of buildings due to differential subsidence [91,92]. That is, the accumulation of uneven settlement over a distance is a current hazard in the Chengguan District of Lanzhou, which may endanger the structural integrity of buildings.
5. Conclusions
In this study, we used the SBAS-InSAR method to analyze and interpret a dataset of 150 Sentinel-1 SAR scenes in Lanzhou from 26 October 2014 to 12 December 2021 to describe the current patterns, rates, impact factors, and long-term predictions of land subsidence in Lanzhou. The main conclusions are as follows:
- (1)
- The average annual deformation rate in Lanzhou ranges from −18.74 to 12.78 mm/yr. The land subsidence pattern is uneven, and it occurs mainly in the form of small subsidence funnels. The land subsidence dynamics in Lanzhou involve horizontal expansion followed by vertical development. During the monitoring period, Lanzhou was dominated by linear subsidence. The overall deformation situation in Lanzhou can be summarized as one uplift area and four subsidence areas, namely, the subsidence area along the railway in Anning District, the southern Xigu subsidence area, the Qilihe urban subsidence area, the eastern Chengguan District subsidence area, and the western Chengguan District uplift area. Most of the significant subsidence occurs along the Yellow River and railway and in villages and towns at the edge of the urban area.
- (2)
- Factors contributing to subsidence in Lanzhou include groundwater extraction, river erosion, stratigraphic lithology, fault distribution, underground pressure, and pressure from high-rise buildings. The fall in the groundwater table inevitably leads to land subsidence, but the extent of the subsidence is mainly influenced by the water table burial depth and surface building loads. A correlation between land subsidence and geological faults in Lanzhou can be established. In the presence of active faults, the land movement pattern is characterized by an uplift on one side of the fault and subsidence on the other side; this phenomenon occurs both in the Leitanhe Fault and the Jinchengguan Fault. The spatial subsidence distribution in Lanzhou is under apparent lithological control; significant subsidence mainly occurs in areas covered by loess, and the remaining large subsidence areas are almost in more compressible soils. The land subsidence in Lanzhou is strongly linked to railway lines, with subsidence mostly distributed along the railway. Moreover, Lanzhou is prone to subsidence funnels near high-rise buildings, and a high building density also causes land subsidence.
- (3)
- The existing subsidence in Lanzhou will continue to occur, and may even trigger the cracking and collapse of buildings. The area at very high risk of future subsidence in Lanzhou is 22.02 km2, while the area at high risk of subsidence is 54.47 km2. A total of 51,163 houses are at very high risk of subsidence, and they are mainly located in Chengguan District and Qilihe District, accounting for 39.22% and 30.40% of the buildings at very high risk of subsidence, respectively. In total, 44.47% of brick-and-timber houses, 51.36% of old houses, and 52.78% of super-tall buildings are at very high risk of subsidence. In addition, new subsidence zones are expected to emerge due to the active use of railways, high-rise buildings, ground lithology, faults, rivers, precipitation, and other factors. This study maps the subsidence risk of each building and provides a list of areas with very high subsidence risk, which should be the focus of government efforts to prevent and control possible accidents in these buildings.
- (4)
- In future urban planning and disaster prevention, the findings of this systematic study—i.e., that the loess-covered areas of Lanzhou are not suitable for medium-rise, high-rise, and super high-rise buildings, while the central city of Lanzhou is not suitable for too many super high-rise buildings—should be considered. Since the ground is highly susceptible to subsidence where the water table is shallow, the changes in groundwater levels in the area should be controlled. At the same time, attention should be paid to buildings in the transition area between the western uplift area and the eastern subsidence area in Chengguan District to prevent their cracking and collapse due to differential settlement. In addition, the authorities should pay attention to the list of buildings at high risk of settlement and the areas at very high risk of settlement that were determined and drawn up in this paper, and focus on preventing possible accidents related to these buildings.
Author Contributions
All authors contributed to the manuscript and discussed the results. Y.X. drafted the manuscript and was responsible for the data processing, and the analysis and interpretation of the results. Z.W. proposed the ideas for the thesis, designed the structure and contributed to the final revision of the thesis. H.Z. revised the manuscript and contributed to the final revision of the thesis. J.L. provided the code for the random forest model and directed the risk assessment section. Z.J. collected the literature. All authors have read and agreed to the published version of the manuscript.
Funding
This study was supported by: the Project of Gansu Significant Natural Science Foundation (21ZD4FA011); the Project of Gansu Natural Science Foundation (No. 22JR5RA824); the Special Fund for Innovation Team, Gansu Earthquake Agency (2019TD-01-02); the Science for Earthquake Resilience of the China Earthquake Administration (No. XH20059); the Basic Scientific Research Foundation of the China Earthquake Administration (2020IESLZ04); and the National Natural Science Foundation of China (No. 41761006).
Data Availability Statement
No new data were created or analyzed in this study. Data sharing is not applicable to this article.
Acknowledgments
We acknowledge the European Space Agency (ESA) for providing the Sentinel-1 A data and the Chinese Academy of Engineering for providing the vector data related to Lanzhou. We acknowledge Aiheng Du of the China University of Geosciences, and Guangqi Jiao, and Wenhao Wu of the Institute of Exploration and Development for their guidance and assistance with this paper. We would like to express our gratitude to the editors and reviewers for their helpful comments on earlier versions of this paper.
Conflicts of Interest
The authors declare no conflict of interest.
Abbreviations
| CART | Classification and Regression Tree |
| DEM | Digital Elevation Model |
| ESA | European Space Agency |
| FR | Frequency Ratio |
| InSAR | Interferometric Synthetic Aperture Radar |
| IW | Interferometric Wide Swath |
| NASA | National Aeronautics and Space Administration |
| POD | Precise Orbit Determination |
| PS-InSAR | Persistent Scatterer Interferometric Synthetic Aperture Radar |
| SBAS-InSAR | Small Baselines Subset Interferometric Synthetic Aperture Radar |
| SLC | Single-Look Complex |
| SRTM | Shuttle Radar Topography Mission |
| TS-InSAR | Time Series Interferometric Synthetic Aperture Radar |
References
- Sun, Z.Z.; Zhang, Q.X. Geohazard Observation—Prevention—Rescue; Geology Press: Beijing, China, 2011; pp. 1–423. ISBN 9787116071773. [Google Scholar]
- Herrera-García, G.; Ezquerro, P.; Tomás, R.; Béjar-Pizarro, M.; López-Vinielles, J.; Rossi, M.; Mateos, R.M.; Carreón-Freyre, D.; Lambert, J.; Teatini, P. Mapping the global threat of land subsidence. Science 2021, 371, 34–36. [Google Scholar] [CrossRef] [PubMed]
- Zhang, A.G.; Yin, Y.P. Translation of Selected Papers. In Proceedings of the 7th International Symposium on Land Subsidence, Shanghai, China, 23–28 October 2005; pp. 1–329. [Google Scholar]
- Wang, F. Experimental Study on Deformation Characteristics of Structural Loess under High Stress in Yan’an Area. Master’s Thesis, Xi’an University of Science and Technology, Xi’an, China, 2018. [Google Scholar]
- Li, P.; Qian, H.; Wu, J. Environment: Accelerate research on land creation. Nature 2014, 510, 29–31. [Google Scholar] [CrossRef] [PubMed]
- Liu, Y.S.; Li, Y.H. China’s land creation project stands firm. Nature 2014, 511, 410. [Google Scholar] [CrossRef]
- Tong, J.S.; Li, J.H.; Zhou, Z.H. Analysis of the Causes of Urban Road Collapse and Refined Preventive Measures. Urban Roads Bridges Flood Control. 2021, 2, 29–33. [Google Scholar] [CrossRef]
- Zhou, Y.; Jia, S.M.; Luo, Y.; Lei, K.C.; Liu, M.K.; Jiang, Y.; Wang, R.; Tian, F.; Yang, Y.; Chen, T.Z. A Bedrock Deformation Measurement Device. C.N. Patent 203908539U, 29 October 2014. [Google Scholar]
- Zhu, L.; Zhou, J.H.; Li, J.T.; Gong, H.L.; Li, X.J.; Guo, G.X.; Luo, Y. A Method and System for Inversion of Water Release Coefficients Combining Surface Deformation and Water Level Information. C.N. Patent 113175949A, 27 July 2021. [Google Scholar]
- Yang, J.; Tang, W.; Xuan, W.; Xi, R. Tight Integration of GNSS and Static Level for High Accuracy Dilapidated House Deformation Monitoring. Remote Sens. 2022, 14, 2943. [Google Scholar] [CrossRef]
- Dzierzega, A.; Scherrer, R. Measuring with electronic total stations. Surv. Rev. 2003, 37, 55–65. [Google Scholar] [CrossRef]
- Psimoulis, P.A.; Houlié, N.; Habboub, M.; Michel, C.; Rothacher, M. Detection of ground motions using high-rate GPS time-series. Geophys. J. Int. 2018, 214, 1237–1251. [Google Scholar] [CrossRef]
- Shi, G.; Ma, P.; Hu, X.; Huang, B.; Lin, H. Surface response and subsurface features during the restriction of groundwater exploitation in Suzhou (China) inferred from decadal SAR interferometry. Remote Sens. Environ. 2021, 256, 112327. [Google Scholar] [CrossRef]
- Hu, J.; Li, Z.-W.; Zhu, J.-J.; Ding, X.-L.; Wang, C.-C.; Feng, G.-C.; Sun, Q. Measuring three-dimensional surface displacements from combined InSAR and GPS data based on BFGS method. Chin. J. Geophys. 2013, 56, 117–126. [Google Scholar] [CrossRef]
- Zhong, W.; Chu, T.; Tissot, P.; Wu, Z.; Chen, J.; Zhang, H. Integrated coastal subsidence analysis using InSAR, LiDAR, and land cover data. Remote Sens. Environ. 2022, 282, 113297. [Google Scholar] [CrossRef]
- Wu, P.C.; Wei, M.; D’Hondt, S. Subsidence in coastal cities throughout the world observed by InSAR. Geophys. Res. Lett. 2022, 49, e2022GL098477. [Google Scholar] [CrossRef]
- Zhou, L.; Guo, J.; Hu, J.; Li, J.; Xu, Y.; Pan, Y.; Shi, M. Wuhan surface subsidence analysis in 2015–2016 based on Sentinel-1A data by SBAS-InSAR. Remote Sens. 2017, 9, 982. [Google Scholar] [CrossRef]
- Zhao, C.; Liu, X.; Zhang, Q.; Peng, J.; Xu, Q. Research on loess landslide identification, monitoring and failure mode with InSAR technique in Heifangtai, Gansu. Geomat. Inf. Sci. Wuhan Univ. 2019, 44, 996–1007. [Google Scholar] [CrossRef]
- Xu, Y.M.; Wu, Z.; Liu, J. Early Identification of Potential Landslide Hazards and Precipitation Correlation Analysis in Zhouqu County Based on SBAS-InSAR Technology. Adv. Eng. Sci. 2022. [Google Scholar] [CrossRef]
- Novellino, A.; Cesarano, M.; Cappelletti, P.; Di Martire, D.; Di Napoli, M.; Ramondini, M.; Sowter, A.; Calcaterra, D. Slow-moving landslide risk assessment combining Machine Learning and InSAR techniques. Catena 2021, 203, 105317. [Google Scholar] [CrossRef]
- Roy, P.; Martha, T.R.; Khanna, K.; Jain, N.; Kumar, K.V. Time and path prediction of landslides using InSAR and flow model. Remote Sens. Environ. 2022, 271, 112899. [Google Scholar] [CrossRef]
- Liu, Y.; Xu, C.; Wen, Y. InSAR Observation of Menyuan Mw5. 9 Earthquake Deformation and Deep Geometry of Regional Fault Zone. Geomat. Inf. Sci. Wuhan Univ. 2019, 44, 1035–1042. [Google Scholar] [CrossRef]
- De Novellis, V.; Reale, D.; Adinolfi, G.M.; Sansosti, E.; Convertito, V. Geodetic model of the March 2021 Thessaly seismic sequence inferred from seismological and InSAR data. Remote Sens. 2021, 13, 3410. [Google Scholar] [CrossRef]
- Maubant, L.; Radiguet, M.; Pathier, E.; Doin, M.-P.; Cotte, N.; Kazachkina, E.; Kostoglodov, V. Interseismic coupling along the Mexican subduction zone seen by InSAR and GNSS. Earth Planet. Sci. Lett. 2022, 586, 117534. [Google Scholar] [CrossRef]
- Li, B.; Li, Y.; Jiang, W.; Su, Z.; Shen, W. Conjugate ruptures and seismotectonic implications of the 2019 Mindanao earthquake sequence inferred from Sentinel-1 InSAR data. Int. J. Appl. Earth Obs. Geoinf. 2020, 90, 102127. [Google Scholar] [CrossRef]
- Chen, Y.; Tao, Q.; Liu, G.; Wang, L.; Wang, F.; Wang, K. Detailed mining subsidence monitoring combined with InSAR and probability integral method. Chin. J. Geophys. 2021, 64, 3554–3566. [Google Scholar] [CrossRef]
- Woo, K.S.; Eberhardt, E.; Rabus, B.; Stead, D.; Vyazmensky, A. Integration of field characterisation, mine production and InSAR monitoring data to constrain and calibrate 3-D numerical modelling of block caving-induced subsidence. Int. J. Rock Mech. Min. Sci. 2012, 53, 166–178. [Google Scholar] [CrossRef]
- Zhang, G.; Xu, Z.; Chen, Z.; Wang, S.; Cui, H.; Zheng, Y. Predictable Condition Analysis and Prediction Method of SBAS-InSAR Coal Mining Subsidence. IEEE Trans. Geosci. Remote Sens. 2022, 60, 1–14. [Google Scholar] [CrossRef]
- Wang, Y.; Dong, J.; Zhang, L.; Deng, S.; Zhang, G.; Liao, M.; Gong, J. Automatic detection and update of landslide inventory before and after impoundments at the Lianghekou reservoir using Sentinel-1 InSAR. Int. J. Appl. Earth Obs. Geoinf. 2023, 118, 103224. [Google Scholar] [CrossRef]
- Jones, J.; Jones, C.E.; Bekaert, D.P. Value of InSAR for monitoring land subsidence to support water management in the San Joaquin Valley, California. JAWRA J. Am. Water Resour. Assoc. 2022, 58, 995–1001. [Google Scholar] [CrossRef]
- Ronczyk, L.; Zelenka-Hegyi, A.; Török, G.; Orbán, Z.; Defilippi, M.; Kovács, I.P.; Kovács, D.M.; Burai, P.; Pasquali, P. Nationwide, Operational Sentinel-1 Based InSAR Monitoring System in the Cloud for Strategic Water Facilities in Hungary. Remote Sens. 2022, 14, 3251. [Google Scholar] [CrossRef]
- Pitcher, L.H.; Pavelsky, T.M.; Smith, L.C.; Moller, D.K.; Altenau, E.H.; Allen, G.H.; Lion, C.; Butman, D.; Cooley, S.W.; Fayne, J.V. AirSWOT InSAR mapping of surface water elevations and hydraulic gradients across the Yukon Flats Basin, Alaska. Water Resour. Res. 2019, 55, 937–953. [Google Scholar] [CrossRef]
- Ferretti, A.; Prati, C. Nonlinear subsidence rate estimation using permanent scatterers in differential SAR interferometry. IEEE Trans. Geosci. Remote Sens. 2000, 38, 2202–2212. [Google Scholar] [CrossRef]
- Ferretti, A.; Prati, C. Permanent Scatterers in SAR Interferometry. IEEE Trans. Geosci. Remote Sens. 2001, 39, 8–20. [Google Scholar] [CrossRef]
- Ferretti, A.; Savio, G.; Barzaghi, R.; Borghi, A.; Rocca, F. Submillimeter Accuracy of InSAR Time Series: Experimental Validation. IEEE Trans. Geosci. Remote Sens. 2007, 45, 1142–1153. [Google Scholar] [CrossRef]
- Berardino, P.; Fornaro, G.; Lanari, R.; Sansosti, E. A New Algorithm for Surface Deformation Monitoring Based on Small Baseline Differential SAR Interferograms. IEEE Trans. Geosci. Remote Sens. 2002, 40, 2375–2383. [Google Scholar] [CrossRef]
- Lanari, R.; Mora, O.; Manunta, M.; Mallorquí, J.; Sansosti, E. A small-baseline approach for investigating deformations on full-resolution differential SAR interferograms. Geosci. Remote Sens. IEEE Trans. 2004, 42, 1377–1386. [Google Scholar] [CrossRef]
- Hooper, A.J. Persistent Scatter Radar Interferometry for Crustal Deformation Studies and Modeling of Volcanic Deformation. Ph.D. Thesis, Stanford University, Stanford, CA, USA, 2006. [Google Scholar]
- Casu, F.; Manzo, M.; Lanari, R. Performance Analysis of the SBAS Algorithm for Surface Deformation Retrieval. In Proceedings of the Fringe 2005 Workshop, Frascati, Italy, 28 November–2 December 2006. [Google Scholar]
- Lauknes, T.R.; Dehls, J.; Larsen, Y.; Hgda, K.A.; Weydahl, D.J. A comparison of SBAS and PS ERS InSAR for subsidence monitoring in Oslo, Norway. In Proceedings of the Fringe 2005 Workshop, Frascati, Italy, 28 November–2 December 2006. [Google Scholar]
- Lee, C.; Lu, Z.; Kwoun, O.; Won, J. InSAR Observation of surface deformation at Augustine volcano, Alaska, 1992–2006. In Proceedings of the AGU Fall Meeting Abstracts, San Francisco, CA, USA, 11–15 December 2006; p. V51C-1679. [Google Scholar]
- Lanari, R. One year after the Abruzzo 2009 earthquake: Pre-, co- and post-seismic surface deformation investigation through advanced InSAR analyses. EGU Gen. Assem. Conf. Abstr. 2010, 40, 2375–2383. [Google Scholar]
- Akitaya, K.; Aichi, M. Land subsidence caused by seasonal groundwater level fluctuations in Kawajima (Japan) and one-dimensional numerical modeling with an evolutionary algorithm. Hydrogeol. J. 2022, 31, 147–165. [Google Scholar] [CrossRef]
- Agarwal, V.; Kumar, A.; Gee, D.; Grebby, S.; Gomes, R.L.; Marsh, S. Comparative study of groundwater-induced subsidence for London and Delhi using PSInSAR. Remote Sens. 2021, 13, 4741. [Google Scholar] [CrossRef]
- Yu, X.; Michael, H.A. Offshore pumping impacts onshore groundwater resources and land subsidence. Geophys. Res. Lett. 2019, 46, 2553–2562. [Google Scholar] [CrossRef]
- Chai, J.-C.; Shen, S.-L.; Zhu, H.-H.; Zhang, X.-L. Land subsidence due to groundwater drawdown in Shanghai. Geotechnique 2004, 54, 143–147. [Google Scholar] [CrossRef]
- Xiao, H.; Li, H.; Tang, Y. Assessing the effects of rainfall, groundwater downward leakage, and groundwater head differences on the development of cover-collapse and cover-suffosion sinkholes in central Florida (USA). Sci. Total Environ. 2018, 644, 274–286. [Google Scholar] [CrossRef]
- Shi, M.; Chen, B.; Gong, H.; Li, X.; Chen, W.; Gao, M.; Zhou, C.; Lei, K. Monitoring differential subsidence along the beijing–tianjin intercity railway with multiband SAR data. Int. J. Environ. Res. Public Health 2019, 16, 4453. [Google Scholar] [CrossRef]
- Charoenwong, C.; Connolly, D.; Woodward, P.; Galvín, P.; Costa, P.A. Analytical forecasting of long-term railway track settlement. Comput. Geotech. 2022, 143, 104–601. [Google Scholar] [CrossRef]
- Jeon, S.-S.; Park, Y.-K.; Eum, K.-Y. Stability assessment of roadbed affected by ground subsidence adjacent to urban railways. Nat. Hazards Earth Syst. Sci. 2018, 18, 2261–2271. [Google Scholar] [CrossRef]
- Cigna, F.; Tapete, D. Present-day land subsidence rates, surface faulting hazard and risk in Mexico City with 2014–2020 Sentinel-1 IW InSAR. Remote Sens. Environ. 2021, 253, 112–161. [Google Scholar] [CrossRef]
- Wetzler, N.; Segev, A.; Lyakhovsky, V. Uplift and subsidence at the periphery of the Lebanese Restraining Bend, Northern Dead Sea Fault. Tectonophysics 2022, 830, 229–292. [Google Scholar] [CrossRef]
- Doglioni, C.; Dagostino, N.; Mariotti, G. Normal faulting vs regional subsidence and sedimentation rate. Mar. Pet. Geol. 1998, 15, 737–750. [Google Scholar] [CrossRef]
- Abidin, H.Z.; Andreas, H.; Gumilar, I.; Fukuda, Y.; Pohan, Y.E.; Deguchi, T. Land subsidence of Jakarta (Indonesia) and its relation with urban development. Nat. Hazards 2011, 59, 1753–1771. [Google Scholar] [CrossRef]
- Aljammaz, A.; Sultan, M.; Izadi, M.; Abotalib, A.Z.; Elhebiry, M.S.; Emil, M.K.; Abdelmohsen, K.; Saleh, M.; Becker, R. Land subsidence induced by rapid urbanization in arid environments: A remote sensing-based investigation. Remote Sens. 2021, 13, 1109. [Google Scholar] [CrossRef]
- Cigna, F.; Tapete, D. Urban growth and land subsidence: Multi-decadal investigation using human settlement data and satellite InSAR in Morelia, Mexico. Sci. Total Environ. 2022, 811, 152211. [Google Scholar] [CrossRef]
- Notti, D.; Mateos, R.M.; Monserrat, O.; Devanthéry, N.; Peinado, T.; Roldán, F.J.; Fernández-Chacón, F.; Galve, J.P.; Lamas, F.; Azañón, J.M. Lithological control of land subsidence induced by groundwater withdrawal in new urban areas (Granada Basin, SE Spain). Multiband DInSAR monitoring. Hydrol. Process. 2016, 30, 2317–2331. [Google Scholar] [CrossRef]
- Hungr, O.; Coates, D. Deformability of joints and its relation to rock foundation settlements. Can. Geotech. J. 1978, 15, 239–249. [Google Scholar] [CrossRef]
- Miščević, P.; Vlastelica, G. Estimation of embankment settlement caused by deterioration of soft rock grains. Bull. Eng. Geol. Environ. 2019, 78, 1843–1853. [Google Scholar] [CrossRef]
- Chen, G.; Zhang, Y.; Zeng, R.; Yang, Z.; Chen, X.; Zhao, F.; Meng, X. Detection of land subsidence associated with land creation and rapid urbanization in the chinese loess plateau using time series insar: A case study of Lanzhou new district. Remote Sens. 2018, 10, 270. [Google Scholar] [CrossRef]
- Rongrong, L.; Weifang, Y.; Deyan, L. Land Deformation Monitoring in Lanzhou City Based on SBAS-InSAR Technology. Proc. IOP Conf. Ser. Earth Environ. Sci. 2020, 608, 1–8. [Google Scholar] [CrossRef]
- Yuan, D.Y.; Wang, L.M.; He, W.G.; Liu, B.C.; Ge, W.P.; Liu, X.W.; Liang, M.J.; Zheng, J.W. New progress of seismic active fault prospecting in lanzhou city. Seismol. Geol. 2008, 30, 236–249. [Google Scholar] [CrossRef]
- Wang, Z.Y.; Shi, P.J.; Zhang, X.B.; Wang, Y.S.; Xie, X.Y. Simulation of Lanzhou urban land expansion based on multi-agent model. Chin. J. Appl. Ecol. 2021, 32, 2169–2179. [Google Scholar] [CrossRef]
- He, S.; Wang, X.; Dong, J.; Wei, B.; Duan, H.; Jiao, J.; Xie, Y. Three-dimensional urban expansion analysis of valley-type cities: A case study of chengguan district, lanzhou, China. Sustainability 2019, 11, 5663. [Google Scholar] [CrossRef]
- Zhang, J. Research on Land Subsidence Monitoring in Lanzhou City Center Based on Sentinel-1 Data. Master’s Thesis, Lanzhou Jiaotong University, Lanzhou, China, 2020. [Google Scholar]
- Guo, H.D.; Wei, L.S.; Zheng, W.; Wei, Y.T.; Zhong, H. Impact from subway project on groundwater environment in Lanzhou fault basin. Water Resour. Hydropower Eng. 2020, 51, 119–128. [Google Scholar] [CrossRef]
- Goldstein, R.M.; Werner, C.L. Radar interferogram filtering for geophysical applications. Geophys. Res. Lett. 1998, 25, 4035–4038. [Google Scholar] [CrossRef]
- Usai, S. A New Approach for Longterm Monitoring of Deformations by Differential SAR Interferometry; Delft University Press: Delft, The Netherlands, 2001; pp. 1–165. ISBN 90-407-2189-0. [Google Scholar]
- Achour, Y.; Pourghasemi, H.R. How do machine learning techniques help in increasing accuracy of landslide susceptibility maps? Geosci. Front. 2020, 11, 871–883. [Google Scholar] [CrossRef]
- Sun, D.; Wen, H.; Wang, D.; Xu, J. A random forest model of landslide susceptibility mapping based on hyperparameter optimization using Bayes algorithm. Geomorphology 2020, 362, 107201. [Google Scholar] [CrossRef]
- Mohammady, M.; Pourghasemi, H.R.; Amiri, M. Land subsidence susceptibility assessment using random forest machine learning algorithm. Environ. Earth Sci. 2019, 78, 503. [Google Scholar] [CrossRef]
- Lee, S.; Park, I. Application of decision tree model for the ground subsidence hazard mapping near abandoned underground coal mines. J. Environ. Manag. 2013, 127, 166–176. [Google Scholar] [CrossRef] [PubMed]
- Jenks, G.F. Optimal data classification for choropleth maps. Dep. Geogr. Univ. Kans. Occas. Pap. 1977, 13, 11–20. [Google Scholar] [CrossRef]
- Berhane, G.; Kebede, M.; Alfarah, N.; Hagos, E.; Grum, B.; Giday, A.; Abera, T. Landslide susceptibility zonation mapping using GIS-based frequency ratio model with multi-class spatial data-sets in the Adwa-Adigrat mountain chains, northern Ethiopia. J. Afr. Earth Sci. 2020, 164, 103795. [Google Scholar] [CrossRef]
- Huang, F.; Cao, Z.; Guo, J.; Jiang, S.-H.; Li, S.; Guo, Z. Comparisons of heuristic, general statistical and machine learning models for landslide susceptibility prediction and mapping. Catena 2020, 191, 104580. [Google Scholar] [CrossRef]
- Park, S.-J.; Lee, C.-W.; Lee, S.; Lee, M.-J. Landslide susceptibility mapping and comparison using decision tree models: A Case Study of Jumunjin Area, Korea. Remote Sens. 2018, 10, 1545. [Google Scholar] [CrossRef]
- RenéJacques, B. Some specific problems of wetted loessial soils in civil engineering. Eng. Geol. 1988, 25, 303–324. [Google Scholar] [CrossRef]
- Kie, T.T. Fundamental properties of loess from Northwestern China. Eng. Geol. 1988, 25, 103–122. [Google Scholar] [CrossRef]
- Bykov, A.; Grecheneva, A.; Kuzichkin, O.; Surzhik, D.; Vasilyev, G.; Yerbayev, Y. Mathematical Description and Laboratory Study of Electrophysical Methods of Localization of Geodeformational Changes during the Control of the Railway Roadbed. Mathematics 2021, 9, 3164. [Google Scholar] [CrossRef]
- Mathu, E.M.; Onyancha, C.; Mwea, S.; Ngecu, W. Effects of drilling deep tube wells in the urban areas of Nairobi city, Kenya. ARPN J. Earth Sci. 2014, 3, 17–24. [Google Scholar]
- Jingtao, L.; Jichao, S.; Liang, Z.; Xiaoli, L.; Chunyan, L. Analysis of Groundwater Environmental Conditions and Influencing Factors in Typical City in Northwest China. J. Groundw. Sci. Eng. 2013, 2, 60–73. [Google Scholar]
- Burbey, T.J. The influence of faults in basin-fill deposits on land subsidence, Las Vegas Valley, Nevada, USA. Hydrogeol. J. 2002, 10, 525–538. [Google Scholar] [CrossRef]
- Holzer, T.L.; Pampeyan, E.H. Earth fissures and localized differential subsidence. Water Resour. Res. 1981, 17, 223–227. [Google Scholar] [CrossRef]
- Chaussard, E.; Wdowinski, S.; Cabral-Cano, E.; Amelung, F. Land subsidence in central Mexico detected by ALOS InSAR time-series. Remote Sens. Environ. 2014, 140, 94–106. [Google Scholar] [CrossRef]
- Frýba, L. Vibration of Solids and Structures Under Moving Loads; Springer: Berlin, Germany, 2012; pp. 1–484. ISBN 9401196877. [Google Scholar]
- Zicha, J.H. High-speed rail track design. J. Transp. Eng. 1989, 115, 68–83. [Google Scholar] [CrossRef]
- Zhang, C.; Chen, W.K.; Lin, X.C. Earthquake damage simulation of urban buildings based on ground motion parameters: A case study of Chengguan District in Lanzhou City. China Earthq. Eng. J. 2022, 44, 172–182. [Google Scholar] [CrossRef]
- Solari, L.; Ciampalini, A.; Raspini, F.; Bianchini, S.; Moretti, S. PSInSAR analysis in the Pisa urban area (Italy): A case study of subsidence related to stratigraphical factors and urbanization. Remote Sens. 2016, 8, 120. [Google Scholar] [CrossRef]
- Qin, X.Q.; Yang, M.S.; Liao, M.S.; Wang, H.M.; Yang, T.L. Exploring Temporal-Spatial Characteristics of Shanghai Road Networks Settlement with Muti-temporal PSInSAR Technique. Geomat. Inf. Sci. Wuhan Univ. 2017, 42, 170–177. [Google Scholar] [CrossRef]
- Gong, X.N. Foundation Treatment Brochure; China Architecture & Building Press: Beijing, China, 2008; pp. 1–1063. ISBN 9787112091010. [Google Scholar]
- Fernández-Torres, E.; Cabral-Cano, E.; Solano-Rojas, D.; Havazli, E.; Salazar-Tlaczani, L. Land Subsidence risk maps and InSAR based angular distortion structural vulnerability assessment: An example in Mexico City. Proc. Int. Assoc. Hydrol. Sci. 2020, 382, 583–587. [Google Scholar] [CrossRef]
- Vassileva, M.; Al-Halbouni, D.; Motagh, M.; Walter, T.R.; Dahm, T.; Wetzel, H.-U. A decade-long silent ground subsidence hazard culminating in a metropolitan disaster in Maceió, Brazil. Sci. Rep. 2021, 11, 7704. [Google Scholar] [CrossRef]


Disclaimer/Publisher’s Note: The statements, opinions and data contained in all publications are solely those of the individual author(s) and contributor(s) and not of MDPI and/or the editor(s). MDPI and/or the editor(s) disclaim responsibility for any injury to people or property resulting from any ideas, methods, instructions or products referred to in the content. |
© 2023 by the authors. Licensee MDPI, Basel, Switzerland. This article is an open access article distributed under the terms and conditions of the Creative Commons Attribution (CC BY) license (https://creativecommons.org/licenses/by/4.0/).