Abstract
This study presents a novel approach for the detection of contrails in satellite imagery using a convolutional neural network (CNN). Contrails are important to monitor because their contribution to climate change is uncertain and complex. Contrails are found to have a net warming effect because the clouds prevent terrestrial (longwave) radiation from escaping the atmosphere. Globally, this warming effect is greater than the cooling effect the clouds have in the reduction of solar (shortwave) radiation reaching the surface during the daytime. The detection of contrails in satellite imagery is challenging due to their similarity to natural clouds. In this study, a certain type of CNN, U-Net, is used to perform image segmentation in satellite imagery to detect contrails. U-Net can accurately detect contrails with an overall probability of detection of 0.51, a false alarm ratio of 0.46 and a F1 score of 0.52. These results demonstrate the effectiveness of using a U-Net for the detection of contrails in satellite imagery and could be applied to large-scale monitoring of contrail formation to measure their impact on climate change.
1. Introduction
Contrails, also known as aviation-induced cirrus (AIC) are ice clouds that form when atmospheric conditions are near saturation and aircraft emissions inject enough water vapor to form clouds that would otherwise not have existed. The resulting white streaks can persist in the atmosphere for just a few minutes or for hours. The theory for forecasting conditions distinguishing temporary from persistent contrails is straightforward as it only involves knowing pressure, temperature, humidity, and engine efficiency. In practice, while pressure, temperature, and engine efficiency are relatively easy to obtain with sufficient accuracy, humidity in the upper troposphere is not [1,2]. It is important that science improves in observing and forecasting the existence and location (including altitude) of persistent contrails, as the aviation industry is considering procedures to mitigate the impact with changes in flight levels. If the science is incorrect, this could cause the unnecessary use of fuel and therefore extra CO2 emissions. Moreover, if we do not have sufficient information, operational procedures will not be able to reroute aircraft to avoid regions that have conditions that are favorable for the formation of persistent contrails that cause the largest warming impact. It has been suggested that 5% of anthropogenic radiative forcing can be attributed to aviation [3]. Of all of the emissions from aviation, contrails contribute between 36–81% of radiative forcing [4], and the largest uncertainty in terms of radiative forcing is associated with contrails [5]. It is the persistent contrails that have an impact on the planetary albedo and the earth’s radiation budget. Studies have found that just 12% of flights contribute on the order of 80% of energy forcing [3]. Therefore, diverting aircraft away from where conditions are favorable for the formation of contrails can reduce this radiative forcing [6]. One such study showed that during the height of the COVID-19 pandemic, air traffic declined by 72%, which corresponded with a drop in contrail radiative forcing by 0.7 W/m2 [7]. Over just the US, air travel reduced by 36%, which resulted in a reduction of contrails by 22% [8].
The detection of contrails in satellite imagery is crucial to understanding their spatial and temporal extent and their impact on climate. Previous studies on contrail detection have found that contrail formation is overestimated by a factor of 2.0 to 3.5 and that the lifespan of contrails is overestimated by a factor of 17–45% [4]. Earlier work by Mannstein et al. 1999 developed an AVHRR approach for contrail detection [9] that was later adapted for SEVIRI [10]. This paper explores the application of a Convolutional Neural Network (CNN) with a specific U-shaped architecture, U-Net [11], to perform image segmentation on satellite imagery for the detection of contrails. Although the physical and spectral characteristics are quite different, the long and linear shape of contrails is similar to that of fractures in sea ice known as sea ice leads. The approach to detecting contrails presented here is not a new technology, but rather, the detection model used for the detection of sea ice leads that was developed by Hoffman et al. 2019 and 2022 [12,13] is reused—but in a new application. The architecture of the U-Net is the same; the detection model simply relies on training from a different dataset—contrail imagery rather than sea ice imagery. A similar approach has been used to detect ship tracks in satellite imagery [14]. Several other studies have demonstrated AI-based approaches to detecting contrails in satellite imagery, including Zhang et al. [15], Kulik [16], and Siddiqui et al. [17]. Recent work by Ng et al. [18] also uses a CNN to detect contrails in Geostationary Operational Environmental Satellites (GOES) Advanced Baseline Imager (ABI) imagery. The primary advantage demonstrated in this study is the value added by height retrieval by aligning contrail detections with the GOES ABI Cloud Top Height (ACHA) product [19].
2. Materials and Methods
The first step in the formation of a contrail detection method is to utilize a dataset of contrail images that can be used to train, test, and validate a detection method [18]. The detection architecture is based on the same AI architecture that was used to detect quasi-linear sea ice lead features as described by Hoffman et al. in 2021 [12] and updated in 2022 [13]. Both the contrail and sea ice lead detection methods uses a particular kind of convolutional neural network, U-Net, to perform image segmentation, which was first described by Ronneberger et al. in 2015 [11]. For sea ice lead detection, a single thermal imagery channel was used. The adaptation for contrail detection is to use brightness temperature difference imagery between the 11 μm and 12 μm channels. To process GOES ABI, the imagery is divided into several small regions (256 × 256 pixel samples) that are stitched together to cover the entire full disk. Contrails can be detected near processing region boundaries, and contrails that span a processing region boundary can be detected in both regions when the contrails are sufficiently long in each processing region (as long as the contrail segment in each sub-region maintains the spatial characteristics of a contrail). However, when a contrail spans a processing region boundary, the contrail segment on one side of the processing region boundary can be too short for contrail detection. To mitigate any detection bias near processing grid boundaries, the processing allows for a random amount of overlap for neighboring grids. Over a time series of imagery, processing region boundaries rarely overlap and therefore detection artifacts are avoided.
For this project, we initially used a previously published dataset of Landsat-based contrail detections developed by McCloskey et al. in 2021 [20]. The dataset was later replaced by the newer Ng et al. 2023 dataset with GOES-16 imagery [18]. The dataset contains a set of contrails identified by hand analysis, which we use as a truth mask. Because of the differences in sensitivity between ice and water clouds between 11 μm and 12 μm [21], we use brightness temperature differences to identify cirrus clouds. For the training, testing, and validation set, the GOES ABI 11 μm and 12 μm channels are Band 14 and Band 15. The original Ng et al. dataset [18] contains several thousand cases that can be segregated for training, testing, and validation. For our study, we have used a subset of 10,000 cases. To avoid overfitting, care was taken to avoid cross-contamination of the training, testing, and validation datasets. From the 10,000 cases, a ratio of 70%/20%/10% was used for training, testing, and validation. The Ng et al. dataset [18] contains a time series of images for contrail masks; however, for operational simplicity, our analysis only uses the central time period in each contrail time series. Example validation imagery is shown for three randomly selected cases in Figure 1: the RGB imagery (red = 8 μm, green = 11 μm, blue = 12 μm) is shown for reference in the left column, and the second column is the 12 μm minus 11 μm brightness temperature difference imagery that is used in the detection model. The third column is the Ng et al. [18] mask used as truth, and the final column is the U-Net detection model image segmentation solution. In general, the model detections are largely consistent with the truth masks. In top row, there appear to be some contrails oriented in the vertical direction that are errors of omission in the U-Net. However, in the middle and bottom rows, there may be some errors of omission in the hand analysis; some of the U-Net detections resemble contrails in the satellite imagery but escaped detection in the hand analysis mask. Overall, the U-Net does appear to positively identify the contrails that are apparent in the imagery.
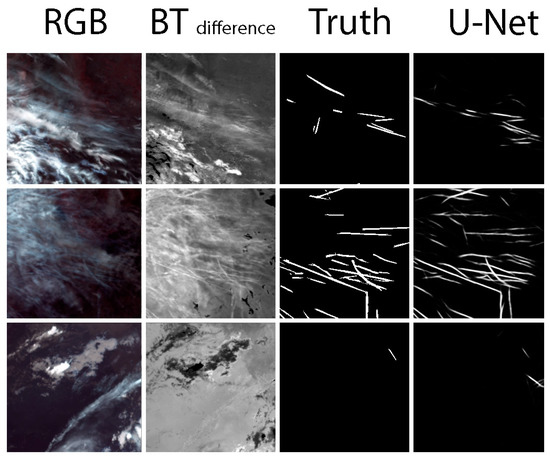
Figure 1.
Randomly selected example imagery of three examples from the validation data set. From left to right: the RGB imagery (red = 8 μm, green = 11 μm, blue = 12 μm) ABI imagery for reference; the “BT difference” column showing the 12 µm minus 11 µm brightness temperature difference; the “Truth” or validation masks; and the U-Net image segmentation results.
3. Results
One way to illustrate detection performance is in the form of a receiver operating characteristic (ROC) curve which is provided in Figure 2; generally, curves that are near the upper left corner are good, and a detection model near the black line is indicative of low skill. Another way to assess skill is to measure the area under the curve (AUC-PR), and the results we achieved have an AUC-PR of 73.9, which compares favorably to the AUC-PR of 72.7 achieved by Ng et al. [18].
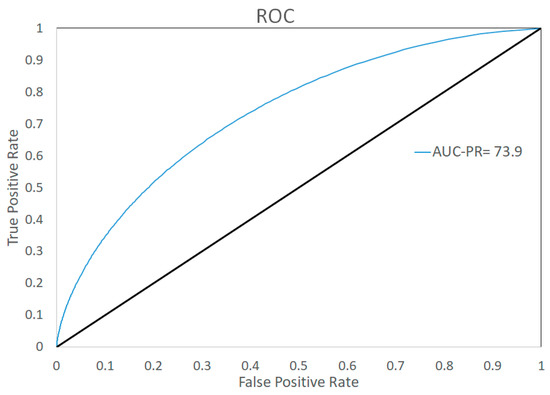
Figure 2.
Receiver operating characteristics (ROC) curve for contrails is the blue curve. For reference, a no-skill, random classifier is shown in black.
The image segmentation results form an image of probabilities from 0 to 1, encoded as bytes ranging from 0 to 255. To make deterministic evaluations, a threshold to distinguish between contrail or clear must be chosen. For our application, we selected a value of 65 as the detection threshold that achieves the maximum F1 score. At a detection threshold of 65 (or 0.254 if encoded 0 to 1), the probability of detection is 0.508 and the false alarm rate is 0.460. The F1 Score, also known as the Dice coefficient, is 0.524 and may be the best measure of success for the detection model, as it captures a balance of omission and commission error. A lower detection threshold could have been chosen to achieve a higher rate of true positives but at the expense of a higher false positive detection rate. However, the image segmentation results tend to be largely bimodal with the majority of the solutions being near zero or near 250; relatively few solutions are near the value of the detection threshold. Despite some imperfections in the validation dataset and a rather conservative detection threshold, the detection metrics of the technique are overall very good, as shown in Table 1.

Table 1.
Contingency table and contrail detection performance statistics including percent correct (PC), probability of detection (POD), false alarm ratio (FAR), critical success index (CSI), Hanssen–Kiuper skill score (KSS), and F1 Score.
An advantage of using thermal IR bands on ABI is that the technique can be applied day or night. The main advantage of using the GOES ABI is that it provides nearly complete coverage over the Western hemisphere every 10 min at a nominal 2 km resolution. An example image of contrail detection over the Gulf of Mexico in GOES imagery is shown in Figure 3. In this example, contrail detections are overlaid on an image of the 11 µm brightness temperature image from 0420 UTC (or 10:20 PM local time) on 10 March 2023. The contrails are color-coded by the GOES ABI Cloud Top Height (ACHA) product [19]. At that time, the native ACHA product had a 4 km nominal resolution, so the product is interpolated to match the 2 km resolution of the native ABI brightness temperature imagery. Later in March of 2023, a 2 km resolution ABI Cloud Top Height product became operational [19] to match the 2 km resolution of the imagery so that interpolation will not be needed in future work. Additionally, the ACHA height is given in km; for aviation applications, it is converted to feet, and for each contrail, the height reported is the highest height retrieval within each contrail object.
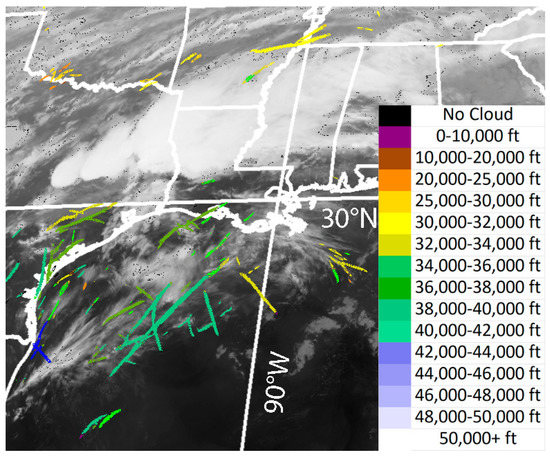
Figure 3.
Example image of contrails detected by GOES-16 on March 10, 2023 at 0420 UTC. Contrail detections are color-coded by height and overlaid on a 11 µm brightness temperature image.
4. Discussion
Another GOES contrail detection case is presented in Figure 4. On 14 March 2023 at 2100 UTC, true color imagery is presented in Panel A and the corresponding 11 μm brightness temperature imagery is presented in Panel B. It is interesting to note that the contrails are barely distinguishable in the true color image against the snow-covered background; however, the contrails are readily apparent in the thermal IR. The GOES Cloud Mask and Cloud Top Pressure products are shown in Panels C and D, respectively. The contrail detection product is shown in Panel E, where it is interesting to note that the western and northern contrails are detected with a maximum height of between 20–25 thousand feet (orange), but the eastern and southern Wisconsin contrails are not detected by the GOES cloud mask (black). Finally, as validation, a photograph is shown looking northward from southern Wisconsin, taken at 4:05 P.M. local time (2105 UTC). The primary advantage of the detection method is that it uses techniques previously demonstrated to be effective in satellite remote sensing applications [12,13], and that it can be applied to this new application without changing the model architecture. The technique also is also relatively simple to run in an operational sense because the detections are based on a single brightness temperature difference image rather than more complex multi-spectral time series of images [18]. One weakness of using a simple brightness temperature difference image for contrail detection is that there are non-cloud features that can have similar spatial characteristics to contrails and also have a brightness temperature difference between 11 μm and 12 μm. Rivers and coastlines can cause apparent false detections; as an example, in Figure 4, the Mississippi River along the Illinois/Iowa border shows a contrail detection not associated with any cloud mask detections (black in Figure 4E). This was a larger issue in early iterations of the detection method that used Landsat based training imagery [20]; however, this has become less of an issue after training with a more extensive training dataset [18]. Because ACHA height retrievals are limited to cloudy regions identified by the ABI Cloud Mask [19], non-cloud false contrail detections can be filtered out by using the ACHA product. However, this does not remove all false contrail detections because there are cases where natural clouds are misclassified as contrails. One other point to make is that contrail detections are often longer and wider features than are detected in the cloud mask or cloud height products. This is because the cloud mask and height product detection techniques are based primarily on spectral differencing tests. In contrast, the U-Net used for the contrail detection model is based on a combination of spatial and spectral characteristics. Features that have low patches of low spectral contrast may escape continuous detection in the cloud mask but may be identified as a continuous contrail due to the spatial characteristics identified by the U-Net.
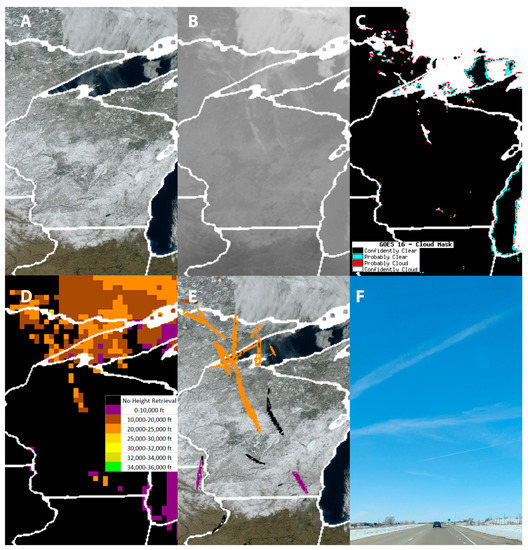
Figure 4.
Example image of contrails detected by GOES-16 on 14 March 2023 at 2100 UTC. Panel (A) is a true color image showing a snow-covered Wisconsin; panel (B) shows the 11 μm brightness temperature image. Contrail detections are color-coded by height and overlaid on a 11 µm brightness temperature image with some contrails visible in northern Wisconsin. The GOES Cloud Mask and Cloud Top Pressure products are shown in panels (C) and (D), respectively. The contrail detection results are shown in Panel (E), and a photograph is shown in Panel (F) looking northward from southern Wisconsin, taken at 4:05 P.M. local time (2105 UTC).
5. Conclusions
The premise that the same AI-based detection method that was used for the identification of sea ice leads in satellite imagery [12,13] can also be used for the detection of contrails in Geostationary satellite imagery has proven to be quite successful. Future iterations may focus on a multi-channel approach, using a time series of imagery and/or using more customized neural networks that have been used in other contrail detection studies [8,15,16,18,20]. It will likely be possible to achieve better detection metrics with more advanced techniques; however, there will likely be tradeoffs in terms developmental time, operational complexity, and/or processing loads. As a proof-of-concept, the single brightness temperature difference does very well at identifying ice clouds. However, the single temperature difference image is prone to false positives due to non-cloud features such as rivers and coastlines. Adding more cloud testing by using imagery from more satellite channels will be beneficial for cloud detection and therefore contrail detection. Visible bands on ABI, for example, would add skill in cloud detection, and the near-IR bands have sensitivity to water vapor and can help differentiate between water and ice cloud. These bands would however be limited to daytime only and would therefore not help detect contrails at night, when they have the largest warming effect.
Future work will also bring in information on atmospheric conditions. For example, Zhang et al. [15] identify regions where the atmosphere is nearly saturated with respect to ice at altitude. We would be able to combine forecasts where contrail detection may be likely to occur with observations. Further, by assimilating this with maps of flight paths or knowledge of where commercial air traffic is prevalent, we could gain greater confidence in the detection of contrails when they are detected within regions where conditions are known to be favorable for the formation of contrails.
Author Contributions
J.P.H., T.F.R. and A.J.W.; methodology, J.P.H.; software, J.P.H.; validation, J.P.H. formal analysis, J.P.H.; investigation, J.P.H.; resources, J.P.H., T.F.R. and W.F.F.; data curation, J.P.H.; writing—original draft preparation, J.P.H.; writing—review and editing, J.P.H., A.J.W., T.F.R. and W.F.F.; visualization, J.P.H.; supervision, W.F.F.; project administration, W.F.F. and T.F.R.; funding acquisition, T.F.R. and W.F.F. All authors have read and agreed to the published version of the manuscript.
Funding
This research was funded by a contract between Boeing and Space Science and Engineering Center (SSEC), University of Wisconsin-Madison. The funding sponsors had no role in the design of the study; in the collection, analyses, or interpretation of data; in the writing of the manuscript; or in the decision to publish the results.
Data Availability Statement
The U-Net model files, example code, validation masks, and product results used in this paper are available by request.
Acknowledgments
The GOES ABI imagery was provided by the Space Science Engineering Center (SSEC) datacenter and Jerry Robaidek. The contrail validation dataset is available at gs://goes_contrails_dataset, accessed on 25 April 2023.
Conflicts of Interest
The authors declare no conflict of interest.
References
- Schumann, U. On conditions for contrail formation from aircraft exhausts. Meteorol. Z. 1996, 5, 4–23. [Google Scholar] [CrossRef]
- Wilhelm, L.; Gierens, K.; Rohs, S. Meteorological Conditions That Promote Persistent Contrails. Appl. Sci. 2022, 12, 4450. [Google Scholar] [CrossRef]
- Teoh, R.; Schumann, U.; Gryspeerdt, E.; Shapiro, M.; Molloy, J.; Koudis, G.; Voigt, C.; Stettler, M.E.J. Aviation contrail climate effects in the North Atlantic from 2016 to 2021. Atmos. Chem. Phys. 2022, 22, 10919–10935. [Google Scholar] [CrossRef]
- Agarwal, A.; Meijer, V.R.; Eastham, S.D.; Speth, R.L.; Barrett, S.R. Reanalysis-driven simulations may overestimate persistent contrail formation by 100%–250%. Environ. Res. Lett. 2022, 17, 014045. [Google Scholar] [CrossRef]
- Lee, D.S.; Fahey, D.W.; Skowron, A.; Allen, M.R.; Burkhardt, U.; Chen, Q.; Doherty, S.J.; Freeman, S.; Forster, P.M.; Fuglestvedt, J.; et al. The contribution of global aviation to anthropogenic climate forcing for 2000 to 2018. Atmos. Environ. 2021, 244, 117834. [Google Scholar] [CrossRef] [PubMed]
- Gierens, K.; Matthes, S.; Rohs, S. How Well Can Persistent Contrails Be Predicted? Aerospace 2020, 7, 169. [Google Scholar] [CrossRef]
- Schumann, U.; Bugliaro, L.; Dörnbrack, A.; Baumann, R.; Voigt, C. Aviation Contrail Cirrus and Radiative Forcing Over Europe During 6 Months of COVID-19. Geophys. Res. Lett. 2021, 48, e2021GL092771. [Google Scholar] [CrossRef] [PubMed]
- Meijer, V.R.; Kulik, L.; Eastham, S.D.; Allroggen, F.; Speth, R.L.; Karaman, S.; Barrett, S.R. Contrail coverage over the United States before and during the COVID-19 pandemic. Environ. Res. Lett. 2022, 17, 034039. [Google Scholar] [CrossRef]
- Mannstein, H.; Meyer, R.; Wendling, P. Operational detection of contrails from NOAA-AVHRR-data. Int. J. Remote Sens. 1999, 20, 1641–1660. [Google Scholar] [CrossRef]
- Dekoutsidis, G.; Feidas, H.; Bugliaro, L. Contrail detection on SEVIRI images and 1-year study of their physical properties and the atmospheric conditions favoring their formation over Europe. Theor. Appl. Climatol. 2023, 151, 1931–1948. [Google Scholar] [CrossRef]
- Ronneberger, O.; Fischer, P.; Brox, T. U-net: Convolutional networks for biomedical image segmentation. In Medical Image Computing and Computer-Assisted Intervention–MICCAI 2015: 18th International Conference, Munich, Germany, October 5–9, 2015, Proceedings, Part III 18; Springer International Publishing: Berlin/Heidelberg, Germany, 2015; pp. 234–241. [Google Scholar]
- Hoffman, J.P.; Ackerman, S.A.; Liu, Y.; Key, J.R.; McConnell, I.L. Application of a Convolutional Neural Network for the Detection of Sea Ice Leads. Remote Sens. 2021, 13, 4571. [Google Scholar] [CrossRef]
- Hoffman, J.P.; Ackerman, S.A.; Liu, Y.; Key, J.R. A 20-Year Climatology of Sea Ice Leads Detected in Infrared Satellite Imagery Using a Convolutional Neural Network. Remote Sens. 2022, 14, 5763. [Google Scholar] [CrossRef]
- Yuan, T.; Wang, C.; Song, H.; Platnick, S.; Meyer, K.; Oreopoulos, L. Automatically Finding Ship Tracks to Enable Large-Scale Analysis of Aerosol-Cloud Interactions. Geophys. Res. Lett. 2019, 46, 7726–7733. [Google Scholar] [CrossRef]
- Zhang, G.; Zhang, J.; Shang, J. Contrail recognition with convolutional neural network and contrail parameterizations evaluation. SOLA 2018, 14, 132–137. [Google Scholar] [CrossRef]
- Kulik, L. Satellite-Based Detection of Contrails Using Deep Learning; Massachusetts Institute of Technology: Cambridge, MA, USA, 2019. [Google Scholar]
- Siddiqui, N. Atmospheric Contrail Detection with a Deep Learning Algorithm. Sch. Horiz. Univ. Minn. Morris Undergrad. J. 2020, 7, 5. [Google Scholar]
- Ng, J.Y.-H.; McCloskey, K.; Cui, J.; Brand, E.; Sarna, A.; Goyal, N.; Van Arsdale, C.; Geraedts, S. OpenContrails: Benchmarking Contrail Detection on GOES-16 ABI. arXiv 2023, arXiv:2304.02122. [Google Scholar]
- Heidinger, A.K.; Pavolonis, M.J.; Calvert, C.; Hoffman, J.; Nebuda, S.; Straka, W., III; Walther, A.; Wanzong, S. ABI cloud products from the GOES-R series. In The GOES-R Series; Elsevier: Amsterdam, The Netherlands, 2020; pp. 43–62. [Google Scholar]
- McCloskey, K.; Geraedts, S.; Jackman, B.; Meijer, V.R.; Brand, E.; Fork, D.; Platt, J.C.; Elkin, C.; Van Arsdale, C. A human-labeled Landsat-8 contrails dataset. In Proceedings of the ICML 2021 Workshop on Tackling Climate Change with Machine Learning, Virtually, 23–24 July 2021. [Google Scholar]
- Ackerman, S.A.; Smith, W.L.; Revercomb, H.E.; Spinhirne, J.D. The 27–28 October 1986 FIRE IFO Cirrus Case Study: Spectral Properties of Cirrus Clouds in the 8–12 μm Window. Mon. Weather Rev. 1990, 118, 2377–2388. [Google Scholar] [CrossRef]


Disclaimer/Publisher’s Note: The statements, opinions and data contained in all publications are solely those of the individual author(s) and contributor(s) and not of MDPI and/or the editor(s). MDPI and/or the editor(s) disclaim responsibility for any injury to people or property resulting from any ideas, methods, instructions or products referred to in the content. |
© 2023 by the authors. Licensee MDPI, Basel, Switzerland. This article is an open access article distributed under the terms and conditions of the Creative Commons Attribution (CC BY) license (https://creativecommons.org/licenses/by/4.0/).