The Changes in Dominant Driving Factors in the Evolution Process of Wetland in the Yellow River Delta during 2015–2022
Abstract
:1. Introduction
2. Materials and Methods
2.1. Study Area
2.2. Data Source and Preprocessing
2.2.1. Wetland of the YRD during 2015–2022
| First Classification | Second Classification | Description [44] |
|---|---|---|
| Natural wetland | Shallow sea | Permanent waters with a depth of less than 6 m at low tide. |
| River | A regular or periodic natural channel concentrated in a surface groove under the action of gravity. | |
| Mud flat | A shallow beach formed by seawater handling and shelving. | |
| Swamp | Low-lying water, weedy large mud area. | |
| Artificial wetland | Paddy field | Land that can hold water regularly and can be used to grow aquatic crops such as rice. |
| Salt pans | Sites for salt production via the evaporation method. | |
| Reservoirs and pond | Land with a water storage capacity of less than 100,000 cubic meters (excluding aquaculture water), excavated or naturally formed, below the normal water level of a pond. | |
| Non-wetland | Dryland | Cultivated land with water saving irrigation, development of dry or drought-resistant crops, maximum water storage and maximum water use efficiency. |
| Woodland | Patches of land covered by natural, secondary, and planted forests. | |
| Construction land | Land for building buildings and structures. | |
| Unused land | Unexploited land, including land that is difficult to use. |
2.2.2. Driving Factor Data
2.3. Methods
2.3.1. Dynamic Degrees of the Wetland
2.3.2. GeoDetector
3. Results
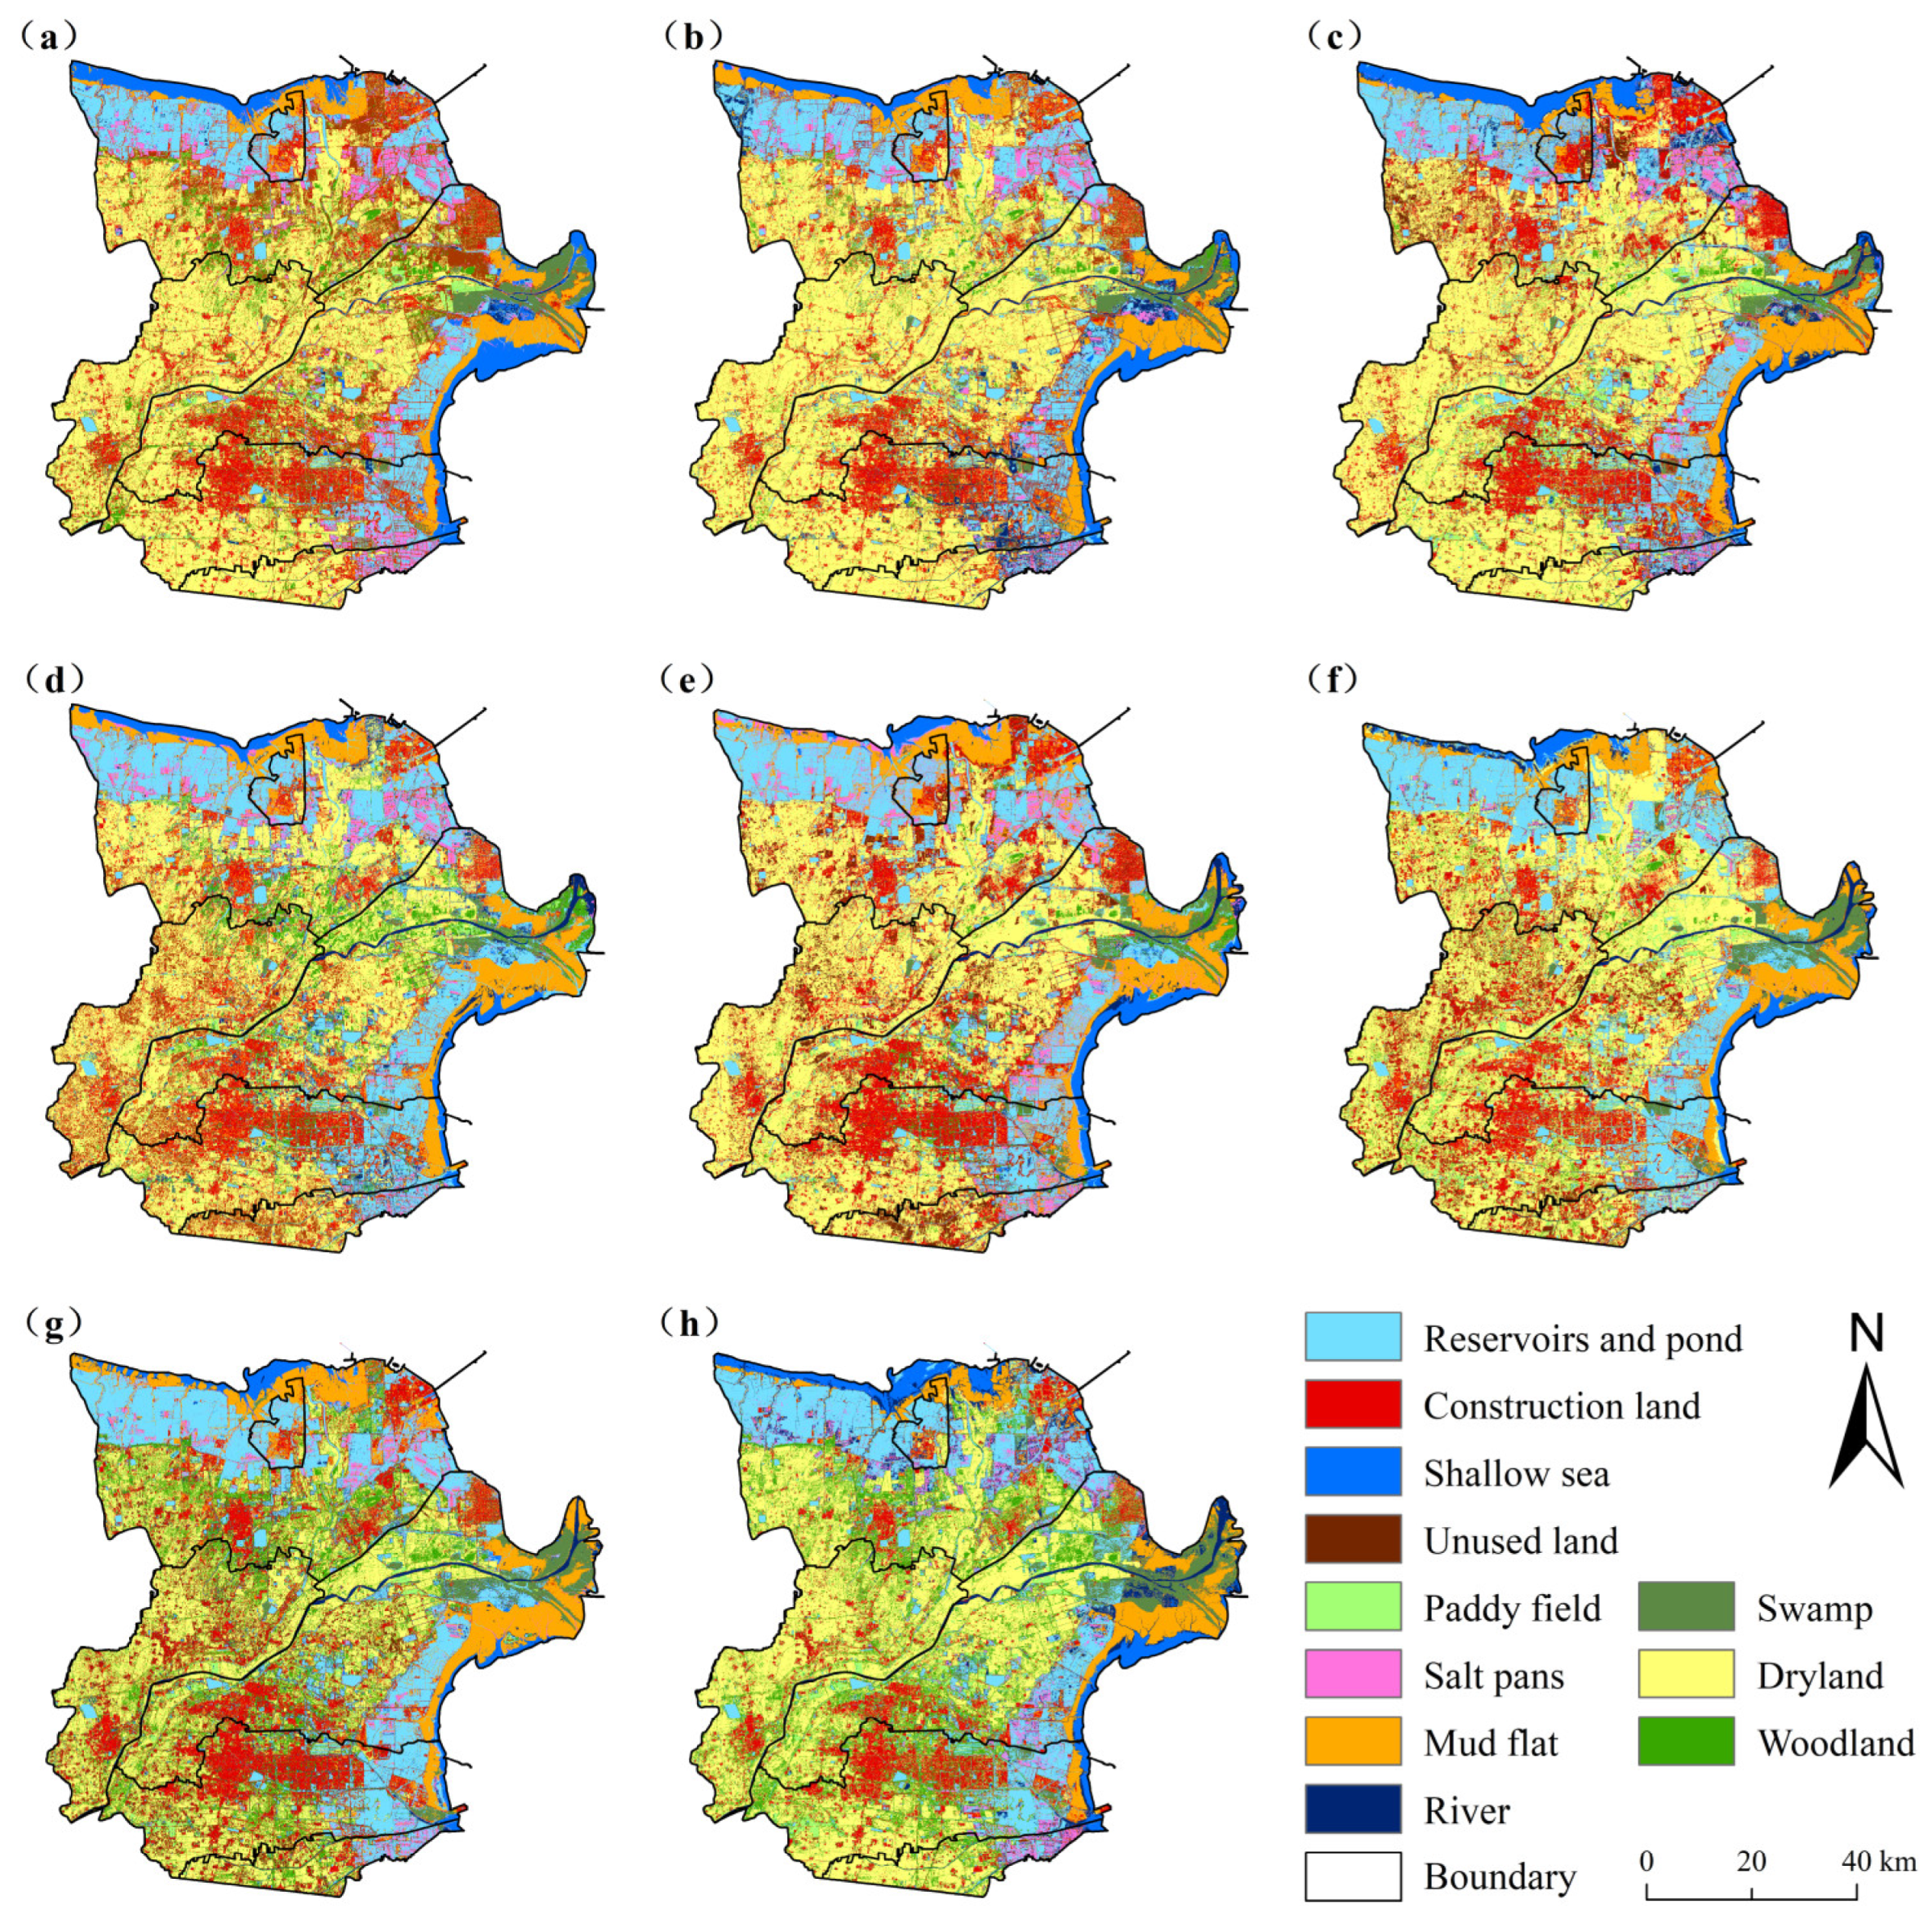
3.1. Spatio-Temporal Distributions of Wetland in the YRD
3.1.1. Spatial Distribution of Wetland in the YRD
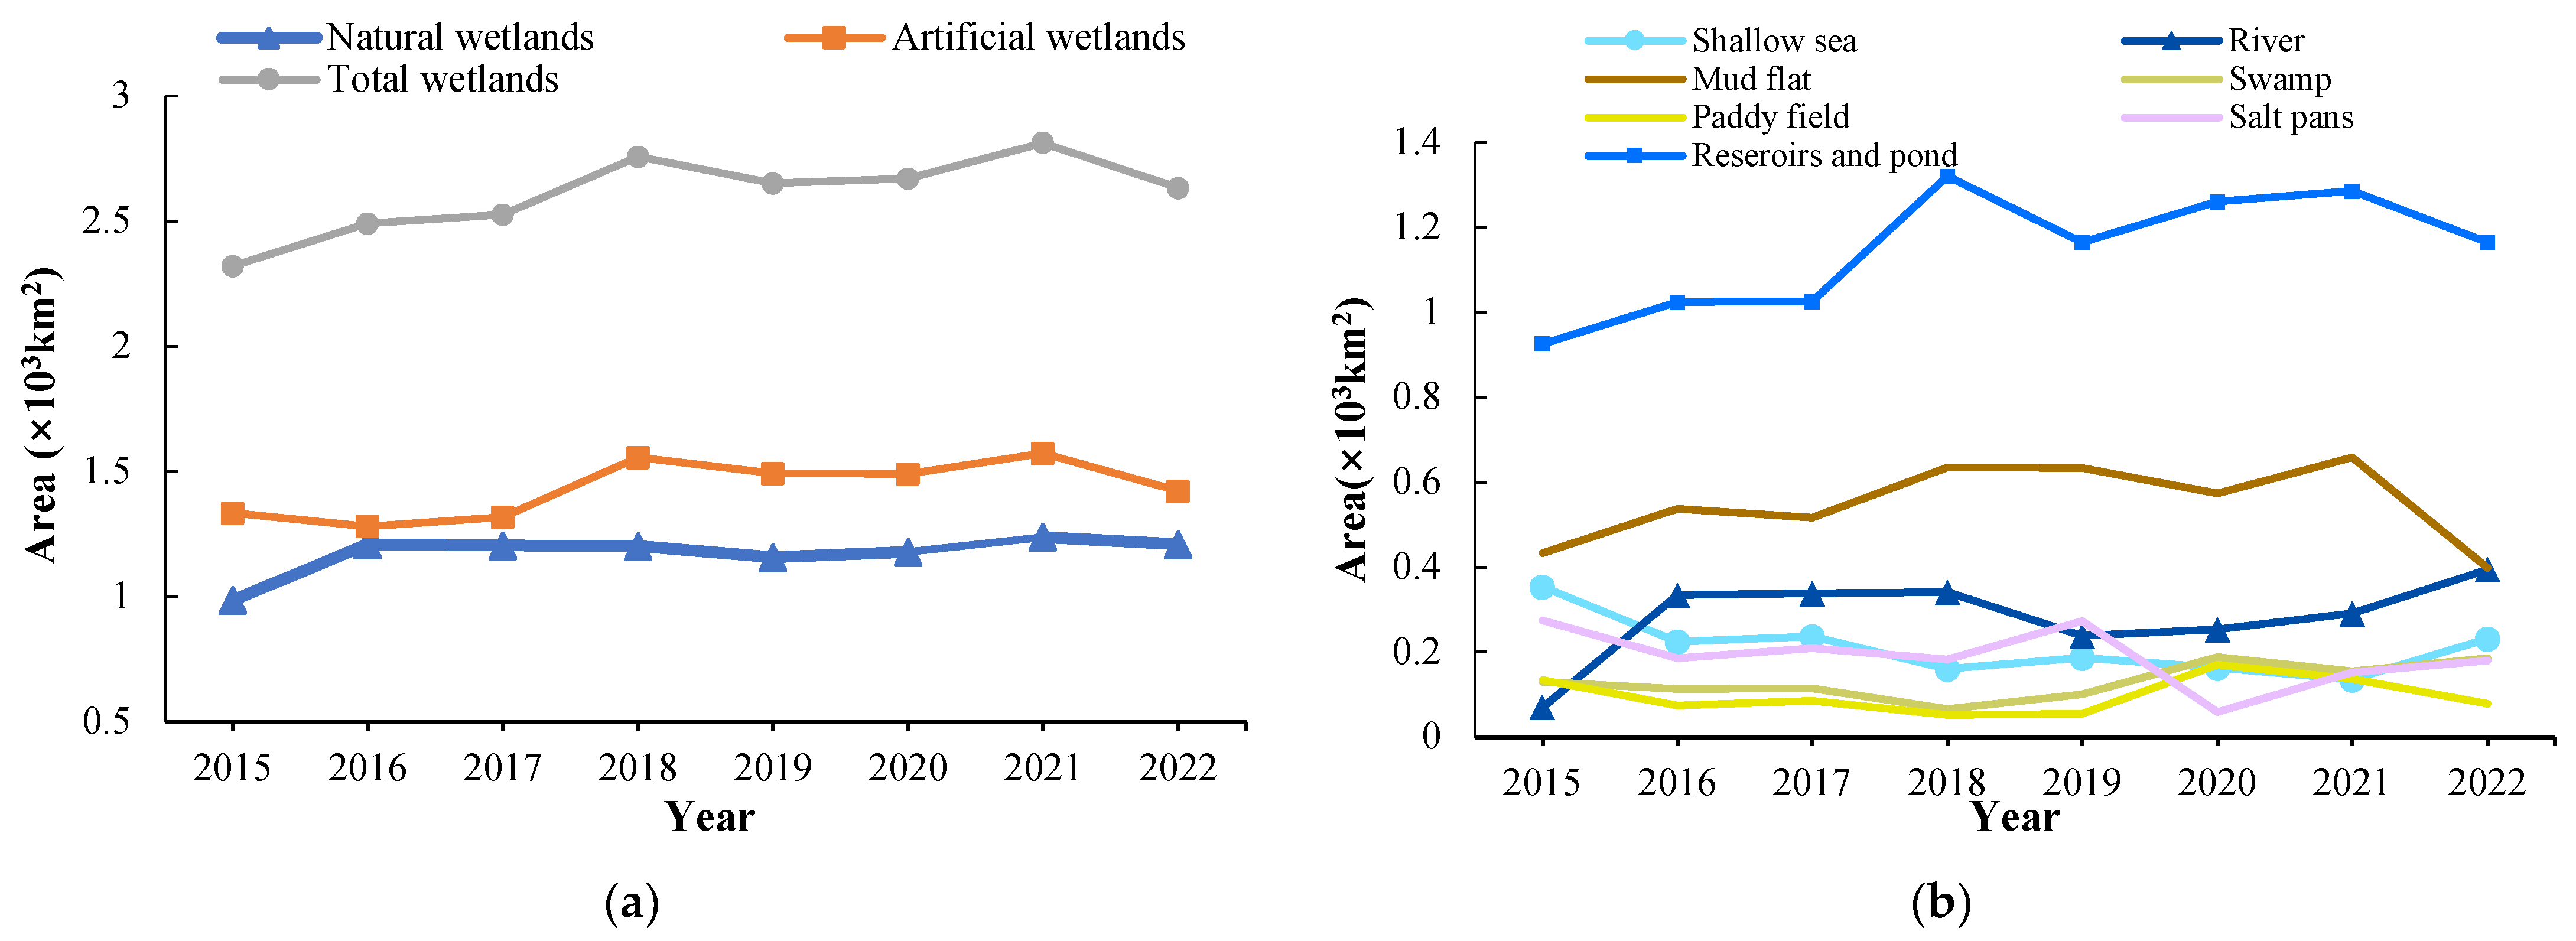
3.1.2. Change Characteristics of Wetland in the YRD
3.2. Change Characteristics of Wetland Types in the YRD
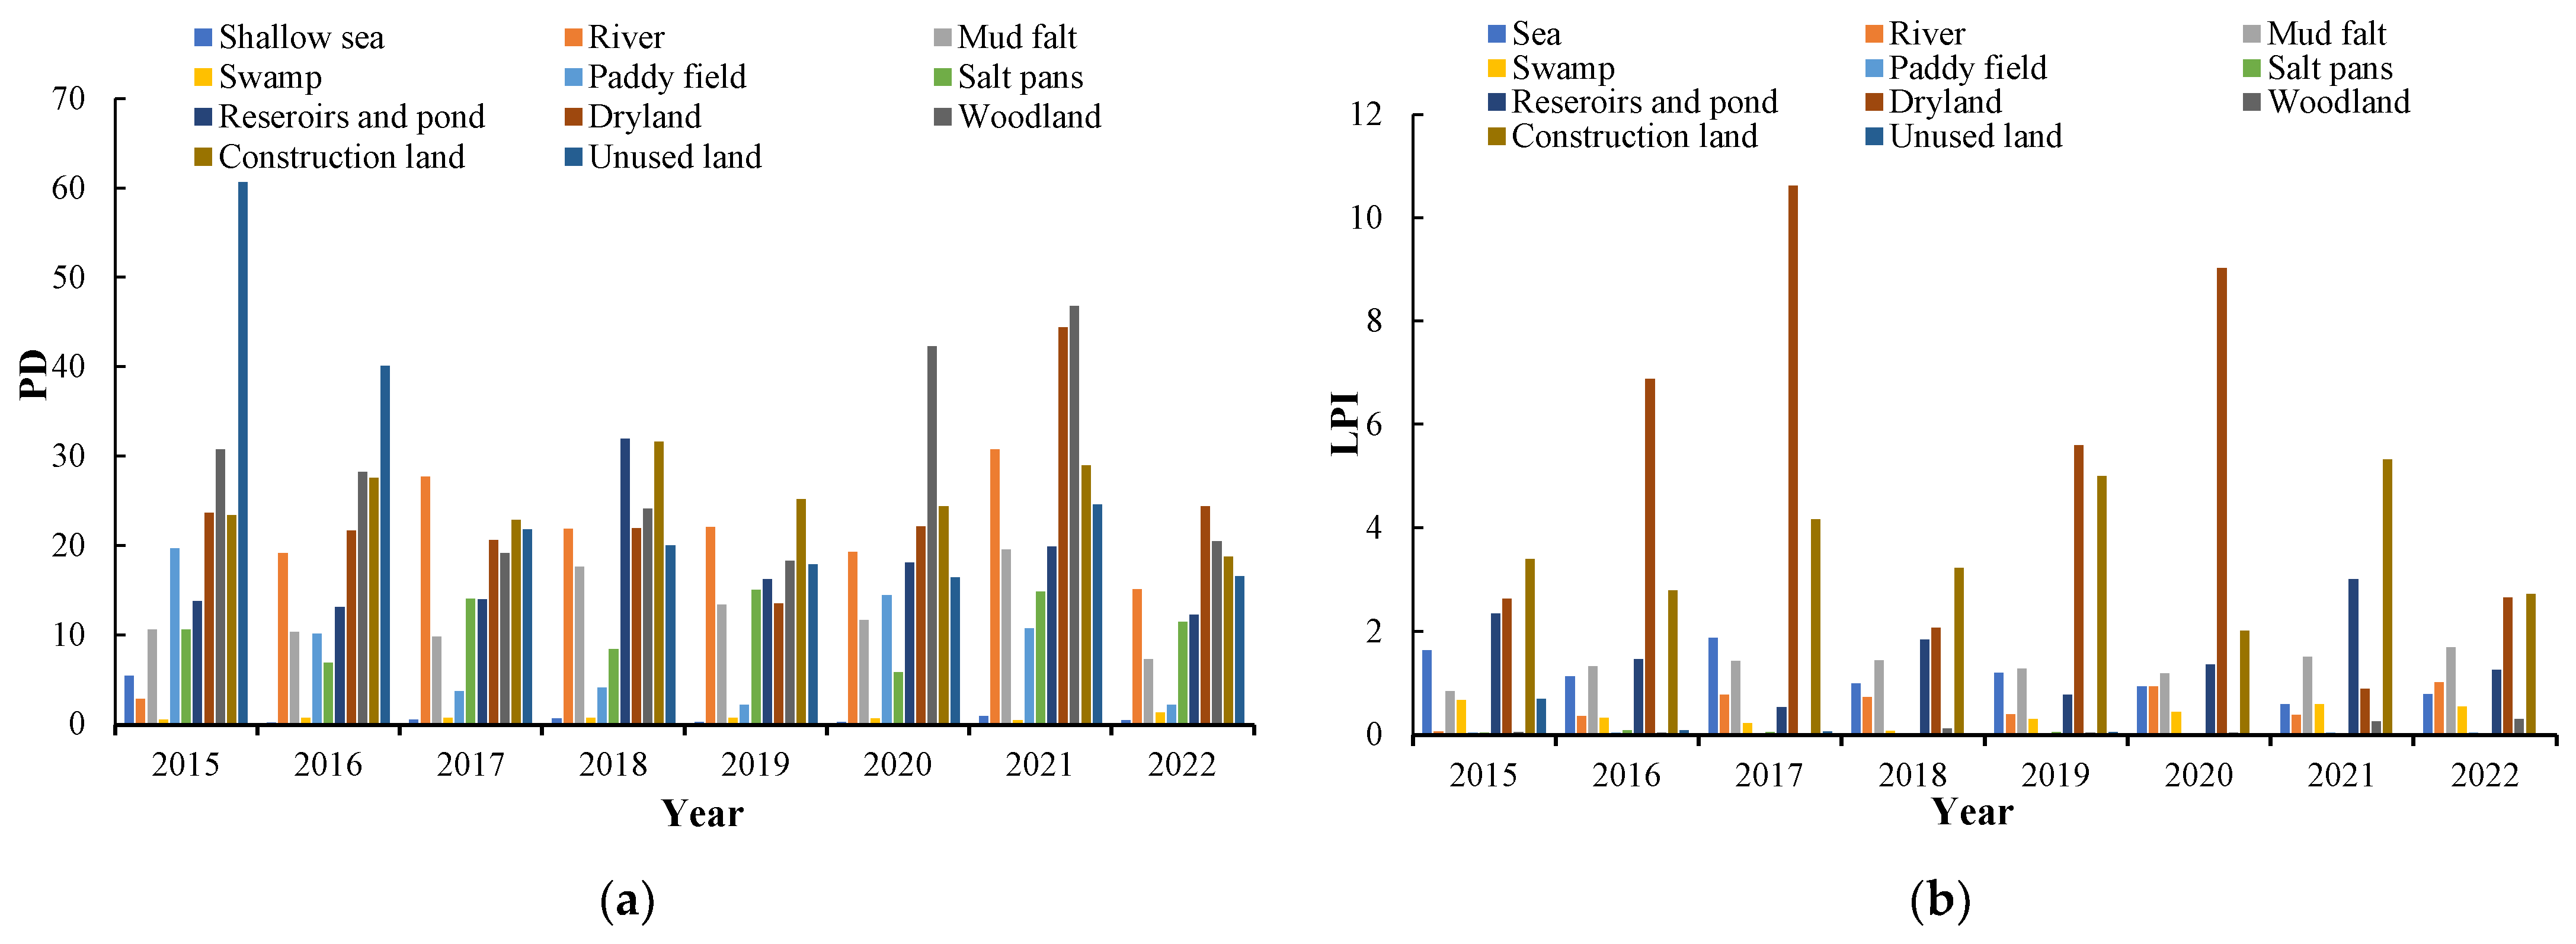
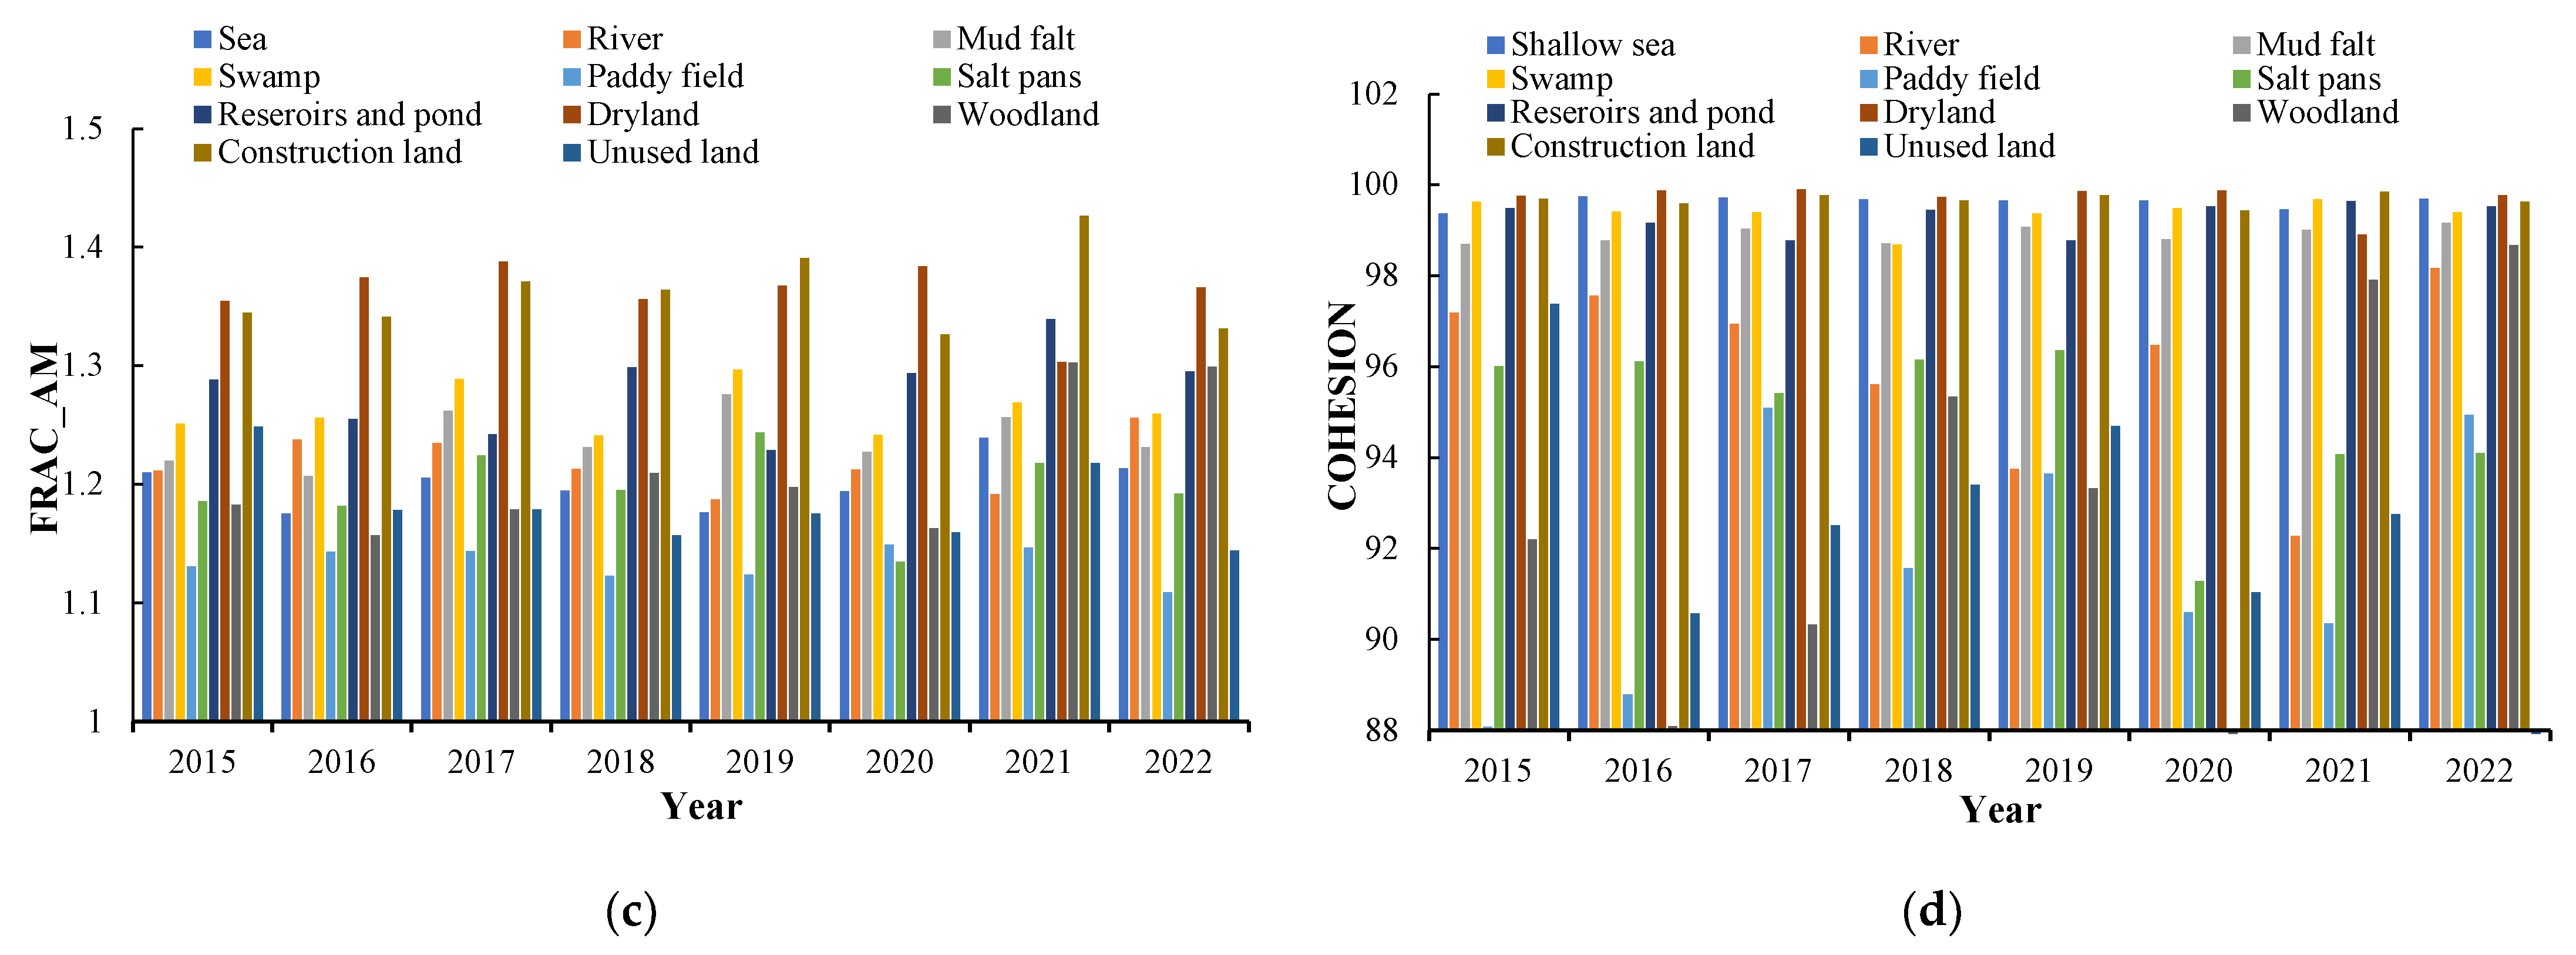
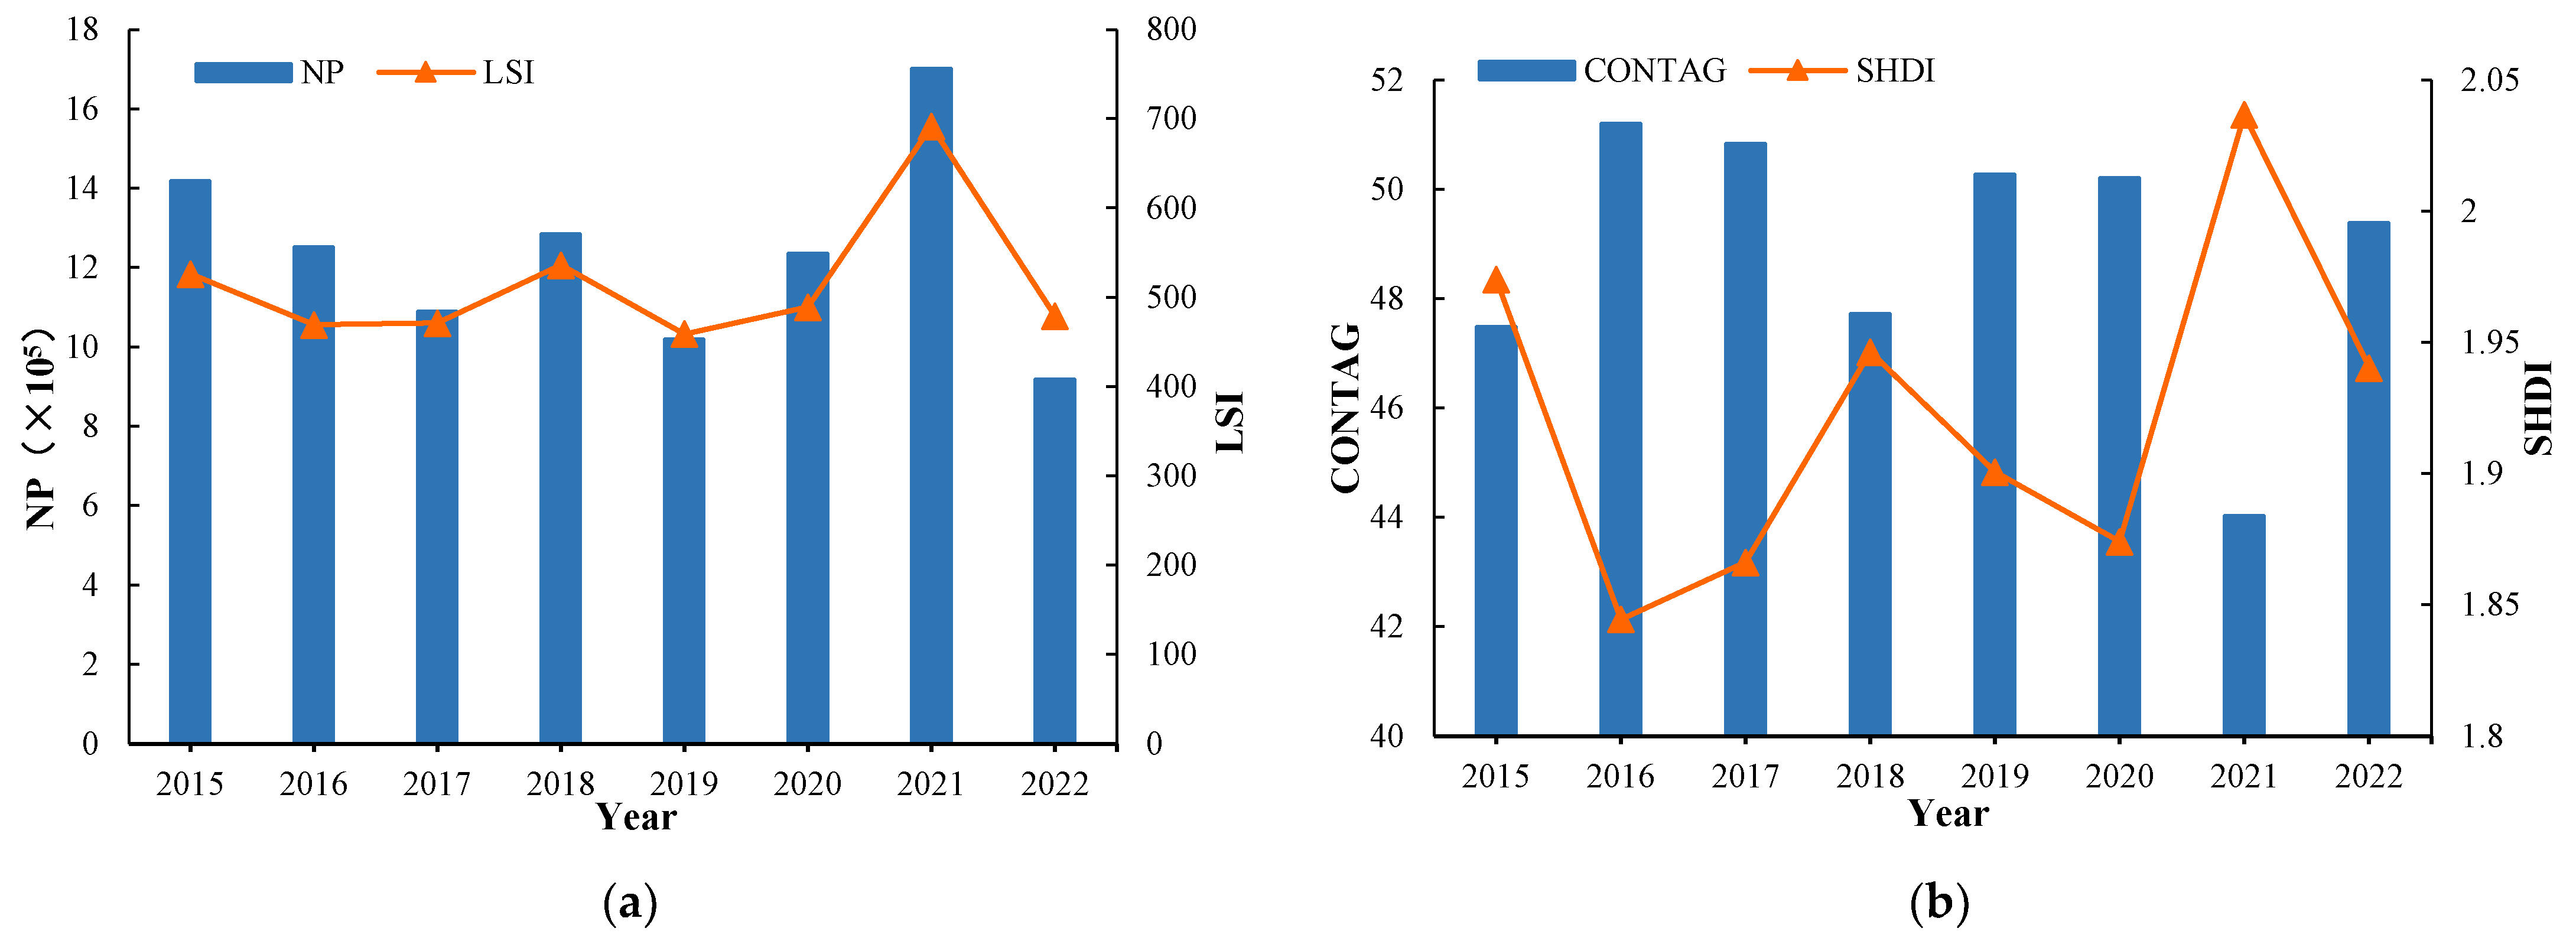
3.3. Changes in Wetland Landscape Pattern Index in the YRD
3.4. The Role of Natural Factors in Driving Wetland Change
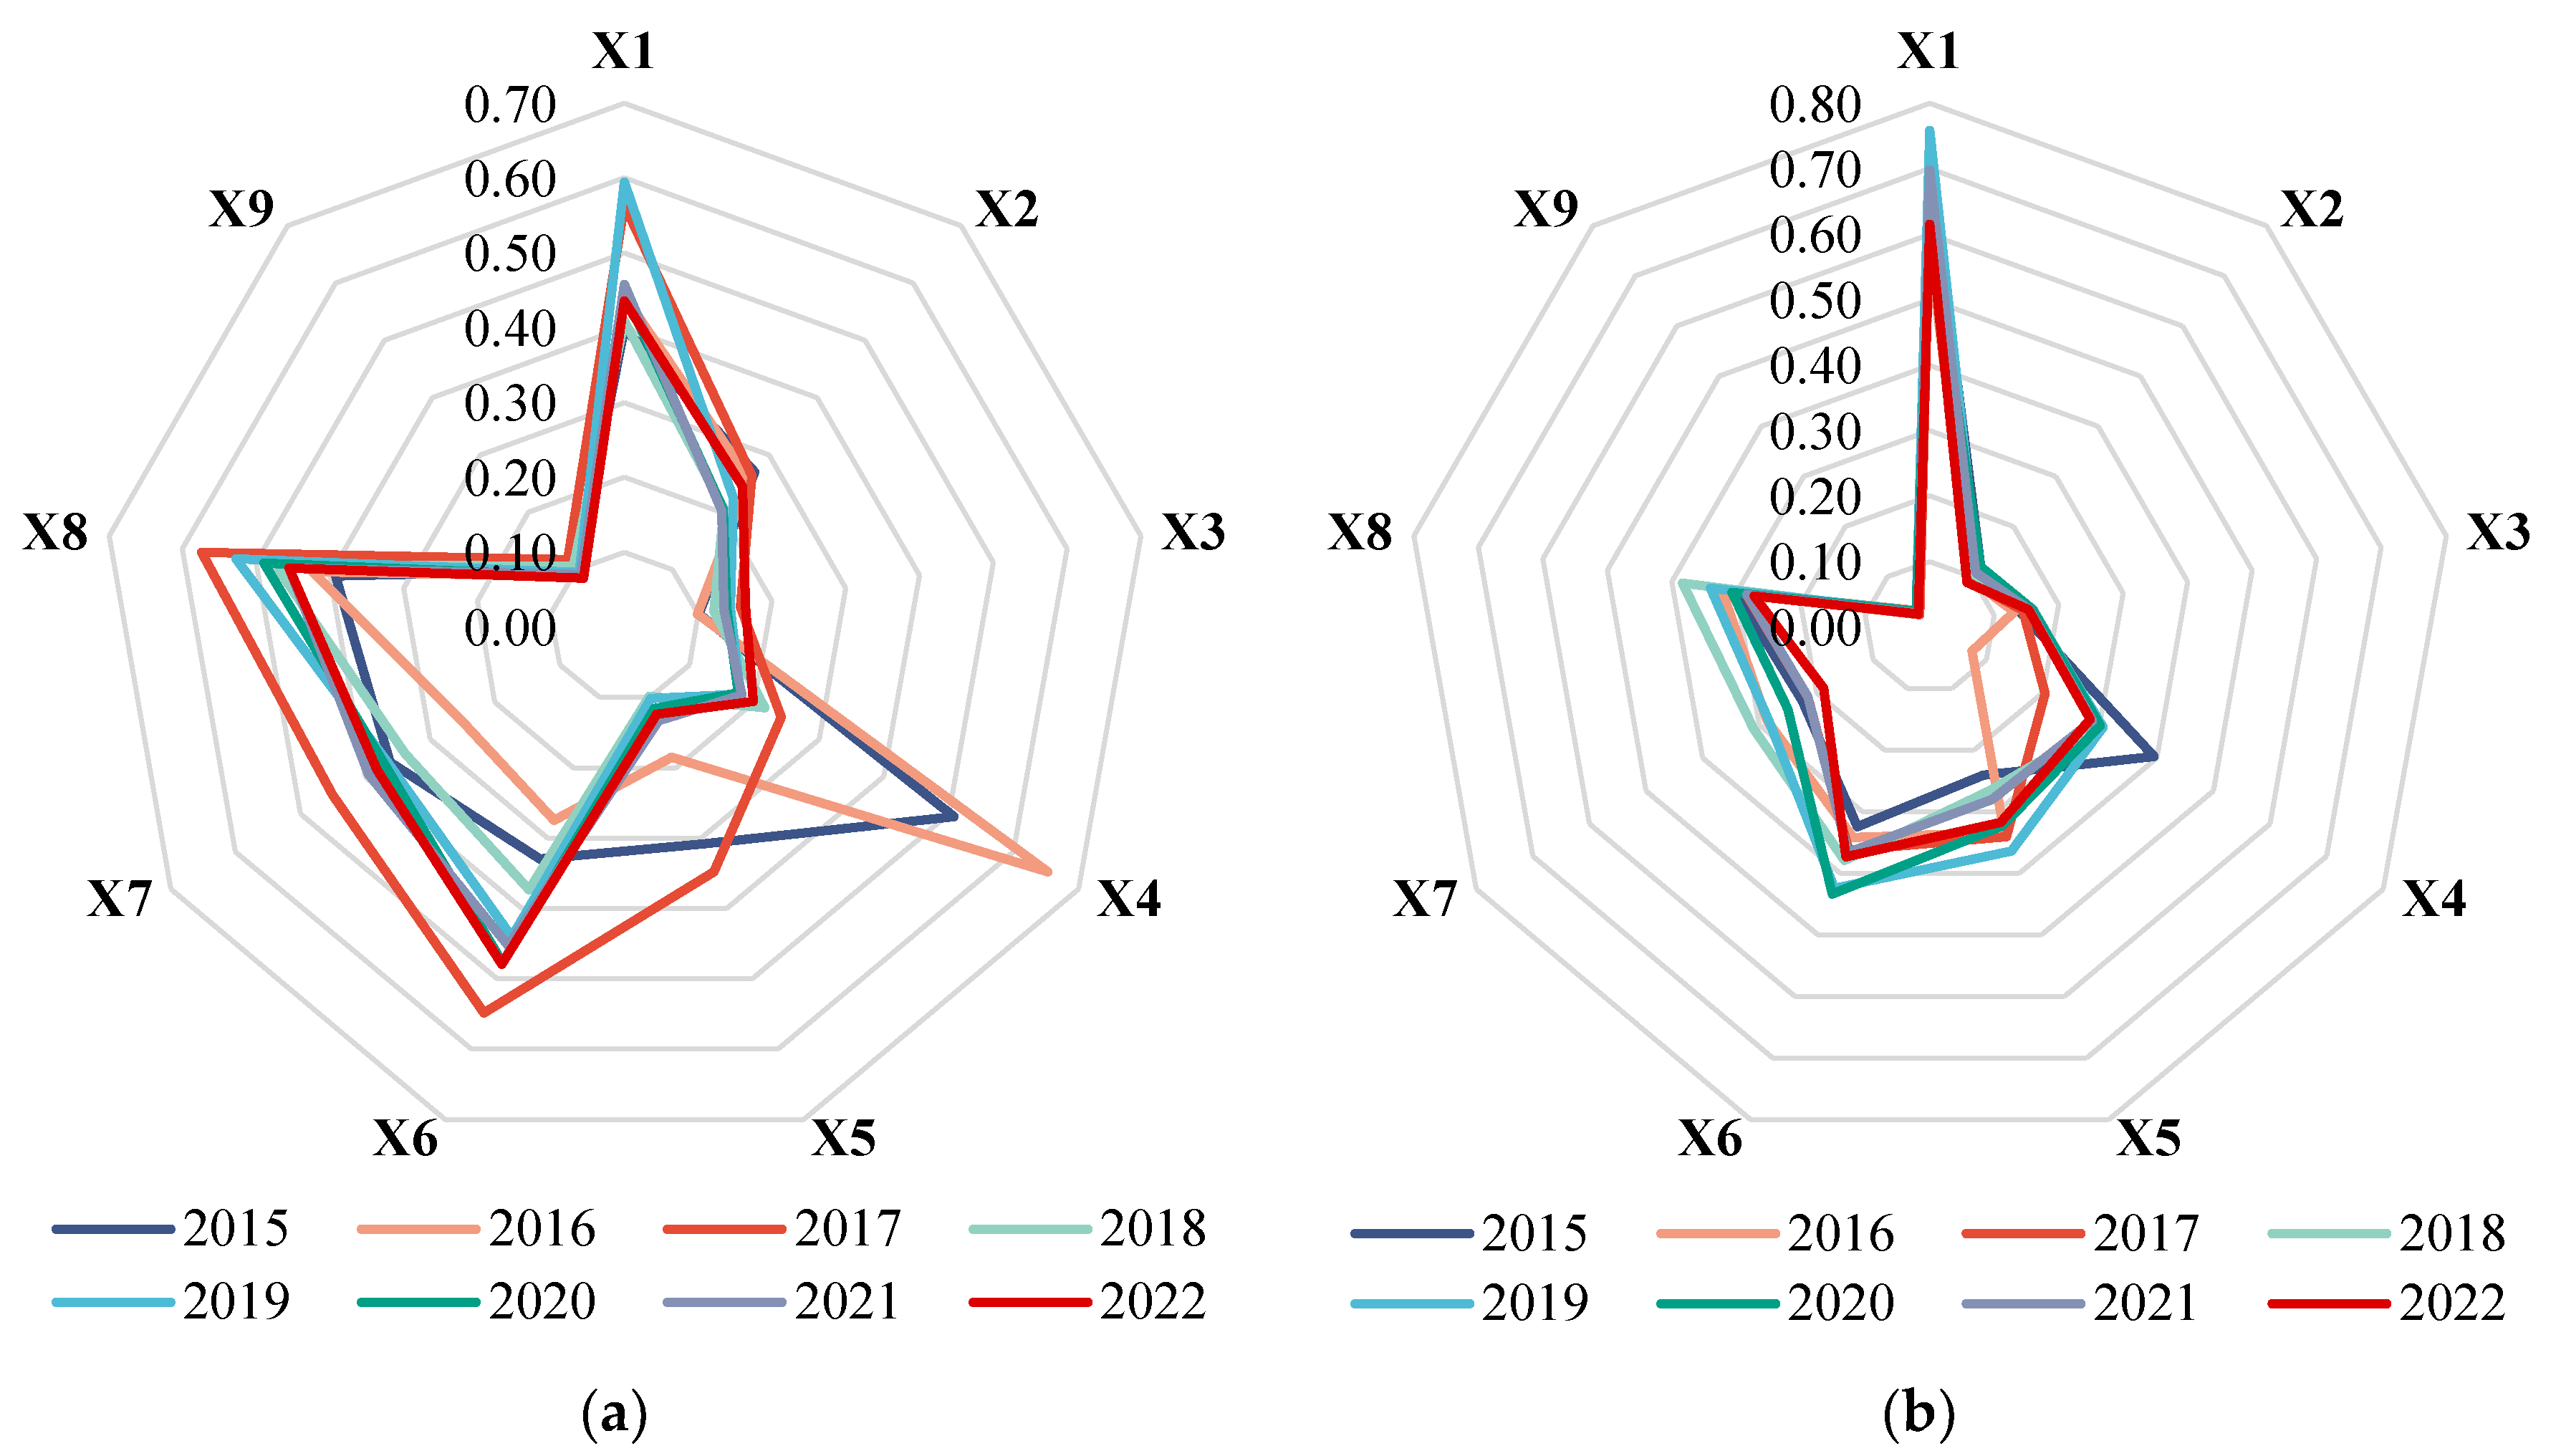
3.5. Dominant Single Driving Factors of Wetland Change
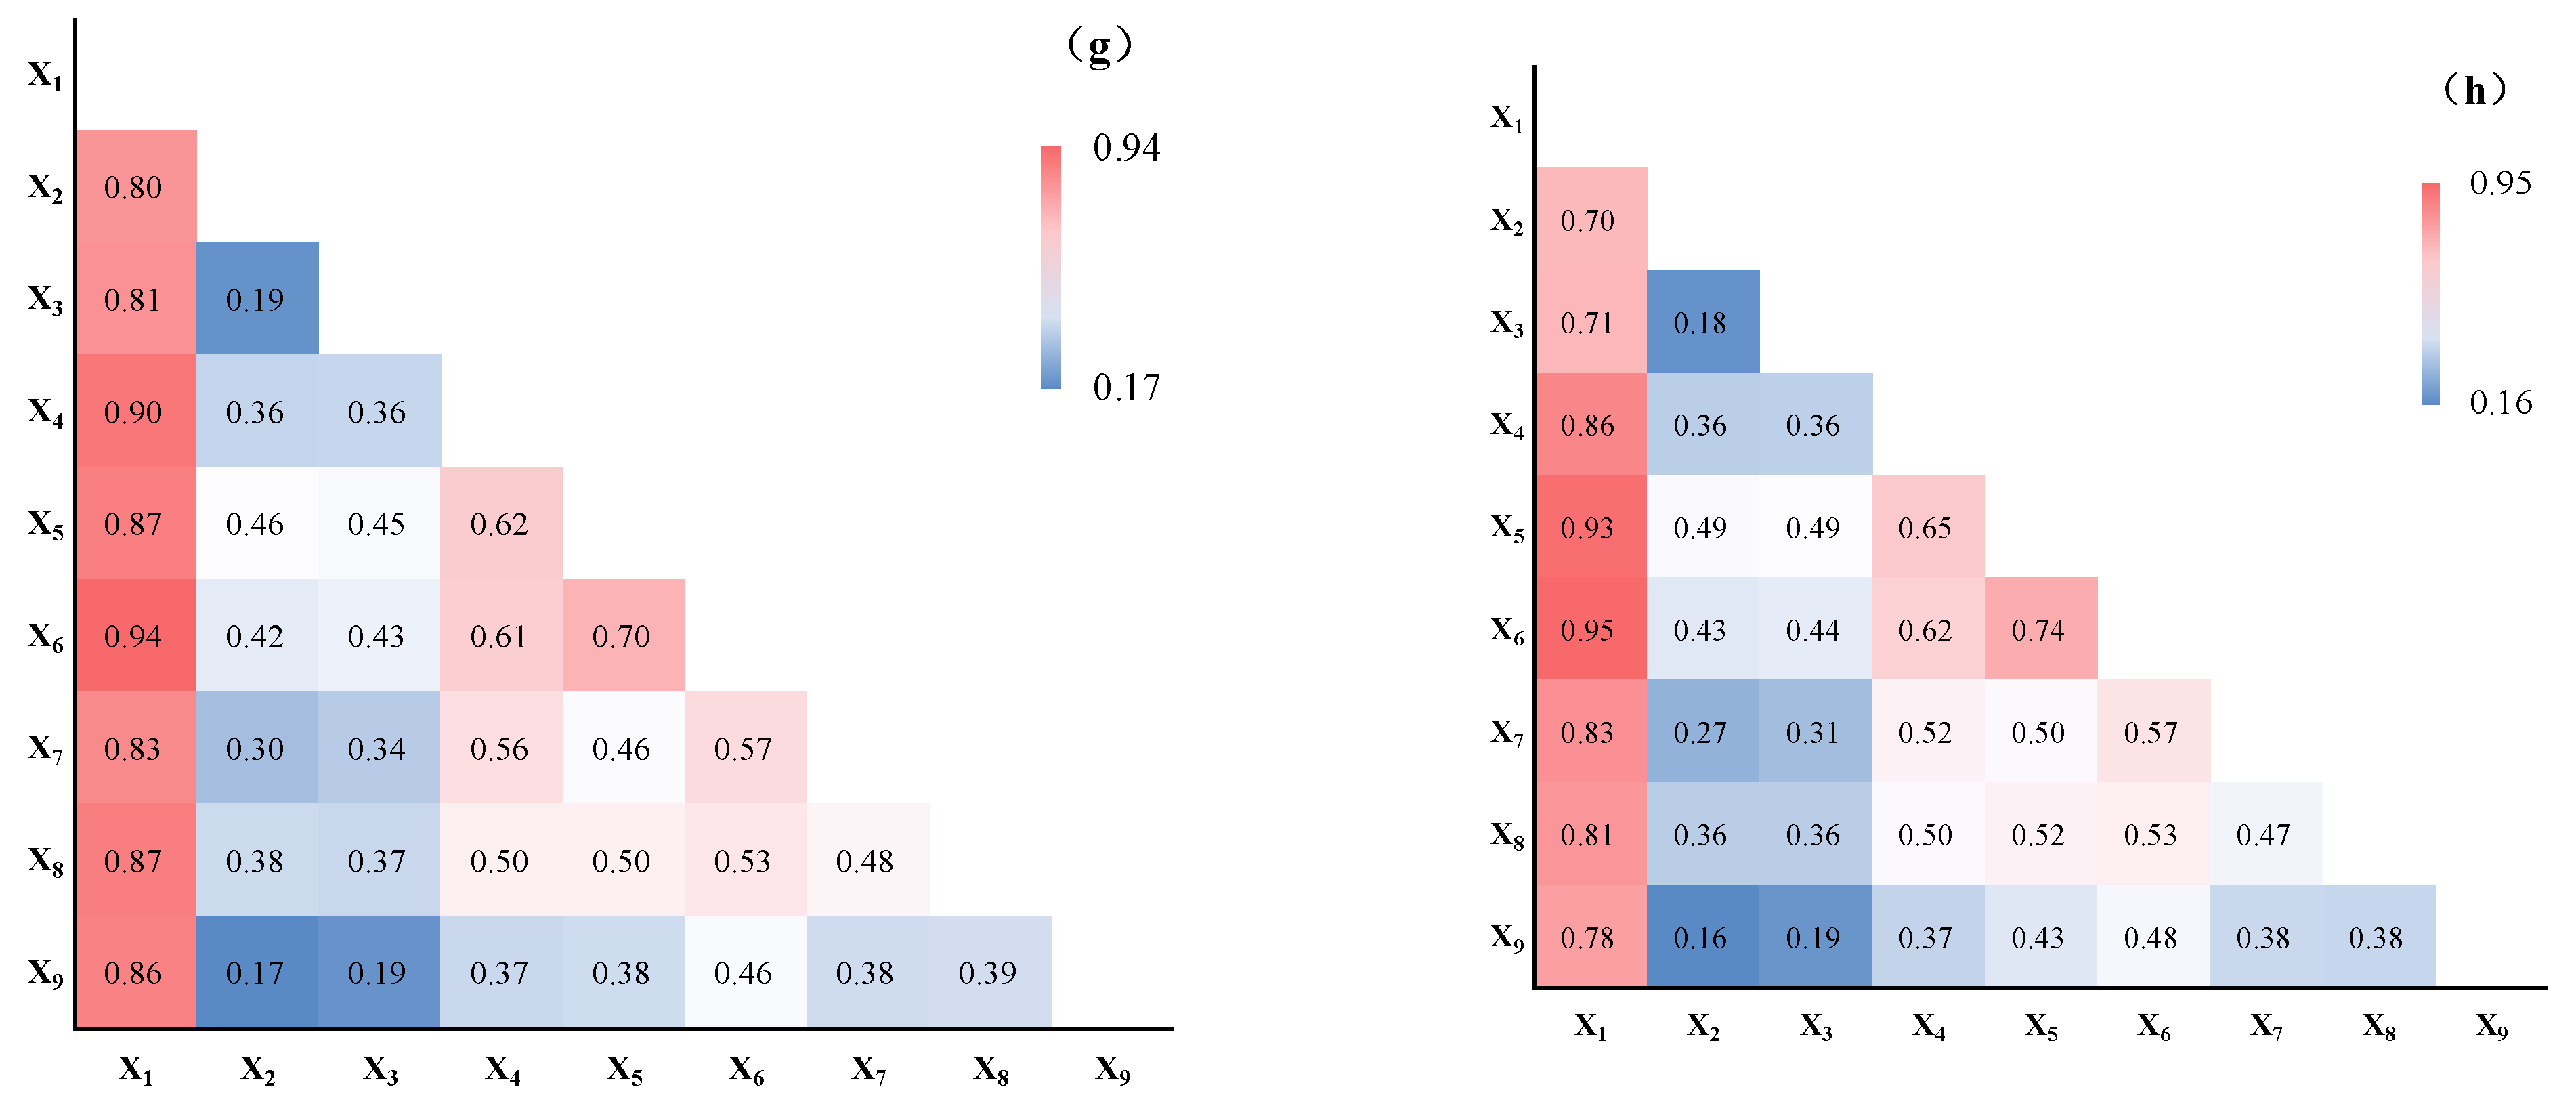
3.6. Dominant Interactive Driving Factors of Wetland Change
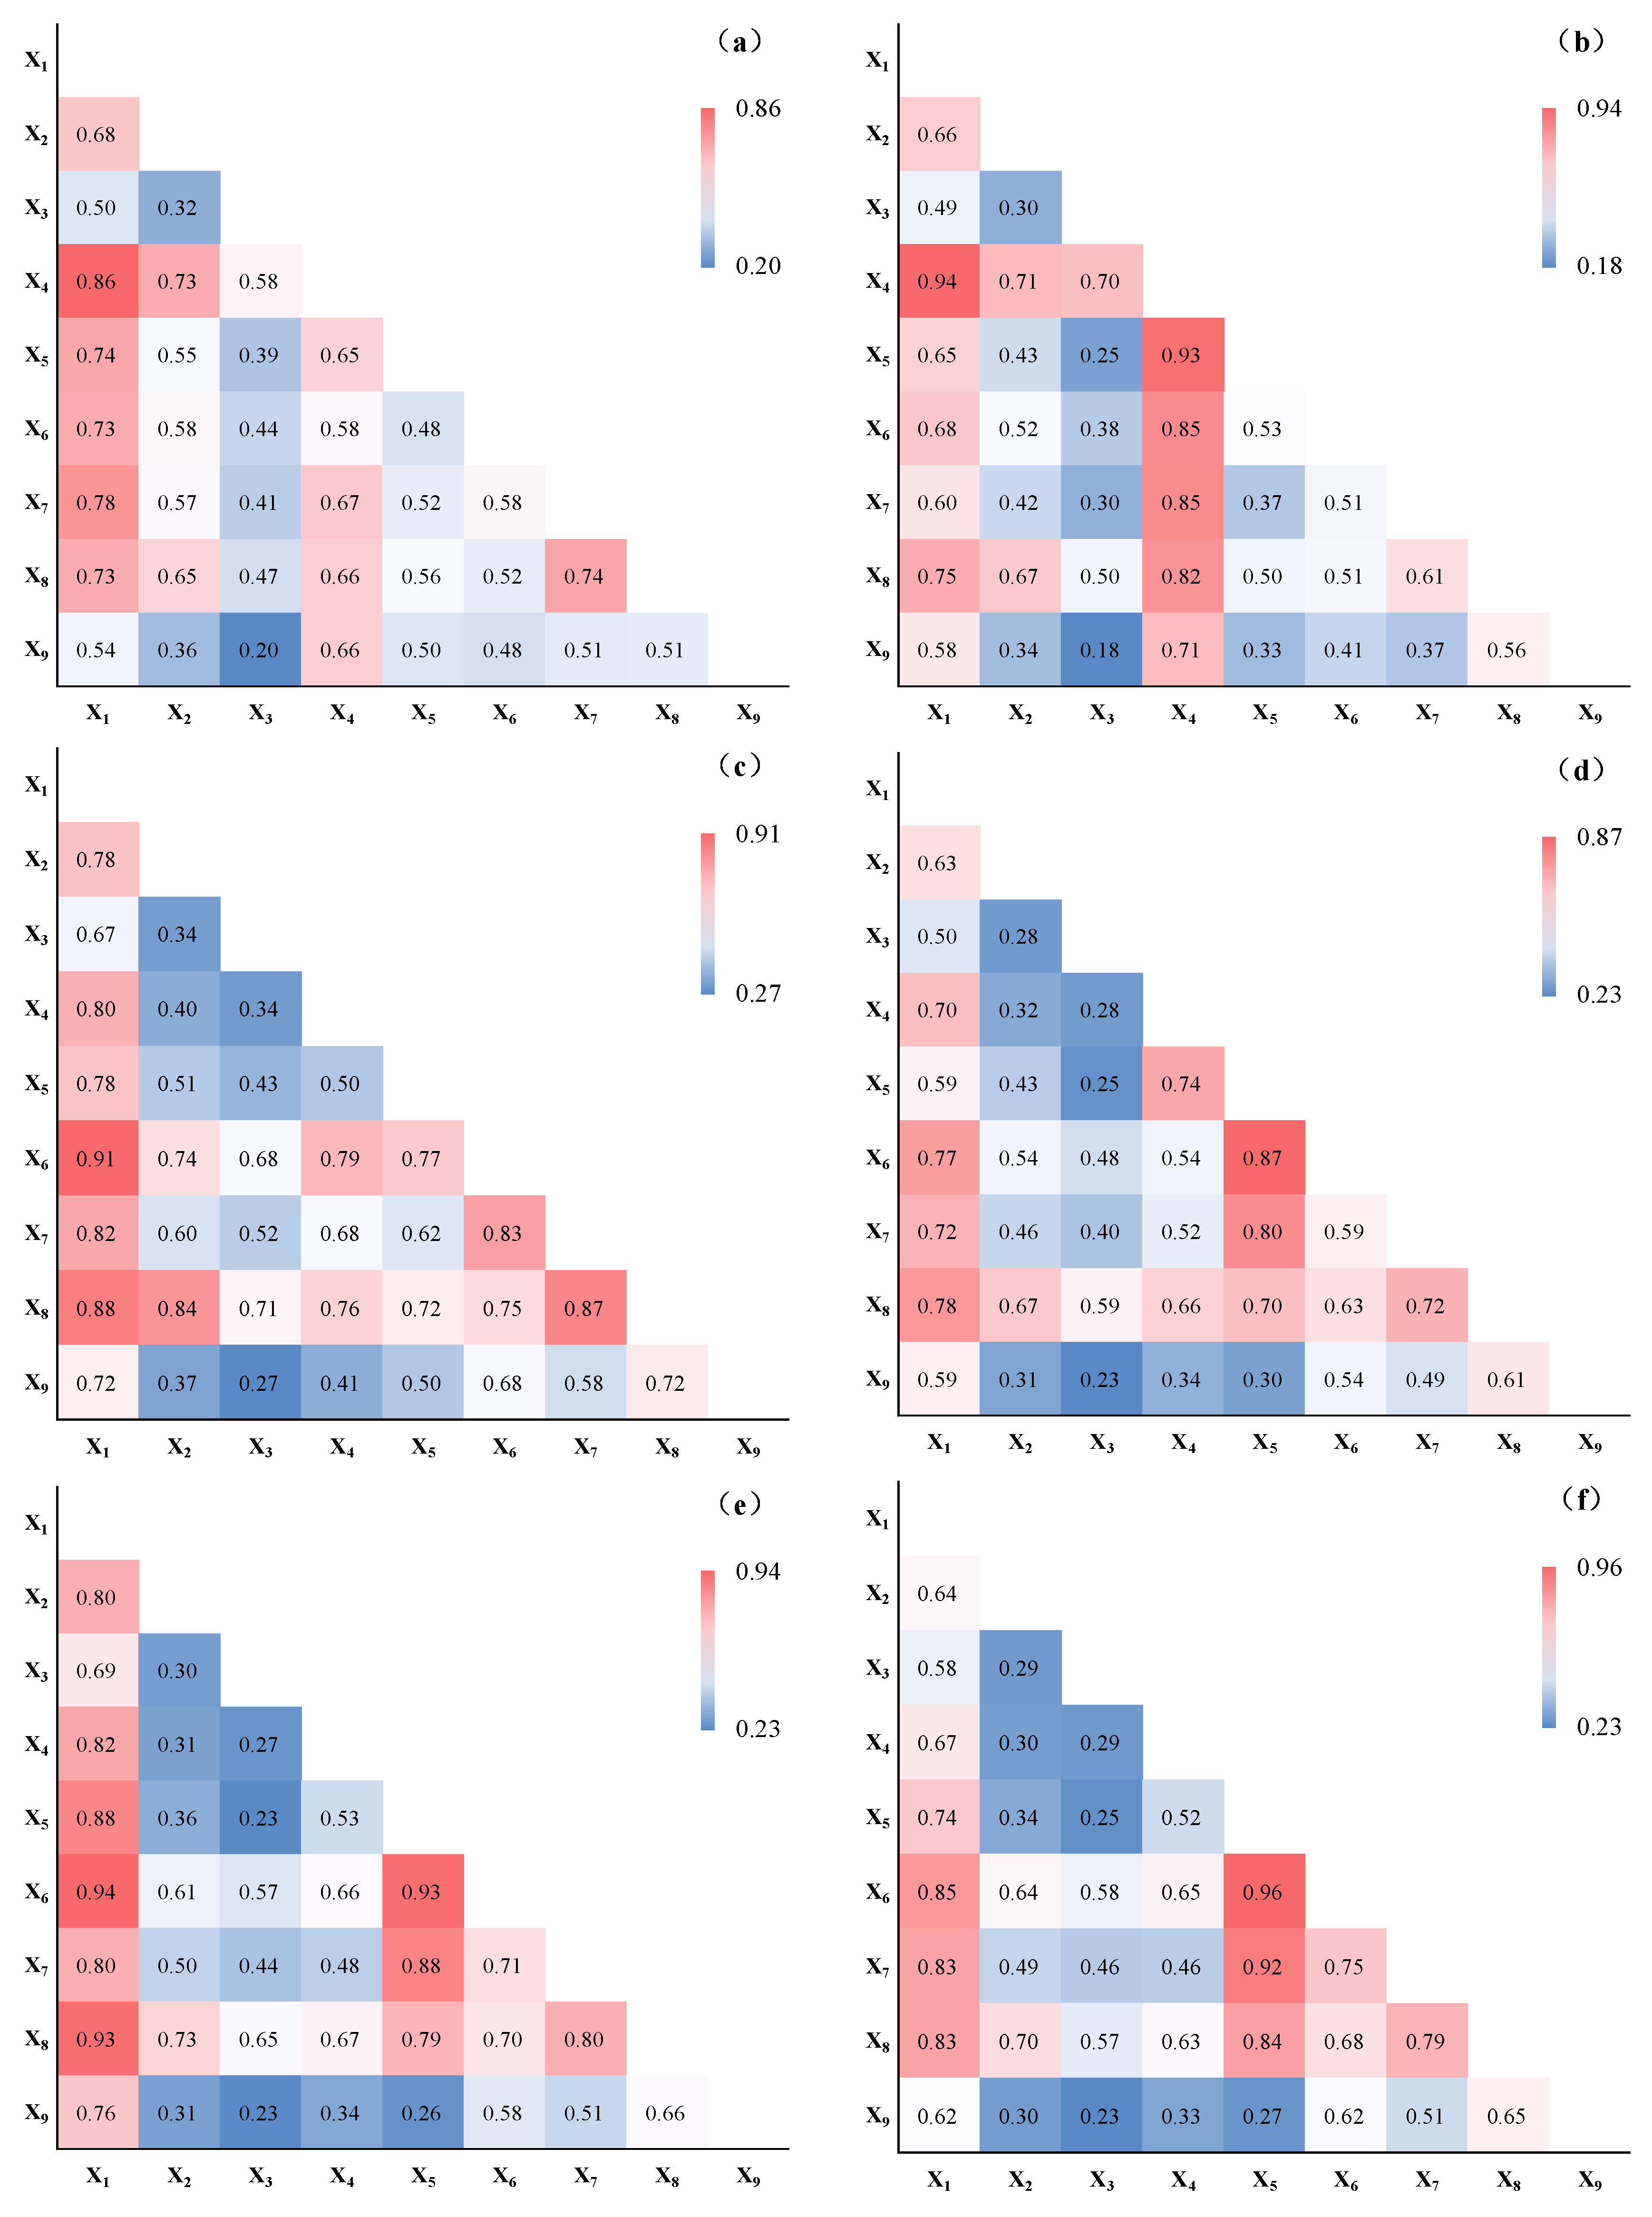
3.6.1. Natural Wetland
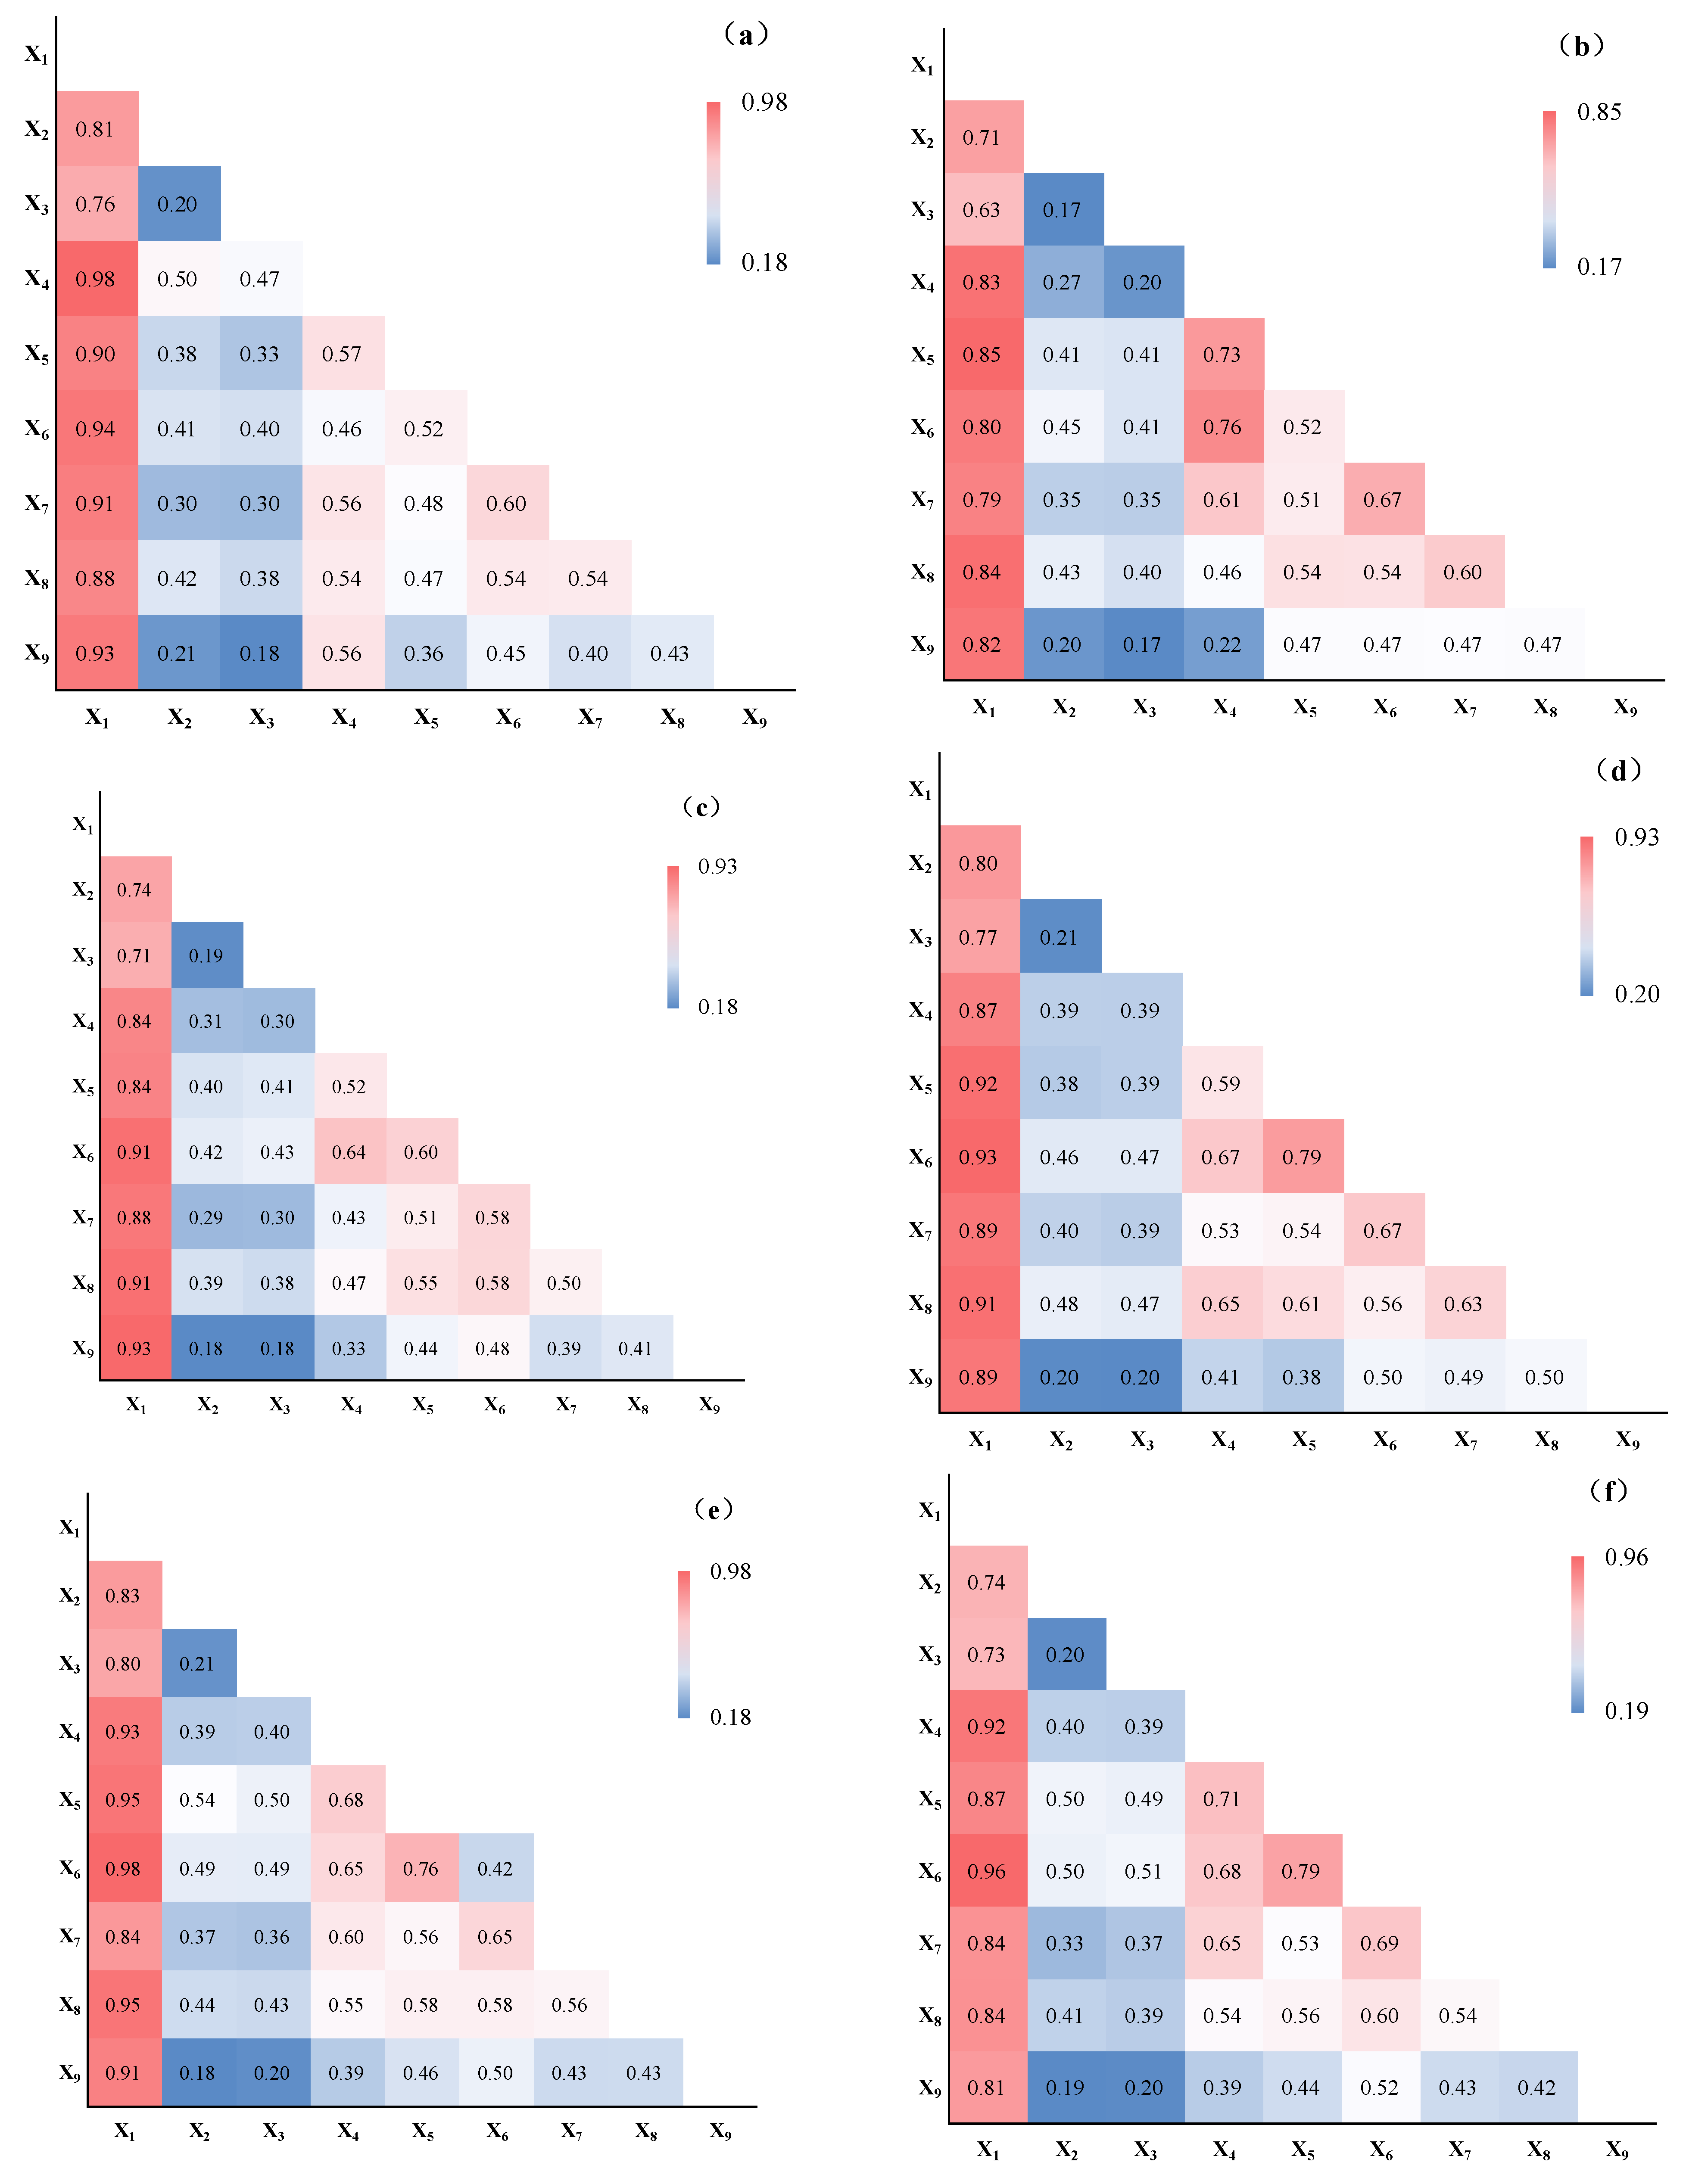
3.6.2. Artificial Wetland
4. Discussion
4.1. Reasons for the Spatio-Temporal Change Patterns of the Wetland
4.2. Reasons for the Changes in the Dominant Factors of the Wetland
4.3. Suggestions for the Protection and Development of Wetlands in the YRD Based on the Results
4.4. The Uncertainty of Dominant Driving Factors in the Evolution Process of the Wetland in the YRD
5. Conclusions
Author Contributions
Funding
Data Availability Statement
Conflicts of Interest
Appendix A
| Topic | Development | Reference |
| Wetland ecological function evaluation | The existence of wetlands may influence arsenic concentrations in adjacent shallow groundwater. | [8] |
| Using Euclidean distance theory, 13 indicators were selected from four aspects: water, soil, biology, and society, and an assessment system of wetland ecosystem was constructed to evaluate the ecosystem health. | [9] | |
| Analysis of wetland ecosystem evolution mechanisms | A study of the spatial pattern of salinity distribution in the estuarine wetlands of the YRD and the dynamic boundary of the freshwater–saltwater interaction zone (FSIZ) proposed a method to determine a dynamic boundary of the FSIZ of estuary wetland. | [11] |
| The spatial and temporal evolution of human activity intensity in the YRD over the past 30 years was analyzed by using the construction land equivalent coefficient method and spatial autocorrelation analysis, and the main drivers of spatial variation in human activity intensity at different scales were explored. | [12] | |
| Using coupled coordination models, manual classification, and spatial autocorrelation analysis, the dynamic evolutionary characteristics of human–environment coordination in the Yellow River Delta over the past 30 years were studied. | [13] | |
| The landscape pattern index analysis method was applied to study the trend of wetland landscape pattern evolution and to explore the change in wetland landscape spatial location by combining it with the center-of-mass model. | [14] | |
| The commonly used landscape connectivity assessment models, namely the minimum depletion distance model and the circuit theory model, were integrated, and two different resistance surface assignment schemes were adopted to assess the landscape connectivity of wetlands in the Yellow River Delta according to the general paradigm of ecological network construction, and the basic principles, working performance, and analysis scales of the two models were compared and analyzed. | [29] | |
| Object-oriented and visual interpretation classification methods were used to extract the wetland information of the Yellow River Delta. At the same time, the spatial analysis, dynamic attitude model, and non-equally spaced sequential gray model were used to analyze the spatial and temporal variability of wetlands, and the driving factors of wetland changes were discussed with the related literature. | [31] | |
| Analysis of the mechanisms driving the evolution of wetland ecosystems | We investigated the composition of soil microbial communities, inter-root microorganisms, environmental factors, and their intrinsic correlation and influence mechanisms by collecting surface soil and some plant roots from representative vegetation communities in the coastal wetlands of the Yellow River Delta. | [15] |
| The visual interpretation method was used to obtain the relevant data information of the artificial wetland, and the change rate, spatial quality center, and landscape index of the artificial wetland quantitatively and qualitatively analyzed the main driving factors with the technical means of GIS, RS, and ENVI. | [16] | |
| The object-oriented classification method was used to extract the information of natural wetlands in the Yellow River Delta; the Markov transfer matrix, grid cell method, and Geodetector method were used to analyze the spatial and temporal distribution dynamics and driving factors of natural wetlands in the Yellow River Delta. | [17] | |
| The spatial and temporal distribution dynamics and drivers of natural wetlands in the Yellow River Delta were analyzed using the Markov transfer matrix, grid cell method, and Geodetector method. | [18] | |
| Erosion of the salt flats driver, salt flats and harbor driver, farm pond driver, and natural factors driver reduced tidal wetlands. While sedimentation of the natural factors driver increased tidal wetlands, there was no clear trend of regular change in the area added by all drivers. | [33] | |
| The length of artificial ditches in the Yellow River Delta showed a significant linear correlation with farmland area (p < 0.05), a good logarithmic relationship with farm pond area (p < 0.0001), and a highly significant linear relationship with road length (p < 0.0001). The results of multiple regression analysis showed that the synergistic effect of farmland area and road length on the length of artificial ditches reached 99.9% (p < 0.0001). | [34] | |
| Wetland protection and restoration | Water yield was chosen as an indicator of water conservation to explore the impact of the ER project by using the water yield module of the Integrated Valuation of Ecosystem Services and Tradeoffs (InVEST) model. | [10] |
| To understand the effectiveness of the restoration strategies implemented in the Xinqiang River National Wetland Park in China, four ecological restoration models were studied, namely protection and conservation (PC), rational use (RU), restoration and rehabilitation (RR), and constructed wetland (CW). | [19] | |
| The estimation of wetland biomass | With the fundamental goal of assessing soil quality, we intended to assemble a series of soil quality indicators to characterize the Soil Quality Index (SQI). Principal component analysis (PCA) of the minimum data set (MDS) was used to determine the SQI. | [20] |
| The annual total amount of emission and sequestration in wetlands of varying types was estimated along with the seasonal variation. | [21] |
Appendix B
| Data | Task ID | Relative Orbit Number | Splicing Domain Number |
|---|---|---|---|
| 13 September 2015 | S2A | R032 | T50SNG |
| 13 September 2015 | S2A | R032 | T50SNH |
| 13 September 2015 | S2A | R032 | T50SPG |
| 13 September 2015 | S2A | R032 | T50SPH |
| 14 October 2016 | S2A | R132 | T50SNG |
| 14 October 2016 | S2A | R132 | T50SPG |
| 14 October 2016 | S2A | R132 | T50SPH |
| 17 October 2016 | S2A | R032 | T50SNH |
| 22 September 2017 | S2A | R032 | T50SNG |
| 12 September 2017 | S2A | R032 | T50SNH |
| 11 July 2017 | S2A | R132 | T50SPG |
| 29 September 2017 | S2A | R132 | T50SPH |
| 29 September 2018 | S2B | R132 | T50SPG |
| 29 September 2018 | S2B | R132 | T50SNG |
| 29 September 2018 | S2B | R032 | T50SNH |
| 29 September 2018 | S2B | R032 | T50SPH |
| 29 September 2019 | S2A | R132 | T50SPG |
| 9 September 2019 | S2A | R132 | T50SNG |
| 29 September 2019 | S2A | R132 | T50SPH |
| 28 August 2019 | S2B | R032 | T50SNH |
| 18 September 2020 | S2B | R132 | T50SPG |
| 1 September 2020 | S2B | R032 | T50SNG |
| 1 September 2020 | S2B | R032 | T50SNH |
| 18 September 2020 | S2B | R132 | T50SPH |
| 8 September 2021 | S2A | R132 | T50SPG |
| 8 September 2021 | S2A | R132 | T50SNG |
| 21 September 2021 | S2A | R032 | T50SNH |
| 8 September 2021 | S2A | R132 | T50SPH |
| 17 August 2022 | S2A | R032 | T50SPG |
| 17 August 2022 | S2A | R032 | T50SNG |
| 17 August 2022 | S2A | R032 | T50SNH |
| 17 August 2022 | S2A | R032 | T50SPH |
| Year | Optimal Combination of Features |
|---|---|
| 2015 | PCA_1, PCA_2, PCA_3, GLCM_Variance, RNDVI, GLCM_Mean, MNDWI, MSAVI, RVI, Energy, DVI, MSRre, NDVIre1, NDVIre3, NDre1, NDre2, CIre, NDVI, NDVIre2, GLCM_Correlation |
| 2016 | PCA_1, PCA_2, PCA_3, GLCM_Variance, NDVIre1, GLCM_Correlation, GLCM_Mean, MNDWI, MSAVI, DVI, Energy, MSRre, NDVIre3, NDre1, NDVIre1, RNDVI, NDre2, CIre, NDVI, ASM |
| 2017 | PCA_1, PCA_2, PCA_3, GLCM_Variance, RNDVI, GLCM_Mean, MNDWI, MSAVI, MSRre, ASM, Homogeneity, Dissimilarity, NDVIre1, NDVIre3, NDre1, NDre2, Cire, NDVI, NDVIre2, GLCM_Correlation |
| 2018 | PCA_1, PCA_2, PCA_3, GLCM_Variance, RNDVI, GLCM_Mean, MNDWI, MSAVI, RVI, Energy, MSRre, NDVIre1, NDVIre3, NDre1, NDre2, Cire, NDVI |
| 2019 | PCA_1, PCA_2, PCA_3, GLCM_Variance, RNDVI, GLCM_Mean, MNDWI, MSAVI, Entropy, RVI, MSRre, NDVIre2, NDVIre3, NDre1, NDre2, CIre, NDVI, NDVIre1, DVI, GLCM_Correlation |
| 2020 | PCA_1, PCA_2, PCA_3, GLCM_Correlation, GLCM_Variance, RNDVI, RVI, GLCM_Mean, MNDWI, MSAVI, Entropy, DVI, NDVIre1, NDVIre3, NDre1, NDre2, CIre, NDVI, NDVIre2, MSRre |
| 2021 | PCA_1, PCA_2, PCA_3, GLCM_Variance, ASM, Energy, GLCM_Correlation, MNDWI, MSAVI, NDVIre1, NDVIre3, NDre1, NDre2, CIre, NDVI, NDVIre2, RNDVI, RVI, DVI, Entropy |
| 2022 | PCA_1, PCA_2, PCA_3, NDre1, GLCM_Variance, CIre, MSAVI, Entropy, MSRre, ASM, Homogeneity, Dissimilarity, NDre2, NDVIre3, GLCM_Correlation, Contrast, RVI, NDVIre1, RNDVI, MNDWI |
| Classification Scheme | Feature Combination |
|---|---|
| A | Spectral feature |
| B | Spectral feature + Vegetation index + Water index |
| C | Spectral feature + Red-edge index |
| D | Spectral feature + Texture feature |
| E | Spectral feature + Vegetation index + Water index + Red-edge index + Texture feature |
| F | The optimal feature variables set |
| 2015 | 2016 | 2017 | 2018 | 2019 | 2020 | 2021 | 2022 | |||||||||
|---|---|---|---|---|---|---|---|---|---|---|---|---|---|---|---|---|
| PA | UA | PA | UA | PA | UA | PA | UA | PA | UA | PA | UA | PA | UA | PA | UA | |
| Shallow sea | 82.37 | 98.57 | 81.66 | 98.34 | 98.03 | 92.98 | 96.39 | 92.32 | 98.65 | 94.20 | 96.70 | 99.10 | 95.42 | 96.15 | 82.37 | 98.57 |
| River | 92.14 | 95.74 | 91.95 | 93.66 | 88.95 | 86.28 | 92.21 | 88.38 | 98.96 | 91.06 | 89.25 | 98.77 | 68.52 | 90.24 | 92.14 | 95.74 |
| Mud flat | 95.31 | 67.96 | 88.41 | 71.68 | 99.36 | 99.18 | 99.85 | 99.75 | 98.62 | 98.40 | 96.59 | 99.57 | 96.99 | 99.23 | 95.31 | 67.96 |
| Swamp | 93.46 | 75.76 | 93.04 | 76.37 | 66.67 | 59.38 | 75.00 | 70.31 | 69.23 | 56.25 | 96.83 | 94.54 | 85.29 | 87.88 | 93.46 | 75.76 |
| Paddy field | 98.65 | 98.67 | 98.44 | 98.94 | 99.51 | 99.07 | 99.22 | 98.77 | 99.87 | 99.93 | 98.45 | 96.59 | 91.51 | 89.81 | 98.65 | 98.67 |
| Salt pans | 73.05 | 66.76 | 71.17 | 32.83 | 30.21 | 76.95 | 90.28 | 93.70 | 72.30 | 82.53 | 79.63 | 88.68 | 94.01 | 90.61 | 73.05 | 66.76 |
| Reservoirs and ponds | 97.71 | 95.99 | 96.54 | 96.10 | 94.80 | 95.71 | 91.98 | 95.14 | 96.01 | 99.46 | 99.30 | 96.14 | 94.85 | 88.04 | 97.71 | 95.99 |
| Dryland | 91.16 | 94.18 | 88.08 | 92.02 | 88.11 | 87.65 | 92.77 | 91.35 | 91.97 | 94.55 | 89.61 | 96.24 | 84.87 | 84.87 | 91.16 | 94.18 |
| Woodland | 86.36 | 78.84 | 79.50 | 73.04 | 77.33 | 81.19 | 89.30 | 90.92 | 82.49 | 71.19 | 91.48 | 89.56 | 87.50 | 89.36 | 86.36 | 78.84 |
| Construction land | 93.00 | 86.49 | 93.54 | 75.74 | 86.31 | 93.11 | 93.86 | 94.24 | 88.88 | 93.19 | 89.87 | 57.39 | 97.64 | 86.11 | 93.00 | 86.49 |
| OA (%) | 93.34 | 92.23 | 92.97 | 93.20 | 96.51 | 96.60 | 90.45 | 93.34 | ||||||||
| Kappa | 0.91 | 0.89 | 0.90 | 0.90 | 0.94 | 0.95 | 0.89 | 0.91 | ||||||||
References
- Qin, L.; Jiang, M.; Chirs, F.; Zou, Y.C.; Gao, C.Y.; Tian, W.; Wang, G.D. Agricultural land use regulates the fate of soil phosphorus fractions following the reclamation of wetlands. Sci. Total Environ. 2023, 863, 160891. [Google Scholar] [CrossRef]
- Mahdieh, D.; Amir, H.H. Occurrence and distribution of microplastics in wetlands. Sci. Total Environ. 2023, 862, 160740. [Google Scholar]
- Su, X.; Liu, M.; Yuan, J.; Huang, X.W.; Lu, Z.J.; Xu, J.M.; He, Y. Potential risk of co-occurrence of microplastics and chlorinated persistent organic pollutants to coastal wetlands: Evidence from a case study. Environ. Pollut. 2023, 320, 121087. [Google Scholar] [CrossRef]
- Qu, Y.B.; Wang, S.L.; Tian, Y.Y.; Jiang, G.H.; Zhou, T.; Meng, L. Territorial spatial planning for regional high-quality development—An analytical framework for the identification, mediation and transmission of potential land utilization conflicts in the Yellow River Delta. Land Use Policy 2023, 125, 106462. [Google Scholar]
- Salimi, S.; Almuktar, S.A.N.; Scholz, M. Impact of climate change on wetland ecosystems: A critical review of experimental wetlands. J. Environ. Manag. 2021, 286, 112160. [Google Scholar] [CrossRef]
- Bai, Z.; Cui, X.J.; Wang, X.F.; Xie, H.J.; Chen, B. Light absorption of black carbon is doubled at Mt. Tai and typical urban area in North China. Sci. Total Environ. 2018, 635, 1144–1151. [Google Scholar] [CrossRef] [PubMed]
- Guo, B.; Yang, F.; Fan, J.F.; Lu, Y.F. The changes of spatiotemporal pattern of rocky desertification and its dominant driving factors in typical karst mountainous areas under the background of global change. Remote Sens. 2022, 14, 2351. [Google Scholar] [CrossRef]
- Gao, Z.P.; Guo, H.M.; Li, S.Y.; Wang, J.; Ye, H.L.; Han, S.B.; Cao, W.G. Remote sensing of wetland evolution in predicting shallow groundwater arsenic distribution in two typical inland basins. Sci. Total Environ. 2022, 806, 150496. [Google Scholar] [CrossRef]
- Liu, H.Y.; Zhou, Z.H.; Wang, N.N.; Wang, Y.J. Wetland ecosystem health assessment in the Yellow River Delta Natural Reserve. Chin. Argic. Sci. Bull. 2022, 38, 74–78. [Google Scholar]
- Li, J.; Liu, L.; Huang, X.; Liao, J.; Liu, C.X. Cross-effect of wetland substrates properties on anammox process in three single-substrate anammox constructed wetlands for treating high nitrogen sewage with low C/N. J. Environ. Manag. 2022, 304, 114329. [Google Scholar] [CrossRef]
- Yu, Y.; Guo, B.; Wang, C.L.; Zang, W.Q.; Huang, X.Z.; Wu., Z.W.; Xu, M.; Zhou, K.D.; Li, J.L.; Yang, Y. Carbon storage simulation and analysis in Beijing-Tianjin-Hebei region based on CA-plus model under dual-carbon background. Geomat. Nat. Hazards Risk 2023, 14, 2173661. [Google Scholar] [CrossRef]
- Zhu, W.J.; Han, M.; Kong, X.L.; Li, Y.L.; Kong, F.B.; Wei, F.; Rong, J.H. Spatiotemporal characteristics of human activity intensity and its driving factors in the Yellow River Delta from 1990 to 2018. Res. Soil Water Conserv. 2021, 28, 287–292+300. [Google Scholar]
- Zhu, W.J.; Muhammad, A.; Han, M.; Li, Y.L.; Kong, X.L.; Kong, F.B. Spatial distribution and aggregation of human-environment coordination and optimal paths in the Yellow River Delta, China. Ecol. Indic. 2022, 143, 109380. [Google Scholar] [CrossRef]
- Lu, X.N.; Zhang, J.Y.; Hong, J.; Wang, L.L. Anlysis of wetland landscape evaluation and its driving factors in Yellow River Delta basedon remote sensing image. Trans. Chin. Soc. Agric. Eng. 2016, 32, 214–223. [Google Scholar]
- Li, J.Y.; Chen, Q.F.; Zhao, C.S.; Feng, Y.; Li, L. Analysis of microbial diversity and driving factors in coastal wetlands of the Yellow River Delta. Acta Ecol. Sin. 2021, 41, 6103–6114. [Google Scholar]
- Jia, G.Y.; Hu, W.M.; Zhang, B.; Li, G.; Shen, S.Y.; Gao, Z.H.; Li, Y. Assessing impacts of the Ecological Retreat project on water conservation in the Yellow River Basin. Sci. Total Environ. 2022, 828, 154483. [Google Scholar] [CrossRef] [PubMed]
- Ren, L.L.; Li, Y.Z.; Yu, M.; Yang, J.S.; Zhan, C.; Zhou, D. Evolution of artificial wetlands in the Yellow River Delta and related driving factors during 1984–2015. J. Agric. Resour. Environ. 2020, 37, 193–502. [Google Scholar]
- Kong, X.L.; Li, Y.L.; Han, M.; Tian, L.X.; Niu, X.R.; Zhu, J.Q.; Wang, M.; Huang, S.P. Distribution of natural wetlands in the Yellow River Delta from three periods since 1990 and driving factors or their changes. Wetl. Sci. 2020, 18, 603–612. [Google Scholar]
- Lin, Y.; Wang, D.M.; Farooq, T.H.; Luo, K.; Wang, W.Y.; Qin, M.X.; Chen, S.Q. Effects of restoration strategies on wetland: A case-study of Xinqiang River National Wetland Park. Land Degrad. Dev. 2022, 33, 1114–1127. [Google Scholar] [CrossRef]
- Zhang, Y.H.; Wang, L.; Jiang, J.; Zhang, J.C.; Zhang, Z.M.; Zhang, M.X. Application of soil quality index to determine the effects of different vegetation types on soil quality in the Yellow River Delta wetland. Ecol. Indic. 2022, 141, 109116. [Google Scholar] [CrossRef]
- Debanshi, S.; Pal, S. Assessing the role of deltaic flood plain wetlands on regulating methane and carbon balance. Sci. Total Environ. 2022, 808, 152133. [Google Scholar] [CrossRef] [PubMed]
- Zhang, C.; Gong, Z.N.; Qiu, H.C.; Zhang, Y.; Zhou, D.M. Mapping typical salt-marsh species in the Yellow River Delta wetland supported by temporal-spatial-spectral multidimensional features. Sci. Total Environ. 2021, 783, 147061. [Google Scholar] [CrossRef] [PubMed]
- Du, S.D.; Bai, H.J.; Jia, J.; Guan, Y.N.; Zhang, G.L.; Chen, G.Z.; Zhang, S.Y.; Gai, L.Y. Changes of soil organic carbon storage in Phragmites australis wetlands along a salinity gradient in the Yellow River Delta. Acta Sci. Circumstantiae 2022, 42, 80–87. [Google Scholar]
- Zhang, Q.J.; Wang, Z.S.; Xia, S.X.; Zhang, G.S.; Li, S.X.; Yu, D.K.; Yu, X.B. Hydrologic-induced concentrated soil nutrients and improved plant growth increased carbon storage in a floodplain wetland over wet-dry alternating zones. Sci. Total Environ. 2022, 822, 153512. [Google Scholar] [CrossRef] [PubMed]
- Chen, X.; Zhang, M.L.; Zhang, W.C. Landscape pattern changes and its drivers inferred from salt marsh plant variations in the coastal wetlands of the Liao River Estuary, China. Ecol. Indic. 2022, 145, 109719. [Google Scholar] [CrossRef]
- Ray, A.M.; Hossack, B.R.; Gould, W.R.; Patla, D.A.; Spear, S.F.; Klaver, R.W.; Bartelt, P.E.; Thoma, D.P.; Legg, K.L.; Daley, R.; et al. Multi-species amphibian monitoring across a protected landscape: Critical reflections on 15 years of wetland monitoring in Grand Teton and Yellowstone national parks. Ecol. Indic. 2022, 135, 108519. [Google Scholar] [CrossRef]
- Yang, X.; Zheng, X.Q.; Chen, R. A land use change model: Integrating landscape pattern indexes and Markov-CA. Ecol. Model. 2014, 283, 1–7. [Google Scholar] [CrossRef]
- Bi, X.L.; Wu, Y.R.; Meng, L.; Wu, J.J.; Li, Y.Z.; Zhou, S.W.; Pan, X.B. Integrating two landscape connectivity models to quantify the priorities of wetland conservation and reclamation restoration at multiple scales: A case study in the Yellow River Delta. Ocean Coast. Manag. 2022, 229, 106334. [Google Scholar] [CrossRef]
- Wu, Y.R.; Wu, J.J.; Bi, X.L.; Li, Y.Z.; Xiao, L.X. Application of the least cost distance model and the circuit theory model in the evaluation of wetland landscape connectivity in the Yellow River Delta. Acta Ecol. Sin. 2022, 42, 1315–1326. [Google Scholar]
- Zhang, L.; Gong, Z.N.; Wang, Q.W.; Jin, D.D.; Wang, X. Wetland mapping of Yellow River Delta wetlands based on multi-feature optimization of Sentinel-2 image. J. Remote Sens. 2019, 23, 313–326. [Google Scholar]
- Liu, H.H.; Liu, Y.X.; Zhang, C.H.; Yang, X.M.; Hu, J.; Li, J. Remote sensing monitoring of wetland changes in the Yellow River Delta during 1991–2016. Earth Environ. 2018, 46, 590–598. [Google Scholar]
- Zhang, Y.Y.; Cai, X.B.; Song, X.X.; Suo, J.R.; Wang, Z.; Li, E.H.; Wang, X.L. Remote Sensing Information Extraction of Hydrophyte in Honghu Lake based on Decision Tree. Wetl. Sci. 2018, 16, 213–222. [Google Scholar]
- Wang, Z.C.; Gao, Z.Q.; Jiang, X.P. Analysis of the evolution and driving forces of tidal wetlands at the estuary of the Yellow River and Laizhou Bay based on remote sensing data cube. Ocean Coast. Manag. 2023, 237, 106535. [Google Scholar]
- Zong, M.; Wang, G.Z.; Han, G.X.; Li, Y.Z.; Zhao, M. Spatial and temporal evolution and driving mechanism of man-made ditches in Yellow River Delta from 1976 to 2015. J. Ludong Univ. (Nat. Sci. Ed.) 2017, 33, 68–75. [Google Scholar]
- Ning, X.G.; Chang, W.T.; Wang, H.; Zhang, H.C.; Zhu, Q.D. Extraction of marsh wetland in Heilongjiang Basin based on GEE and multi-source remote sensing data. Natl. Remote Sens. Bull. 2022, 26, 386–396. [Google Scholar]
- Ozesmi, S.L.; Bauer, M.E. Satellite remote sensing of wetlands. Wetl. Ecol. Manag. 2002, 10, 381–402. [Google Scholar] [CrossRef]
- Na, X.D.; Zhang, S.Q.; Kong, B.; Yu, H.; Li, X.F.; Liu, C.Y. The extraction of fresh water marsh wetland information based on decision tree algorithm—A case study in the northeast of the Sanjiang Plain. Remote Sens. Technol. Appl. 2008, 23, 365–372. [Google Scholar]
- Liu, J.K.; Bernard, A.E.; Zhang, G.F.; Wang, Y.; Wu, Y.N.; Zhang, M.X.; Zhang, Z.M. Hydrological connectivity: One of the driving factors of plant communities in the Yellow River Delta. Ecol. Model. 2020, 112, 106150. [Google Scholar] [CrossRef]
- Xing, H.Q.; Niu, J.G.; Feng, Y.Y.; Hou, D.Y.; Wang, Y.; Wang, Z.Q. A coastal wetlands mapping approach of Yellow River Delta with a hierarchical classification and optimal feature selection framework. Catena 2023, 223, 106897. [Google Scholar] [CrossRef]
- Yu, X.Y.; Zhu, W.B.; Wei, J.X.; Jia, S.F.; Wang, A.D.; Huang, Y.B.; Zhao, Y.J. Estimation of ecological water supplement for typical bird protection in the Yellow River Delta wetland. Ecol. Indic. 2021, 127, 107783. [Google Scholar] [CrossRef]
- Yu, M.; Li, Y.Z.; Zhang, K.; Yu, J.B.; Guo, X.L.; Guan, B.; Yang, J.S.; Zhou, D.; Wang, X.H.; Li, X.; et al. Studies on the dynamic boundary of the fresh-salt water interaction zone of estuary wetland in the Yellow River Delta. Ecol. Eng. 2023, 188, 106893. [Google Scholar] [CrossRef]
- He, Y.; Huang, C.; Li, H.; Liu, Q.S.; Liu, G.H.; Zhou, Z.C.; Zhang, C.C. Land-cover classification of random forest based on Sentinel- 2A image feature optimization. Resour. Sci. 2019, 41, 992–1001. [Google Scholar]
- Wei, C.X.; Guo, B.; Fan, Y.W.; Zang, W.Q.; Ji, J.W. The change pattern and its dominant driving factors of wetlands in the Yellow River Delta based on Sentinel-2 images. Remote Sens. 2022, 14, 4388. [Google Scholar] [CrossRef]
- Jamali, A.; Mahdianpari, M.; Mohammadimanesh, F.; Homayouni, S. A deep learning framework based on generative adversarial networks and vision transformer for complex wetland classification using limited training samples. Int. J. Appl. Earth Obs. 2022, 115, 103095. [Google Scholar] [CrossRef]
- Prăvălie, R.; Patriche, C.; Tişcovschi, A.; Dumitraşcu, M.; Săvulescu, I.; Sîrodoev, I.; Bandoc, G. Recent spatio-temporal changes of land sensitivity to degradation in Romania due to climate change and human activities: An approach based on multiple environmental quality indicators. Ecol. Indic. 2020, 118, 106755. [Google Scholar] [CrossRef]
- Pace, L.; Imbrenda, V.; Lanfredi, M.; Cudlín, P.; Simoniello, T.; Salvati, L.; Coluzzi, R. Delineating the Intrinsic, Long-Term Path of Land Degradation: A Spatially Explicit Transition Matrix for Italy, 1960–2010. Int. J. Env. Res. Public Health 2023, 20, 2402. [Google Scholar] [CrossRef] [PubMed]
- Bai, J.H.; Fang, J.S.; Huang, L.B.; Deng, W.; Li, A.N.; Kong, B. Langscape pattern evolution and its driving factors of Baiyangdian lake-marsh wetland system. Geogr. Res. 2013, 32, 1634–1644. [Google Scholar]
- Wu, Z.H.; Lei, S.G.; Yan, Q.W.; Bian, Z.F.; Lu, Q.Q. Landscape ecological network construction controlling surface coal mining effect on landscape ecology: A case study of a mining city in semi-arid steppe. Ecol. Indic. 2021, 133, 108403. [Google Scholar] [CrossRef]
- Torquetti, C.G.; de Carvalho, T.P.; de Freitas, R.M.P.; Freitas, M.B.; Guimarães, A.T.B.; Soto-Blanco, B. Influence of landscape ecology and physiological implications in bats from different trophic guilds. Sci. Total Environ. 2023, 857, 159631. [Google Scholar] [CrossRef]
- Zhu, Z.; Qiu, S.; Ye, S. Remote sensing of land change: A multifaceted perspective. Remote Sens. Environ. 2022, 282, 113266. [Google Scholar] [CrossRef]
- Guo, B.; Lu, M.; Fan, Y.W.; Wu, H.W.; Yang, Y.; Wang, C.L. A novel remote sensing monitoring index of salinization based on three-dimensional feature space model and its application in the Yellow River Delta. Geomat. Nat. Hazards Risk 2023, 14, 95–156. [Google Scholar] [CrossRef]
- Guo, B.; Yang, F.; Fan, Y.W.; Zang, W.Q. The dominant driving factors of rocky desertification and their variations in typical mountainous karst areas of Southwest China in the context of global change. Catena 2023, 220, 106674. [Google Scholar] [CrossRef]
- Yao, C.X.; Yuan, H.M.; Meng, X.J. Natural factors for deterioration of coastal wetland in the Yellow River Delta. Mar. Geol. Quat. Geol. 2011, 31, 43–50. [Google Scholar] [CrossRef]
- Lu, Q.; Wu, S.H.; Zhao, D.S. Variations in Alpine Grassl Cover and Its Correlation with Climate Variabl es on the Qinghai-Tibet Plateau in 1982–2013. Sci. Geogr. Sin. 2017, 37, 292–300. [Google Scholar]
- Zhang, X.J.; Wang, G.Q.; Xue, B.L.; Zhang, M.X.; Tan, Z.X. Dynamic landscapes and the driving forces in the Yellow River Delta wetland region in the past four decades. Sci. Total Environ. 2021, 787, 147644. [Google Scholar] [CrossRef]
- Xia, C.; Liu, G.; Xia, H.; Jiang, F.; Meng, Y. Influence of saline intrusion on the wetland ecosystem revealed by isotopic and hydrochemical indicators in the Yellow River Delta, China. Ecol. Indic. 2021, 133, 108422. [Google Scholar] [CrossRef]
- Gu, X.S.; Peng, Y.Y.; Sun, S.S.; He, S.B. Simultaneous denitrification and iron-phosphorus precipitation driven by plant biomass coupled with iron scraps in subsurface flow constructed wetlands. J. Environ. Manag. 2022, 322, 116104. [Google Scholar] [CrossRef]
- Dronova, I.; Gong, P.; Wang, L.; Zhong, L.H. Mapping dynamic cover types in a large seasonally flooded wetland using extended principal component analysis and object-based classification. Remote Sens. Environ. 2015, 158, 193–206. [Google Scholar] [CrossRef]
- Liu, Y.F.; Guo, B.; Lu, M.; Zang, W.Q.; Yu, T.; Chen, D.H. Quantitative distinction of the relative actions of climate change and human activities on vegetation evolution in the Yellow River Basin of China during 1981–2019. J. Arid Land 2023, 15, 91–108. [Google Scholar] [CrossRef]
- Younes, N.; Joyce, K.E.; Northfield, T.D.; Maier, S.W. The effects of water depth on estimating Fractional Vegetation Cover in mangrove forests. Int. J. Appl. Earth Obs. 2019, 80, 1011924. [Google Scholar] [CrossRef]
- Xiong, Q.L.; Xiao, Y.; Halmy, M.W.A.; Dakhil, M.A.; Liang, P.H.; Liu, C.G.; Zhang, L.; Pandey, B.; Pan, K.W.; El Kafraway, S.B.; et al. Monitoring the impact of climate change and human activities on grassland vegetation dynamics in the northeastern Qinghai-Tibet Plateau of China during 2000–2015. J.Arid. Land. 2019, 11, 637–651. [Google Scholar] [CrossRef]
- Yan, J.N.; Wang, L.Z.; He, H.X.; Liang, D.; Song, W.J.; Han, W. Large area land cover changes monitoring with time-series remote sensing images using transferable deep models. IEEE Trans. Geosci. Remote 2022, 60, 4409917. [Google Scholar] [CrossRef]
- Yan, J.N.; He, H.X.; Wang, L.Z.; Zhanh, H.; Liang, D.; Zhang, J.Q. Inter-comparison of four models for detecting forest fire disturbance from MOD13A2 time series. Remote Sens. 2022, 14, 1446. [Google Scholar] [CrossRef]
- Yan, J.N.; Liu, J.W.; Wang, L.Z.; Liang, D.; Cao, Q.C.; Zhang, W.F.; Peng, J.Y. Land-cover classification with time-series remote sensing images by complete extraction of multi-scale timing dependency. IEEE J. STARS 2022, 15, 1953–1967. [Google Scholar]



| Data Type | Data Name | Resolution (m) | Data Sources | Pretreatment Process |
|---|---|---|---|---|
| Wetland type data | Wetland type | 10 | United States Geological Survey (http://www.usgs.gov/, accessed on 9 October 2022) | Extraction and classification of wetland information |
| Natural factors | Slope | 30 | Geospatial Data Cloud (https://www.gscloud.cn/, accessed on 11 October 2022) | Resample |
| DEM | 30 | Resample | ||
| Temperature | 10 | The China Meteorological Data Service Center (http://www.nmic.cn/, accessed on 9 October 2022) | Kriging interpolation | |
| Sunshine hours | 10 | |||
| Precipitation | 10 | |||
| Vegetation coverage (FVC) | 10 | United States Geological Survey (http://www.usgs.gov/, accessed on 12 October 2022) | Band math, resample | |
| Distance to river | 10 | Resource and Environment Science and Data Center (https://www.resdc.cn/, accessed on 9 October 2022) | Euclidean distance | |
| Socio-economic factor | The density of Gross Domestic Product (GDP) | 1000 | Resource and Environment Science and Data Center (https://www.resdc.cn/, accessed on 5 October 2022) | Resample |
| The density of population (POP) | 1000 | Resample |
| Criterion | Interaction |
|---|---|
| Nonlinear weakening | |
| Single-factor nonlinear weakening | |
| Double-factor enhancement | |
| Independent | |
| Nonlinear enhancement |
| 2022 | |||||||||||||
|---|---|---|---|---|---|---|---|---|---|---|---|---|---|
| Sea | Shallow Sea | River | Mud Flat | Swamp | Paddy Field | Salt Pans | Reservoirs and Ponds | Dryland | Woodland | Construction Land | Unused Land | ||
| 2015 | Sea | -- | 23.28 | 13.73 | 9.07 | 3.37 | 0.00 | 0.08 | 5.03 | 0.03 | 0.00 | 0.18 | 0.01 |
| Shallow sea | 39.04 | -- | 55.79 | 40.33 | 13.69 | 0.12 | 2.85 | 8.27 | 1.74 | 0.75 | 8.44 | 0.61 | |
| River | 0.01 | 0.32 | -- | 0.70 | 7.67 | 0.18 | 4.07 | 17.88 | 0.54 | 1.37 | 0.81 | 0.08 | |
| Mud flat | 3.58 | 15.71 | 37.18 | -- | 12.82 | 0.54 | 2.95 | 26.91 | 9.92 | 3.94 | 54.87 | 3.43 | |
| Swamp | 0.00 | 0.11 | 10.67 | 11.27 | -- | 0.01 | 0.76 | 10.64 | 2.28 | 3.06 | 1.42 | 0.18 | |
| Paddy field | 0.00 | 0.05 | 3.09 | 0.30 | 3.83 | -- | 2.49 | 11.40 | 52.21 | 35.80 | 4.28 | 1.98 | |
| Salt pans | 1.41 | 3.22 | 50.40 | 8.71 | 4.58 | 1.04 | -- | 108.19 | 5.18 | 5.85 | 11.74 | 0.79 | |
| Reservoirs and ponds | 0.48 | 4.65 | 100.81 | 30.31 | 8.79 | 1.74 | 55.89 | -- | 11.98 | 23.75 | 24.84 | 1.88 | |
| Dryland | 0.00 | 0.09 | 14.69 | 2.84 | 7.94 | 40.49 | 8.43 | 54.36 | -- | 506.63 | 78.05 | 51.33 | |
| Woodland | 0.00 | 0.03 | 7.89 | 1.17 | 3.20 | 4.55 | 2.57 | 28.26 | 168.13 | -- | 26.54 | 5.88 | |
| Construction land | 0.16 | 1.37 | 36.90 | 25.19 | 11.06 | 4.65 | 9.00 | 78.32 | 214.71 | 108.64 | -- | 70.74 | |
| Unused land | 0.00 | 0.88 | 26.64 | 7.80 | 17.97 | 6.18 | 17.10 | 153.98 | 235.11 | 213.35 | 56.27 | -- | |
| Number | 00 | 01 | 02 | 03 | 04 | 05 |
|---|---|---|---|---|---|---|
| Landscape types | Sea | Paddy field | Shallow sea | Salt pans | Reservoirs and ponds | Dryland |
| Number | 06 | 07 | 08 | 09 | 10 | 11 |
| Landscape types | Woodland | River | Mud flat | Construction land | Swamp | Unused land |
| Driving Factors | Index | Code Name |
|---|---|---|
| Natural factors | FVC | X1 |
| Precipitation | X4 | |
| Sunshine hours | X5 | |
| Temperature | X6 | |
| Distance to river | X7 | |
| DEM | X8 | |
| Slope | X9 | |
| Socio-economic factors | GDP | X2 |
| POP | X3 |
Disclaimer/Publisher’s Note: The statements, opinions and data contained in all publications are solely those of the individual author(s) and contributor(s) and not of MDPI and/or the editor(s). MDPI and/or the editor(s) disclaim responsibility for any injury to people or property resulting from any ideas, methods, instructions or products referred to in the content. |
© 2023 by the authors. Licensee MDPI, Basel, Switzerland. This article is an open access article distributed under the terms and conditions of the Creative Commons Attribution (CC BY) license (https://creativecommons.org/licenses/by/4.0/).
Share and Cite
Wei, C.; Guo, B.; Lu, M.; Zang, W.; Yang, F.; Liu, C.; Wang, B.; Huang, X.; Liu, Y.; Yu, Y.; et al. The Changes in Dominant Driving Factors in the Evolution Process of Wetland in the Yellow River Delta during 2015–2022. Remote Sens. 2023, 15, 2858. https://doi.org/10.3390/rs15112858
Wei C, Guo B, Lu M, Zang W, Yang F, Liu C, Wang B, Huang X, Liu Y, Yu Y, et al. The Changes in Dominant Driving Factors in the Evolution Process of Wetland in the Yellow River Delta during 2015–2022. Remote Sensing. 2023; 15(11):2858. https://doi.org/10.3390/rs15112858
Chicago/Turabian StyleWei, Cuixia, Bing Guo, Miao Lu, Wenqian Zang, Fei Yang, Chuan Liu, Baoyu Wang, Xiangzhi Huang, Yifeng Liu, Yang Yu, and et al. 2023. "The Changes in Dominant Driving Factors in the Evolution Process of Wetland in the Yellow River Delta during 2015–2022" Remote Sensing 15, no. 11: 2858. https://doi.org/10.3390/rs15112858
APA StyleWei, C., Guo, B., Lu, M., Zang, W., Yang, F., Liu, C., Wang, B., Huang, X., Liu, Y., Yu, Y., Li, J., & Xu, M. (2023). The Changes in Dominant Driving Factors in the Evolution Process of Wetland in the Yellow River Delta during 2015–2022. Remote Sensing, 15(11), 2858. https://doi.org/10.3390/rs15112858


