
Landslide Susceptibility Zoning in Yunnan Province Based on SBAS-InSAR Technology and a Random Forest Model
 , ,
, ,
Abstract
:
1. Introduction
2. Methods
2.1. SBAS-InSAR Method and Deformation Result Acquisition
2.1.1. SBAS-InSAR Method
2.1.2. Deformation Result Acquisition
2.2. Random Forest Model
2.2.1. Random Forest Model Method
2.2.2. Model Training
3. Study Area and Data Sources
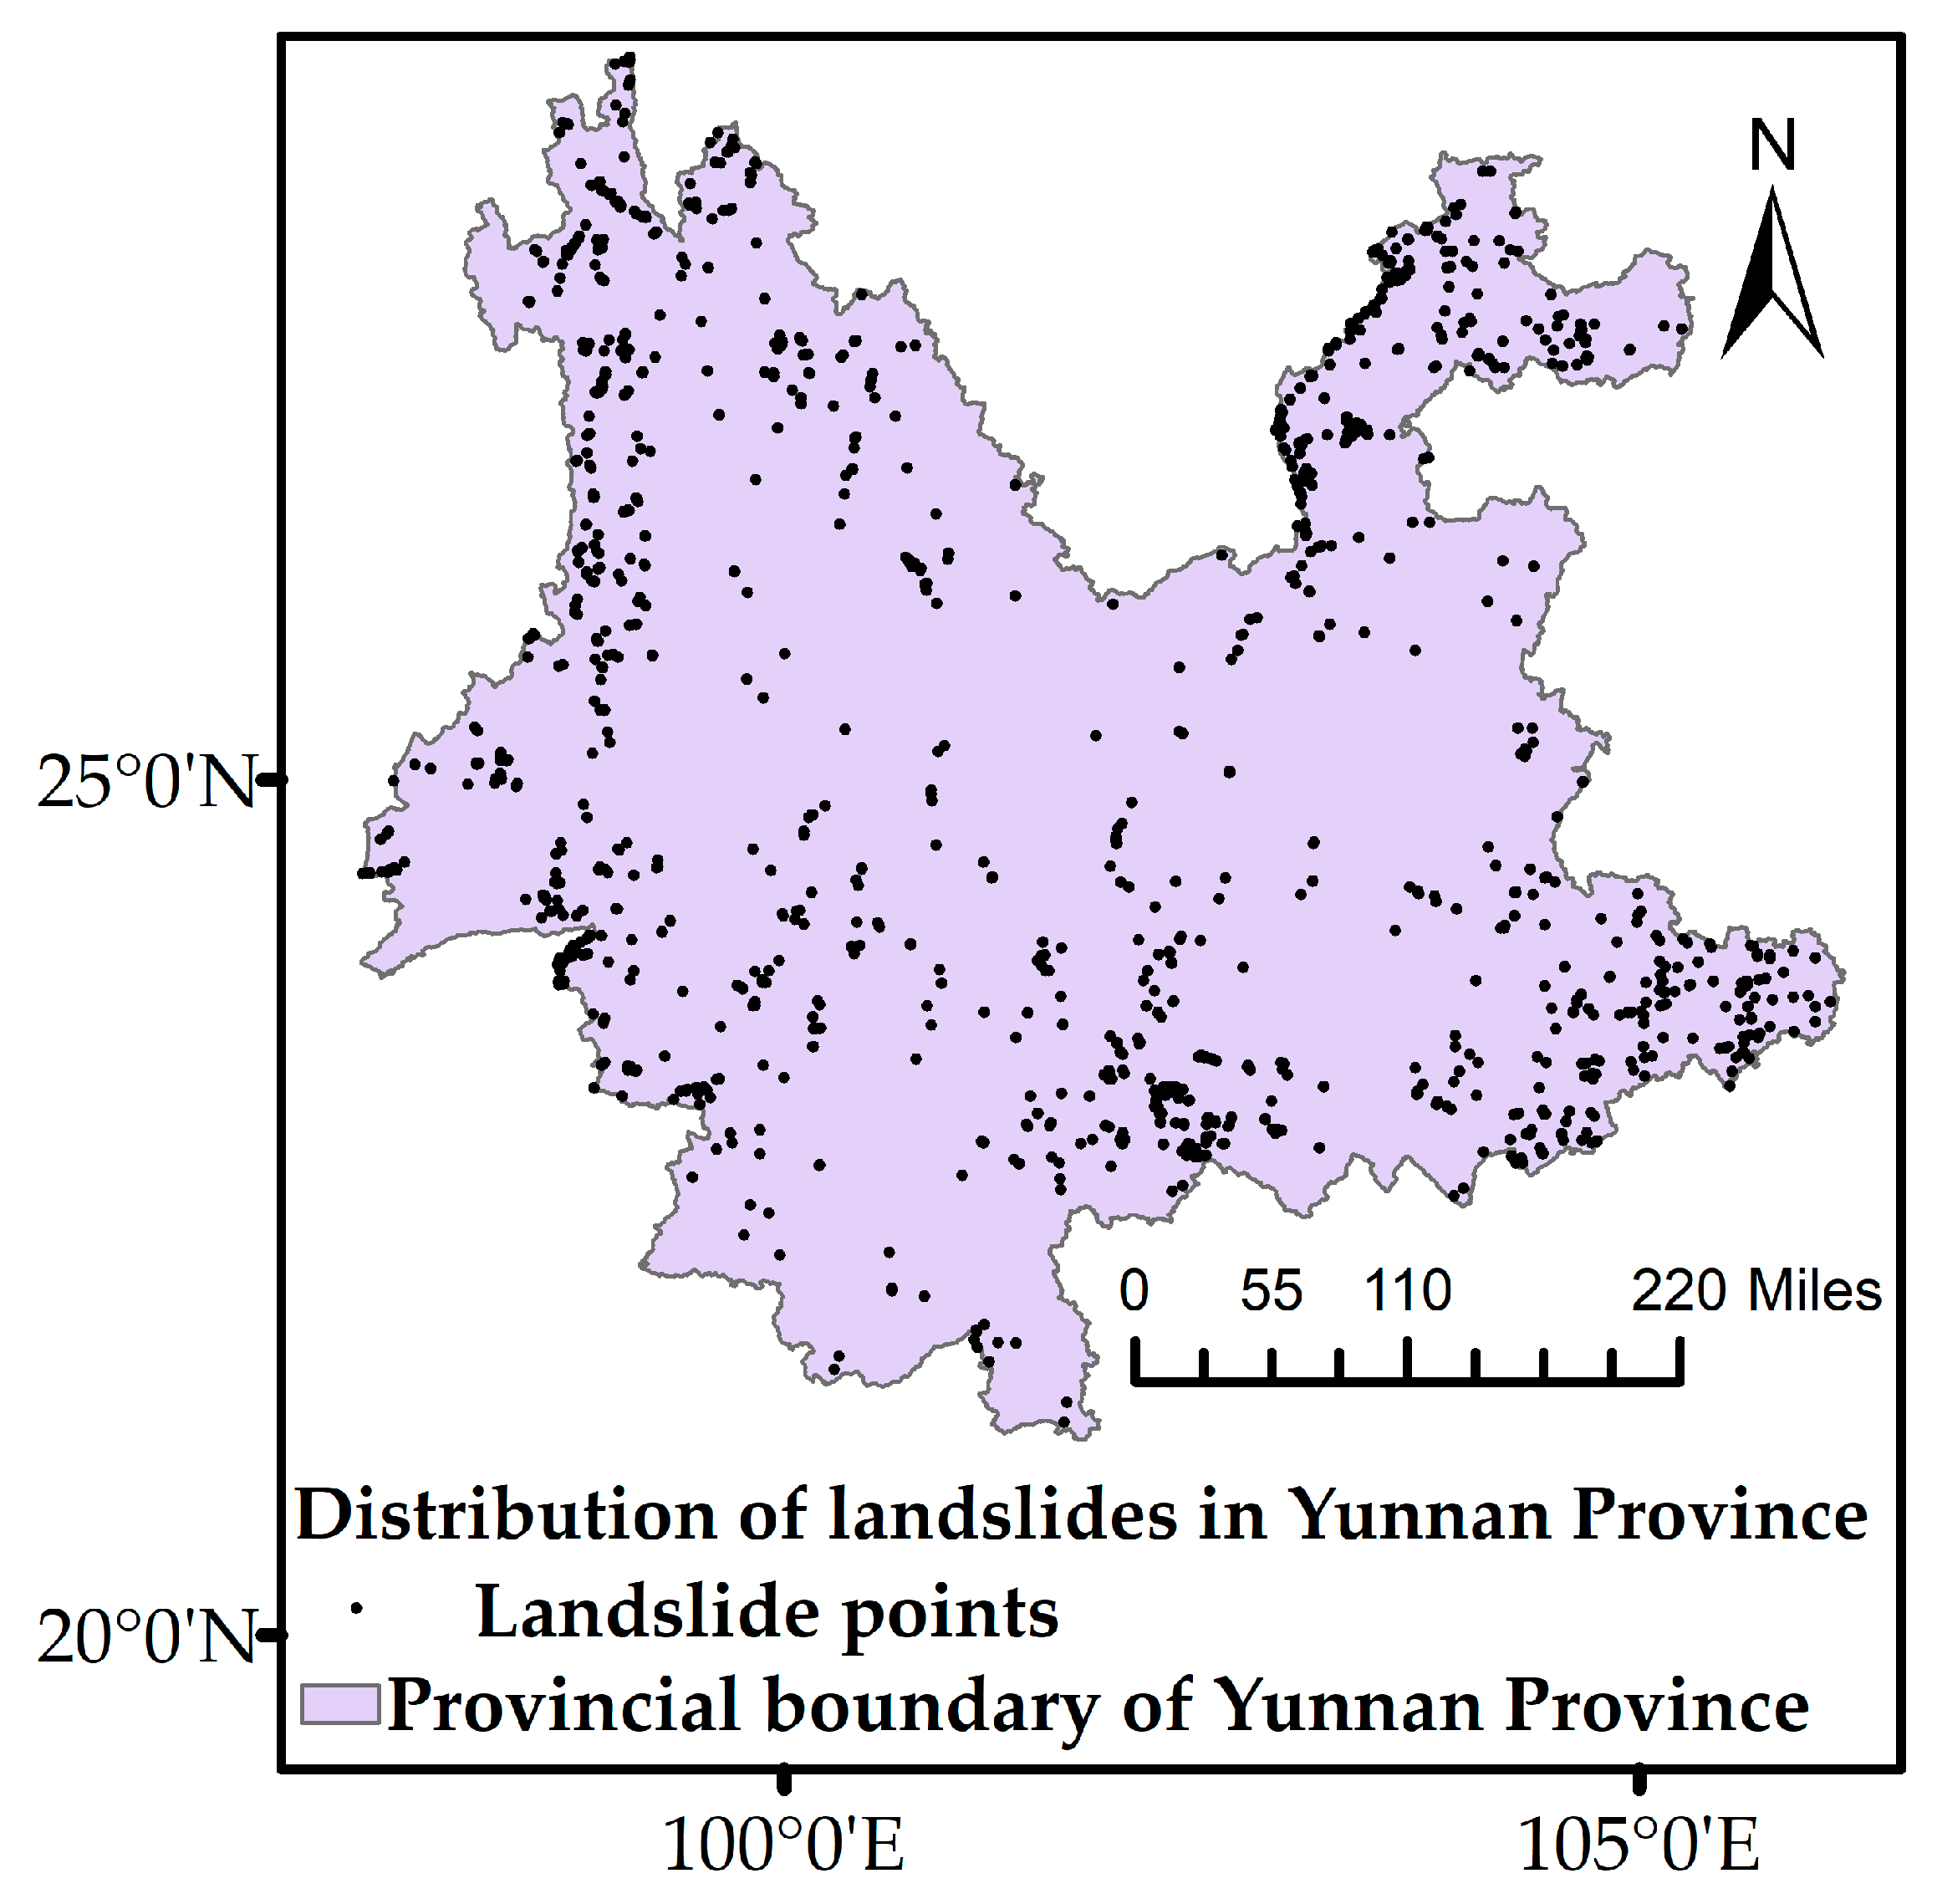
3.1. Study Area
3.2. Data Sources
4. Indicator Factor Data Processing
4.1. Topography and Landform
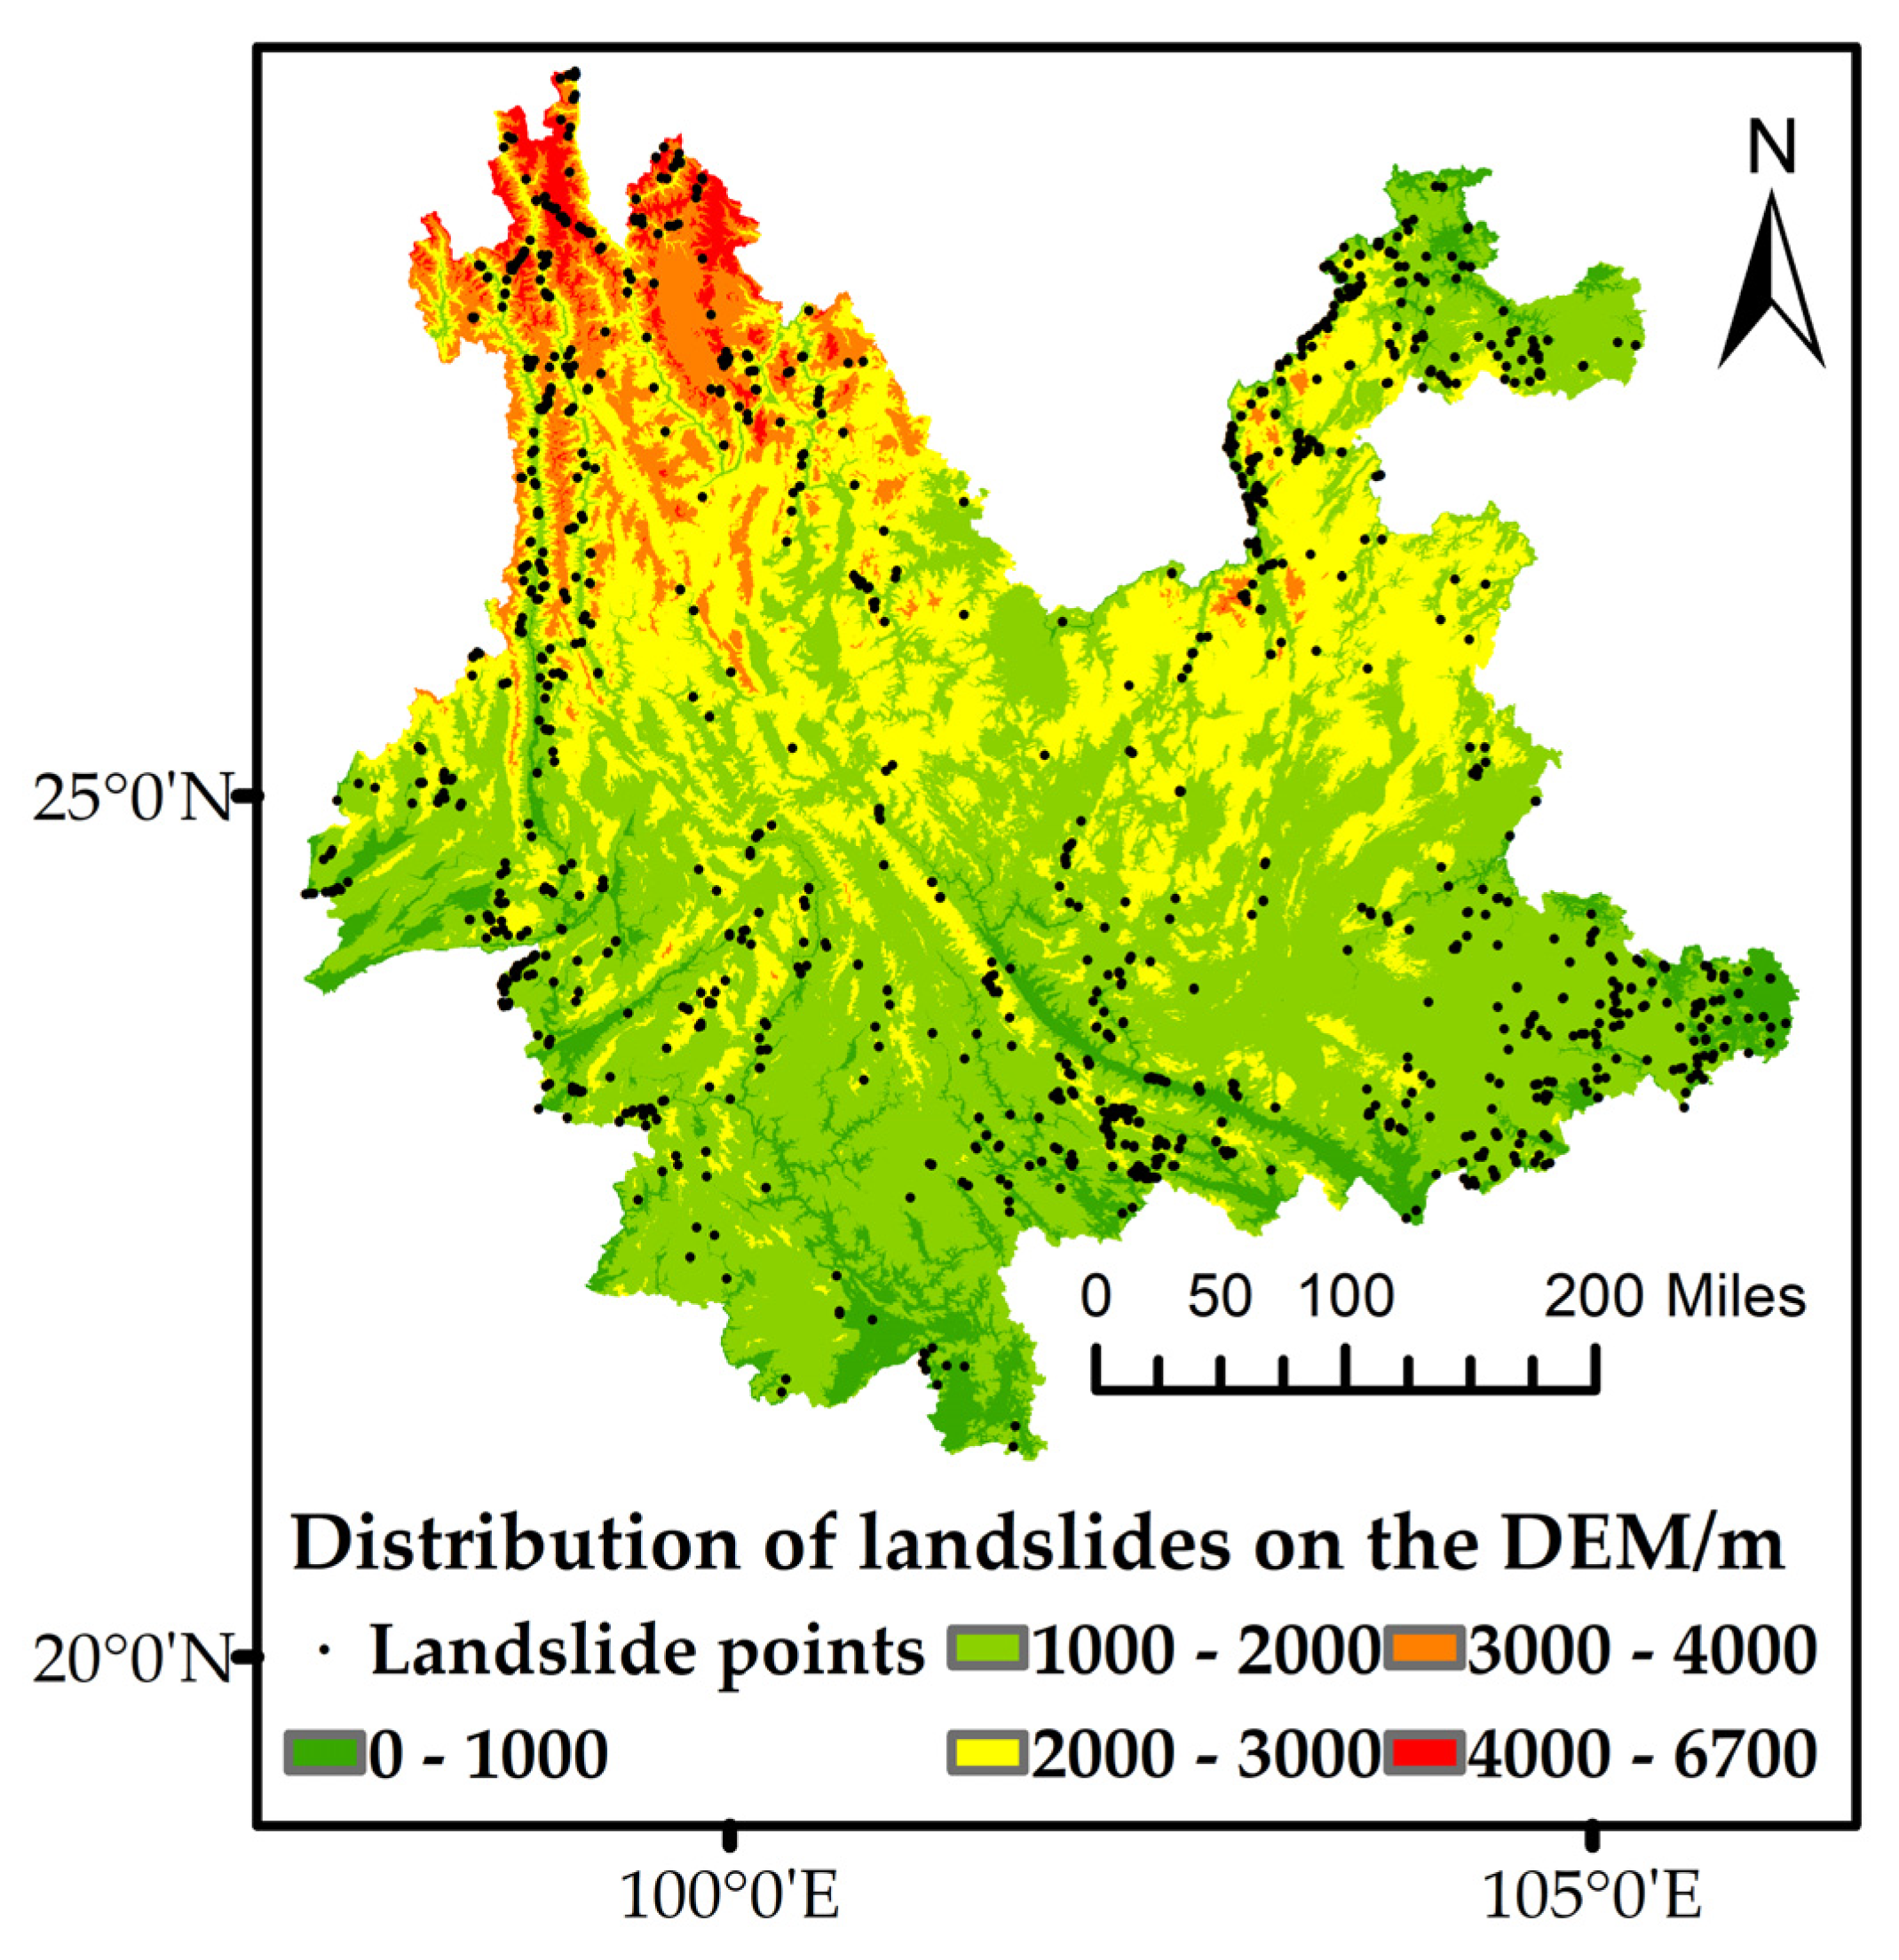
4.1.1. DEM
4.1.2. Slope
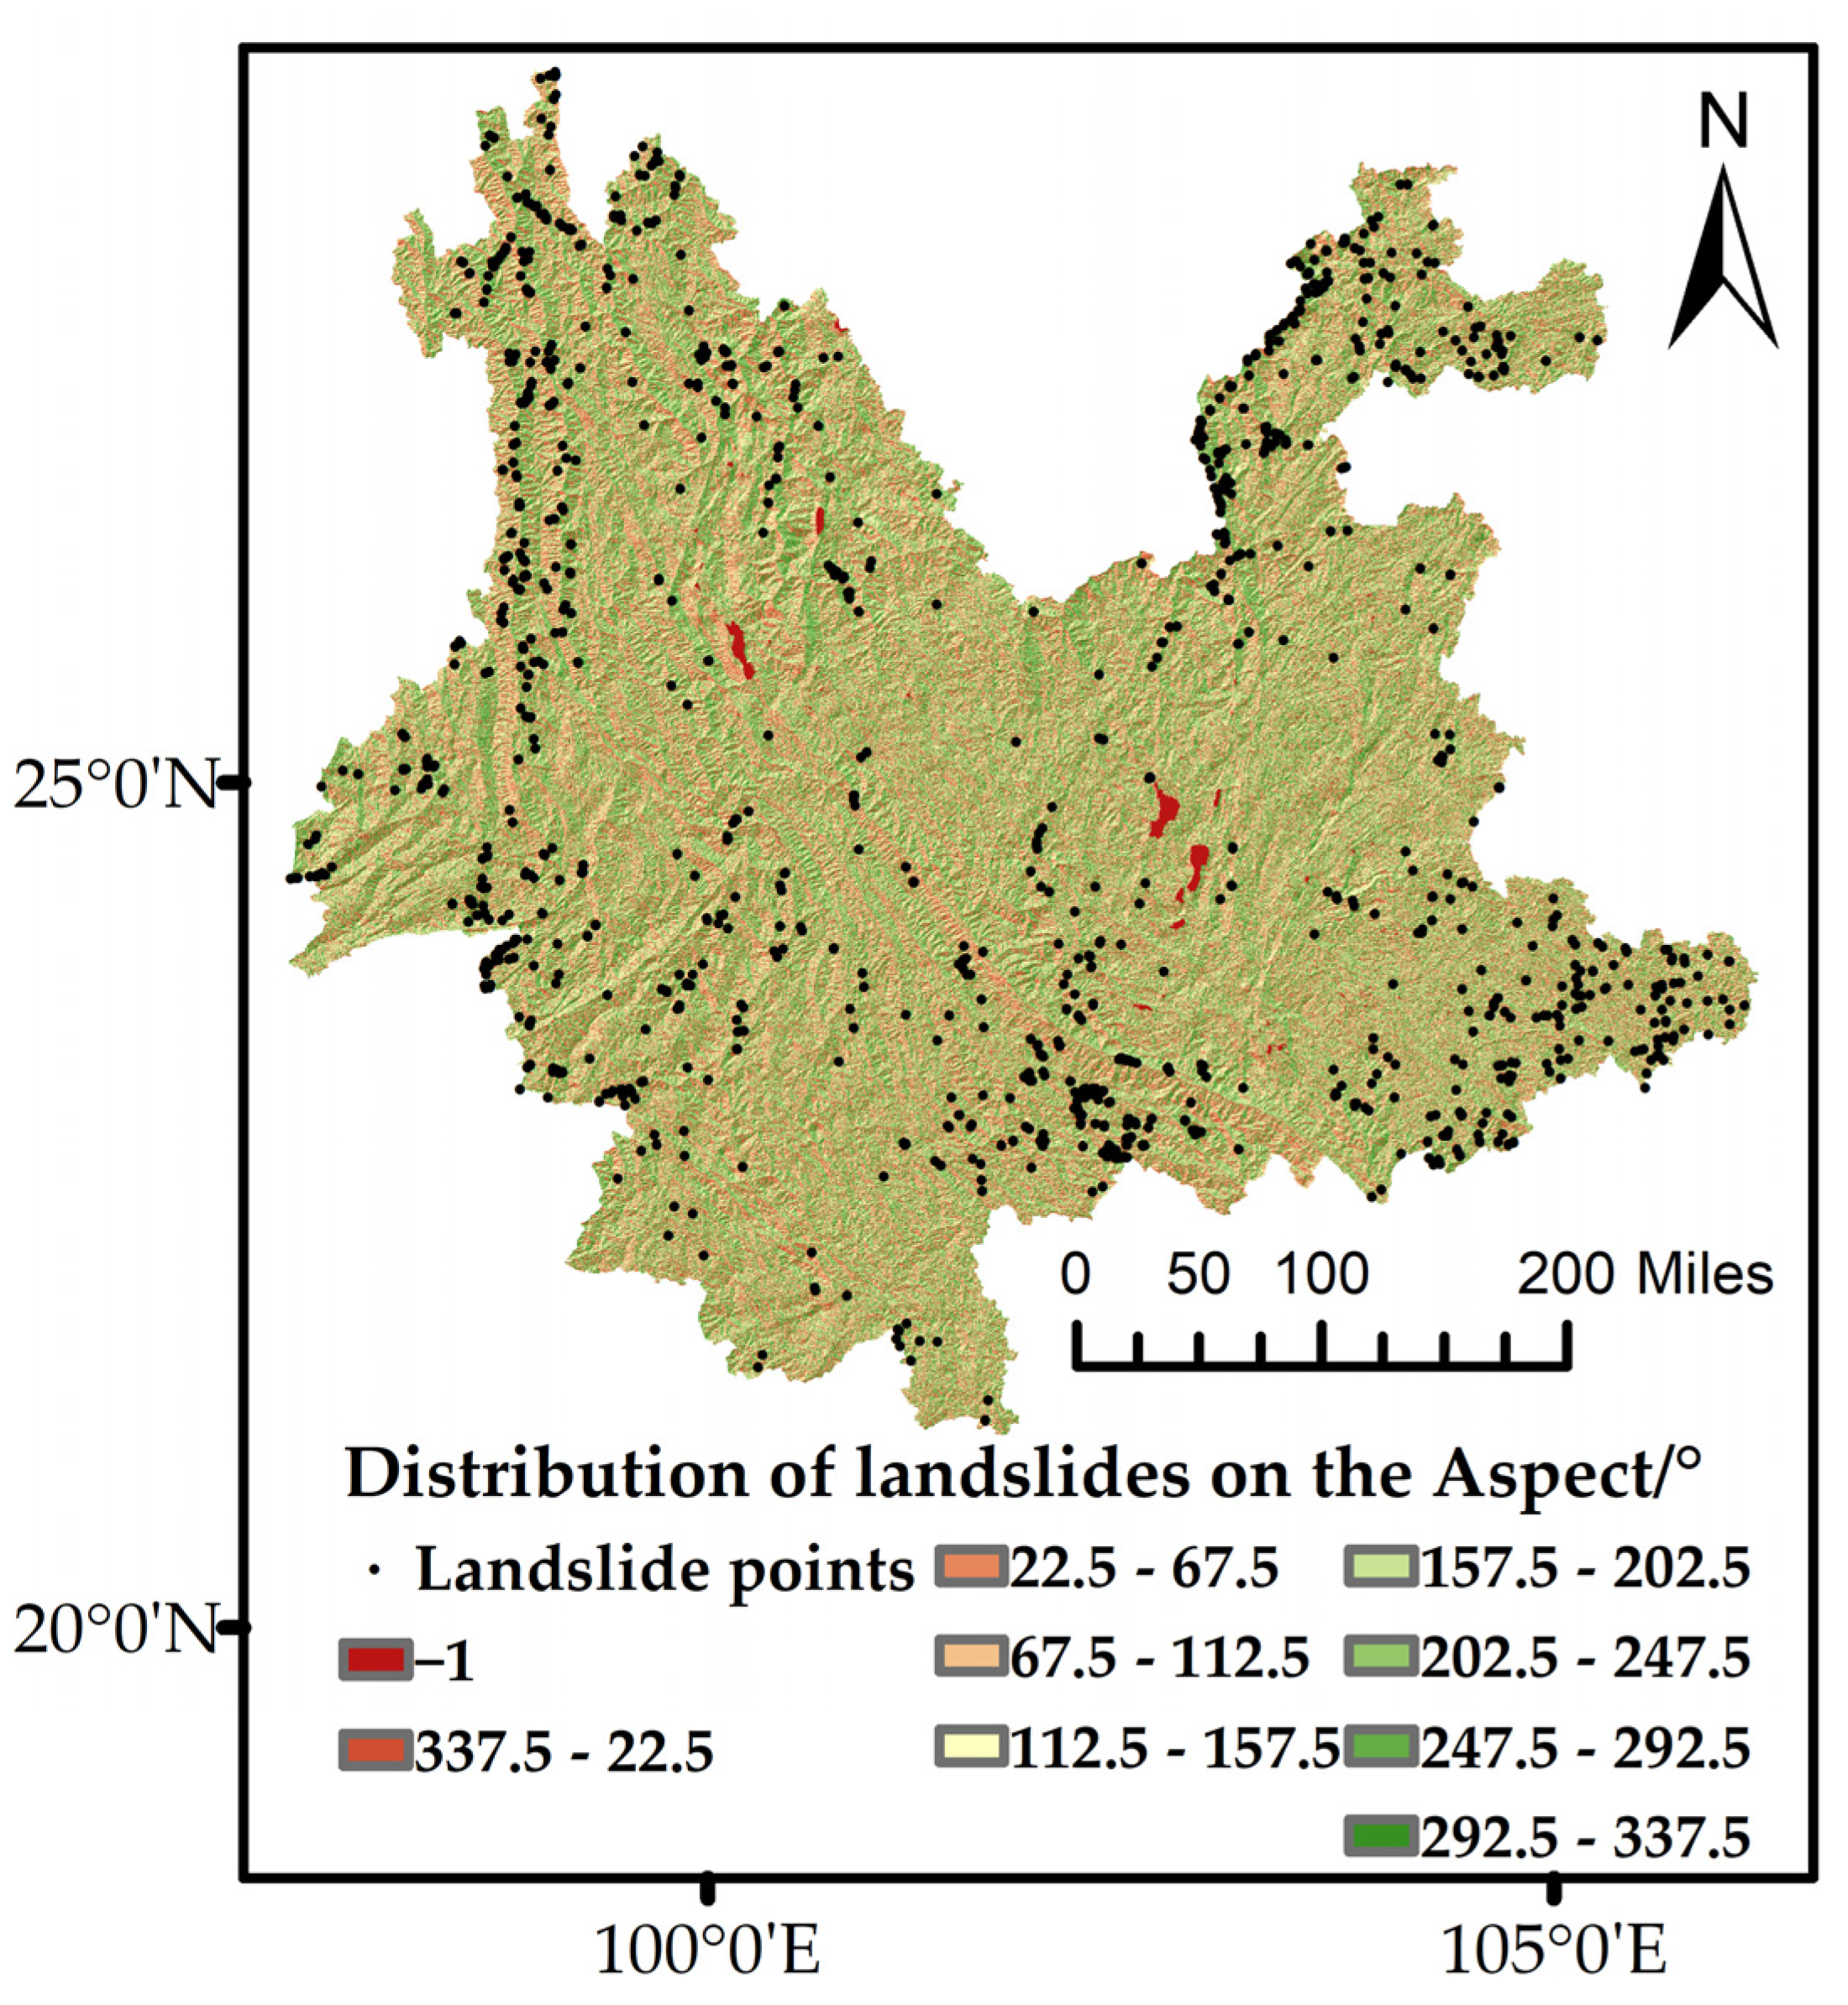
4.1.3. Aspect
4.1.4. Terrain Undulation
4.2. Geological Structure
4.2.1. Distance from the Fault
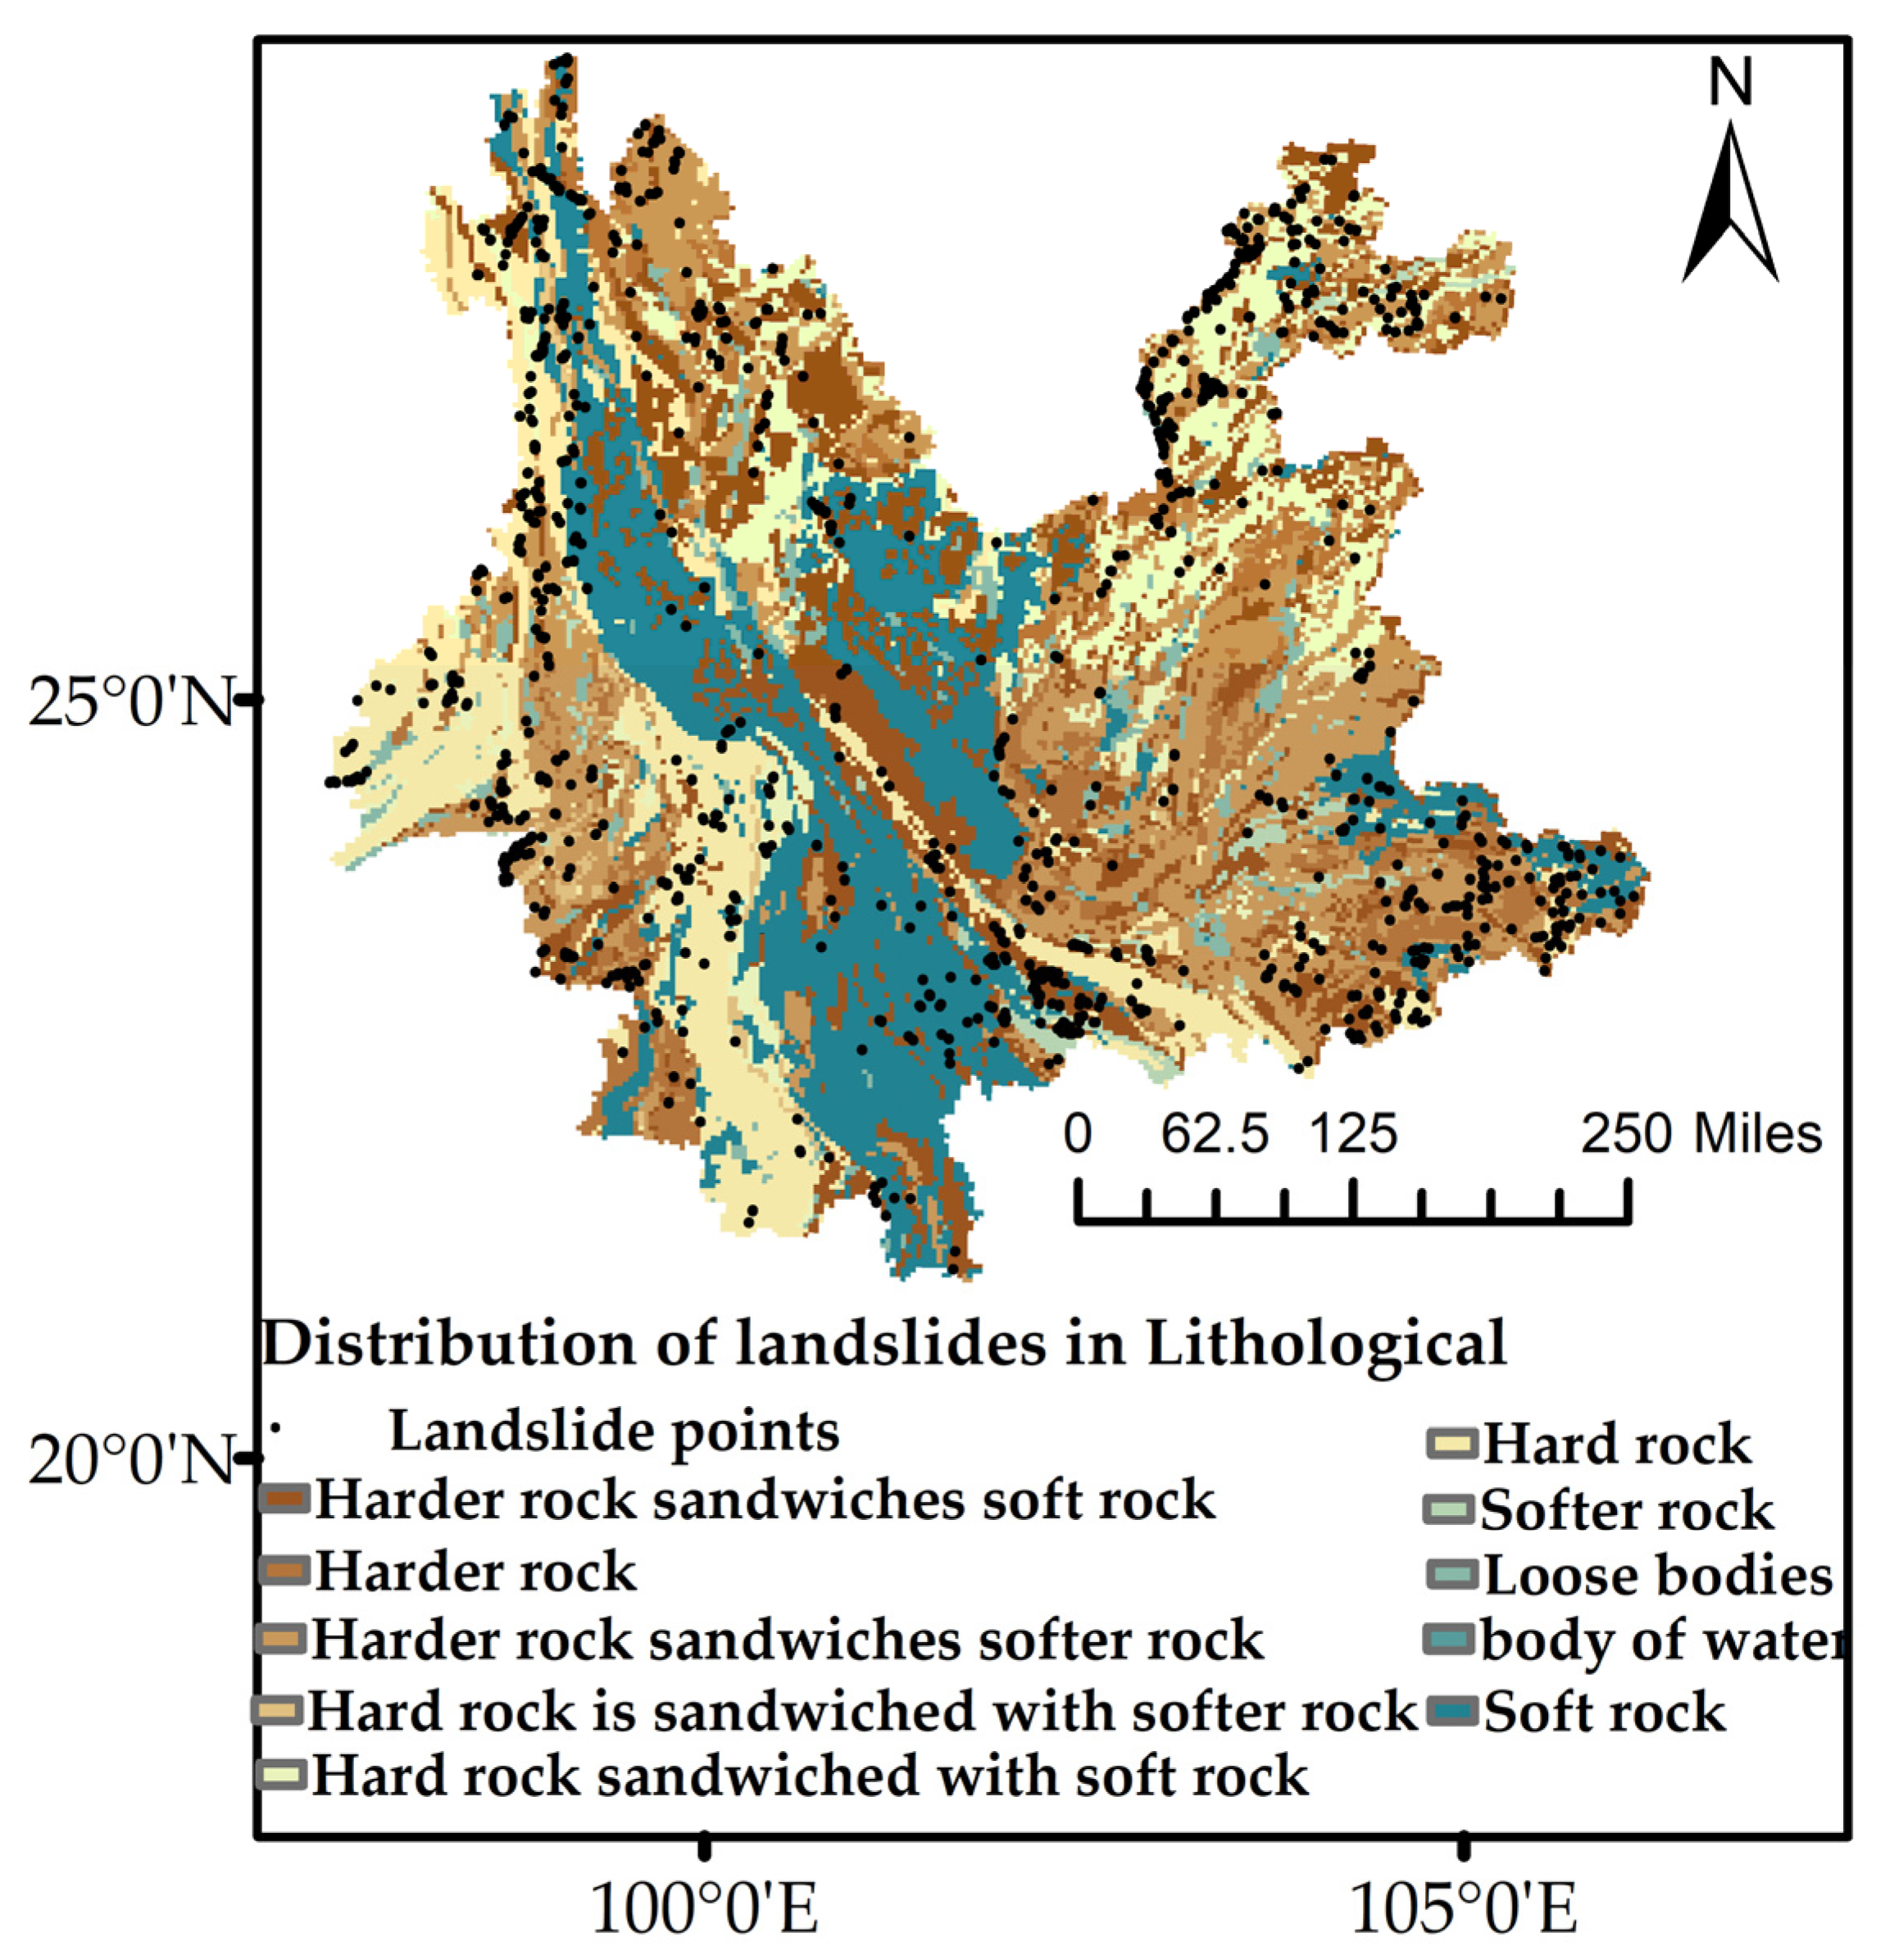
4.2.2. Lithological Classification
4.3. Meteorological Hydrology
4.3.1. Distance from Rivers
4.3.2. Average Annual Rainfall
4.4. Human Activity
Distance from Roads
4.5. The Degree of Vegetation Cover
5. Results and Discussion
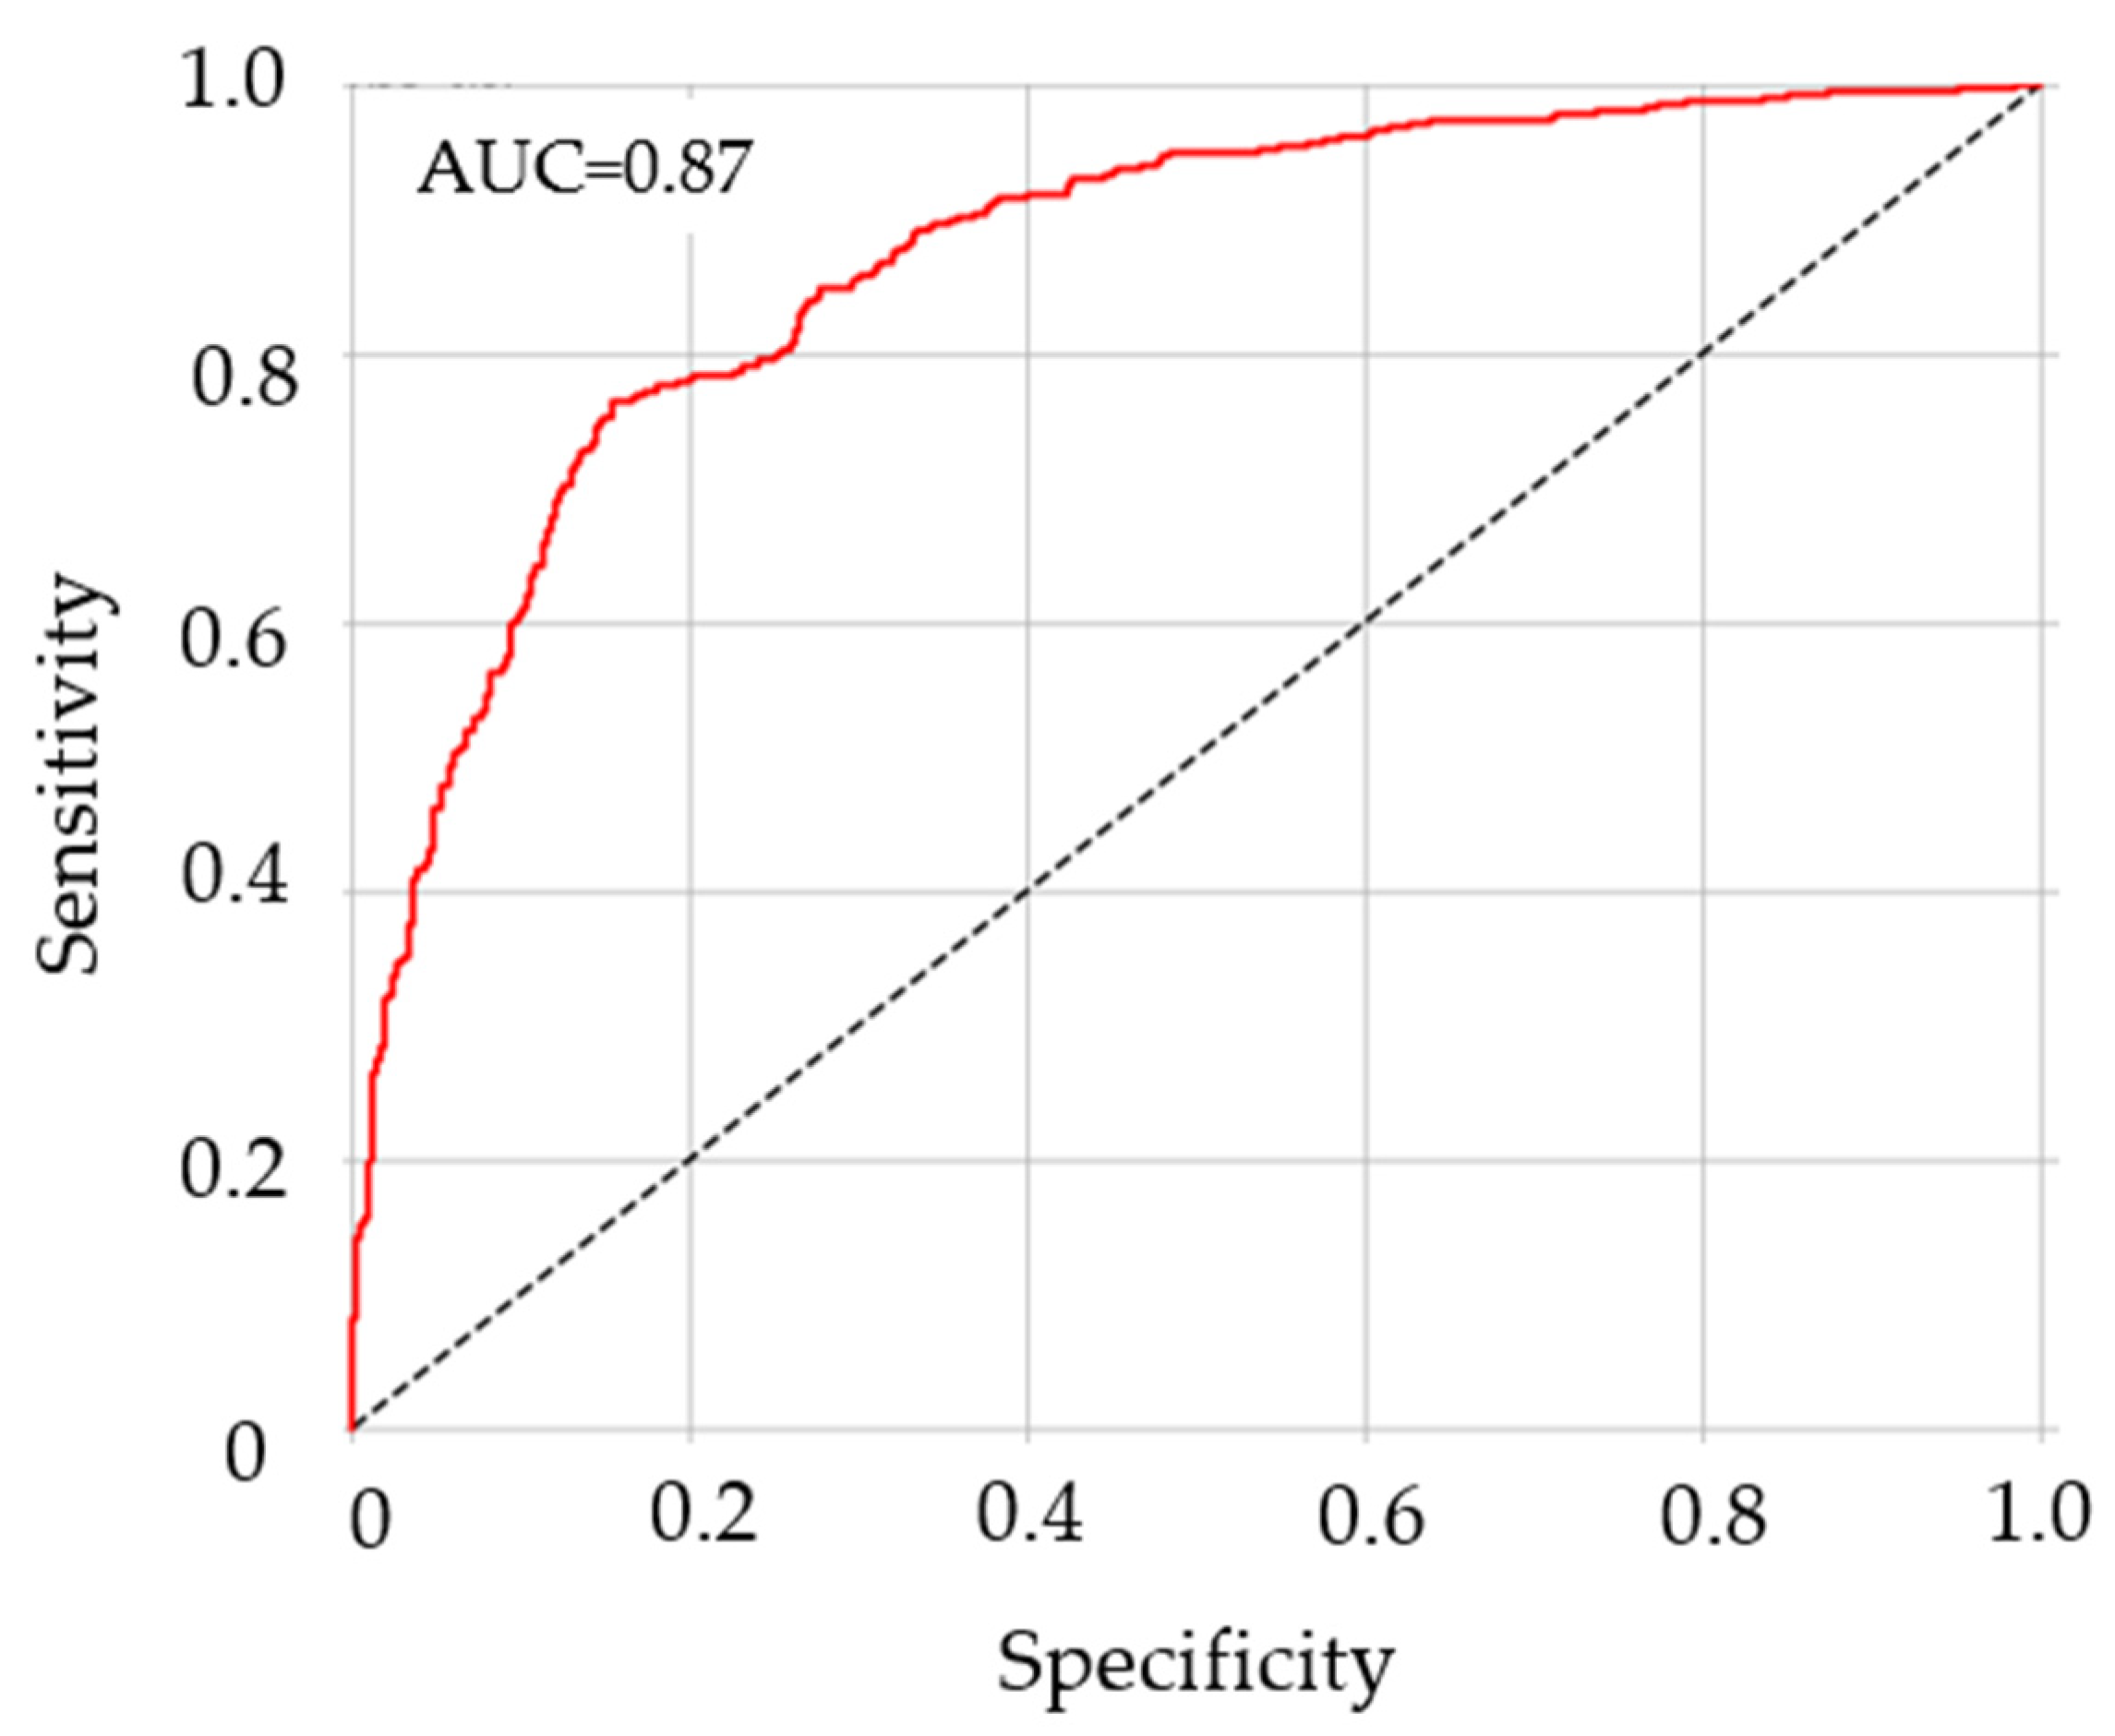
5.1. Model Parameter Settings and Accuracy Verification
5.2. Susceptibility Assessment Results
5.3. Impact Factor Importance Analysis
6. Conclusions
Author Contributions
Funding
Data Availability Statement
Acknowledgments
Conflicts of Interest
References
- He, F.; Tan, S.; Liu, H. Mechanism of rainfall induced landslides in Yunnan Province using multi-scale spatiotemporal analysis and remote sensing interpretation. Microprocess. Microsyst. 2022, 90, 104502. [Google Scholar] [CrossRef]
- Suvam, H.; Sarkar, S.; Kanungo, D. GIS-based landslide susceptibility zonation mapping using the analytic hierarchy process (AHP) method in parts of Kalimpong Region of Darjeeling Himalaya. Environ. Monit. Assess. 2022, 194, 234. [Google Scholar]
- Panchal, S.; Shrivastava, A.K. Landslide hazard assessment using analytic hierarchy process (AHP): A case study of National Highway 5 in India. Ain Shams Eng. J. 2022, 13, 101626. [Google Scholar] [CrossRef]
- Li, Y.; Deng, X.; Ji, P.; Yang, Y.; Jiang, W.; Zhao, Z. Evaluation of Landslide Susceptibility Based on CF-SVM in Nujiang Prefecture. Int. J. Environ. Res. Public Health 2022, 19, 14248. [Google Scholar] [CrossRef] [PubMed]
- Li, Y.Y.; Mei, H.B.; Ren, X.J.; Hu, X.; Li, M. Geological disaster susceptibility evaluation based on certainty factor and support vector machine. J. Geo-Inf. Sci. 2018, 20, 1699–1709. [Google Scholar] [CrossRef]
- Van Dao, D.; Jaafari, A.; Bayat, M.; Mafi-Gholami, D.; Qi, C.; Moayedi, H.; Van Phong, T.; Ly, H.-B.; Le, T.-T.; Trinh, P.T.; et al. A spatially explicit deep learning neural network model for the prediction of landslide susceptibility. Catena 2020, 188, 104451. [Google Scholar] [CrossRef]
- Wu, X.; Ren, F.; Niu, R. Landslide susceptibility assessment using object mapping units, decision tree, and support vector machine models in the Three Gorges of China. Environ. Earth Sci. 2013, 71, 4725–4738. [Google Scholar] [CrossRef]
- Sun, D.; Wen, H.; Wang, D.; Xu, J. A random forest model of landslide susceptibility mapping based on hyperparameter optimization using Bayes algorithm. Geomorphology 2020, 362, 107201. [Google Scholar] [CrossRef]
- Arabameri, A.; Saha, S.; Roy, J.; Chen, W.; Blaschke, T.; Bui, D.T. Landslide Susceptibility Evaluation and Management Using Different Machine Learning Methods in The Gallicash River Watershed, Iran. Remote Sens. 2020, 12, 475. [Google Scholar] [CrossRef]
- He, Q.; Wang, M.; Liu, K. Rapidly assessing earthquake-induced landslide susceptibility on a global scale using random forest. Geomorphology 2021, 391, 107889. [Google Scholar] [CrossRef]
- Wang, X.Q.; Ding, M.T.; He, Y.F. Assessment of debris flow vulnerability in Xiangcheng County, Ganzi Tibetan Autonomous Prefecture based on RF model. J. Catastrophol. 2023, 38, P642. [Google Scholar]
- Reichenbach, P.; Rossi, M.; Malamud, B.D.; Mihir, M.; Guzzetti, F. A review of statistically-based landslide susceptibility models. Earth Sci. Rev. 2018, 180, 60–91. [Google Scholar] [CrossRef]
- Devara, M.; Tiwari, A.; Dwivedi, R. Landslide susceptibility mapping using MT-InSAR and AHP enabled GIS-based multi-criteria decision analysis. Geomat. Nat. Hazards Risk 2021, 12, 675–693. [Google Scholar] [CrossRef]
- Yang, S.; Li, D.Y.; Yan, L.X.; Huang, Y.; Wang, M.Z. Landslide Susceptibility Assessment in High and Steep Bank Slopes along Wujiang River Based on Random Forest Model. Saf. Environ. Eng. 2021, 28, 131–138. [Google Scholar] [CrossRef]
- Huang, L.X.; Hao, M.J.; Li, W.P.; Zhaoye, Z.; Peiqian, J. Evaluation of Landslide Susceptibility Based on RBF Neural Network-Information Coupling Model: A Case Study of Min County, Gansu Province. Chin. J. Geol. Hazard Control 2021, 32, 116–126. [Google Scholar] [CrossRef]
- Wang, X.D.; Zhang, C.B.; Wang, C. Geological Disaster Susceptibility in Helong City Based on Logistic Regression and Random Forest. J. Jilin Univ. (Earth Sci. Ed.) 2022, 52, 1957–1970. [Google Scholar] [CrossRef]
- Li, M.; Zhang, L.; Yang, M.; Liao, M. Complex surface displacements of the Nanyu landslide in Zhouqu, China revealed by multi-platform InSAR observations. Eng. Geol. Eng. Geol. 2023, 317, 107069. [Google Scholar] [CrossRef]
- Kouhartsiouk, D.; Perdikou, S. The application of DInSAR and Bayesian statistics for the assessment of landslide susceptibility. Nat. Hazards 2021, 105, 2957–2985. [Google Scholar] [CrossRef]
- Ran, P.; Li, S.; Zhuo, G.; Wang, X.; Meng, M.; Liu, L.; Chen, Y.; Huang, H.; Ye, Y.; Lei, X. Early Identification and Influencing Factors Analysis of Active Landslides in Mountainous Areas of Southwest China Using SBAS−InSAR. Sustainability 2023, 15, 4366. [Google Scholar] [CrossRef]
- Wang, Y.; Dong, J.; Zhang, L.; Deng, S.; Zhang, G.; Liao, M.; Gong, J. Automatic detection and update of landslide inventory before and after impoundments at the Lianghekou reservoir using Sentinel-1 InSAR. Int. J. Appl. Earth Obs. Geoinf. 2023, 118, 103224. [Google Scholar] [CrossRef]
- Lauknes, T.R.; Zebker, H.A.; Larsen, Y. InSAR Deformation Time Series Using an L1-Norm Small-Baseline Approach. IEEE Trans. Geosci. Remote Sens. 2011, 49, 536–546. [Google Scholar] [CrossRef]
- Schmidt, D.A.; Bürgmann, R. Time-dependent land uplift and subsidence in the Santa Clara valley, California, from a large interferometric synthetic aperture radar data set: Santa Clara Valley INSAR Time Series. J. Geophys. Res. Solid Earth 2003, 108, B002267. [Google Scholar] [CrossRef]
- Lauknes, T.; Shanker, A.P.; Dehls, J.; Zebker, H.; Henderson, I.; Larsen, Y. Detailed rockslide mapping in northern Norway with small baseline and persistent scatterer interferometric SAR time series methods. Remote Sens. Environ. 2010, 114, 2097–2109. [Google Scholar] [CrossRef]
- Berardino, P.; Fornaro, G.; Lanari, R.; Sansosti, E. A new algorithm for surface deformation monitoring based on small baseline differential SAR interferograms. IEEE Trans. Geosci. Remote Sens. 2002, 40, 2375–2383. [Google Scholar] [CrossRef]
- Breiman, L. Random forests. Mach. Learn. 2001, 45, 5–32. [Google Scholar] [CrossRef]
- Wu, X.; Song, Y.; Chen, W.; Kang, G.; Qu, R.; Wang, Z.; Wang, J.; Lv, P.; Chen, H. Analysis of Geological Hazard Susceptibility of Landslides in Muli County Based on Random Forest Algorithm. Sustainability 2023, 15, 4328. [Google Scholar] [CrossRef]
- Sangeeta; Singh, S.K. Influence of anthropogenic activities on landslide susceptibility: A case study in Solan district, Himachal Pradesh, India. J. Mt. Sci. 2023, 20, 429–447. [Google Scholar] [CrossRef]
- Addis, A. GIS-Based Landslide Susceptibility Mapping Using Frequency Ratio and Shannon Entropy Models in Dejen District, Northwestern Ethiopia. J. Eng. 2023, 2023, 1–14. [Google Scholar] [CrossRef]
- Mao, Y.P.; Wu, B.Q.; He, W.Y.; Yu, W.X.; Yang, J.W. The neotectonic movement and the chronological feature of active fault in yunnan. J. Seismol. Res. 1997, 20, 98–106. [Google Scholar]
- Huang, H. Research on Landslide Susceptibility Evaluation Based on Time Series InSAR Technology; Liaoning University of Science and Technology: Anshan, China, 2021. [Google Scholar] [CrossRef]
- Tian, C.Y.; Zhang, W.; Zhang, G. Evaluation of Geological Disaster Vulnerability in Xifeng County Based on Information Content Method. J. Cap. Norm. Univ. (Nat. Sci. Ed.) 2020, 41, 32–40. [Google Scholar]
- Xu, J.H.; Sun, D.L.; Wang, Y.; Wen, H.; Wang, D. Landslide Susceptibility Mapping of Fegjie County Based on GIS and Improved Analytic Hierarchy Process. J. Chongqing Norm. Univ. (Nat. Sci.) 2020, 37, 36–44. [Google Scholar] [CrossRef]
- Chen, X.Y.; Shi, Y.; Wen, Y.X.; Shi, R.Y.; Mi, X.M. Landslide susceptibility evaluation based on certainty factor support vector machines. Sci. Technol. Eng. 2023, 23, 518–527. [Google Scholar]


| Track Number | Number of Images | Interfere Pairs/Piece |
|---|---|---|
| 26 | 120 | 237 |
| 99 | 116 | 229 |
| 128 | 121 | 239 |
| 172 | 117 | 231 |
| Data Source | Data Name | Type | Scales |
|---|---|---|---|
| Geo-monitoring cloud platform | DEM | Raster | 30 m |
| Slope | Raster | 30 m | |
| Aspect | Raster | 30 m | |
| Rainfall | Vector | 1000 m | |
| Resource Science Data Center, Chinese Academy of Sciences | Road | Vector | 1:100,000 |
| River | Vector | 1:100,000 | |
| Fault | Vector | 1:100,000 | |
| Lithology | Vector | 1:10,000 | |
| NDVI | Raster | 30 m | |
| Terrain undulation | Raster | 90 m | |
| Optical image sketching | Landslide disaster points | Vector | |
| Annual average deformation rate | Sentinel-1 data |
| DEM Grading (m) | Number of Landslide Disasters | Proportion of Total Disasters (%) |
|---|---|---|
| 0–1000 | 213 | 15 |
| 1000–2000 | 846 | 61 |
| 2000–3000 | 229 | 17 |
| 3000–4000 | 70 | 5 |
| 4000–6700 | 27 | 2 |
| Slope Grading (°) | Number of Landslide Disasters | Proportion of Total Disasters (%) |
|---|---|---|
| <10 | 69 | 5 |
| 10–20 | 282 | 21 |
| 20–30 | 438 | 32 |
| 30–40 | 411 | 30 |
| 40–50 | 131 | 10 |
| >50 | 23 | 2 |
| Aspect Grading (°) | Number of Landslide Disasters | Proportion of Total Disasters (%) |
|---|---|---|
| −1 | 1 | 0 |
| 337.5–22.5 | 141 | 11 |
| 22.5–67.5 | 123 | 9 |
| 67.5–112.5 | 180 | 13 |
| 112.5–157.5 | 258 | 19 |
| 157.5–202.5 | 190 | 14 |
| 202.5–247.5 | 191 | 14 |
| 247.5–292.5 | 140 | 11 |
| 292.5–337.5 | 125 | 9 |
| NDVI Grading | Number of Landslide Disasters | Proportion of Total Disasters (%) |
|---|---|---|
| Plain | 6 | 0 |
| Mesa | 10 | 1 |
| Hilly | 29 | 2 |
| Small undulating mountains | 210 | 15 |
| Medium undulating mountains | 709 | 52 |
| Large undulating mountains | 372 | 27 |
| Extremely large undulating mountains | 36 | 3 |
| Distance from Fault Classification (m) | Number of Landslide Disasters | Proportion of Total Disasters (%) |
|---|---|---|
| 0–400 | 31 | 2 |
| 400–800 | 31 | 2 |
| 800–1200 | 33 | 2 |
| 1200–1600 | 39 | 3 |
| 1600–2000 | 22 | 2 |
| 2000–2400 | 26 | 2 |
| >2400 | 1202 | 87 |
| Lithological Classification Grading | Number of Landslide Disasters | Proportion of Total Disasters (%) |
|---|---|---|
| Harder rock sandwiching soft rock | 232 | 17 |
| Harder rock | 180 | 13 |
| Harder rock sandwiching softer rock | 360 | 26 |
| Loose hard rock sandwiching softer rock | 19 | 1 |
| Hard rock | 214 | 16 |
| Hard rock sandwiching soft rock | 158 | 12 |
| Softer rock | 27 | 2 |
| Loose body | 11 | 1 |
| Water body | 0 | 0 |
| Soft rock | 158 | 12 |
| Distance from River Classification (m) | Number of Landslide Disasters | Proportion of Total Disasters (%) |
|---|---|---|
| 0–400 | 94 | 4 |
| 400–800 | 63 | 3 |
| 800–1200 | 54 | 2 |
| 1200–1600 | 43 | 3 |
| 1600–2000 | 46 | 2 |
| 2000–2400 | 47 | 2 |
| >2400 | 1037 | 86 |
| Average Annual Rainfall Grading (m) | Number of Landslide Disasters | Proportion of Total Disasters (%) |
|---|---|---|
| 1.3–2.0 | 112 | 8 |
| 2.0–3.0 | 565 | 41 |
| 3.0–4.0 | 385 | 28 |
| 4.0–5.0 | 279 | 21 |
| >5.0 | 29 | 2 |
| Distance from River Classification (m) | Number of Landslide Disasters | Proportion of Total Disasters (%) |
|---|---|---|
| 0–400 | 56 | 4 |
| 400–800 | 41 | 3 |
| 800–1200 | 29 | 2 |
| 1200–1600 | 26 | 3 |
| 1600–2000 | 22 | 2 |
| 2000–2400 | 25 | 2 |
| >2400 | 1185 | 86 |
| NDVI Grade | Number of Landslide Disasters | Proportion of Total Disasters (%) |
|---|---|---|
| −0.06–0.3 | 6 | 0 |
| 0.3–0.4 | 35 | 3 |
| 0.4–0.5 | 73 | 5 |
| 0.5–0.6 | 193 | 14 |
| 0.6–0.7 | 489 | 36 |
| 0.7–0.8 | 536 | 39 |
| 0.8–0.9 | 37 | 3 |
| Parameter Settings | Mean Square Error | Accuracy | Area under Curve |
|---|---|---|---|
| Default parameters | 0.23 | 0.77 | 0.85 |
| n_estimators = 86, max_features = 3, max_depth = 10 | 0.20 | 0.80 | 0.87 |
| n_estimators = 86, max_features = 2, max_depth = 10, min_samples_split = 20, min_samples_leaf = 2 | 0.21 | 0.79 | 0.86 |
| RF Prediction | True Value | Recall | |
|---|---|---|---|
| Landslide | Non-Landslide | ||
| Landslide | 343 | 72 | 0.83 |
| Non-landslide | 95 | 321 | 0.77 |
| Precision | 0.78 | 0.82 | |
| Degree of Susceptibility | Number of Landslides/Pcs | Proportion of Landslides/(%) | Zoning Area/km2 | Proportion of Area/(%) | Hazard Points Density/ Place/10,000 km2 |
|---|---|---|---|---|---|
| Low-susceptibility areas | 13 | 1 | 130,066 | 34 | 1 |
| Lower-susceptibility areas | 36 | 3 | 90,291 | 23 | 4 |
| Medium-susceptibility areas | 131 | 9 | 76,607 | 20 | 16 |
| Higher-susceptibility areas | 264 | 19 | 49,536 | 13 | 53 |
| High-susceptibility areas | 941 | 68 | 37,317 | 10 | 235 |
Disclaimer/Publisher’s Note: The statements, opinions and data contained in all publications are solely those of the individual author(s) and contributor(s) and not of MDPI and/or the editor(s). MDPI and/or the editor(s) disclaim responsibility for any injury to people or property resulting from any ideas, methods, instructions or products referred to in the content. |
© 2023 by the authors. Licensee MDPI, Basel, Switzerland. This article is an open access article distributed under the terms and conditions of the Creative Commons Attribution (CC BY) license (https://creativecommons.org/licenses/by/4.0/).
Share and Cite
Liu, M.; Xu, B.; Li, Z.; Mao, W.; Zhu, Y.; Hou, J.; Liu, W. Landslide Susceptibility Zoning in Yunnan Province Based on SBAS-InSAR Technology and a Random Forest Model. Remote Sens. 2023, 15, 2864. https://doi.org/10.3390/rs15112864
Liu M, Xu B, Li Z, Mao W, Zhu Y, Hou J, Liu W. Landslide Susceptibility Zoning in Yunnan Province Based on SBAS-InSAR Technology and a Random Forest Model. Remote Sensing. 2023; 15(11):2864. https://doi.org/10.3390/rs15112864
Chicago/Turabian StyleLiu, Meiyu, Bing Xu, Zhiwei Li, Wenxiang Mao, Yan Zhu, Jingxin Hou, and Weizheng Liu. 2023. "Landslide Susceptibility Zoning in Yunnan Province Based on SBAS-InSAR Technology and a Random Forest Model" Remote Sensing 15, no. 11: 2864. https://doi.org/10.3390/rs15112864