Technical Note

Baseline Calibration of L-Band Spaceborne Bistatic SAR TwinSAR-L for DEM Generation

1
National Key Laboratory of Microwave Imaging Technology, Aerospace Information Research Institute, Chinese Academy of Sciences, Beijing 100190, China
2
School of Electronic, Electrical and Communication Engineering, University of Chinese Academy of Sciences, Beijing 100049, China
3
China Center for Resources Satellite Data and Application, Beijing 100049, China
*
Author to whom correspondence should be addressed.
Remote Sens. 2023, 15(12), 3024; https://doi.org/10.3390/rs15123024
Submission received: 9 April 2023 / Revised: 7 June 2023 / Accepted: 8 June 2023 / Published: 9 June 2023

Abstract

:
The Terrain Wide-swath Interferometric L-band Synthetic Aperture Radar (TwinSAR-L) mission is a spaceborne bistatic synthetic aperture radar (SAR) mission to derive a high-quality global digital elevation model (DEM). The prerequisite of the high-accuracy DEM is knowing the interferometric baseline with high precision. The challenging problem is that the baseline of the bistatic system is highly dynamic due to the fast relative motion between the two satellites. In this paper, a pixel-related baseline model based on the geometrical shift is proposed to accurately reflect the position change of satellites. The baseline error is then calibrated using height gradient information and a small number of point targets with a slight incidence angle difference, eliminating the need for low-frequency corner reflectors and avoiding the difficulty of selecting a calibration site. The proposed method has been successfully exploited during the initial Commissioning Phase of TwinSAR-L, demonstrating its effectiveness in evaluating the precise baseline and supporting the generation of high-precision DEM.

1. Introduction

The bistatic SAR system, which operates with distinct transmit and receive antennas mounted on separate platforms, enables new radar imaging modes [1]. The spatial separation between the antennas enhances the system’s capability, flexibility, and performance, allowing for the acquisition of novel information products [2,3]. The Terrain Wide-swath Interferometric L-band Synthetic Aperture Radar (TwinSAR-L) mission is a spaceborne bistatic SAR mission based on two low-orbit L-band multi-channel fully polarized twin SAR satellites, also called LuTan-1 [4]. The TwinSAR-L mission consists of Satellites A and B, launched on 26 January 2022, and 27 February 2022, respectively. Currently, the bistatic system TwinSAR-L is in the in-orbit Commissioning Phase. The launch of TwinSAR-L marks a new milestone in the Chinese space program and effectively addresses the gaps in China’s SAR remote sensing capabilities, specifically in spaceborne L-band interferometry, differential interferometry, and full-polarization interferometry [5]. In addition, the TwinSAR-L mission is essential to the medium- and long-term development plan for China’s civil space infrastructure [6].
The TwinSAR-L has several operation modes that provide significant space technology support for global observation, such as geological disaster detection, deformation measurement, and forest survey with wide-swath and high-quality images [7]. The bistatic interferometry mode is one of the critical operation modes for generating consistent and global digital elevation models (DEMs) with a height accuracy of 5 m [8]. Accurate and timely DEMs are crucial in various commercial and scientific applications [9]. The precise information on Earth’s surface and topography are essential components of numerous geoscience fields, including hydrology, glaciology, forestry, geology, oceanography, and land environment [10,11,12].
The accuracy of DEM generated by interferometric SAR (InSAR) is affected by various errors, such as the unwrapped phase error, systematic delay error, and interferometric baseline error [13]. Among them, the interferometric baseline significantly impacts the accuracy of DEM, and the inaccuracies in the baseline at the millimeter level can result in height errors at the meter level [14]. Therefore, the foundation of high-precision DEM is that the bistatic system has obtained the precise baseline, and the accuracy requirement of the baseline for TwinSAR-L is 6 mm (1 δ ) [15].
In the repeat-pass InSAR system, the interferometric baseline is generally described by a time-linear model [16,17,18], i.e., the baseline changes linearly over azimuth time. However, unlike the stable orbit of the repeat-pass satellite, the baseline of the bistatic system is highly dynamic due to the TwinSAR-L flying in a helix constellation [4]. The linear baseline model cannot reflect the factual baseline of the bistatic system, which is proved by the fact that the geometric shifts between the master satellite and slave satellite of TwinSAR-L are not linearly changing with time. Therefore, a new baseline model is demanded to accurately reflect the fast relative motion between the two satellites.
However, the baseline extraction is ultimately based on orbital state vectors of satellites determined by the integrated Global Positioning System (GPS) navigation receivers. The uncertainty in relative radio-frequency phase center positions can introduce biases in the relative satellite positions determined through GPS measurements and result in a residual baseline error [19], which needs to be detected and compensated before the generation of DEM. Various studies have been devoted to deriving the baseline error, which can be roughly classified into two categories.
The first category is based on fitting the residual phase interferogram [20,21,22,23]. A typical method is the first-order approximation linear plane model [24], which modifies the baseline to eliminate the residual phase and obtain the interferogram consistent with the reference interferogram. The InSAR DEM closely matches the reference DEM based on this method. However, the accuracy of the baseline error can be compromised, since this method attributes all residual phase errors to the baseline error, whereas the residual phase errors may also stem from the unwrapped phase error or reference DEM error.
The second category is intrinsically correcting the baseline error based on the baseline calibration model [25,26,27]. A typical calibration method of a high-accuracy baseline for bistatic SAR is proposed by German Aerospace for TanDEM-X [28]. The TanDEM-X utilizes the distributed target DEM of two consecutive interferometric images to calculate the height error and derive the baseline error. However, the calibration method based on the distributed target DEM is unsuitable for the TwinSAR-L system due to the L-band’s long wavelength and strong penetrability. The literature [29] points out that the penetration depth can lead to additional height error in the distributed target. The extra height error caused by penetration depth couples with the height error caused by the baseline error, thus reducing the baseline calibration accuracy. Therefore, the baseline calibration of the TwinSAR-L demands point targets, i.e., corner reflectors, to avoid the problem caused by penetration because the corner reflectors exhibit a high radar cross section (RCS) [30].
Nevertheless, the baseline calibration method operated in TanDEM-X with two consecutive interferometric images is challenging to achieve by point targets. The difficulties for TwinSAR-L to adopt this method are elaborated, as follows. First, the calibration site selection is a formidable task. The TanDEM-X method requires two calibration sites, which should be consecutive in the azimuth direction to minimize the baseline variation and be separated by at least 200 km in the range direction to meet the significant incidence angle difference conditions. Moreover, both sites require adequate transportation and installation facilities for the large corner reflectors. Finally, expanding the area of the calibration site increases the demand for corner reflectors, leading to greater expenses, longer time requirements, and increased labor intensity.
This paper introduces a new pixel-related baseline model based on geometrical shifts and analyzes baseline error sources to construct a corresponding error model. A novel baseline calibration model based on height gradient information is then established, which only requires a few corner reflectors to solve baseline errors. The proposed methods accurately describe the baseline of the bistatic system despite significant dynamic satellite changes and have been successfully used to generate high-precision DEM during the initial Commissioning Phase of TwinSAR-L.
The rest of this paper is organized as follows. Section 2 presents the pixel-related baseline model, analyzes the sources of the baseline error to establish the error model of the bistatic TwinSAR-L interferometer, and proposes the method for solving the baseline error. Section 3 applies the proposed methods to TwinSAR-L data with a reference height of deployed corner reflectors to derive a high-accuracy baseline and generate DEM. Section 4 investigates the influence of baseline on height by the baseline-to-height sensitivity, discusses the impact of penetration depth, and addresses the discontinuity issue between adjacent DEMs. Finally, Section 5 summarizes the conclusions.

2. Materials and Methods

2.1. Baseline Model

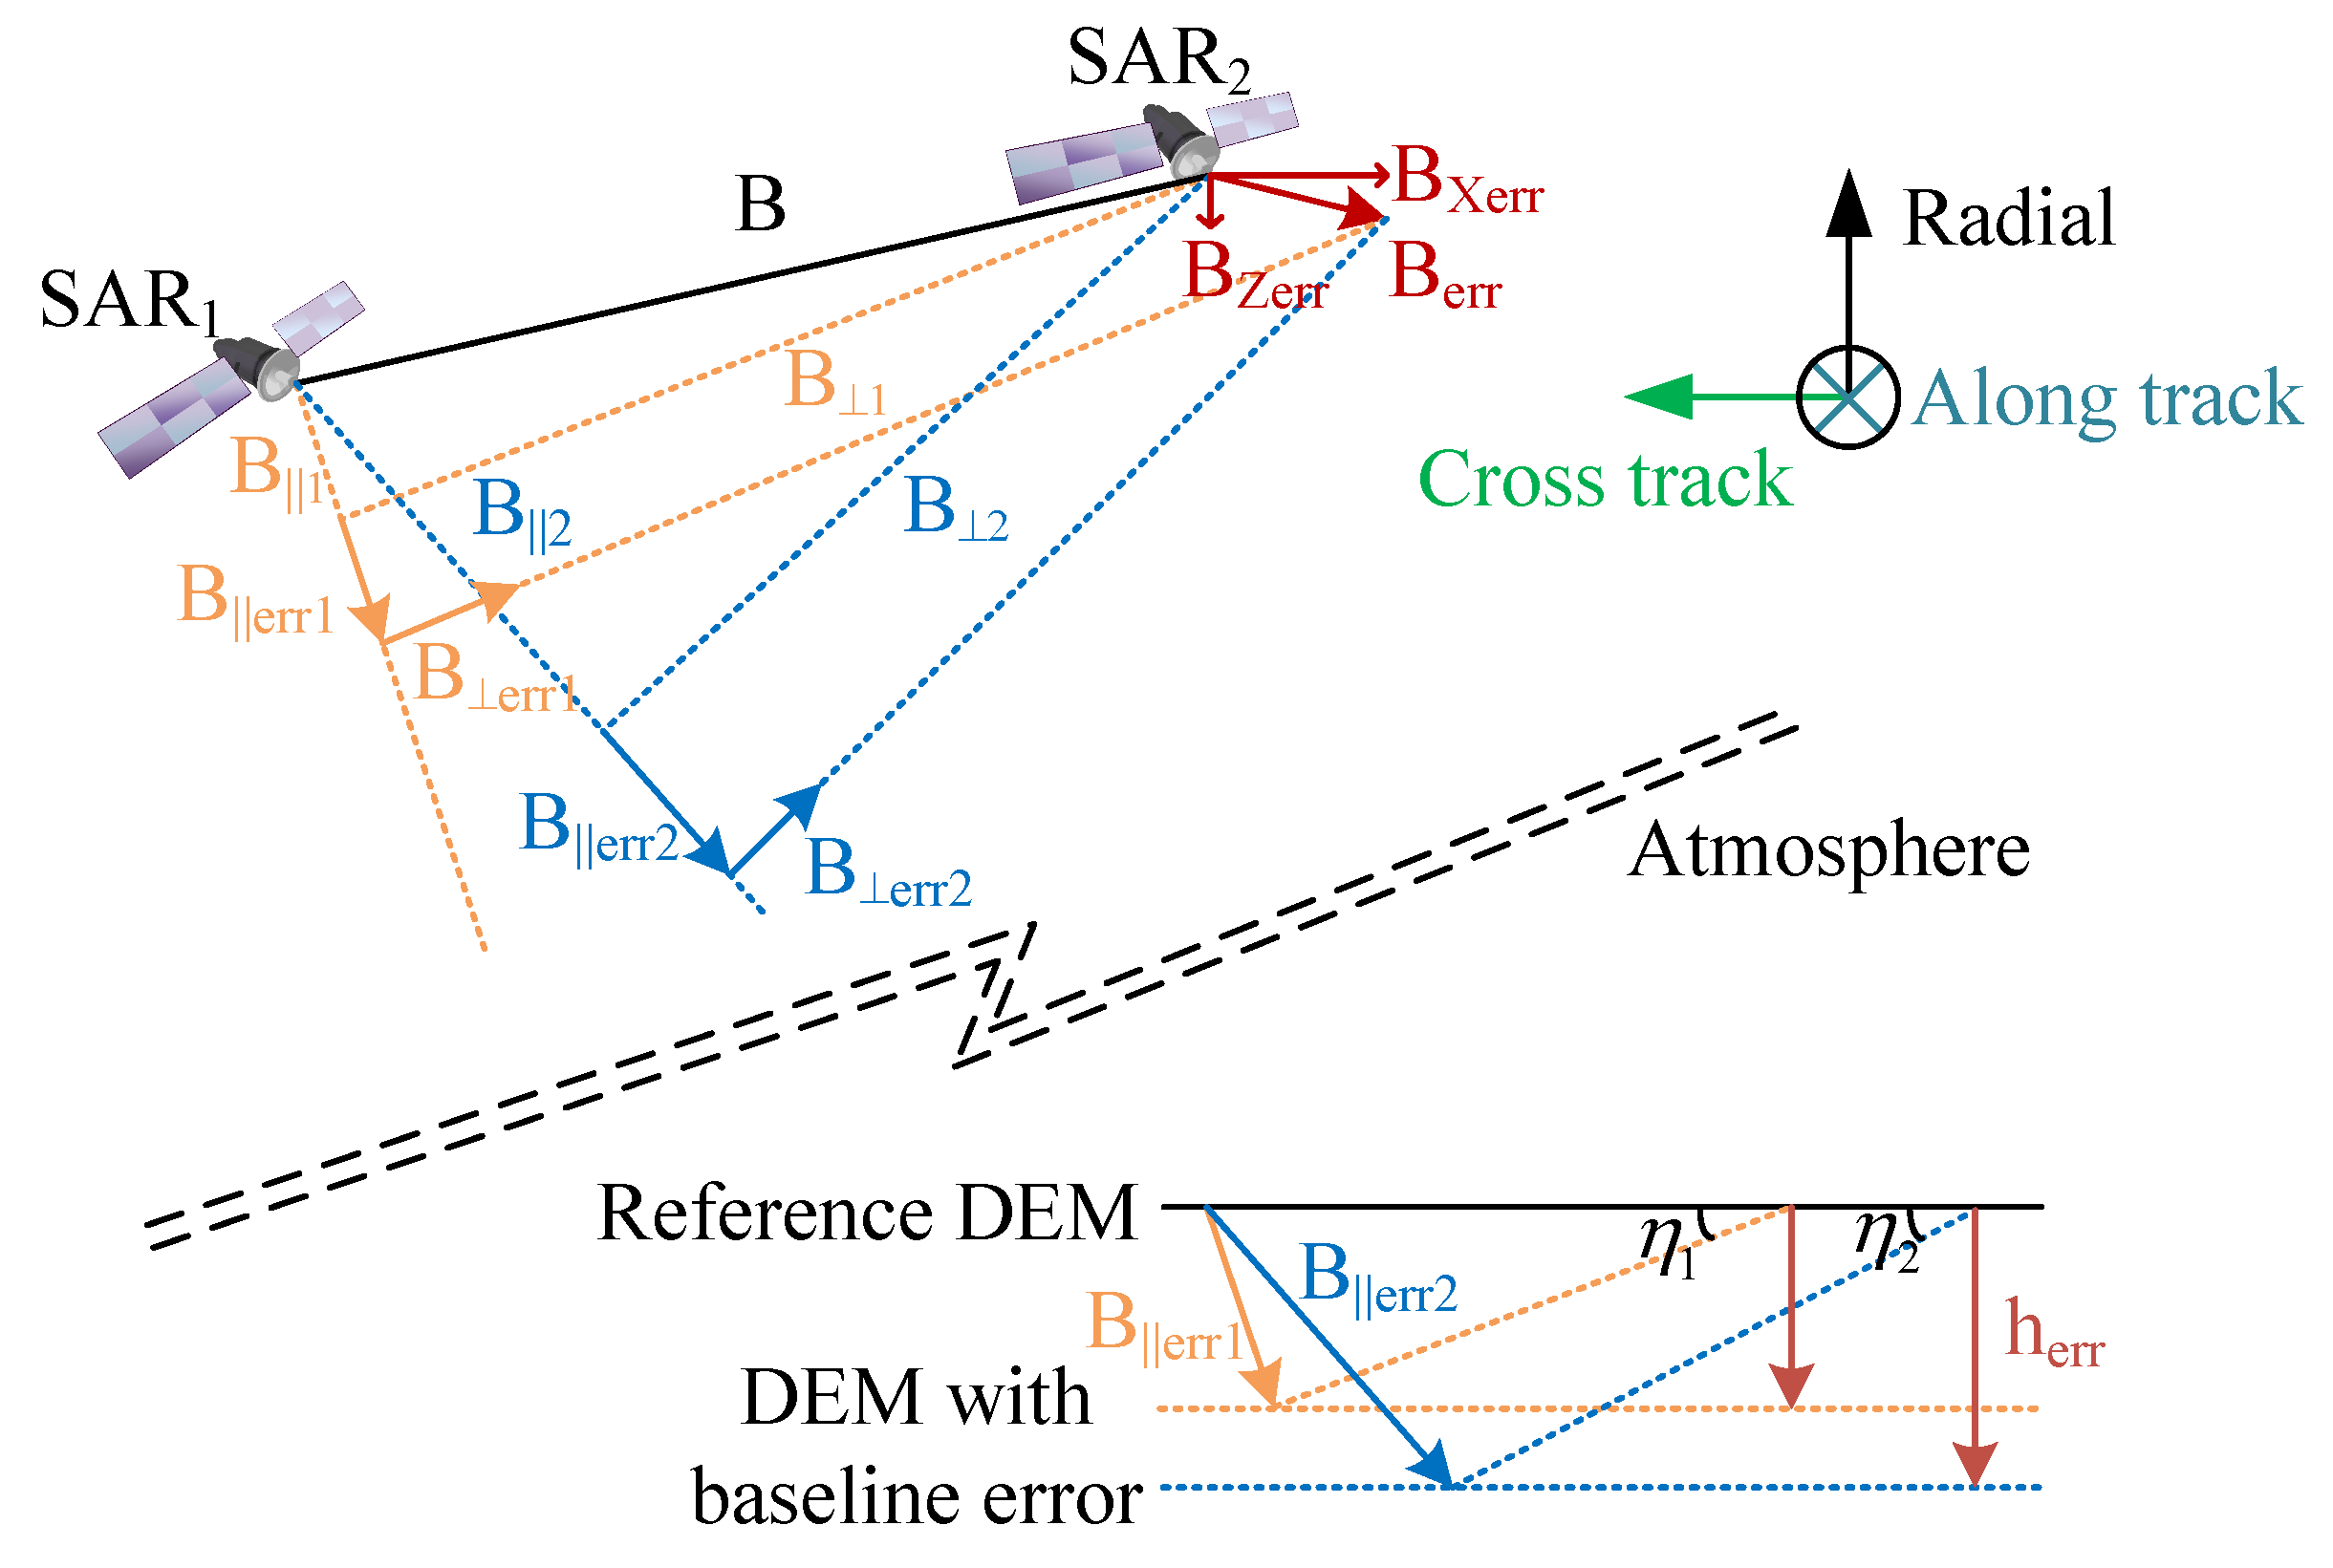
The interferometric baseline is the difference between two SAR antennas centers when the satellites observe the same ground area. The baseline model is established based on the orbit parameters of satellites and the geometric shift, as shown in Figure 1. Assuming the master satellite observes the ground point P at an azimuth time t and orbit position P M , while the slave one observes it for t + Δ t poly az and P S , the corresponding interferometric baseline is:
B ( t ) = P S t + Δ t poly az P M ( t ) .
The relationship between the orbit position and the azimuth time in the Earth-Centered Earth-Fixed (ECEF) coordinate system can be obtained by polynomial fitting:
P S t = X S t Y S t Z S t = k = 0 N k a S k t k k = 0 N k b S k t k k = 0 N k c S k t k , P M t = X M t Y M t Z M t = k = 0 N k a M k t k k = 0 N k b M k t k k = 0 N k c M k t k
where N k is the polynomial degree, and N k is set to 3 in the experiment. a M k , b M k , c M k , a S k , b S k , and c S k are the polynomial coefficients of the master satellite and slave satellite.
The shift of azimuth time Δ t poly az is the polynomial function of the pixel position of the master image. A bivariate quadratic polynomial in Equation (3) is used to express Δ t poly az to characterize the rotation and stretching between the master and slave images.
Δ t poly az ( x az , x rg ) = Δ x poly az ( x az , x rg ) / f a z s = ( a 0 + a 1 x az + a 2 x rg + a 3 x az x rg + a 4 x az 2 + a 5 x rg 2 ) / f a z s
where Δ x poly az ( x az , x rg ) is the polynomial function of azimuth shift, a i is the fitting parameter of the polynomial function; f a z s is the azimuth sampling frequency; x az and x rg are the pixel positions in the azimuth and range directions of the master image, respectively.
The image coregistration obtains the fitting parameters of the polynomial function, and coregistration includes three main procedures [31]: (1) Match the identical points on the master image and slave image based on the correlation coefficient algorithm and derive the geometric shifts of the identical points. (2) The shifts of the identical points with the large coherence coefficient are used to fit the coefficients of the shift polynomial function, i.e., Equation (3). (3) Calculate the new pixel values in the slave image by geometrical transformation and resampling based on the shift polynomial function.
Then, the interferogram is generated by the master image and resampled slave image. Therefore, the coordinates of the interferogram are consistent with the coordinates of the master image. In addition, each interferogram’s baseline model varies because the coregistration and resampling processes are different.
Finally, the pixel-related baseline of the interferogram can be modeled as:
B ( x az , x rg ) E C E F = k = 0 N k a S k t + Δ t poly az N k a M k t N k k = 0 N k b S k t + Δ t poly az N k b M k t N k k = 0 N k c S k t + Δ t poly az N k c M k t N k .

2.2. Baseline Calibration Model

Based on the analysis of systematic errors, the baseline error depends on attitude determination, the SAR antenna phase center, the GPS antenna phase center, and the relative radio-frequency phase center positions [10,13,14].
The attitude of TwinSAR-L is determined by the Star Trackers onboard. The orientation accuracy of TwinSAR-L is 0.01 (3 δ ), and the attitude stability is 5 × 10 4 /s. Based on the error transfer relationship introduced in paper [32], the baseline error caused by the error of attitude determination is less than 0.2 mm, which can be neglected. The phase center of the SAR antenna characterizes the displacement of the phase curve within the coverage region for the antenna coordinate system’s defined origin [13]. In the bistatic mode, the same beams are commanded for both SAR antennas, so the phase center deviations of the two SARs are equal [13]. Thus, the antenna phase center error is a common mode error that can be eliminated for the bistatic SAR. Additionally, the GPS antenna phase center variation can be disregarded because it similarly affects both satellites [13,14].
One crucial factor that cannot be overlooked is the uncertainty associated with the relative radio-frequency phase center positions [10,14], which can introduce biases in the relative satellite positions determined through GPS measurements and result in a tilt of the DEM. According to the engineering experience of GRACE [16] and TanDEM-X [19], the baseline bias is treated as a constant value. In addition, an obvious indication of a constant baseline error in TwinSAR-L is that the height error of TwinSAR-L DEM is not changing with azimuth time. Meanwhile, the height error of TwinSAR-L DEM is a tilt in the range direction due to the change of incidence angle.
The baseline error can be decomposed into one parallel to the line-of-sight (LOS) B e r r and one perpendicular to the LOS B e r r , as shown in Figure 2. B e r r has a critical impact on the height error of the DEM. It creates a differential slant range error that leads to an interferometric phase error, ultimately resulting in height error. Moreover, the baseline error is projected to different LOS directions when the local incidence angle η varies, resulting in various height errors.
To calibrate the baseline, we decompose the baseline in an SAR platform-fixed coordinate system: cross-track (X), along-track (Y), and radial (Z). Mathematically, the unit vectors can be expressed by [14]:
X = P M × V M P M × V M , Y = X × Z , Z = P M P M
where V M is the velocity vector of the master satellite.
Since the registration can eliminate the along-track component of baseline error [28], this paper only focuses on the cross-track and radial components of the baseline error:
B e r r = [ B X e r r , 0 , B Z e r r ] T
where B X e r r and B Z e r r are the cross-track and radial components of the baseline error, respectively; and the superscript T indicates a transpose. Thus, the precise baseline is:
B p r = B + B e r r .
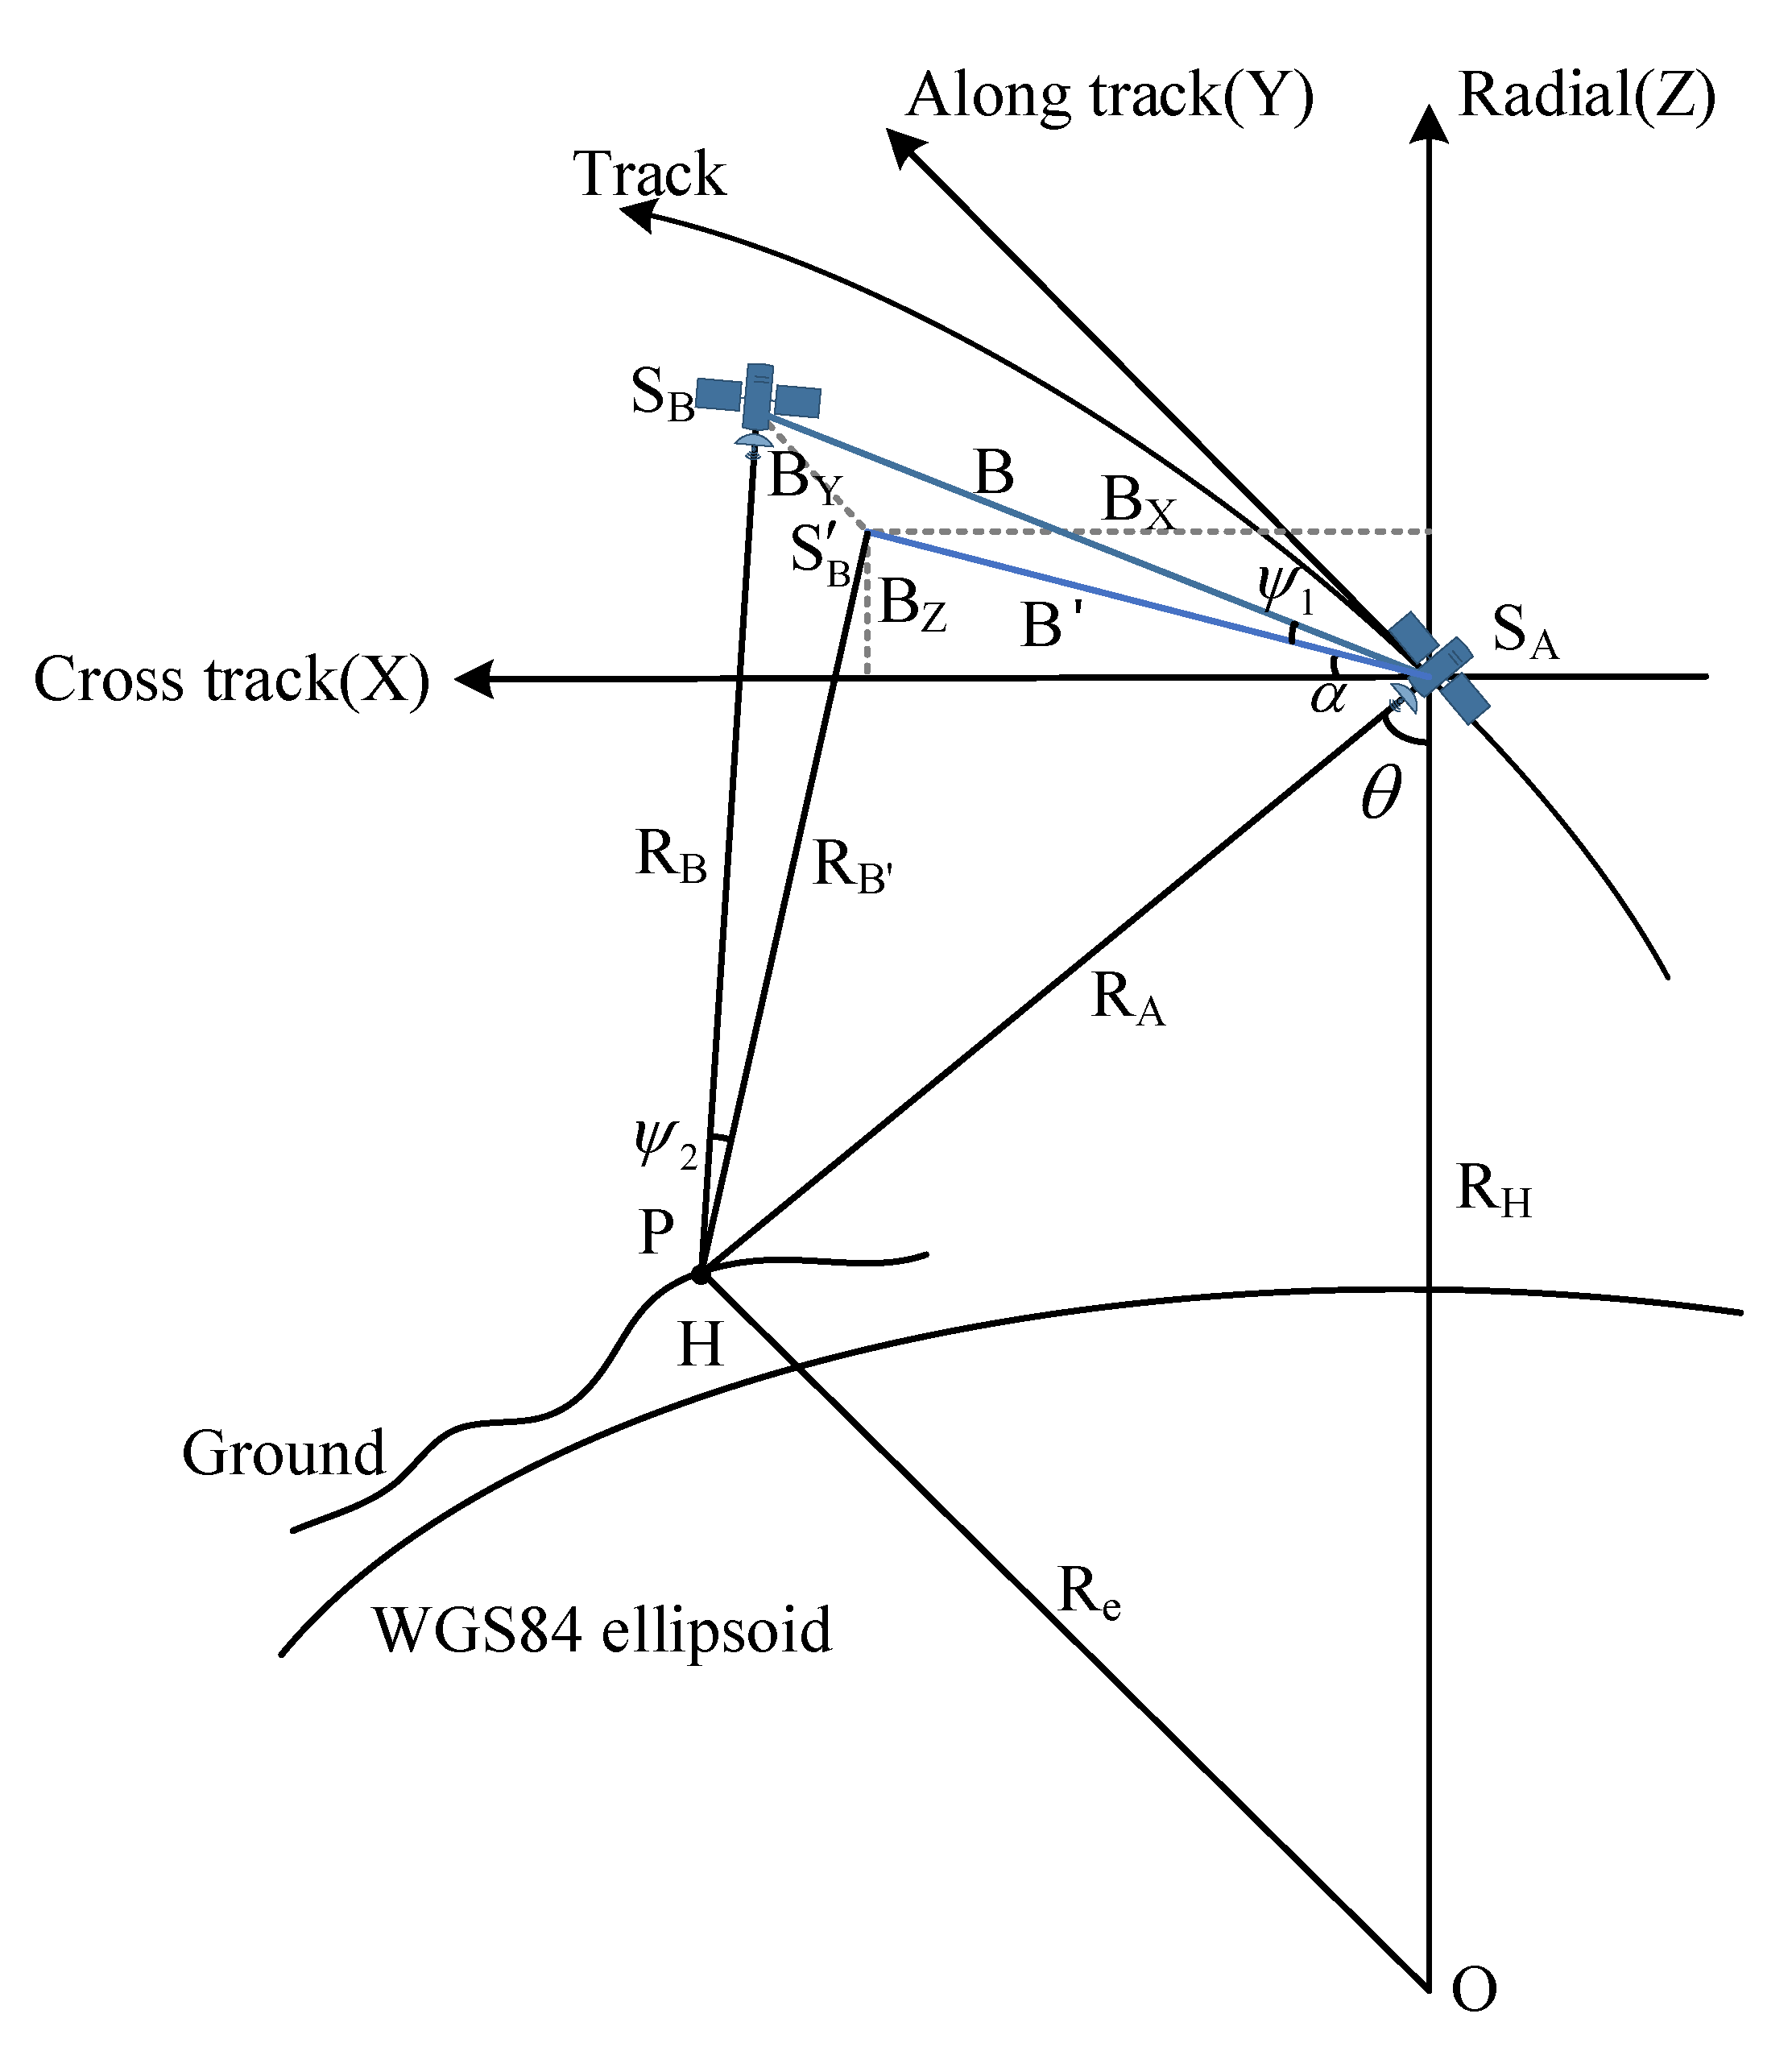
Then, we have to investigate the relationship between the height error and baseline error based on the satellite-earth geometry, as shown in Figure 3. The height of the ground point target P is:
H = R H 2 + R A 2 2 R H R A cos θ R e
where R A is the slant range of the master satellite to the ground point target P; θ is the look angle of the master SAR antenna; R H is the distance from the master satellite to the center of the earth O; and R e is the curvature radius of the earth.
Since the baseline vector B is a three-dimensional vector and is not in the same plane as the look angle, the position of the slave satellite S B needs to be projected onto the plane of the look angle to obtain the position S B . The azimuth angles of the baseline and slave satellite slant range are ψ 1 and ψ 2 , respectively. According to the law of cosines, we can obtain the angle between the side P S A and the side O S A :
θ = π 2 α arccos B 2 + R A 2 R B 2 2 B 2 R A
where B is the baseline length on the projection plane, B = B cos ψ 1 ; α is the elevation angle of the baseline, α = arccos B · X B X ; and R B is the slant range from the slave satellite to the ground point target on the projection plane:
R B = R A + λ 2 π φ cos ψ 2
where φ is the interferometric phase.
Combine Equations (8)–(10) to obtain Equation (11). Finally, the height of the point target can be inverted.
H = R H 2 + R A 2 2 R H R A cos π 2 arccos B · X B X arccos B 2 + R A 2 R B 2 2 B R A R e .
The baseline error can be calculated according to the reference height H r e f of the ground point target:
0 = H r e f H B p r .
Substituting the H B p r by its Taylor series expansion at the initial baseline B , Equation (12) becomes:
0 = H r e f H B + H B X B B X e r r + H B Z B B Z e r r + o n = H r e f H B H B X B d B X + H B Z B d B Z + o n , H B X = 1 / B B X 2 / B 3 1 B X 2 / B 2 B X / R A B B X cos η / B 2 1 cos 2 η ξ , H B Z = B Z / R A B B Z cos η / B 2 1 cos 2 η + B X B Z 1 B X 2 / B 2 B 3 ξ , ξ = R H R A sin π / 2 α β R H 2 + R A 2 2 R H R A cos π / 2 α β , β = arccos B 2 + R A 2 R B 2 2 B R A ,
where o n is the high-order terms. The baseline error can be solved by Equation (13).

2.3. Baseline Calibration Method

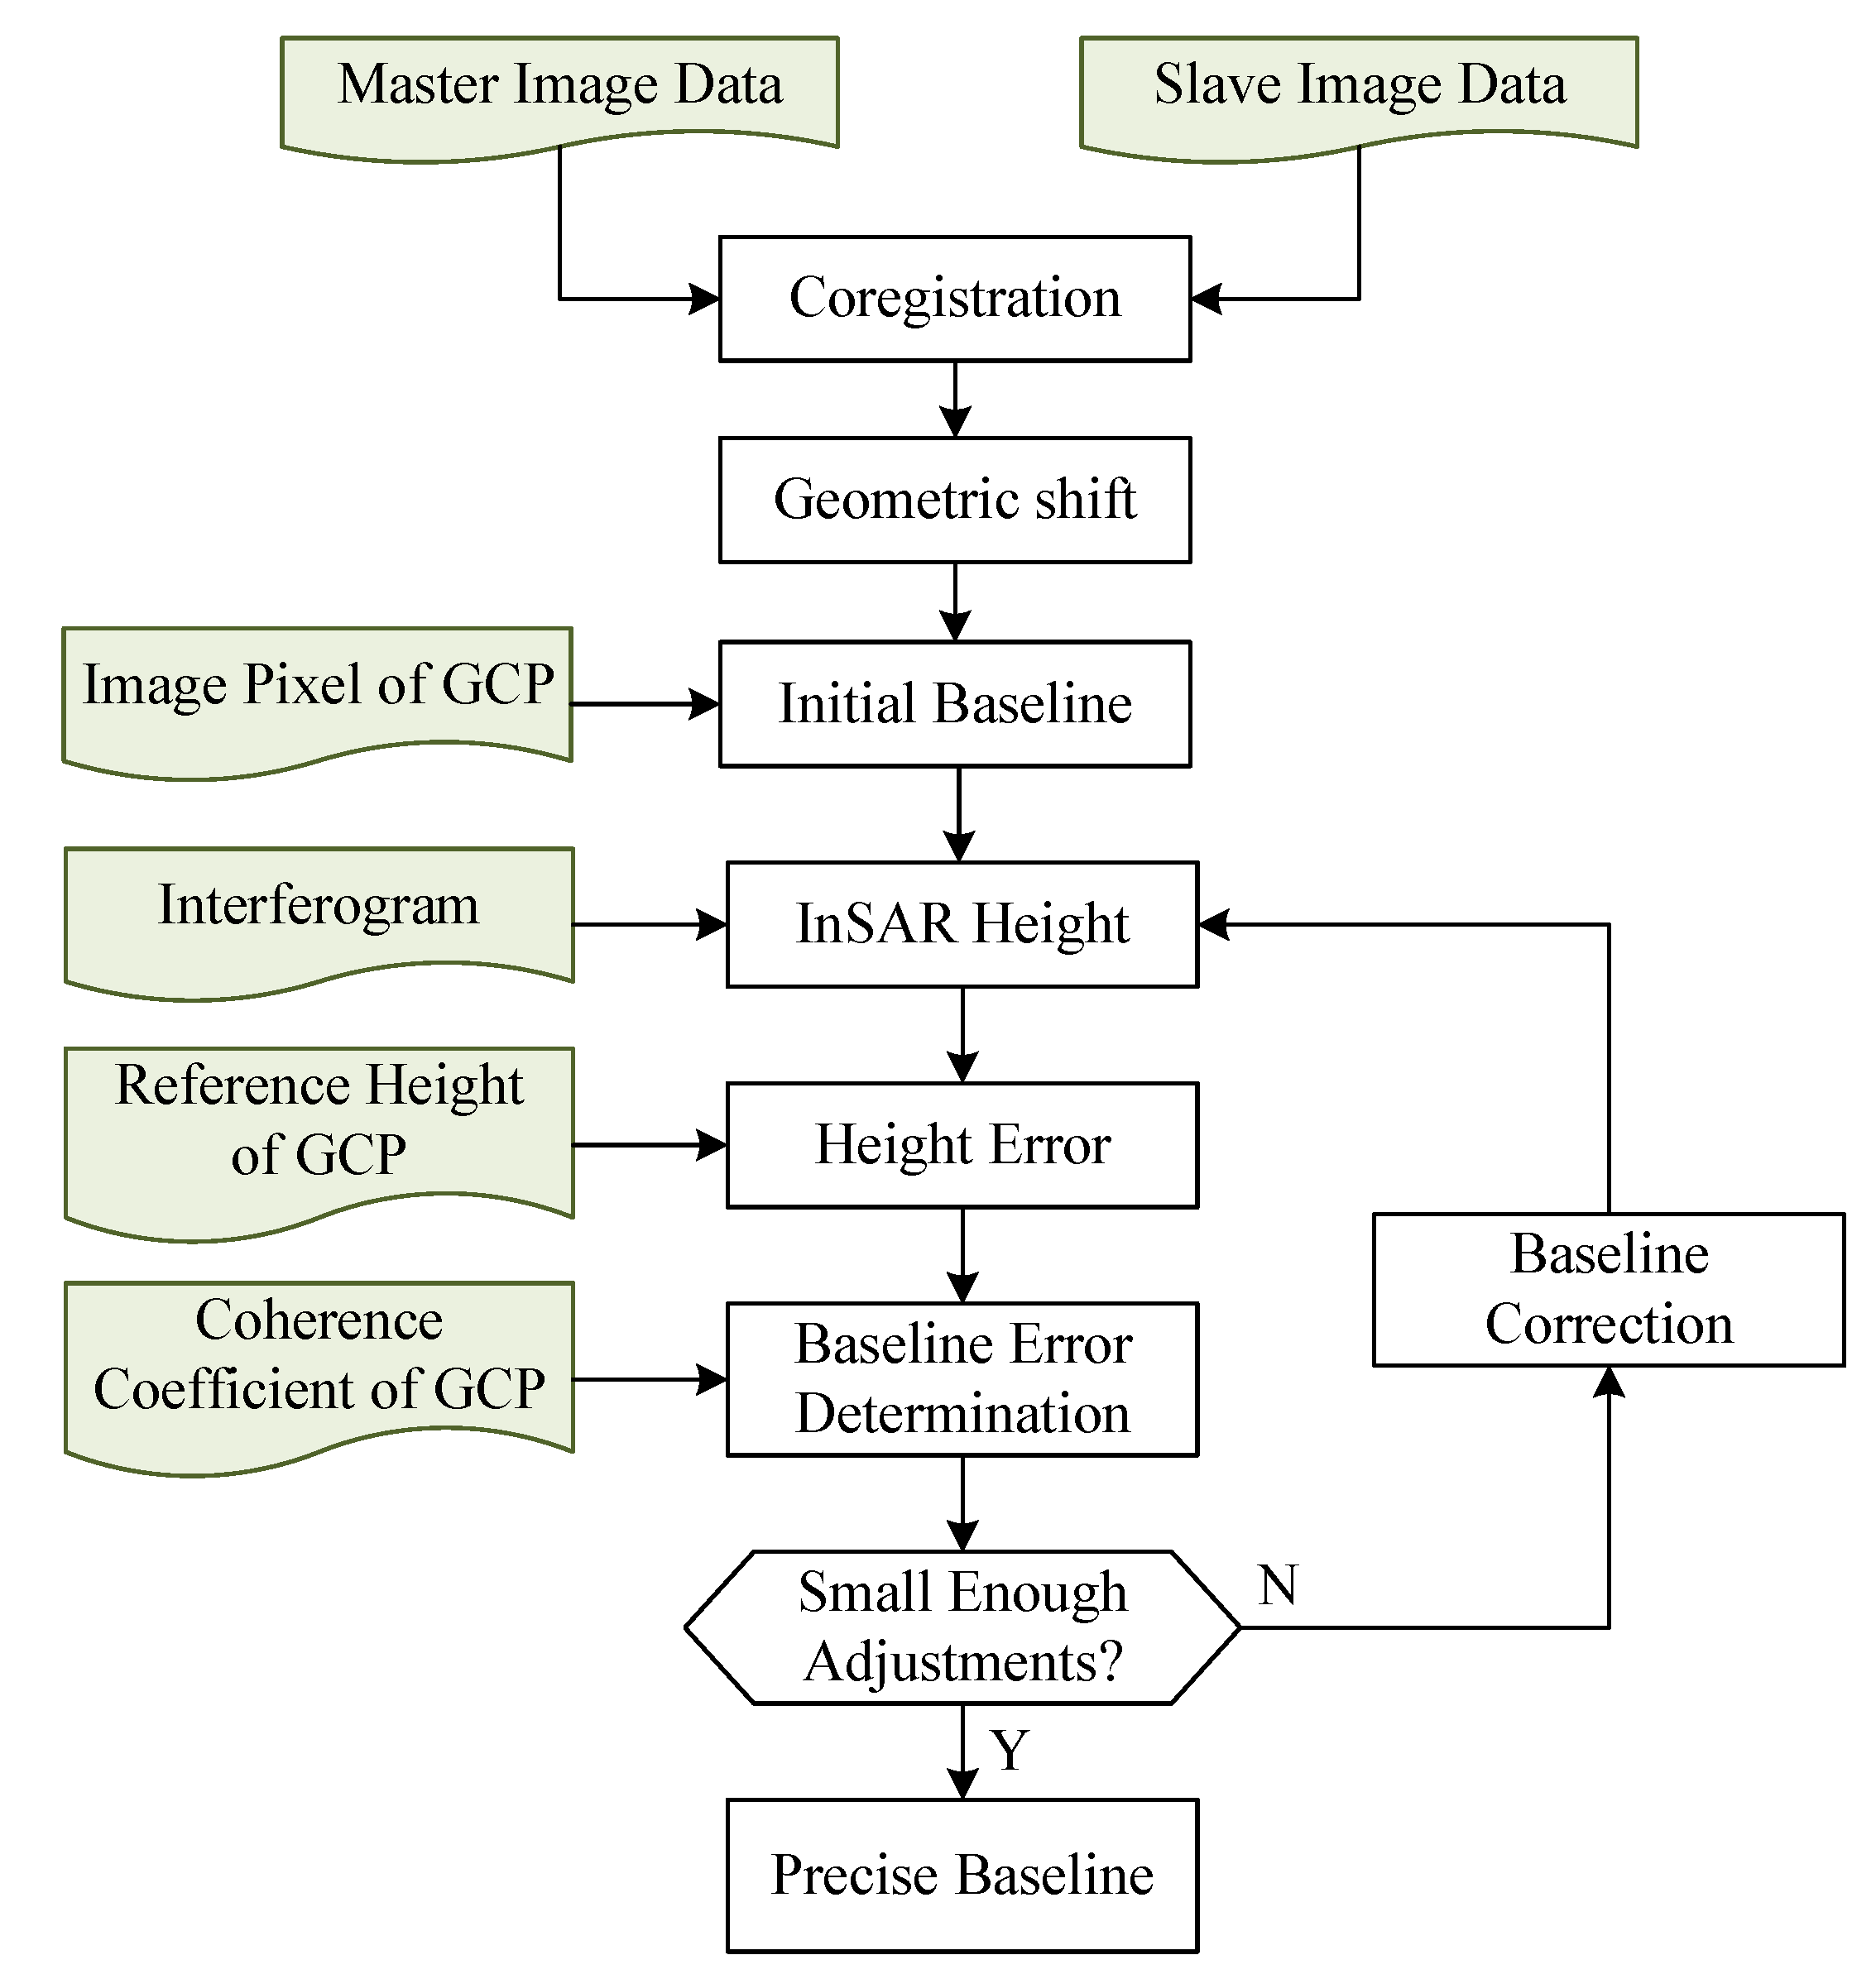
After building the relationship between the height error and baseline error, we need to solve the equation based on the data of ground control point (GCP). The workflow of the proposed baseline calibration method is shown in Figure 4. Firstly, the baseline vector can be obtained in the ECEF coordinate system using the pixel coordinates of GCPs on the interferogram based on the proposed baseline model. The baseline is then converted from the ECEF coordinate system to the SAR platform-fixed coordinate system using the appropriate transformation matrix R:
B i = R B ( x a z i , x r g i ) E C E F = X , Y , Z T B ( x a z i , x r g i ) E C E F
where x a z i and x r a i are pixel positions in the azimuth and range directions of the i-th GCP, respectively. The initial baseline matrix can be expressed as B 0 = B 1 , B 2 , , B N T , where superscript N refers to the number of GCPs.
Then, the InSAR height of the GCP can be calculated by Equation (11), and we donate the initial height matrix as H = H 1 , H 2 , . . . , H N T . Combining the inversed height matrix and reference height matrix of GCP, Equation (13) can be rewritten as the matrix form:
0 = H ref H G B err
where H ref is the reference height matrix and H ref = H r e f 1 , H r e f 2 , . . . , H r e f N T , G is the gradient of height at B 0 . The solution of Equation (15) can be acquired by minimizing the 2-norm of residuals:
B ^ err = arg min B err H ref H G B err .
Therefore, the best-unbiased estimation of baseline error is:
B ^ err = G T PG G T H ref H
where P is the weight matrix, which consists of the coherence coefficient of each GCP: P = diag σ 1 , σ 2 , σ N , and σ i is the coherence coefficient of the i-th GCP; Superscript † represents the pseudoinverse of the matrix with a singular value decomposition.
Thus, the best-unbiased estimation of the baseline is:
B ^ = B 0 + B ^ err .
The above process should be iterated until the solution result converges to improve the accuracy of the baseline calibration. The termination condition of the iteration is B ^ err < t h r e s h o l d , and the t h r e s h o l d is set to 10 9 mm, which will lead to the adjustment of the baseline error in the last iteration smaller than 10 9 mm. After iteration, the precise baseline can be acquired by the baseline error and the initial baseline. Finally, we can generate the high-accuracy DEM by the precise baseline.
In summary, the main steps of the proposed baseline calibration method can be summarized as follows:
Step 1: Derive the polynomial function of geometric shift, i.e., Equation (3), by the coregistration.
Step 2: Establish the pixel-related baseline model, i.e., Equation (4), based on the polynomial function of geometric shift.
Step 3: Acquire the initial baseline by the coordinate position of GCP based on the baseline model, i.e., Equation (14).
Step 4: Calculate the height of GCP by the initial baseline and interferometric phase based on Equation (11).
Step 5: Combine the reference height and InSAR height to establish the baseline calibration model based on Equation (15).
Step 6: Obtain the baseline error according to Equation (17).
Step 7: If B ^ err < t h r e s h o l d , output the baseline error and compensate it for the initial baseline to obtain precise baseline by Equation (7); else, correct the baseline based on Equation (18), and repeat Steps 4–6 until the terminative condition B ^ err < t h r e s h o l d is met.

3. Results and Analysis

3.1. Study Area and Data

The study area is selected in the Hami South Gobi area in Xinjiang, as shown in Figure 5a. The site belongs to a typical temperate continental climate, with deficient annual rainfall and long-term low soil humidity. The topographic environment of this area hardly changes, and the backscattering coefficient is stable throughout the year. Moreover, the terrain in this area is relatively flat, with an average slope of about 2.3 . The selected data was acquired by TwinSAR-L in the HH configuration on 7 July 2022. The area and the reference DEM of the selected data are shown in Figure 5b, and the values of the TwinSAR-L system parameter are shown in Table 1.
The calibrator that serves TwinSAR-L is the trihedral corner reflector with a 3 m right-angle side length, as shown in Figure 5c,d. The locations of the deployed corner reflectors are shown as the black triangles in Figure 5b. The boresight of the calibrator points to the direction of the local incidence angle of the master SAR, and the pointing accuracy is 0.1 . The accuracy of the height and plane location of the corner reflector is 5 cm and 3 cm, respectively.

3.2. Baseline Estimation

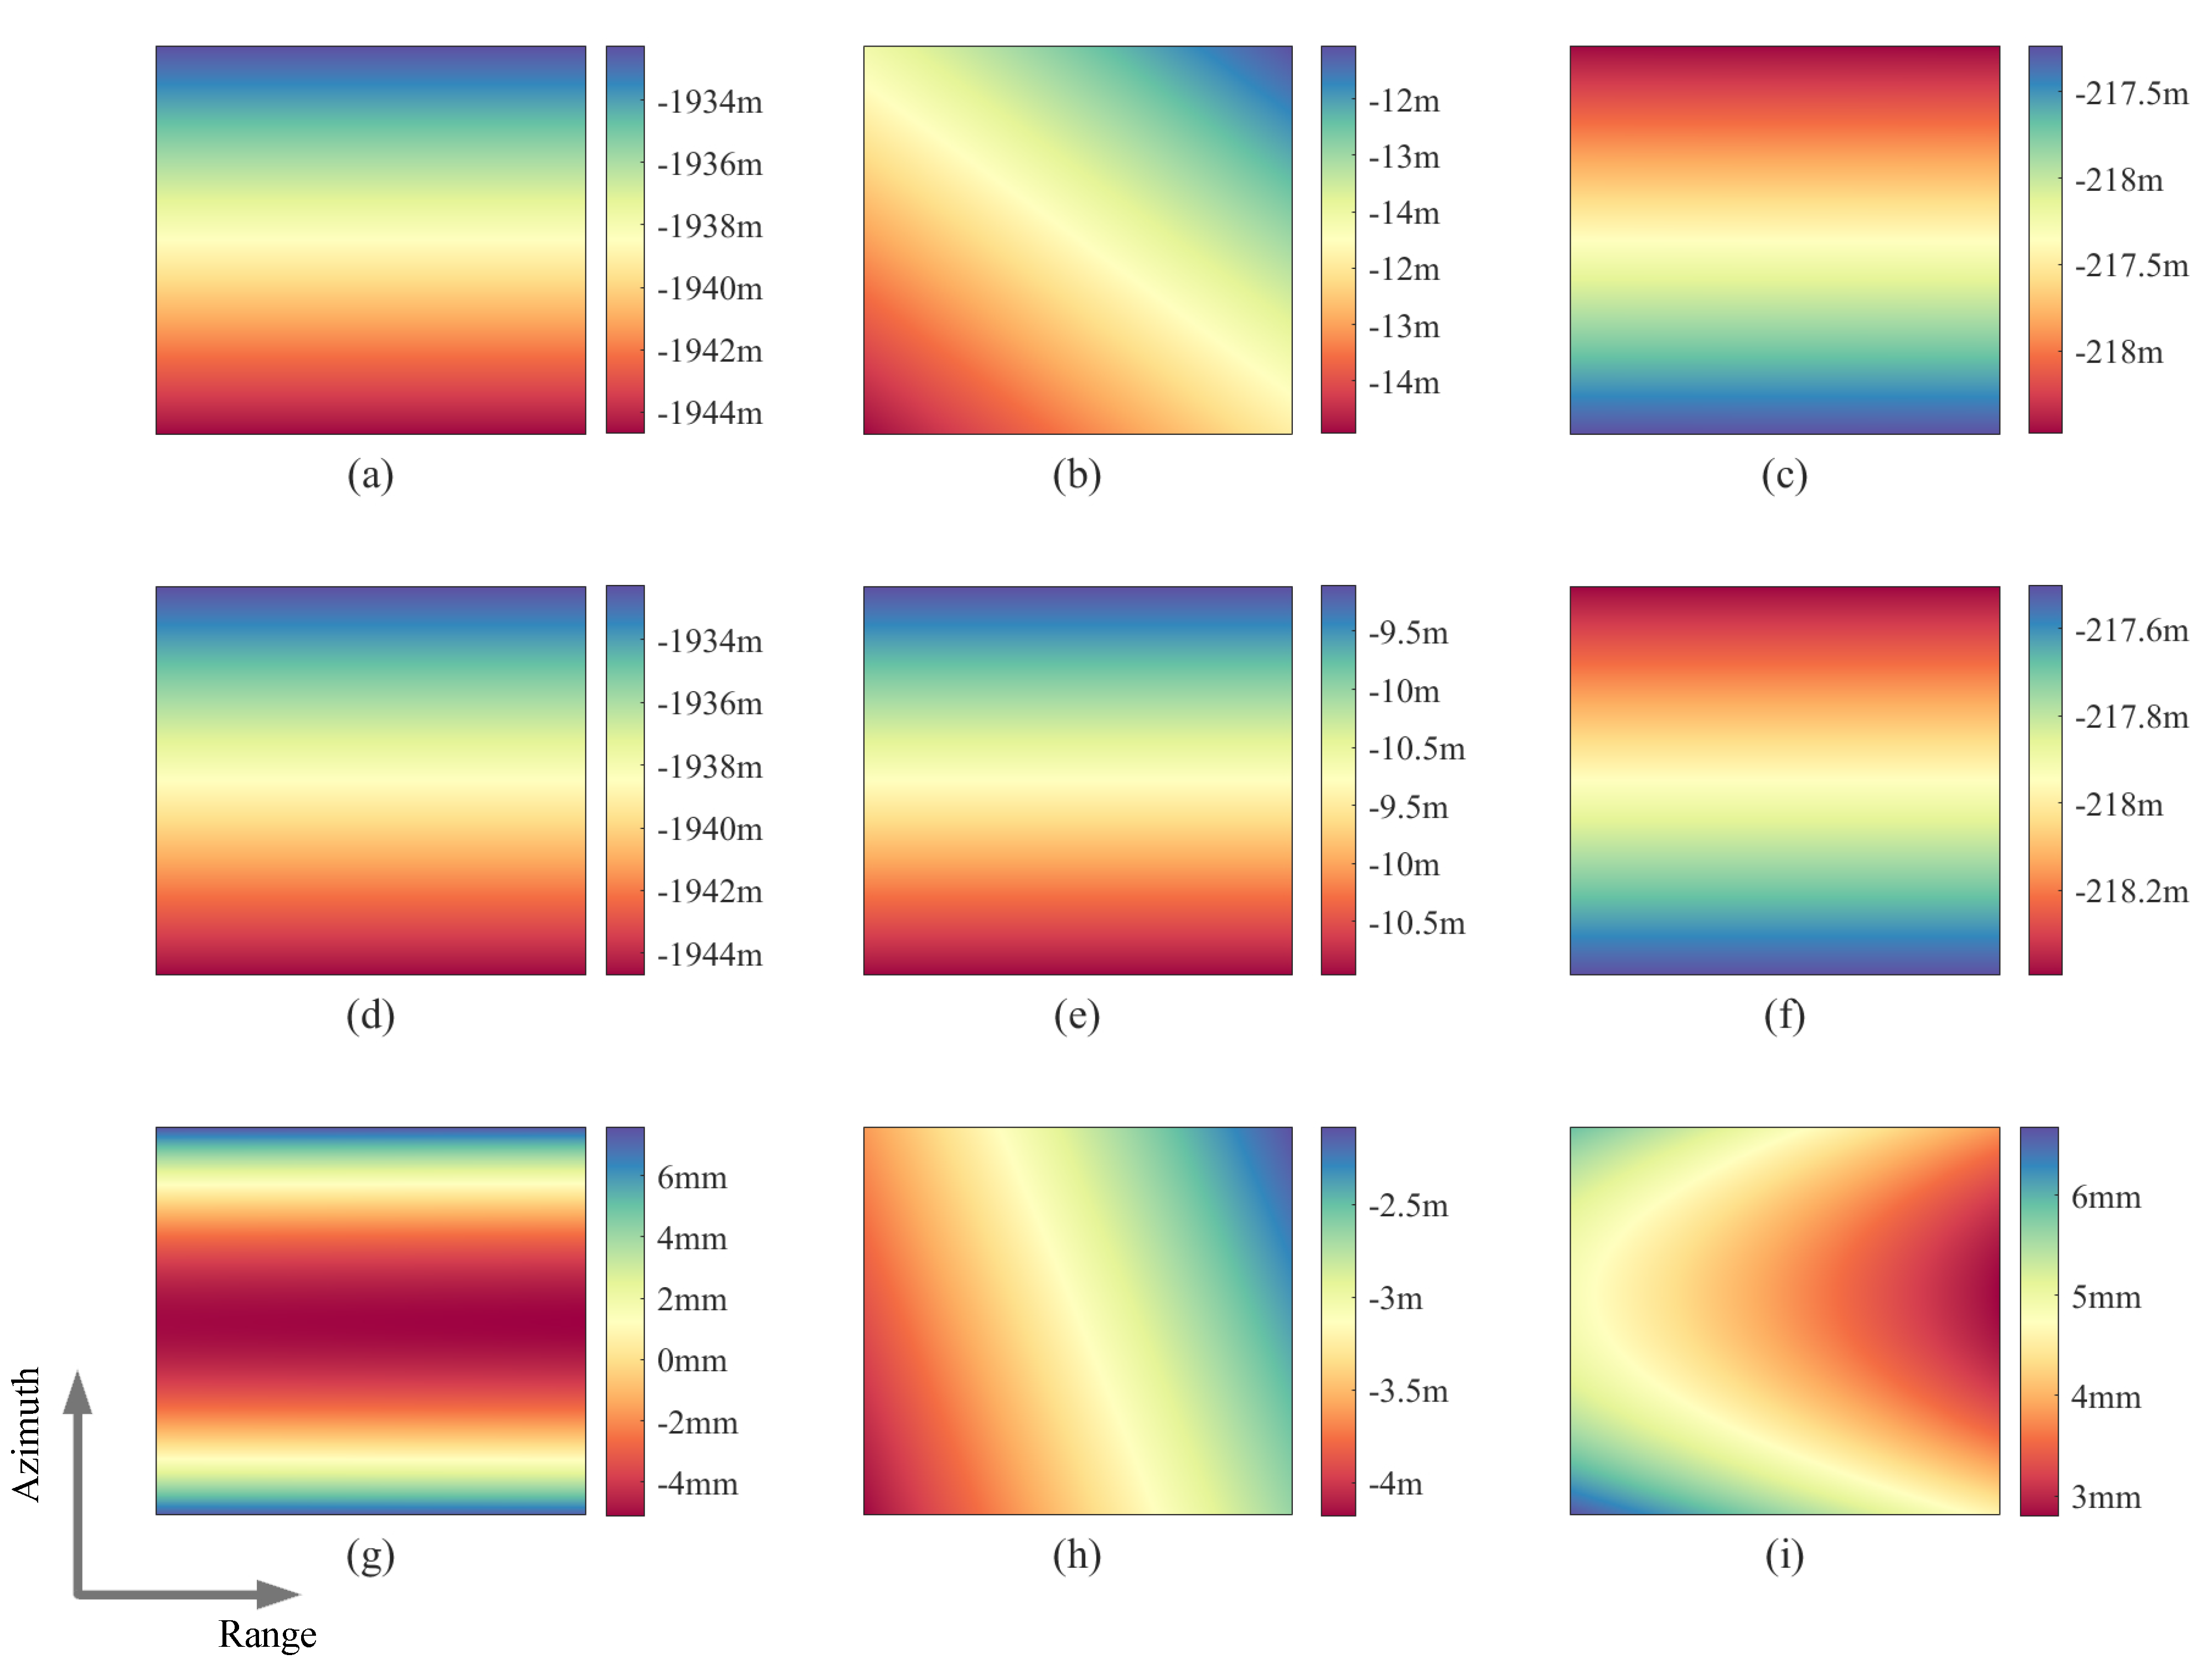
The coregistration of master and slave image is firstly operated to obtain polynomial fitting parameters: a 0 = 72.79198 , a 1 = 1.5357 × 10 4 , a 2 = 5.1914 × 10 7 , a 3 = 7.4827 × 10 11 , a 4 = 1.8401 × 10 10 , a 5 = 5.7468 × 10 10 . Then the baseline is derived by Equation (4), and the results are shown in Figure 6a–c. We also obtain the baseline based on the conventional linear model [18] for comparison, and the results are shown in Figure 6d–f. Figure 6g–i shows the baseline difference between the proposed baseline model and the linear baseline model.
As shown in Figure 6, the difference between the proposed baseline model and the linear model is a quadratic deviation in only the azimuth direction for X-axis components. For Y-axis components, the difference between the proposed baseline model and the linear model is a linear deviation in both the azimuth and range direction. Meanwhile, for Z-axis components, the difference is a linear deviation in the range direction and a quadratic deviation in the azimuth direction. Therefore, the deviation of the proposed baseline and linear models is a quadratic deviation in the azimuth direction and a linear deviation in the range direction. The different components of baseline errors are coupled, resulting in a coupled height error.
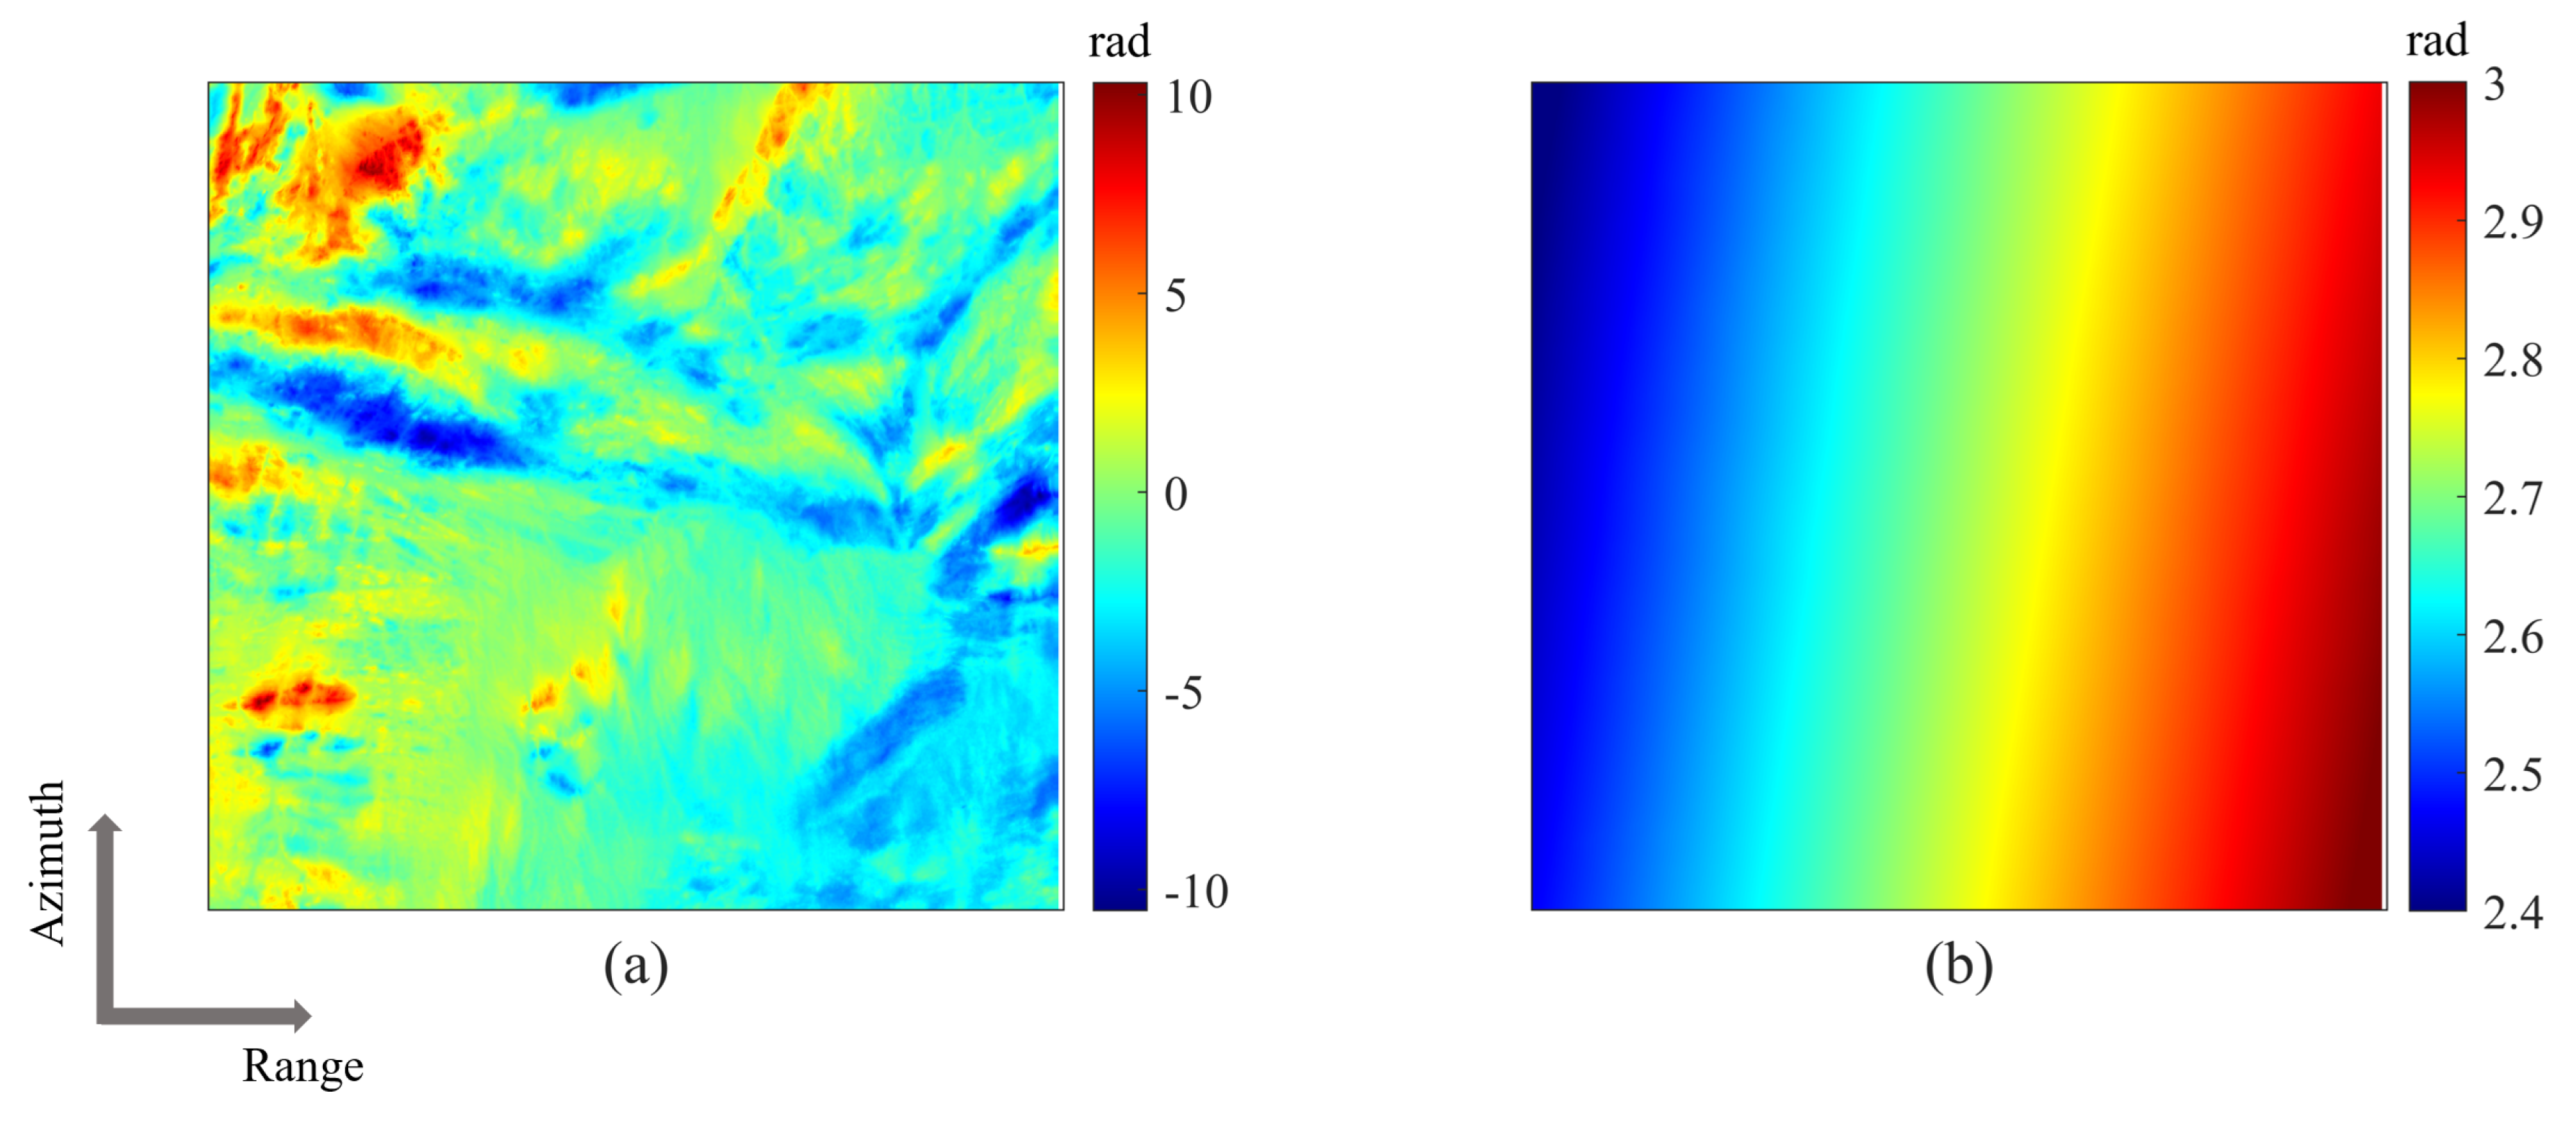
Before generating the DEM, the interferometric phase must be acquired through a series of processes, including interferogram generation, flattened phase removal, phase unwrapping, and absolute phase estimation [33]. Moreover, the interferometric phase results are obtained by the interferometric processor of TwinSAR-L. Figure 7 displays the results of the unwrapped phase and the flattened phase, which are summed to yield the interferometric phase necessary for generating the DEM. Then, the height can be derived by the interferometric phase, the values of the system parameters, and the baseline model based on Equation (11).
To evaluate the effectiveness of the proposed baseline model in generating DEM, we conducted a comparison with the linear model. The DEMs generated using the proposed baseline model and the linear model are shown in Figure 8a,d. The SRTM (Shuttle Radar Topography Mission) DEM is used as the reference DEM to check the height accuracy. As shown in Figure 8b,c,e,f, the height error of raw DEM with the linear model appears as a quadratic error of 4 m in the azimuthal direction, while this error disappears in the raw DEM generated with the proposed model. This difference in azimuth height error is consistent with the baseline deviation between the proposed baseline model and the linear model in the azimuthal direction. Conversely, the height errors in the raw DEM with both models are similar in the range direction, as the baseline deviation in the Y and Z directions (−4∼2 m and 3∼7 mm, respectively) cancels out any effects on height. Although these values are substantially different, the same baseline errors can yield varying height errors in different directions. Additional details regarding baseline-to-height sensitivity will be presented in Section 4.
Although the proposed baseline model can improve the accuracy of the DEM, an average height error of 7.69 m still exists in the raw DEM, indicating the presence of baseline errors. Therefore, it is imperative to calibrate the baseline to enhance the DEM’s accuracy further.

3.3. Baseline Calibration

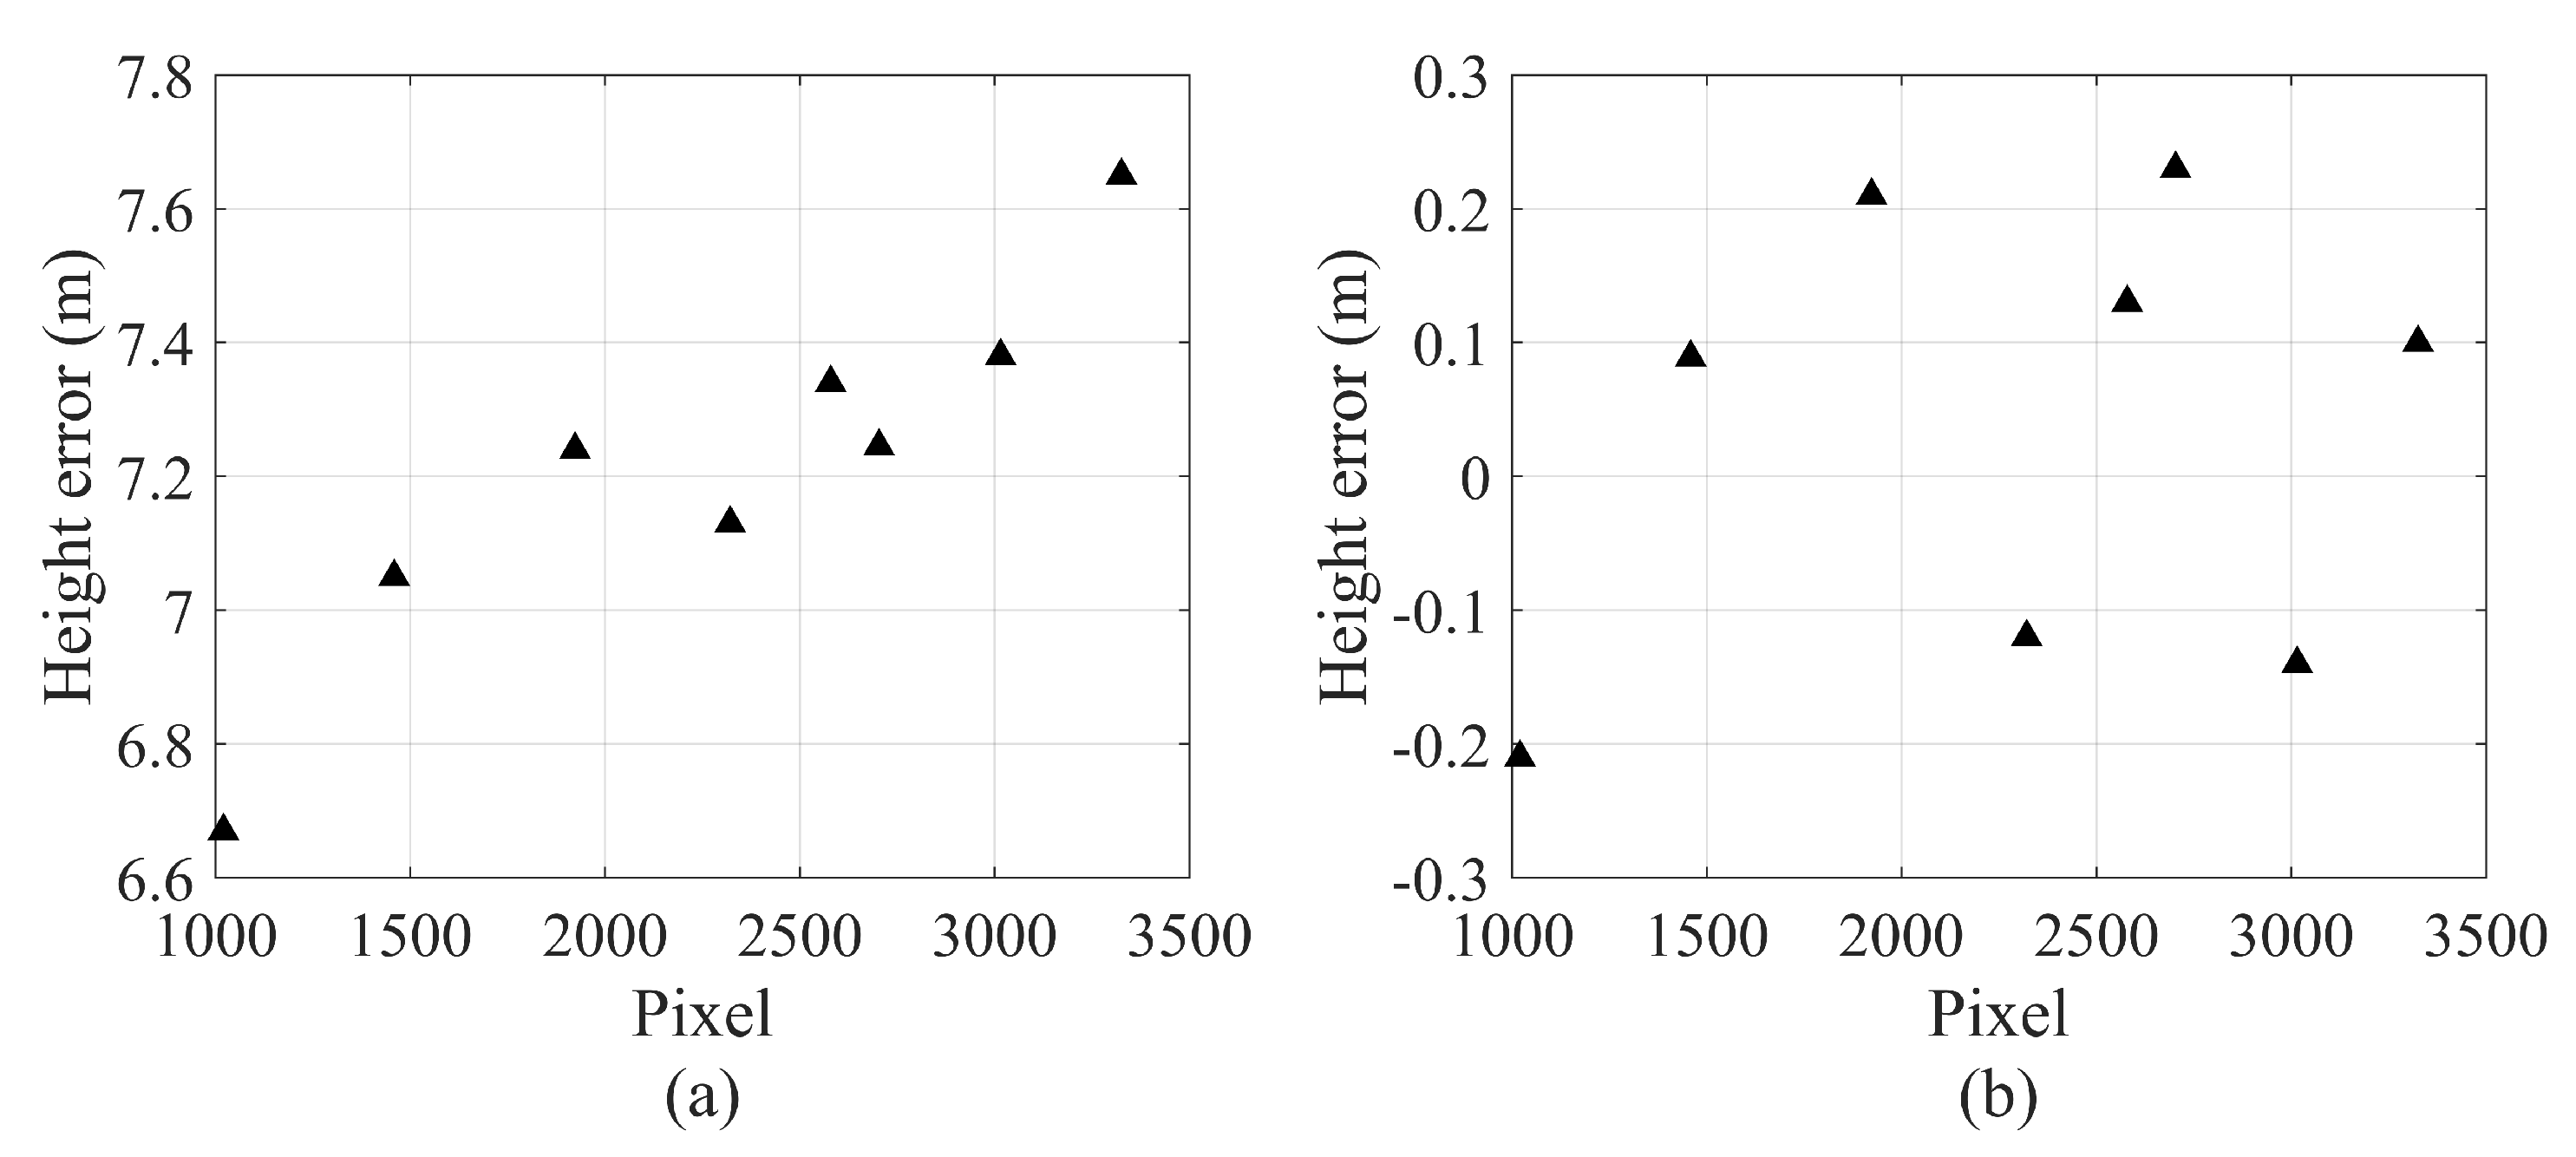
In this section, we solve the residual baseline error by the reference height of corner reflectors. First, we calculate the corner reflectors’ baseline by their image pixel coordinates. Then, we use Equation (11) to derive the height of the corner reflectors and compare it with the reference height to obtain the height error. The result of the height error of corner reflectors is shown in Figure 9a.
We observe that the height error of the corner reflectors has the same trend as the height error of the raw DEM in the range direction. However, the average height error of the corner reflectors is 7.13 m and is smaller than that of the raw DEM because the baseline error and penetration depth both cause the height error of the raw DEM. In contrast, the height error of corner reflectors is only caused by the baseline error.
Then, the baseline error derived by the proposed baseline calibration method is B e r r = B X e r r , 0 , B Z e r r = 13 . 58 , 0 , 12 . 31 mm. After calibration, the height error of corner reflectors is from −0.25 m to 0.25 m, as shown in Figure 9b. We also calibrate the baseline using the TanDEM-X method to compare it with the proposed method. Since the TanDEM-X method requires two pairs of interferometric images, we divide the image into two segments to obtain the baseline error, and the result is B e r r = B X e r r , 0 , B Z e r r = 6.60 , 0 , 23.90 mm.
To check the accuracy of the baseline error derived by different methods, we use these two baseline errors to compensate for the initial baseline and generate the DEM products based on these two compensated baselines. The results of the InSAR DEM are shown in Figure 10a,d. Then, we compare the InSAR DEM products with the SRTM DEM, and the results of the height error are shown in Figure 10b,c,e,f.
From Figure 10b,c,e,f, we can observe that the height error with the TanDEM-X baseline is even more significant than the original height error. In contrast, the average height error of the InSAR DEM with a precise baseline calculated by the proposed method is decreased to 0.64 m and the standard deviation of the height error is 1.05 m. Therefore, the TanDEM-X baseline calibration method is hardly achieved by one interferogram because the incidence angle difference in one interferogram is too small. Although the proposed method in this paper is more complex than the TanDEM-X method, it makes a breakthrough in baseline calibration with one interferogram with a slight incidence angle difference.
Figure 11 summarizes the height errors of InSAR DEM products. A comparison between the linear model and the proposed baseline model reveals that the DEM obtained by the latter has a lower height error and standard deviation. The improved accuracy is attributed to the fact that the baseline of one interferogram is a function of both the azimuth and range pixel. Consequently, the proposed pixel-related baseline model can effectively describe the interferometric baseline. After baseline calibration using the proposed method, the average height error is reduced to 0.64 m, and the standard deviation is reduced to 1.05 m, which meets the height accuracy requirement of 5 m. These findings validate the feasibility of the proposed baseline calibration method.

4. Discussion

4.1. Error Transfer Analysis

4.1.1. First-Order Terms

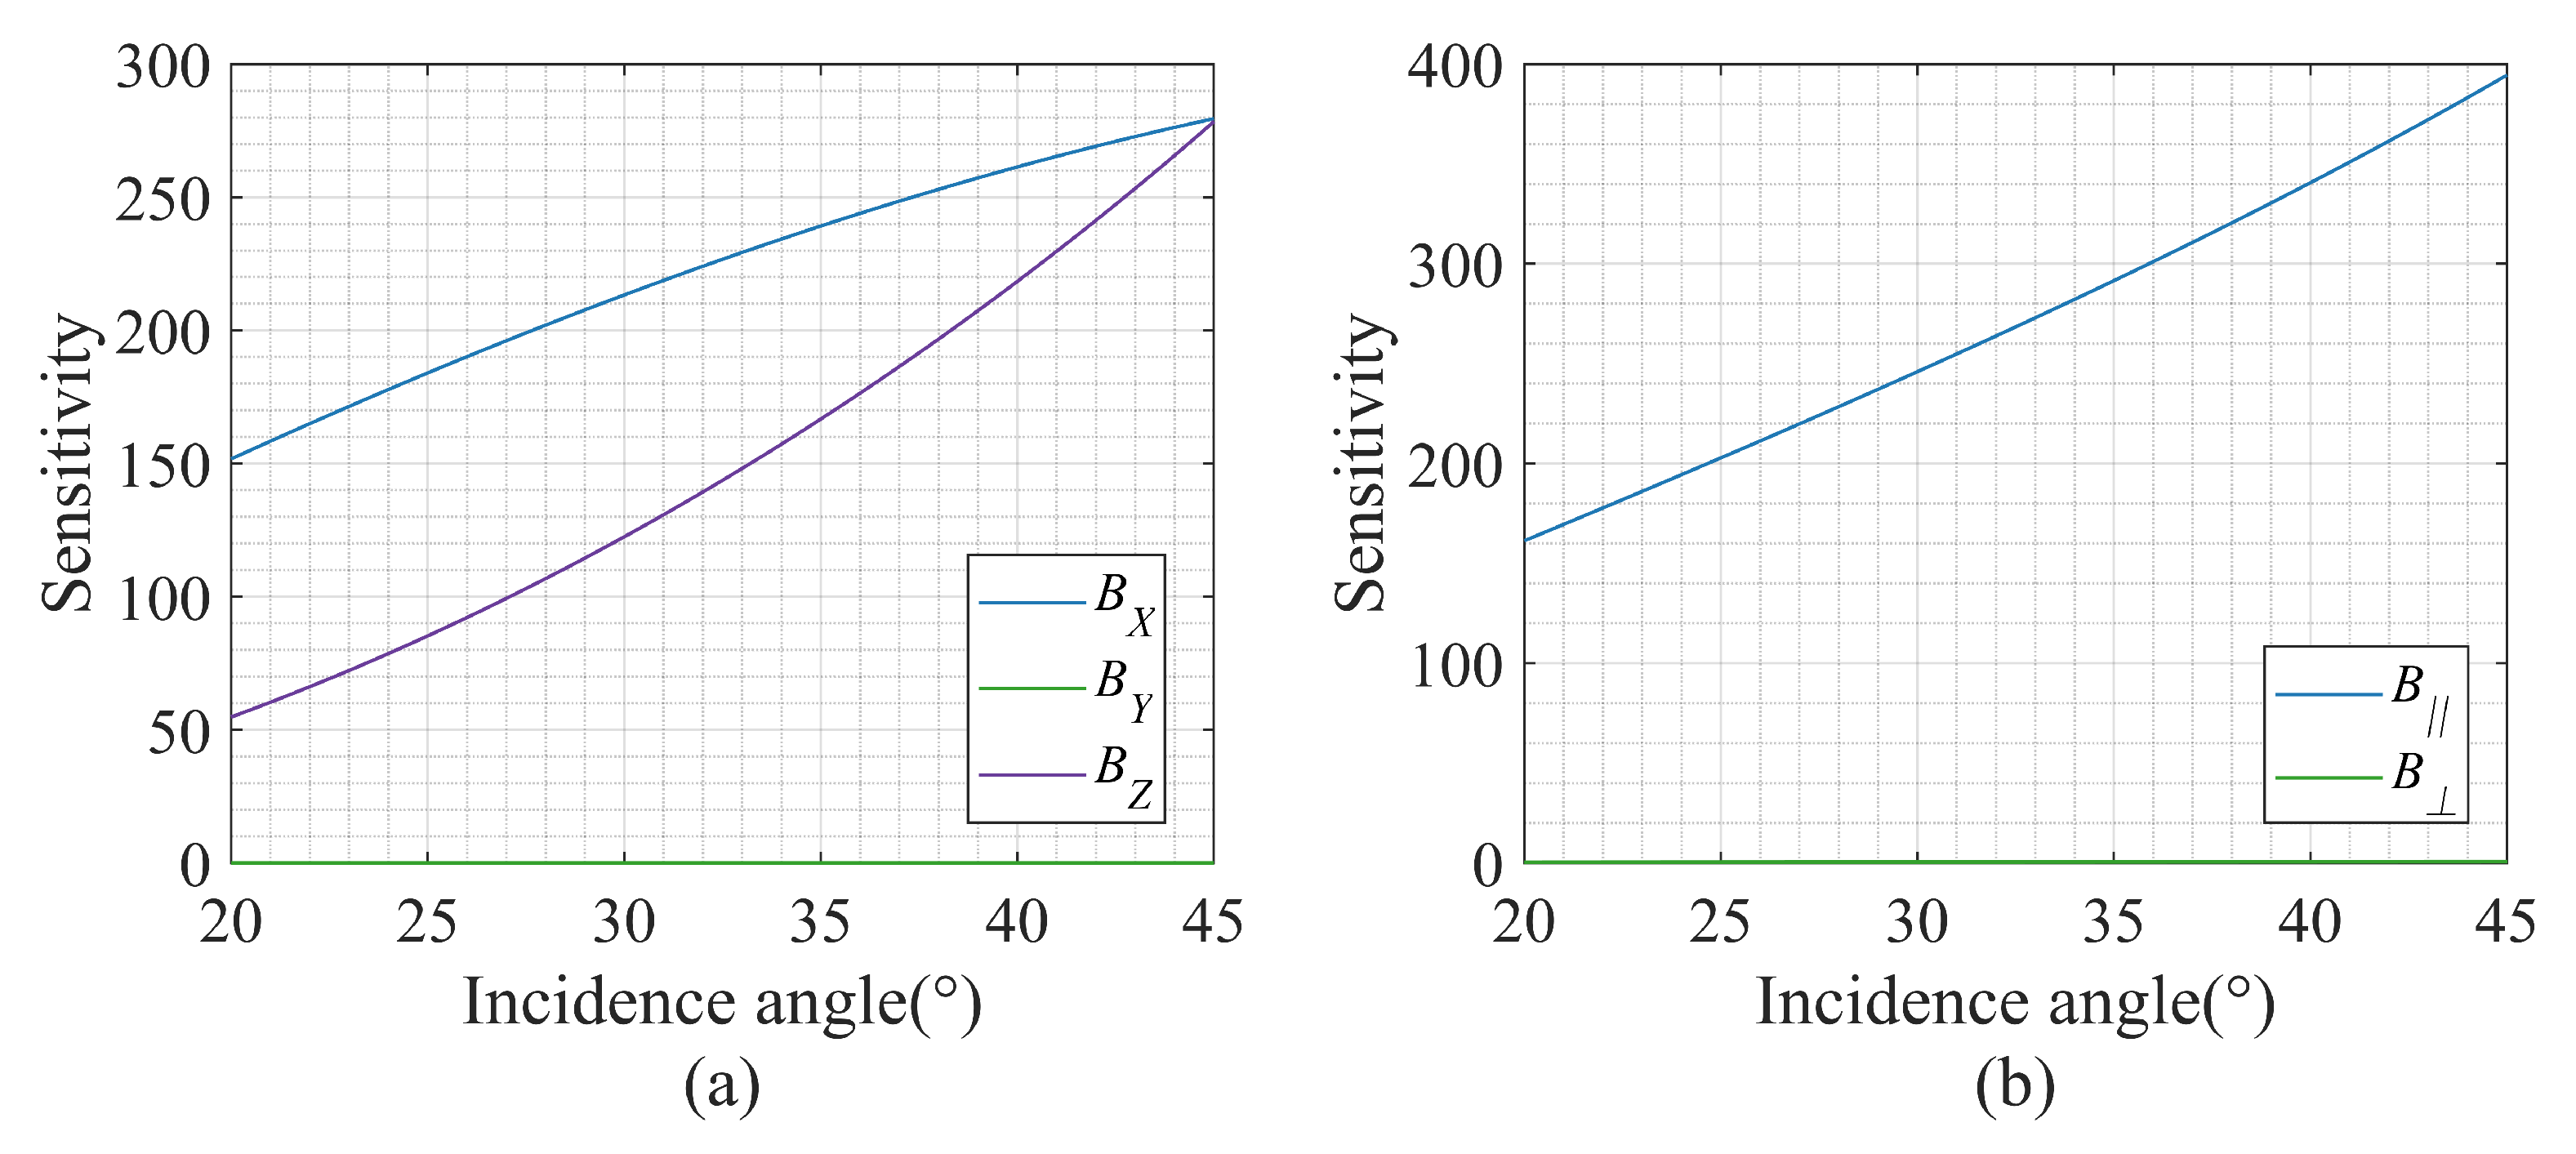
In Section 2.2, we highlighted the significant impact of the baseline error on height accuracy. This section aims to determine which baseline component significantly affects height through the baseline-to-height sensitivity analysis. Using the parameters of the TwinSAR-L system, we calculate the sensitivity of the X, Y, and Z components of the baseline to height using Equation (13). Figure 12a presents the results of sensitivity values.
As shown in Figure 12a, when the incidence angle is 44.33 , H B X = 277.38 m/m, H B Y = 0.052 m/m, H B Z = 270.04 m/m, i.e., a 1 m baseline error in an X, Y, and Z direction can cause a misestimation of 277.38 m, 0.052 m, and 270.04 m height error, respectively. Our analysis reveals that the along-track baseline error has little impact on DEM generation and can be neglected. Therefore, we only consider the influence of the cross-track baseline error in the baseline calibration process and do not include the along-track baseline error. By reducing the number of calibration parameters, we avoid the potential coupling between the parameters and improve the calibration accuracy.
Figure 6 shows that the proposed baseline model and the linear model have a quadratic deviation of −6∼6 mm in the azimuth direction, resulting in a quadratic height error of −1.67∼1.67 m based on the baseline-to-height sensitivity. Figure 8c,f further confirms that the InSAR DEM generated by the linear baseline model has a 4 m quadratic height error in the azimuth direction, while the InSAR DEM generated by the proposed baseline model exhibits a random error of 1 m. This additional 3 m height error in the InSAR DEM with the linear model corresponds to the height error induced by baseline deviation. Consequently, the proposed baseline model is more accurate in describing the baseline of the bistatic system than the conventional model.
In addition, the baseline error can also be decomposed into one parallel to the LOS and one perpendicular to the LOS, as mentioned in Section 2.2. The height sensitivity to B and B is:
H B = H B X cos θ + H B Z sin θ H B = H B X sin θ + H B Z cos θ
The sensitivity results of the height to the changes in B and B are illustrated in Figure 12b. The findings reveal that the height error is primarily caused by the baseline LOS error, while it is hardly influenced by the baseline error perpendicular to the LOS.

4.1.2. High-Order Terms

In Equation (13), H B p r is approximated by a first-order Taylor expansion, and in Section 4.1.1, higher-order terms are neglected. However, it is unclear whether these higher-order terms could affect the accuracy of Equation (13) and lead to nonlinear height errors. To address this, we investigate the impact of higher-order terms. Specifically, we expand H B p r using a second-order Taylor expansion centered at B :
0 = ( H B + H B X B Δ B X e r r + H B Z B Δ B Z e r r + 1 2 ! 2 H B X 2 B Δ B X e r r 2 + 1 2 ! 2 H B Z 2 B Δ B Z e r r 2 + 1 2 ! 2 H B X B Z B Δ B X e r r Δ B Z e r r + 1 2 ! 2 H B Z B X B Δ B X e r r Δ B Z e r r + o n ) + H r e f ,
where o n ( n > 2 ) is the higher-order terms.
The coefficients of the first-order are shown in Equation (13), and the coefficients of the second-order terms are expressed in Appendix A. Taking the parameter values of the TwinSAR-L system into the expression of coefficients, we obtain: 2 H B X 2 = 0.34 , 2 H B Z 2 = 0.03 , 2 H B X B Z = 0.23 . The values of the second-order terms are 0.1% of the value of the first-order terms. Therefore, the higher-order terms are so trivial that the first-order expansion can accurately express H B p r .

4.2. Penetration Depth

Based on the analysis of Figure 8 and Figure 9, we observe that the average height error of the InSAR DEM is greater than the height error of the point targets. This difference in height error is caused by the penetration depth effect. The penetration depth is defined as the depth at which the SAR signal attenuates to 1 / e , and e represents the base of the natural logarithm [34]. The penetration depth depends on the frequency of the electromagnetic wave and the dielectric properties of the media. Based on the Bir Safsaf sand samples, the C-band penetration depth is 0.2∼0.5 m, while the L-band is 1∼2 m [35], which is consistent with the residual height error of the calibrated DEM in Figure 10. In contrast, the penetration depth effect is less significant in areas with high backscattering, such as the area where the corner reflector is located.
The height error in the InSAR DEM is caused by the coupling of the baseline error and penetration depth, which makes distributed targets unsuitable for the baseline calibration of TwinSAR-L. However, when the penetration depth is accurately estimated and compensated, distributed targets can perform baseline calibration in areas without corner reflectors. This approach can solve the costly, time-consuming, and laborious problem of deploying corner reflectors. Therefore, the estimation of penetration depth needs to be further investigated. In addition, the proposed method can be extended to short-wavelength bistatic SAR systems with no penetration.
The estimation of penetration depth is commonly based on the dielectric constant of the soil, which can be estimated through field measurement [36] or empirical models [37,38]. However, field measurement is often laborious and time-consuming, and empirical models may not accurately represent the edaphic conditions of the calibration site, leading to uncertain accuracy in penetration depth estimation. As a result, we plan to investigate more accurate methods for estimating penetration depth to improve the baseline calibration accuracy using distributed targets.

4.3. DEM Adjustment

As mentioned in Section 2.1, the baseline model for each interferogram varies due to differences in coregistration and resampling processes. Consequently, we must address the potential for discontinuity between adjacent scenes resulting from differences in the baseline model.
While the images of the overlapping parts of adjacent scenes are the same, the polynomial fitting of the shift is independently performed in two images, and differences in the polynomial fitting may lead to baseline error. To address this, we fit the polynomial function of shift using the shifts of identical points with the large coherence coefficient and find that the root mean squared error of polynomial prediction shifts and original shifts is 0.06 pixels. In the worst case, the shift difference in the overlapping part of the two adjacent images is 0.12 pixels, and the corresponding azimuth time difference is 3.14 × 10 5 s. According to the changing trend of the baseline over the azimuth direction in Figure 6 and Equation (4), the baseline error introduced by the shift difference does not exceed 0.1 mm, which is within the tolerable range and can be ignored.
Although the baseline model does not introduce discontinuity between adjacent scenes, residual errors may still exist and cause height tilts in neighboring DEMs’ azimuth (time) direction and range direction [13]. The main sources of residual errors are the remaining instrument phase drifts and unwrapping inconsistency since the baseline calibration cannot reduce these errors.
The TanDEM-X system applies a least-squares adjustment of adjacent DEM acquisitions to correct these remaining systematic height errors [39]. This adjustment is based on the connecting tie-points in an overlap of at least 3 km of neighboring DEMs to remove DEM discontinuity between adjacent scenes. Global positioning data from the Ice, Cloud, and land Elevation Satellite (ICESat) can serve as GCPs in this process. Additionally, the DEM adjustment is part of the operationally implemented “DEM Mosaicking and Calibration Processor” in the TanDEM-X system [40].
In the TwinSAR-L system, the discontinuity between adjacent DEMs has to be further investigated based on more neighboring image data to construct a suitable DEM adjustment model for achieving the desired height accuracy goals.

5. Conclusions

This paper aims to accurately obtain the baseline for generating the high-precision DEM. A pixel-related baseline model based on the geometrical shift is proposed first. Then, the baseline error sources are analyzed to construct the baseline error model, and a novel baseline calibration model that solves the baseline error based on height gradient information is proposed. The method is verified by a pair of interferometric images acquired by TwinSAR-L and the data from corner reflectors deployed in Xinjiang, China. The calibrated baseline successfully generated the DEM that meets the height accuracy requirement of 5 m. This paper discusses the first-order and higher-order derivatives of the height to different baseline components, concluding that the cross-track baseline error, radial baseline error, and baseline LOS error seriously impact height accuracy. Then, this paper discusses the role of the penetration depth and points out that if the penetration depth can be accurately estimated and compensated for, the proposed baseline calibration method can be achieved using distributed targets without relying on point targets. In the end, this paper addresses the discontinuity issue between adjacent DEMs and emphasizes the need for further investigation of the DEM adjustment. In conclusion, the proposed baseline model and calibration method have been successfully exploited for DEM generation during the initial Commissioning Phase of TwinSAR-L.

Author Contributions

Conceptualization, J.M. and Y.W. (Yu Wang); methodology, J.M.; software, J.M. and Y.W. (Yachao Wang); validation, J.H. and Y.W. (Yu Wang); resources, A.W.; writing—original draft preparation, J.M.; writing—review and editing, Y.W. (Yu Wang); visualization, J.M. and Y.W. (Yachao Wang); supervision, A.W.; project administration, J.H.; funding acquisition, A.W. and J.H. All authors have read and agreed to the published version of the manuscript.

Funding

This work was supported by the Aerospace Information Research Institute, Chinese Academy of Sciences under Grant E1Z201020F.

Data Availability Statement

Not applicable.

Acknowledgments

The authors would like to express their gratitude to the anonymous reviewers and the associate editor for their constructive comments on the paper.

Conflicts of Interest

The authors declare no conflict of interest.

Appendix A. Second-Order Terms

The coefficients of the second-order terms in Equation (20) are:
2 H B X 2 = R H R A cos η R H 2 + R A 2 2 R H R A cos η 1 / B B X 2 / B 3 1 B X 2 / B 2 B X / R A B B X cos η / B 2 1 cos 2 η 2 R H 2 R A 2 sin η 2 R H 2 + R A 2 2 R H R A cos η 3 1 / B B X 2 / B 3 1 B X 2 / B 2 B X / R A B B X cos η / B 2 1 cos 2 η R H R A sin η R H 2 + R A 2 2 R H R A cos η 3 B X 3 / B 5 / 2 3 B X / B 3 / 2 1 B X 2 / B 2 B X cos η B 2 1 B X 2 / B 2 3 B X 3 / B 4 B X / B 4 1 / B B X 2 / B 3 2 1 B X 2 / B 2 3 + 2 B X 2 cos 2 η 2 B X 2 cos η / R A B R A B 1 / R A B cos η / B B X 2 / R A B 3 + 3 B X 2 / B 4 cos η 1 cos 2 η ,
2 H B Z 2 = R H R A cos η R H 2 + R A 2 2 R H R A cos η B Z / R A B B Z cos η / B 2 1 cos 2 η + B X B Z 1 B X 2 / B 2 B 3 2 R H 2 R A 2 sin η 2 R H 2 + R A 2 2 R H R A cos η 3 B Z / R A B B Z cos η / B 2 1 cos 2 η + B X B Z 1 B X 2 / B 2 B 3 R H R A sin η R H 2 + R A 2 2 R H R A cos η 3 B X B Z 2 1 B X 2 / B 2 B 5 B Z 1 B X 2 / B 2 B 3 1 / R A B cos η / B 2 2 B 2 / R A B + 3 B Z 2 cos η / B 4 1 cos 2 η + B X 3 B Z 2 1 B X 2 / B 2 3 B 7 + 2 B Z cos 2 η 2 B Z cos η B Z / R A B B Z cos η / B 2 1 cos 2 η 3 ,
2 H B X B Z = 2 H B Z B X = R H R A sin η R H 2 + R A 2 2 R H R A cos η B Z / B 3 3 B X 2 B Z / B 5 1 B X 2 / B 2 2 B X B Z / R A B 3 3 B X B Z cos η / B 4 1 cos 2 η B Z cos 2 η B Z cos η / R A B 2 B X / R A B B X cos η / B 2 1 cos 2 η 3 + B X 2 B Z / B B X 2 / B 3 1 B X 2 / B 2 3 B 4 R H R A cos η R H 2 + R A 2 2 R H R A cos η 1 / B B X 2 / B 3 1 B X 2 / B 2 B X / R A B B X cos η / B 2 1 cos 2 η B Z / R A B B Z cos η / B 2 1 cos 2 η + B X B Z 1 B X 2 / B 2 B 3 + R H 2 R A 2 sin η 2 R H 2 + R A 2 2 R H R A cos η 3 1 / B B X 2 / B 3 1 B X 2 / B 2 B X / R A B B X cos η / B 2 1 cos 2 η B Z / R A B B Z cos η / B 2 1 cos 2 η + B X B Z 1 B X 2 / B 2 B 3 .

References

  1. Krieger, G.; De, Z.F. Relativistic effects in bistatic SAR processing and system synchronization. In Proceedings of the 9th European Conference on Synthetic Aperture Radar, EUSAR 2012, Nuremberg, Germany, 23–26 April 2012; pp. 231–234. [Google Scholar]
  2. Breit, H.; Younis, M.; Balss, U.; Niedermeier, A.; Grigorov, C.; Hueso-Gonzalez, J.; Krieger, G.; Eineder, M.; Fritz, T. Bistatic synchronization and processing of TanDEM-X data. In Proceedings of the 2011 IEEE International Geoscience and Remote Sensing Symposium, IGARSS 2011, Vancouver, BC, Canada, 24–29 July 2011; pp. 2424–2427. [Google Scholar]
  3. Wang, R.; Deng, Y. Bistatic SAR System and Signal Processing Technology; Springer: Singapore, 2018. [Google Scholar] [CrossRef]
  4. Zhang, H.; Deng, Y.; Wang, R.; Wang, W.; Jia, X.; Liu, D.; Li, C. End-to-end bistatic InSAR raw data simulation for TwinSAR-L mission. In Proceedings of the 2019 IEEE International Geoscience and Remote Sensing Symposium, IGARSS 2019, Yokohama, Japan, 28 July–2 August 2019; pp. 3519–3522. [Google Scholar] [CrossRef]
  5. Jin, G.; Liu, K.; Liu, D.; Liang, D.; Zhang, H.; Ou, N.; Zhang, Y.; Deng, Y.; Li, C.; Wang, R. An advanced phase synchronization scheme for LT-1. IEEE Trans. Geosci. Remote Sens. 2020, 58, 1735–1746. [Google Scholar] [CrossRef]
  6. Liang, D.; Liu, K.; Yue, H.; Chen, Y.; Deng, Y.; Zhang, H.; Li, C.; Jin, G.; Wang, R. An advanced non-interrupted synchronization scheme for bistatic synthetic aperture radar. In Proceedings of the 2019 IEEE International Geoscience and Remote Sensing Symposium, IGARSS 2019, Yokohama, Japan, 28 July–2 August 2019; pp. 1116–1119. [Google Scholar] [CrossRef]
  7. Zhang, Y.; Zhang, H.; Ou, N.; Liu, K.; Liang, D.; Deng, Y.; Wang, R. First demonstration of multipath effects on phase synchronization scheme for LT-1. IEEE Trans. Geosci. Remote Sens. 2019, 58, 2590–2604. [Google Scholar] [CrossRef]
  8. Mou, J.; Hong, J.; Wang, Y.; Du, S.; Xing, K.; Qiu, T. LT-1 Baseline Calibration Method Based on Improved Baseline Calibration Model. In Proceedings of the 2022 IEEE International Geoscience and Remote Sensing Symposium, IGARSS 2022, Kuala Lumpur, Malaysia, 17–22 July 2022; pp. 7452–7455. [Google Scholar] [CrossRef]
  9. Zebker, H.A.; Farr, T.G.; Salazar, R.P.; Dixon, T.H. Mapping the world’s topography using radar interferometry: The TOPSAT mission. Proc. IEEE 1994, 82, 1774–1786. [Google Scholar] [CrossRef] [Green Version]
  10. Zink, M.; Bachmann, M.; Brautigam, B.; Fritz, T.; Hajnsek, I.; Moreira, A.; Wessel, B.; Krieger, G. TanDEM-X: The new global DEM takes shape. IEEE Geosci. Remote Sens. Mag. 2014, 2, 8–23. [Google Scholar] [CrossRef]
  11. Xie, H.; Zhan, Y.; Zeng, G.; Pan, X. LEO mega-constellations for 6G global coverage: Challenges and opportunities. IEEE Access 2021, 9, 164223–164244. [Google Scholar] [CrossRef]
  12. Pinheiro, M.; Reigber, A. Improving TamDEM-X DEMs accuracy using large-baseline data from the science phase. In Proceedings of the 11th European Conference on Synthetic Aperture Radar, EUSAR 2016, Hamburg, Germany, 6–9 June 2016; pp. 1–6. [Google Scholar]
  13. González, J.H.; Bachmann, M.; Krieger, G.; Fiedler, H. Development of the TanDEM-X calibration concept: Analysis of systematic errors. IEEE Trans. Geosci. Remote Sens. 2010, 48, 716–726. [Google Scholar] [CrossRef] [Green Version]
  14. Krieger, G.; Moreira, A.; Fiedler, H.; Hajnsek, I.; Werner, M.; Younis, M.; Zink, M. TanDEM-X: A satellite formation for high-resolution SAR interferometry. IEEE Trans. Geosci. Remote Sens. 2007, 45, 3317–3341. [Google Scholar] [CrossRef] [Green Version]
  15. Qi, Y.; Wang, Y.; Hong, J.; Du, S. Additional Reference Height Error Analysis for Baseline Calibration Based on a Distributed Target DEM in TwinSAR-L. Remote Sens. 2021, 13, 2750. [Google Scholar] [CrossRef]
  16. Kroes, R.; Montenbruck, O.; Bertiger, W.; Visser, P. Precise GRACE baseline determination using GPS. GPS Solut. 2005, 9, 21–31. [Google Scholar] [CrossRef]
  17. Small, D.; Werner, C.; Nuesch, D. Baseline modelling for ERS-1 SAR interferometry. In Proceedings of the IEEE International Geoscience and Remote Sensing Symposium, IGARSS 1993, Tokyo, Japan, 18–21 August 1993; pp. 1204–1206. [Google Scholar]
  18. Xu, B.; Li, Z.; Zhu, Y.; Shi, J.; Feng, G. SAR Interferometric Baseline Refinement Based on Flat-Earth Phase without a Ground Control Point. Remote Sens. 2020, 12, 233. [Google Scholar] [CrossRef] [Green Version]
  19. González, J.H.; Antony, J.; Bachmann, M.; Krieger, G.; Zink, M.; Schrank, D.; Schwerdt, M. Bistatic system and baseline calibration in TanDEM-X to ensure the global digital elevation model quality. ISPRS J. Photogramm. Remote Sens. 2012, 73, 3–11. [Google Scholar] [CrossRef]
  20. Liu, G.; Hanssen, R.F.; Guo, H.; Yue, H.; Perski, Z. Nonlinear model for InSAR baseline error. IEEE Trans. Geosci. Remote Sens. 2016, 54, 5341–5351. [Google Scholar] [CrossRef]
  21. Du, Y.; Fu, H.; Liu, L.; Feng, G.; Peng, X.; Wen, D. Orbit error removal in InSAR/MTInSAR with a patch-based polynomial model. Int. J. Appl. Earth Obs. Geoinf. 2021, 102, 102438. [Google Scholar] [CrossRef]
  22. Liu, Z.; Jung, H.S.; Lu, Z. Joint correction of ionosphere noise and orbital error in L-band SAR interferometry of interseismic deformation in southern California. IEEE Trans. Geosci. Remote Sens. 2013, 52, 3421–3427. [Google Scholar] [CrossRef]
  23. Yang, Q.; Wang, J.; Wang, Y.; Lu, P.; Jia, H.; Wu, Z.; Li, L.; Zan, Y.; Wang, R. Image-Based Baseline Correction Method for Spaceborne InSAR With External DEM. IEEE Trans. Geosci. Remote Sens. 2023, 61, 1–16. [Google Scholar] [CrossRef]
  24. Hanssen, R.F. Radar Interferometry: Data Interpretation and Error Analysis; Springer Science & Business Media: Berlin/Heidelberg, Germany, 2001. [Google Scholar]
  25. Crosetto, M. Calibration and validation of SAR interferometry for DEM generation. ISPRS J. Photogramm. Remote Sens. 2003, 57, 213–227. [Google Scholar] [CrossRef]
  26. Rabus, B.; Eineder, M.; Roth, A.; Bamler, R. The shuttle radar topography mission–A new class of digital elevation models acquired by spaceborne radar. ISPRS J. Photogramm. Remote Sens. 2003, 57, 241–262. [Google Scholar] [CrossRef]
  27. Tu, J.; Gu, D.; Wu, Y.; Yi, D. Error modeling and analysis for InSAR spatial baseline determination of satellite formation flying. Math. Probl. Eng. 2012, 2012, 140301. [Google Scholar] [CrossRef] [Green Version]
  28. Antony, J.M.W.; Gonzalez, J.H.; Schwerdt, M.; Bachmann, M.; Krieger, G.; Zink, M. Results of the TanDEM-X Baseline Calibration. IEEE J. Sel. Top. Appl. Earth Obs. Remote. Sens. 2013, 6, 1495–1501. [Google Scholar] [CrossRef]
  29. Dall, J. InSAR Elevation Bias Caused by Penetration Into Uniform Volumes. IEEE Trans. Geosci. Remote Sens. 2007, 45, 2319–2324. [Google Scholar] [CrossRef] [Green Version]
  30. Gisinger, C.; Schubert, A.; Breit, H.; Garthwaite, M.; Balss, U.; Willberg, M.; Small, D.; Eineder, M.; Miranda, N. In-depth verification of Sentinel-1 and TerraSAR-X geolocation accuracy using the Australian corner reflector array. IEEE Trans. Geosci. Remote Sens. 2020, 59, 1154–1181. [Google Scholar] [CrossRef]
  31. Li, D.; Zhang, Y. A fast offset estimation approach for InSAR image subpixel registration. IEEE Geosci. Remote. Sens. Lett. 2011, 9, 267–271. [Google Scholar] [CrossRef]
  32. Zhao, S.; Gu, D.; Yi, B.; Yi, D. Error analysis for the baseline estimation and calibration of distributed InSAR satellites. In Proceedings of the 2016 IEEE International Geoscience and Remote Sensing Symposium. IGARSS 2016, Beijing, China, 10–15 July 2016; pp. 4179–4182. [Google Scholar] [CrossRef]
  33. Fritz, T.; Rossi, C.; Yague-Martinez, N.; Rodriguez-Gonzalez, F.; Lachaise, M.; Breit, H. Interferometric processing of TanDEM-X data. In Proceedings of the 2011 IEEE International Geoscience and Remote Sensing Symposium. IGARSS 2011, Vancouver, BC, Canada, 24–29 July 2011; pp. 2428–2431. [Google Scholar] [CrossRef]
  34. Sharma, J.J.; Hajnsek, I.; Papathanassiou, K.P.; Moreira, A. Estimation of Glacier Ice Extinction Using Long-Wavelength Airborne Pol-InSAR. IEEE Trans. Geosci. Remote Sens. 2013, 51, 3715–3732. [Google Scholar] [CrossRef] [Green Version]
  35. Xiong, S.; Muller, J.-P.; Li, G. The Application of ALOS/PALSAR InSAR to Measure Subsurface Penetration Depths in Deserts. Remote Sens. 2017, 9, 638. [Google Scholar] [CrossRef] [Green Version]
  36. Gaber, A.; Koch, M.; Griesh, M.H.; Motoyuki, S.; Farouk, E. Near-surface imaging of a buried foundation in the Western Desert, Egypt, using space-borne and ground penetrating radar. J. Archaeol. Sci. 2013, 40, 1946–1955. [Google Scholar] [CrossRef]
  37. Hallikainen, M.T.; Ulaby, F.T.; Dobson, M.C.; El-Rayes, M.A.; Wu, L.K. Microwave dielectric behavior of wet soil-part 1: Empirical models and experimental observations. IEEE Trans. Geosci. Remote Sens. 1985, 1, 25–34. [Google Scholar] [CrossRef]
  38. Michael, S.; Paul, M.; Brian, E.; Craig, A.; Stefan, E. Canopy height estimation with TanDEM-X in temperate and boreal forests. IEEE J. Sel. Top. Appl. Earth Obs. Remote Sens. 2019, 82, 101904. [Google Scholar] [CrossRef]
  39. Gruber, A.; Wessel, B.; Huber, M.; Roth, A. Operational TanDEM-X DEM calibration and first validation results. ISPRS J. Photogramm. Remote Sens. 2012, 73, 39–49. [Google Scholar] [CrossRef]
  40. Rizzoli, P.; Martone, M.; Gonzalez, C.; Wecklich, C.; Tridon, D.B.; Bräutigam, B.; Bachmann, M.; Schulze, D.; Fritz, T.; Huber, M.; et al. Generation and performance assessment of the global TanDEM-X digital elevation model. ISPRS J. Photogramm. Remote Sens. 2017, 132, 119–139. [Google Scholar] [CrossRef] [Green Version]
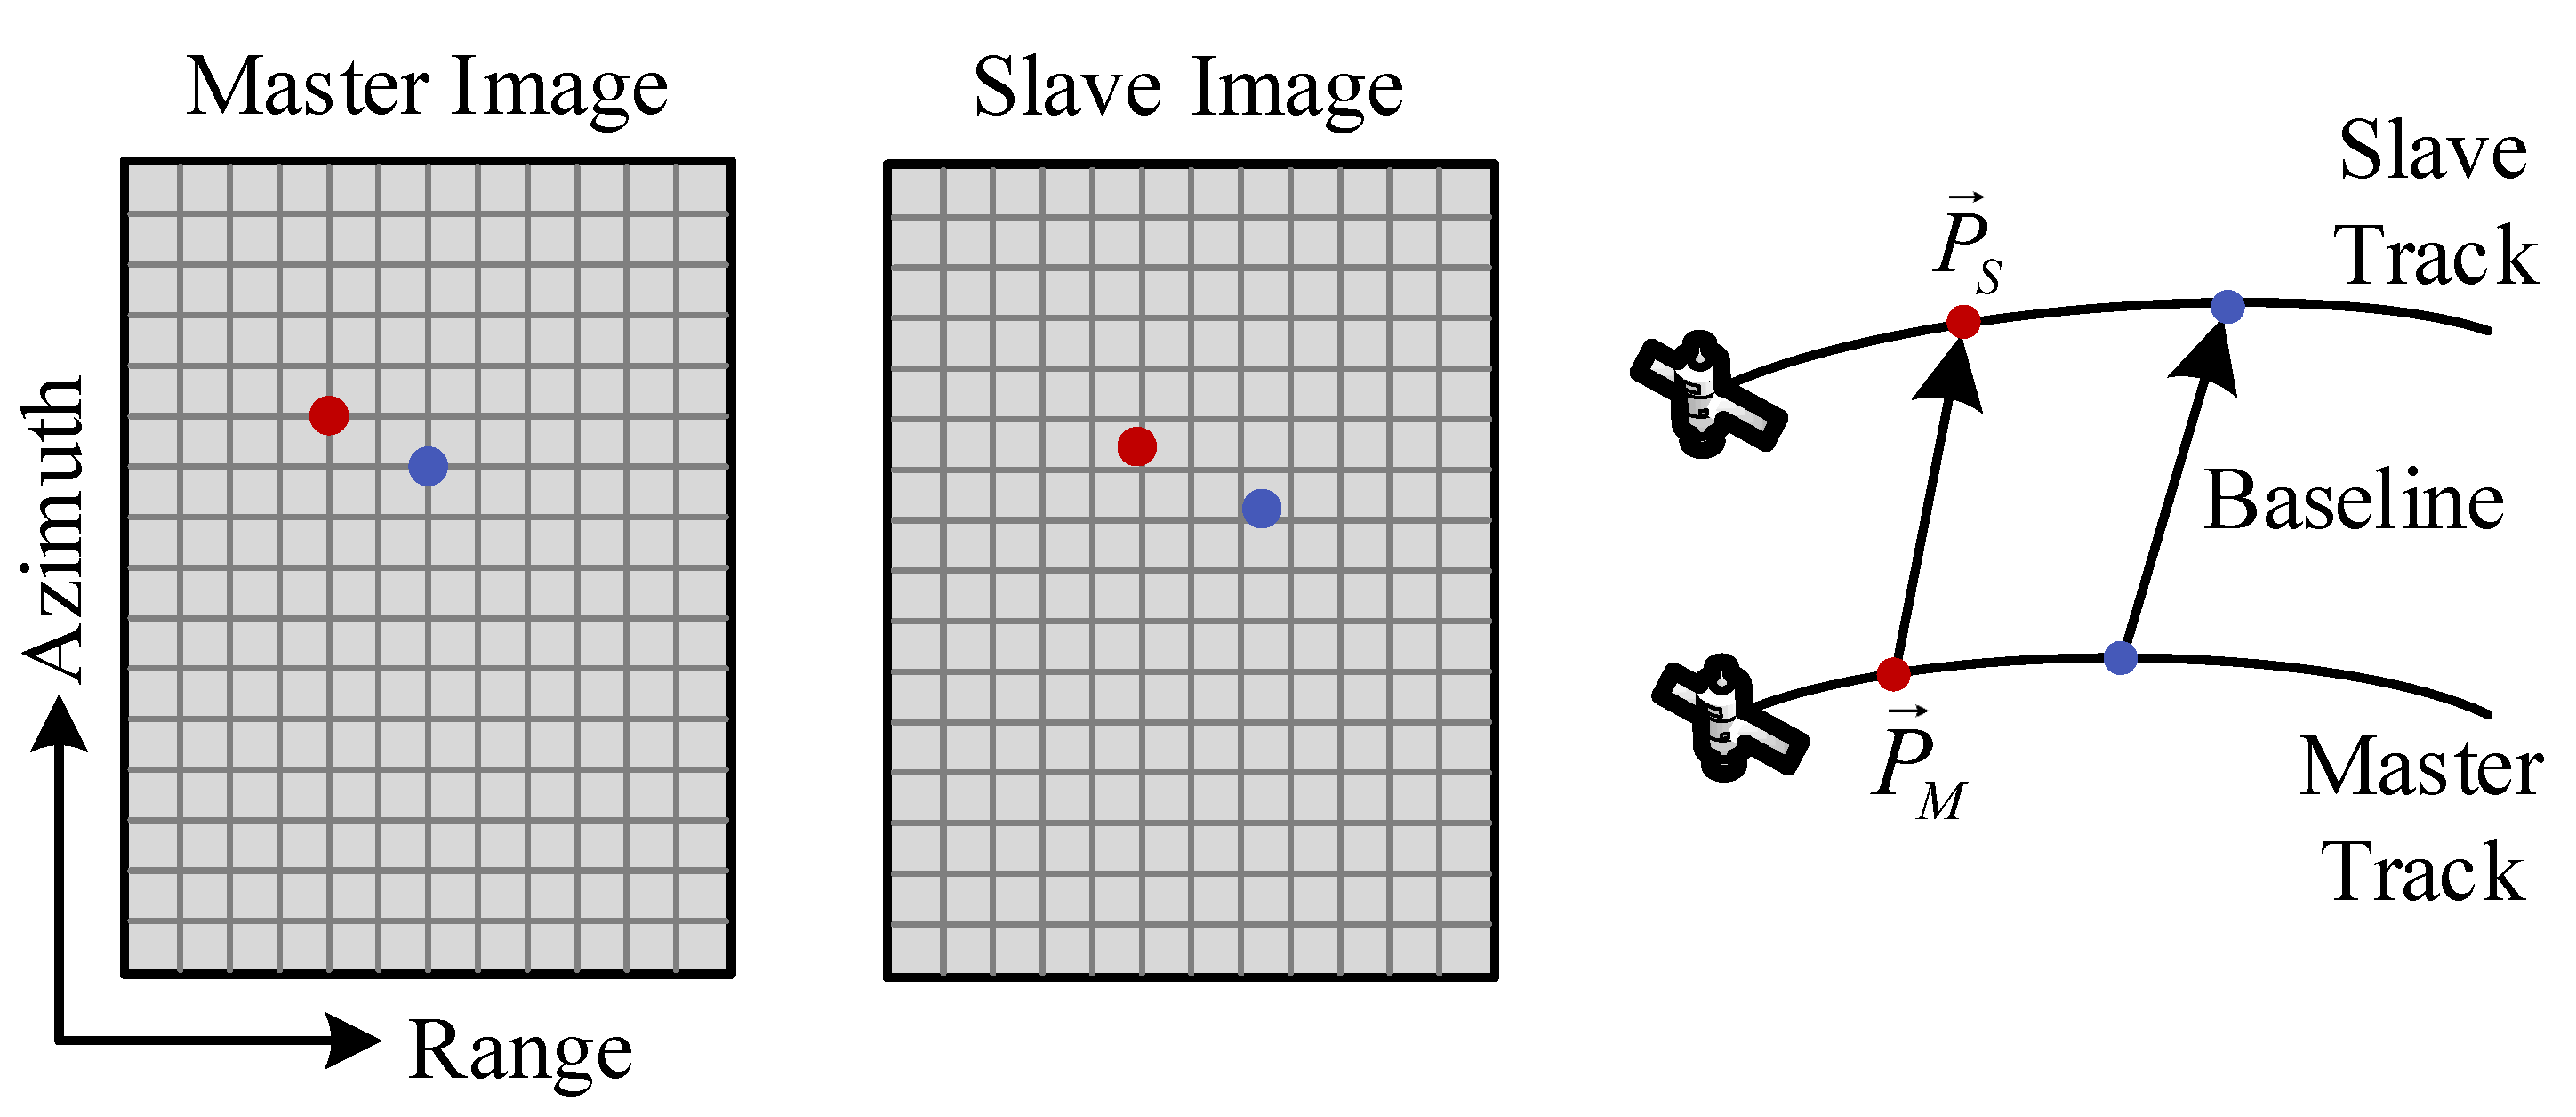
Figure 1. Sketch of the pixel-related baseline model. Points of the same color are identical points.
Remotesensing 15 03024 g001
Figure 2. Schematic diagram of baseline error effect on DEM.
Remotesensing 15 03024 g002
Figure 3. DEM inversion based on observation geometry of bistatic SAR system.
Remotesensing 15 03024 g003
Figure 4. Workflow of the proposed baseline calibration method.
Remotesensing 15 03024 g004
Figure 5. Study Area and point targets. (a) Xinjiang, China. (b) Reference DEM of TwinSAR-L data. (c,d) Deployment of point targets.
Remotesensing 15 03024 g005
Figure 6. The baseline products. (a) X-axis components of the proposed baseline model. (b) Y-axis components of the proposed baseline model. (c) Z-axis components of the proposed baseline model. (d) X-axis components of the linear baseline model. (e) Y-axis components of the linear baseline model. (f) Z-axis components of the linear baseline model. (g) X-axis baseline difference. (h) Y-axis baseline difference. (i) Z-axis baseline difference.
Remotesensing 15 03024 g006
Figure 7. Interferometric phase. (a) Unwrapped phase. (b) Flattened phase.
Remotesensing 15 03024 g007
Figure 8. Raw DEM products. (a) Raw DEM generated by the proposed baseline model. (b) The difference between (a) and SRTM DEM. (c) The average height error of (b) in different directions. (d) Raw DEM generated by the linear baseline model. (e) The difference between (d) and SRTM DEM. (f) The average height error of (e) in different directions.
Remotesensing 15 03024 g008
Figure 9. Height error of corner reflectors. (a) Before baseline calibration. (b) After baseline calibration.
Remotesensing 15 03024 g009
Figure 10. InSAR DEM products generated after baseline calibration. (a) InSAR DEM, proposed method. (b) The difference between (a) and SRTM DEM. (c) The average height error of (b) in different directions. (d) InSAR DEM, TanDEM-X method. (e) The difference between (d) and SRTM DEM. (f) The average height error of (e) in different directions.
Remotesensing 15 03024 g010
Figure 11. Statistical analysis of the height errors.
Remotesensing 15 03024 g011
Figure 12. The sensitivity of the height to the change of different components of the baseline. (a) Baseline X, Y, and Z components (b) Parallel to the LOS and perpendicular to the LOS.
Remotesensing 15 03024 g012
Table 1. Parameters of the selected TwinSAR-L data.
ParameterValue
Central incidence angle44.41
Bistatic angle0.16
Orbit height607 km
Height of ambiguity78.48 m
Resolution (azimuth × range)1.99 m × 1.66 m
Image pixel (azimuth × range)23,248 × 22,914
Multi-look number (azimuth × range)5 × 5
Disclaimer/Publisher’s Note: The statements, opinions and data contained in all publications are solely those of the individual author(s) and contributor(s) and not of MDPI and/or the editor(s). MDPI and/or the editor(s) disclaim responsibility for any injury to people or property resulting from any ideas, methods, instructions or products referred to in the content.