Abstract
Methane (CH4) is recognized as the second most important greenhouse gas. An accurate and precise monitoring of methane gas globally has a vital role in studying the carbon cycle and global warming. The spaceborne integrated path differential absorption (IPDA) lidar is one of the most effective payload for methane detection. The simulation and optimization of the lidar system parameters can create an important base for the development of spaceborne payloads. However, previous IPDA lidar simulations have mostly used standard atmospheric models at simulation conditions, and to the best of our knowledge, there is no literature yet which applies a wavelength optimization to the IPDA system. In this study, we have investigated the relationship between the IPDA lidar system, based on wavelength optimization, and error measurement for CH4 column-averaged concentration. By selecting the wavelengths with the lowest comprehensive error as on-line and off-line, the error has been minimized by 10 ppb approximately relative to before optimization. We have proposed an IPDA simulation model at real atmospheric conditions, combining with ERA-5 reanalysis data, to simulate methane concentration globally, and present the distribution of errors. Finally, after the optimization of the lidar system parameters, we have ensured that the maximum inversion error for CH4 measurement is less than 10 ppb, to provide a reference for designing spaceborne IPDA lidar systems for high-precision CH4 column-averaged concentration detection.
1. Introduction
Methane (CH4) is the second most important greenhouse gas after carbon dioxide (CO2) [1]. Post the industrial revolution, global methane concentration increased staggeringly; there was a period of stabilization at the beginning of the 21st century [2], but it has started to rise again since 2007 [3,4] and has increased by a factor of 2.6 since 2021. Currently, the atmospheric methane gas level has reached over 1895 parts per billion (ppb), which is a remarkable increase as compared to the modest level of 722 ppb in the beginning [5]. Ice core measurements reveal that such levels are unprecedented over the last 6.5 million years [6,7,8]. By now, it has been assured that CH4 has been considered to be a crucial factor in global climate change. Further increase in its atmospheric concentration level in the 21st century could undermine international climate change mitigation efforts [9]. Hence, the detection of methane gas is critical, in which global methane gas detection technologies can help us not only to regulate methane gas emissions to mitigate the effects of climate change but can also help us to understand its role in Earth’s climate change.
To systematically observe methane gas, the World Meteorological Organization’s (WMO) Global Atmospheric Watch (GAW) program started working on it since the 1880s [10]. The stratospheric and mesospheric sounder (SAMS) instruments installed on the Nimbus-7 satellite achieved the first detection of stratospheric CH4 profile, to build a foundation for Earth observation systems, such as Aqua, Terra, Aura, Landsat, and SeaWiFS [11]. Similarly, SCIAMACHY satellites detected methane gas distribution using 1.65 µm and 2.3 µm channels with a spatial resolution of 30 km × 60 km [12,13,14,15]. Among the existing thermal infrared (TIR) spaceborne instruments devoted to tropospheric remote sensing, the Infrared Atmospheric Sounding Interferometer (IASI), the Atmospheric Infrared Sounder (AIRS) and the Cross-track Infrared Sounder (CrIS) use methane TIR absorption bands for observations [16,17,18]. Zhou et al. also have analyzed the spatiotemporal distributions and changes of methane in atmosphere globally using data from these hyperspectral TIR instruments [19]. Additionally, passive remote sensing satellites, such as GOSAT, GHGSat, TROPOMI, GOSAT-2, GF-5, and Prisma also monitored methane gas [20,21,22,23,24,25,26,27]. Moreover, China’s FY-3D satellite was launched in 2018 with 1.65 µm channel to monitor methane gas with a spatial resolution of 10 km [28]. Based on the development of satellite detection technology and inversion algorithms, the accuracy of CH4 inversion has been improved. The deviation of the inverse CH4 concentration in the sky-bottom mode, using the ground station data, is at least 14 ppb, where the highest spatial resolution is 7 km × 7 km, and all of them are spaceborne monitoring with passive remote sensing [29,30,31]. However, passive remote sensing has limitations: it does not have the ability to observe at night, is influenced by clouds, aerosols and atmospheric molecules, has poor accuracy, and is unable to achieve the required accuracy of 10 ppb to detect methane gas globally [3]. Moreover, current passive remote sensing satellites are unable to observe high latitudes area.
Spaceborne integrated path differential absorption (IPDA) lidar is considered to be effective for the monitoring of global methane concentration changes [32]. These lidars determine target gas concentrations by measuring the difference in absorption produced by the laser beam on the round-trip path between the lidar and the hard target. They are not affected by the backscattering of laser due to atmospheric molecules, clouds, and aerosols, resulting in high signal-to-noise ratio and minimum atmospheric influence. Active remote sensing technology, with IPDA lidar, has a large signal-to-noise ratio and can be only minimally affected by the sunlight, allowing for uninterrupted global monitoring at any weather condition and season, and thus has improved the spatial and temporal resolution of methane gas monitoring. The Deutsches Zentrum für Luft- und Raumfahrt (DLR) and the Centre National d’Etudes Spatiales (CNES) are jointly working on the Methane Remote Lidar Mission (MERLIN) program. The program is expected to launch in 2024 with an integrated path differential absorption lidar and will operate in a sun-synchronous orbit at an altitude of about 500 km [33,34]. The channels selected for methane gas detection will be 1645.552 nm at the center of the methane absorption line and 1645.846 nm at the methane absorption valley (reference wavelength) [34]. The expected horizontal spatial resolution will be 50 km, with a methane gas detection random error of less than 22 ppb and a systematic error of less than 3 ppb [35,36].
Currently, several simulations and error analyses of IPDA lidar systems for methane gas measurement have been reported. Cassét et al. [37] analyzed the uncertainty of meteorological information on methane measurement results. Bousquet and Ehret et al. [35,38] have carried out error budgeting for methane gas measurement from the perspective of random and systematic errors. Xie et al. [39] have proposed a wavelength optimization model of IPDA lidar systems for CO2 detection. The MERLIN team, the first international developer of a methane detection satellite lidar, has also estimated methane detection errors for different regions of the world, where Kiemle et al. have evaluated the entire IPDA system performance and has studied the sensitivity for MERLIN [40,41], resulting in better detection accuracy than the GOSAT passive remote sensing satellite [35]. Most of the previous studies have presented system simulations with fixed global methane concentration or used standard atmospheric models, which have not accurately obtained the simulation results and error magnitudes for different regions, and have not analyzed the influence of wavelength selection on methane gas detection errors. This paper combines global meteorological element data and methane gas column concentration to establish an IPDA lidar simulation and error analysis model for different regions worldwide. Additionally, the lidar’s wavelength is optimized for the first time to improve the accuracy of the entire system.
China launched the world’s first satellite DQ-1 with the capability of carbon dioxide laser detection in 2022; a lidar for global methane detection is also under consideration. Therefore, methane gas measurement and analysis simulations, and development in payloads are of great significance. In addition, simulation and error analysis can also help to improve the existing active inversion algorithms for greenhouse gases. In this study, we have selected the wavelength of the laser around 1645 nm, and the influence of systematic and random errors was considered individually. To minimize the error, the wavelength optimization algorithm was employed to find the selection of on-line and off-line wavelengths. The simulation and error analysis of the IPDA lidar have been conducted based on meteorological data and column-averaged methane gas mixing ratio data at different locations worldwide. At the optimization of the lidar system parameters, the overall system inversion accuracy was controlled up to 10 ppb. These results may present a theoretical foundation to design China’s new generation of greenhouse gas detection satellites. Section 2 of the paper presents the principle and methods of error analysis of the IPDA system, followed by the wavelength optimization method and the results of the two lasers used by the system. Section 3 describes the parameter sources and processing methods used in the simulation model. Section 4 presents the results of simulation model and error analysis, to reduce random errors by the optimization of lidar parameters. Section 5 summarizes the entire simulation process and proposes the design requirements for lidar parameters.
2. Methods
2.1. IPDA Lidar Inversion Principle
The differential absorption lidar (DIAL) emits two laser beams with similar wavelengths, referred to as on-line and off-line [38]. The on-line beam is typically located at a position with strong methane absorption, making it more sensitive to changes in methane gas concentration, whereas the off-line beam is located at a position with low methane gas absorption property. Both these laser beams have similar values of wavelength. The other parameters used in laser transmission, such as the transmission rate of other gases and aerosols, can be considered to be the same. By using the DIAL equation (Equation (1)), the energy of the backscattered signals of the two wavelengths can be calculated [38].
The variables, , represent the echo power of the two laser beams, respectively, represent the emitted powers, respectively, denotes the radar receiving area, /, respectively, show the atmospheric methane gas absorption cross-section of both the wavelengths at a distance from the lidar, represents surface reflectance, is the distance between the lidar and the ground, is the effective pulse width, and indicate the aerosol optical transmission and the atmospheric transmission, respectively, of other gases, whereas and describe the distances between the lidar and the atmospheric layer top side and ground side, respectively. Similarly, denotes the number of methane molecules per unit volume.
Using the above two equations, the differential absorption optical depth of methane gas can be obtained as below:
Combining the equations of static equilibrium and the universal gas law, the following equation is obtained:
shows the air and methane gas mixing ratio, and are the pressure at the top of the atmosphere and at the ground, respectively, and is the weighting function, which is expressed as:
is the molecular mass of dry air, is the relative humidity of the air and column-averaged concentration of methane gas, indicated by XCH4, can be obtained using Equations (2)–(4):
2.2. Error Calculation for the IPDA Lidar System
2.2.1. Calculation of Random Error
In the IPDA lidar system, errors can be divided into systematic and random errors. The random errors can be caused by several sources of noise, such as background noise, thermal noise, and dark current of detectors. The random error fits the Gaussian distribution, and its mean value can be obtained by using the signal-to-noise ratio (SNR). The SNR of the avalanche photodiode (APD) output can be computed using Equation (6) [42]. The on-line and off-line SNR can be calculated using the echo signal and system parameters, and then by combining it with Equation (7), the value of relative random error (RRE) can be calculated.
where, shows the internal gain factor of APD, is the individual electron power, is the unamplified APD detector responsivity, ( is the laser frequency, is the Planck constant, and is the quantum efficiency), is the average power of incident light, is the electron bandwidth, is the excess noise factor, is the dark current, is the Boltzmann constant, is the internal operating temperature of APD, is the feedback resistance. is the differential absorption optical depth, indicates the signal-to-noise ratio of the on-line echo signal, indicates the signal-to-noise ratio of the off-line echo signal, and is the number of detections per unit horizontal resolution of the IPDA system.
2.2.2. Calculation of Systematic Error
Systematic errors in the lidar system are primarily caused by errors in the atmospheric and system parameters, wherein atmospheric errors are caused due to inaccuracies in temperature, humidity, and pressure data. In this study, the atmospheric parameters are mainly obtained using ERA-5 reanalysis data [43]. The data are obtained from one of the extensive databases worldwide. The evaluation results from ECMWF show that the error in air temperature is about 0.5 K, pressure error is about 0.5 hPa, and relative humidity error is about 5% [43]. Variations in temperature and pressure values can cause error in the methane gas absorption cross-section, which leads to an error in the methane gas differential absorption optical depth (DAOD). Moreover, relative humidity error may cause integral weighting function (IWF) calculation error. To surmise, the effect of the magnitude of 1/IWF due to such error may influence the inversion results of XCH4. In this study, we use Equation (8) [38] to calculate the relative error of the methane gas inversion results (RSEatm), caused by the errors occurring in several meteorological variables.
where, is the inverse of integral weight function including error in atmospheric parameters and is the inverse of integral weight function value without error.
Systematic parameter errors occur due to laser linewidth, monitoring accuracy of laser emission energy, and laser frequency drift [38]. The accurate emission energy error is primarily because of the inevitable presence of the monitoring systematic errors during practical laser emission. The systematic error caused by emission energy accuracy (RSEE) is shown by Equation (9):
where, shows the values of differential absorption optical depth at different positions for specific wavelength values of the emitted laser energy.
The lasers emitted by a lidar is not theoretically monochromatic and have a broader spectrum at the laser frequency. The atmosphere also absorbs light spectrum in this vicinity, but the absorption cross-section may vary with frequency, modifying the strength of the echo signal and which results in systematic errors. To calculate the linearity error of the laser, the differential absorption cross-section has to be replaced by the effective differential absorption cross-section , using Equation (10), which is as follows:
Assuming that the emitted laser is in accordance with the Lorentz linearity, the spectral distribution function, , can be obtained [38]. Here, represents the absorption cross-section at various locations and frequencies, and shows the atmospheric transmittance.
Systematic error is also caused by the center frequency drift of the laser. Similarly, the laser linewidth is caused by changes in the absorption cross-section of methane gas at different frequencies, resulting in differential absorption optical depth error. The corresponding systematic error (RSEf) can be expressed using the differential absorption spectroscopy slope, as shown in the following equation:
2.3. On-Line and Off-Line Wavelength Optimization
To obtain the spectral line intensity of the absorption lines, the HITRAN 2020 database [44] and the Voigt profile are combined [38,45] at different frequencies. The comparison concludes that the absorption cross-section of methane is the same, around 6075 cm−1, for multiple versions of HITRAN 2020 and HITRAN 2004, hence, the comparison results in this study are not related to the version of the HITRAN database. By proper tuning of temperature and pressure values, the absorption cross-section of CH4 can be calculated. Measurements of methane gas was carried out at standard atmospheric temperature and pressure. The absorption spectra of methane gas, water vapors, and carbon dioxide gas were calculated separately. It was found that water vapors had a stronger absorption ability in the infrared band. To eliminate interference from the other two gases, the methane gas absorption peak near 1645 nm was selected, with two small absorption peaks coinciding with the weak absorption bands of water vapors and carbon dioxide gas.
The on-line and off-line wavelength optimization is very important to minimize the expected error for the IPDA lidar system. Xie et al. [39] investigated the sensitivity of the measurement error of CO2 column concentration versus wavelength in terms of both random and systematic errors, where the wavelength optimization was carried out to minimize the total error of the lidar system to detect CO2 column concentration. As the inversion principle of CH4 is similar to that of CO2 [38], therefore, a similar optimization algorithm has been employed in this paper to optimize the on-line and off-line wavelengths. Among the several error factors, the systematic error caused by temperature variation and frequency offset, and the random error caused by background noise vary greatly with on-line wavelength. The other factors are less sensitive to the wavelength. Because the measurement errors of the IPDA lidar for methane in Antarctica, Qinghai-Tibet Plateau and Greenland Island are high, the above errors in these areas are calculated individually by combining the atmospheric background fields, such as ERA-5, surface reflectance and CH4 column concentration data.
For random errors, we assumed an excess noise factor of 4.3 for the APD operating at 23 , with an electronic broadening of 3 MHz, a dark current of 160 fA√Hz, and a feedback resistance of 1 MΩ, the system quantum efficiency was 0.8, and the internal gain factor was 20. The energy of echo signal at different on-line wavelength values in the Antarctic, Greenland, and Qinghai-Tibet Plateau regions was calculated using Equation (1), whereas using Equations (6) and (7), in combination with the 1976 standard atmospheric model, we have calculated the random errors, as shown in Figure 1a. The figure shows that selecting the on-line wavelengths closer to the two small absorption peaks near 1645 nm increases the optical depth, which results in reducing the signal-to-noise ratio. However, moving away from the absorption peaks causes a decrease in the differential effect, leading to an increase in error.
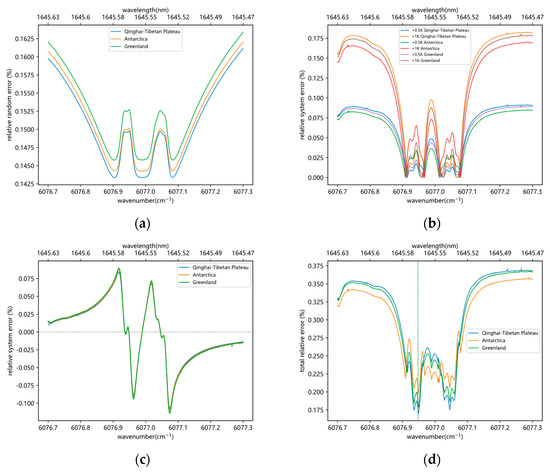
Figure 1.
(a) The effect of different on-line wavelength selections near 1645 nm on the systematic random error due to background noise, where three areas with large errors are selected for calculation, (b) the random error due to temperature uncertainty near 1645 nm versus on-line wavelength selection with the temperature offsets of 0.5 K and 1 K values, (c) the relationship between systematic error and wavelength at a selected frequency offset of 0.6 MHz, (d) the relationship between the comprehensive relative error and on-line wavelength selection; the dotted line position is the lowest error point of the on-line wavelength selection.
The systematic error caused by temperature variation affects the absorption coefficient and thus influences the XCH4 inversion results. Following the US standard atmospheric model, and using Equation (8) with a temperature error of 1 K and 0.5 K, the relationship between the IPDA systematic error and different wavelengths can be calculated for the three different regions with higher errors (as shown in Figure 1b). The figure shows that selecting on-line wavelengths, slightly deviating from the absorption peak, can reduce the error.
The error caused by the laser frequency instability, can be calculated by assuming a fluctuation of 0.6 MHz in the central frequency using Equation (11). The relationship between the differential optical depth and the on-line wavelength selection is shown in Figure 1c. As the figure shows, the frequency instability error increases near the centers of the two CH4 absorption peaks. This is because the closer the center of the absorption peak, the greater the differential absorption spectrum slope, which then leads to a high frequency instability error.
The three types of absolute errors are combined to obtain the relationship between the comprehensive error and wavelength, as shown in Figure 1d. The on-line wavelength is selected at a minimum value of total error, where the value of wavelength is 1645.565 nm. The graph shows the maximum value of the error at the center of the absorption peak and minimum value at both sides of the peak. At a larger distance from the peak, the error gradually increases. The distribution of total error at a selected wavelength is same to that of the CO2 calculated by Xie et al. [39]. Choosing the on-line wavelength at this position effectively avoids the adverse effect of low SNR at the center of the absorption peak and experiences an insignificant differential effect at a distance away from the peak.
For the IPDA lidar, the off-line should be at a distance away from the CH4 absorption peak, but on-line should be at the nearest point so that the optical depth of the other gases, the ground reflectance and the aerosol optical depth may hardly change. The systematic error from the absorption effect of the other gases in the off-line can be calculated using Equation (12):
The and represent the differential absorption optical depth of CO2 and water vapors in the atmosphere, respectively. Assuming the atmospheric concentrations of 1900 ppb for CH4, 400 ppm for CO2, and 20,000 ppm for H2O, the optical depth of the three gases was calculated using the 1976 US standard atmosphere model and is shown in Figure 2. According to Equation (12), the RSEother caused by H2O and CO2 was also calculated as shown in Figure 2: the RSEother is minimized when the off-line wavelength is selected at 1645.831 nm, using the above position, and the effect of CO2 and H2O is reduced; the RSEother remains minimal at an off-line frequency offset of 0.6 MHz. In conclusion, the optimization results show that the on-line and the off-line wavelengths can be set at 1645.565 nm and 1645.831 nm, respectively. These selected values of wavelength minimize the sum of the four types of errors analyzed as mentioned previously.
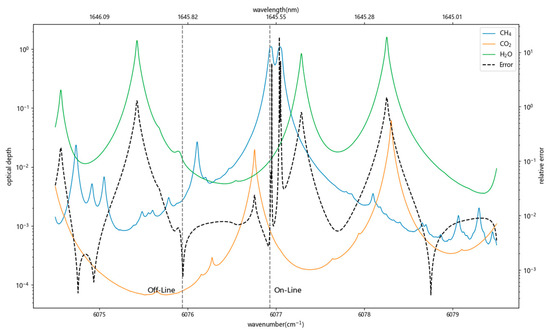
Figure 2.
Optical depth of CH4, CO2, and H2O at different wavelengths. The gray dotted lines in the figure are the off-line and on-line positions of the IPDA lidar system. The black dashed line is the relative error corresponding to the selection of different off-line.
2.4. IPDA Lidar System Parameters and Simulation Routes
The instrument parameters of the IPDA system used for the initial simulation are listed in Table 1, which can be easily implemented. At a certain value of systematic and random errors, for example, the temperature error is 0.5 K, the pressure error is 0.5 hPa, the relative humidity error is 5%, the laser frequency offset is 0.3 MHz, and the accuracy error of the emitted laser energy and other factors are added. The three-dimensional distribution of global methane gas absorption cross-section was obtained by combining the three-dimensional field of temperature and pressure. Using the satellite data, the global distribution of reflectance, aerosol transmittance, and XCH4 can be obtained. The echo signals of the two laser beams can be inverted, followed by the calculation of the global distribution of the IWF value. The XCH4 can be determined by comparing it with the simulated value obtained in the forward process. The error distribution of the global simulation results can thus be obtained, and the specific process is explained in Figure 3.

Table 1.
System parameters for IPDA LIDAR simulation.
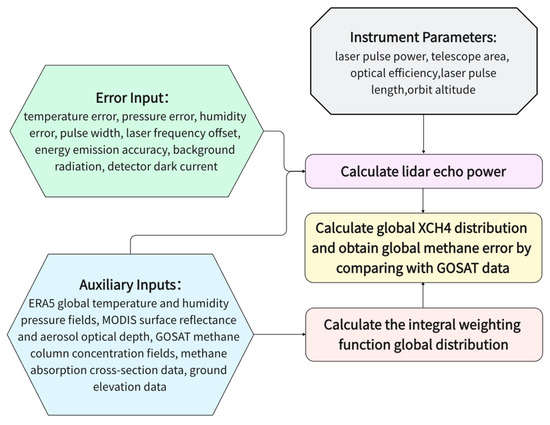
Figure 3.
Schematic diagram of the simulation framework used in IPDA lidar.
3. Materials
3.1. Calculation of Surface Reflectance
The surface reflectance is the ability of the surface to reflect laser, where each underlying surface has its own reflectance value, differentiating the strength of the echo signal, that may affect the SNR and the random error of lidar. In this study, channel 6 (1628–1652 nm) data provided by MCD43C3 in MODIS reflectance product [46] has been used. This data provide an estimated value of spectral reflectance of every spectral band and corrects the atmospheric scattering and aerosol effects. In case of passive remote sensing MODIS Terra satellite, polar data are missing due to solar zenith angle limitations. At the surface of ice and water, the reflectance values cannot be used directly without making some corrections. Dumont et al. [47] have proposed the modified equation for snow and ice reflectance. Hu and Lancaster and Disney et al. [48,49,50] have proposed a correction equation for sea surface reflectance based on sea surface wind speed. We have combined these methods with the average ground snow cover and sea surface wind speed for August 2020 using ERA-5 data [43] to calculate the surface reflectance, as shown in Figure 4. The specific correction equations for different earth surfaces are shown in Table 2, where, is the original surface reflectance in sr−1, is the snow cover, is the wind speed, and is the corrected surface reflectance. For high wind speed of the sea surface, the reflectance is higher because of rough sea surface.
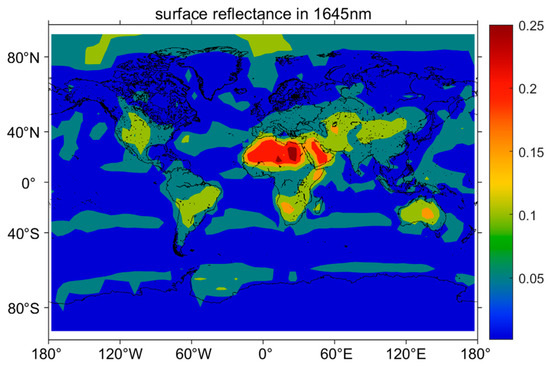
Figure 4.
Global surface reflectance obtained at 1645 nm by correcting the surface albedo of MODIS.

Table 2.
Surface reflectance correction methods for different surface types.
3.2. Calculation of the Aerosol Optical Depth
Angstrom [51] has proposed the following formula to calculate aerosol optical depth of whole atmosphere:
The value of β is directly dependent on the aerosol concentration, while α reflects the properties of aerosol particle size distribution. The aerosol optical depth at two known wavelengths can be used to determine the depth at other wavelengths theoretically using Equations (14) and (15):
In this study, the MODIS aerosol optical depth (AOD) data at 1.24 μm and 1.64 μm in the MOD04_L2 product’s near-infrared band dataset from NASA’s Global Meteorological Data Center [52] for August 2020 have been chosen. Using Equations (13)–(15), the AOD at 1645 nm wavelength can be calculated as presented in Figure 5, showing AOD is higher in the northern parts of Africa and temperate Asia.
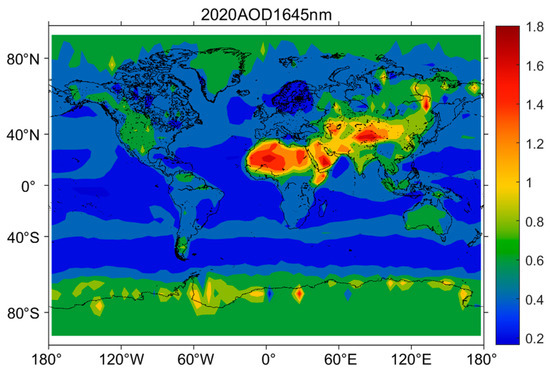
Figure 5.
Aerosol optical depth at a wavelength of 1645 nm used by IPDA lidar.
3.3. Calculation of the XCH4 Field
In previous simulations of lidar, the methane gas data have a fixed value during the forward process. However, this can cause errors in the resulting global echo signal distribution and error distribution. To improve the accuracy of the inversion results, this study utilized Level 4B data from the GOSAT satellite, which provides global column-averaged methane gas mixing ratio fields integrated from the actual observations [53]. XCH4 is obtained by a weighted average in the vertical direction based on the weighting function in the GOSAT dataset and the methane concentration at different altitudes. Using the temperature, humidity, and pressure field data collected via ERA-5, the number of atmospheric molecules at different altitudes can be calculated. Using these calculated data, the number of methane molecules at different altitudes can be obtained. By incorporating this data into the forward process, the inversion results became more accurate. Methane gas diffusion occurs slowly, as gas concentration cannot fluctuate significantly in a short time, so the average methane gas column concentration from January to December 2020 was calculated to generate a global distribution map of yearly average (as shown in Figure 6). The methane gas concentration in the northern hemisphere was found to be denser than that in the southern hemisphere, whereas in Asia it was relatively high, which resulted in an increased differential optical depth and lower signal-to-noise ratio, leading to higher random errors.
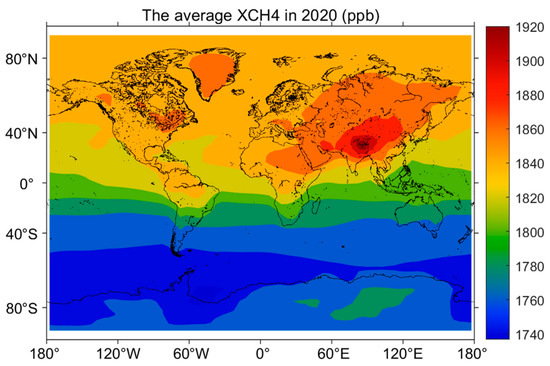
Figure 6.
Global yearly averaged distribution of L4B level data of methane gas using GOSAT satellite for the year 2020.
4. Results and Discussion
4.1. Calculation of the Integral Weighting Function
The simulation process for XCH4 is presented above in Section 2.1, and the value of the integral weight function (IWF) can be obtained for different regions of the globe. The main factors affecting the IWF value are the integration height, temperature, humidity and pressure. Temperature and pressure affect the IWF value by influencing the differential absorption cross-section. In this paper, the global three-dimensional fields of temperature, pressure and humidity are obtained from the reanalysis information of ERA-5. A global reanalysis dataset is published by the European Center for Medium-Range Weather Forecasts (ECMWF) [43].
Using Equation (4) and combining the global surface elevation data obtained from the Global Land One-kilometer Base Elevation (GLOBE) dataset and by setting the elevation value on the ocean to 0, we obtained the global altitude, as shown in Figure 7a. On the other hand, after setting the lower limit of integration to the global altitude and the upper limit to the height of 1 hPa of atmospheric pressure to integrate the WF in the vertical direction, we have obtained the global distribution of the IWF value (as shown in Figure 7b). For regions at high altitudes, like, the Antarctic Plateau and the Tibetan Plateau, the optical depth is lower and hence the IWF value is lower. For regions with the same altitude, at a lower value of temperature and pressure, the corresponding absorption cross-section and IWF have larger values.
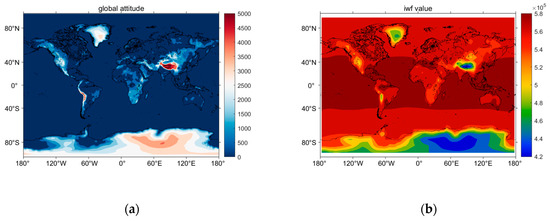
Figure 7.
(a) Global altitude data, (b) global distribution of the magnitude of the IWF during the simulation of the IPDA lidar system.
4.2. IPDA System Simulation Results and Estimation of Random Errors
After calculating the system parameters and combining them with the instrument parameters, the on-line and off-line backscattered signal strength can be calculated using the lidar Equation (1), and the corresponding global distribution of relative random error and absolute random error caused by background noise and detector dark current and the methane gas column concentration can be calculated using Equation (7), as shown in Figure 8c,d. In addition, the IPDA lidar signal simulation of methane in this paper was ideal in the case of no clouds. In the presence of clouds, it is difficult for the laser to pass through the target, which allows the lidar to only measure the methane gas column concentration above the clouds, requiring the surface reflectance data to be changed to the reflectance of the clouds. However, we can combine the methane column concentration over the clouds with numerical weather predictions to get the whole atmospheric XCH4.


Figure 8.
(a) Global on-line echo signal SNR (b) and off-line echo signal SNR simulated by IPDA lidar system in this study. (c) The global distribution of the XCH4 relative random error and (d) the absolute random error.
By combining the energy of the echo signal with the system parameters mentioned in Figure 3, the SNR of the on-line and off-line channels of the lidar can be calculated using Equation (6), as shown in Figure 8a,b. The SNR in Figure 8 is calculated by averaging the echo signal every 200 times along the satellite orbit, which corresponds to a horizontal resolution of about 20 km.
The aerosol optical depths are large and methane concentrations are the greatest in Central Asia, resulting in a weak echo signal and low signal-to-noise ratio, presenting high value of random error in Central Asia. As for the global random error, the maximum calculated value is 5.03 ppb, so the high coverage of ice and snow with a low surface reflectance in the regions of Antarctic and Greenland lead to a high random error with an average value of 4.43 ppb. Although the reflectance is low on the ocean, the small aerosol optical depth and large echo power result in an average random error of only 3.52 ppb. In ocean, the main factor affecting the random error is the wind speed magnitude. The larger the ocean surface reflectance, the greater the SNR at locations with high sea surface wind speed. On land, the main factors affecting the error are the aerosol optical depth and the surface reflectance. Overall, the initial design requirements meet at a horizontal resolution of about 20 km.
4.3. Analysis of Systematic Errors Using IPDA Lidar
4.3.1. Verification of Model Accuracy
Prior to calculating the inversion error, it is necessary to verify the accuracy of the model. The specific methods used to classify errors in the literature for previous error analysis of CH4 do not agree with ours, so a direct comparison cannot be carried out to verify our correctness. In 2008, Ehret et al. showed [38] that the principles of differential absorption lidar inversion for CO2 and CH4 are the same, and hence the correctness of our model can be verified by comparing the CO2 error inversion results. This study refers to the parameter data of the lidar system presented in reference [38]. Using the same model and methods for calculating different types of errors presented in Section 2.2, the error of the CO2 inversion results is calculated under the assumption of a 380 ppm CO2 concentration, and a horizontal comparison is carried out, as shown in Table 3.

Table 3.
The comparison results of the relative errors of XCO2 due to different error sources obtained from the simulation of the same system parameters selected for comparison.
Some specific parameters are not specifically presented in the reference, such as the molecular transmittance of other atmospheric gases and the aerosol optical depth, and the absorption lines cannot be exactly the same due to rounding errors, which can lead to some deviation in the error calculation. But overall, the comparative results of the two papers are similar and can prove the correctness of our error analysis model, so we can then use the model and simulate the error of CH4.
4.3.2. Simulation of Systematic Errors
To process methane gas inversion, the sensitivity of the systematic error is calculated using the US 1976 standard atmospheric model. We employ Equation (8), presented in Section 2.3, to compute the relative error of the system caused by meteorological factors. The sensitivity of the linewidth, frequency offset, and energy detection accuracy to the systematic error caused by the parameters can be evaluated by assuming the independent influence of each factor and using Equations (10)–(12), mentioned in Section 2.3. The sensitivity of the systematic error in the XCH4 inversion results are shown in Figure 9.
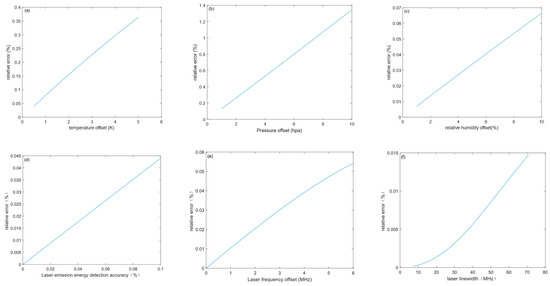
Figure 9.
(a) The relationships between the relative system error of inversion and the temperature offset, (b) pressure offset, (c) and relative humidity. (d) Systematic error due to accuracy of emitted laser energy detection in IPDA system parameters, (e) systematic error due to laser center frequency offset, and (f) relative systematic error due to laser linewidth.
As seen in Figure 9, meteorological elements, such as temperature, pressure and relative humidity have a great influence on the error of the whole system with high sensitivity, hence, it is rather important to choose a high precision global atmospheric background field. The emission accuracy of the laser has a great impact, and a shift in the center frequency of the laser will affect the differential absorption coefficient of the methane gas, thereby generating errors.
Assuming that the inversion errors caused by each error source are independent of each other, with only the on-line and off-line wavelengths changed, using the model we have verified as correct in Section 4.3.1, the absolute errors at the wavelengths selected by a previous study (on-line and off-line were selected at 1645.552 nm and 1645.846 nm) [35] and the error distribution after wavelength optimization (on-line and off-line at 1645.565 nm and 1645.831 nm) are calculated separately and presented in Table 4. The results show that the system can meet the 10 ppb requirement in the Antarctic region where the inversion error is relatively high. Additionally, the absolute error is reduced by 10.1 ppb compared to before wavelength optimization in this region.

Table 4.
For the IPDA lidar model in this paper, the absolute systematic errors at 1900 ppb concentration of XCH4 were chosen to be inverted at on-line and off-line wavelengths before and after optimization under certain error assignments for different error factors.
4.4. Random Errors Optimization
As the inversion of the total XCH4 from different error sources is not completely independent, it is important to count all the errors to calculate the total error. In this study, the six influencing factors are listed in Table 4. These errors are the parameters of the forward simulation process. The global methane gas column concentration is obtained using the same steps as shown in Figure 3. The two laser beam signals and global distribution of the differential absorption optical depth (DAOD) are calculated and shown in Figure 10a. The comparison of the XCH4 values through inversion using the original GOSAT satellite XCH4 data is carried out, to obtain the global error distribution of the XCH4 (as shown in Figure 10b).
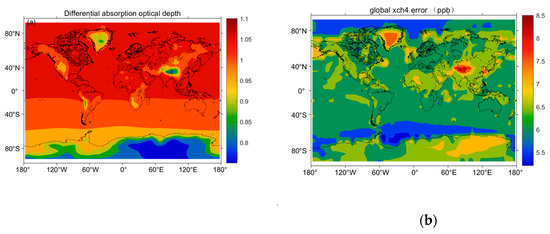
Figure 10.
(a) Differential absorption optical depth distribution through inversion with error, and (b) global distribution of the total error using inversion.
The figure shows that the average absolute error of the XCH4 inversion in the southern hemisphere is smaller than the northern hemisphere due to lower average methane gas column concentration. On the other hand, large error values resulted with an average error of 8.41 ppb, in the Tibetan Plateau region, due to smaller differential absorption optical depth and in Central Asia, due to larger aerosol optical depth. Bousquet et al. [35] has also mentioned the high value of errors for methane gas in temperate Asia. Although our simulation uses a horizontal resolution of 20 km, while the reference is 50 km, the very small difference in horizontal resolution will only have an effect on the absolute magnitude of the error, and it can be seen that our simulation is similar to the error distribution of Bousquet et al.
In the polar regions, the low signal-to-noise ratio is because of low snow and ice reflectance which results in a relatively large random error. The average methane error is only 6.69 ppb due to low average methane concentration. Other regions may have an average error of 6.51 ppb over the ocean and 7.18 ppb over the land surface. The overall results are below 10 ppb which meets the target requirements.
However, there may be other factors which increase the actual inversion error. Moreover, the results show that the random error accounts for a large proportion and has significant randomness, hence, it is important reduce the random error more. Random error can be reduced by increasing the telescope receiving area, increasing the energy of laser emission, and by increasing the number of detections. Because of the large random error in the Antarctic, the relationship between the magnitude of the random error and these factors is calculated assuming that in the Antarctic, the atmospheric parameters and the surface reflectance are the average values, as shown in Figure 11.

Figure 11.
The relationship between receiver (a) telescope diameter, (b) lidar single pulse energy, (c) and number of lidar repeat detections of the detection area and the absolute random error.
An increase in number of detections can significantly reduce the random errors. But even with an increase in number of detections, the horizontal resolution of detecting methane gas will decrease without increasing the pulse repetition rate. The diameter of the receiver telescope in the atmospheric dynamics mission, Aeolus, is 1.5 m [54], where a telescope with 1.2 m diameter is well-matured and developed. The single pulse energy of the laser carried by the CALIPSO lidar is 110 mJ [55], hence, a laser of 75 mJ is also in line with the actual situation. Therefore, according to the requirements of the system, the value of the single pulse energy is set to 75 mJ, the telescope diameter value is set As 1.2 m, and the number of detections is 200 times, which has finally reduced the random error to 3.5 ppb. The final inversion results control the maximum global error in the temperate Asian region to 8.14 ppb, which is the design requirement of the system.
5. Conclusions
In this study, we have used the HITRAN 2020 spectral database to calculate methane gas absorption cross-sections and analyze the relationship between random error, systematic error, and selected wavelength. The on-line and off-line optimal wavelengths of 1645.565 nm and 1645.831 nm, respectively, were selected. These parameter selection has resulted in the integrated error reduction of about 10 ppb in the integrated error of the system as compared to the inversion results of previous study using different wavelengths. To simulate errors in different regions at real atmospheric conditions, GOSAT satellite XCH4 data have been used in conjunction with ERA-5 reanalysis meteorological data. Similarly, MODIS satellite land surface reflectance, and aerosol optical depth data are used to simulate and analyze methane gas column concentrations in different regions worldwide. Furthermore, the error allocation for the IPDA lidar system was performed, meeting the total error index of 10 ppb. The results of the global error simulation show that the average error can be controlled up to 6.51 ppb over the ocean and up to 7.18 ppb over land. However, in temperate Asia, the inversion error reaches a local maximum of 8.41 ppb due to the high aerosol optical depth and low echo signal-to-noise ratio. To address this issue, this study optimizes the IPDA lidar system parameters by controlling the single pulse energy to 75 mJ, increasing the receiver telescope diameter to 1.2 m, and increasing the detection frequency to 200 times per unit spatial resolution. These optimizations effectively improve the system signal-to-noise ratio and control the maximum global error up to 8.14 ppb, to meet the design requirements. This study can provide important reference information for the parameter designing of spaceborne IPDA lidar systems for high-precision CH4 gas column concentration detection.
Author Contributions
Conceptualization, X.Z. and L.B.; methodology, X.Z.; validation, L.B., Z.F. and M.Z.; writing—original draft, X.Z.; writing—review and editing, L.B., Z.F. and A.M.; supervision, L.B. All authors have read and agreed to the published version of the manuscript.
Funding
This research was funded by the Shanghai Aerospace Science and Technology Innovation Foundation (SAST2022-039) and the National Natural Science Foundation of China (Grant No. 42175145).
Data Availability Statement
The ECMWF (https://cds.climate.copernicus.eu/, accessed on 11 February 2023), MODIS (https://lpdaac.usgs.gov/products/mcd43c3v061/, accessed on 7 March 2023), HITRAN (https://hitran.org/lbl/, accessed on 12 February 2023) and GOSAT (https://www.gosat.nies.go.jp/en/index.html, accessed on 29 March 2023) data used in this study are freely available.
Acknowledgments
The authors kindly acknowledge the teams of ECMWF, MODIS, NOAA, HITRAN and GOSAT for their effort in making the data available.
Conflicts of Interest
The authors declare no conflict of interest.
References
- Etminan, M.; Myhre, G.; Highwood, E.; Shine, K. Radiative forcing of carbon dioxide, methane, and nitrous oxide: A significant revision of the methane radiative forcing. Geophys. Res. Lett. 2016, 43, 12614–612623. [Google Scholar] [CrossRef]
- Dlugokencky, E.; Houweling, S.; Bruhwiler, L.; Masarie, K.; Lang, P.; Miller, J.; Tans, P. Atmospheric methane levels off: Temporary pause or a new steady-state? Geophys. Res. Lett. 2003, 30, 19. [Google Scholar] [CrossRef]
- Kirschke, S.; Bousquet, P.; Ciais, P.; Saunois, M.; Canadell, J.G.; Dlugokencky, E.J.; Bergamaschi, P.; Bergmann, D.; Blake, D.R.; Bruhwiler, L. Three decades of global methane sources and sinks. Nat. Geosci. 2013, 6, 813–823. [Google Scholar] [CrossRef]
- Nisbet, E.G.; Dlugokencky, E.J.; Bousquet, P. Methane on the rise—Again. Science 2014, 343, 493–495. [Google Scholar] [CrossRef]
- Lan, X.; Nisbet, E.G.; Dlugokencky, E.J.; Michel, S.E. What do we know about the global methane budget? Results from four decades of atmospheric CH4 observations and the way forward. Philos. Trans. R. Soc. A 2021, 379, 20200440. [Google Scholar] [CrossRef]
- Etheridge, D.; Pearman, G.; Fraser, P. Changes in tropospheric methane between 1841 and 1978 from a high accumulation-rate Antarctic ice core. Tellus B 1992, 44, 282–294. [Google Scholar] [CrossRef]
- Petit, J.-R.; Jouzel, J.; Raynaud, D.; Barkov, N.I.; Barnola, J.-M.; Basile, I.; Bender, M.; Chappellaz, J.; Davis, M.; Delaygue, G. Climate and atmospheric history of the past 420,000 years from the Vostok ice core, Antarctica. Nature 1999, 399, 429–436. [Google Scholar] [CrossRef]
- Spahni, R.; Chappellaz, J.; Stocker, T.F.; Loulergue, L.; Hausammann, G.; Kawamura, K.; Fluckiger, J.; Schwander, J.; Raynaud, D.; Masson-Delmotte, V. Atmospheric methane and nitrous oxide of the late Pleistocene from Antarctic ice cores. Science 2005, 310, 1317–1321. [Google Scholar] [CrossRef]
- Reay, D.S.; Smith, P.; Christensen, T.R.; James, R.H.; Clark, H. Methane and global environmental change. Annu. Rev. Environ. Resour. 2018, 43, 165–192. [Google Scholar] [CrossRef]
- Liu, S.; Li, X.; Cao, X.; Zhang, X. Development of Atmospheric Methane Observation and Distribution of Global Methane. Remote Sens. Technol. Appl. 2022, 37, 436–450. [Google Scholar]
- Hansen, A.R.; Robinson, G. Water vapor and methane in the upper stratosphere: An examination of some of the Nimbus 7 measurements. J. Geophys. Res. Atmos. 1989, 94, 8474–8484. [Google Scholar] [CrossRef]
- Buchwitz, M.; Schneising, O.; Khlystova, I.; Burrows, J. Retrieval of Carbon Monoxide and Long-lived Greenhouse Gases (CH4, CO2) from SCIAMACHY/ENVISAT Satellite Data; Observing Tropospheric Trace Constituents from Space 50; ACCENT: Brussels, Belgium, 2022. [Google Scholar]
- Buchwitz, M.; De Beek, R.; Noël, S.; Burrows, J.; Bovensmann, H.; Bremer, H.; Bergamaschi, P.; Körner, S.; Heimann, M. Carbon monoxide, methane and carbon dioxide columns retrieved from SCIAMACHY by WFM-DOAS: Year 2003 initial data set. Atmos. Chem. Phys. 2005, 5, 3313–3329. [Google Scholar] [CrossRef]
- Bergamaschi, P.; Frankenberg, C.; Meirink, J.F.; Krol, M.; Dentener, F.; Wagner, T.; Platt, U.; Kaplan, J.O.; Körner, S.; Heimann, M. Satellite chartography of atmospheric methane from SCIAMACHY on board ENVISAT: 2. Evaluation based on inverse model simulations. J. Geophys. Res. Atmos. 2007, 112, D006235. [Google Scholar] [CrossRef]
- Frankenberg, C.; Meirink, J.F.; van Weele, M.; Platt, U.; Wagner, T. Assessing methane emissions from global space-borne observations. Science 2005, 308, 1010–1014. [Google Scholar] [CrossRef]
- Clerbaux, C.; Boynard, A.; Clarisse, L.; George, M.; Hadji-Lazaro, J.; Herbin, H.; Hurtmans, D.; Pommier, M.; Razavi, A.; Turquety, S. Monitoring of atmospheric composition using the thermal infrared IASI/MetOp sounder. Atmos. Chem. Phys. 2009, 9, 6041–6054. [Google Scholar] [CrossRef]
- Xiong, X.; Barnet, C.; Maddy, E.; Sweeney, C.; Liu, X.; Zhou, L.; Goldberg, M. Characterization and validation of methane products from the Atmospheric Infrared Sounder (AIRS). J. Geophys. Res. Biogeosci. 2008, 113, 2007JG000500. [Google Scholar] [CrossRef]
- Goldberg, M.D.; Kilcoyne, H.; Cikanek, H.; Mehta, A. Joint Polar Satellite System: The United States next generation civilian polar-orbiting environmental satellite system. J. Geophys. Res. Atmos. 2013, 118, 13463–413475. [Google Scholar] [CrossRef]
- Zhou, L.; Warner, J.; Nalli, N.R.; Wei, Z.; Oh, Y.; Bruhwiler, L.; Liu, X.; Divakarla, M.; Pryor, K.; Kalluri, S.; et al. Spatiotemporal Variability of Global Atmospheric Methane Observed from Two Decades of Satellite Hyperspectral Infrared Sounders. Remote Sens. 2023, 15, 2992. [Google Scholar] [CrossRef]
- Saitoh, N.; Touno, M.; Hayashida, S.; Imasu, R.; Shiomi, K.; Yokota, T.; Yoshida, Y.; Machida, T.; Matsueda, H.; Sawa, Y. Comparisons between XCH4 from GOSAT shortwave and thermal infrared spectra and aircraft CH4 measurements over Guam. Sola 2012, 8, 145–149. [Google Scholar] [CrossRef]
- Butz, A.; Guerlet, S.; Hasekamp, O.; Schepers, D.; Galli, A.; Aben, I.; Frankenberg, C.; Hartmann, J.M.; Tran, H.; Kuze, A. Toward accurate CO2 and CH4 observations from GOSAT. Geophys. Res. Lett. 2011, 38, 14. [Google Scholar] [CrossRef]
- Buchwitz, M.; Reuter, M.; Schneising, O.; Boesch, H.; Guerlet, S.; Dils, B.; Aben, I.; Armante, R.; Bergamaschi, P.; Blumenstock, T. Comparison and quality assessment of near-surface-sensitive satellite-derived CO2 and CH4 global data sets. Remote Sens. Environ. 2015, 162, 344–362. [Google Scholar] [CrossRef]
- Hu, H.; Hasekamp, O.; Butz, A.; Galli, A.; Landgraf, J.; Aan de Brugh, J.; Borsdorff, T.; Scheepmaker, R.; Aben, I. The operational methane retrieval algorithm for TROPOMI. Atmos. Meas. Tech. 2016, 9, 5423–5440. [Google Scholar] [CrossRef]
- Nakajima, M.; Kuze, A.; Suto, H. The current status of GOSAT and the concept of GOSAT-2. In Proceedings of the Sensors, Systems, and Next-Generation Satellites XVI, Edinburgh, UK, 24–27 September 2012; pp. 21–30. [Google Scholar]
- Ligori, M.; Bradbury, L.; Spina, R.; Zee, R.E.; Germain, S. GHGSat Constellation: The future of Monitoring greenhouse gas emissions. In Proceedings of the 33rd AIAA/USU Conference on Small Satellites, Logan, UT, USA, 6 August 2019. [Google Scholar]
- Fan, B.; Chen, X.; Li, B.; Zhao, Y. Technical innovation of optical remote sensing payloads onboard GF-5 satellite. Infrared Laser Eng. 2017, 46, 0102002. (In Chinese) [Google Scholar] [CrossRef]
- Galeazzi, C.; Sacchetti, A.; Cisbani, A.; Babini, G. The PRISMA program. In Proceedings of the IGARSS 2008-2008 IEEE International Geoscience and Remote Sensing Symposium, Boston, MA, USA, 7–11 July 2008; pp. IV-105–IV-108. [Google Scholar]
- Lin, Z.P.C.; Zhe, X.D.X. Recent Progress of Fengyun Meteorology Satellites. Chin. J. Space Sci. 2018, 38, 788–796. [Google Scholar]
- Qu, Z.; Jacob, D.J.; Shen, L.; Lu, X.; Zhang, Y.; Scarpelli, T.R.; Nesser, H.; Sulprizio, M.P.; Maasakkers, J.D.; Bloom, A.A. Global distribution of methane emissions: A comparative inverse analysis of observations from the TROPOMI and GOSAT satellite instruments. Atmos. Chem. Phys. 2021, 21, 14159–14175. [Google Scholar] [CrossRef]
- Lu, X.; Jacob, D.J.; Zhang, Y.; Maasakkers, J.D.; Sulprizio, M.P.; Shen, L.; Qu, Z.; Scarpelli, T.R.; Nesser, H.; Yantosca, R.M. Global methane budget and trend, 2010–2017: Complementarity of inverse analyses using in situ (GLOBALVIEWplus CH4 ObsPack) and satellite (GOSAT) observations. Atmos. Chem. Phys. 2021, 21, 4637–4657. [Google Scholar] [CrossRef]
- Schneising, O.; Buchwitz, M.; Reuter, M.; Bovensmann, H.; Burrows, J.P.; Borsdorff, T.; Deutscher, N.M.; Feist, D.G.; Griffith, D.W.; Hase, F. A scientific algorithm to simultaneously retrieve carbon monoxide and methane from TROPOMI onboard Sentinel-5 Precursor. Atmos. Meas. Tech. 2019, 12, 6771–6802. [Google Scholar] [CrossRef]
- Liu, D.; Chen, S.; Liu, Q.; Ke, J.; Wang, N.; Sun, Y.; Wang, S.; Chen, Y.; Li, W.; Tao, Y.; et al. Spaceborne Environmental Detection Lidar and Its Key Techniques. Acta Opt. Sin. 2022, 42, 1701001. (In Chinese) [Google Scholar]
- Ehret, G.; Flamant, P.; Kiemle, C.; Quatrevalet, M.; Amediek, A. MERLIN Performance Simulation of Global CH4. In Proceedings of the AGU Fall Meeting Abstracts, San Francisco, CA, USA, 5–9 December 2011; p. A21D-0114. [Google Scholar]
- Pierangelo, C.; Millet, B.; Esteve, F.; Alpers, M.; Ehret, G.; Flamant, P.; Berthier, S.; Gibert, F.; Chomette, O.; Edouart, D. Merlin (methane remote sensing Lidar mission): An overview. EPJ Web Conf. 2016, 116, 26001. [Google Scholar] [CrossRef]
- Bousquet, P.; Pierangelo, C.; Bacour, C.; Marshall, J.; Peylin, P.; Ayar, P.V.; Ehret, G.; Bréon, F.M.; Chevallier, F.; Crevoisier, C. Error budget of the MEthane Remote LIdar mission and its impact on the uncertainties of the global methane budget. J. Geophys. Res. Atmos. 2018, 123, 11766–711785. [Google Scholar] [CrossRef]
- Ehret, G.; Bousquet, P.; Pierangelo, C.; Alpers, M.; Millet, B.; Abshire, J.B.; Bovensmann, H.; Burrows, J.P.; Chevallier, F.; Ciais, P. MERLIN: A French-German space lidar mission dedicated to atmospheric methane. Remote Sens. 2017, 9, 1052. [Google Scholar] [CrossRef]
- Cassé, V.; Chomette, O.; Crevoisier, C.; Gibert, F.; Brožková, R.; El Khatib, R.; Nahan, F. Impact of Meteorological Uncertainties in the Methane Retrieval Ground Segment of the MERLIN Lidar Mission. Atmosphere 2022, 13, 431. [Google Scholar] [CrossRef]
- Ehret, G.; Kiemle, C.; Wirth, M.; Amediek, A.; Fix, A.; Houweling, S. Space-borne remote sensing of CO2, CH4, and N2O by integrated path differential absorption lidar: A sensitivity analysis. Appl. Phys. B 2008, 90, 593–608. [Google Scholar] [CrossRef]
- Xie, Y.; Liu, J.; Jiang, J.; Chen, W. Wavelengths optimization to decrease error for a space-borne lidar measuring CO2 concentration. Infrared Laser Eng. 2014, 43, 88–93. (In Chinese) [Google Scholar]
- Kiemle, C.; Quatrevalet, M.; Ehret, G.; Amediek, A.; Fix, A.; Wirth, M. Sensitivity studies for a space-based methane lidar mission. Atmos. Meas. Tech. 2011, 4, 2195–2211. [Google Scholar] [CrossRef]
- Kiemle, C.; Kawa, S.R.; Quatrevalet, M.; Browell, E.V. Performance simulations for a spaceborne methane lidar mission. J. Geophys. Res. Atmos. 2014, 119, 4365–4379. [Google Scholar] [CrossRef]
- Caron, J.; Durand, Y.; Bezy, J.-L.; Meynart, R. Performance modeling for A-SCOPE: A space-borne lidar measuring atmospheric CO2. In Proceedings of the Lidar Technologies, Techniques, and Measurements for Atmospheric Remote Sensing V, Berlin, Germany, 31 August–3 September 2009; pp. 105–119. [Google Scholar]
- Hersbach, H.; Bell, B.; Berrisford, P.; Hirahara, S.; Horányi, A.; Muñoz-Sabater, J.; Nicolas, J.; Peubey, C.; Radu, R.; Schepers, D. The ERA5 global reanalysis. Q. J. R. Meteorol. Soc. 2020, 146, 1999–2049. [Google Scholar] [CrossRef]
- Gordon, I.; Rothman, L.; Hargreaves, R.; Hashemi, R.; Karlovets, E.; Skinner, F.; Conway, E.; Hill, C.; Kochanov, R.; Tan, Y. The HITRAN2020 molecular spectroscopic database. J. Quant. Spectrosc. Radiat. Transf. 2022, 277, 107949. [Google Scholar] [CrossRef]
- Olivero, J.J.; Longbothum, R. Empirical fits to the Voigt line width: A brief review. J. Quant. Spectrosc. Radiat. Transf. 1977, 17, 233–236. [Google Scholar] [CrossRef]
- Vermote, E. MOD09CMG MODIS/Terra Surface Reflectance Daily L3 Global 0.05 Deg CMG V006; NASA EOSDIS LP DAAC; NASA: Washington, DC, USA, 2015; Volume 10. [Google Scholar]
- Dumont, M.; Brissaud, O.; Picard, G.; Schmitt, B.; Gallet, J.-C.; Arnaud, Y. High-accuracy measurements of snow Bidirectional Reflectance Distribution Function at visible and NIR wavelengths–comparison with modelling results. Atmos. Chem. Phys. 2010, 10, 2507–2520. [Google Scholar] [CrossRef]
- Hu, Y.; Stamnes, K.; Vaughan, M.; Pelon, J.; Weimer, C.; Wu, D.; Cisewski, M.; Sun, W.; Yang, P.; Lin, B. Sea surface wind speed estimation from space-based lidar measurements. Atmos. Chem. Phys. 2008, 8, 3593–3601. [Google Scholar] [CrossRef]
- Lancaster, R.S.; Spinhirne, J.D.; Palm, S.P. Laser pulse reflectance of the ocean surface from the GLAS satellite lidar. Geophys. Res. Lett. 2005, 32, 22. [Google Scholar] [CrossRef]
- Disney, M.I.; Lewis, P.E.; Bouvet, M.; Prieto-Blanco, A.; Hancock, S. Quantifying surface reflectivity for spaceborne lidar via two independent methods. IEEE Trans. Geosci. Remote Sens. 2009, 47, 3262–3271. [Google Scholar] [CrossRef]
- Ångström, A. On the atmospheric transmission of sun radiation and on dust in the air. Geogr. Ann. 1929, 11, 156–166. [Google Scholar]
- Platnick, S.; Ackerman, S.; King, M.; Meyer, K.; Menzel, W.; Holz, R.; Baum, B.; Yang, P. MODIS Atmosphere L2 Cloud Product (06_L2), NASA MODIS Adaptive Processing System; Goddard Space Flight Center: Greenbelt, MD, USA, 2015. [Google Scholar]
- Yokota, T.; Yoshida, Y.; Eguchi, N.; Ota, Y.; Tanaka, T.; Watanabe, H.; Maksyutov, S. Global concentrations of CO2 and CH4 retrieved from GOSAT: First preliminary results. Sola 2009, 5, 160–163. [Google Scholar] [CrossRef]
- Wimmer, R.; Willis, S.; Morancais, D.; Fabre, F.; Demuth, D. The ADM-Aeolus Mission-the first wind lidar in space. In Proceedings of the 57th International Astronautical Congress, Matera, Italy, 12–16 July 2004; p. B1. 2.08. [Google Scholar]
- Winker, D.; Pelon, J.; Coakley, J., Jr.; Ackerman, S.; Charlson, R.; Colarco, P.; Flamant, P.; Fu, Q.; Hoff, R.; Kittaka, C. The CALIPSO mission: A global 3D view of aerosols and clouds. Bull. Am. Meteorol. Soc. 2010, 91, 1211–1230. [Google Scholar] [CrossRef]
Disclaimer/Publisher’s Note: The statements, opinions and data contained in all publications are solely those of the individual author(s) and contributor(s) and not of MDPI and/or the editor(s). MDPI and/or the editor(s) disclaim responsibility for any injury to people or property resulting from any ideas, methods, instructions or products referred to in the content. |
© 2023 by the authors. Licensee MDPI, Basel, Switzerland. This article is an open access article distributed under the terms and conditions of the Creative Commons Attribution (CC BY) license (https://creativecommons.org/licenses/by/4.0/).