Coordination Analysis between the Development of Urban Built-Up Areas and Urban Environmental Factors through Remote Sensing of Nighttime Lights: A Case Study in Nanjing, China
Abstract
1. Introduction
2. Study Area and Data Preprocessing
2.1. Study Area
2.2. Datasets and Data Preprocessing
2.2.1. Datasets
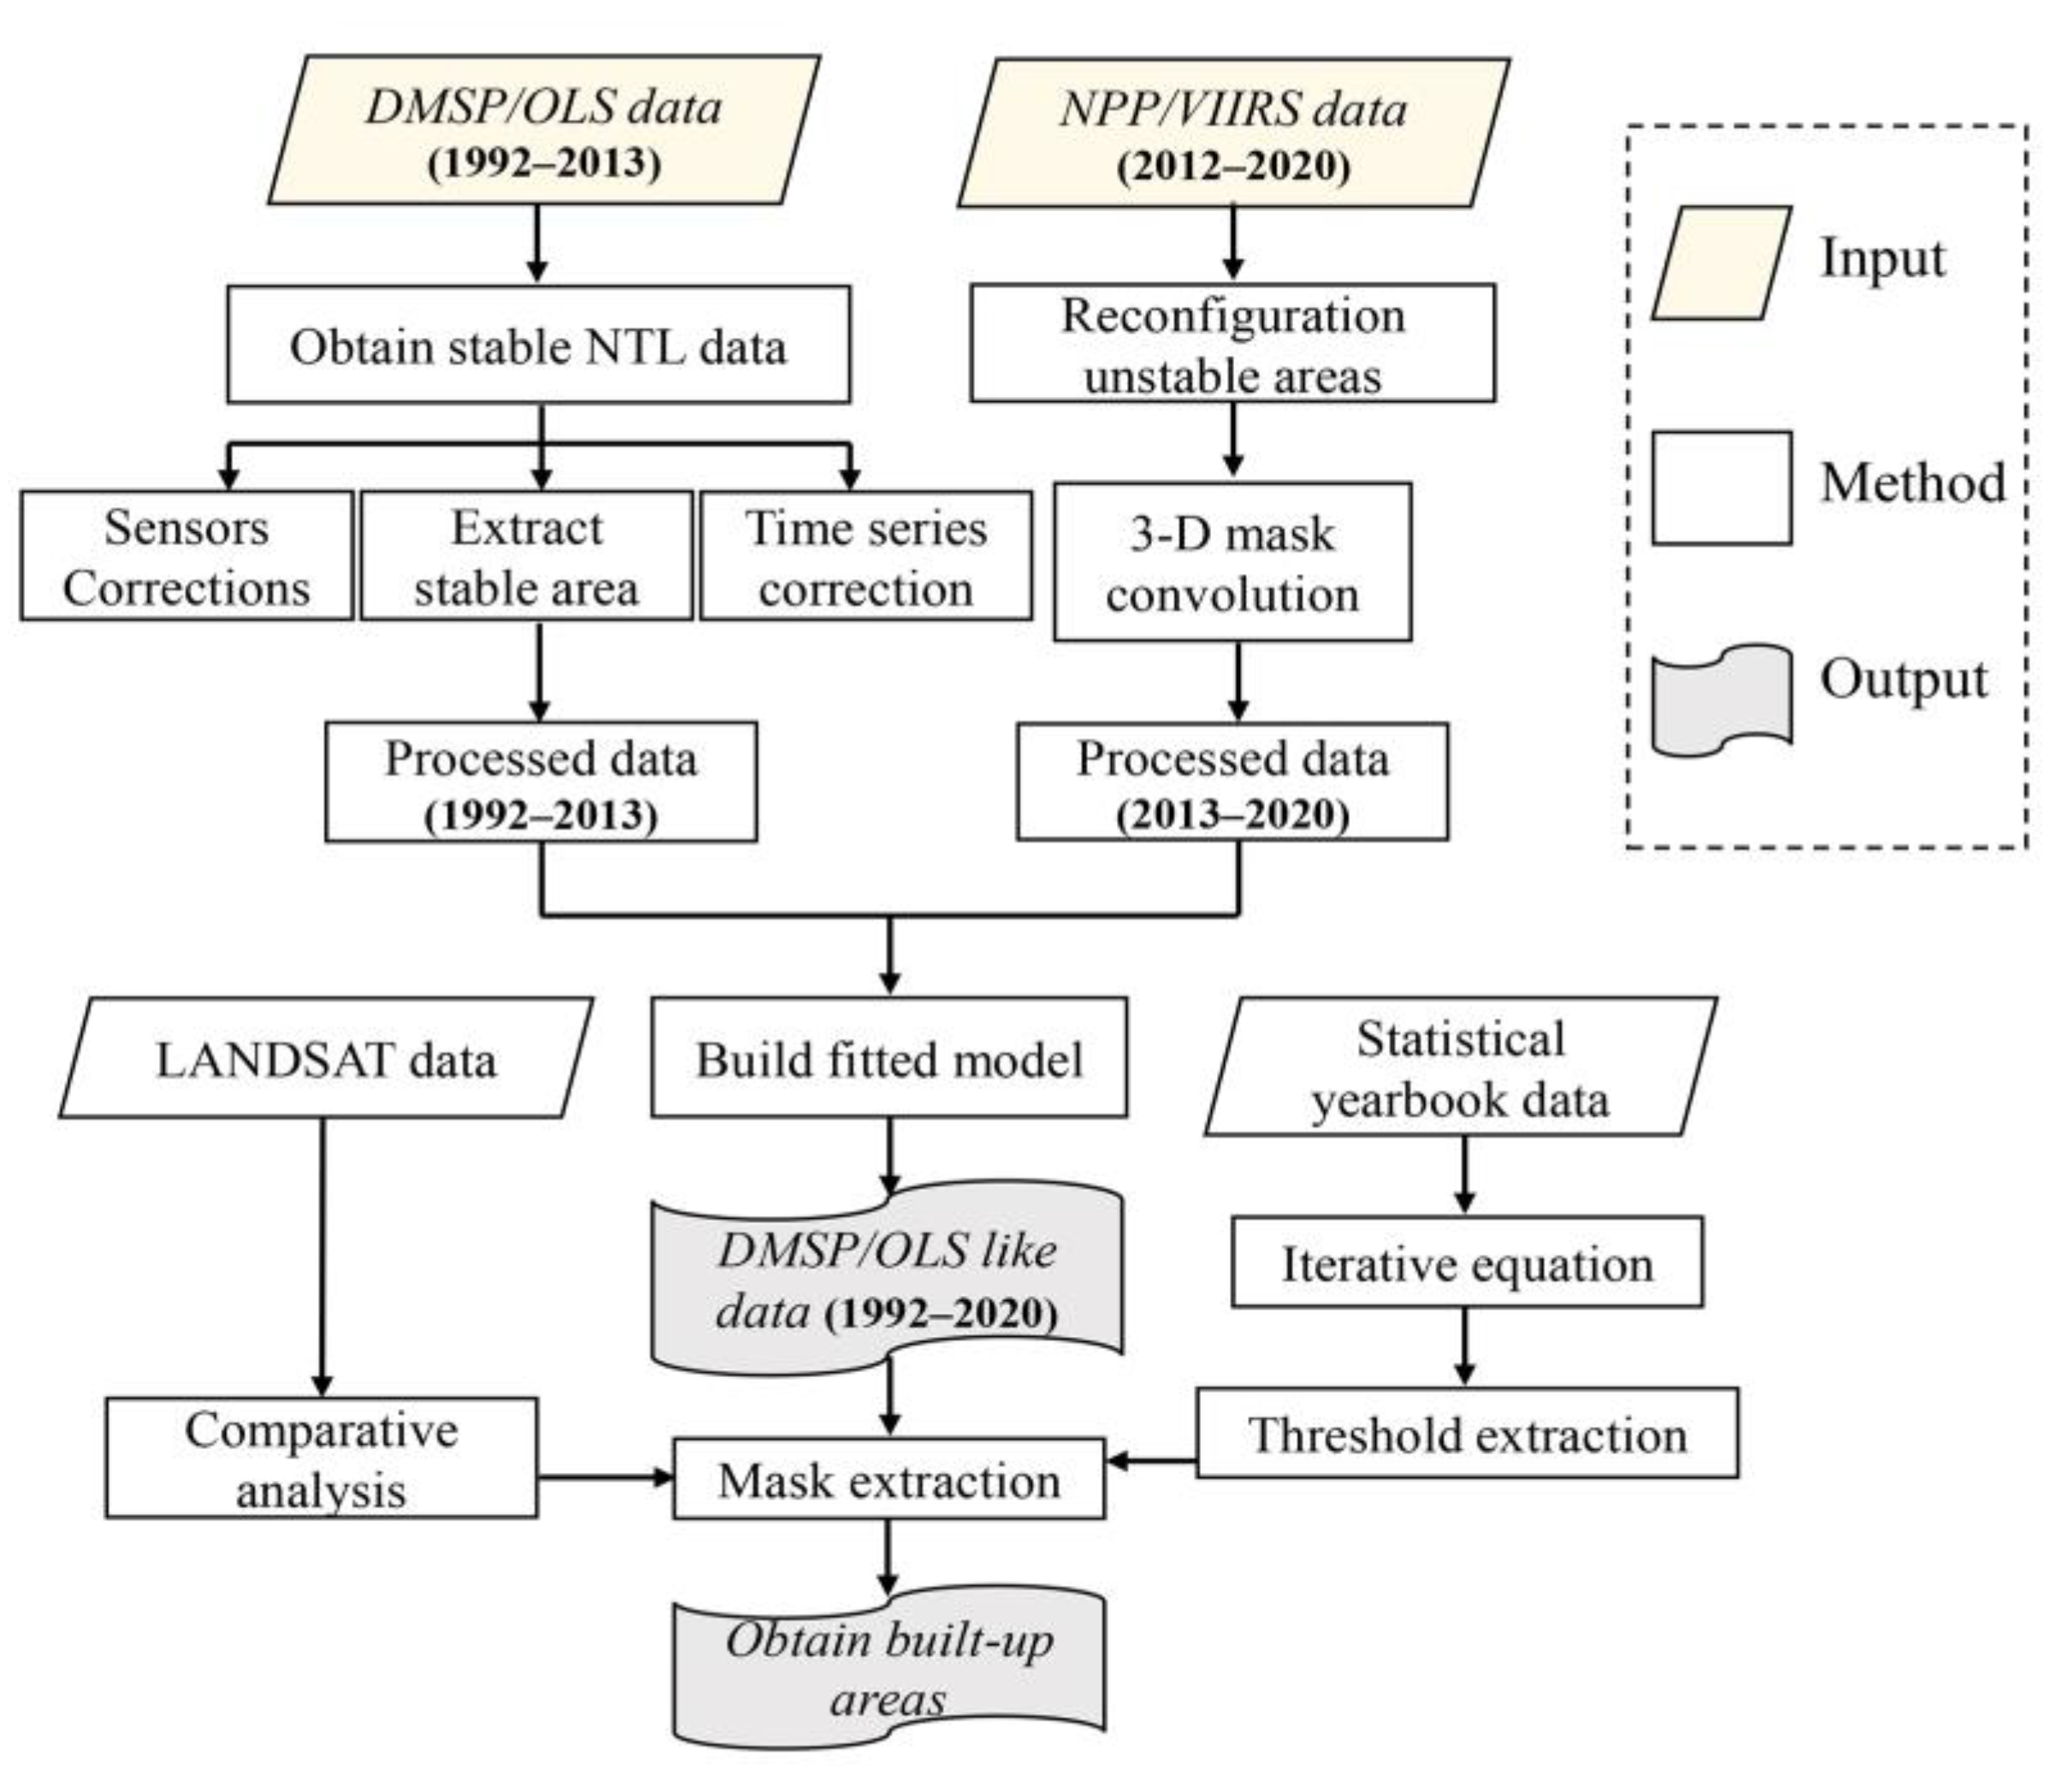
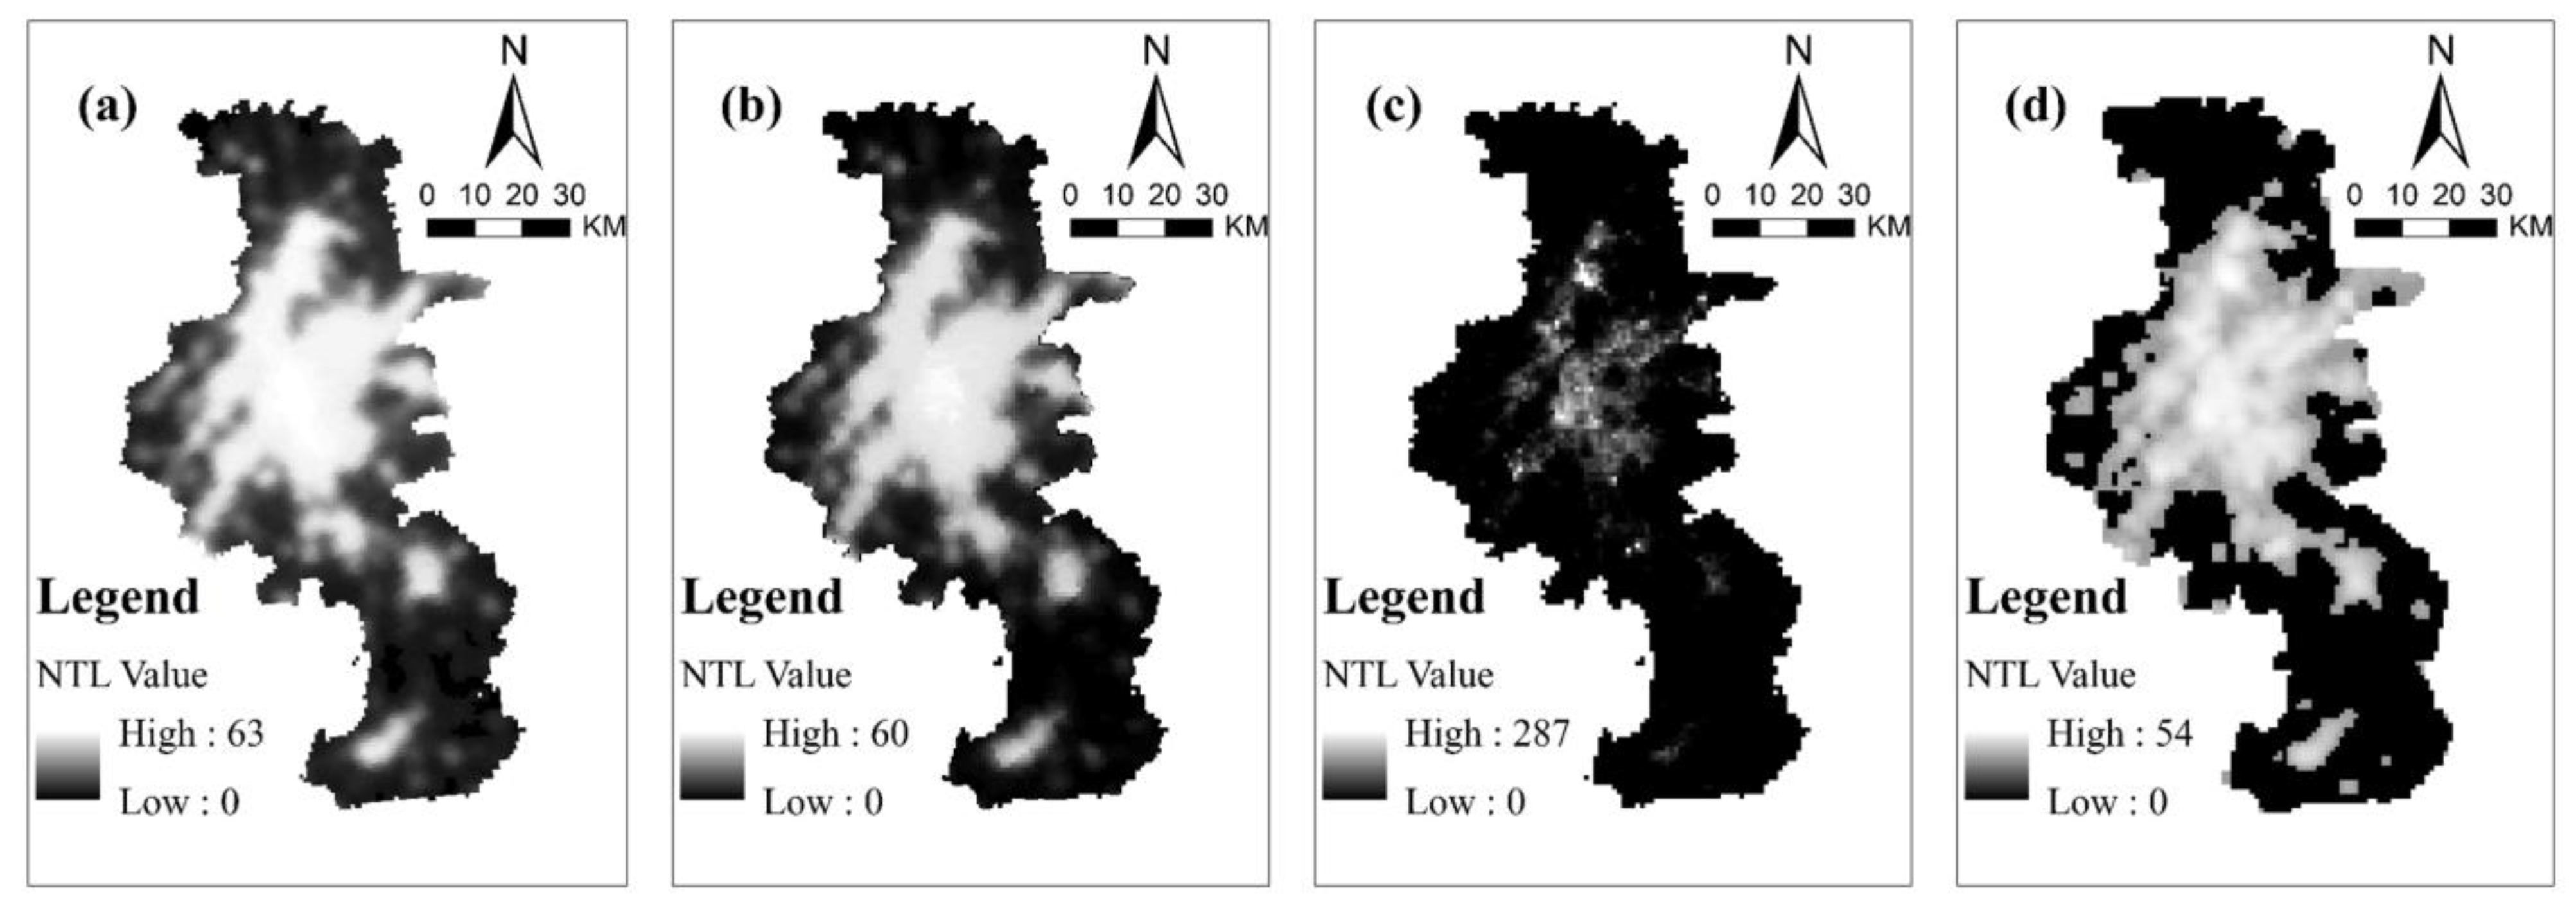
2.2.2. Preprocessing of Nighttime Lights Data
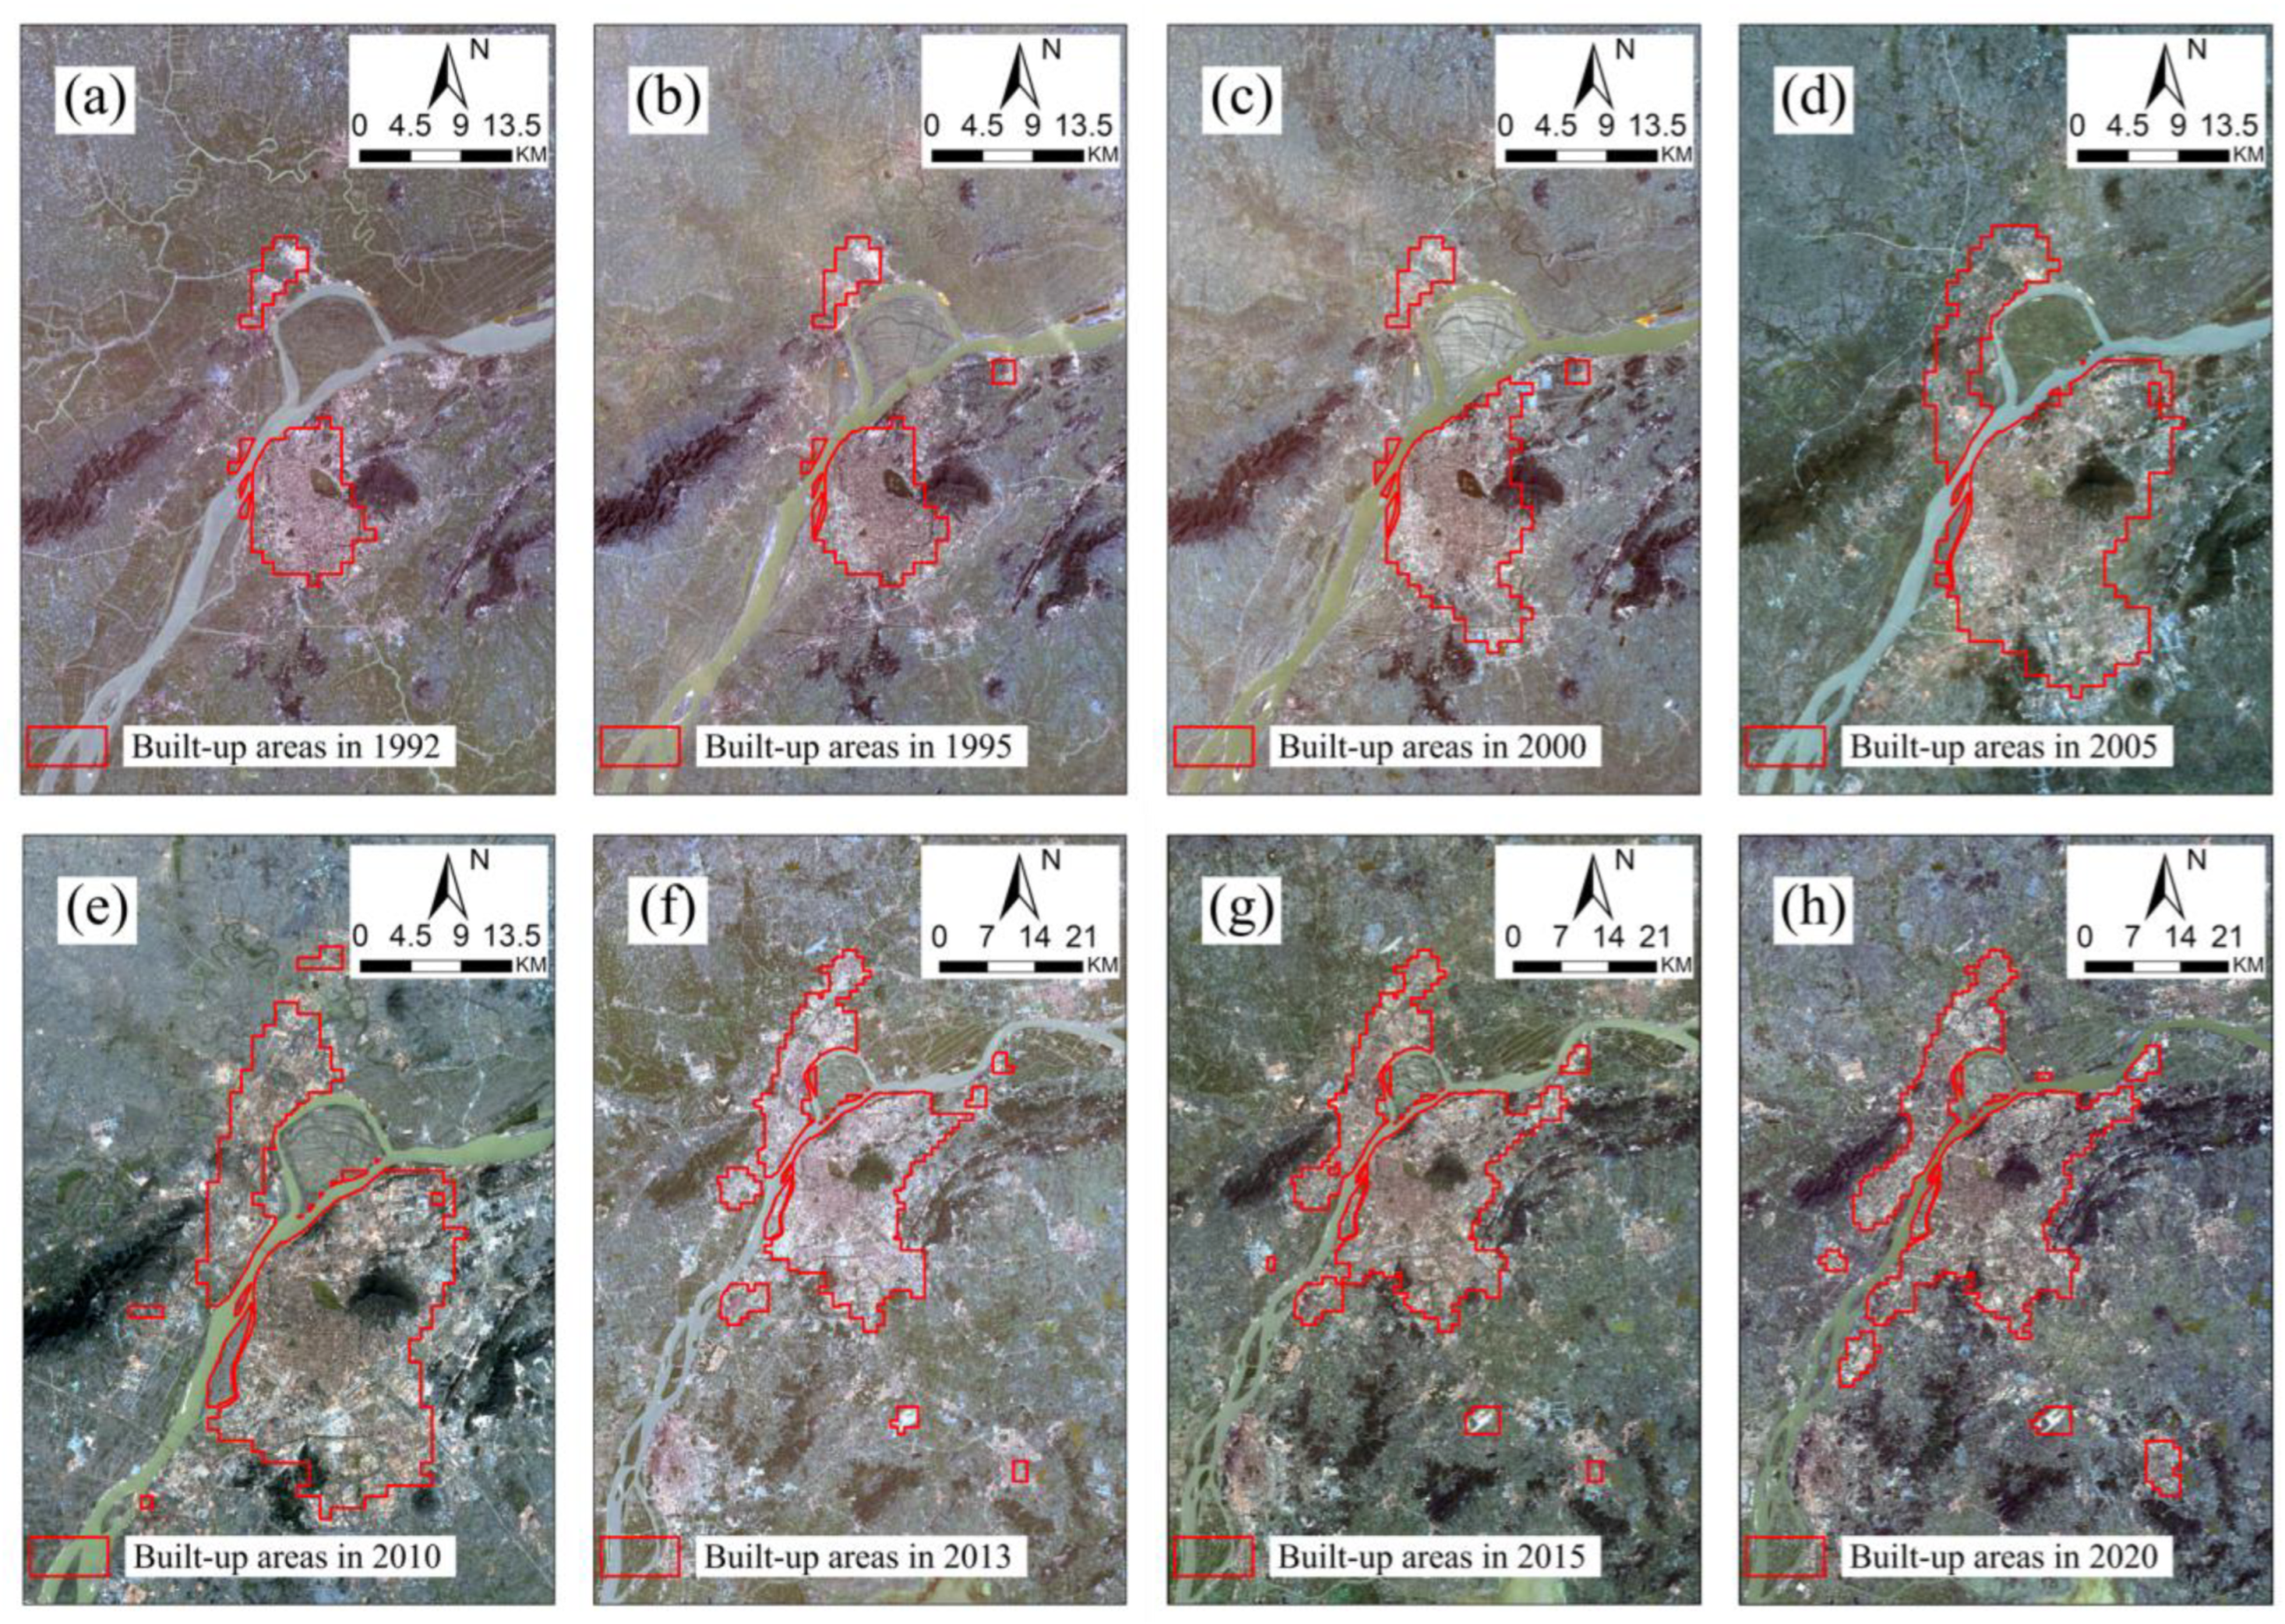
2.2.3. Determination of the Expansion of Built-Up Areas
3. Research Methods
3.1. Urban Areas Expansion Index
3.2. The Change in Gravity Centers and Standard Deviational Ellipse
3.3. The Spearman Correlation Coefficient
3.4. The Entropy Weight Method
3.5. Analysis of Changes in Coordination Degree
3.6. Obstacle Factor Analysis
3.7. Linear Propensity Estimation (Slope)
4. Analysis and Results
4.1. Analysis of the Expansion of Built-Up Areas
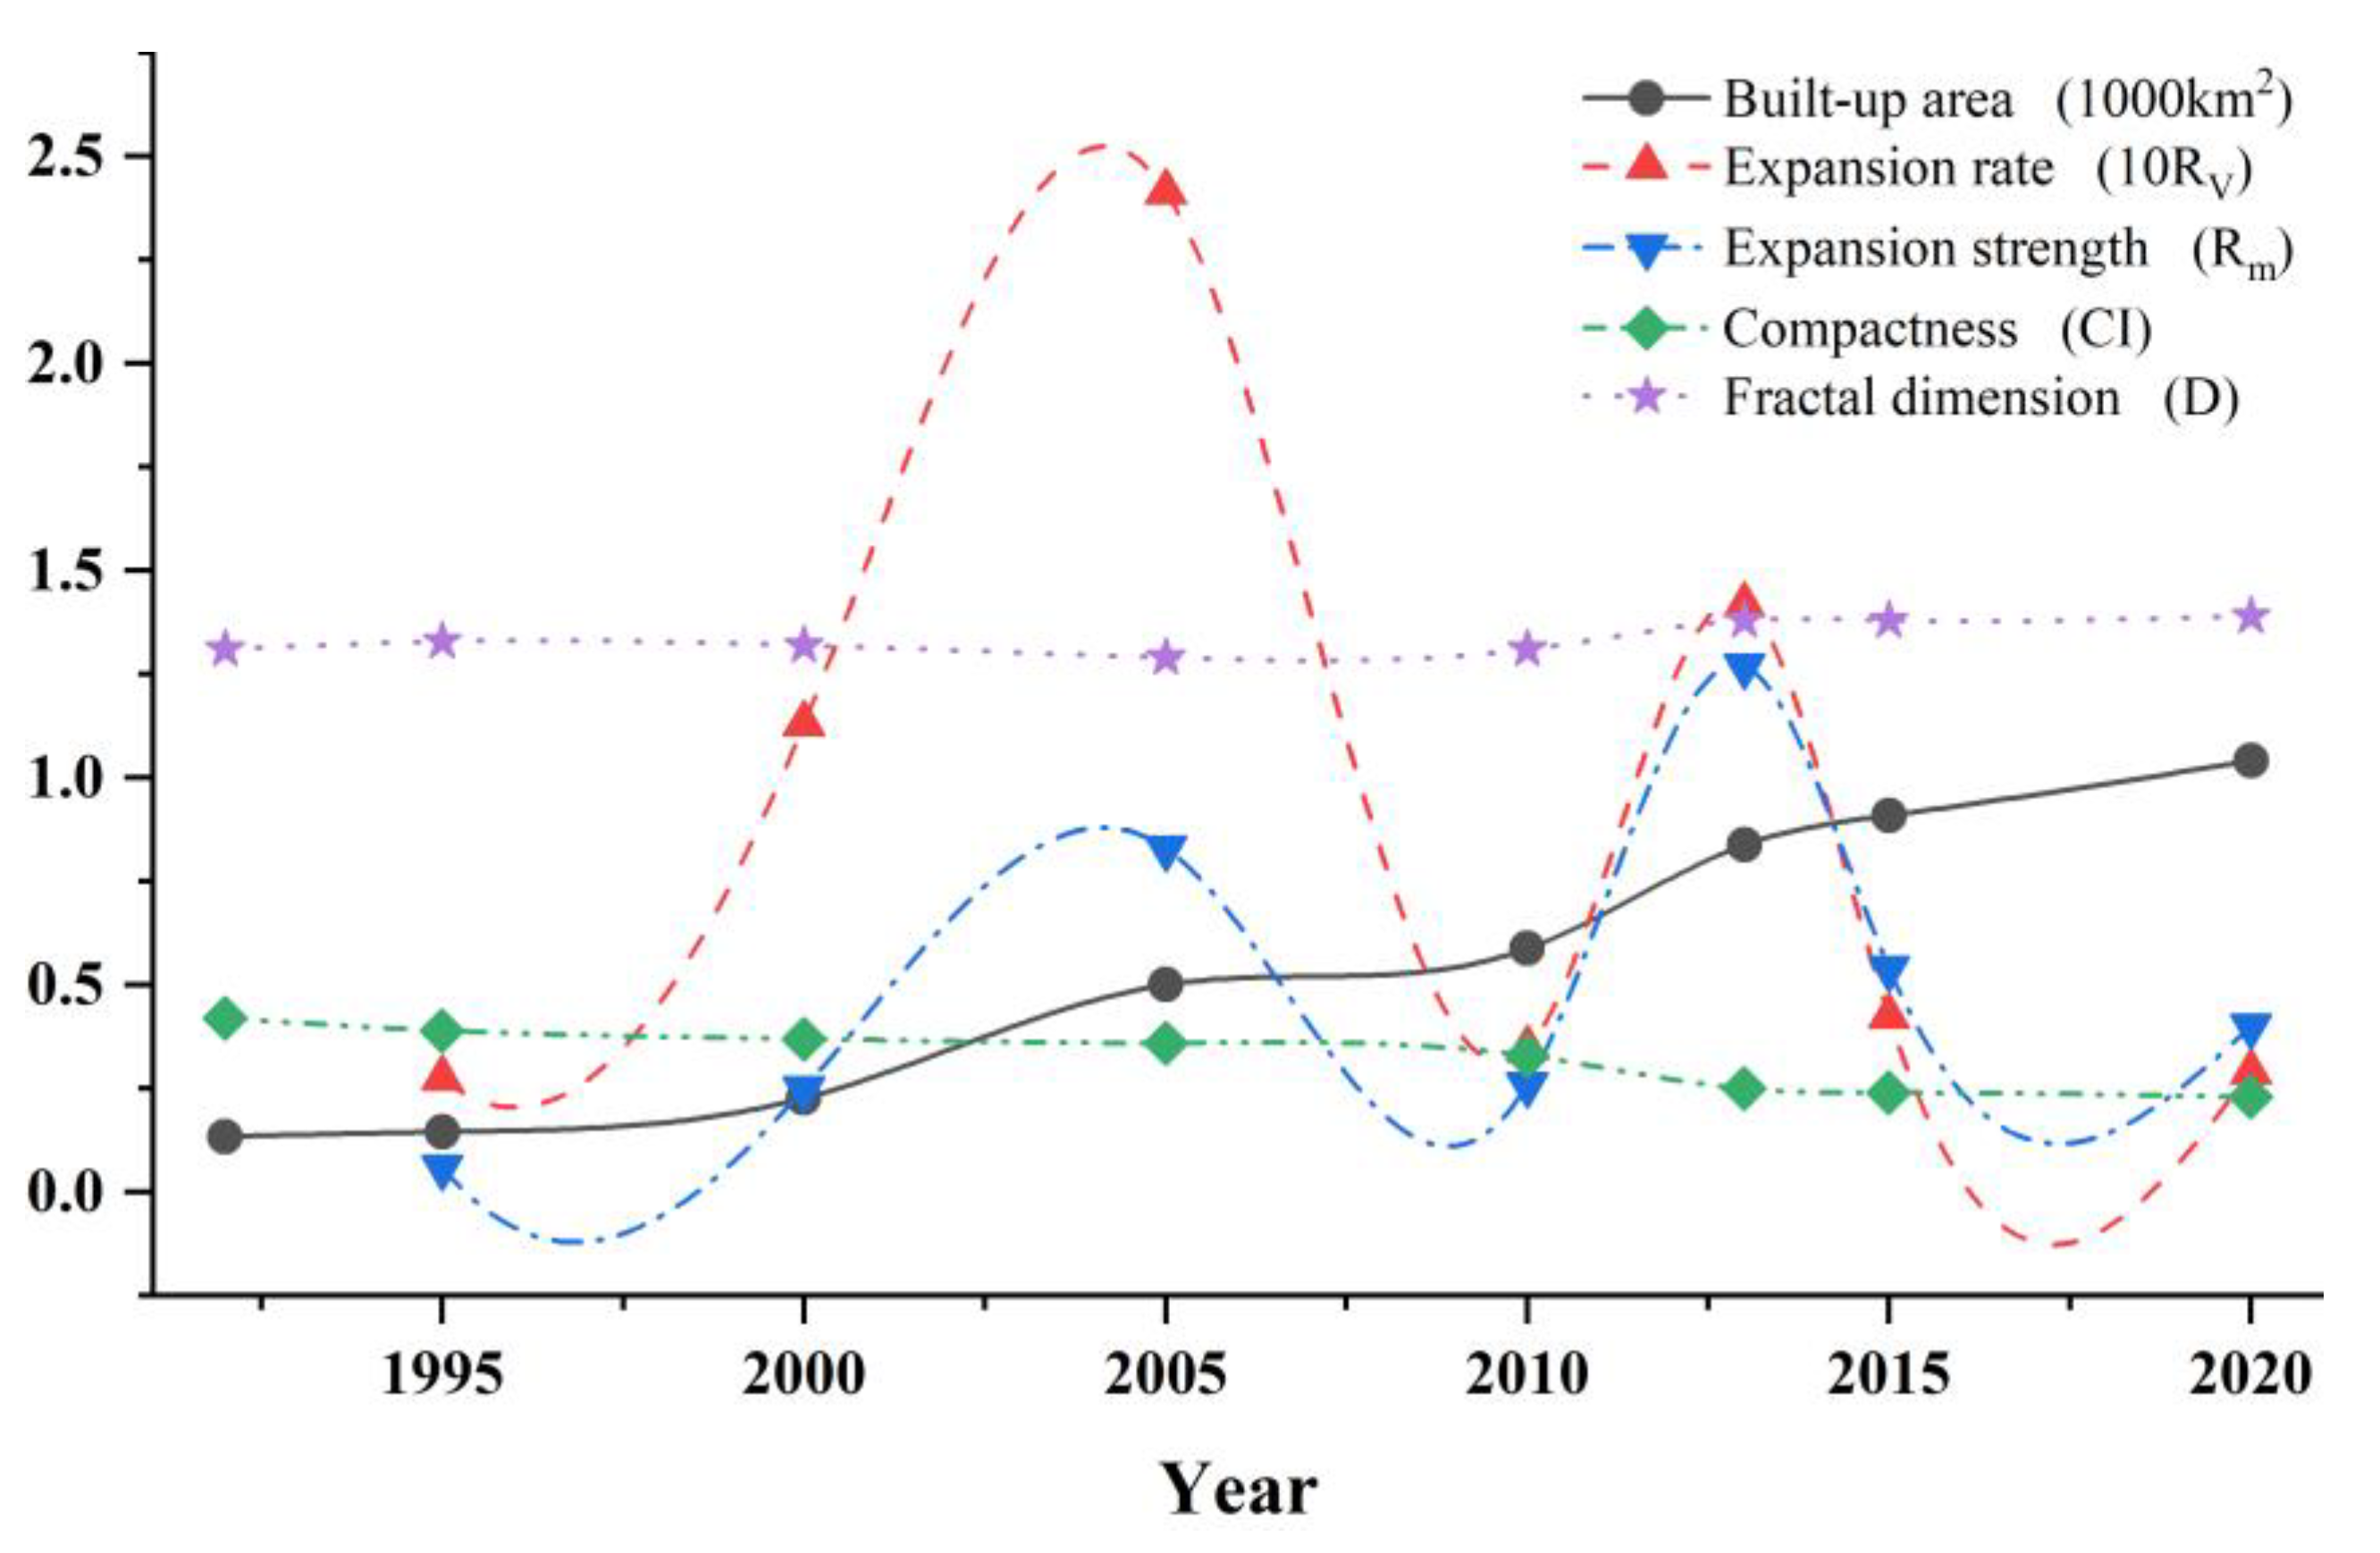
4.1.1. Evaluation Index of the Expansion of Built-Up Areas
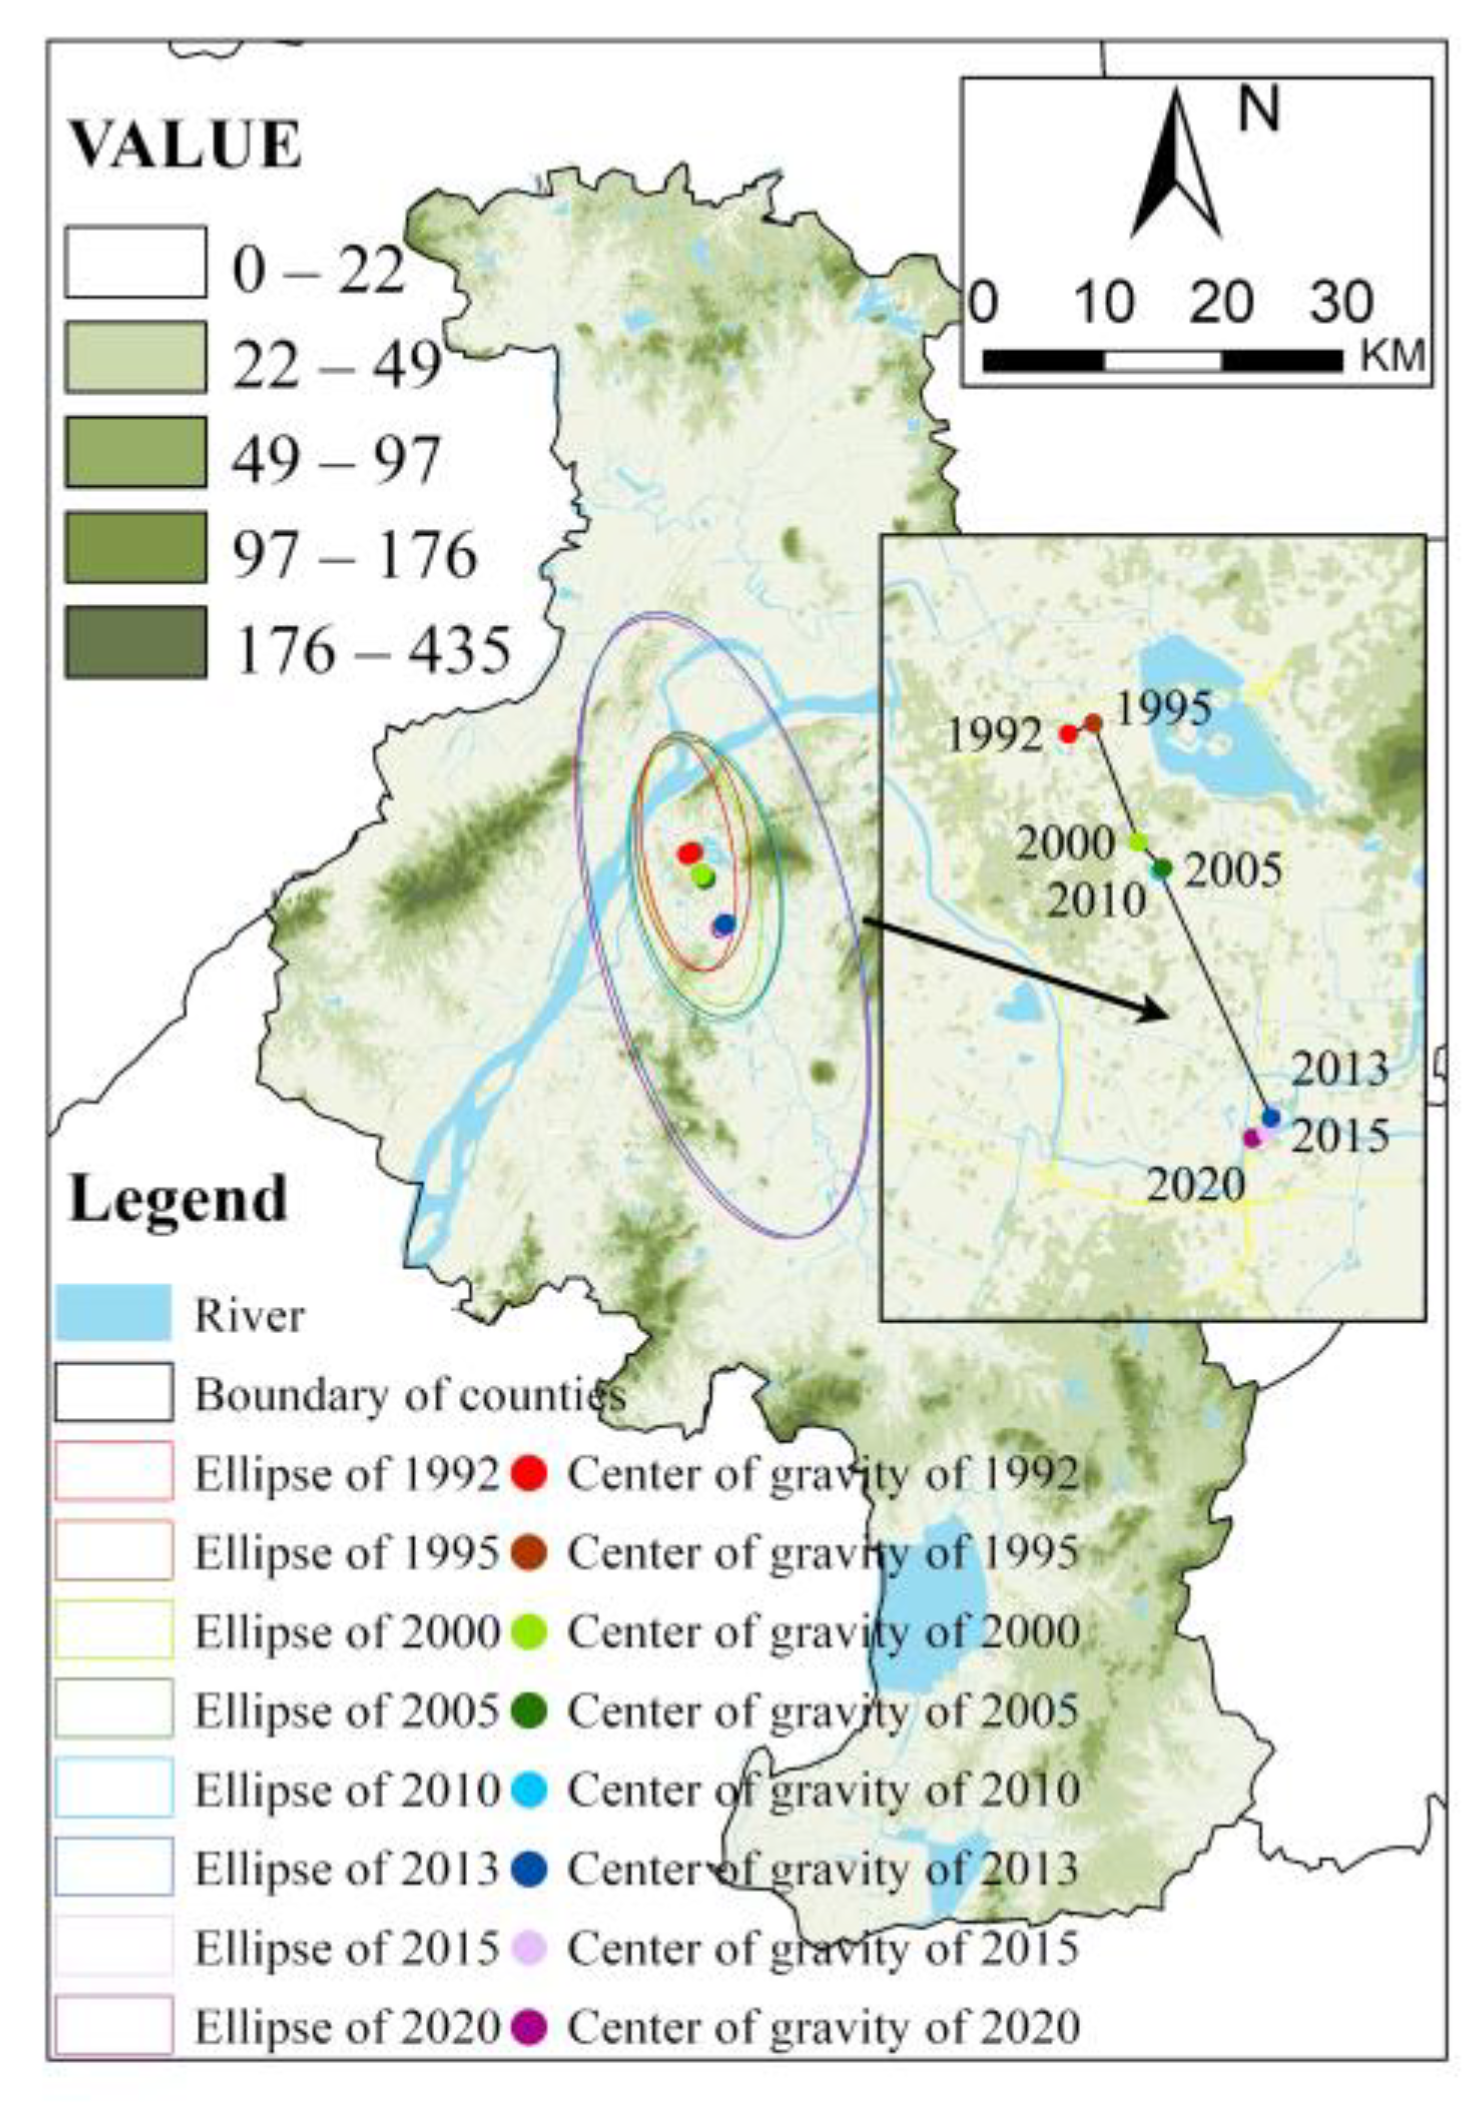
4.1.2. Analysis of Spatiotemporal Changes in Built-Up Areas
4.2. Analysis of the Expansion of Built-Up Areas vs. Environmental Parameters
4.2.1. Weight Analysis
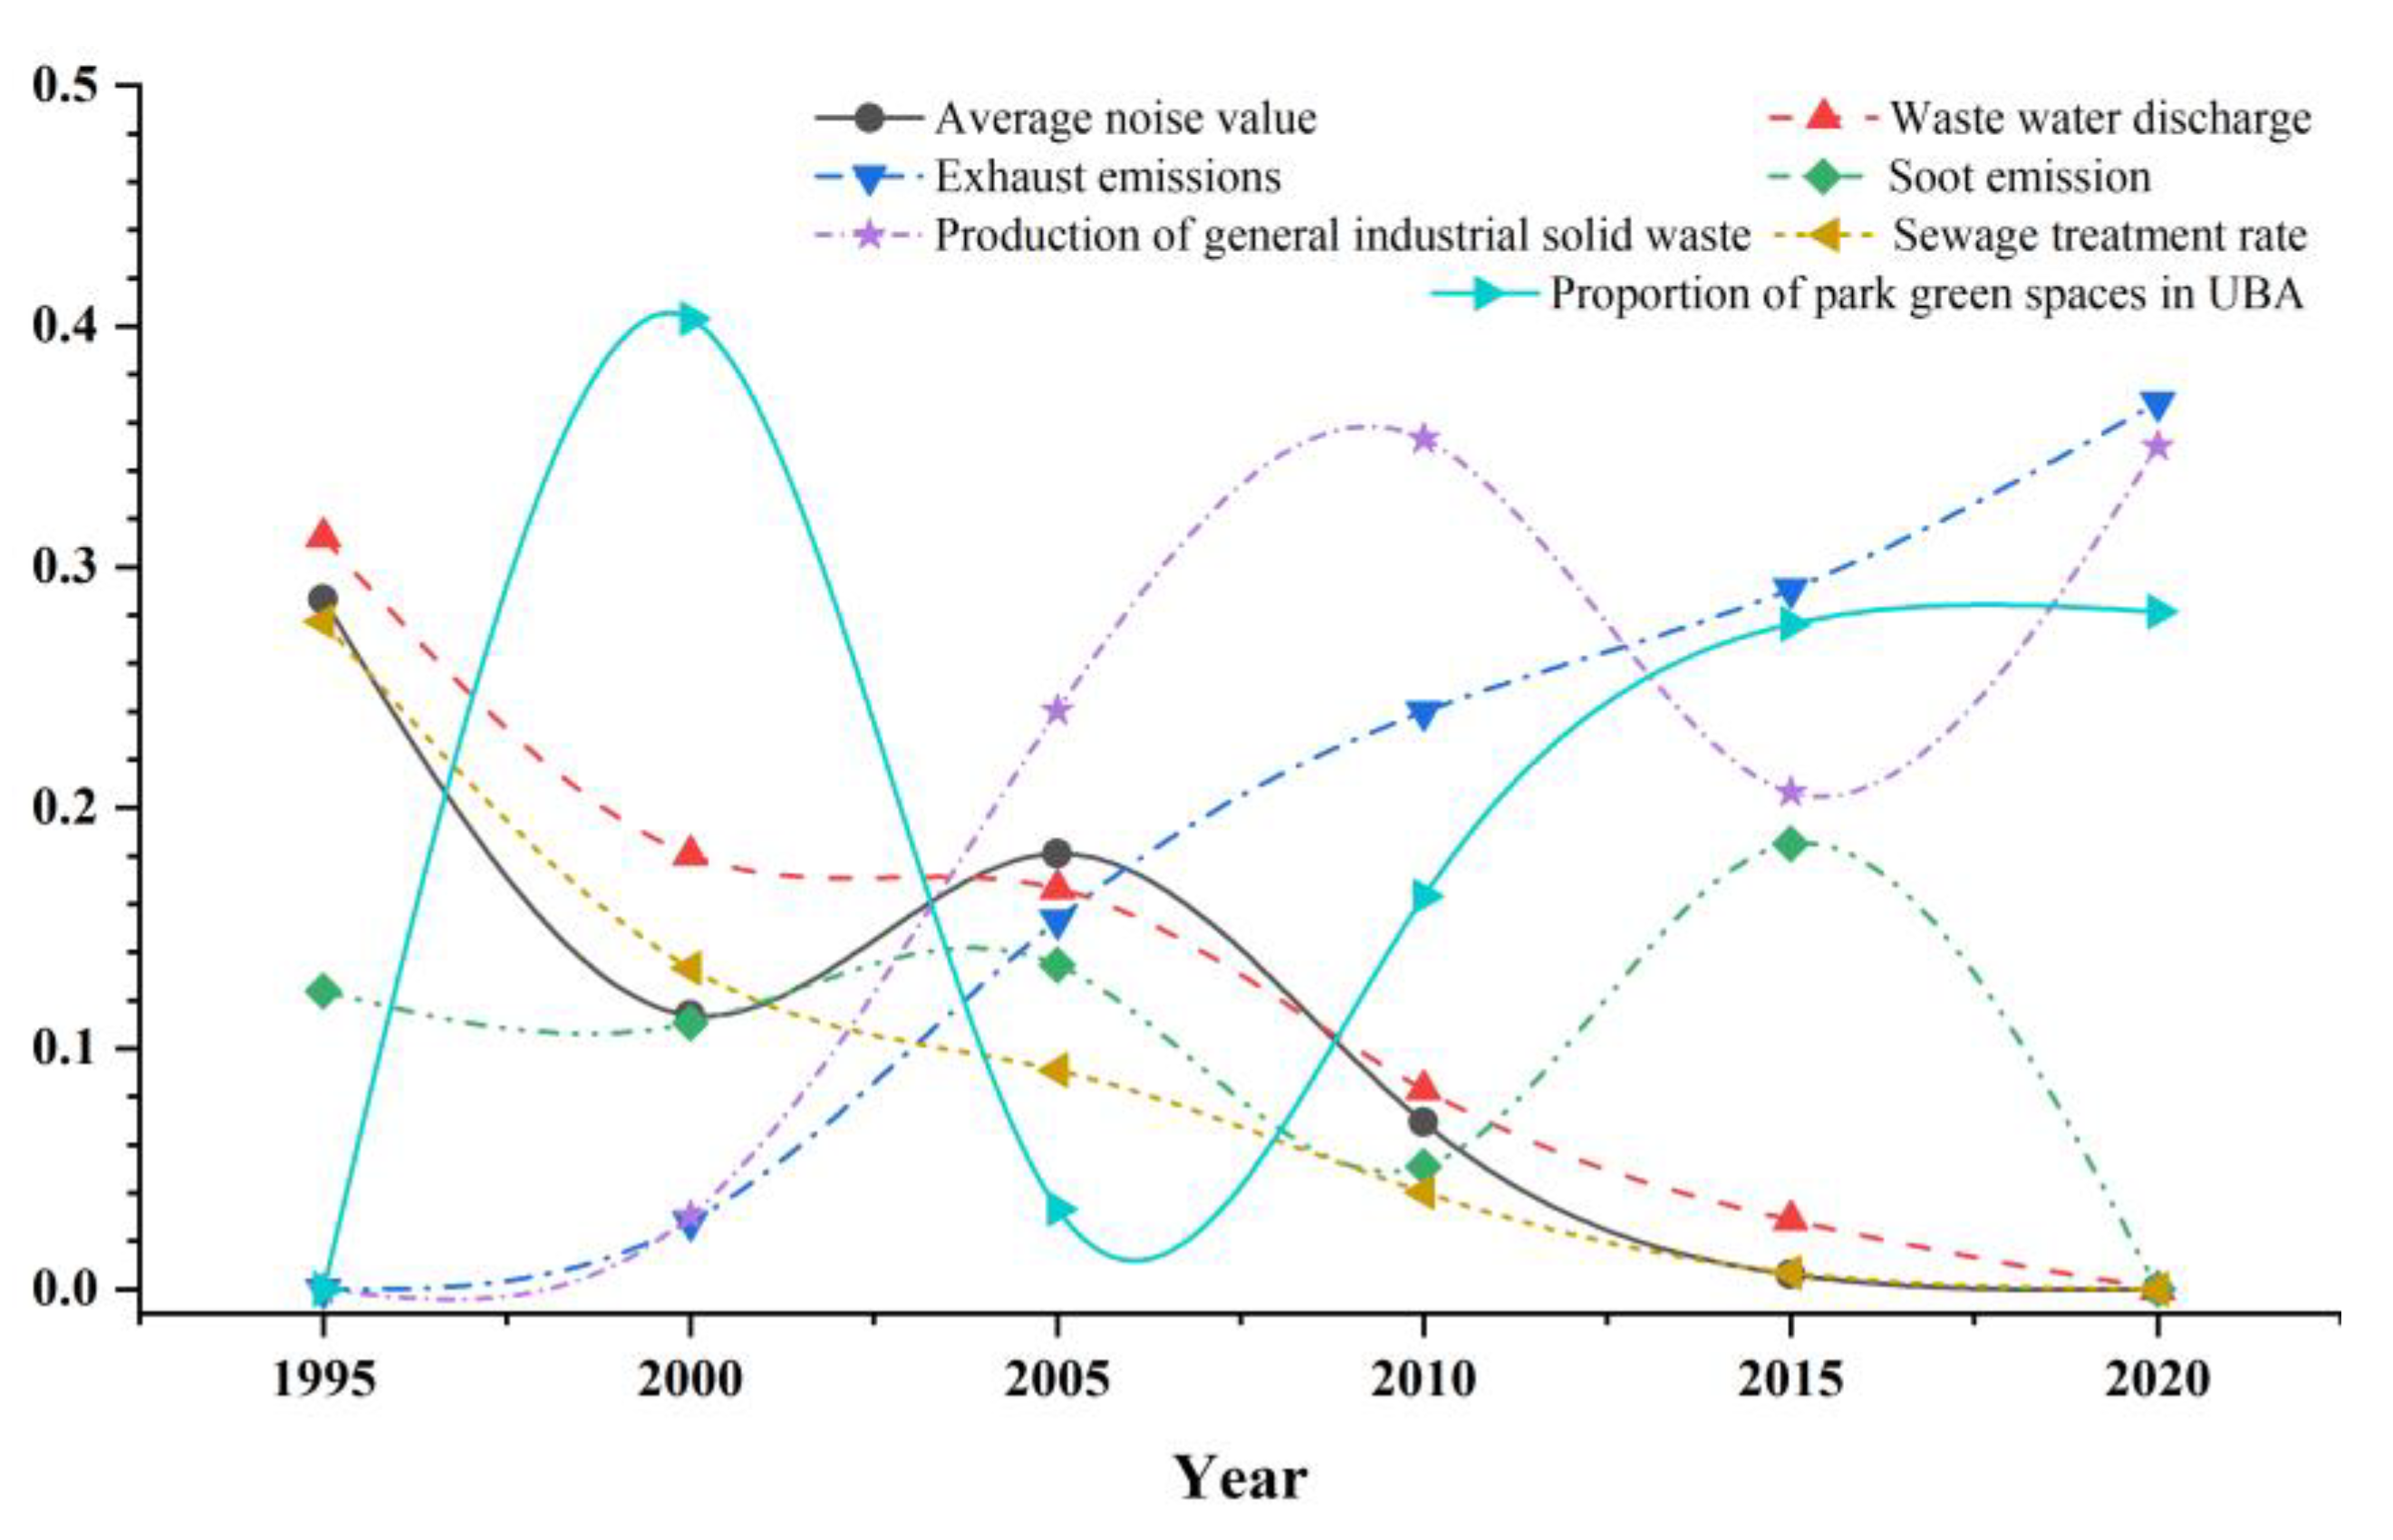
4.2.2. Trend Analysis
4.2.3. Impact Factor Analysis
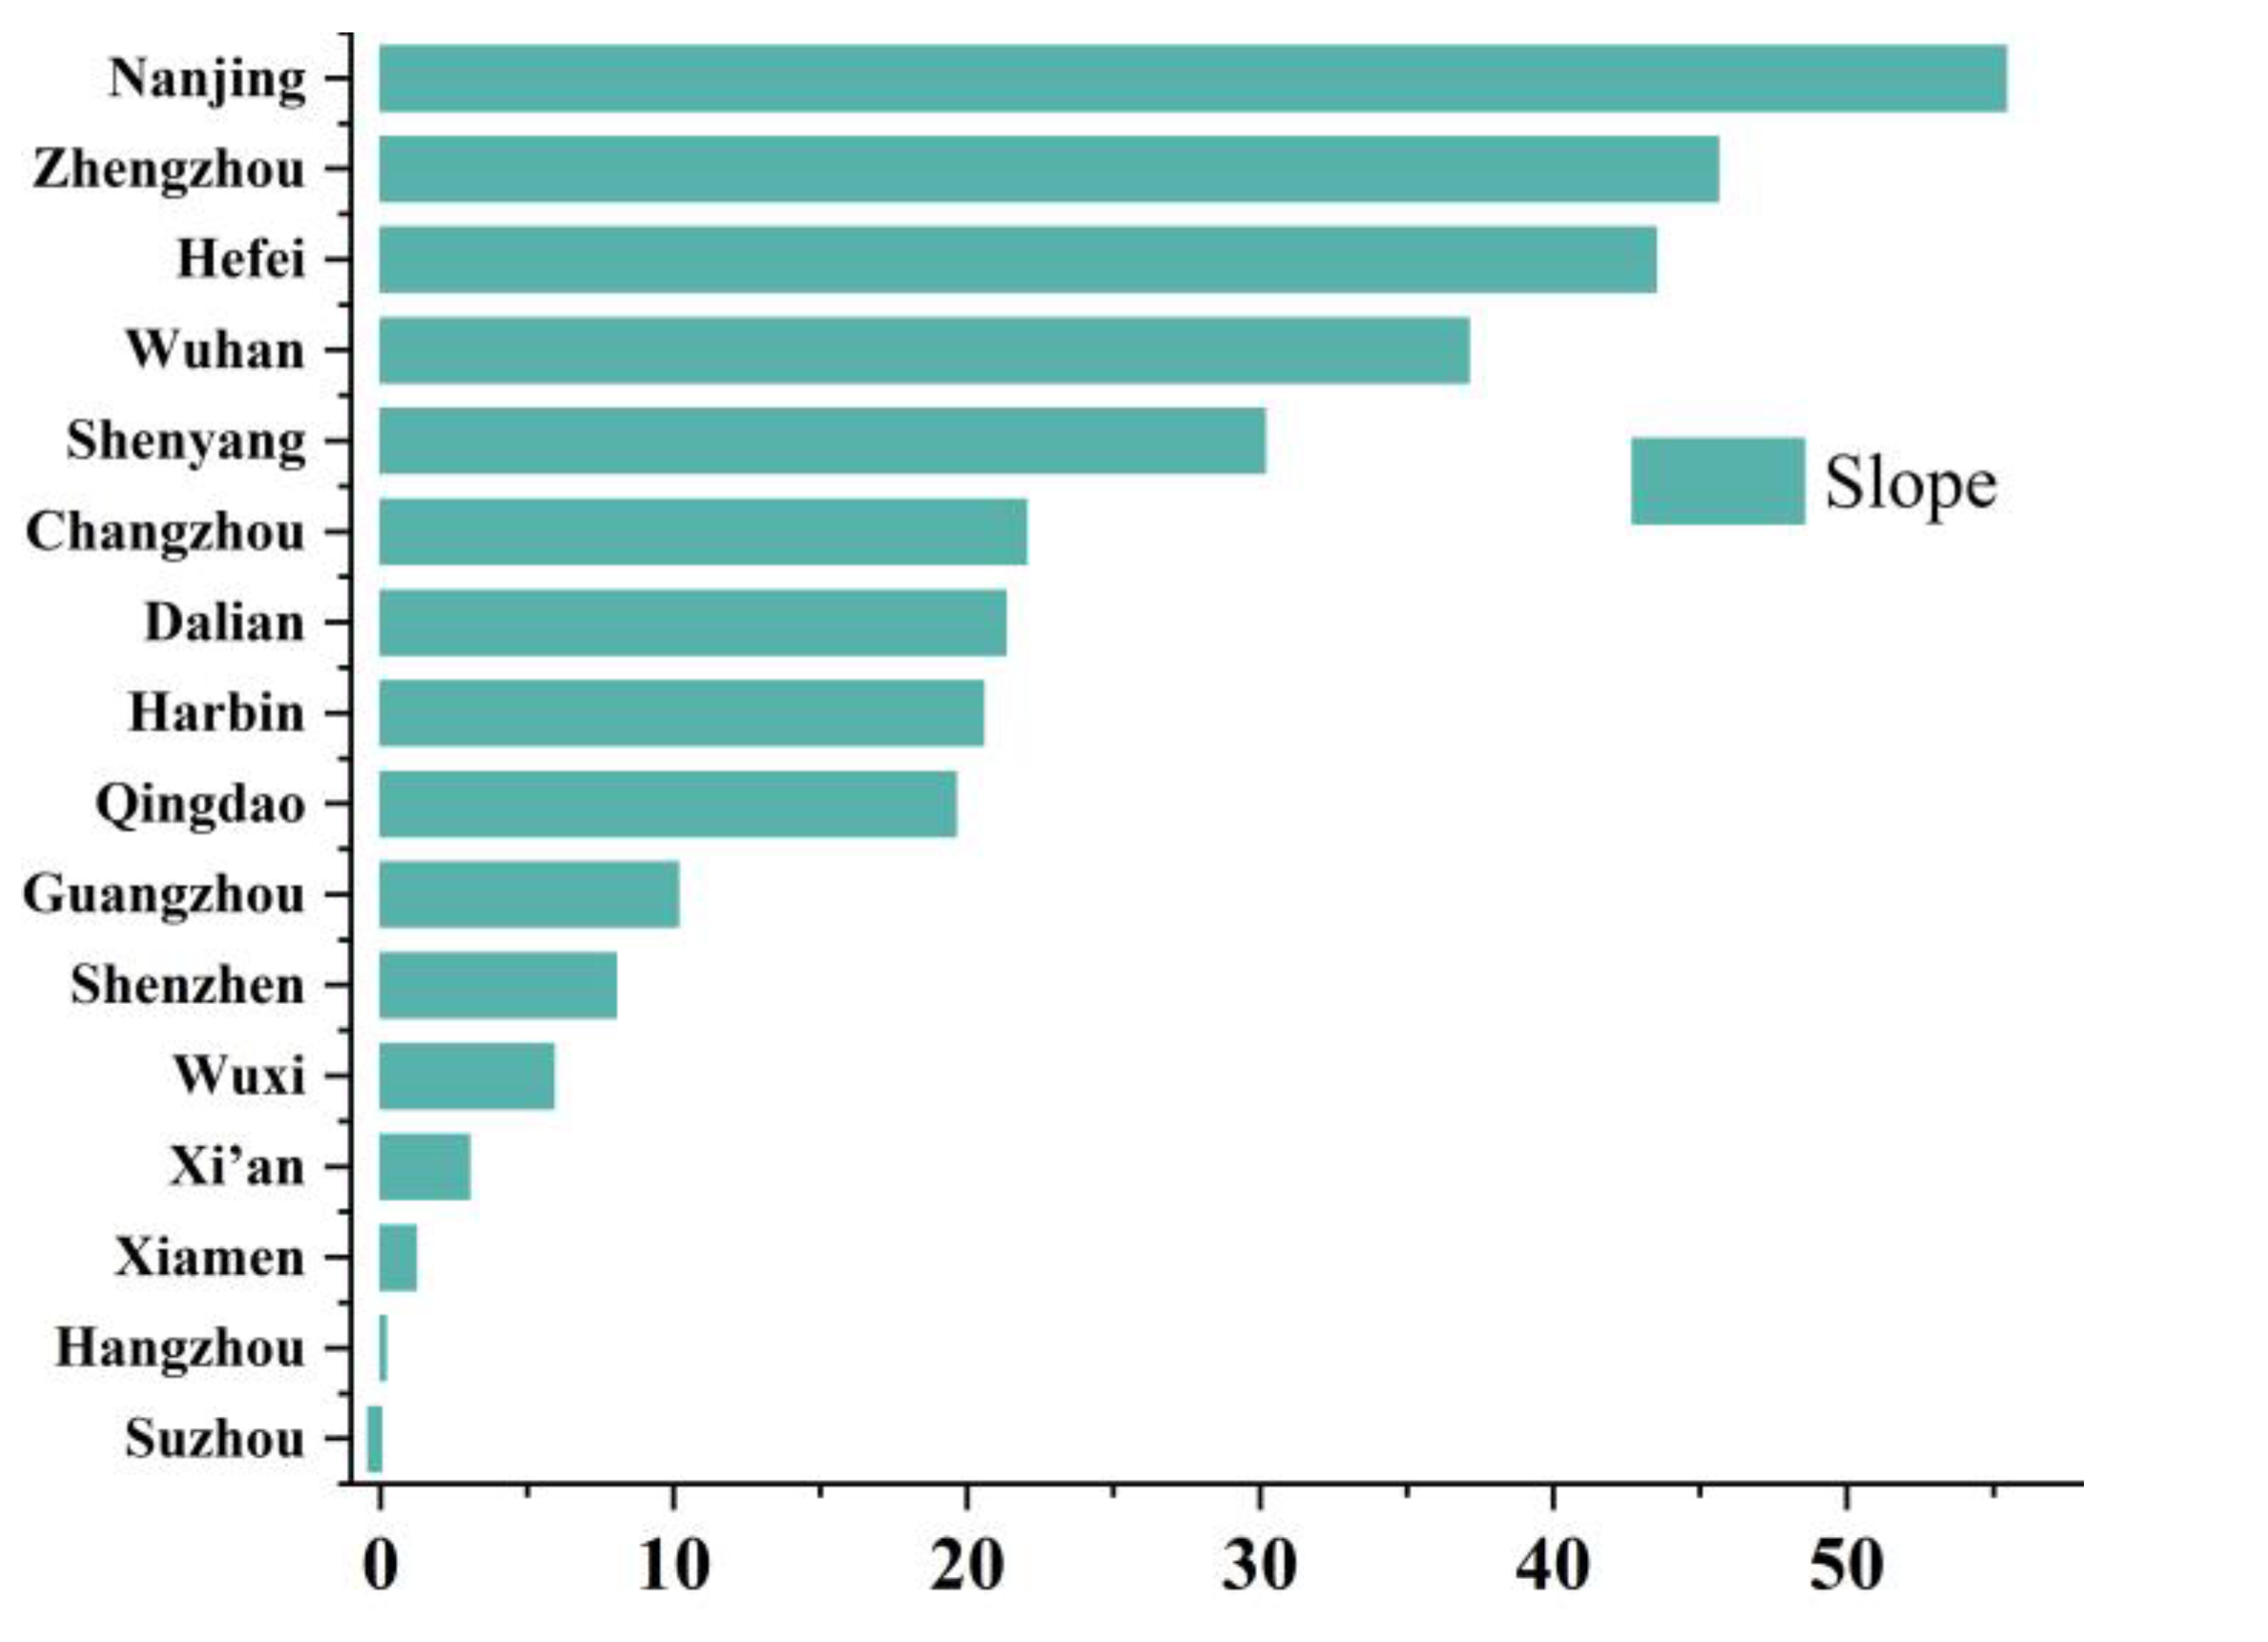
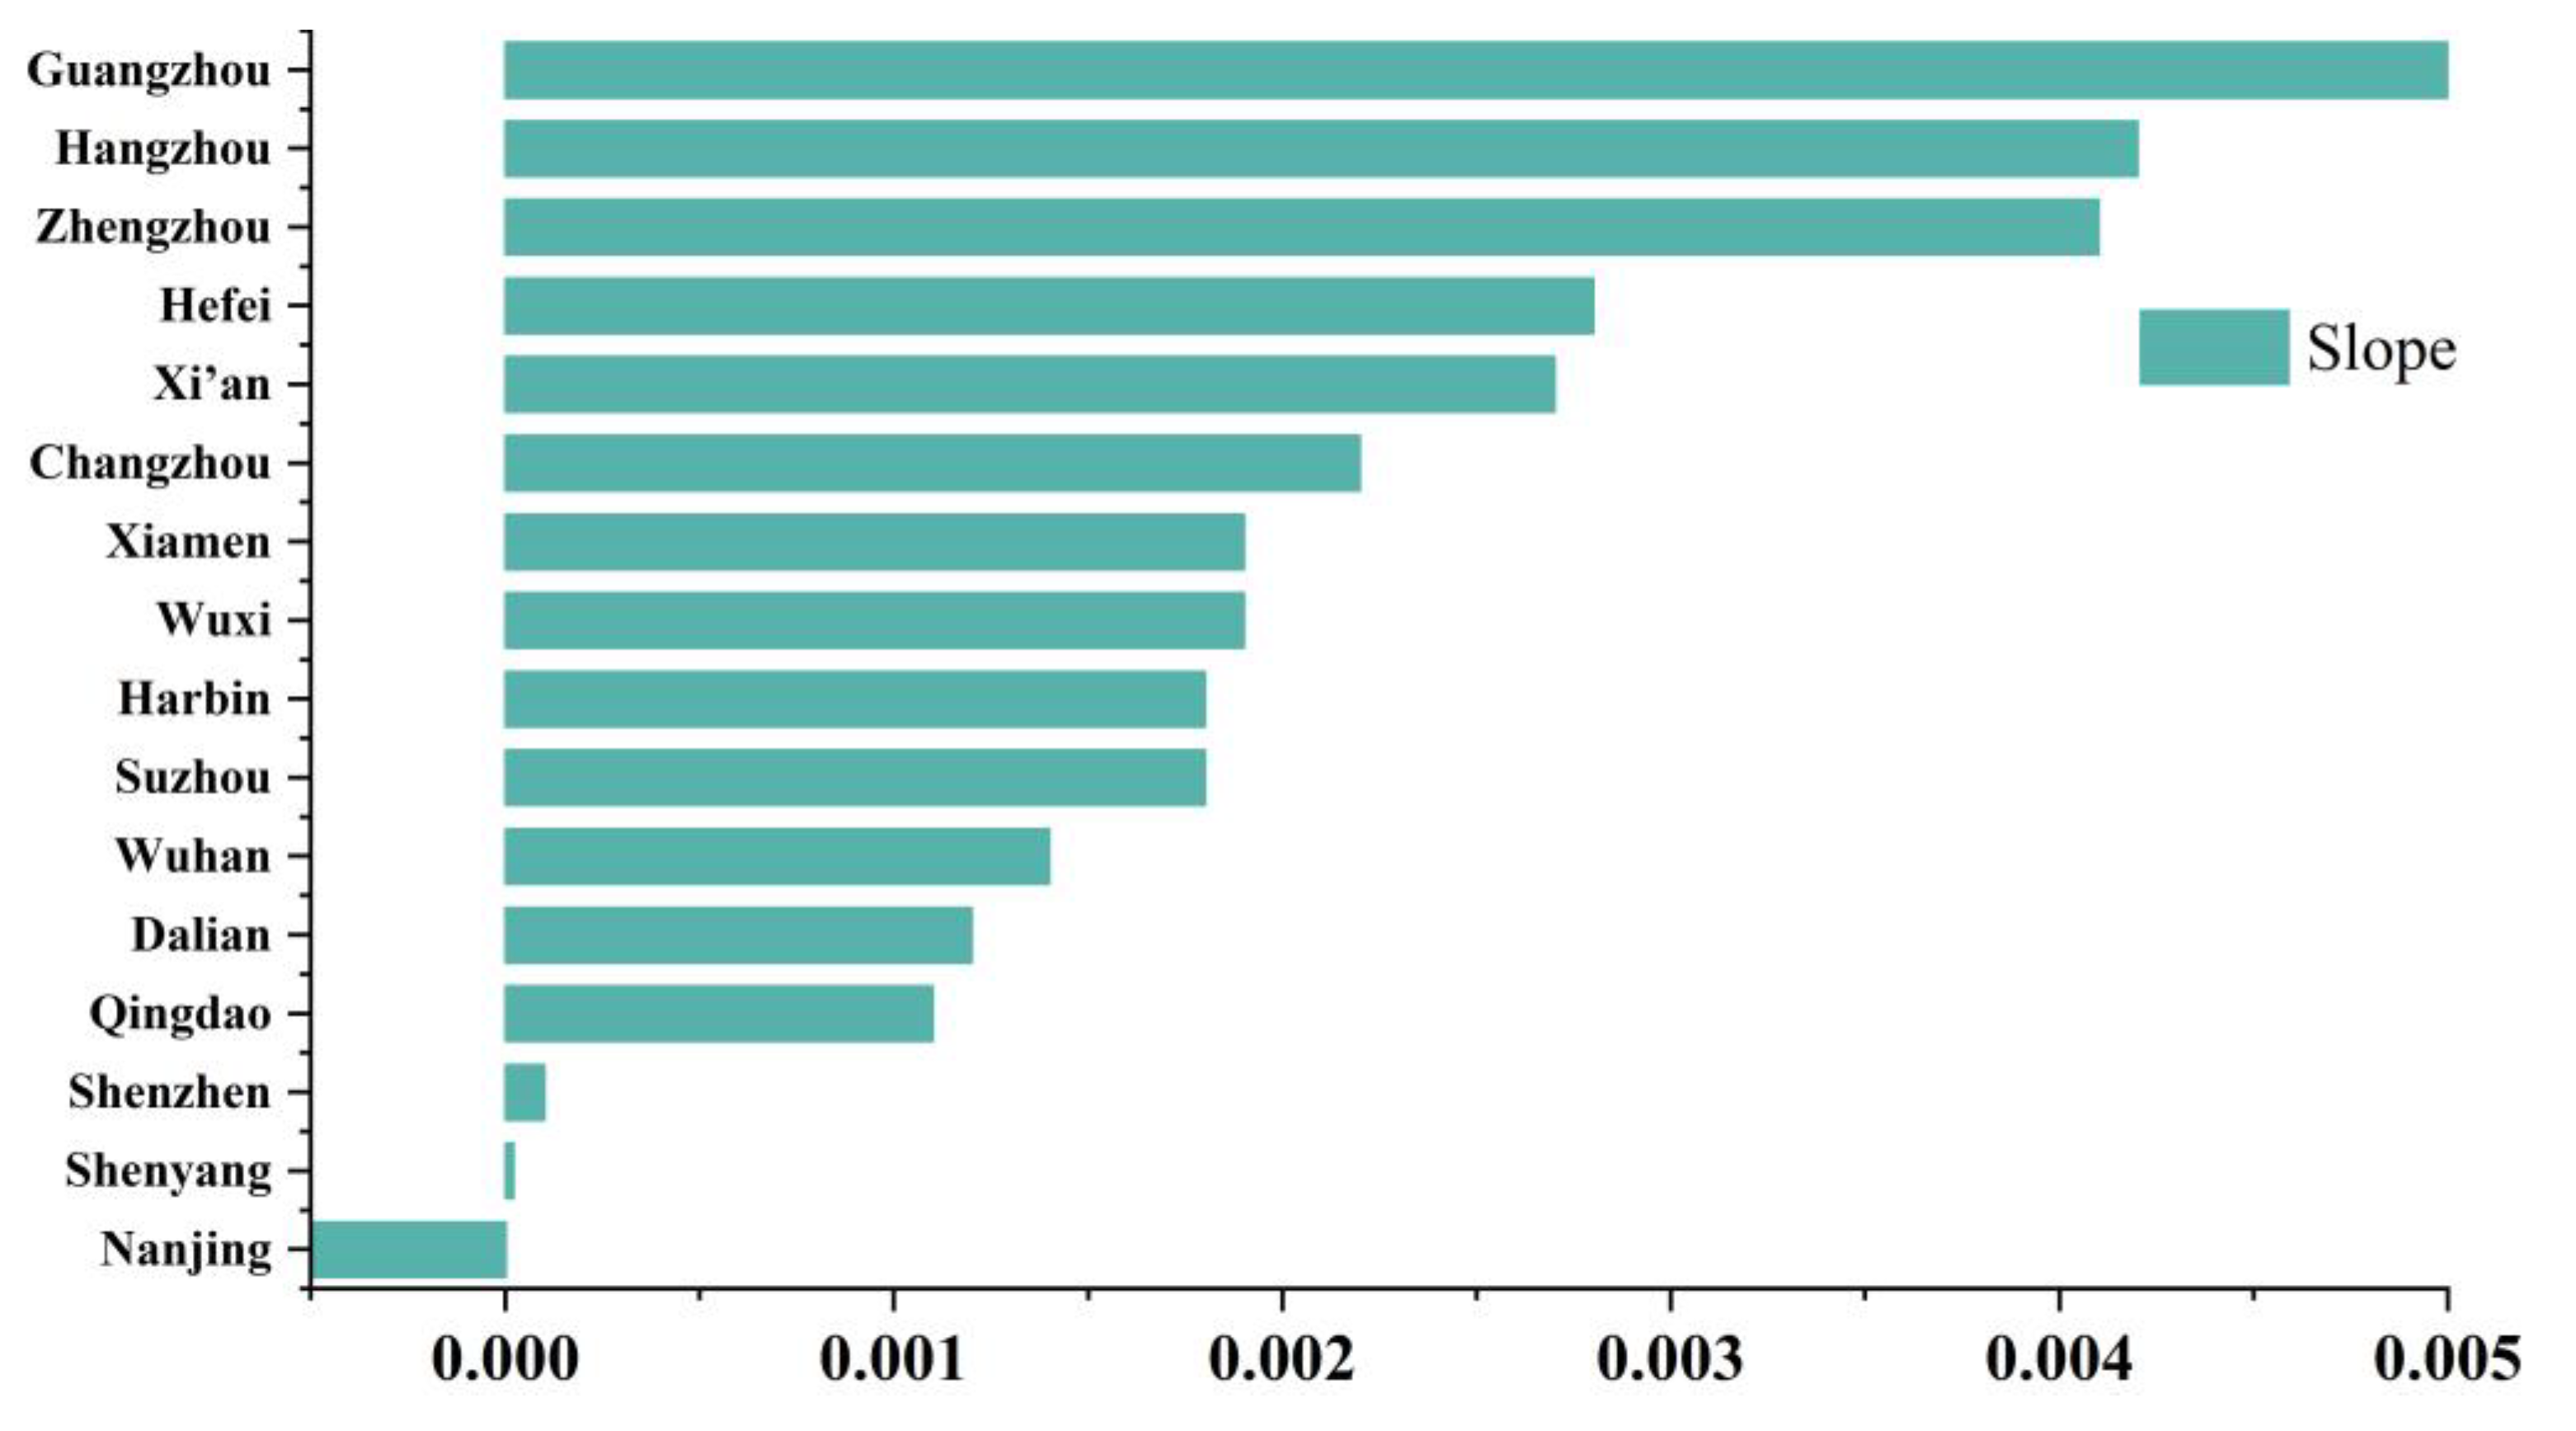
4.2.4. Comparative Analysis of Cities
5. Conclusions
Author Contributions
Funding
Data Availability Statement
Acknowledgments
Conflicts of Interest
References
- Lin, X.; Lu, C.; Song, K.; Su, Y.; Lei, Y.; Zhong, L.; Gao, Y. Analysis of Coupling Coordination Variance between Urbanization Quality and Eco-Environment Pressure: A Case Study of the West Taiwan Strait Urban Agglomeration, China. Sustainability 2020, 12, 2643. [Google Scholar] [CrossRef]
- Hong, W.; Bao, G.; Du, Y.; Guo, Y.; Wang, C.; Wang, G.; Ren, Z. Spatiotemporal Changes in Supply–Demand Patterns of Carbon Sequestration Services in an Urban Agglomeration under China’s Rapid Urbanization. Remote Sens. 2023, 15, 811. [Google Scholar] [CrossRef]
- Lu, C.; Li, L.; Lei, Y.; Ren, C.; Su, Y.; Huang, Y.; Chen, Y.; Lei, S.; Fu, W. Coupling Coordination Relationship between Urban Sprawl and Urbanization Quality in the West Taiwan Strait Urban Agglomeration, China: Observation and Analysis from DMSP/OLS Nighttime Light Imagery and Panel Data. Remote Sens. 2020, 12, 3217. [Google Scholar] [CrossRef]
- Yang, C.; Yu, B.; Chen, Z.; Song, W.; Zhou, Y.; Li, X.; Wu, J. A Spatial-Socioeconomic Urban Development Status Curve from NPP-VIIRS Nighttime Light Data. Remote Sens. 2019, 11, 2398. [Google Scholar] [CrossRef]
- Wang, J.; Chen, J.; Liu, X.; Wang, W.; Min, S. Exploring the Spatial and Temporal Characteristics of China’s Four Major Urban Agglomerations in the Luminous Remote Sensing Perspective. Remote Sens. 2023, 15, 2546. [Google Scholar] [CrossRef]
- Zhao, Z.; Tang, X.; Wang, C.; Cheng, G.; Ma, C.; Wang, H.; Sun, B. Analysis of the Spatial and Temporal Evolution of the GDP in Henan Province Based on Nighttime Light Data. Remote Sens. 2023, 15, 716. [Google Scholar] [CrossRef]
- Zhou, L.; Song, J.; Chi, Y.; Yu, Q. Differential Spatiotemporal Patterns of CO2 Emissions in Eastern China’s Urban Agglomerations from NPP/VIIRS Nighttime Light Data Based on a Neural Network Algorithm. Remote Sens. 2023, 15, 404. [Google Scholar] [CrossRef]
- Zuo, C.; Gong, W.; Gao, Z.; Kong, D.; Wei, R.; Ma, X. Correlation Analysis of CO2 Concentration Based on DMSP-OLS and NPP-VIIRS Integrated Data. Remote Sens. 2022, 14, 4181. [Google Scholar] [CrossRef]
- Xia, S.; Shao, H.; Wang, H.; Xian, W.; Shao, Q.; Yin, Z.; Qi, J. Spatio-Temporal Dynamics and Driving Forces of Multi-Scale CO2 Emissions by Integrating DMSP-OLS and NPP-VIIRS Data: A Case Study in Beijing-Tianjin-Hebei, China. Remote Sens. 2022, 14, 4799. [Google Scholar] [CrossRef]
- Zhou, G. Urban High-Resolution Remote Sensing: Algorithms and Modeling; CRC Press: Boca Raton, FL, USA, 2020. [Google Scholar]
- Zhou, G.; Tan, Z.; Cen, M.; Li, C. Customizing Visualization in Three-Dimensional Urban GIS via Web-Based Interaction. J. Urban Plan. Dev. 2006, 132, 97–103. [Google Scholar] [CrossRef]
- Elvidge, C.D.; Ziskin, D.; Baugh, K.E.; Tuttle, B.T.; Ghosh, T.; Pack, D.W.; Erwin, E.H.; Zhizhin, M. A Fifteen Year Record of Global Natural Gas Flaring Derived from Satellite Data. Energies 2009, 3, 595–622. [Google Scholar] [CrossRef]
- Liu, Z.; He, C.; Zhang, Q.; Huang, Q.; Yang, Y. Extracting the Dynamics of Urban Expansion in China Using DMSP-OLS Nighttime Light Data from 1992 to 2008. Landsc. Urban Plan. 2012, 106, 62–72. [Google Scholar] [CrossRef]
- Cao, Z. Correction of DMSP/OLS Night-time Light Images and Its Application in China. J. Geo-Inf. Sci. 2015, 17, 1092–1102. [Google Scholar]
- Zhang, M. Calibration for DMSP/OLS Stable Nighttime Light Images. Bull. Surv. Mapp. 2017, 12, 58–62, 76. [Google Scholar]
- Shu, S. Methods for Deriving urban built-up areas Using Night-light Data:Assessment and Application. Remote Sens. Technol. Appl. 2011, 26, 169–176. [Google Scholar]
- Hou, A.; Zhu, M.; Li, P.; He, Y.; Zhang, X.; Shi, J.; Chen, K.; Weng, T.; Zheng, Z.; Zhou, G. Inference of Urban Function Zone Based on Deep Neural Network. In Proceedings of the IGARSS 2020—2020 IEEE International Geoscience and Remote Sensing Symposium, Waikoloa, HI, USA, 26 September–2 October 2020. [Google Scholar]
- Zhou, G.; Xiong, S. Comparison of object-oriented and Maximum Likelihood Classification of land use in Karst area. In Proceedings of the 2012 IEEE International Geoscience and Remote Sensing Symposium, Munich, Germany, 22–27 July 2012. [Google Scholar]
- Zheng, Z.; Yang, W.; Zhou, G.; Wang, X. Analysis of land use and cover change in Sichuan province, China. J. Appl. Remote Sens. 2012, 6, 063587. [Google Scholar] [CrossRef]
- Zhou, G. Characteristics and Influencing Factors of Urban Land Expansion in Changsha. Acta Geogr. Sin. 2006, 61, 1171–1180. [Google Scholar]
- Iu, S. A GIS based Model of Urban Land Use Growth in Beijing. Acta Geogr. Sin. 2000, 55, 407–416. [Google Scholar]
- Wang, X. Spatial-temporal Changes of Urban Spatial Morphology in China. Acta Geogr. Sin. 2005, 60, 392–400. [Google Scholar]
- Zhang, L. The Features and Influencing Factors of Urban Expansion in China during 1997–2007. Prog. Geogr. 2011, 30, 607–614. [Google Scholar]
- Li, D. An Overview on Data Mining of Nighttime Light Remote Sensing. Acta Geod. Et Cartogr. Sin. 2015, 44, 591–601. [Google Scholar]
- Li, D. The Spatial-Temporal Pattern Analysis of City Development in Countries along the Belt and Road Initiative Based on Nighttime Light Data. Geomat. Inf. Sci. Wuhan Univ. 2017, 42, 711–720. [Google Scholar]
- Yang, Y. Coordination between urban land expansion and population growth in China. Geogr. Res. 2013, 32, 1668–1678. [Google Scholar]
- Sun, C. Rural water poverty risk evaluation, obstacle indicators and resistance paradigms in China. Resour. Sci. 2014, 36, 895–905. [Google Scholar]
- Zhang, Y. The application of minimum variance in agricultural classification: Take the structure type division of grain crops in China as an example. Econ. Geogr. 1986, 6, 49–55. [Google Scholar]
- OECD. Decoupling:A Conceptual Overview; OECD: Paris, France, 2000. [Google Scholar]
- OECD. Environmental Indicators-Development, Measurement and Use; OECD: Paris, France, 2003. [Google Scholar]
- Zhang, X.; Bai, Z.; Fan, X.; Lu, Y.; Cao, Y.; Zhao, Z.; Sun, Q.; Pan, J. Urban Expansion Process, Pattern, and Land Use Response in an Urban Mining Composited Zone from 1986 to 2013. J. Urban Plan. Dev. 2016, 142, 04016014. [Google Scholar] [CrossRef]
- Li, Y. Measure the coordination of city benefit and city scale in the Pan-Yangtze river delta. Hum. Geogr. 2017, 32, 124–130. [Google Scholar]
- Chen, M. Comprehensive Evaluation and the Driving Factors of China’s Urbanization. Acta Geogr. Sin. 2009, 64, 387–398. [Google Scholar]
- Li, X. The intensity and modes of urban landuse growth in Shanghai. J. Nat. Resour. 2003, 18, 412–422. [Google Scholar]
- Zhou, G.; Yan, H.; Chen, K.; Zhang, R. Spatial analysis for susceptibility of second-time karst sinkholes: A case study of Jili Village in Guangxi, China. Comput. Geosci. 2016, 89, 144–160. [Google Scholar] [CrossRef]
- Zhang, D.; Zhou, G.; Yu, L. Uncertainties analysis for normalized soil moisture model based on the combination of optical and thermal infrared data. In Proceedings of the 2016 IEEE International Geoscience and Remote Sensing Symposium (IGARSS), Beijing, China, 10–15 July 2016. [Google Scholar]
- Xiao, Q.; Wang, Y. Study on the Spatial Convergence Club and Growth Momentum of China’s Regional Economies. Sustainability 2022, 14, 12820. [Google Scholar] [CrossRef]
- Li, S.; Li, X.; Zhang, M. Spatial-Temporal Pattern Evolution of Xi’an Metropolitan Area Using DMSP/OLS and NPP/VIIRS Nighttime Light Data. Sustainability 2022, 14, 9747. [Google Scholar] [CrossRef]
- Zhang, Z.; Liu, Y. Spatial Expansion and Correlation of Urban Agglomeration in the Yellow River Basin Based on Multi-Source Nighttime Light Data. Sustainability 2022, 14, 9359. [Google Scholar] [CrossRef]
- Chang, P.; Pang, X.; He, X.; Zhu, Y.; Zhou, C. Exploring the Spatial Relationship between Nighttime Light and Tourism Economy: Evidence from 31 Provinces in China. Sustainability 2022, 14, 7350. [Google Scholar] [CrossRef]
- Wang, Y.; Cheng, H.; Wang, N.; Huang, C.; Zhang, K.; Qiao, B.; Wang, Y.; Wen, P. Trade-Off and Synergy Relationships and Spatial Bundle Analysis of Ecosystem Services in the Qilian Mountains. Remote Sens. 2023, 15, 2950. [Google Scholar] [CrossRef]
- Zeng, J.; Xu, J.; Li, W.; Dai, X.; Zhou, J.; Shan, Y.; Zhang, J.; Li, W.; Lu, H.; Ye, Y.; et al. Evaluating Trade-Off and Synergies of Ecosystem Services Values of a Representative Resources-Based Urban Ecosystem: A Coupled Modeling Framework Applied to Panzhihua City, China. Remote Sens. 2022, 14, 5282. [Google Scholar] [CrossRef]
- Zhou, G.; Wang, L.; Wang, D.; Reichle, S. Integration of GIS and Data Mining Technology to Enhance the Pavement Management Decision Making. J. Transp. Eng. 2010, 136, 332–341. [Google Scholar] [CrossRef]
- Yang, T.; Liu, J.; Mi, H.; Cao, Z.; Wang, Y.; Han, H.; Luan, J.; Wang, Z. An Estimating Method for Carbon Emissions of China Based on Nighttime Lights Remote Sensing Satellite Images. Sustainability 2022, 14, 2269. [Google Scholar] [CrossRef]
- Wang, J.; Zhao, M.; Zhong, W.; Li, J.; Zheng, C. Coupling Relationship of Urban Development and the Eco-Environment in Guanzhong Region, China. Sustainability 2022, 14, 2969. [Google Scholar] [CrossRef]
- Wang, C.; Qin, H.; Zhao, K.; Dong, P.; Yang, X.; Zhou, G.; Xi, X. Assessing the Impact of the Built-Up Environment on Nighttime Lights in China. Remote Sens. 2019, 11, 1712. [Google Scholar] [CrossRef]
- Mou, F.; Kong, R.; Li, K.; Zheng, Z.; Xia, J.; He, Y.; Zhu, M.; Zhou, G.; Zhang, H.; Liu, Z.; et al. Urban Functional Regions Discovering Based on Deep Learning. In Proceedings of the IGARSS 2019—2019 IEEE International Geoscience and Remote Sensing Symposium, Yokohama, Japan, 28 July–02 August 2019. [Google Scholar]
- Xu, Y.; Mo, Y.; Zhu, S. Poverty Mapping in the Dian-Gui-Qian Contiguous Extremely Poor Area of Southwest China Based on Multi-Source Geospatial Data. Sustainability 2021, 13, 8717. [Google Scholar] [CrossRef]
- Wang, J.; Liu, H.; Peng, D.; Lv, Q.; Sun, Y.; Huang, H.; Liu, H. The County-Scale Economic Spatial Pattern and Influencing Factors of Seven Urban Agglomerations in the Yellow River Basin—A Study Based on the Integrated Nighttime Light Data. Sustainability 2021, 13, 4220. [Google Scholar] [CrossRef]
- Chang, Y.; Zhang, G.; Zhang, T.; Xie, Z.; Wang, J. Vegetation Dynamics and Their Response to the Urbanization of the Beijing–Tianjin–Hebei Region, China. Sustainability 2020, 12, 8550. [Google Scholar] [CrossRef]
- Zhou, G.; Chen, X.; Huang, J.; Yan, H. The ecological environment assessment and repairing of Guilin Karst Scenery based on satellite remote sensing. In Proceedings of the 2014 IEEE Geoscience and Remote Sensing Symposium, Quebec City, QC, Canada, 13–18 July 2014; pp. 1666–1669. [Google Scholar] [CrossRef]
- Zhou, G.; Wang, H.; Chen, W.; Zhang, G.; Luo, Q.; Jia, B. Impacts of Urban land surface temperature on tract landscape pattern, physical and social variables. Int. J. Remote Sens. 2019, 41, 683–703. [Google Scholar] [CrossRef]
- Chen, M.; Zhang, C.; Chen, C.; Li, J.; Cui, W. Main Pathways of Carbon Reduction in Cities under the Target of Carbon Peaking: A Case Study of Nanjing, China. Sustainability 2023, 15, 8917. [Google Scholar] [CrossRef]
- Lu, M.; Zhang, Y.; Liang, F.; Wu, Y. Spatial Relationship between Land Use Patterns and Ecosystem Services Value—Case Study of Nanjing. Land 2022, 11, 1168. [Google Scholar] [CrossRef]
- Lei, G.; Guo, S.; Yuan, Z. Study on the Effect and Mechanism of Circular Economy Promotion Law on the Utilization Rate of Industrial Solid Waste in Resource-Based Cities. Sustainability 2022, 14, 9878. [Google Scholar] [CrossRef]




| Parameter | DMSP/OLS | NPP/VIIRS |
|---|---|---|
| Time (Year) | 1992–2013 | 2012–Now |
| Spatial resolution | 2.7 km | 740 m |
| Imaging width | 3000 km | 3000 km |
| Spectral range | 0.5–0.9 μm | 0.5–0.9 μm |
| Spectral resolution | 6 bits | 14 bits |
| Year | Built-Up Area | DN Value | Extracted Perimeter/km | Extraction Area/km2 |
|---|---|---|---|---|
| 1992 | 148 | 42 | 98 | 134 |
| 1995 | 151 | 43 | 110 | 145 |
| 2000 | 201 | 50 | 144 | 227 |
| 2005 | 513 | 49 | 218 | 501 |
| 2010 | 619 | 53 | 260 | 588 |
| 2013 | 713 | 15 | 415 | 838 |
| 2015 | 755 | 14 | 444 | 909 |
| 2020 | 868 | 18 | 502 | 1041 |
| Year | X Coordinates (E) | Y Coordinates (N) | Area/km2 | The Offset Direction | Offset Distance/m |
|---|---|---|---|---|---|
| 1992 | 118°46′12.59″ | 32° 4′30.93″ | 116 | -- | -- |
| 1995 | 118°46′24.35″ | 32°4′35.07″ | 148 | East | 412.11 |
| 2000 | 118°46′44.42″ | 32°3′33.33″ | 163 | South | 1942.11 |
| 2005 | 118°46′57.64″ | 32°3′19.08″ | 223 | Southeast | 550.58 |
| 2010 | 118°46′55.57″ | 32°3′17.38″ | 240 | Southwest | 74.43 |
| 2013 | 118°47′48.12″ | 32°1′8.27″ | 883 | South | 4143.07 |
| 2015 | 118°47′44.88″ | 32°1′0.77″ | 873 | South | 242.31 |
| 2020 | 118°47′36.22″ | 32°0′58.82″ | 888 | West | 230.74 |
| 1995 | 2000 | 2005 | 2010 | 2015 | 2020 | Correlation | |
|---|---|---|---|---|---|---|---|
| Nighttime light DN Value | 54,725 | 71,010 | 94,285 | 134,406 | 130,600 | 188,035 | |
| Urban population | 266 | 290 | 525 | 629 | 746 | 809 | 0.943 ** |
| Urban non-agricultural GDP | 540 | 1016 | 2376 | 5056 | 9783 | 14521 | 0.943 ** |
| Urban compactness | 0.39 | 0.37 | 0.36 | 0.33 | 0.24 | 0.23 | −0.943 ** |
| Urban electricity consumption | 604,800 | 1,377,395 | 2,466,661 | 3,736,638 | 4,951,753 | 6,329,425 | 0.943 ** |
| Passenger transport capacity | 10,068 | 15,294 | 20,537 | 39,104 | 15,929 | 11,375 | 0.371429 |
| Road length | 1271 | 1802 | 6132 | 5599 | 7771 | 9335 | 0.829 * |
| Drainage facilities | 1014 | 1370 | 3380 | 4948 | 8308 | 10,863 | 0.943 ** |
| Household consumption of LPG | 83,670 | 80,272 | 81,903 | 76,409 | 50,481 | 23,422 | −0.886 * |
| Wastewater discharge | 9 | 6 | 5 | 3 | 2 | 1 | −0.943 ** |
| Exhaust emissions | 1602 | 2155 | 3754 | 5738 | 8782 | 9340 | 0.943 ** |
| Soot emissions | 5 | 5 | 5 | 3 | 8 | 2 | −0.57682 |
| Production of general industrial solid waste | 542 | 652 | 1159 | 1657 | 1475 | 1888 | 1.000 ** |
| Number of key pollution control projects | 196 | 299 | 135 | 77 | 76 | 1056 | −0.02857 |
| Sewage treatment rate | 37.4 | 63.6 | 81.2 | 88.8 | 95.7 | 97.9 | 0.943 ** |
| Garbage treatment rate | 100 | 85.76 | 87.46 | 78.74 | 100 | 100 | −0.03036 |
| Parks and green areas | 1798 | 2250 | 6139 | 6773 | 9328 | 10981 | 0.943 ** |
| Indicator | Feature Weight | Indicator | Feature Weight |
|---|---|---|---|
| Compactness | 0.19 | Average noise value | 0.11 |
| Population density in built-up areas | 0.09 | Wastewater discharge | 0.12 |
| GDP per square kilometer of built-up areas | 0.21 | Exhaust emissions | 0.18 |
| Road density | 0.13 | Soot emissions | 0.11 |
| Student density in urban built-up areas | 0.13 | Production of general industrial solid waste | 0.17 |
| Electricity consumption | 0.10 | Sewage treatment rate | 0.11 |
| Drainage facilities | 0.15 | Proportion of green spaces in built-up areas | 0.19 |
| 1995 | 2000 | 2005 | 2010 | 2015 | 2020 | |
|---|---|---|---|---|---|---|
| Environmental pollution | 1.10 | 1.30 | 1.10 | 1.187 | 0.93 | 2.294 |
| Urban development | 1.19 | 1.27 | 1.29 | 0.98 | 1.11 | 2.71 |
| Microscopic | 0.93 | 1.03 | 0.85 | 1.21 | 0.84 | 0.93 |
| Macroscopic | 1 | 0.96948 | 0.93896 | 0.90844 | 0.87792 | 0.84739 |
Disclaimer/Publisher’s Note: The statements, opinions and data contained in all publications are solely those of the individual author(s) and contributor(s) and not of MDPI and/or the editor(s). MDPI and/or the editor(s) disclaim responsibility for any injury to people or property resulting from any ideas, methods, instructions or products referred to in the content. |
© 2023 by the authors. Licensee MDPI, Basel, Switzerland. This article is an open access article distributed under the terms and conditions of the Creative Commons Attribution (CC BY) license (https://creativecommons.org/licenses/by/4.0/).
Share and Cite
Zhou, G.; Wu, D.; Zhou, X.; Zhu, Q. Coordination Analysis between the Development of Urban Built-Up Areas and Urban Environmental Factors through Remote Sensing of Nighttime Lights: A Case Study in Nanjing, China. Remote Sens. 2023, 15, 3279. https://doi.org/10.3390/rs15133279
Zhou G, Wu D, Zhou X, Zhu Q. Coordination Analysis between the Development of Urban Built-Up Areas and Urban Environmental Factors through Remote Sensing of Nighttime Lights: A Case Study in Nanjing, China. Remote Sensing. 2023; 15(13):3279. https://doi.org/10.3390/rs15133279
Chicago/Turabian StyleZhou, Guoqing, Da Wu, Xiao Zhou, and Qiang Zhu. 2023. "Coordination Analysis between the Development of Urban Built-Up Areas and Urban Environmental Factors through Remote Sensing of Nighttime Lights: A Case Study in Nanjing, China" Remote Sensing 15, no. 13: 3279. https://doi.org/10.3390/rs15133279
APA StyleZhou, G., Wu, D., Zhou, X., & Zhu, Q. (2023). Coordination Analysis between the Development of Urban Built-Up Areas and Urban Environmental Factors through Remote Sensing of Nighttime Lights: A Case Study in Nanjing, China. Remote Sensing, 15(13), 3279. https://doi.org/10.3390/rs15133279


