Article

Disturbing Variability in Microwave Emission from a Non-Gaussian Distributed and Correlated Multiscale Rough Surface

1
School of Electronic and Optical Engineering, Nanjing University of Science and Technology, Nanjing 210094, China
2
College of Geomatics and Geoinformation, Guilin University of Technology, Guilin 541004, China
*
Author to whom correspondence should be addressed.
Remote Sens. 2023, 15(13), 3297; https://doi.org/10.3390/rs15133297
Submission received: 27 May 2023 / Revised: 25 June 2023 / Accepted: 26 June 2023 / Published: 27 June 2023
(This article belongs to the Section Remote Sensing in Geology, Geomorphology and Hydrology)

Abstract

:
In passive microwave remote sensing of the Earth’s surface, it is essential to relate the emission to geophysical parameters. The emissivity ranges between 0 and 1. Hence, a slight emissivity variation leads to a significant change in brightness temperature. Many sources of error contribute to such tiny variations in emission. This paper quantifies microwave emission variability from a rough surface through model simulation due to the non-Gaussianity in height probability density (HPD) and power spectrum density (PSD). We considered Gaussian and exponential distributions for surface height and correlation functions, representing two extremes of asperity and skewness. Additionally, the surface under consideration contains multiscale roughness. The impact of the HPD and multiscale roughness on the polarization index of the emissivity is evaluated as a function of frequency and roughness. In general, assuming that Gaussian-distributed height leads to an underestimation of the emissivity, with V polarization being less sensitive to the non-Gaussian HPD and PSD effects than H polarization, the emissions are enhanced at high roughness with small look angles but are reduced for smooth surfaces at large look angles under non-Gaussian PSD. In a specific scenario, the dynamic range of the difference between exponential and Gaussian HPD is 0~10%, and the difference in emissivity caused by non-Gaussian PSD ranges from −2% to 16%. These results should be helpful in interpreting the radiometric measurements that exhibit fluctuations and differences with model predictions.

1. Introduction

Natural surfaces frequently display a non-Gaussian distribution because of natural forcing. Ocean surfaces and snow-covered sea ice, driven by dynamic forces, are typical examples of non-Gaussian-distributed rough surfaces revealing asymmetric distribution to different degrees [1,2]. Two rough surfaces can have the same correlation function but different height distributions or vice versa. In comparison, the non-Gaussian effect on the scattering characteristics has been well recognized; most previous works of a theoretical and numerical nature studying radar scattering on a rough surface assumed a Gaussian height [3,4,5,6], where the surface is statistically symmetric in its mean value. Limited theoretical studies have been conducted to understand the effects of non-Gaussian surface height distributions [7,8,9,10,11], where treatments were focused on the backscattering variations in the coherent and incoherent scattering components. More extensive numerical simulations of wave scattering were reported, but these were restricted to the backscattering of one-dimensional profiles [12].
We display computer-generated sample surfaces in Figure 1 with the specified power spectral density (PSD) and height probability density (HPD) to gain insights into the height non-Gaussianity. In particular, we show surfaces with Gaussian and exponential HPDs and exponential PSD. The RMS height and correlation lengths were kept the same, and the height distribution was estimated from an ensemble average of 100 samples. According to the surface features, visually, we may see that a Gaussian surface contains more low-frequency components, and an exponential surface tends to be spiky because of a narrow concentration and highly skewed height variations in terms of asperity and skewness. Among these features, the HPDs would exercise different degrees of impact on coherent scattering (specular) and incoherent scattering (diffuse). The effect of non-Gaussian heights on radar bistatic scattering was analyzed by means of model simulations [13]. It has been found that the height probability distribution’s impacts differ in the different regions of the bistatic scattering plane, thus complicating the differentiation of the scattering patterns due to height distribution. However, whether the surface height probability distribution influences the emission remains unknown.
The Gaussian assumption is usually adopted in modeling microwave emission because it partially allows a more manageable solution to develop an analytical expression. Another reason is deduced from the fact that the reflectivity is computed by averaging out the bistatic scattering coefficients over a hemisphere. Thus, presumably, it will lose its directional sensitivity. Furthermore, the emissivity is one minus the reflectivity under energy conservation. Intuitively, whether the surface height is asymmetrically or symmetrically distributed seems irrelevant to the net reflectivity and emissivity. Recall that reflectivity consists of coherent and incoherent components. Given roughness features, as suggested from the above-shown surface, it has been shown that the coherent component strongly depends on the surface height probability density (HPD). In contrast, the incoherent component is more dependent on the surface correlation function or the power spectrum density (PSD). Since the surface roughness parameters determine the proportion of coherent to incoherent components, we may argue that it is not always appropriate to assume a Gaussian HPD when dealing with scattering and emission problems.
Retrieval algorithms for geophysical parameters from observed emissivity have been developed and successfully applied [14,15,16]. In this regard, among noisy sources contributing to the measured emissivity, a small percentage of emission difference due to the non-Gaussian effects may contaminate the geophysical parameters from the observed emissivity. More systematic studies of how the non-Gaussianity affects the bistatic scattering in the whole scattering plane remain to be performed. Hence, it is essential to quantify the non-Gaussian HPD and PSD effects on microwave emission from a rough surface to differentiate the variability and improve radiometric accuracy over land and ocean surfaces.
This paper focuses on the effects of rough surface non-Gaussian HPD and PSD on microwave emissivity. Section 2 describes the scattering and microwave emission from Gaussian and non-Gaussian surfaces. HPD and PSD are described with two extreme cases: Gaussian and exponential distributions. Section 3 discusses the model simulation of polarized emissions from Gaussian and non-Gaussian surfaces, both HPD and PSD. Finally, Section 4 summarizes the results to conclude the study.

2. Scattering and Emission from Non-Gaussian Distributed Rough Surface

Two generic statistical descriptors are needed to characterize the scattering and emission behavior from a randomly rough surface: the height probability density and the power spectral density. The HPD describes how the surface heights vary in terms of a probability distribution, while PSD describes how the surface heights at two positions correlate. These properties translate into how the scattered fields fluctuate and correlate with contributing to the total scattered power that accounts for the scattering and emission capability of a rough surface under probing. Two extreme models for each, namely Gaussian and exponential, are given below for ease of reference.

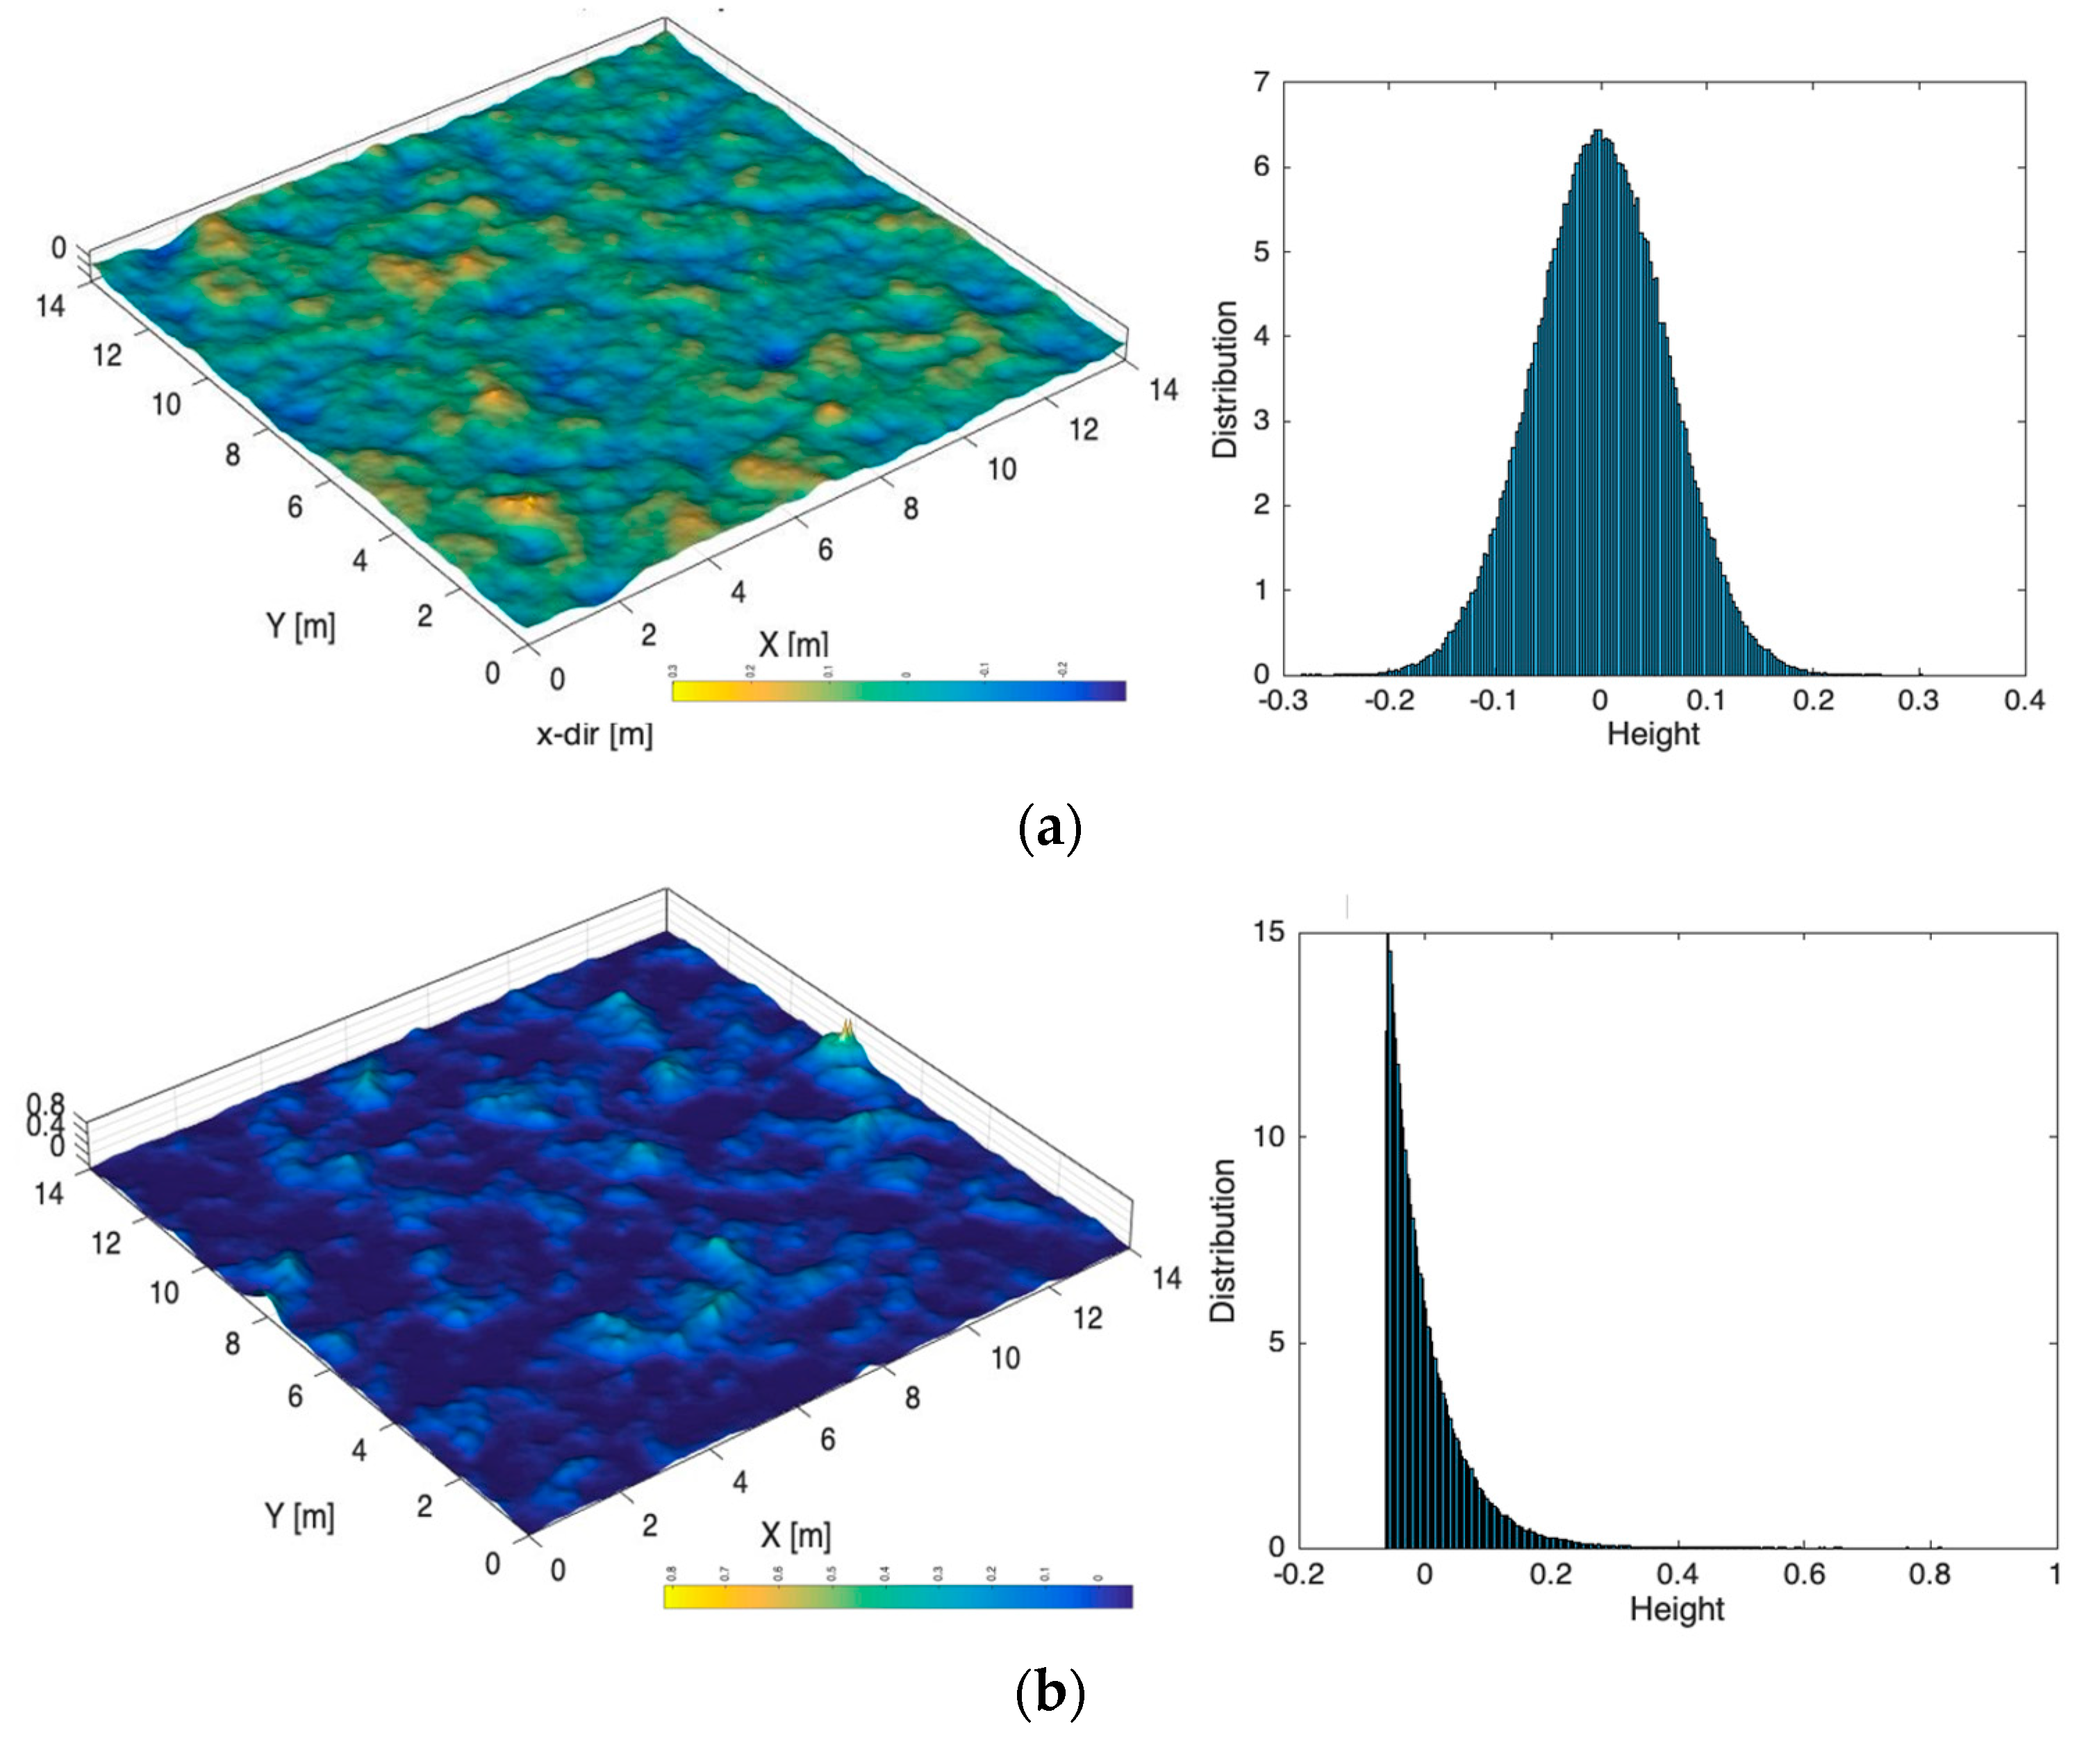
2.1. Height Probability Density (HPD)

Consider a randomly rough surface with height ζ = ζ x , y . The Gaussian and exponential distributions of ζ are of the forms, respectively:
p g ( ζ ) = 1 2 π σ e ζ 2 / 2 σ 2
p e ( ζ ) = 1 σ exp ζ σ
where σ is the RMS height.

2.2. Power Spectrum Density (PSD)

For the sake of simplicity and without loss of generality, we consider an isotropic surface, where the correlation is non-directional. For a Gaussian correlated surface, the correlation function and PSD are
ρ g r = exp r 2 l 2
W g K = l 2 2 exp K 2 l 2 4
where K = ( K x , K y ) is the spatial wavenumber vector with K x , K y being the wavenumber components in the x and y directions— r = ( x , y ) , with K = K x 2 + K y 2 ; l is the correlation length, in units of radar wavelength.
For an exponential correlated surface, the correlation function and PSD are
ρ e r = exp r l
W e K = l 2 1 + K 2 l 2 3 / 2
To account for the multiscale roughness, a modulation model is adopted [17]:
ρ ( r ) = ρ b ( r ) J 0 ( k m r )
where ρ b ( r ) is the baseband correlation function, as given by Equation (3) or (5); J 0 is a zero-order Bessel function, k m = 2 π / λ m is a modulation wavenumber which controls the degree of multiscale roughness, and λ m is the modulation length. The modulation ratio r m = l / λ m is defined as the ratio of correlation length l and modulation length λ m . r m = 0 indicates the unmodulated single-scale surface, and a larger r m represents a finer scale of roughness. By means of the modulation process, the effective correlation length of the surface represented by Equation (7) becomes l e rather than l .

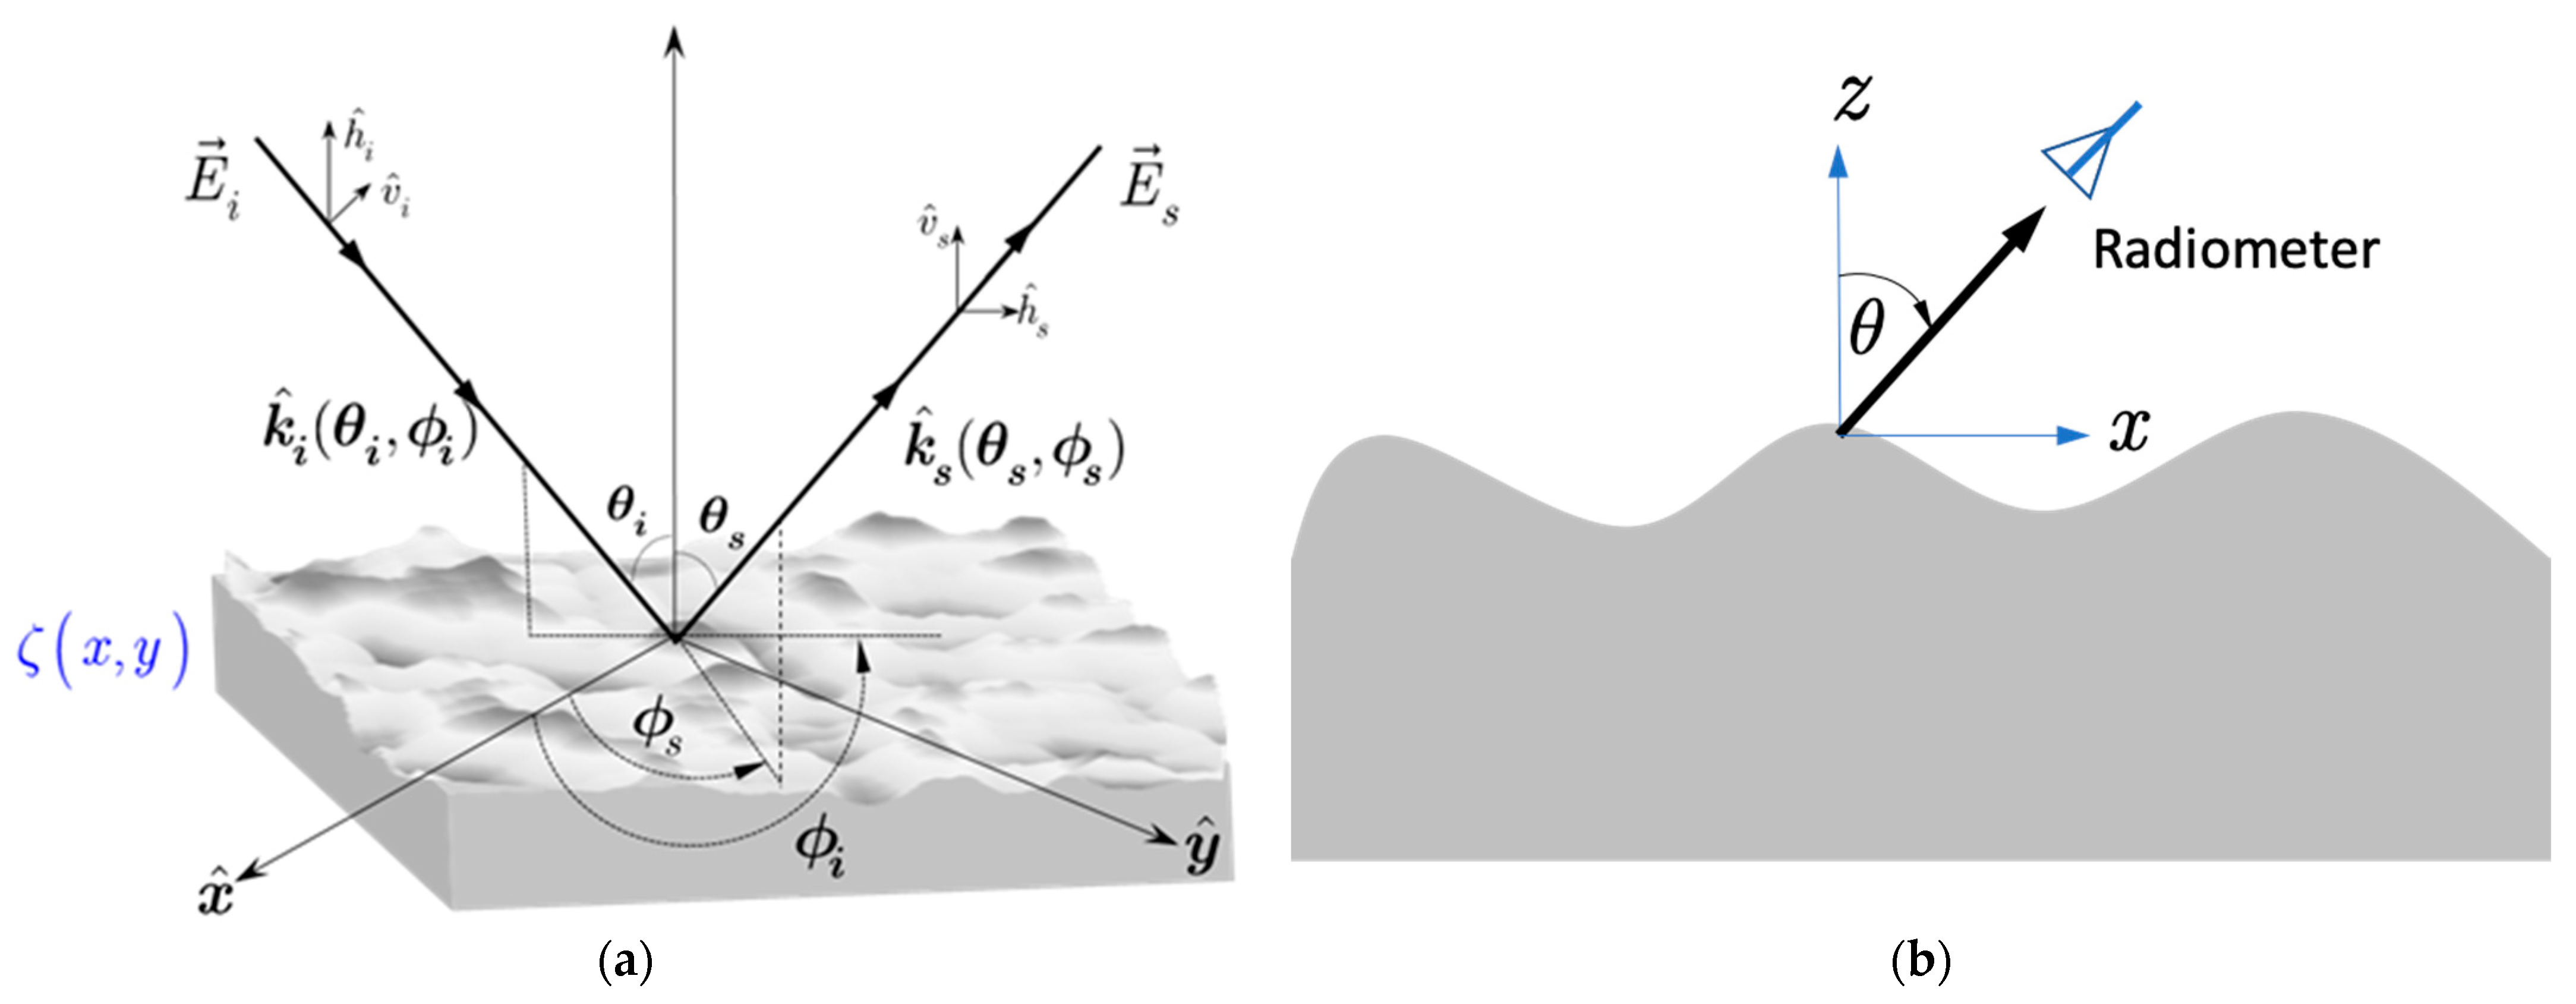
2.3. Bistatic Scattering Coefficients and Emissivity

The far-zone scattered field can be calculated in terms of the surface electric current density J s and magnetic current density M s via the Stratton–Chu formula [4].
E r = j k i 4 π R e j k i R A [ η i J s + k ^ s × M s ] e j k i R d S
where R is the range from the center of the illuminated area to the point of observation, and k i is the wave number. A is the illuminated area; η i is the intrinsic impedance; and R is the project length from r to r .
Figure 2 illustrates the scattering geometry of wave scattering from a rough surface ζ x , y . Here, assume a plane wave impinging upon a rough surface that is non-Gaussian in height probability density (HPD). In Figure 2, for the scattering problem, k ^ i θ i , ϕ i and k ^ s θ s , ϕ s denote the incident- and scattering-wave unit vectors, respectively; θ i and ϕ i are the incident angle and the incident azimuthal angle, respectively; θ s and ϕ s are the scattering angle and the scattering azimuthal angle, respectively; h ^ i and v ^ i are the horizontally and vertically incident polarized vectors, respectively, and h ^ s and v ^ s are the horizontally and vertically scattering polarized vectors, respectively. In the emission problem, the radiometer’s look angle is θ .
The incident and scattering wavenumbers are
k i = k k ^ i = x ^ k i x + y ^ k i y + z ^ k i z ; k i x = k sin θ i cos ϕ i ,   k i y = k sin θ i sin ϕ i ,   k i z = k cos θ i
k s = k k ^ s = x ^ k s x + y ^ k s y + z ^ k s z ; k s x = k sin θ s cos ϕ s ,   k s y = k sin θ s sin ϕ s ,   k s z = k cos θ s
The diffraction field from the surface edges may be ignored due to the infinite length of the surface or due to the tapering off of the antenna radiation pattern. For our discussion, Equation (8) may be expressed as
E r = j k i e i k R 4 π R E 0 ( I = k ^ s k ^ s ) α q p   I
where R is the range from the center of the illuminated area to the point of observation, and k i is the wave number. A is the illuminated area, I = is the unit dyadic, E 0 is the magnitude of the incident field, I = d S e j ( k s k i ) r , α q p is the polarized field coefficient with q-polarized scattering and p-polarized incidence, and p and q can be either horizontal or vertical polarization.
The scattered field is composed of a mean field (coherent) and a fluctuating field (incoherent). The ensemble average scattered power also consists of a coherent power P q p c and an incoherent power P q p i :
P q p c   I 2 = e j ( k s k i ) r d S 2
P q p i   II = e j ( k s k i ) ( r r ) d S d S e j ( k s k i ) r d S 2
where k s and k i denote the incident- and scattering- wave vectors, respectively.
From the above equations, it is identified that in computing the coherent power, we need to know the height probability density, while in computing the incoherent power, a joint height probability density is required. For Gaussian and exponential distribution, the bivariate HPDs are:
p g ( ζ , ζ ) = 1 2 π σ 2 1 ρ 2 exp ζ 2 2 ρ ζ ζ + ζ 2 2 σ 2 1 ρ 2
p e ( ζ , ζ ) = 1 σ 2 ( 1 ρ ) exp ζ + ζ σ ( 1 ρ ) I 0 2 ρ ζ ζ σ ( 1 ρ )
where σ is the RMS height, ρ is the correlation function, and I 0 is the zeroth-order modified Bessel function. The detailed derivation of bivariate HPDs are given in the Appendix A.
The bistatic scattering coefficient is calculated in terms of the average power:
σ q p 0 = 4 π R 2 A P q p E 0 2
where P q p is the scattering power, which consists of coherent P q p c and incoherent components P q p i . E 0 is the incident field amplitude, A is the illuminated area, and R is the range from the center of the illuminated area to the point of observation.
Under the AIEM model, the pq-polarized bistatic scattering coefficients σ p p 0 and σ p q 0 from a Gaussian HPD surface are [18]:
σ q p 0 = k 2 2 e σ 2 k s z 2 + k z 2 n = 0 σ 2 n n ! I q p n 2 W n k s x k x , k s y k y
and from an exponential HPD surface is derived:
σ q p 0 = k 2 2 1 1 + σ 2 k s z + k z 2 n = 0 σ 2 n 1 + σ 2 k s z + k z 2 n I q p n 2 W n k s x k x , k s y k y
In Equations (17) and (18), we note that the terms with n = 0 inside the summation correspond to the coherent scattering; W n ( ) is the Fourier transform of the nth power of the correlation function and is computed from Equation (4) or (6), and σ is the RMS height. I q p n is the scattering factor, which is defined as I q p n = k s z + k z n f q p e σ 2 k z k s z . The Kirchhoff field coefficients f q p with q and p denoting the polarization (q, p = h, v) are given in [18].
With the bistatic scattering coefficients given in Equations (17) and (18), the surface emissivity can be computed by:
e p = 1 1 4 π cos θ i 0 2 π 0 π σ p p 0 + σ p q 0 sin θ s d θ s d ϕ s
We may use a polarization index (PI) to evaluate the influence of the frequency and look angle on the polarization sensitivity of emissivity at different HPDs and PSDs:
PI = e v e h e v + e h
where e v is the vertically polarized emissivity and e h is the horizontally polarized emissivity.

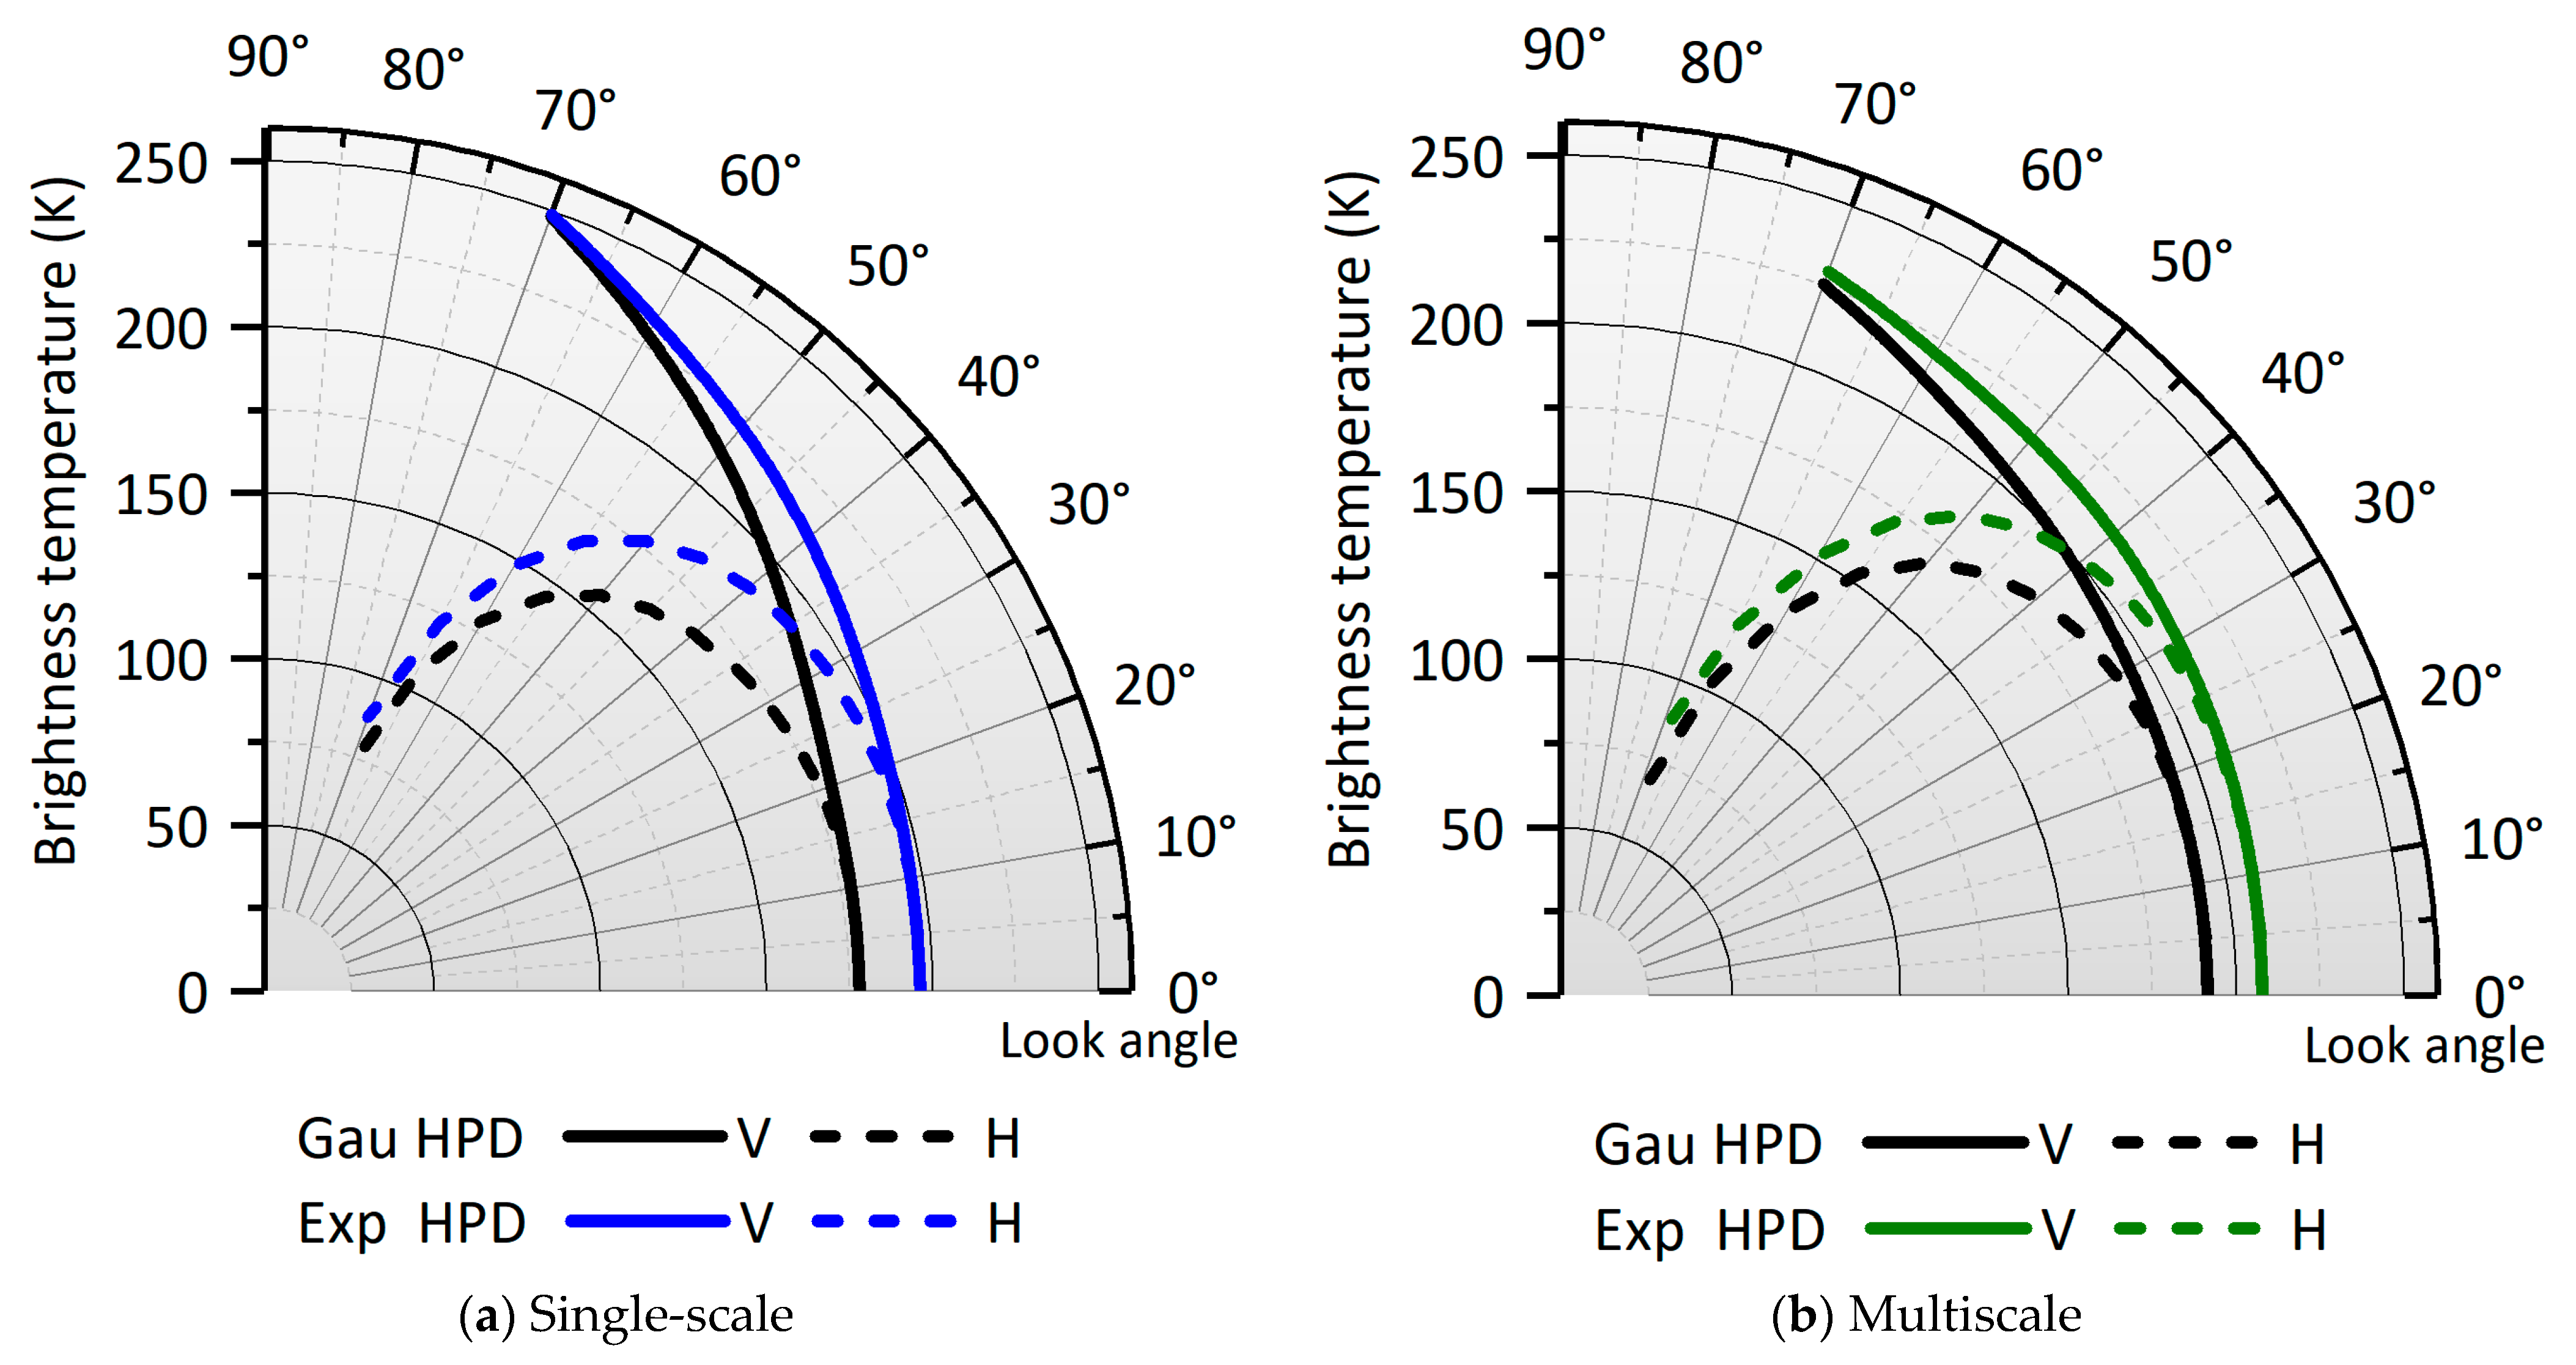
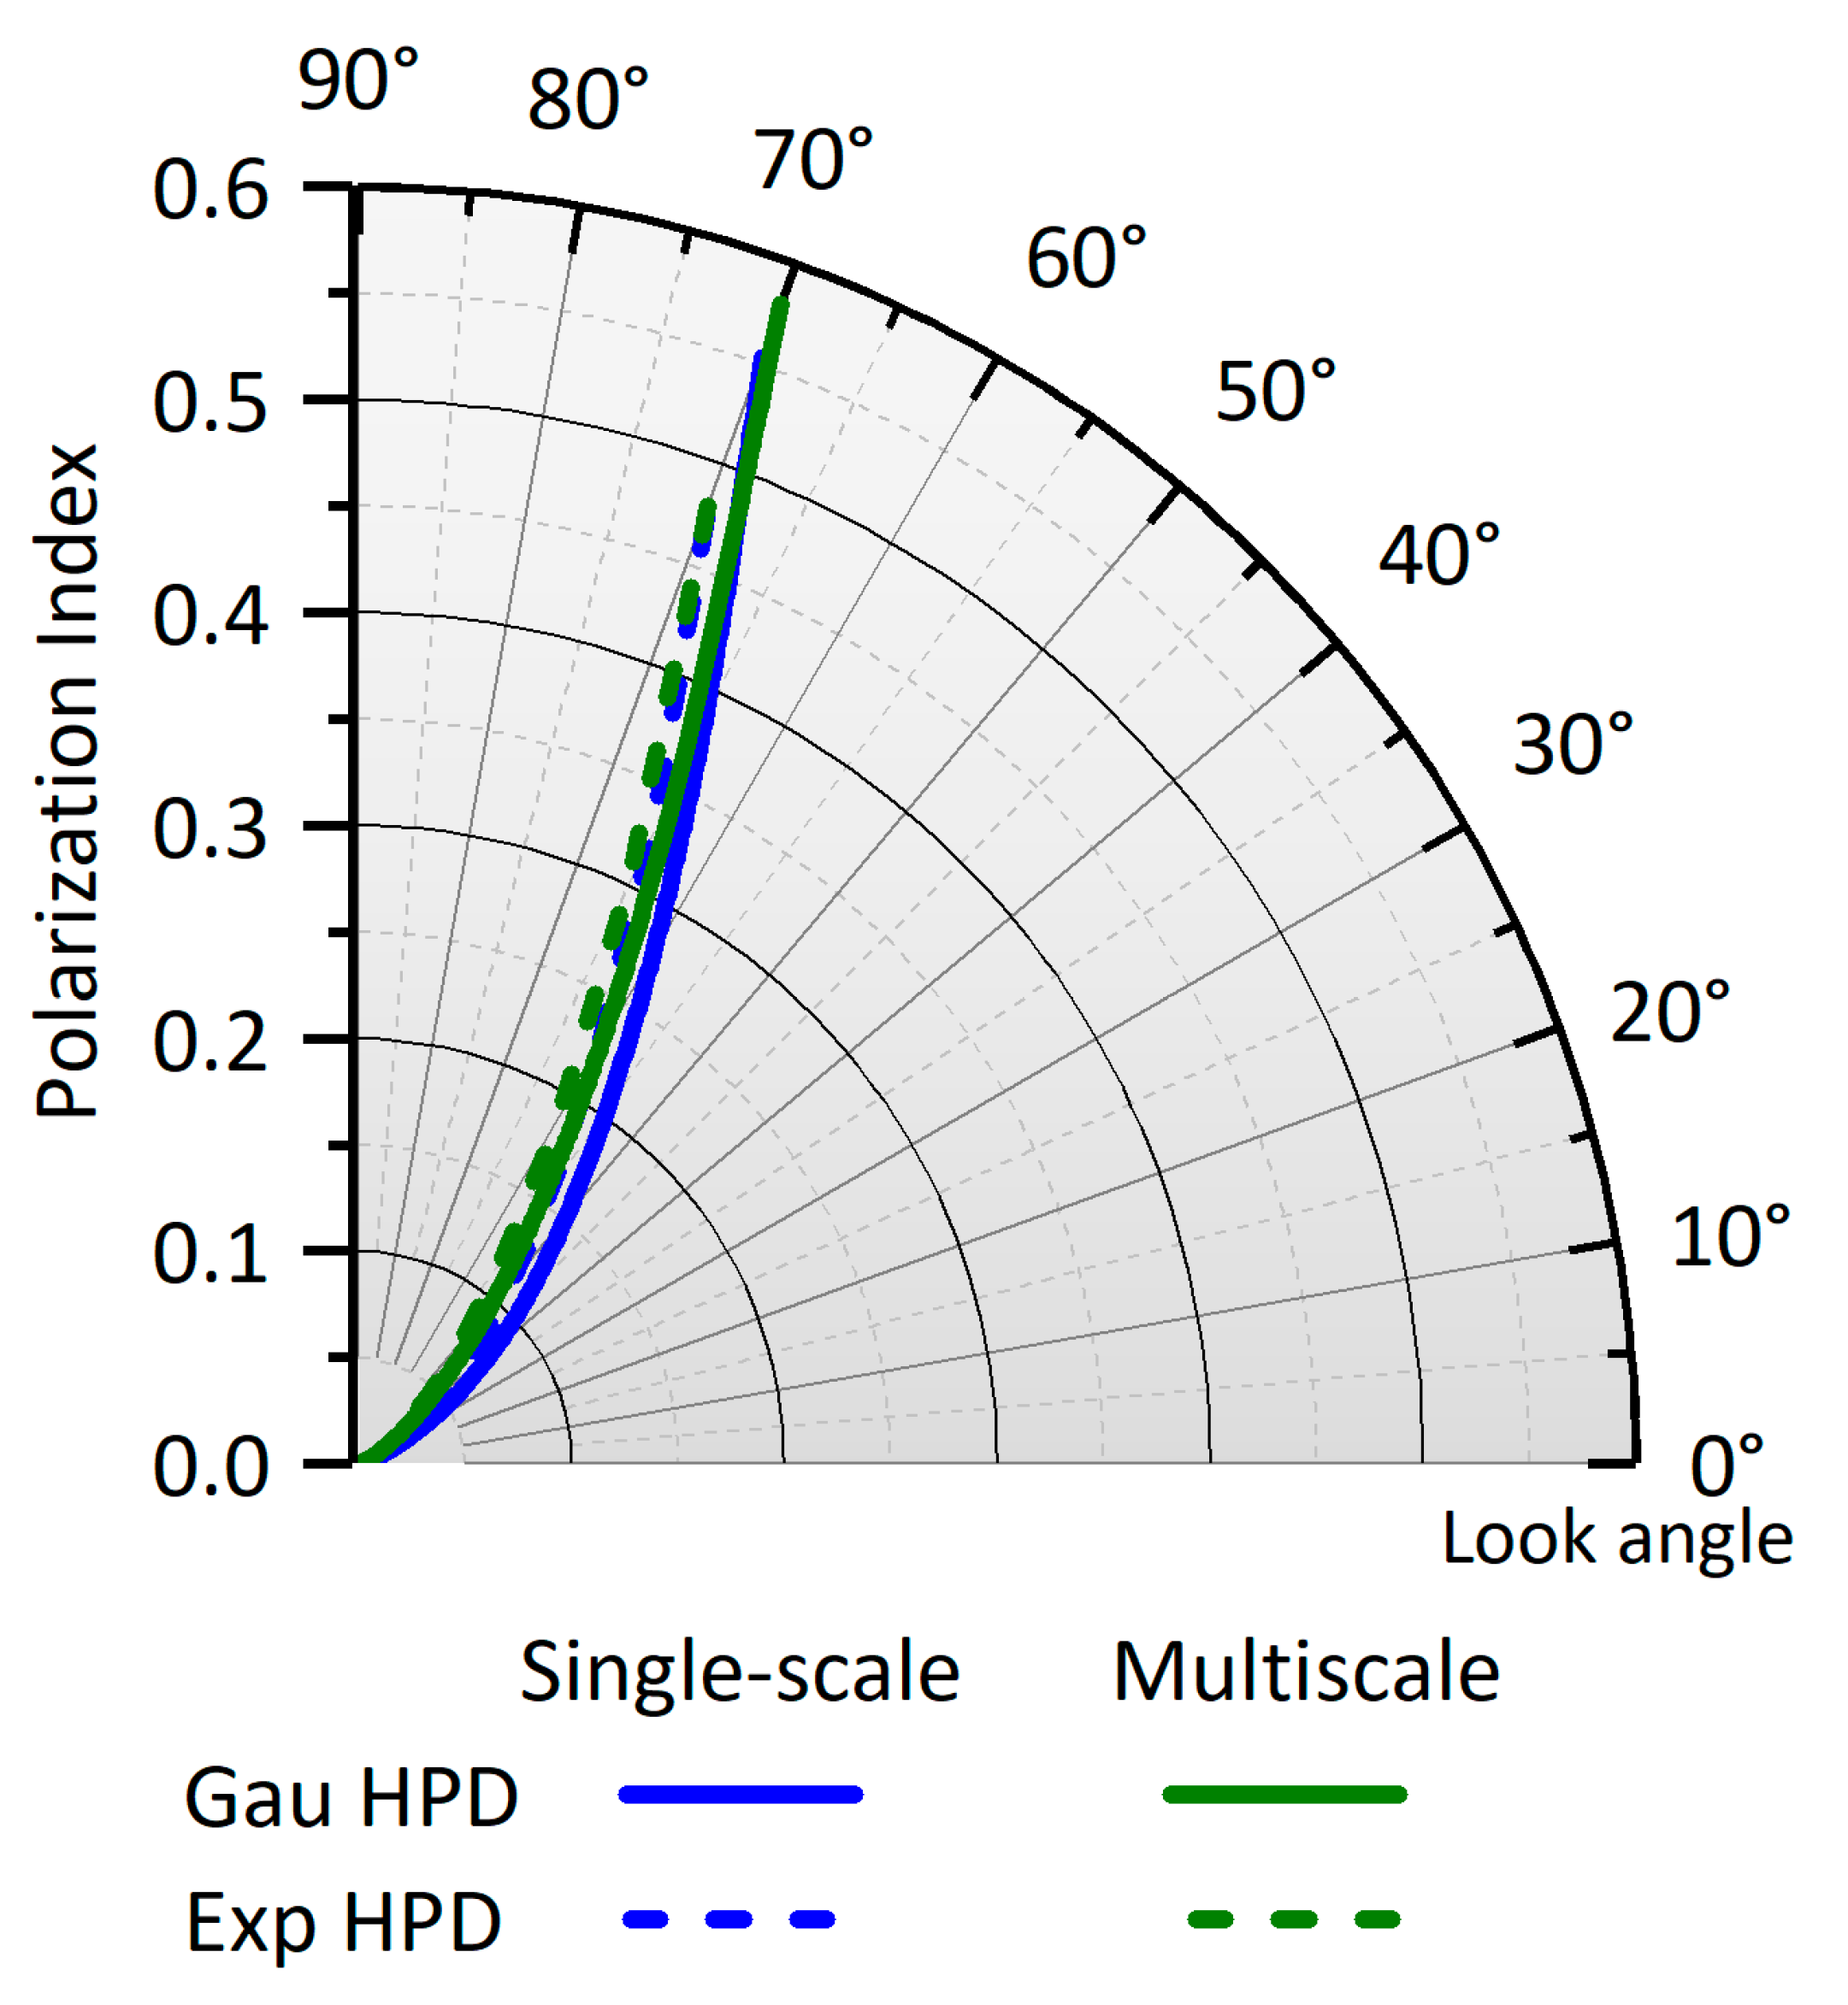
3. Polarized Emissions from Non-Gaussian Distributed Surfaces

We compare polarized emissivity and polarization index (PI) differences between exponential and Gaussian HPD rough surfaces to illustrate the non-Gaussian HPD effects. We also show the differences in emissivity and polarization index (PI) between exponential and Gaussian PSD rough surfaces to demonstrate the non-Gaussian PSD effect.

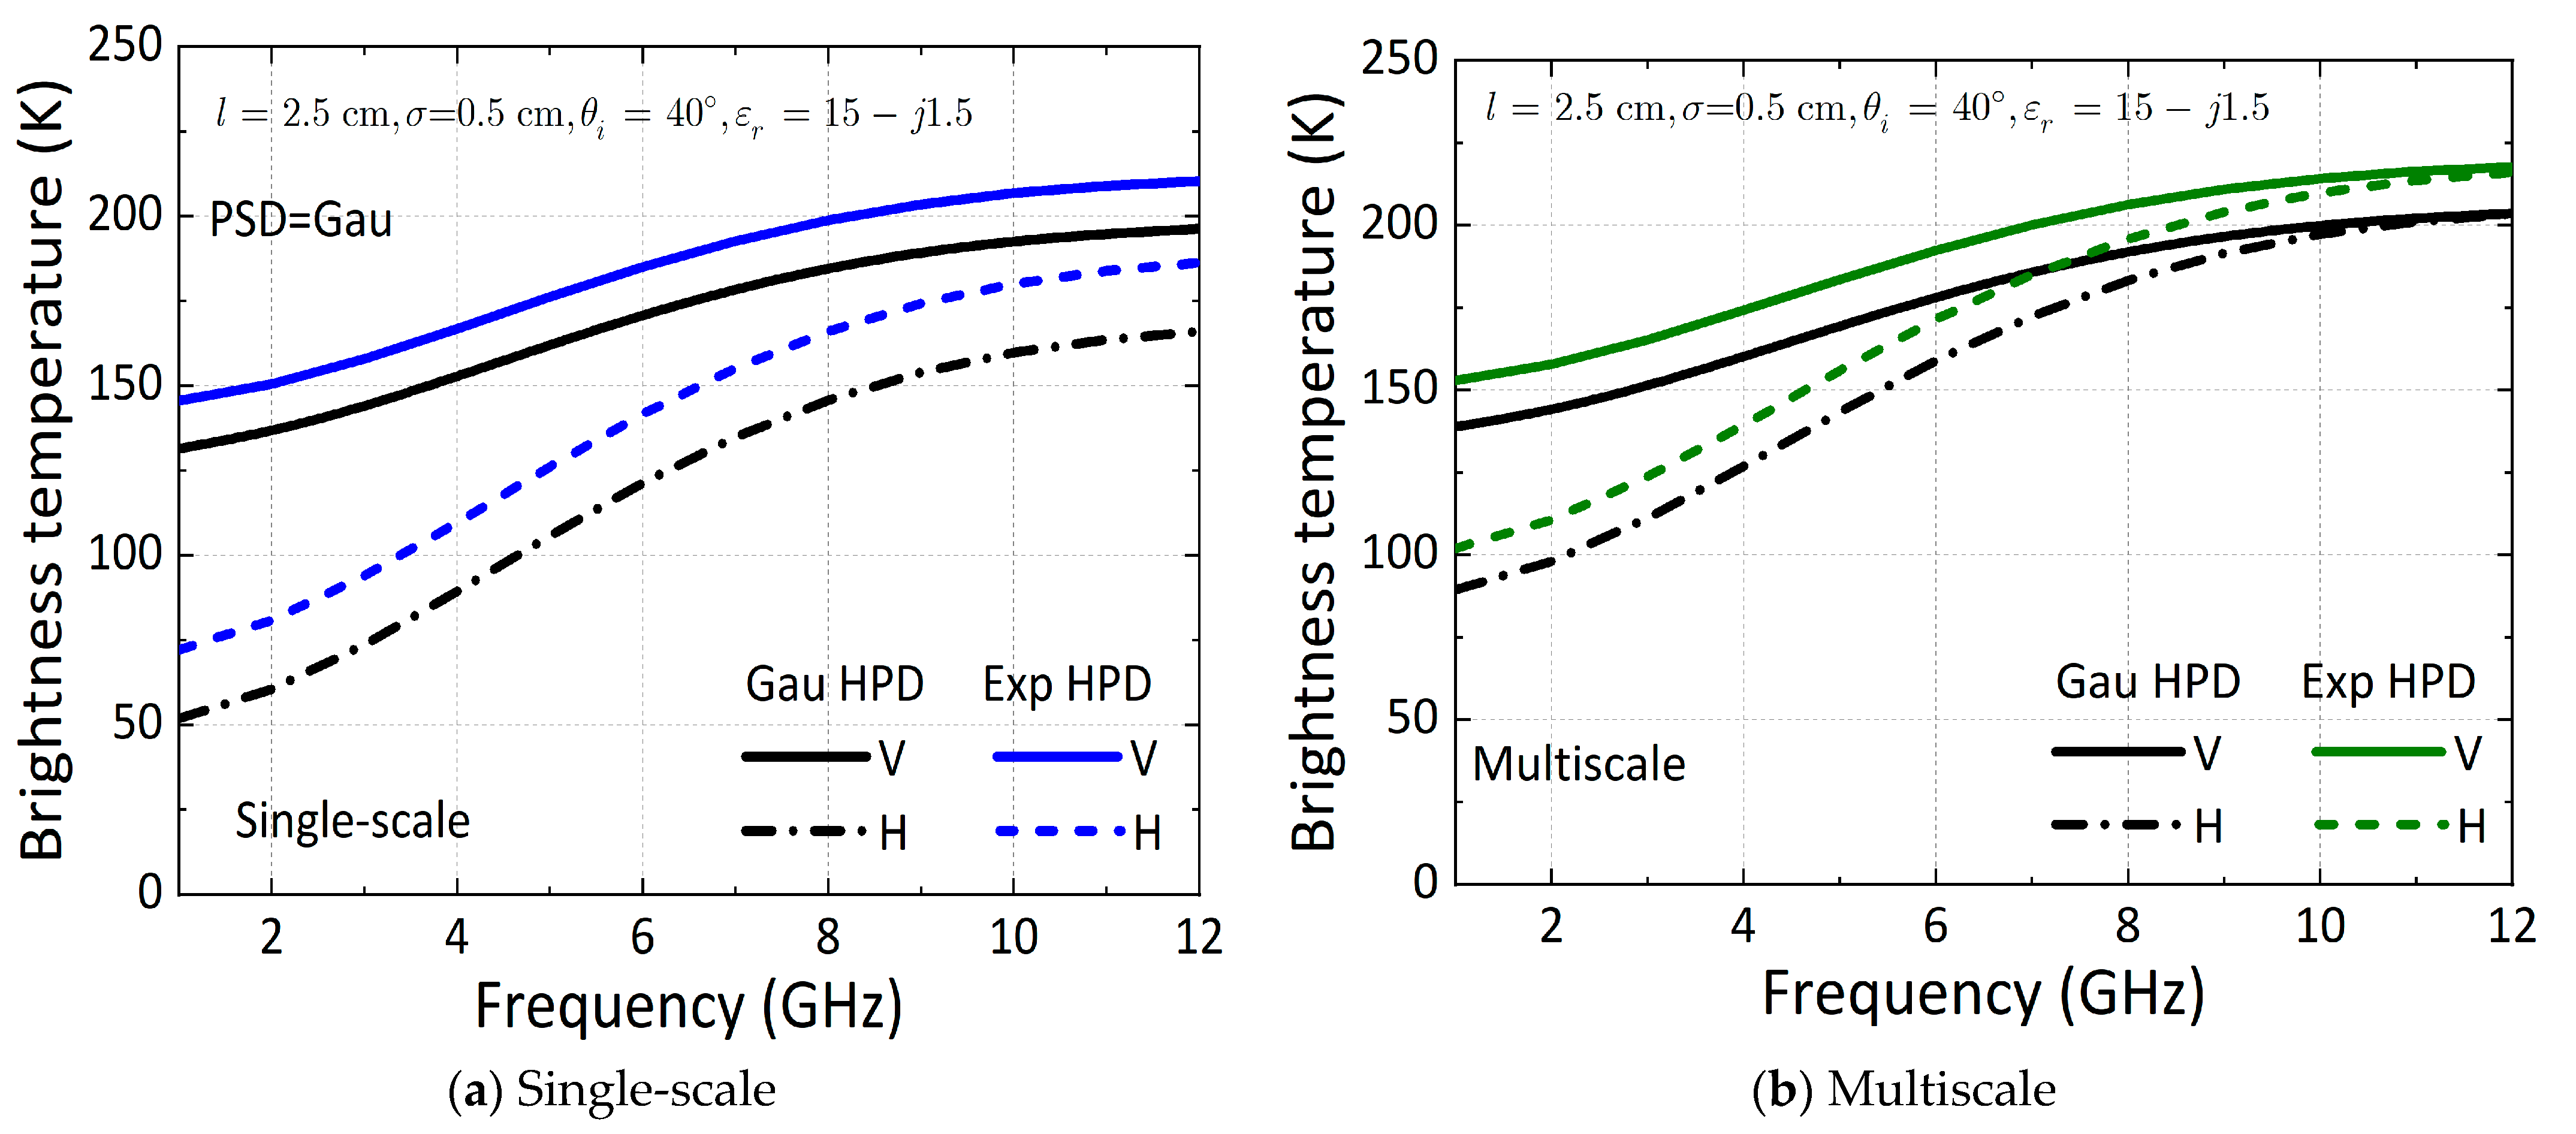
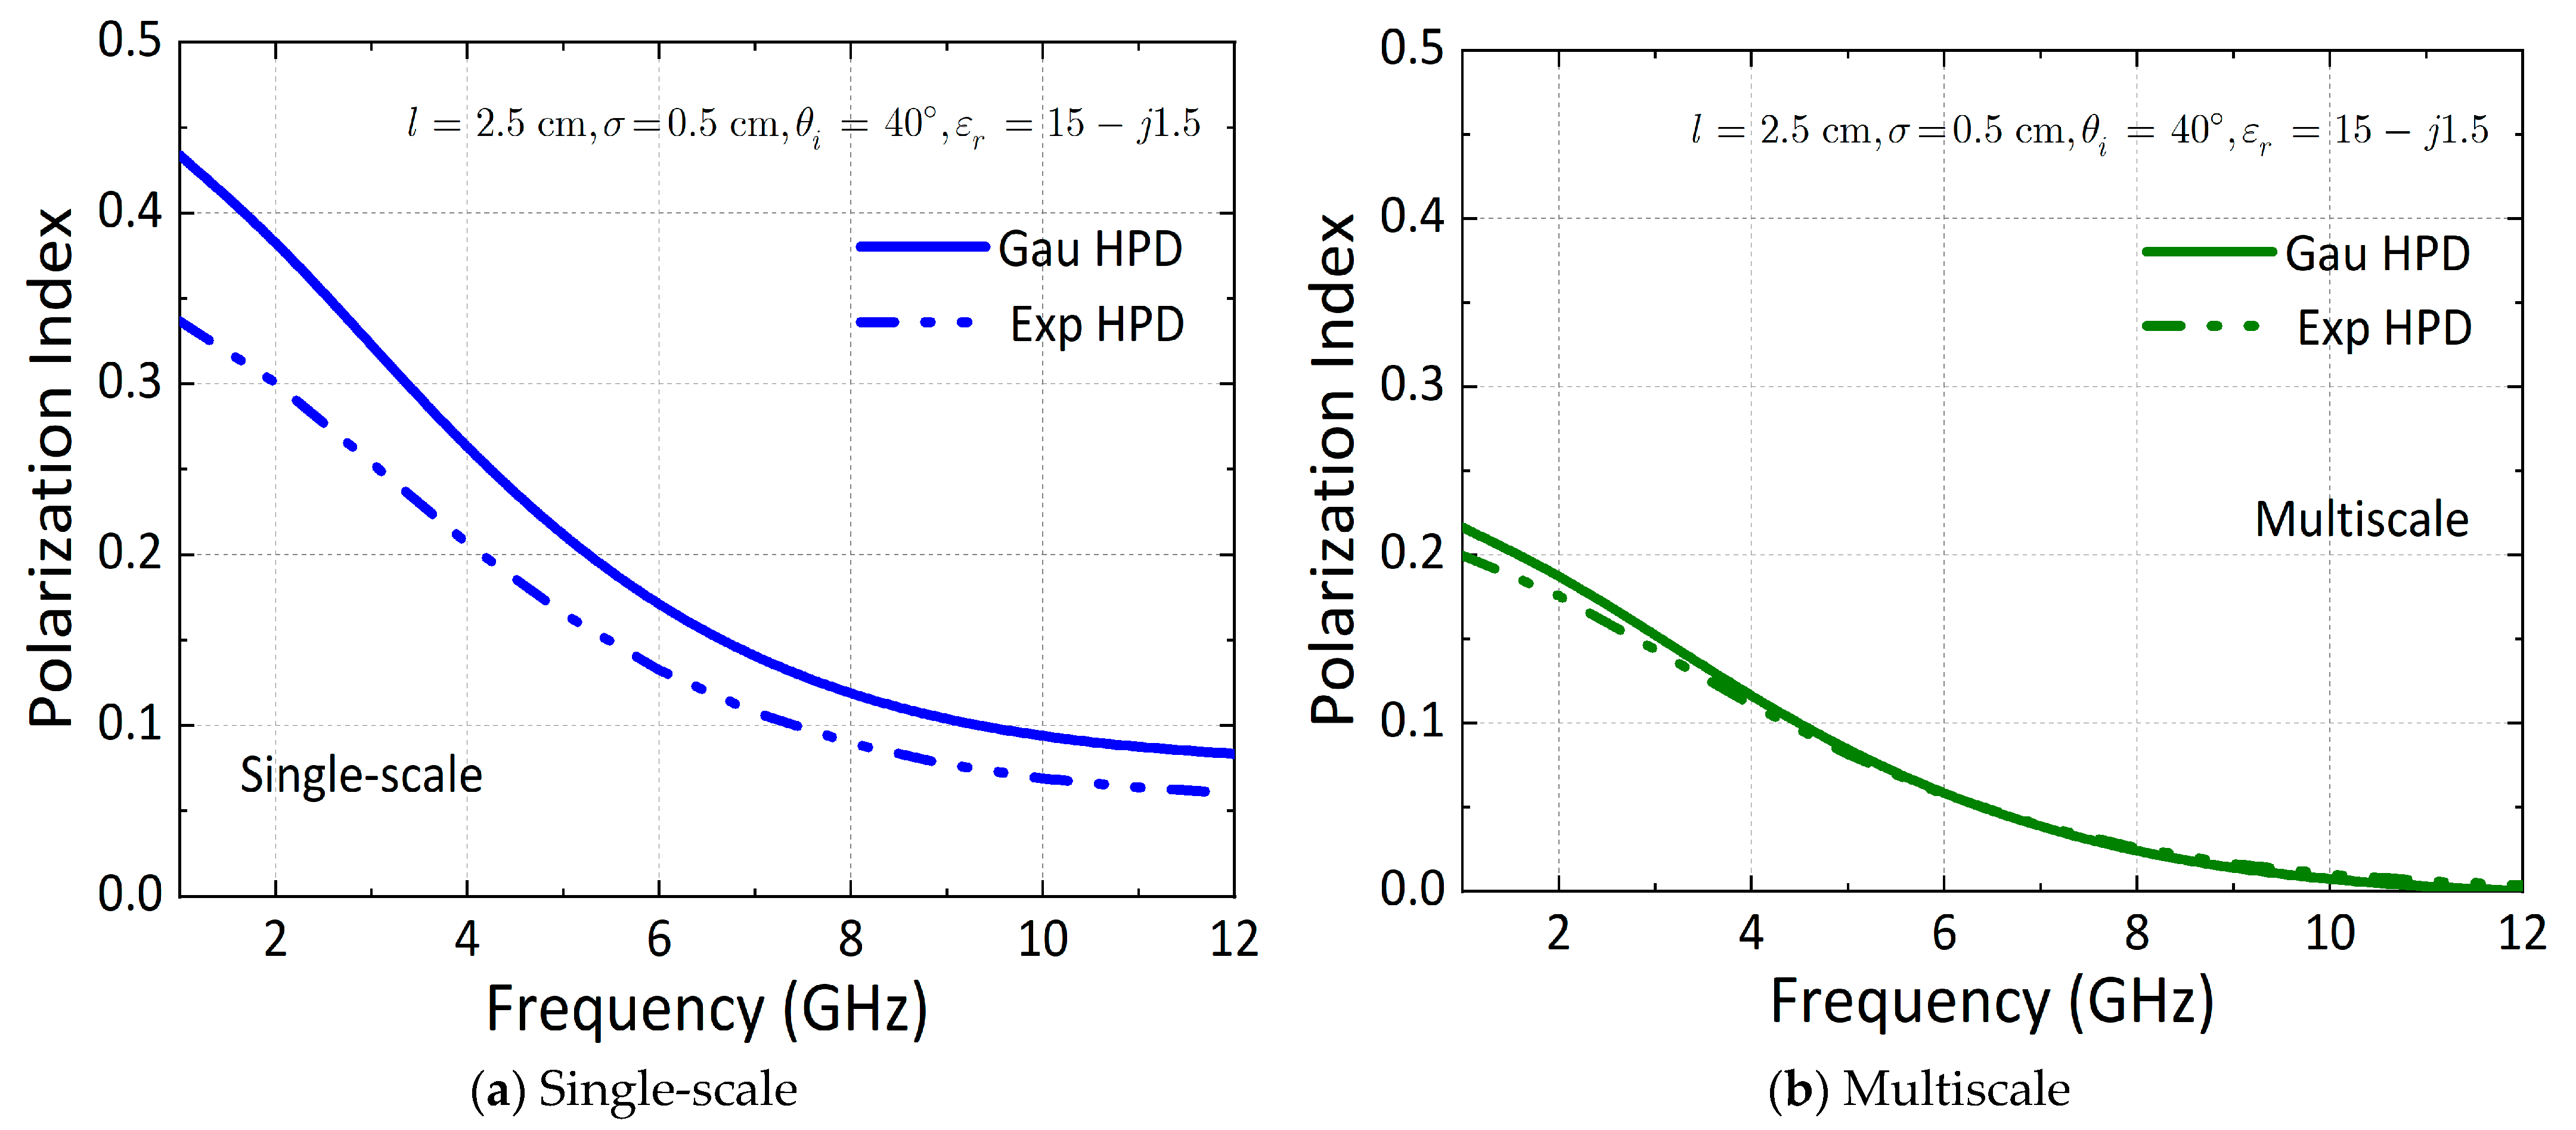
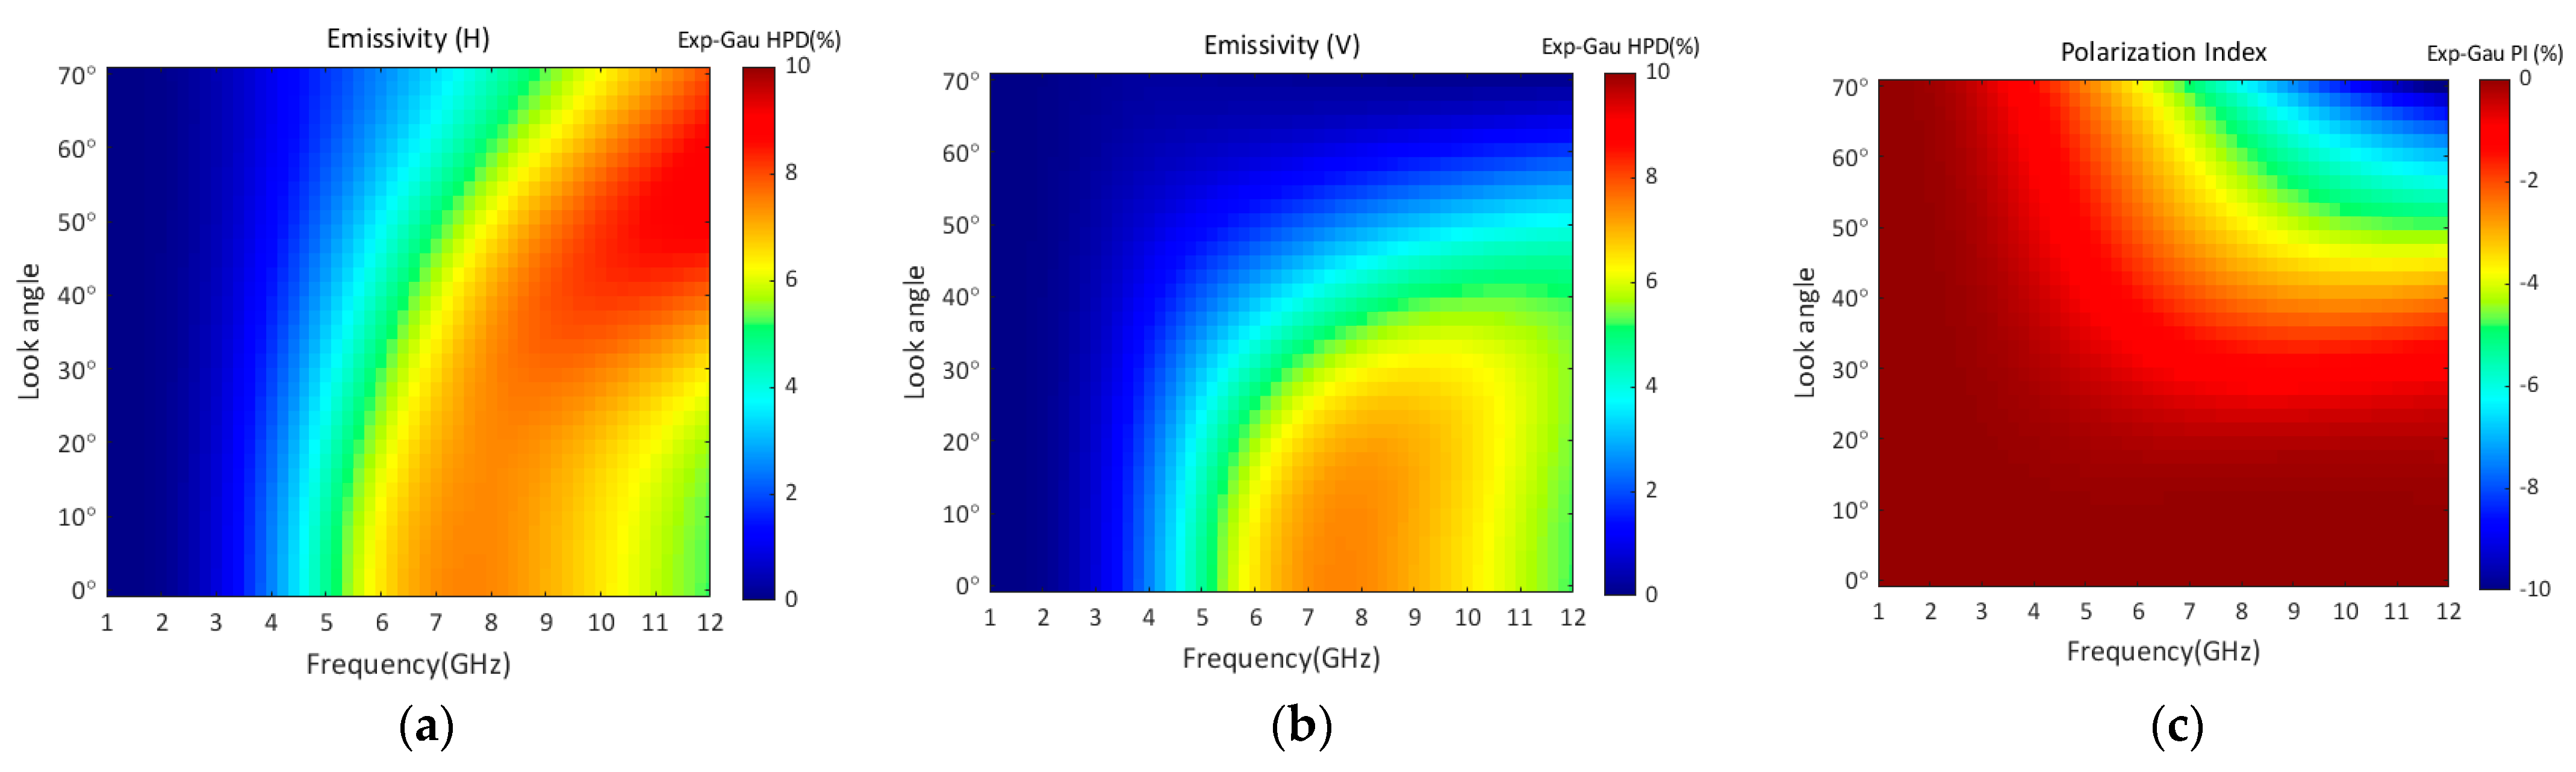
3.1. Non-Gaussian HPD Effect

We examine the non-Gaussian HPD effect by comparing the brightness temperature and PI between Gaussian and exponential HPD rough surface. Here, we illustrate the non-Gaussian HPD effect for single-scale and multiscale surfaces. In this case, the baseband PSD is assumed to be Gaussian. For numerical illustration, we set the surface roughness as k l = 5 ,   k σ = 1 . The dielectric constant is chosen as ε r = 15 j 1.5 , which is the dielectric characteristic of several natural backgrounds (e.g., wet snow-covered field, sandy soil surface and bare soil). The physical temperature is fixed at 270 K. For Gaussian modulated multiscale rough surfaces, the modulation ratio is r m = 0.25 . The non-Gaussian HPD effects on brightness temperature for single-scale and multiscale surfaces are plotted in Figure 3a and Figure 3b respectively. We can see that the H- and V-polarized brightness temperatures vary significantly due to the non-Gaussian HPD effect. That is, the Gaussian assumption for height leads to an emissivity variability.
Figure 4 displays the non-Gaussian HPD effect on the polarization index (PI) of the emissivity at different look angles. Generally, the PI for the exponential HPD rough surface is lower than that for the Gaussian HPD surface, especially at a moderate look angle. This suggests that non-Gaussian HPD reduces the polarization differences of emissivity. This phenomenon can also be clearly observed in Figure 3. Because of the non-Gaussian HPD effect, both the H- and V-polarized emissivities increase. The non-Gaussian HPD causes an increase in H-polarized emissivity greater than that for V polarization.
Next, in Figure 5 and Figure 6, we plot the brightness temperature and PI as a function of frequency (1~12 GHz) between Gaussian and exponential HPD rough surfaces. Similarly, we present the non-Gaussian HPD effect both for single-scale and multiscale surfaces. For numerical illustrations, we selected a look angle of 40°, a correlation length of 2.5 cm, and an RMS height of 0.5 cm. The permittivity was set as 15 − j1.5, and the single scale Gaussian PSD was used. Figure 5 shows that the brightness temperature is enhanced for H and V polarizations due to the non-Gaussian HPD effect, with that for H polarization being even more enhanced. The H-polarized emissivity is more sensitive to the non-Gaussian HPD effect. That is, ignoring non-Gaussian height distribution, the emissivity will be underestimated as a whole. Figure 6 displays the PI in emissivity between Gaussian and exponential HPD rough surfaces to further investigate the polarization diversity of emissivity in frequency. We can see that the PI decreases nonlinearly as the frequency increases. Moreover, the polarization differences are reduced due to non-Gaussian HPD effects. By comparison, the non-Gaussian HPD effect on a single-scale rough surface is significantly higher than that on a multiscale surface.
Figure 7 compares the PI between Gaussian and exponential HPD rough surfaces with three RMS heights. We can note that the non-Gaussian HPD effect on PI is relatively weak at a lower roughness. As the surface roughness increases, the non-Gaussian HPD effect is more significant. In addition, the polarization difference reduces with higher roughness.
To further examine the non-Gaussian HPD effect on the polarized emissivity and polarization index (PI) as a function of sensor parameters, we present their difference patterns varying with look angle and frequency simultaneously for single-scale and multiscale surfaces. In this case, the PSD was set to Gaussian. As a numerical demonstration, with a correlation length of 2.5 cm, an RMS height of 0.5 cm, and a permittivity of 15 − j1.5, we computed H- and V-polarized emissivities as a function of look angle (0–70o) and frequency (1–12 GHz). We notice in Figure 8 that the H- and V-polarized emission patterns are quite different. H polarization’s most significant HPD effect is located at a higher roughness with a moderate look angle. However, V polarization’s most significant HPD effect is found at moderate roughness with small look angles. The H-polarized emissivity is more sensitive to the HPD effect, and the dynamic range of the difference between exponential and Gaussian HPD is 0~10%. This phenomenon suggests that the non-Gaussian HPD effect enhances the H- and V-polarized emission. The non-Gaussian effect reduces the polarization index because the dynamic range shrinks −10~0%. These results suggest that in view of the natural surface’s height statistics, measuring its emission with V polarization at the L band may come with less variability.

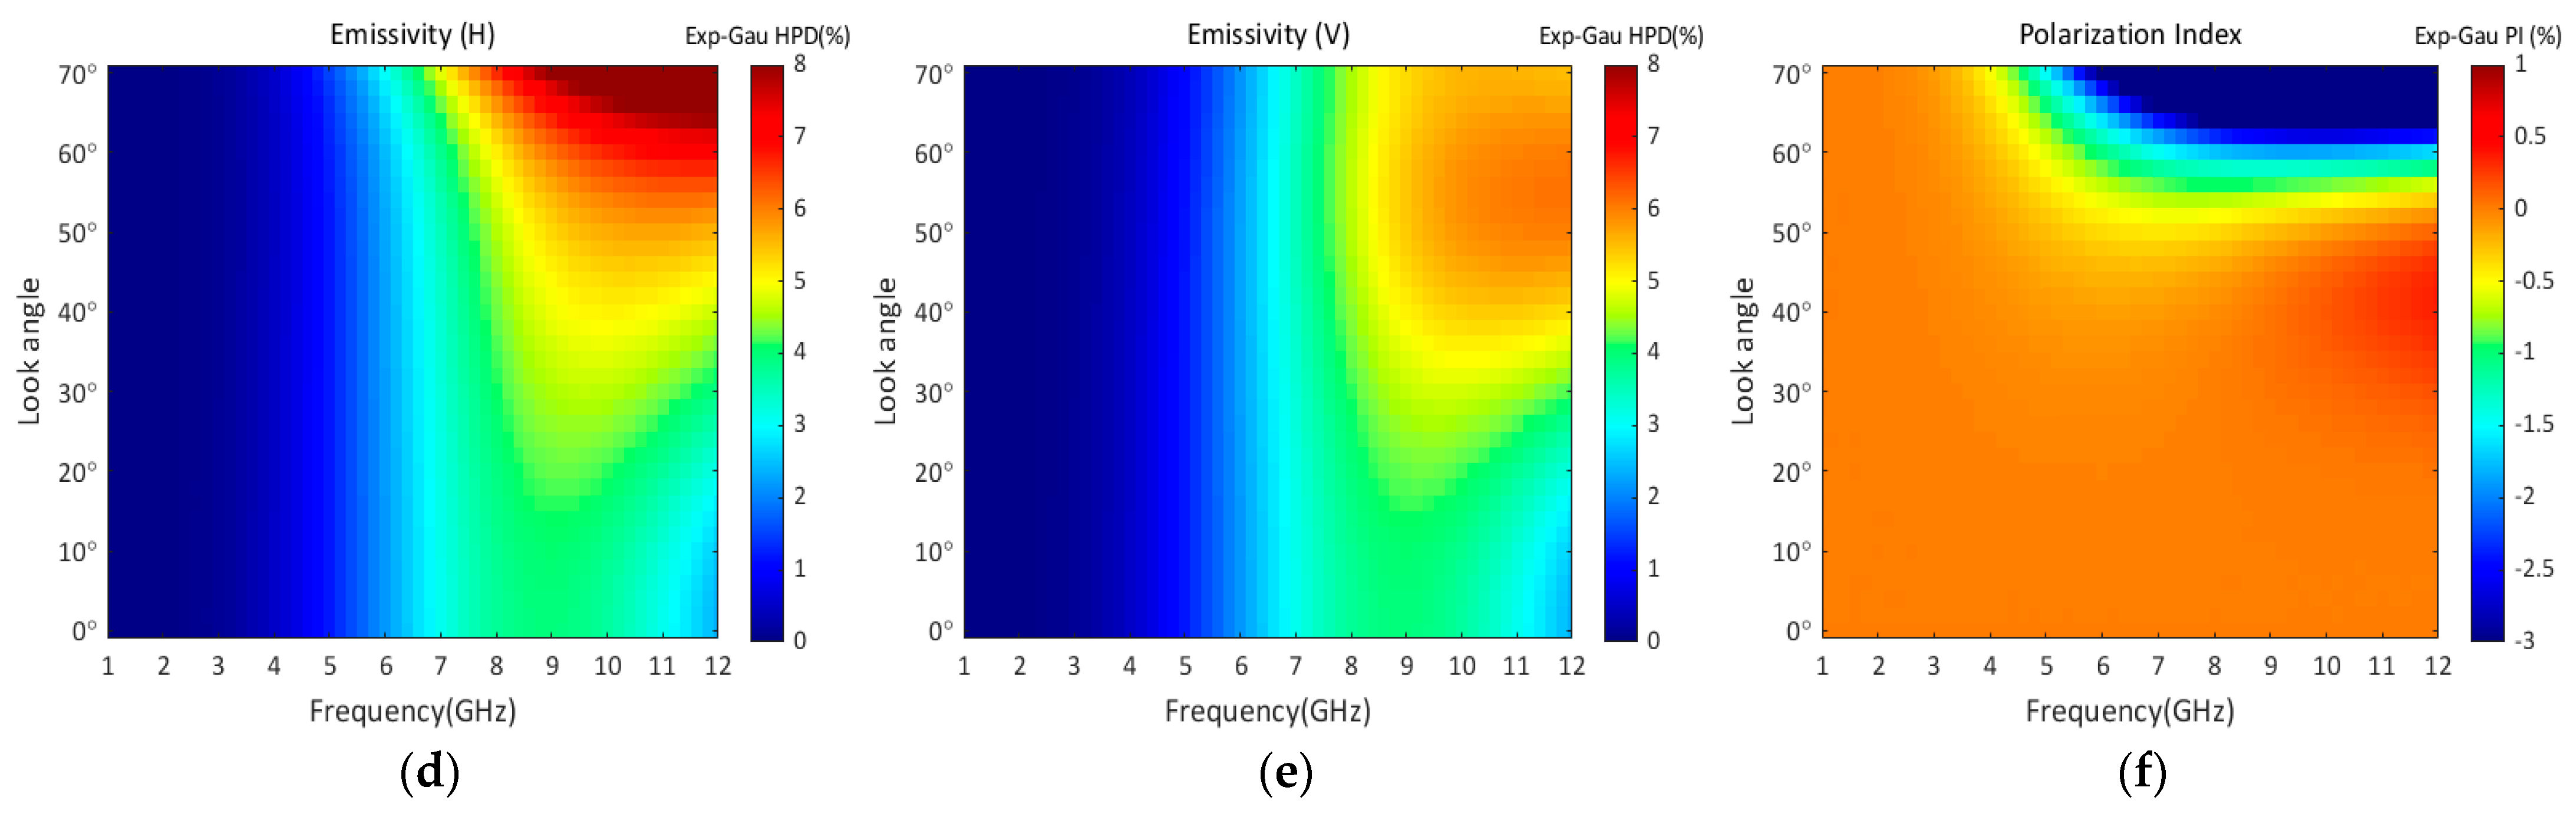
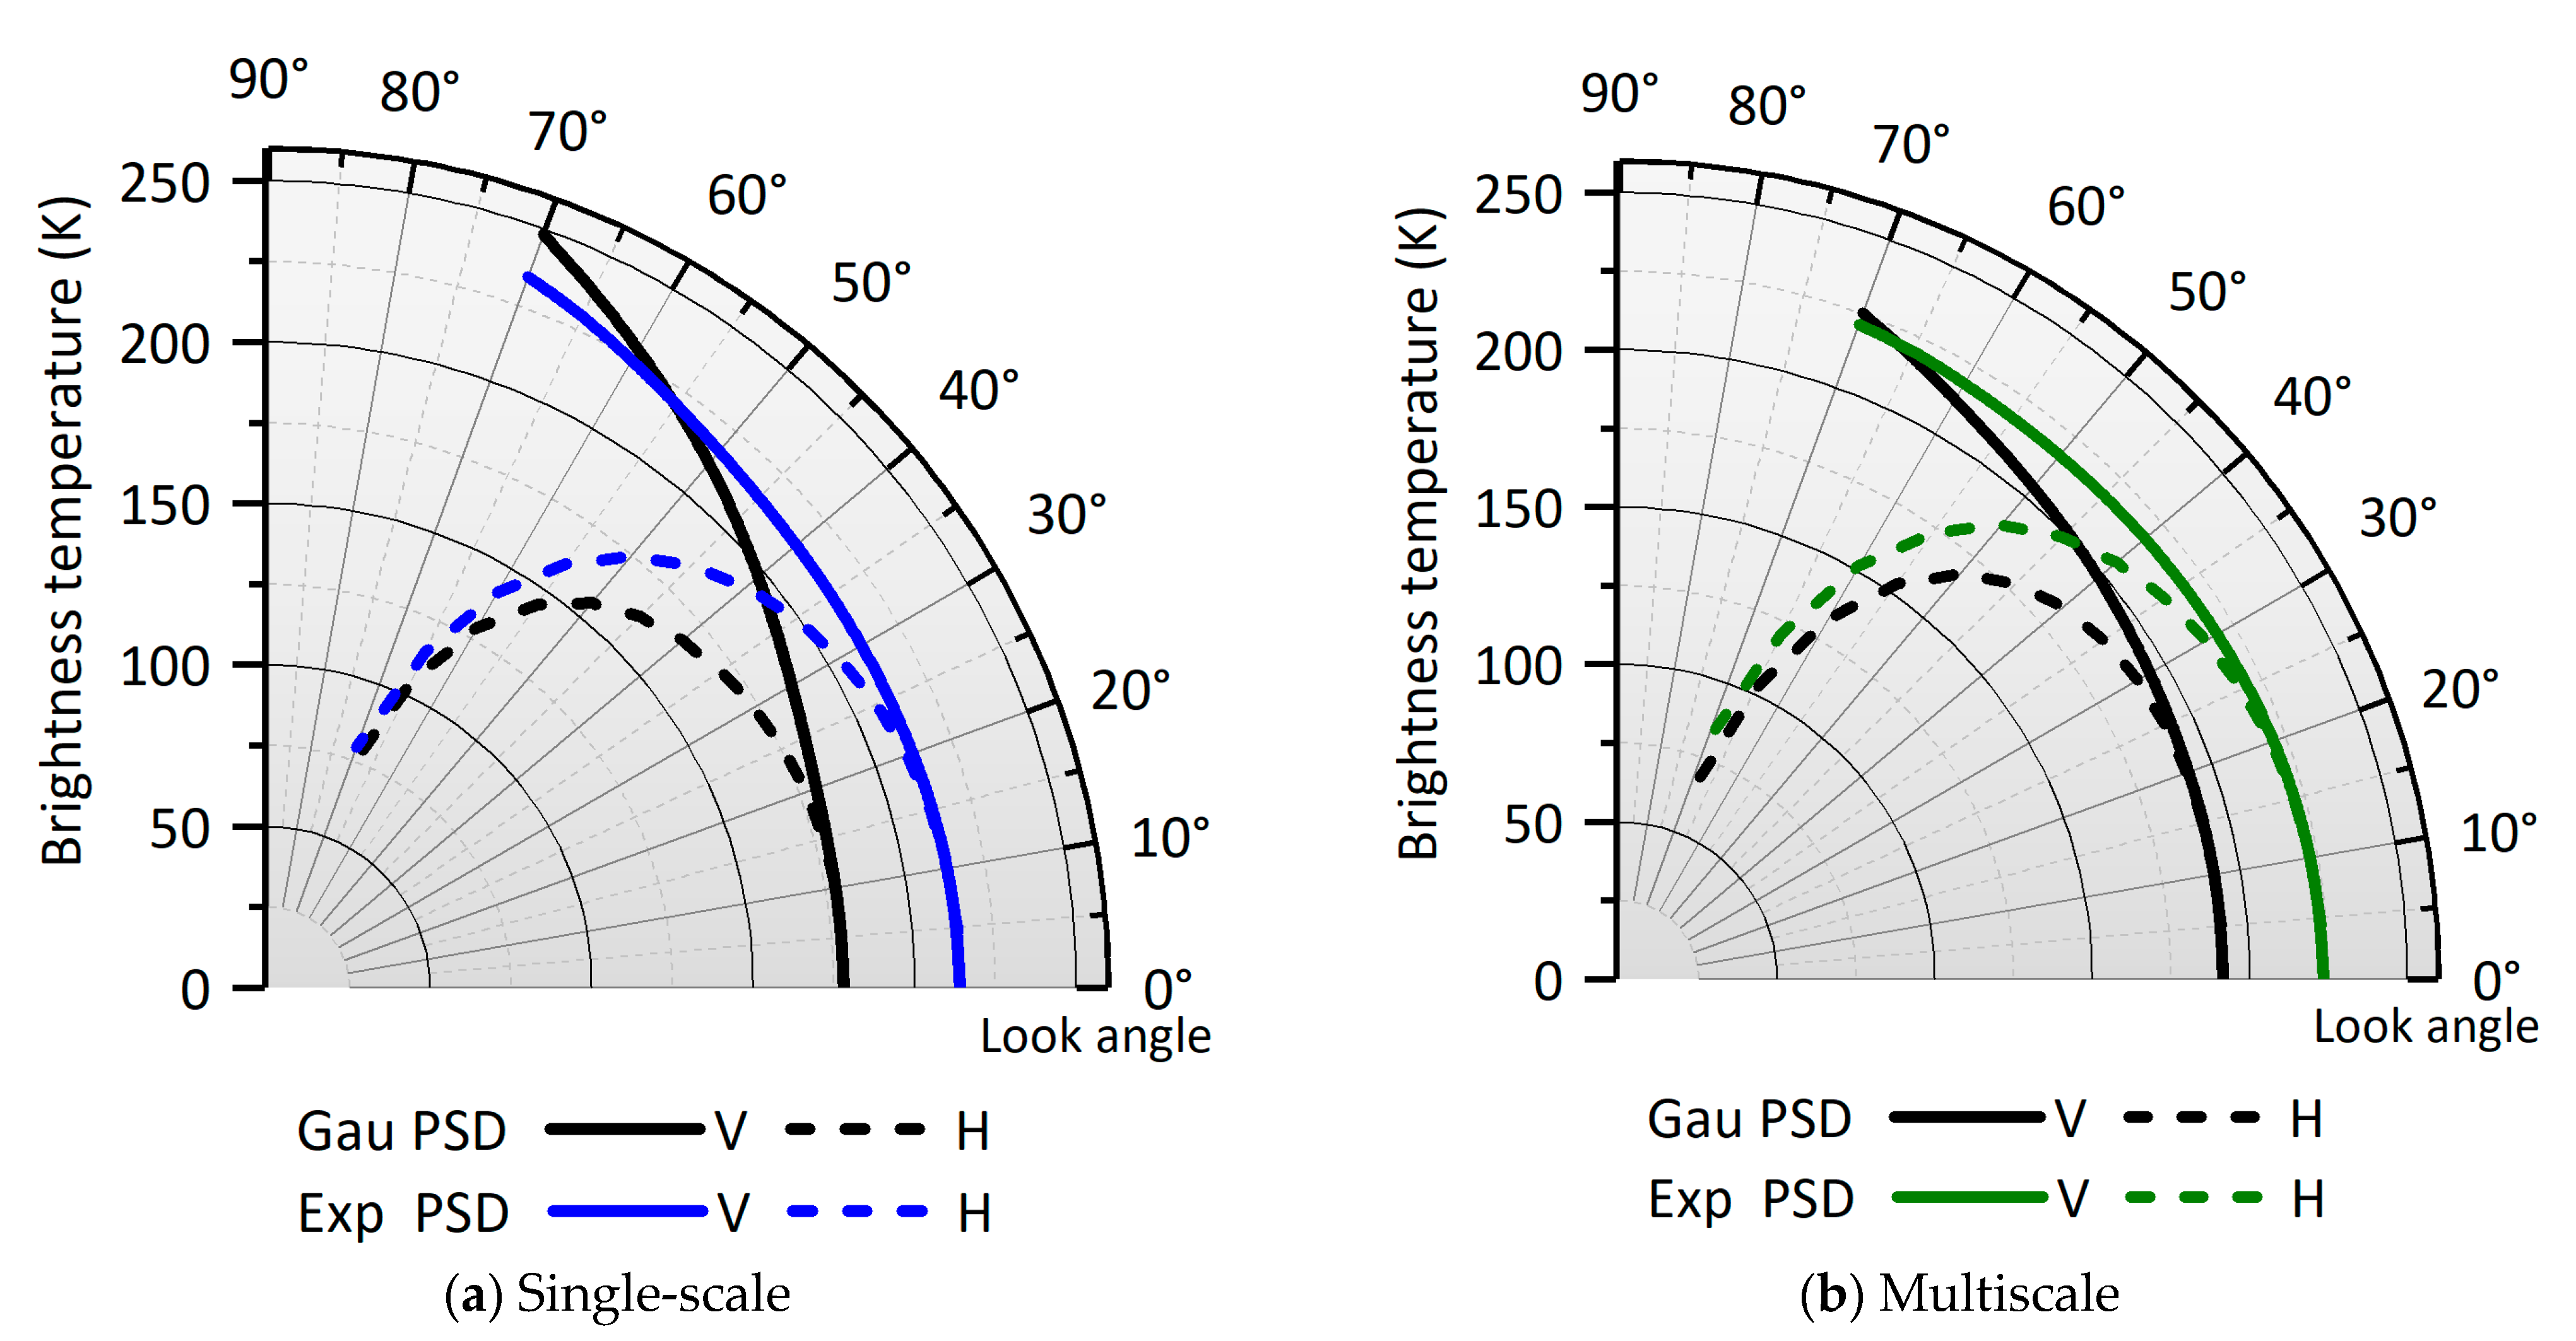
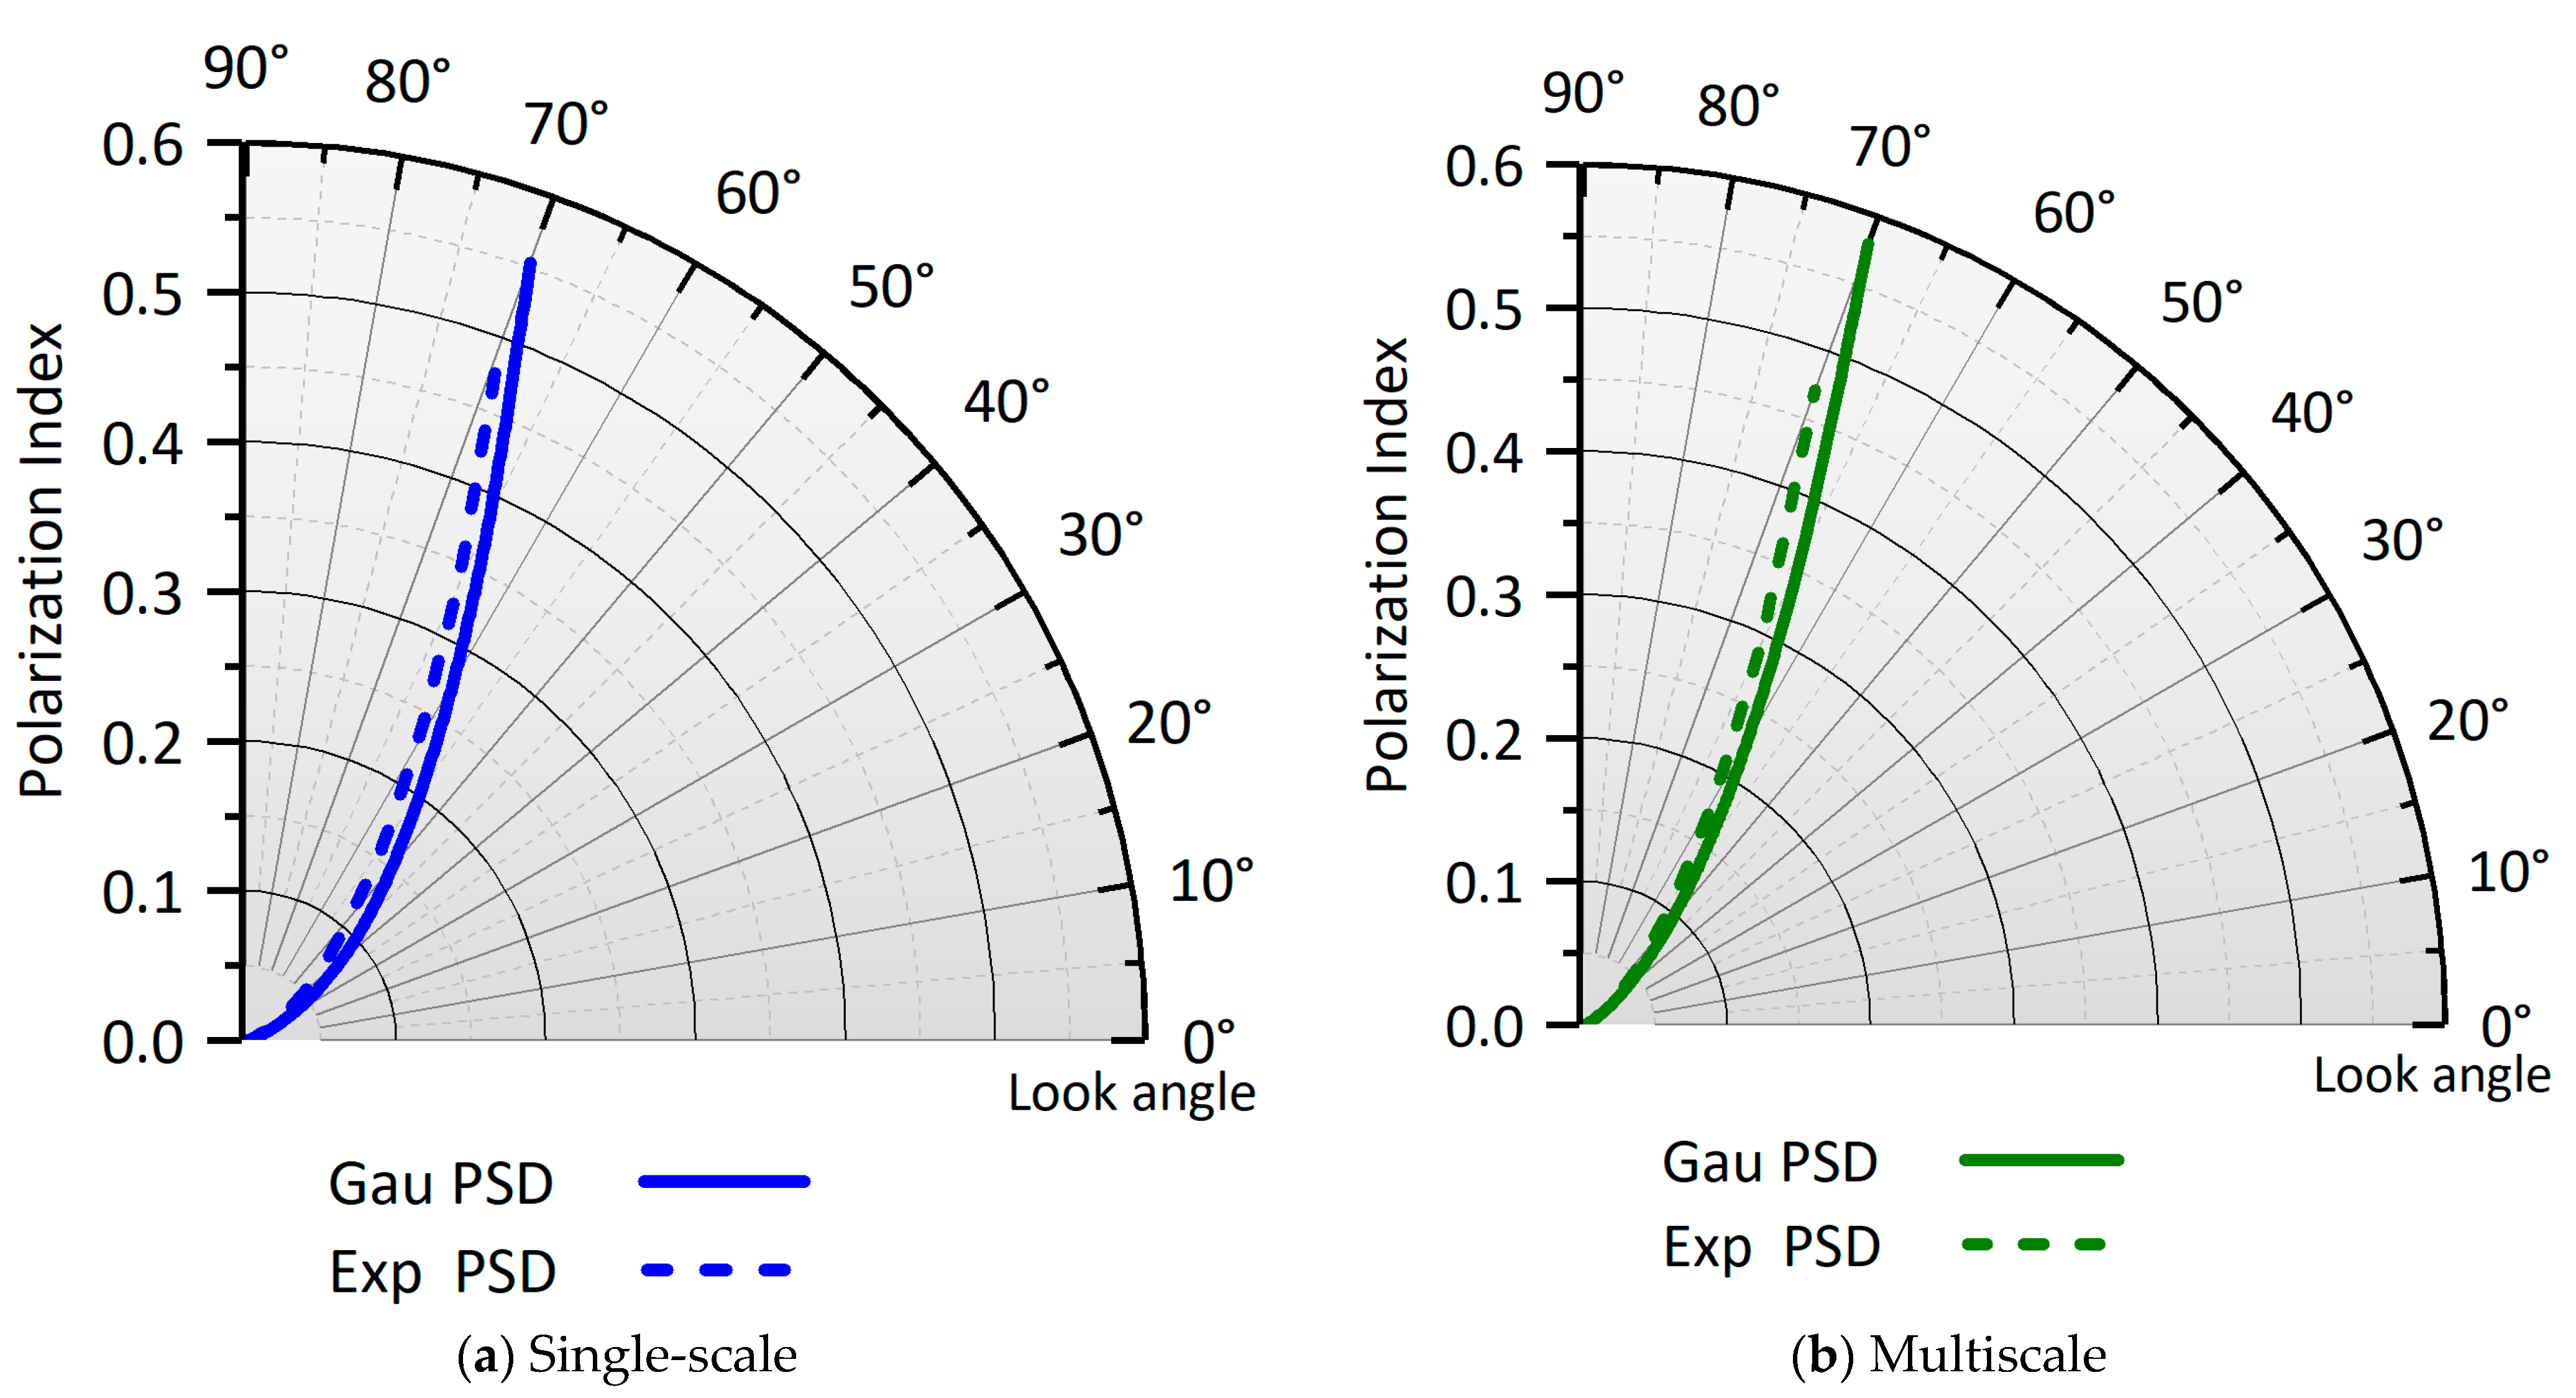
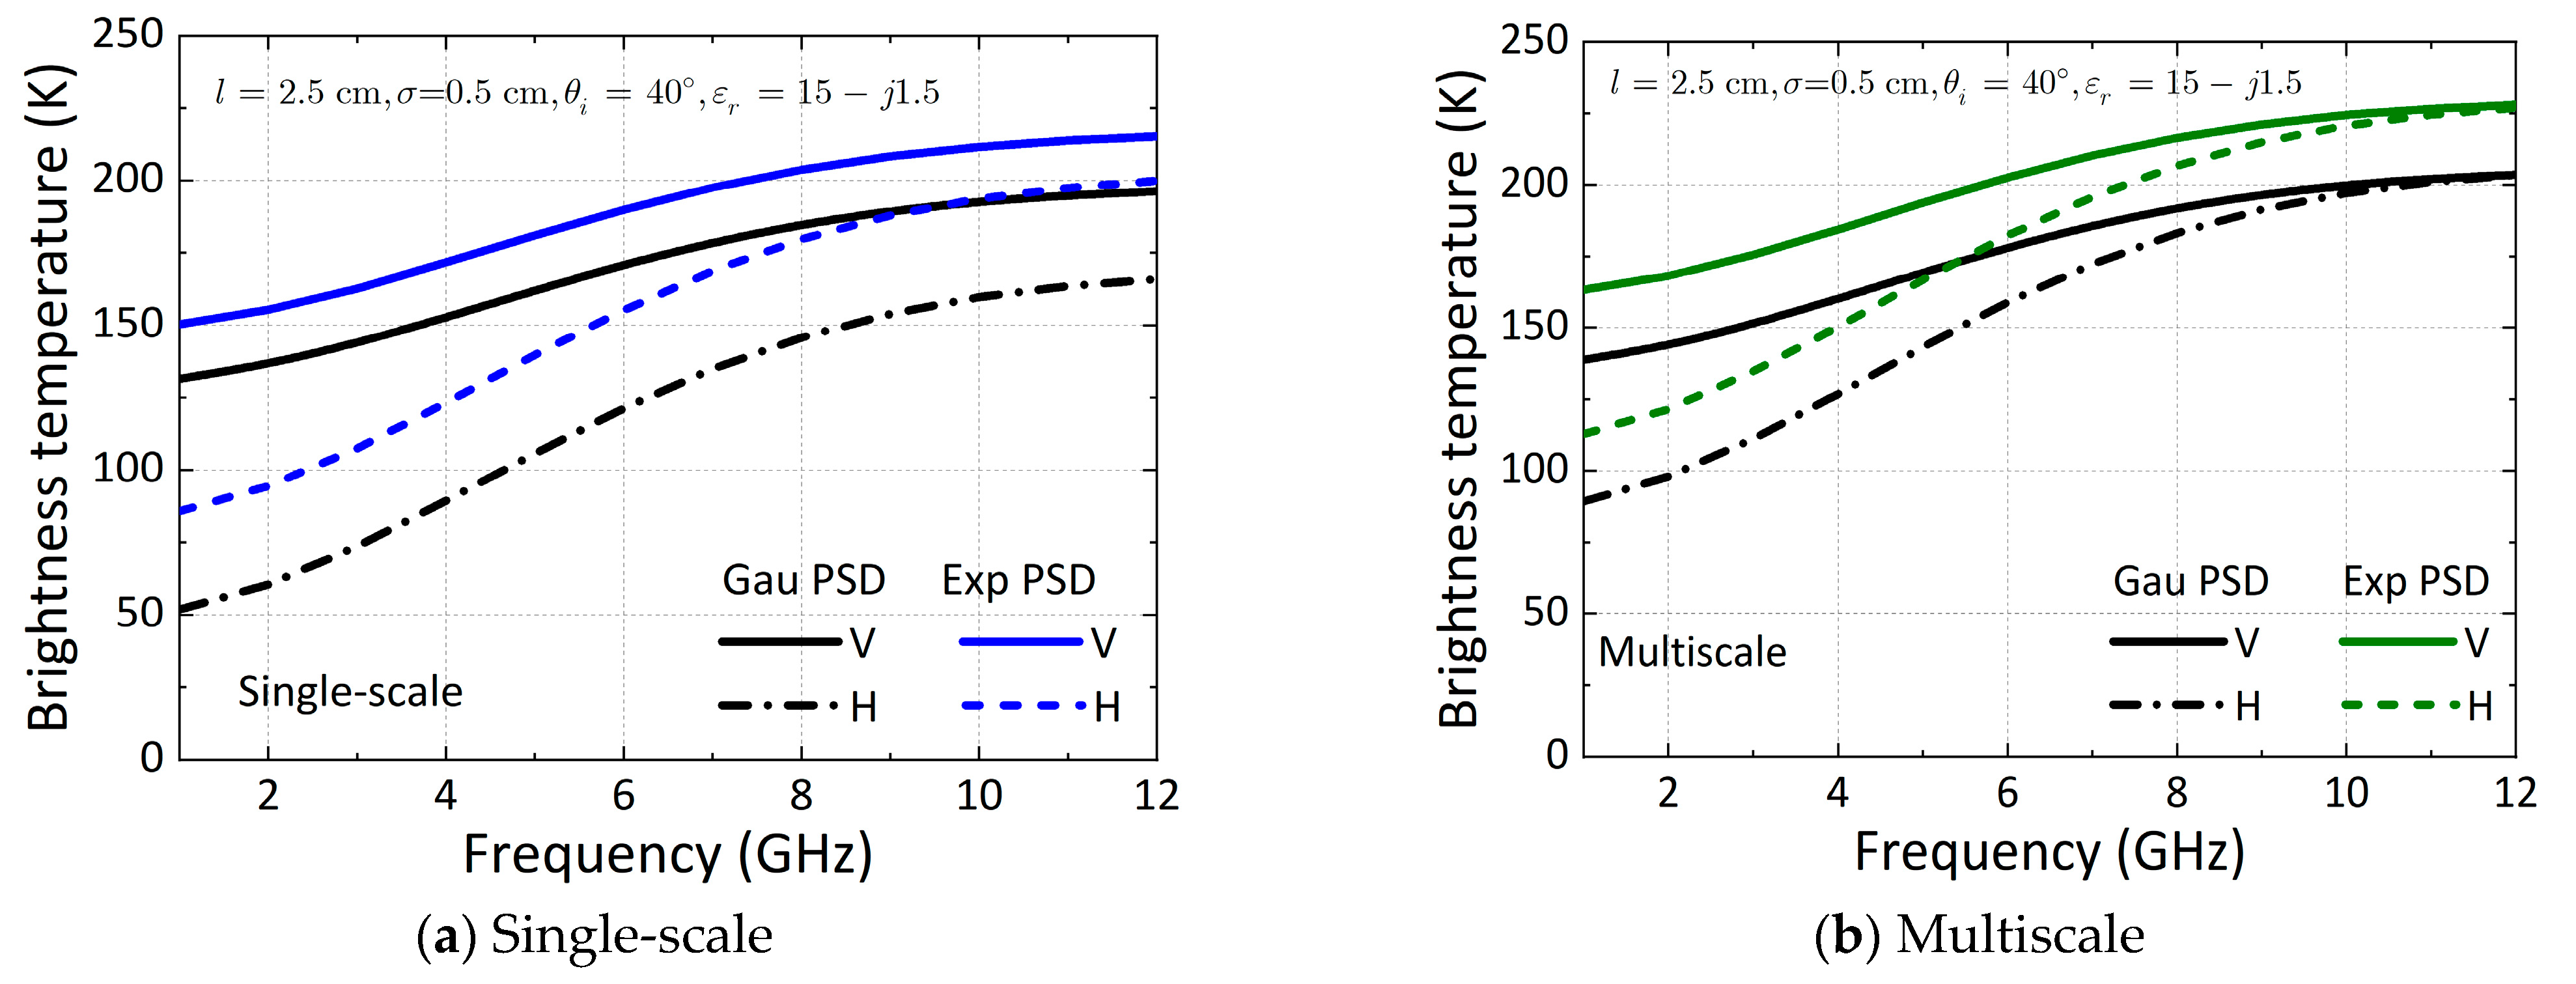
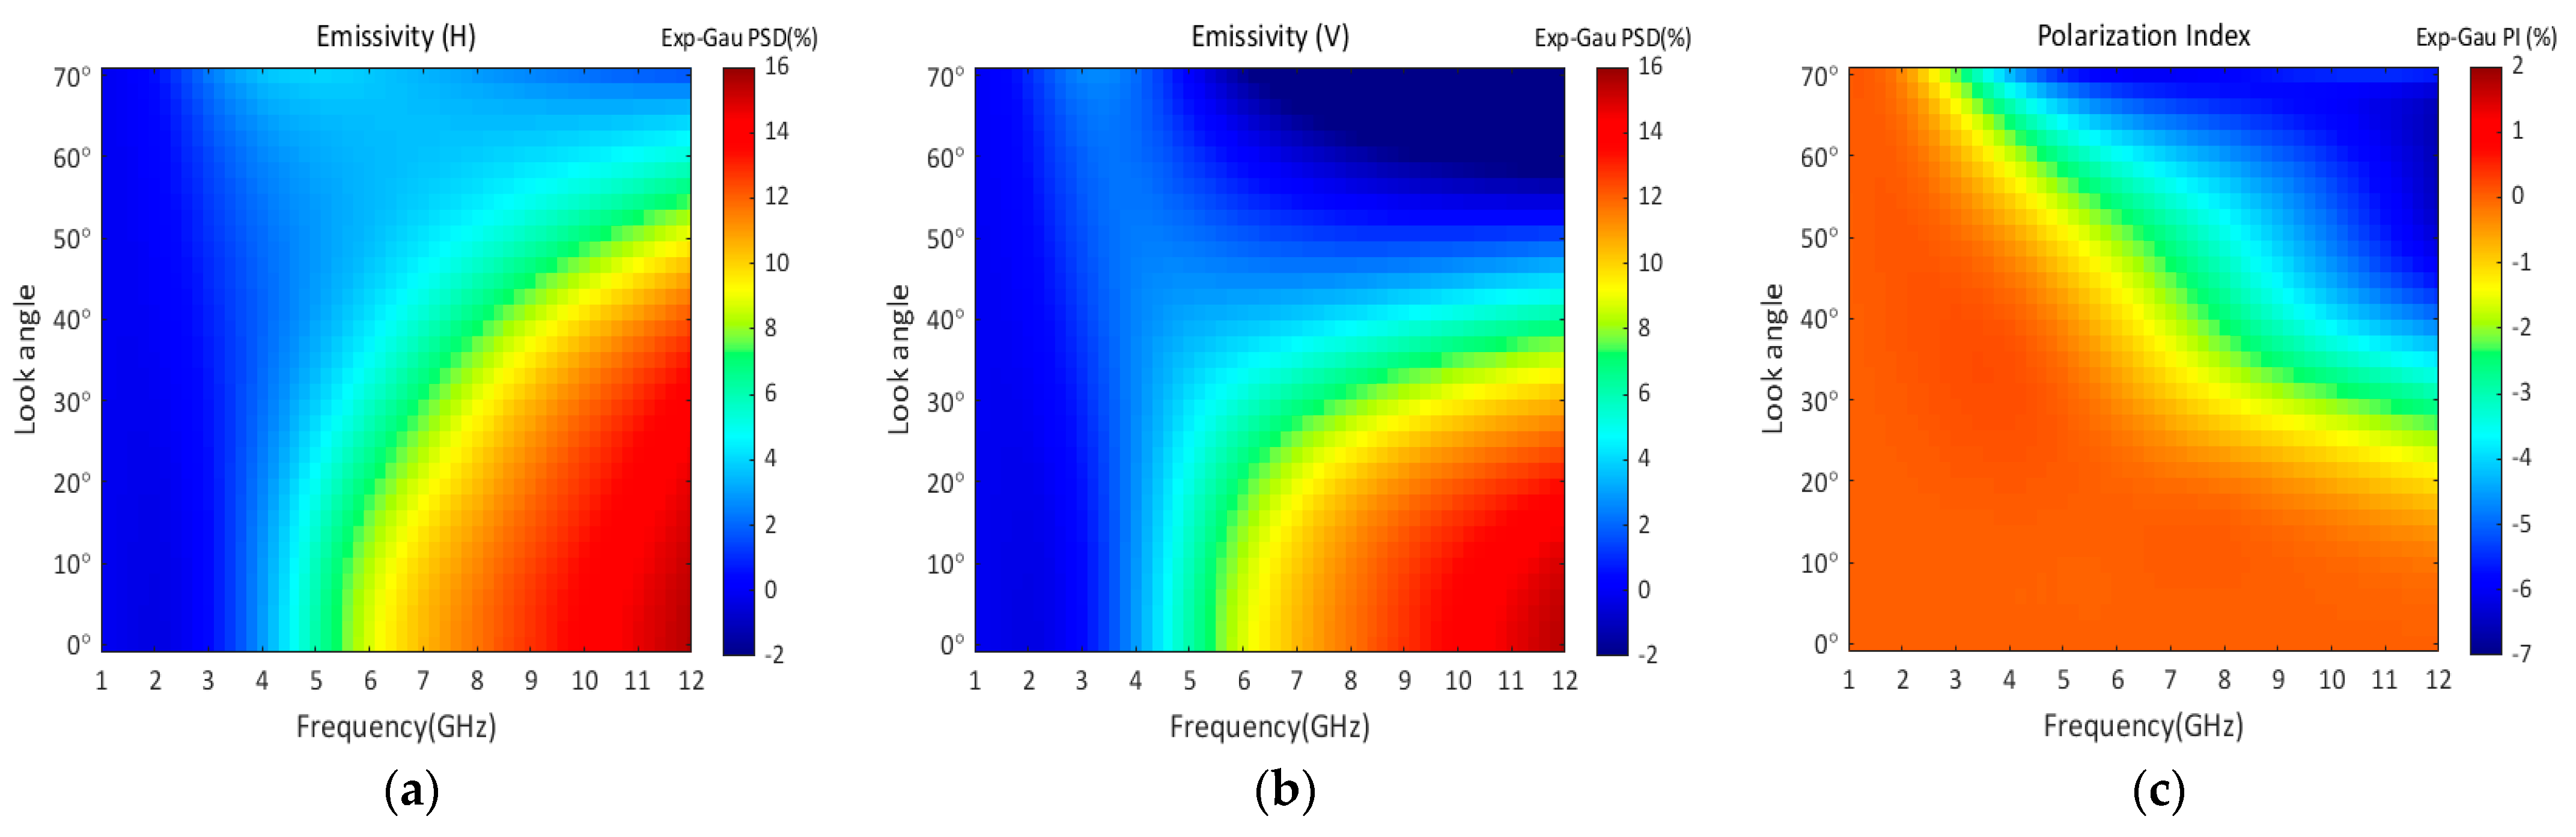
3.2. Non-Gaussian PSD Effect

We examine the non-Gaussian PSD effect by comparing the brightness temperature and PI in Figure 9 and Figure 10. We fix the HPD as Gaussian, and the surface parameters are the same as in Figure 2. As shown in Figure 9, due to the non-Gaussian PSD effect, we see that the H-polarized brightness temperature is enhanced at all look angles. However, the V-polarized brightness temperature is enhanced at small and moderate look angles, but reduced at large look angles. Figure 10 plots the PI of the emissivity between the Gaussian and exponential PSD rough surface at different look angles. The exponential PSD weakens the polarization differences of emissivity at almost all look angles. The non-Gaussian PSD effect on PI is most pronounced at moderate look angles.
As another example, we plot the brightness temperature and PI between Gaussian and exponential PSD rough surfaces with Gaussian HPD. The characteristics of the curves are similar to those in Figure 5. As shown in Figure 11, the H-polarized emissivity is more sensitive to the PSD effect. We also see that the change rate of PI depends on the frequency in Figure 12. As the frequency increases, the polarization difference between H and V polarizations is less affected by the PSD, particularly for multiscale roughness. A silent feature to note is that the PSD effect on the multiscale surface diminishes as the frequency increases; such a feature is not distinguished for a single-scale surface, as suggested in Figure 12.
Figure 13 shows the emissivity and polarization index (PI) between exponential and Gaussian PSD rough surfaces to demonstrate the PSD effect, assuming a Gaussian HPD. By comparison, the dynamic range of the difference caused by non-Gaussian PSD is −2%~16%. Due to the non-Gaussian PSD effect, the emissivity is enhanced at a higher roughness with small look angles but reduced at a lower roughness with large angles. In addition, the PI is close to zero except for the higher roughness with moderate look angles. The results imply that if the non-Gaussian characteristic of the PSD is unknowable, it is feasible to measure the emission with V polarization at the L band under a moderate angle.

4. Conclusions

We investigated the effects of non-Gaussian HPD and PSD on emission as a function of frequency and look angle. The surface roughness parameters (wavenumber × RMS height, wavenumber × correlation length) in terms of probing wavelength in the simulation were selected such that the first-order solution is applicable, for which the simulation results are valid. The results show that non-Gaussian distributed rough surfaces’ H- and V-polarized brightness temperatures deviate significantly from the Gaussian ones. The results indicate that the non-Gaussian HPD enhances both the H- and V-polarized emission. The Gaussian assumption for height leads to an underestimation of the emissivity. V-polarized emissivity is less sensitive to the effects of non-Gaussian HPD and PSD than H-polarized emissivity. Due to the non-Gaussian PSD effect, the emissions are enhanced at a high roughness with small look angles but reduced for smooth surfaces at large look angles. As the surface roughness increases, the non-Gaussian HPD effect is more significant. Non-Gaussian HPD and PSD effects weaken the polarization difference, particularly at high roughness with a large look angle. The results imply that if the non-Gaussian statistics of the HPD and PSD are unknown, it is feasible to measure the emission with V polarization under a moderate angle. We can conclude that a small percentage of emission difference due to the non-Gaussian effects solely may contaminate the geophysical parameters from the observed emissivity. The model study shows that the non-Gaussian HPD and PSD effects induce disturbed and non-negligible microwave emission variability from a rough surface.

Author Contributions

Conceptualization, K.-S.C.; methodology, K.-S.C. and Y.Y.; software, Y.Y.; validation, K.-S.C. and Y.Y.; formal analysis, K.-S.C. and Y.Y.; investigation, K.-S.C. and Y.Y.; resources, Y.Y.; data curation, Y.Y.; writing—original draft preparation, K.-S.C. and Y.Y.; writing—review and editing, K.-S.C. and Y.Y.; visualization, Y.Y.; supervision, K.-S.C.; project administration, K.-S.C.; funding acquisition, K.-S.C. All authors have read and agreed to the published version of the manuscript.

Funding

This work was supported by the National Natural Science Foundation of China under Grant NO. 42201352, and the Fundamental Research Funds for the Central Universities No. 30922010311.

Data Availability Statement

Not applicable.

Conflicts of Interest

The authors declare no conflict of interest.

Appendix A

Derivation of the Bivariate HPD Given in Equations (14) and (15)
As depicted in Equations (A1) and (A2), the univariates of Gaussian and exponential distributions are:
p g ( ζ ) = 1 2 π σ e ζ 2 / 2 σ 2
p e ( ζ ) = 1 σ exp ζ σ ,   ζ 0
Let x and y be identically distributed random variables with a given probability density p ( ζ ) and given correlation coefficient ρ , and let x and y be independent for ρ = 0 .
If p ( ζ ) is proportional to the weighting function of one of the standard classical systems of orthogonal polynomials { Q n }, then the bivariate distribution is given by [19]
p ( x , y ; ρ ) = p ( x ) p ( y ) n = 0 ρ n h n 2 Q n ( x ) Q n ( y )
with
a b p ( ζ ) Q n ( ζ ) Q m ( ζ ) d ζ = 0 , n m h n 2 , n = m
where a and b are the (finite or infinite) bounds of p ( ζ ) . The assumption of his theorem is that ρ = 0 implies independence, which in general is not true. Indeed, it is just the reverse, namely, for x and y being independent, it is true that ρ = 0 .
(1) 
For Gaussian distribution
According to [19], the Hermite polynomials H n ( x ) are defined by the following condition:
e x 2 H n ( x ) H m ( x ) d x = π 1 2 2 n n ! δ n m
Setting x = x 2 2 σ 2 ,   y = y 2 2 σ 2 , Equation (A5) can be changed to
1 2 π σ e x 2 / 2 σ 2 H n ( x 2 σ ) H m ( x 2 σ ) d x = 2 n n ! δ n m
The weighting functions of Hermite polynomials is of the form
p ( x ) = 1 2 π σ e x 2 / 2 σ 2
For Gaussian distribution, the bivariate distribution is
p ( x , y ) = 1 2 π σ 2 e ( x 2 + y 2 ) / 2 σ 2 n = 0 ρ n 2 n n ! H n ( x 2 σ ) H n ( y 2 σ )
According to the theorem
n = 0 H n ( x ) H n ( y ) s n 2 n n ! = 1 1 s 2 exp 2 x y s s 2 x 2 s 2 y 2 1 s 2
we obtain the bivariate distribution
p g ( ζ , ζ ) = 1 2 π σ 2 1 ρ 2 exp ζ 2 2 ρ ζ ζ + ζ 2 2 σ 2 1 ρ 2
where σ is the RMS height and ρ is the correlation function.
(2) 
For exponential distribution
From [19], the Laguerre polynomials L n α ( x ) ,   α > 1 are defined by the following condition of orthogonality and normalization:
0 e x x α L n α x L m α x d x = Γ ( α + 1 ) n + α       n δ n m
The weighting functions of Laguerre polynomials is of the form
p ( x ) = C x μ e x , μ > 1 ,   0 ζ <
For exponential distribution, the bivariate distribution is
p ( x , y ) = 1 σ 2 e ( x + y ) / σ n = 0 ρ n L n ( x σ ) L n ( y σ )
The theorem is given as [19]
n = 0 n + α n 1 L n ( α ) ( x ) L n ( α ) ( y ) ρ n = Γ ( α + 1 ) ( 1 ρ ) 1 exp ( x + y ) ρ 1 ρ ( x y ρ ) α / 2 J α 2 ( x y ρ ) 1 / 2 1 ρ
Setting α = 0 and noting L n ( 0 ) ( x ) = L n ( x ) , the bivariate distribution of Equation (A13) is yielded
p e ( ζ , ζ ) = 1 σ 2 ( 1 ρ ) exp ζ + ζ σ ( 1 ρ ) I 0 2 ρ ζ ζ σ ( 1 ρ )
where σ is the RMS height, ρ is the correlation function, and I 0 is the zeroth-order modified Bessel function.

References

  1. Huang, N.E.; Long, S.R.; Tung, C.-C.; Yuan, Y.; Bliven, L.F. A non-Gaussian statistical model for surface elevation of nonlinear random wave fields. J. Geophys. Res. 1983, 88, 7597. [Google Scholar] [CrossRef]
  2. Beckers, J.F.; Renner, A.H.; Spreen, G.; Gerland, S.; Haas, C. Sea-ice surface roughness estimates from airborne laser scanner and laser altimeter observations in Fram Strait and north of Svalbard. Ann. Glaciol. 2015, 56, 235–244. [Google Scholar] [CrossRef]
  3. Beckmann, P.; Spizzichino, A. The Scattering of Electromagnetic Waves from Rough Surfaces; MacMillan: New York, NY, USA, 1963. [Google Scholar]
  4. Ulaby, F.T.; Moore, R.K.; Fung, A.K. Microwave Remote Sensing; Volume 2: Radar Remote Sensing and Surface Scattering and Emission Theory; Artech House: Norwood, MA, USA, 1982. [Google Scholar]
  5. Tsang, L.; Kong, J.A.; Shin, R.T. Theory of Microwave Remote Sensing; Wiely: Hoboken, NJ, USA, 1985. [Google Scholar]
  6. Sanamzadeh, M.; Tsang, L.; Johnson, J. Scattering and emission of electromagnetic waves from random layered media with random rough interfaces: A partially coherent cascading approach. IEEE Trans. Antenn. Propag. 2020, 68, 3094–3102. [Google Scholar] [CrossRef]
  7. Beckmann, P. Scattering by non-Gaussian surfaces. IEEE Trans. Antenn. Propag. 1973, 21, 169–175. [Google Scholar] [CrossRef]
  8. Brown, G.S. A theory for near-normal incidence microwave scattering from first-year sea ice. Radio Sci. 1982, 17, 233–243. [Google Scholar] [CrossRef]
  9. Eom, H.J.; Fung, A.K. A Comparison between backscattering coefficients using Gaussian and non-Gaussian surface statistics. IEEE Trans. Antenn. Propag. 1983, 31, 635–638. [Google Scholar] [CrossRef]
  10. Fung, A.K.; Chen, K.S. Kirchhoff Model for a Skewed Random Surface. J. Electromagn. Waves Appl. 1991, 5, 205–216. [Google Scholar] [CrossRef]
  11. Chen, K.S.; Fung, A.K.; Amar, F. An empirical bispectrum model for sea surface scattering. IEEE Trans. Geosci. Remote Sens. 1993, 31, 830–835. [Google Scholar] [CrossRef]
  12. Wu, S.C.; Chen, M.F.; Fung, A.K. Scattering from non-Gaussian randomly rough surfaces-cylindrical case. IEEE Trans. Geosci. Remote Sens. 1988, 26, 790–798. [Google Scholar] [CrossRef]
  13. Yang, Y.; Chen, K.S.; Wang, S. Bistatic radar scattering from non-Gaussian height distributed rough surfaces. Remote Sens. 2022, 18, 4457–4461. [Google Scholar] [CrossRef]
  14. Stephen, H.; Long, D.G. Modeling microwave emissions of erg surfaces in the Sahara Desert. IEEE Trans. Geosci. Remote Sens. 2005, 12, 2822–2830. [Google Scholar] [CrossRef]
  15. Yueh, S.H.; Chaubell, J. Sea surface salinity and wind retrieval using combined passive and active L-band microwave observations. IEEE Trans. Geosci. Remote Sens. 2012, 50, 1022–1032. [Google Scholar] [CrossRef]
  16. Njoku, E.G.; Chan, S. Comprehensive Remote Sensing. In Water Cycle Components over Land; Liang, S., Ed.; Elsevier: Amsterdam, The Netherland, 2018. [Google Scholar]
  17. Yang, Y.; Chen, K.S.; Ren, C. Radar Scattering from a Modulated Rough Surface: Simulations and Applications. IEEE Trans. Geosci. Remote Sens. 2021, 59, 9842–9850. [Google Scholar] [CrossRef]
  18. Chen, K.S. Radar Scattering and Imaging of Rough Surface: Modeling and Applications with MATLAB®; CRC Press: Boca Raton, FL, USA, 2020. [Google Scholar]
  19. Szego, G. Orthogonal Polynomials; Colloquium Publications; American Mathematical Society Press: Providence, RI, USA, 1939; Volume XXIII. [Google Scholar]
Figure 1. Samples of computer-generated rough surfaces with different height probability densities (HPD). The power spectral density is exponential. (a) Gaussian HPD. (b) Exponential HPD.
Remotesensing 15 03297 g001
Figure 2. Geometry of wave scattering and emission from a rough surface ζ x , y . (a) Scattering problem. (b) Emission problem.
Remotesensing 15 03297 g002
Figure 3. Comparison of the brightness temperature between Gaussian and exponential HPD rough surfaces. The related parameters are k l = 5 ,   k σ = 1 ,   ε r = 15 j 1.5 . (a) Gaussian-correlated single-scale surface and (b) Gaussian-modulated multiscale rough surface r m = 0.25 ,   k l e = 3.43 .
Remotesensing 15 03297 g003
Figure 4. Multiscale non-Gaussian HPD’s effect on the polarization index. The related parameters are k l = 5 ,   k σ = 1 ,   ε r = 15 j 1.5 .
Remotesensing 15 03297 g004
Figure 5. Comparison of the brightness temperature as a function of frequency between Gaussian and exponential HPD rough surfaces from (a) a Gaussian-correlated single-scale surface and (b) a Gaussian-modulated multiscale rough surface r m = 0.5 ,   l e = 1.11   cm . The related parameters are l = 2.5   cm ,   σ =   0.5   cm ,   ε r = 15 j 1.5 ,   θ i = 40 .
Remotesensing 15 03297 g005
Figure 6. Comparison of the PI as a function of frequency between Gaussian and exponential HPD rough surfaces from (a) a Gaussian-correlated single-scale surface and (b) a Gaussian-modulated multiscale rough surface.
Remotesensing 15 03297 g006
Figure 7. Comparison of the PI between Gaussian and exponential HPD rough surfaces with three RMS heights k σ = 0.5 ,   1.0 ,   1.5 . (a) Gaussian PSD. (b) Exponential PSD.
Remotesensing 15 03297 g007
Figure 8. Non-Gaussian HPD effect on polarization index (PI) as a function of sensor parameters (look angle and frequency) at l = 2.5   cm ,   σ = 0.5   cm ,   ε r = 15 j 1.5 . (ac) Single-scale rough surfaces. (df) Multiscale rough surfaces ( r m = 0.5 ). (a,d) H-polarized emissivity. (b,e) V-polarized emissivity. (c,f) Polarization index (PI).
Remotesensing 15 03297 g008aRemotesensing 15 03297 g008b
Figure 9. Comparison of the brightness temperature as a function of look angle between Gaussian and exponential baseband PSD rough surfaces with Gaussian HPD. (a) Single-scale surface. (b) Multiscale rough surface r m = 0.25 ,   k l e = 3.43 . The surface parameters are k l = 5 ,   k σ = 1 ,   ε r = 15 j 1.5 .
Remotesensing 15 03297 g009
Figure 10. Comparison of the PI of look angle between Gaussian and exponential baseband PSD rough surfaces with Gaussian HPD. (a) Single-scale surface. (b) Multiscale rough surface with r m = 0.25 ,   k l e = 3.43 , k l = 5 ,   k σ = 1 ,   ε r = 15 j 1.5 .
Remotesensing 15 03297 g010
Figure 11. Comparison of the brightness temperature as a function of frequency between Gaussian and exponential baseband PSD rough surfaces with Gaussian HPD. (a) Single-scale surface (b) Multiscale rough surface r m = 0.5 ,   l e = 1.11   cm . The surface parameters are l = 2.5   cm ,   σ =   0.5   cm ,   ε r = 15 j 1.5 ,   θ i = 40 .
Remotesensing 15 03297 g011
Figure 12. Comparison of the PI as a function of frequency between Gaussian and exponential baseband PSD rough surfaces with Gaussian HPD. (a) Single-scale surface (b) Multiscale rough surface r m = 0.5 ,   l e = 1.11   cm .
Remotesensing 15 03297 g012
Figure 13. Non-Gaussian PSD effect on polarization index (PI) as function of sensor parameters (look angle and frequency) at l = 2.5   cm ,   σ = 0.5   cm ,   ε r = 15 j 1.5 . (ac) Single-scale rough surfaces. (df) Multiscale rough surfaces ( r m = 0.5 ). (ad) H-polarized emissivity. (be) V-polarized emissivity, (cf) Polarization index (PI).
Remotesensing 15 03297 g013aRemotesensing 15 03297 g013b
Disclaimer/Publisher’s Note: The statements, opinions and data contained in all publications are solely those of the individual author(s) and contributor(s) and not of MDPI and/or the editor(s). MDPI and/or the editor(s) disclaim responsibility for any injury to people or property resulting from any ideas, methods, instructions or products referred to in the content.

