Article

Analysis of PlanetScope Dove Digital Surface Model Accuracy Using Geometrically Simulated Images

1
Byrd Polar and Climate Research Center, The Ohio State University, 1090 Carmack Rd., Columbus, OH 43210, USA
2
School of Earth Sciences, The Ohio State University, 125 S Oval Mall, Columbus, OH 43210, USA
*
Author to whom correspondence should be addressed.
Remote Sens. 2023, 15(14), 3496; https://doi.org/10.3390/rs15143496
Submission received: 6 April 2023 / Revised: 10 June 2023 / Accepted: 7 July 2023 / Published: 11 July 2023

Abstract

:
Many objectives in geoscience and engineering require Earth surface elevations at greater temporospatial resolution and coverage than are currently available. This may be achieved with stereo imagery from large constellations of “small sats”, such as PlanetScope Doves. Obtaining Digital Surface Models (DSMs) of sufficient quality from these images is challenging due to their lower resolution and weaker stereo geometry relative to stereo mode satellites such as WorldView. The quality can be improved by utilizing their much larger numbers of repeat images, but this requires effective stereopair selection. To determine the stereo geometries required for obtaining quality DSMs from PlanetScope Dove imagery, we apply a new methodology for generating simulated stereo images of varying geometries using adjusted orientation parameters obtained by a self-calibrating bundle adjustment and validated by comparing the resulting rigorous sensor and rational function models. The accuracies of simulated stereo and multi-pair DSMs are then assessed through comparison to a reference DSM, providing the relationship between specific imaging geometries and DSM quality. Our results provide a basis for automated stereo imagery selection to enable large-scale DSM production from PlanetScope Dove imagery. Our methodology can be applied to other sources of stereo imagery and designing future satellite missions. In the future, we will further develop multi-pair matching algorithms for generating DSMs with Dove Classic images to improve both accuracy and quality that are otherwise limited by the weak stereo geometry of single stereo pairs.

1. Introduction

Improved mapping of the Earth’s surface topography, in terms of both spatial and temporal resolution and coverage, is enabled by the recent proliferation of satellites obtaining optical images suitable for photogrammetric Digital Surface Model (DSM) extraction. While conventional satellite imaging platforms, such as of the WorldView constellation, offer high geometric and radiometric quality, yielding high-quality, decimeter-precision DSMs from single stereo pairs, they are limited in spatial and temporal coverage. Instead, large numbers of repeat imagery of coarser resolution and lower quality obtained from SmallSats may be used to expand coverage. Currently, Planet Inc. operates a constellation of ~180 PlanetScope 3U CubeSats that image the Earth’s entire land surface daily with a coverage of 350 M + km2 a day [1]. The PlanetScope PS2 (Dove Classic) has a four-band frame imager with a split-frame visible band and NIR band. Each scene has an approximately 24 by 8 km footprint, a 3.7 m nominal spatial resolution and a limited off-nadir look angle of ±5°. Designed for low-latency, high-frequency Earth surface monitoring, PlanetSope images are not designed to produce stereophotogrammetric DSMs. Thus, individual image pairs often have poor stereo geometries, with convergence angles often less than 10°, resulting in DSMs of less quality than those from satellites designed to obtain stereo pairs, such as WorldView and Pleiades. However, the large number of repeat acquisitions over short periods of time (days) offers the possibility that multiple pairs can be combined to increase DSM quality. Ghuffar [2] generated 5 m resolution DSMs from PlanetScope Dove Classic stereo pair images collected within one month and with Base-to-Height (B/H) ratios between 1:5 and 1:250. These DSMs had standard deviations of 4 to 9 m compared to surface heights obtained from airborne Light Detection And Ranging (LiDAR) and DSMs obtained from the Advanced Land Observing Satellite Panchromatic Remote-sensing Instrument for Stereo Mapping (ALOS PRISM) satellite. Through comparison to SRTM (Shuttle Radar Topography Mission) and 2 m resolution DSMs created from GeoEye-1 and WorldView-2, Aati and Avouac [3] concluded that the highest possible vertical accuracy of Dove Classic DSMs over any area of interest is 10 to 15 m. D’Angelo and Reinartz [4] used stereo pairs with more than 6° of convergence angle to generate a multi-pair DSM with a 5.5 m vertical accuracy compared to airborne LiDAR. While they also reported a relationship between the stereo pair convergence angle and resulting DSM accuracy pair, a consistent relationship was obscured by large temporal surface changes between images. Huang et al. [5] selected Dove Classic stereo pair images collected within 2 to 4 months and with greater than 8° convergence angles to maximize DSM quality. They generated 4 m resolution DSMs with vertical accuracies of 4 to 6 m compared with airborne LiDAR. These previous studies, therefore, suggest the possibility of utilizing Dove Classic multi-pair DSMs to obtain useful topographic data with up to 4 m vertical accuracy depending on surface type and image quality.
Stereo imaging geometry is a primary determinant of the accuracy and quality of multi-pair DSMs. The above studies either manually selected optimal convergence angles or simply generated the DSMs with all possible stereo pairs. To examine the impact of stereo pair convergence angles on accuracy, Jacobsen and Topan [6] generated stereo and multi-pair DSMs from 0.5 m resolution Pleiades triplet images with convergence angles of 6.3°, 6.5°, and 12.6°, respectively. They found that the vertical accuracy ranged from 3.52 times of the ground sample distance (GSD) for all three pairs to 3.88 times GSD for a stereo pair with a 6.3° convergence angle. The main objective of this paper is to analyze the impact of stereo geometry, specifically the convergence and azimuth angles, ground sample distance, and biases in Rational Polynomial Coefficients (RPCs), on the accuracy and quality of stereo and multi-pair DSMs for PlanetScope Dove Classic stereo image pairs. The analysis aims to provide valuable reference information in understanding the influence of these factors. This reference information can be utilized to improve the quality of PlanetScope Dove Classic multi-pair DSMs when filtering and selecting stereo pairs in the multi-pair DSM generation procedure. For isolating the impact of stereo geometry on DSM quality from that of variable image quality, we use geometrically simulated images from a reference image by adjusting exterior orientation parameters. The Surface Extraction from Triangulated Irregular Network (TIN)-based Search-space Minimization (SETSM) algorithm [7] is applied to generate stereo and multi-pair DSMs. The SETSM software (version 4.3.14.) package is open-source, HPC-optimized, fully automated and has been extensively validated through the ArcticDEM and REMA continental-scale terrain mapping projects [8,9]. In this paper, we first provide methodologies for (1) retrieving the reference image orientations for constructing a rigorous sensor model (RSM) through self-calibrating bundle adjustment with the vendor-provided RPCs, (2) determining exterior orientations for simulated images in terms of the three axis angles and scale, and (3) generating simulated images (Section 2). We then explain our test dataset and assess a set of generated stereo and multi-pair DSMs to examine their sensitivity to geometric conditions in relation to accuracy and quality (Section 3). Finally, we summarize our experimental results (Section 4 and Section 5).

2. Methodology

PlanetScope Dove Classic images are taken at the instant of exposure without a stereo acquisition mode. To collect surface information simultaneously and widely, multiple PlanetScope satellites operate on multiple-path trajectories. To improve the quality of stereo-photogrammetric DSMs with a proper multiple image matching methodology, a sufficient number of pairs from multiple paths over a wide timespan (>10 days) are required. Stereo pair images have both radiometric and geometric differences caused by differences in image acquisition time and exposure position. Even pairs with identical stereo geometries can yield DSMs of significantly different qualities due to radiometric differences. These differences prevent the analysis of DSM accuracy in terms of only stereo geometry. To remove the radiometric uncertainty in an assessment of DSM quality, we used geometrically simulated images generated from one real image (the reference image) as shown in Figure 1. For minimizing relief displacements on images caused by central perspective geometry, a nadir-view image was selected as the reference image. A reference DSM is required to locate image pixel positions on an image plane by projecting rays connecting a simulated projection center and 3D object points. PlanetScope Dove Classic images are acquired with a frame camera’s central perspective geometry and are provided with RPCs from the vendor. To simulate the elements of exterior orientation parameters (EOPs) expressed by the X, Y, Z spatial positions and three angular attitudes (omega-phi-kappa or tilt-swing-azimuth), the EOPs of the reference image were retrieved from the provided RPCs through self-calibrating bundle adjustment. The geometrically simulated images were then generated by adjusting the EOPs of the reference image.

2.1. Retrieval of Orientation Parameters by Self-Calibrating Bundle Adjustment

PlanetScope Dove Classic images are provided with RPCs for constraining a Rational Function Model (RFM) that provides a more compact and generalized description of the physical orientation of imaging sensors than an RSM. To retrieve the orientations, RPCs are utilized to acquire observations between image points and Ground Control Points (GCPs) in a self-calibrating bundle adjustment. These GCPs are evenly distributed on multiple height layers (hl), similar to the terrain-independent method [10] for generating RPCs as shown in Figure 1b. The corresponding image points are then computed from the RFM with the provided RPCs. An RFM describes the spatial relationship between a two-dimensional point on an image, with normalized line and sample coordinates L n and S n , and the corresponding three-dimensional point on the ground with normalized coordinates P, L, and H, as in [11]:
L n = g ρ , λ , h = c T u d T u ,   S n = q ρ , λ , h = e T u f T u
P = ρ L A T o f f L A T s c a l e ,   L = λ L O N G o f f L O N G s c a l e ,   H = h H E I G H T o f f H E I G H T s c a l e
L i n e = L n · L I N E s c a l e + L I N E o f f ,   S a m p l e = S n · S A M P s c a l e + S A M P o f f
u = 1   L   P   H   L P   L H   P H   L 2   P 2   H 2   P L H   L 3   L P 2   L H 2   L 2 P   P 3   p H 2   L 2 H   P 2 H   H 3
c = c 1   c 2     c 20 ,   d = 1   d 2   d 20 ,   e = e 1   e 2     e 20 ,   f = 1   f 1     f 20
where P, L, and H are normalized latitude, longitude, and height coordinates, respectively. ρ , λ, and h are actual latitude and longitude coordinates, and height, respectively. g and q are functions that describe the relationship between the normalized line and sample coordinates, ρ , λ, and h. T stands for matrix transpose. LAT, LONG, and HEIGHT are the latitude, longitude, and height coordinates, respectively. Line and Sample are the image line pixel number starting from the center of the first line and the sample pixel number starting from the center of the left-top sample, respectively. The subscripts off and scale denote the independent offset and scale factors for each variable. The variables c and d are numerator and denominator of 38 RPCs for Ln, and e and f are numerator and denominator of 38 RPCs for Sn, respectively. The RPCs, scale and offset parameters are provided by the data source.
Since P, L, H are the normalized coordinates ranging from −1 to 1, the boundary of horizontal plane ( ρ m i n , ρ m a x , λ m i n , λ m a x ) and relief range ( h m i n , h m a x ) in Figure 1b are determined by the provided offset and scale parameters as:
ρ m i n = L A T o f f L A T s c a l e ,                       ρ m a x = L A T o f f + L A T s c a l e λ m i n = L O N G o f f L O N G s c a l e ,                 λ m a x = L O N G o f f + L O N G s c a l e h m i n = H E I G H T o f f H E I G H T s c a l e ,     h m a x = H E I G H T o f f + H E I G H T s c a l e
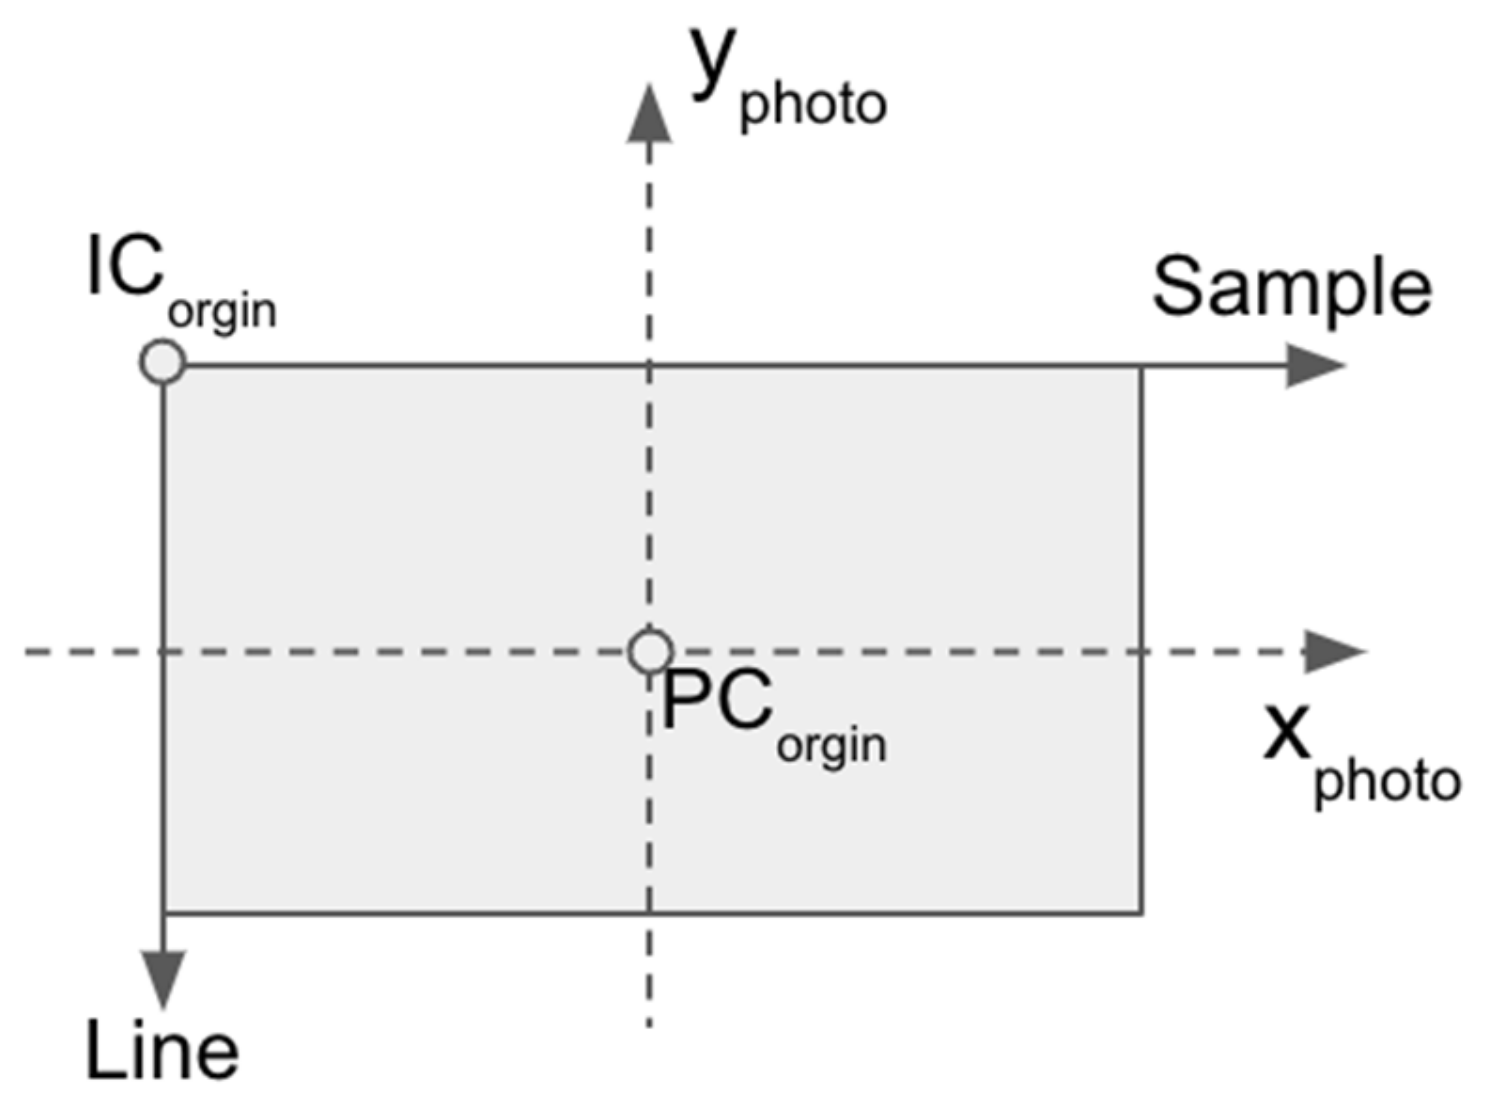
With the horizontal boundary and relief range, a total of n p × n l × h l GCPs are evenly distributed by dividing the 3D space. n p and n l are the number of GCP spacing in latitude and longitude direction, respectively. h l is number of height layer. Image points corresponding to the GCPs are calculated by Equation (3). For applying the RSM represented by a collinear equation, the geographic coordinates of GCPs are reprojected into Universal Transverse Mercator (UTM) coordinates and the image point coordinates are then converted into a photo coordinate system with an origin at the image center (Figure 2).
The PlanetScope Dove classic has a 2D frame sensor. Thus, to retrieve an accurate spatial relationship between the image points and the 3D object points of GCPs through a RSM based on the collinear equation at the time of exposure of the image, 8 interior frame camera calibration parameters are applied into a self-calibrating bundle adjustment as unknown, as shown in Equation (7) [12].
x x p + x x p q 1 r 2 + q 2 r 4 + q 3 r 6 + p 1 ( r 2 + 2 x x p ) 2 + 2 p 2 x x p y y p = f l R Q
y y p + y y p q 1 r 2 + q 2 r 4 + q 3 r 6 + p 2 ( r 2 + 2 y y p ) 2 + 2 p 1 x x p y y p = f l S Q
r 2 = x x p x x p + y y p y y p R = m 11 X X c + m 12 Y Y c + m 13 Z Z c S = m 21 X X c + m 22 Y Y c + m 23 Z Z c Q = m 31 X X c + m 32 Y Y c + m 33 Z Z c
where (x, y) are the measured photo coordinates corresponding to 3D object point ( X , Y, Z), ( x p , y p ) are the coordinate of the principal point, ( q 1 , q 2 , q 3 ) are the symmetric radial lens distortion coefficients, ( p 1 , p 2 ) are the decentering distortion coefficients, f l is the calibrated focal length, m is the rotation matrix in terms of omega( ω ) -phi( φ ) -kappa(k) angle corresponding to X, Y, Z axis, ( X c , Y c , Z c ) are the projection center coordinates, respectively. R, S, and Q are functions of the rotation matrix, 3D object coordinates and projection center coordinates.

2.2. EOPs for Simulated Images

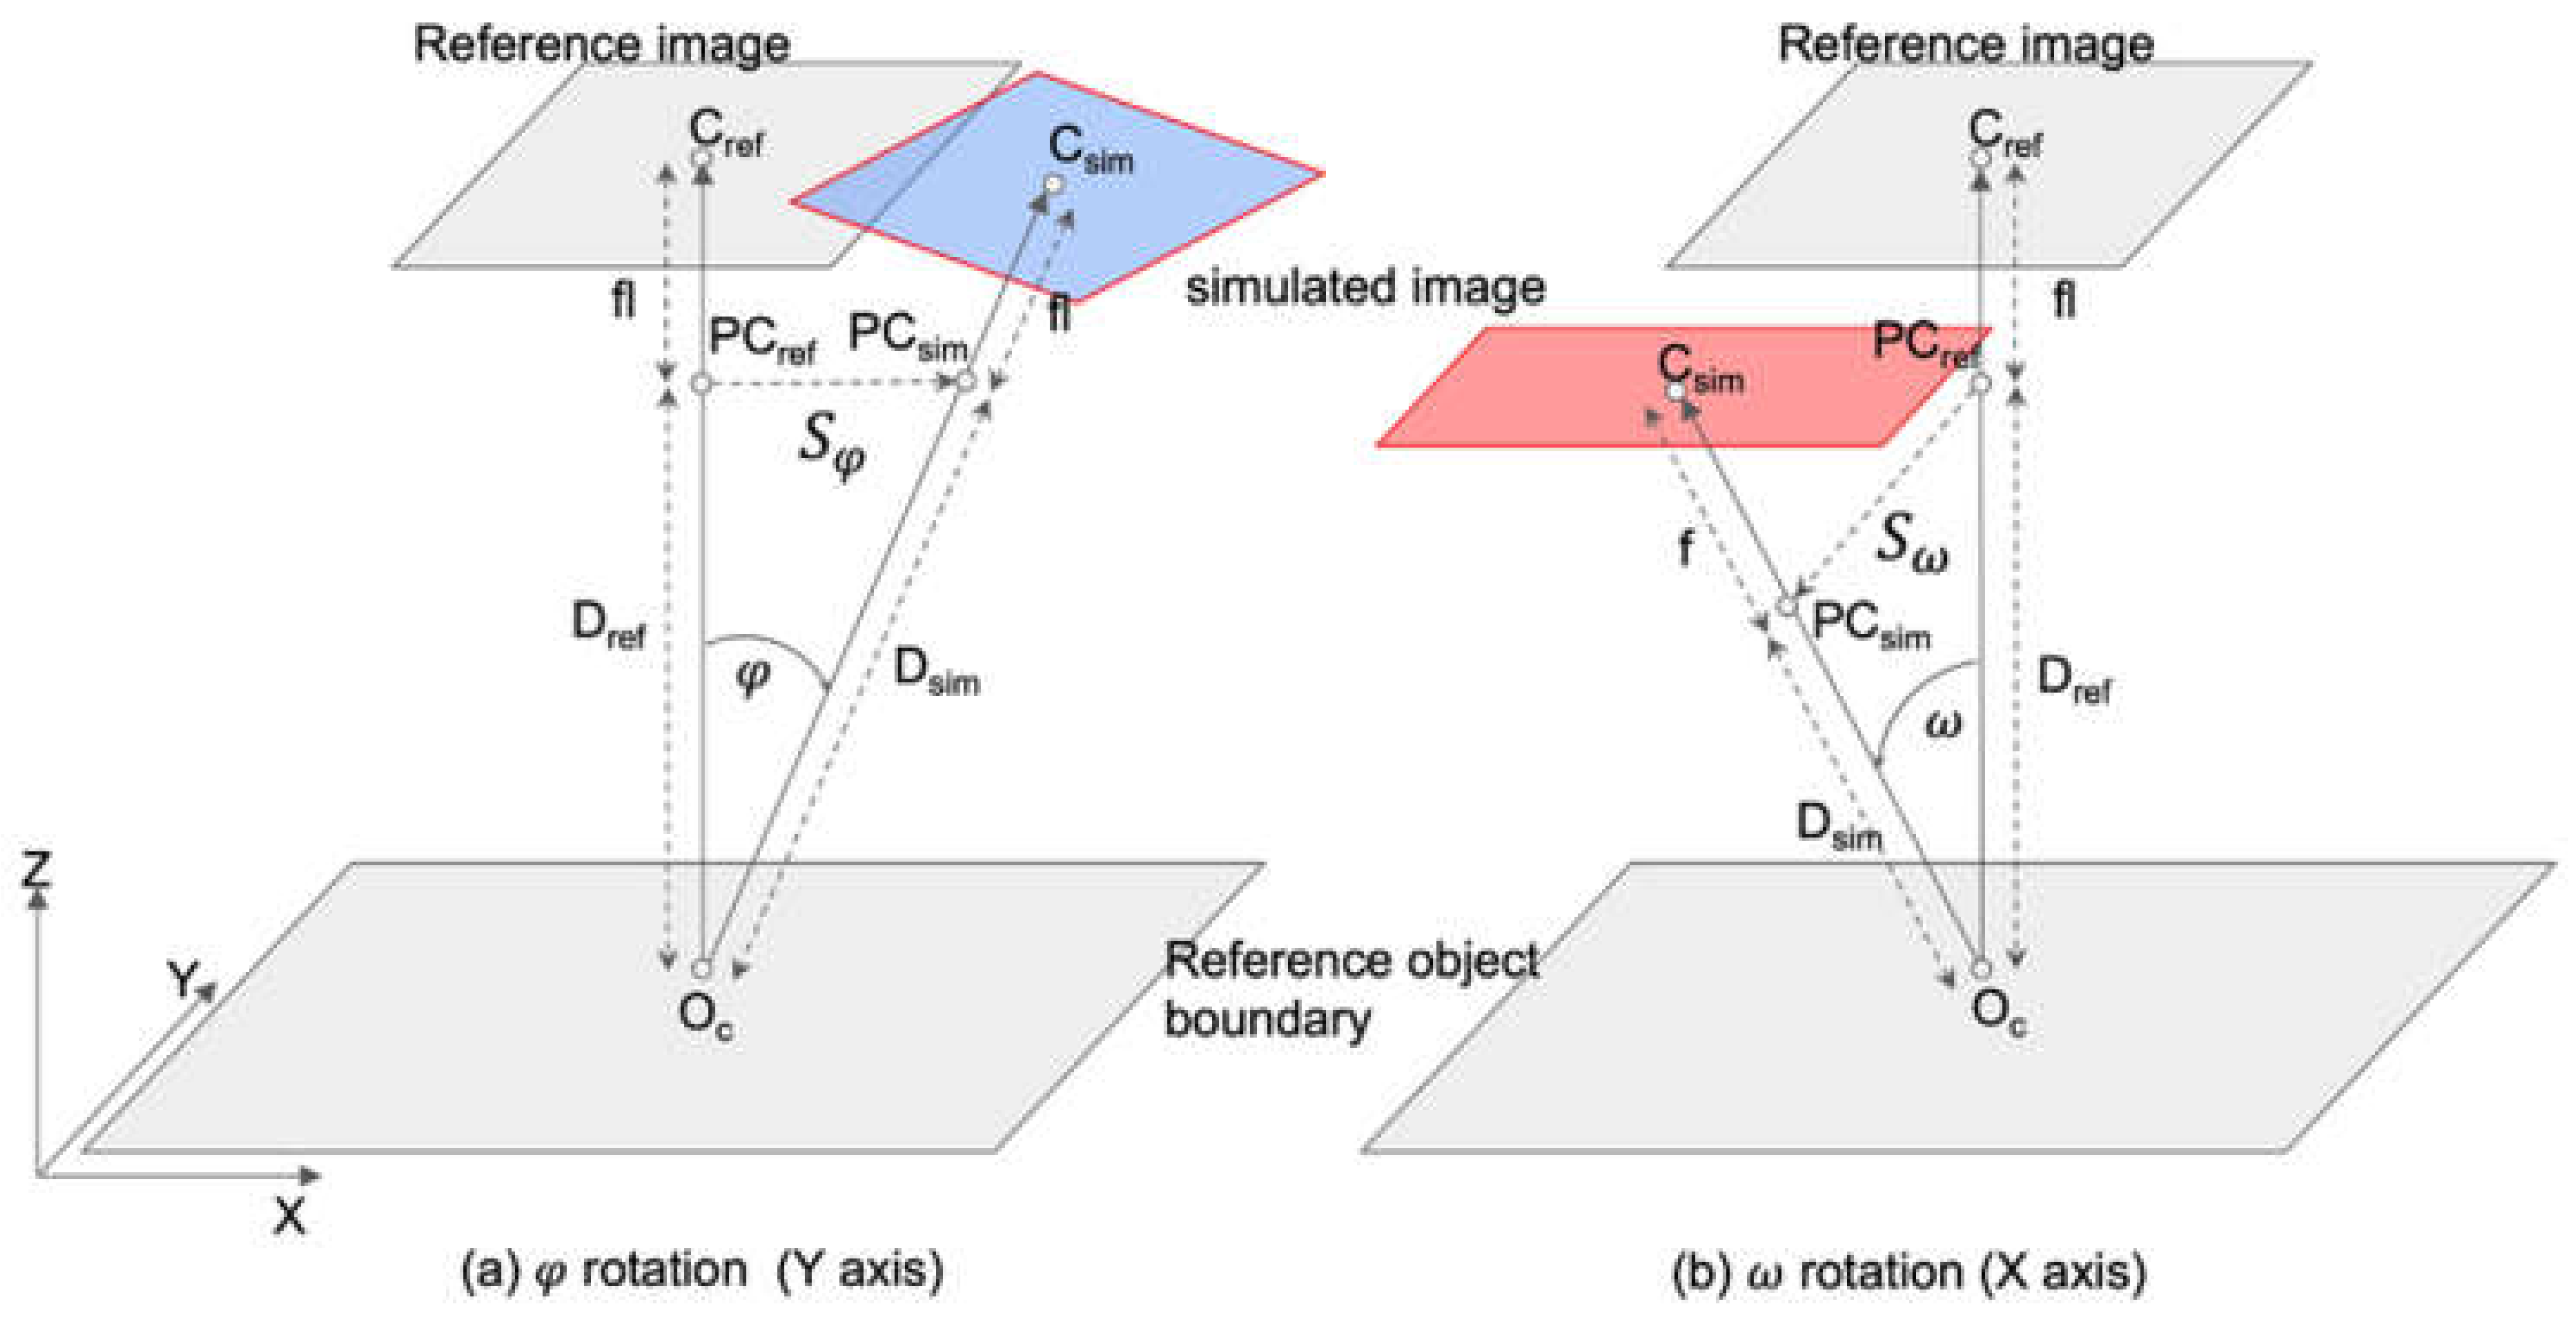
To avoid missing data on the simulated image, the object target area viewed by a simulated image should entirely cover the reference image’s object target area. An image point (C) traced by a perspective ray which connects between a projection center (PC) and a center object point (Oc) of the reference object boundary is selected to match the object target area between the simulated image and the reference image, and to minimize the number of void pixels on the simulated images, as shown in Figure 3. The photo coordinates of the image point (Csim) on the simulated image are determined by a collinear equation with orientation parameters. The Interior Orientation Parameters (IOPs) of the simulated image are set to equal those of the reference image. For simulating the EOPs of the simulated image, there are two adjustable components: rotations defining the stereo viewing geometry and a scale for adjusting image resolution. For the first component, the horizontal elements of the projection center (Xc_sim and Yc_sim) are directionally shifted depending on a rotation axis, as shown in Figure 3. A k rotation in the Z-axis does not change the projection center location. Each of the rotation angles of ω , φ , k are considered a positive value if rotated counterclockwise when viewed from the positive end of the rotation axis. The projection center (PCsim) of the simulated image is initially set to equal that of the reference image (PCref). To initially locate the horizontal projection center of the simulated image based on the rotation angle, shifted distances S φ and S ω are calculated as shown in Figure 3. When a positive φ along the Y-axis is applied to the simulated image, PCsim is shifted to a positive direction along the X-axis to match the photo coordinates of C between the simulated image point (Csim) and the reference image point (Cref). Csim and Cref are traced by a perspective ray starting at Oc. In case of a positive ω in the X-axis, PCsim is shifted to a negative direction along the Y-axis in the same manner. The shifted distance corresponding to φ and ω , S φ and S ω is calculated as:
S φ = D r e f · t a n φ ,   S ω = D r e f · t a n ω
The initial EOPs of the simulated image are determined as:
X c _ s i m = X c _ r e f + S φ ,   Y c _ s i m = Y c _ r e f S ω ,   Z c _ s i m = Z c _ r e f
ω s i m = ω r e f + ω ,   φ s i m = φ r e f + φ ,   k s i m = k r e f + k
where X c _ s i m , Y c _ s i m , Z c _ s i m are the projection center position of the simulated image. X c _ r e f , Y c _ r e f , Z c _ r e f are the projection center position of the reference image.
In the real case, the perspective ray vector ( O c C r e f ) of the reference image is not perfectly perpendicular to the horizontal plane. Therefore, the photo coordinates of Csim derived by the initial EOPs are not identical to the photo coordinates of Cref. In order to minimize photo coordinate differences between Csim and Cref, Xc_sim and Yc_sim are iteratively updated with the adjusted distances (Xadj, Yadj) estimated from the photo coordinate difference in dx and dy between reference and simulated image, and the reference image’s scale of SCref, as:
X c _ s i m n + 1 = X c _ s i m n X a d j ,   Y c _ s i m n + 1 = Y a d j
X a d j = d x · S C r e f ,   Y a d j = d y · S C r e f
d x = x c _ r e f x c _ s i m ,   d y = y c _ r e f y c _ s i m ,   S C r e f = D r e f f l
where (xc_ref, yc_ref) and (xc_sim, yc_sim) are the x and y photo coordinates of Cref and Csim, respectively and n is the iteration number.
The iterative process is terminated when the photo coordinate difference is less than a threshold of 1 pixel. In each iteration, the photo coordinates of Csim are updated from the updated values of Xc_sim and Yc_sim.
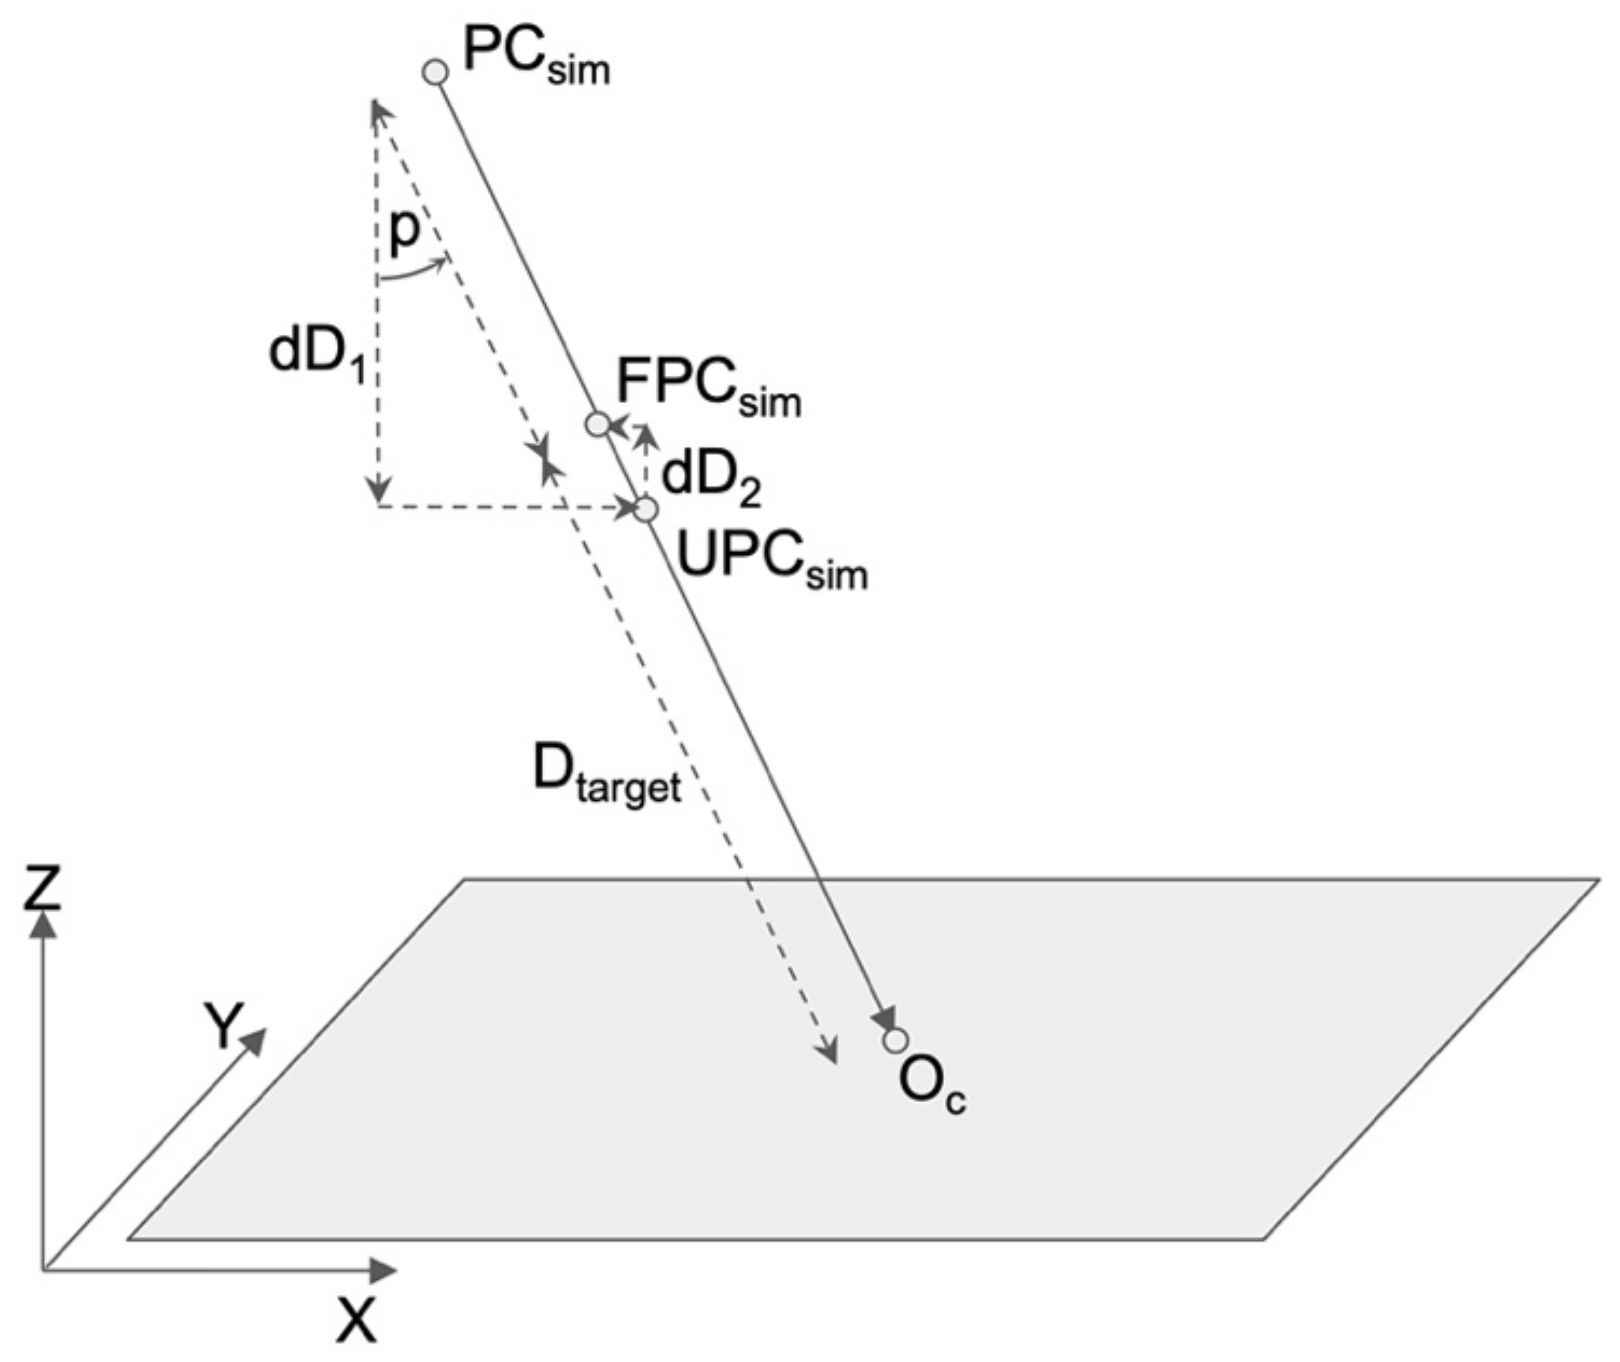
After deriving the horizontal elements of the projection center (Xc_sim, Yc_sim), the altitude of the projection center (Zc_sim) is determined based on a targeted image resolution or scale. Figure 4 shows an illustration to determine the altitude of the projection center with distance adjustment.
The simulated image’s perspective ray vector ( v ) between Oc and PCsim is defined as:
v = v x ,   v y ,   v z = X c _ o b j X c _ s i m ,   Y c _ o b j Y c _ s i m ,   Z c _ o b j Z c _ s i m
where ( X c _ o b j , Y c _ o b j , Z c _ o b j ) are the object coordinates of Oc.
The Euclidean distance (Dtarget) between the altitude of the projection center and Oc is calculated based on a desired image resolution (GSDsim) as:
D t a r g e t = G S D s i m C S · f l
where CS is the cell size of the CCD (charge-coupled device) sensor.
The difference (dD) between Dsim and Dtarget is calculated to adjust the altitude of the projection center. If the perspective ray is perpendicular to the horizontal plane, Dtarget is the altitude of the projection center. Since the simulated image can be considered a rotated image with ω and φ , dD is applied to adjust Zc_sim as:
Z c _ s i m n + 1 = Z c _ s i m n + d D = Z c _ s i m n + Z D t a r g e t Z D s i m
where Z D t a r g e t and Z D s i m are the distance in Z axis for the Euclidean distance of D t a r g e t and D s i m , respectively.
Then, the updated Xc_sim and Yc_sim on the perspective ray are determined as:
X c _ s i m = X c _ o b j + Z c _ s i m Z C _ o b j n z · n x ,   Y c _ s i m = Y c _ o b j + Z c _ s i m Z C _ o b j n z · n y
n x = v x / v   ,   n y = v y / v   ,   n z = v z / v
With the updated projection center (UPCsim), Dsim is recalculated for the next iteration. The ray-tracing method for deriving the final projection center (FPCsim) is iteratively performed until dD is less than 1 m.

2.3. Simulated Image Generation

Images are simulated from EOPs and surface heights on the reference DSM assuming no changes in the surface height between the reference image and DSM. The narrow (<3°) FOV of PlanetScope Dove results in a much smaller amount of relief displacement and occlusion on the reference image than typical for frame vertical aerial images. For the purpose of assessing the relative accuracy of simulated DSMs, as measured by differencing PlanetScope DSMs with the reference DSM, we can ignore small relief displacements and occlusions on the reference image when assigning the pixel Digital Number (DN) values on the simulated image from the corresponding position on the reference image obtained from the projection of the perspective ray vector ( O 4 P C r e f ), as shown in Figure 5. Ray-tracing along the perspective ray vector ( P C s i m O ) of the simulated image locates the object point (O4) on the 3D surface. Starting from the image point (Csim) on the simulated image, a horizontal coordinate of the initial object point (O1) on P C s i m O is defined by the RSM with the photo coordinates of the image point (Csim) and a minimum height of the object domain. This horizontal coordinate gives the location of the updated h1 on the reference DSM. This updated h1 and the RSM, in turn, provides an update object point (O2). This iterative process is continued until the difference between hn+1 and hn is less than a threshold of 0.1 m, giving the final object point (O4). The size of the resulting simulated image is equal to the reference image.

2.4. DSM Generation with the Simulated Images

We used SETSM to extract DSMs from the simulated images. SETSM employs a coarse-to-fine strategy, with each finer level iteratively minimizing the search height range to find the optimal height at each grid cell. For generating multi-pair DSMs, SETSM is modified so that heights obtained from each stereo pair are averaged at each iteration and the search height ranges are updated through a TIN of the average heights.

3. Experimental Results

3.1. PlanetScope Dove Classic Images and the Reference DSM

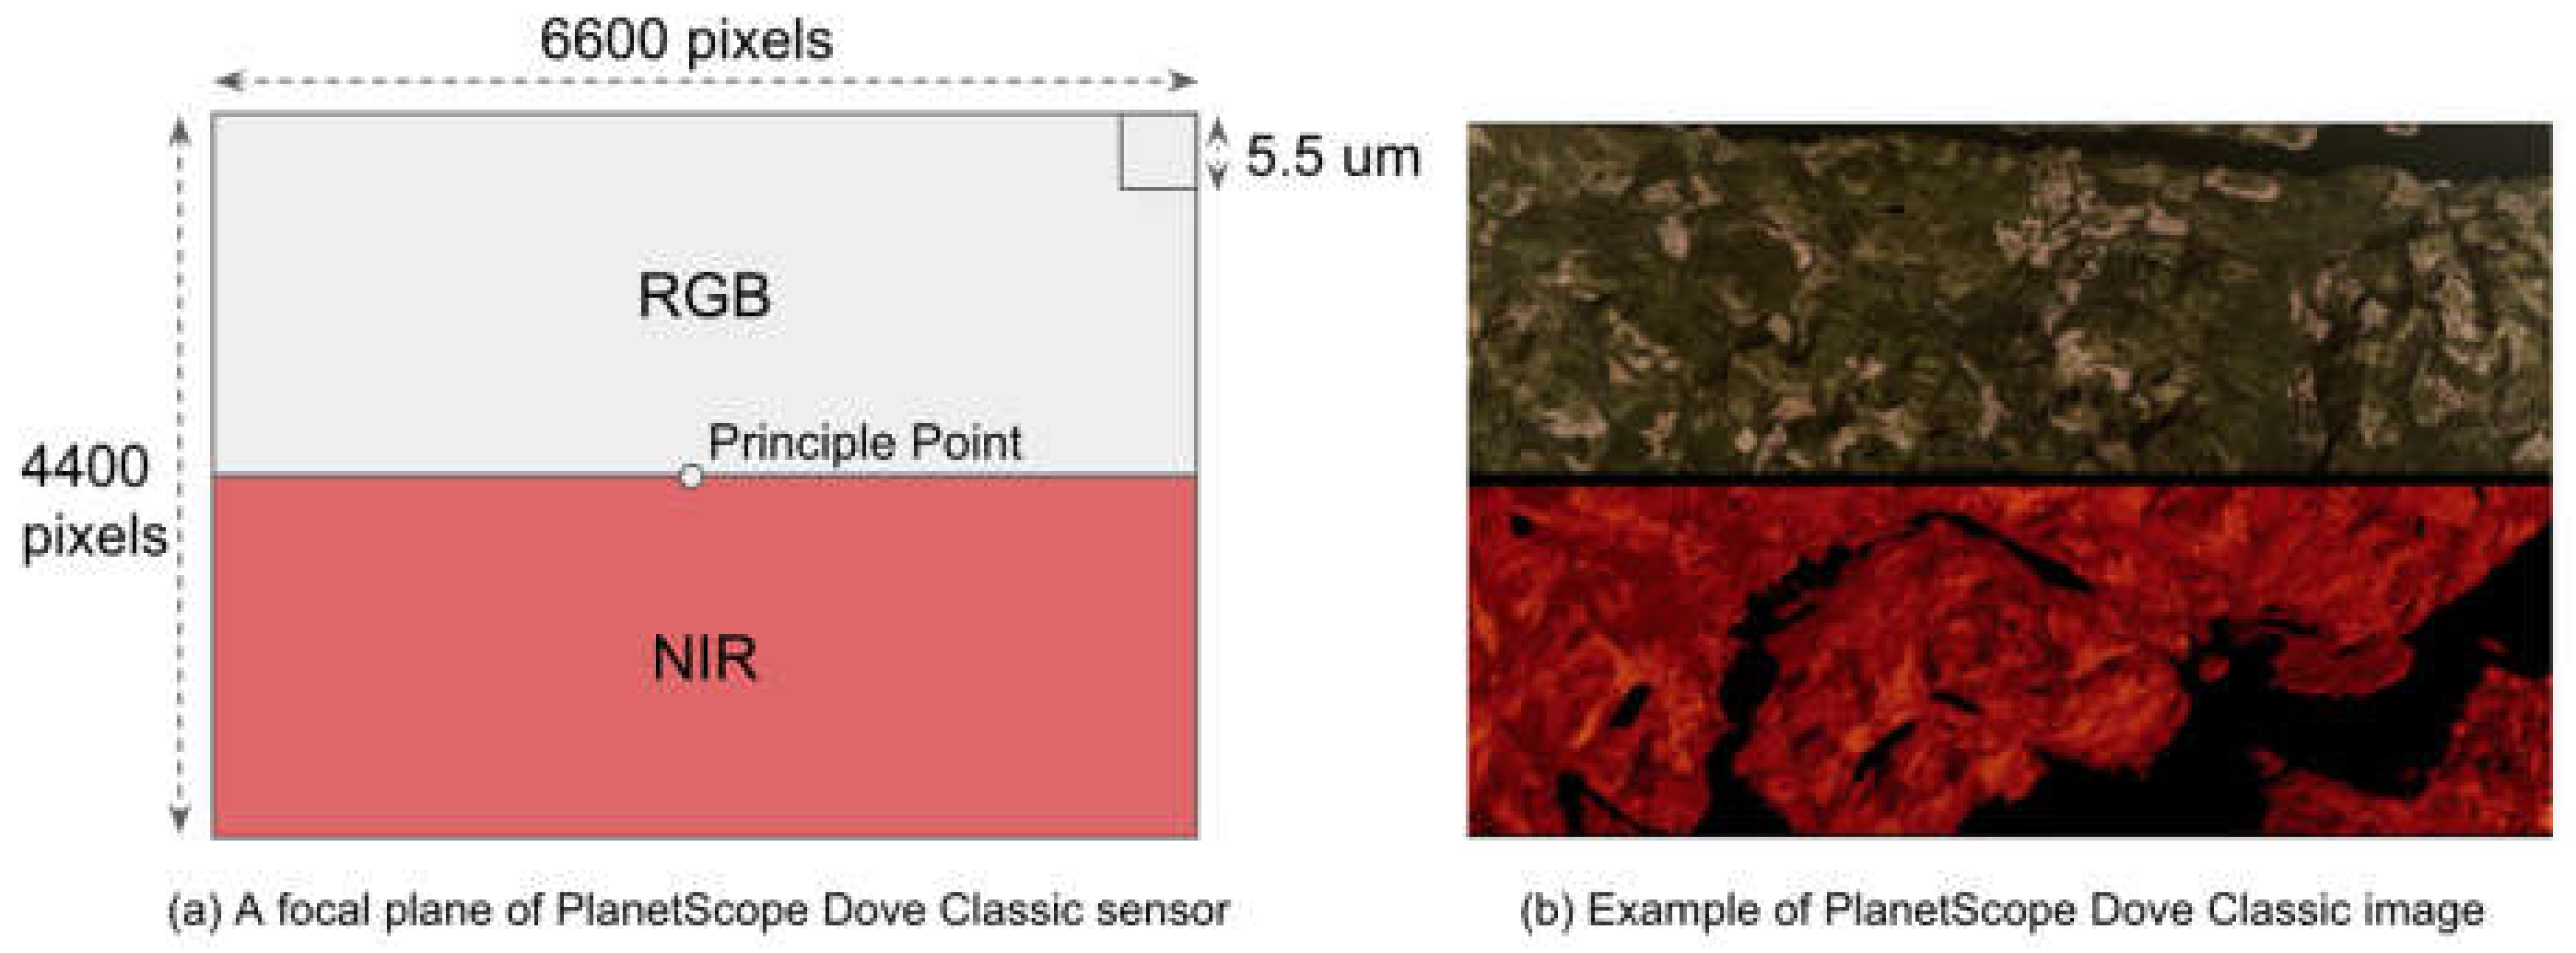
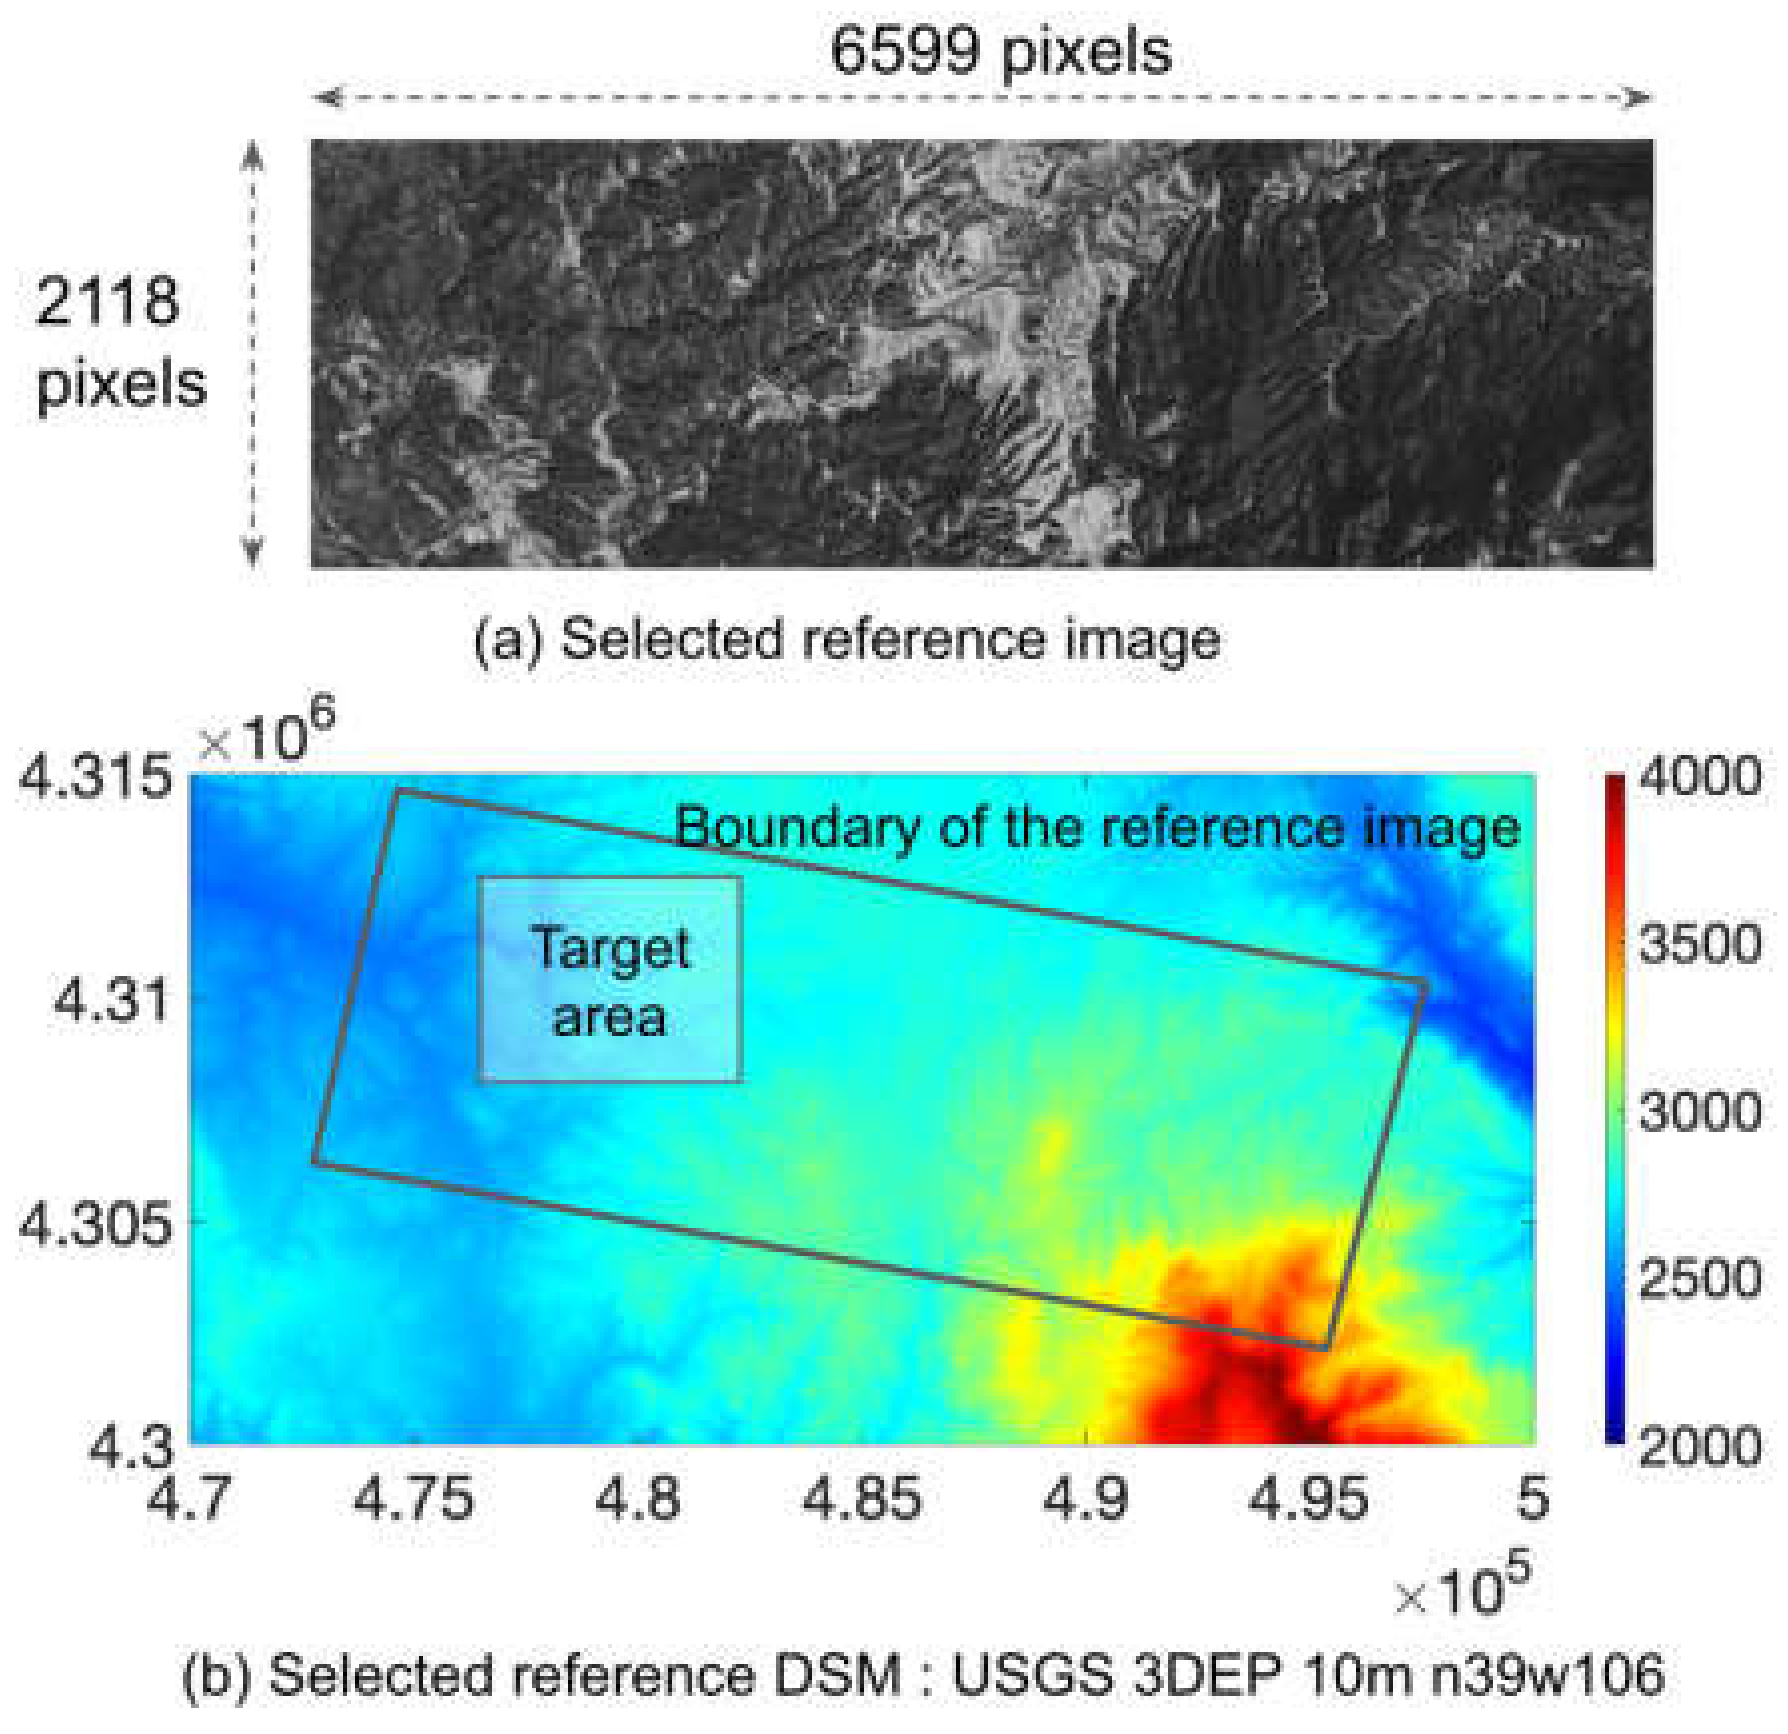
The focal plane of each PlanetScope Dove Classic sensor consists of a 2D frame detector with 6600 column pixels and 4400 row pixels, as shown in Figure 6. Each CCD detector has 12-bit radiometric resolution at a 5.5 um pixel size. The top half of each frame consists of a visible (RGB) image and the bottom half consists of a Near InfraRed (NIR) image. The principal point is located at the center of the 2D frame detector. For a reference image, we selected the RGB bands of a Dove Classic image from Colorado, USA (−105.174° longitude, 38.927° latitude) taken on 13 January 2020, shown in Figure 7. According to the metadata, the viewing angle is 0.97° and the GSD is 3.83 m. Since SETSM software performs DSM generation using single-band (grayscale) images, the RGB images are converted into a single panchromatic image by the National Television System Committee (NTSC) color space formula provided by Matlab image processing toolbox (P = 0.299R + 0.587G + 0.114B). For a reference DSM, we use the 10 m resolution tile n39w106 from the United State Geological Survey (USGS) 3DEP (3D Elevation Program) elevation product generated from September 2019 to October 2020. The 3DEP data are derived from multiple sources processed to a common coordinate system and unit of vertical measure [13]. For the context of relative accuracy and quality assessment and minimizing any potential change in surface height between the reference image and DSM, we selected a 6 km by 5 km target area over stable terrain for assessing the accuracy of DSMs created from the simulated images (Figure 7).

3.2. Self-Calibrating Bundle Adjustment for the Reference Image

The reference object boundary defined by the provided RPCs is in UTM zone 13, with dimensions of 22.6 km in the X direction and 17.4 km in the Y direction (Figure 7). Because the height scale of 3377 m and offset of 3234 m from the provided RPCs did not define an appropriate relief range over the target area, the relief range from 2000 m to 4000 m was determined from the reference USGS DSM. The GCPs were evenly distributed over the target area by dividing the reference object boundary into 10 by 10 intervals ( n p × n l ), and six height layers ( h l ) were evenly generated over the relief range. Image point positions corresponding to the GCPs were calculated from the RFM with the provided RPCs. The image point positions were then converted into photo coordinates with a CCD size of 5.5 um and image size of 6600 by 4400 pixels. Among the 100 GCPs per the height layer, 65 GCPs were selected by removing those located outside of the focal plane. An initial focal length of 646.214 mm was estimated from the CCD size, the satellite altitude of 450 km, and the GSD of 3.83 m. The remaining IOPs were initialized as zeros for the self-calibrating bundle adjustment. Table 1 shows the accuracy statistics obtained by differencing horizontal GCP coordinates and image point positions between the RPCs RFM and the RSM using the orientations estimated by self-calibrating bundle adjustment. The horizontal GCP coordinates for the RSM were calculated from the estimated orientations, heights of the GCPs and the photo coordinates derived from the RPCs/RFM. The image point positions of the RSM, as defined by the estimated orientations, were then calculated from the 3D coordinates of the GCP.
Table 1 includes four test cases with increasing numbers of applied IOP parameters. With the calibrated focal length (fl) and the principal points (xp, yp) in case #2, the Root Mean Square Error (RMSE) of the horizontal object and image coordinates are 9.76 m and 2.56 pixels, respectively. By adding the parameters of symmetric radial lens distortion (case #3), the RMSE is improved by 94% (0.70 m in object and 0.20 pixels in image coordinates). The maximum differences between cases #2 and #3 are reduced from 27.30 m to 1.63 m in object space, and from 7.16 pixels to 0.45 pixels in image space. Case #4, which includes all eight IOPs, has the smallest RMSE (0.25 m in object space and 0.10 pixels in image space, with maximum differences of 0.62 m and 0.25 pixel in object and image space, respectively). By applying self-calibrating bundle adjustment with eight IOPs, the results of the RSM constrained by the estimated orientations closely correspond to those obtained from the RFM constrained by the provided RPCs, with an RMSE of less than 0.5 m and 0.25 pixels for horizontal coordinates in object and image space, respectively. Therefore, it is crucial to apply the 8 IOPs in case 4 to precisely establish the relationship between object and image points using the collinear equation, aligned with the accuracy of the provided RFM RPCs.

3.3. Example of Simulated Images

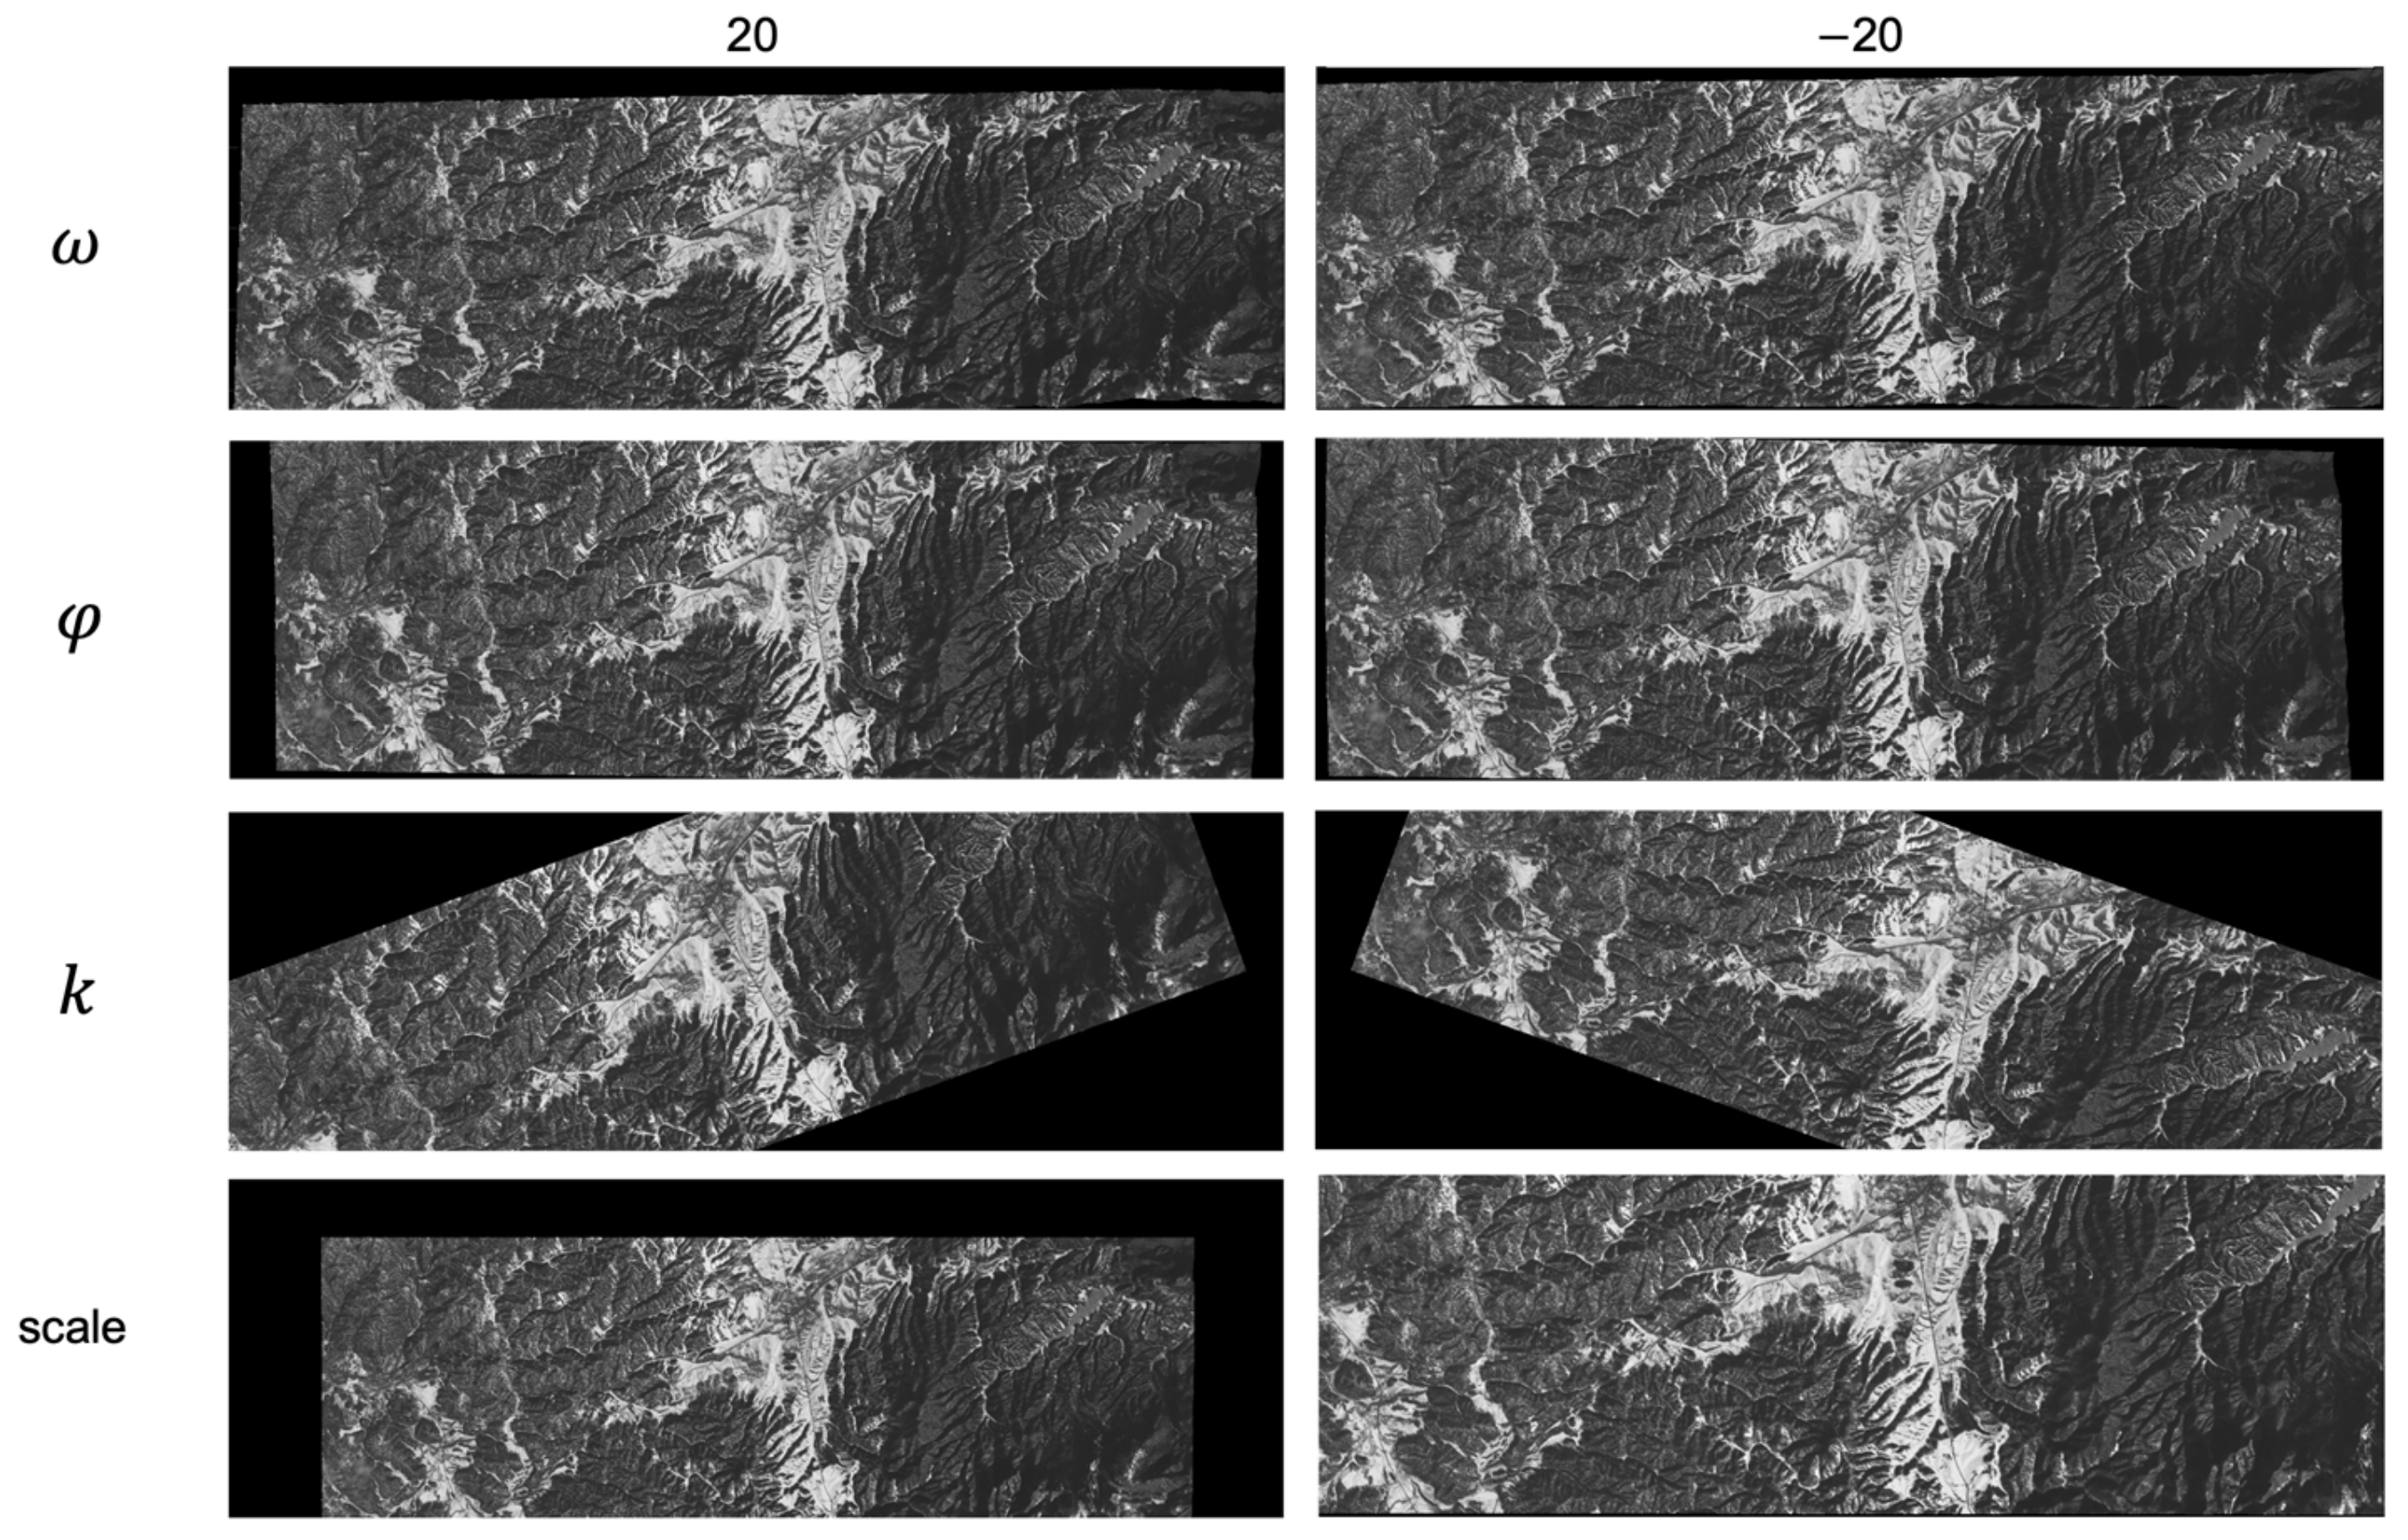
For validating the proposed method for generating simulated images from estimated orientations, simulated images, obtained by the rotation of angles ω , φ , k +/−20° relative to the reference image, are shown in Figure 8. In addition, images are scaled by the ratio of the Euclidean distance between the projection center and the object points along the perspective ray for the simulated image to that of the reference image (Section 2.2). As expected, the simulated images are rotated by k around the principal point of the focal plane. Scaling the images by 120% and 80% results in 20% coarser and finer GSD than the reference image, as shown in Figure 8.

3.4. Accuracy Analysis of Simulated DSMs

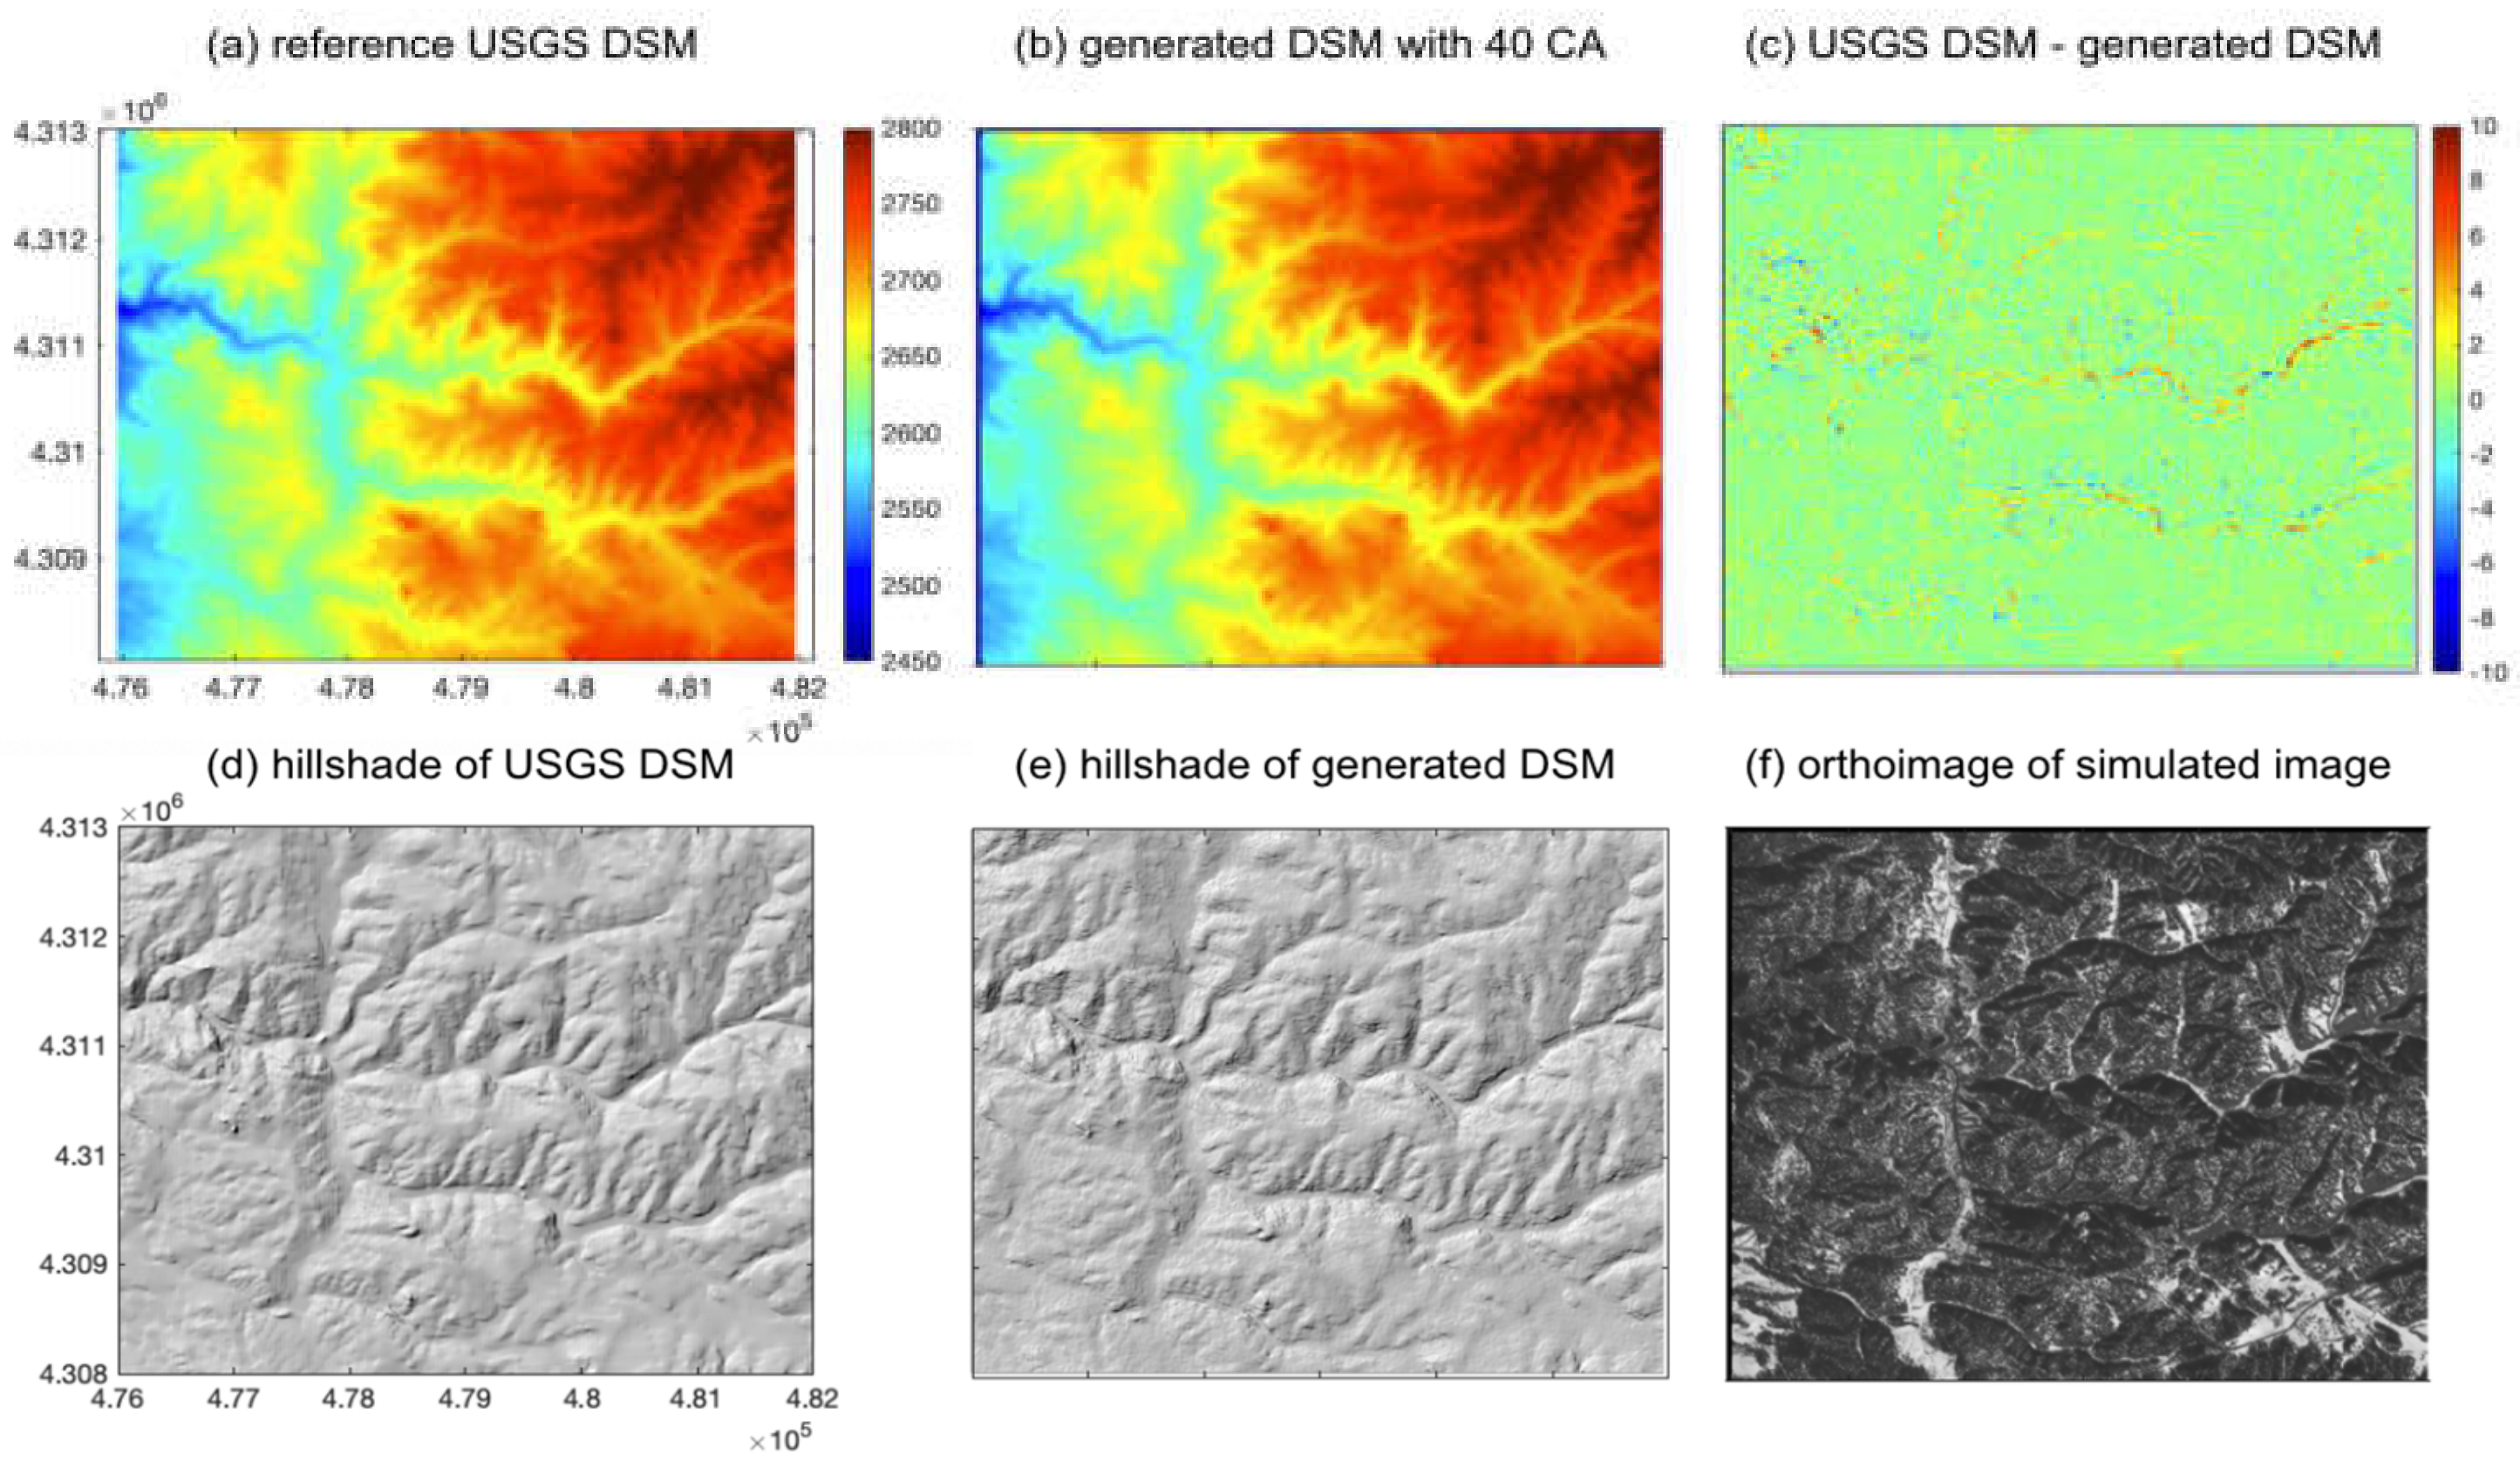
Since the simulated images are generated from the reference DSM, the height difference between the reference DSM and DSMs generated from the stimulated images can be used to analyze the impact of imaging geometry, such as convergence angles determined by the orientations ω and φ , the differences in azimuth determined by k , and scale differences, on DSM accuracy. The simulated DSMs are generated with 4 m grid resolution and the reference 10 m DSM is interpolated to 4 m resolution for the accuracy analysis. A 3D coregistration algorithm [15] is applied to remove biases between the reference DSM and the simulated DSMs. The target area for the accuracy analysis covers mountains ranging from 2400 m to 2800 m height as shown in Figure 9.

3.4.1. Convergence Angle Analysis with φ

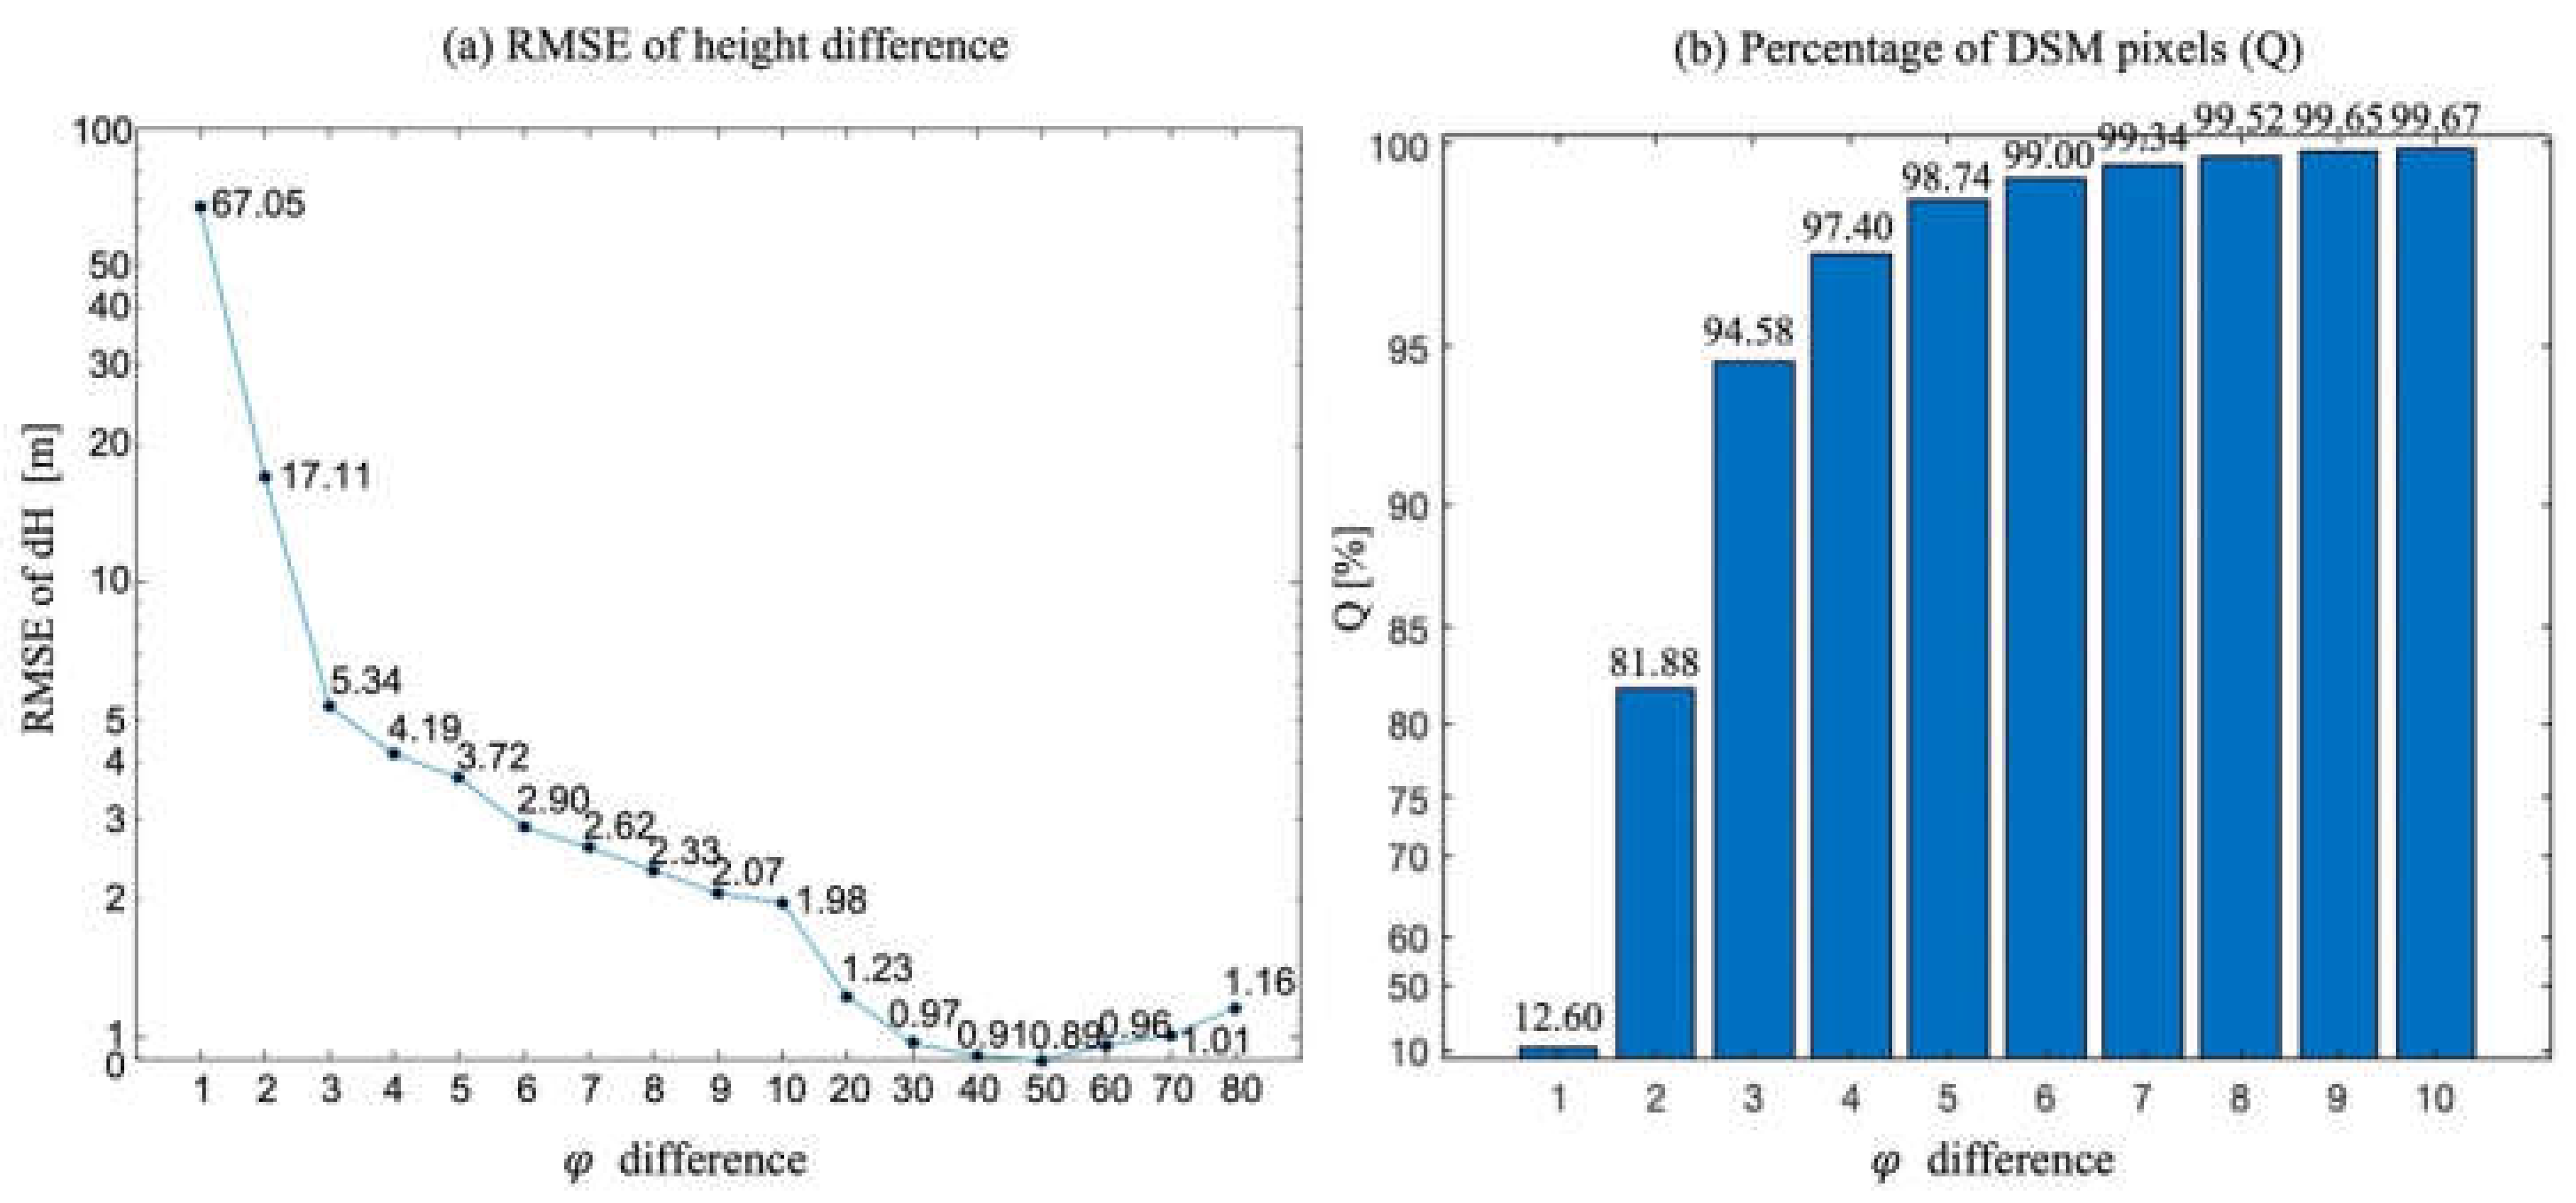
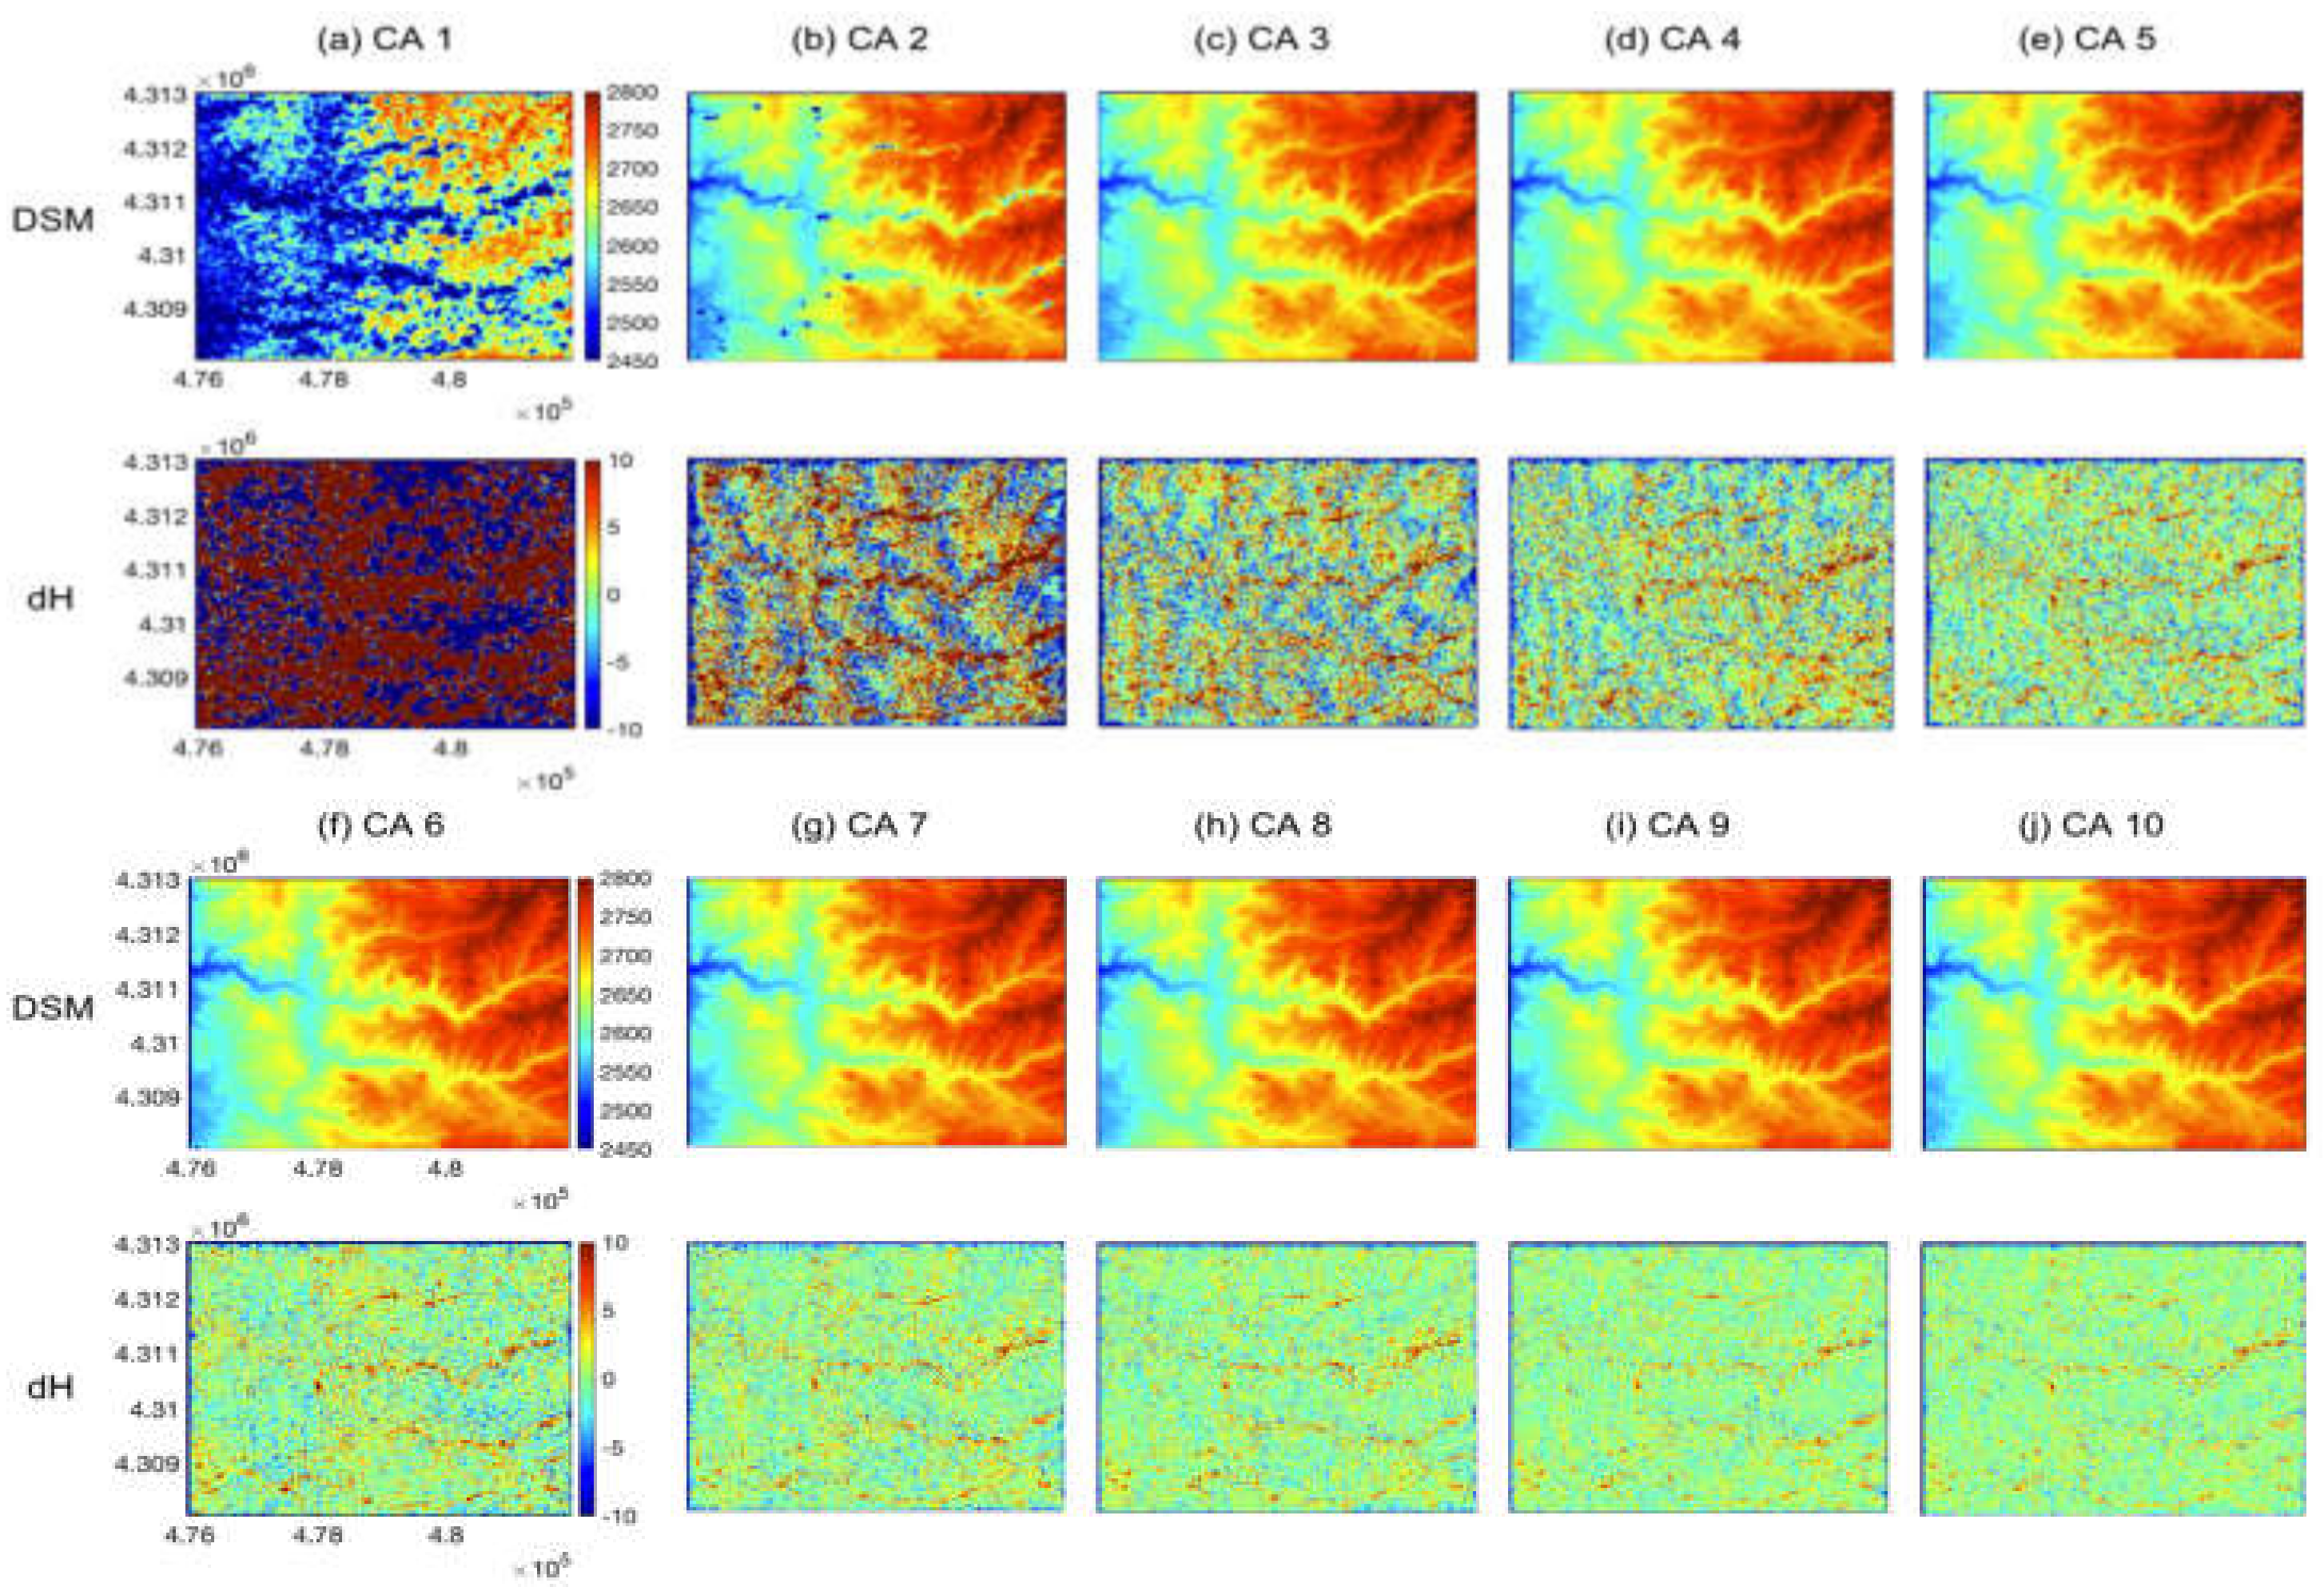
The spacecraft across-track, off-nadir viewing angle of PlanetScope Dove imagery normally ranges ±5°, with positive being east and negative being west. The stereoscopic convergence angle is primarily determined by the φ along the Y axis. Here, CA stands for the convergence angle, which is the difference in φ between stereo pair images. Based on the direction of the convergence angle, simulated images with more than +/−10° φ are generated to configure the stereo pairs, corresponding with typical stereo-mode satellite image pairs that have CA greater than 30°. These simulated images are used to validate the proposed methods of simulating EOPs and images by comparing the simulated DSMs with the reference DSM. Figure 10a shows the RMSE of the height difference between the reference DSM and the simulated DSM in terms of CA. To serve as a metric of overall matching quality in relation to changes in imaging geometry, we define the quality index (Q) as the percentage of the pixels within ±10 m of the height difference, with pixel locations more than ±10 m (or 2.5 pixels) considered matching failures or blunders. In the case of a CA greater than 20°, Q and RMSE are more than 99.99% and less than 1.2 m (¼ pixel), respectively, confirming that the proposed methods for simulating EOPs and images are correctly applied for DSM generation. Figure 9 shows the DSM generated from a simulated stereo pair with a 40° CA stereo pair compared to the reference DSM. In this case, less than 0.01% of pixels have height differences greater than ±10 m, located mostly within mountain valleys due to the relief displacement of the reference image, change in surface height and texture with time, and the difference in resolution between the reference image and the reference DSM. The RMSE increases for CA greater than 60° due to the increasing relief displacement with the angle. Overall, and as expected, the best accuracy is achieved for a CA between 40° and 50°s. For the actual image acquisition cases, simulated images are generated with φ ranging from −5° to 5° at 1° intervals. Stereo pairs are then configured with CAs ranging from 1° to 10°.
As shown in Figure 10, DSMs created from stereo pairs with a CA less than 2° have Q values below 90% and RMSE values 17 times greater than those with CA of 40°. These DSMs exhibit very rough surfaces with high-frequency noise, resulting in little or no useful surface information. As a result, it is not recommended to utilize these stereo pairs for PlanetScope Dove DSM generation. Increasing the CA to 3° results in 3 times better RMSE and Q greater than 90%, providing observable surface features, such as mountain ridges and valleys, with less blunders and reduced roughness (Figure 11). The RMSE of 5.34 m, however, is still 5 times worse than DSMs generated with a CA of 40°. For a CA greater than 6°, DSMs have Q values greater than 99.0% and the RMSE is less than 3.0 m, or 3 times larger than those generated with a 40° CA. As shown in Figure 10 and Figure 11, the prevalence blunders and the RMSE have an inverse relationship with CA, which is expected because the convergence angle, through stereo geometry, determines the accuracy of heights obtained from image matching. The maximum CA of 10° achievable from PlanetScope Dove stereo images results in a RMSE of 1.98 m, or about twice the RMSE obtained with CAs in the optimal range of 30° to 40° as used by conventional satellite stereo-mode image pairs, such as from WorldView. This suggests that PlanetScope Dove DSMs obtained from a single stereo pair, with a convergence angle greater than 10°, can be utilized for surface change detection and monitoring, achieving approximately half the accuracy of conventional WorldView stereo mode DSMs.

3.4.2. Analysis of Convergence Angle with Respect to the Difference in ω and Azimuth Angles from k

The ω along the X-axis (north and south) of PlanetScope Dove images is normally 0°. Small, non-zero ω values can occur due to variations in satellite trajectory and, in this case, DSM accuracy may be improved with a combination of φ and ω . To investigate the degree of accuracy improvement relative to differences in ω , we generate simulated images with ω ranging from 1° to 5° based on the CA of the stereo pairs. As shown in Figure 12, the accuracy and quality of DSM are improved with the combination of angles since the parallax information of the stereo pair is enhanced, improving the height accuracy obtained from image matching. The improvement is more effective when the difference in ω is larger than the difference in φ . By adding a 1° ω difference in the case of a 2° CA, the accuracy is dramatically improved, from 17.11 m to 9.40 m RMSE, which is like the improvement obtained by increasing CA from 2° to 3°, as shown in Figure 9. In the case that the actual ω for Dove images is less than 1° and the maximum possible difference in ω is less than 2°, the accuracy improvement by ω is negligible (<3%) when applied to stereo pairs with a CA greater than 3°. Based on this analysis, it is evident that the influence of ω can be disregarded when employing stereo pairs with a large CA, especially those with a CA greater than 6°.
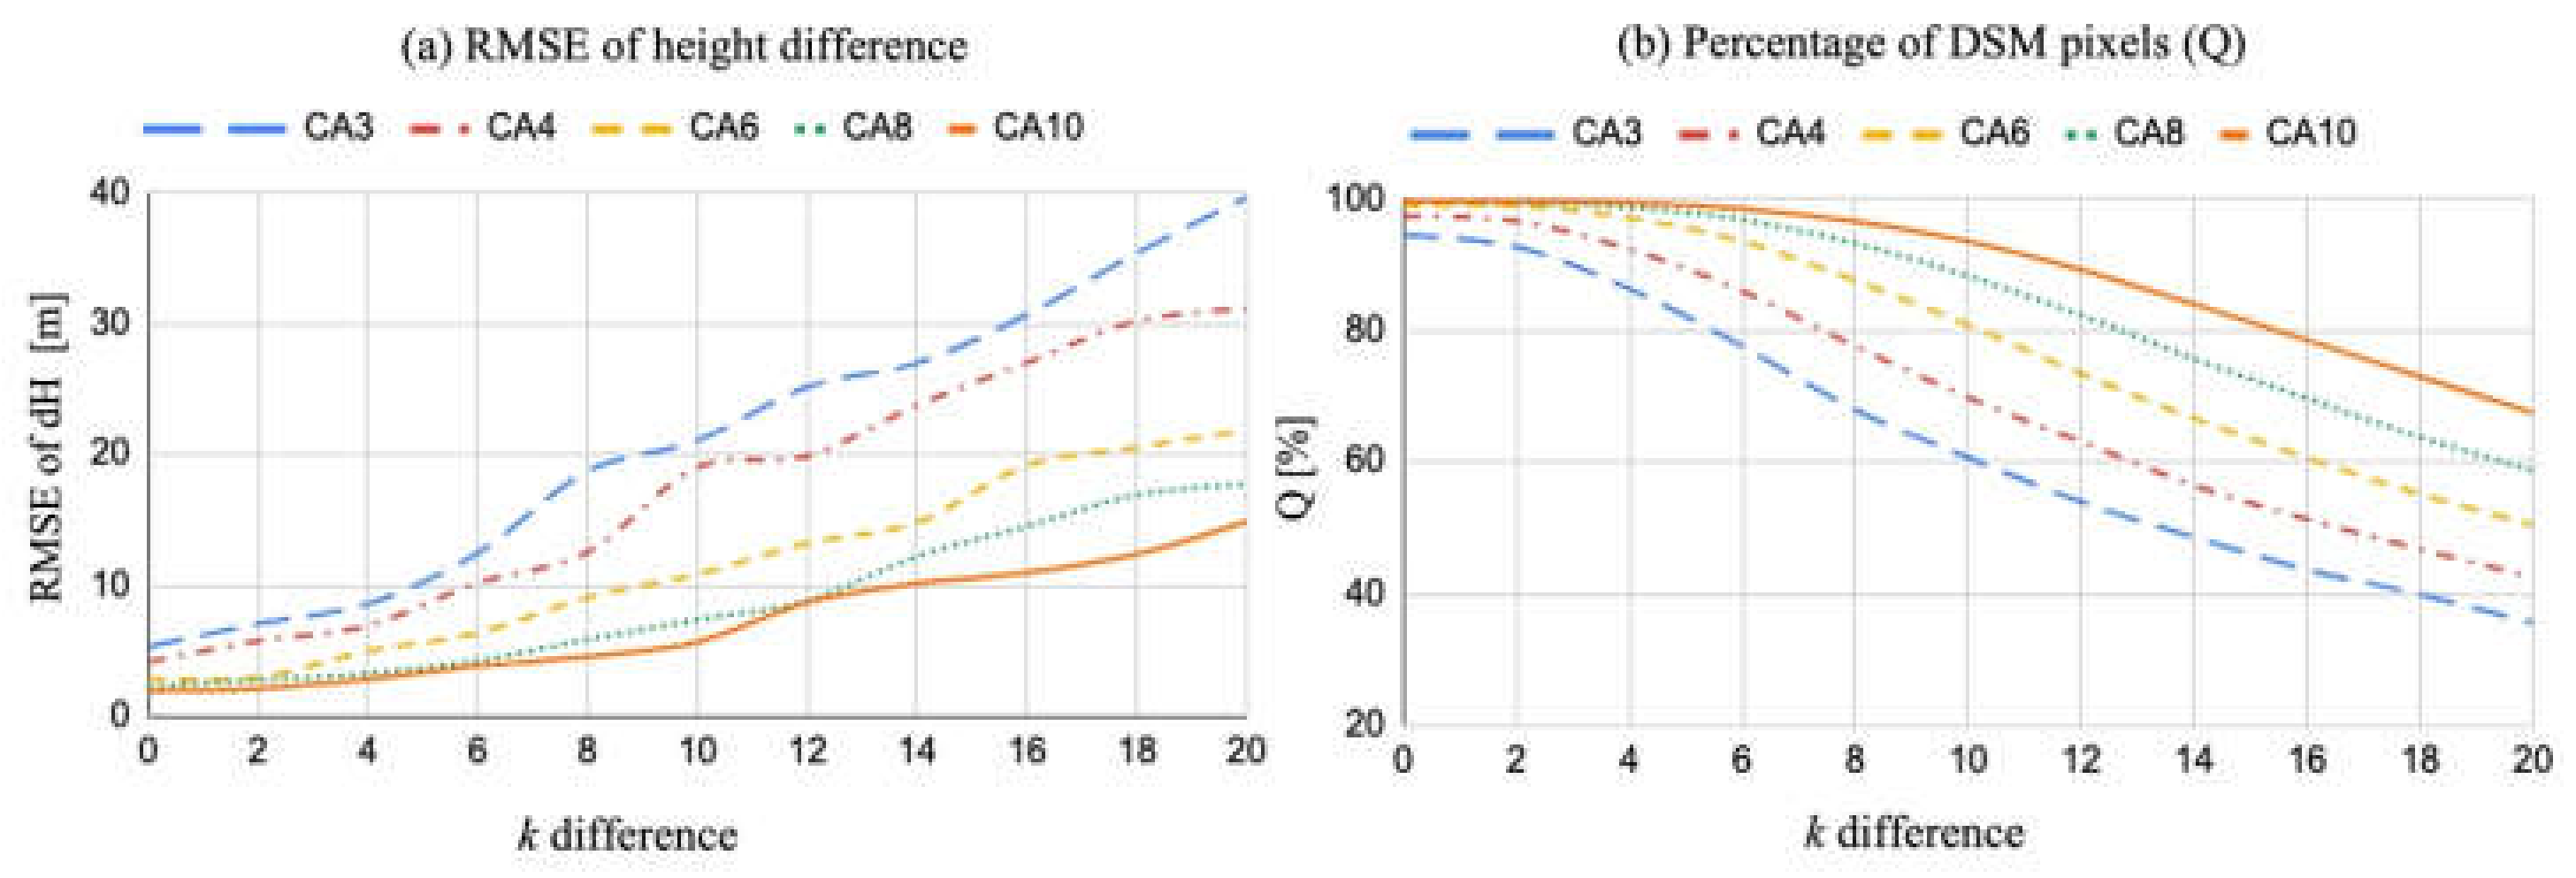
To analyze the effect of differences in satellite azimuth angles on the accuracy of simulated DSMs, stereo pairs are created from simulated images with k ranging from −10° to 10°. Differences in k strongly impacts differences in feature orientation between images and, therefore, strongly impacts the accuracy of image matching. As shown in Figure 13, the increase in RMSE (decline in accuracy) increases with k differences at a higher rate for stereo pairs with a narrower CA. However, even with a 10° CA, a 2° difference in k results in a >9% accuracy reduction (1.98 m with 0° to 2.16 m with 2° of k difference). Therefore, differences in azimuth angle between stereo pairs should be minimized to prevent substantial DSM quality degradation, especially for pairs with narrower CA.

3.4.3. Scale and RPCs Bias Analysis

Scaled images are simulated by adjusting the distance (Dsim) between simulated projection center (PCsim) and object center point (Oc) as shown schematically in Figure 4. Scale ratios relative to the reference image distance between the projection center (PCref) and object center point (Oc), which range from 1.05 per 4.02 m GSD to 1.20 per 4.60 m GSD with an interval of 0.02, are applied to generate simulated images with coarser resolutions. DSMs are then generated from stereo pairs made up of the reference image and the scaled images.
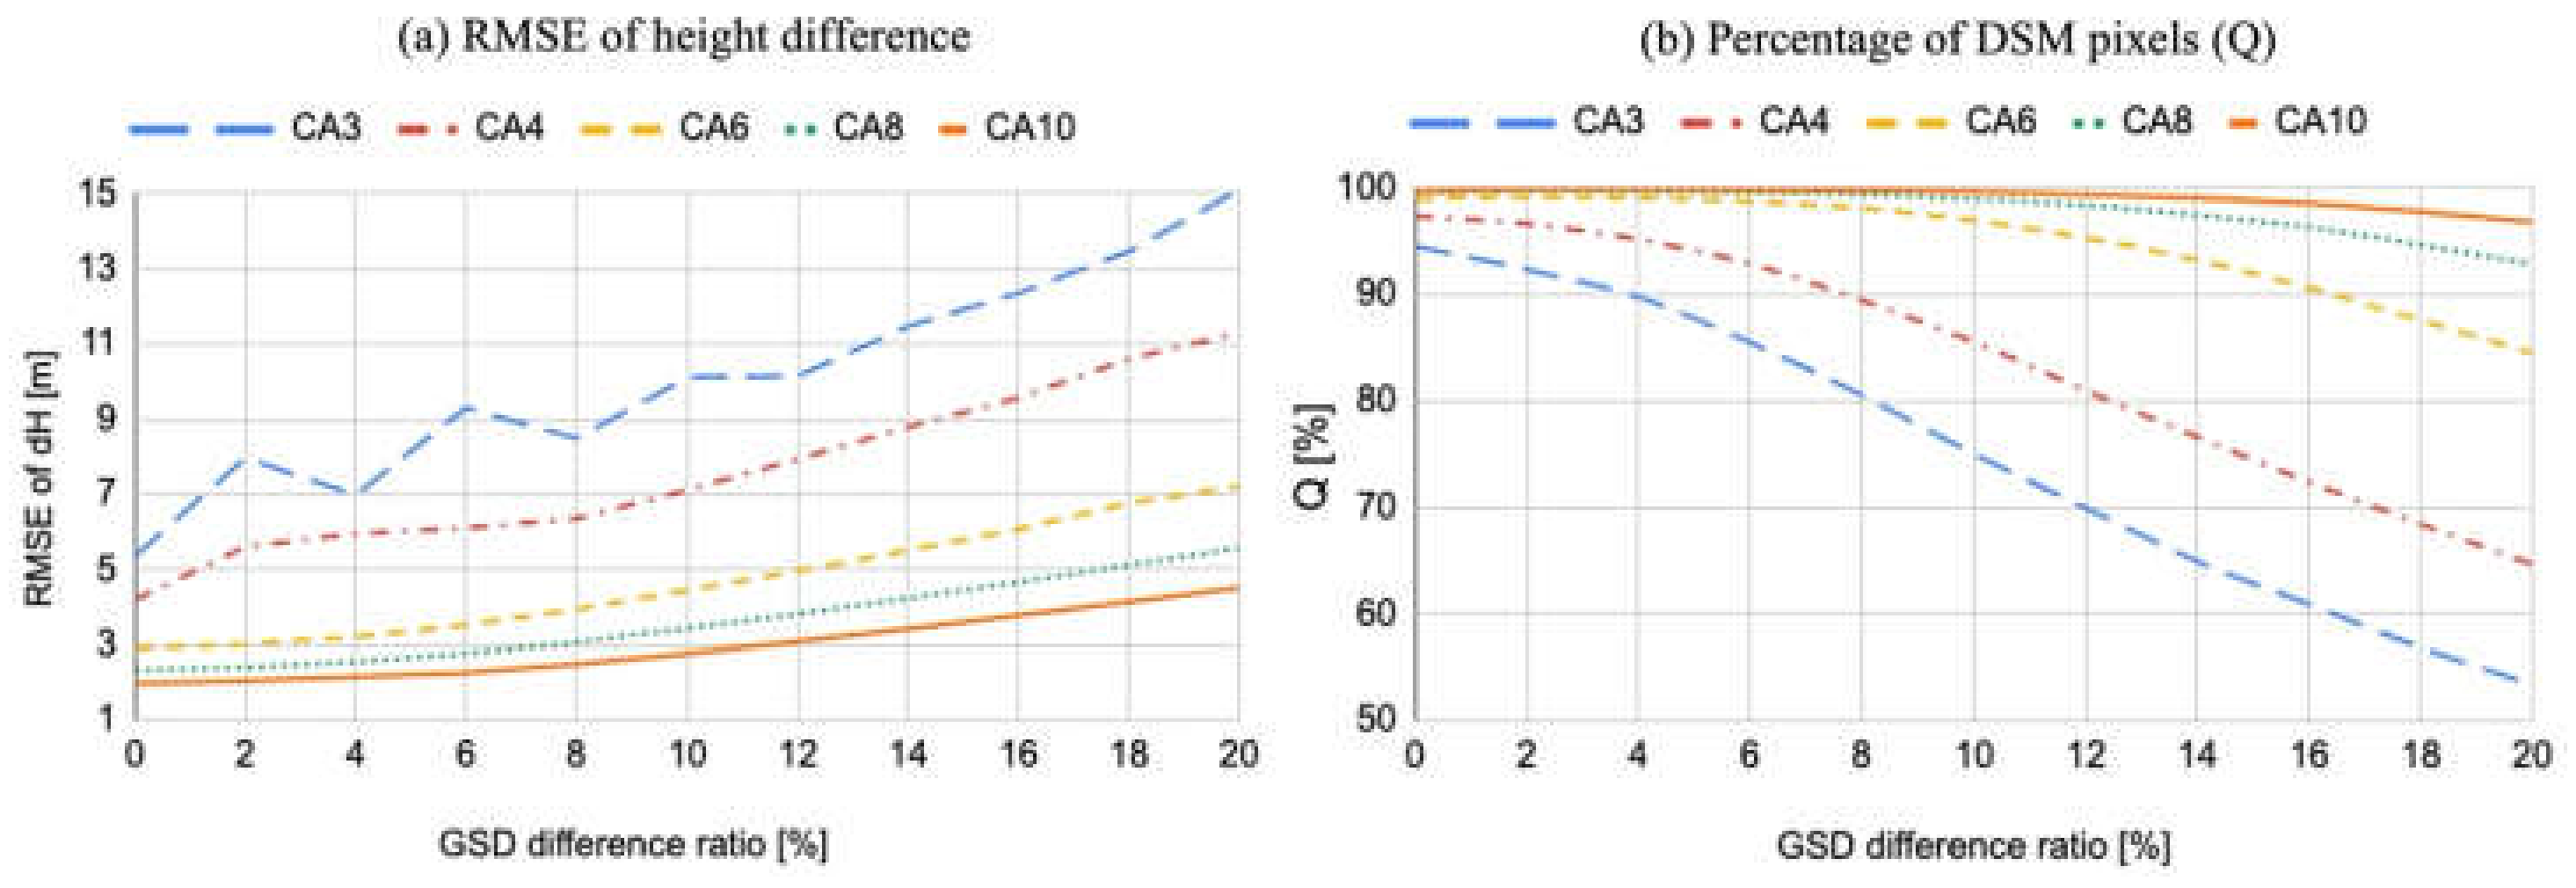
As shown in Figure 14, RMSE increases and Q decreases with increasing GSD difference ratio because, similar to the impact of differences in k (Section 3.4.2), the accuracy of image matching, which utilizes area-based kernel correlation matching, is dependent upon the amount of texture information per pixel between images. The case of a 3° CA shows an irregular pattern for GSD differences less than 10% (Figure 14a) because the GSD difference causes more blunders and matching failures. With a CA of more than 4°, the accuracy and quality of the DSM decreases proportionally, as expected. In the case of a 10° CA, a 4% GSD difference of 0.15 m causes a reduction in accuracy of 40%, from 1.98 m to 2.86 m. In practice, the GSD of PlanetScope Dove images varies with satellite altitude. To generate high-quality stereo-photogrammetric DSMs from the images with CAs less than 10°, it is imperative to minimize the disparity in GSD by selecting satellite images with similar altitudes or GSD.
To analyze DSM accuracy in terms of RPC biases [11,16], we imposed line and sample pixel biases on the image coordinates when generating the simulated images. The biases range from 0.2 to 1.0 pixels with an interval of 0.2 pixels. Figure 15 shows the resulting RMSE with the imposed line and sample biases according to stereo pair CA s, respectively. For CA larger than 3° CA, the impact of sample biases on DSM quality is negligible. The maximum rate of decreasing RMSE for the 10° CA case is 7% between sample biases of 0.8 and 1.0 pixels, while the RMSE increases from 1.98 m with no sample bias to 2.34 m with a 1-pixel sample bias. In the case of a 3° CA, as with image scale, the RMSE varies irregularly with sample bias due to matching blunders. DSM accuracy is much more sensitive to imposed line biases. In the case of a 10° CA, the DSM accuracy decreases to from 1.98 m to 3.15 m with a line bias of 0.4 pixels, and to 7.52 m with 1 pixel of bias. Conversely, when differences in ω , rather than φ , dominate the convergence angle, DSM accuracy becomes more sensitive to sample bias than line bias, and the loss in accuracy with bias is larger than for φ -dominated CAs as shown in Figure 16. Here, in the case of a 10° CA and 1-pixel bias, RMSEs increase from 7.52 m with φ -dominated CA and to 10.61 m with ω -dominated CA, respectively. Even a bias of 0.5 pixels decreases the DSM accuracy by a factor of 2. For selecting appropriate stereo pairs from the PlanetScope Dove constellation, the utilization of multi-path images is necessary. Importantly, stereo pairs involving multi-path images may introduce unforeseen biases in the RPCs, potentially leading to a degradation in quality, as shown in the analysis. Therefore, RPCs biases should be properly compensated before generating DSMs.

3.4.4. Multi-Pair DSM Analysis

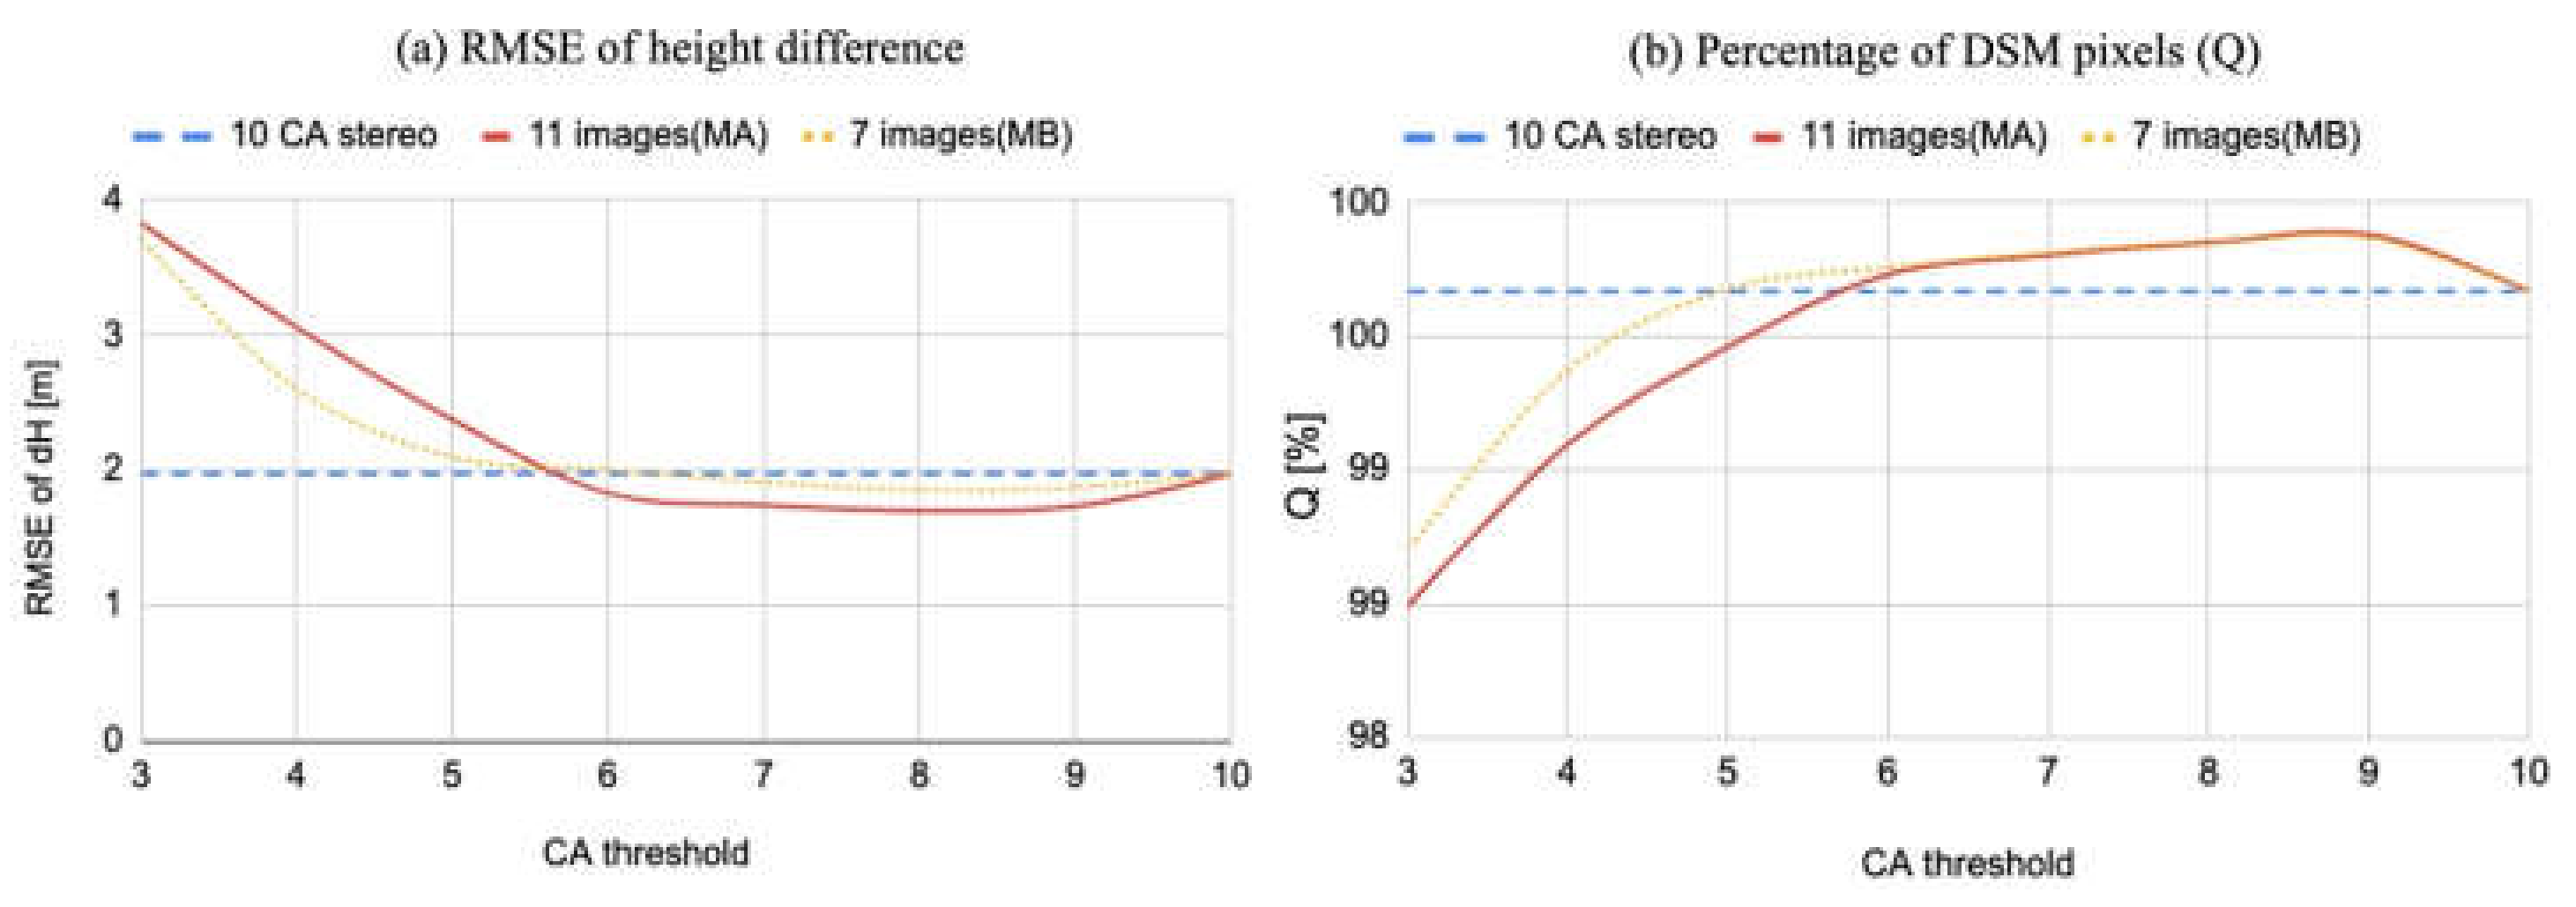
Based on the accuracy analysis in Section 3.4.1, multi-pair DSMs are generated from simulated stereo pairs with values in φ giving CAs greater than 3° CA. Two scenarios are applied for configuring stereo pairs. Case MA utilizes 11 simulated images with φ ranging from −5° to 5° at 1° intervals. Case MB utilizes 7 simulated images with φ ranging from 0° to 5° at 1° intervals, and an additional simulated image with a φ of −5°. Multi-pair DSMs are generated by selecting stereo pairs with CA greater than a threshold among all the possible pairs. With a threshold of the minimum CA of 3°, thus using all possible pairs (Figure 17), the RMSE and Q for the multi-pair DSMs are worse than for the 10° CA single-stereo pair due to the many blunders and matching failures arising from the stereo pairs with very narrow CAs. With a 6° CA threshold, the RMSE accuracy is 1.83 m for MA and 2.01 m for MB. This is the minimum CA threshold that results in an equal or better accuracy to the 1.98 m RMSE obtained from the 10° CA single stereo pair. In addition, Q values for both the MA and MB cases are higher than for the 10° CA stereo pair. MA utilizes 10 more stereo pairs than MB, and results in 10% better accuracy than MB. In the case of the 9° CA threshold, the numbers of added stereo pairs for the MA and MB case are 2 (−5° and 4° pair and 5° and −4° pair), and 1 (−5° and 4° pair) compared to the stereo case of 10° CA (−5° and 5° pair). In this case, the differences in RMSE and Q between the multi-pair and the stereo DSM are less than 0.30 m (1.74 m for MA, 1.88 m for MB, and 1.98 m for the 10° CA stereo pair) and 0.2%, respectively. However, the addition of one or two more stereo pairs to obtain the multi-pair DSM results in a much smoother surface texture (Figure 18). The inclusion of many additional stereo pairs with CAs less than 5° does not significantly improve the accuracy and quality of the multi-pair DSMs, with the best result (RMSE of 1.70 m) obtained from case MA with a CA threshold of 8°. Based on this result, we propose that a CA threshold of 6° is optimal for generating high-quality DSMs from PlanetScope multiple images. However, if there is an insufficient number of stereo pairs with a CA greater than the optimal threshold, using a single stereo pair of 10° can yield a better-quality DSM.

4. Discussion

We analyzed the relative accuracy and quality of PlanetScope Dove Classic stereo and multi-pair stereophotogrammetric DSMs in terms of geometric conditions such as convergence angles, azimuth angles, scales, and RPCs biases. For minimizing radiometric difference in stereo pairs, simulated images with a nadir-view reference image and a reference USGS DSM were generated to configure the stereo pairs. For the simulated image generation, we presented a methodology for retrieving the collinear equation representing RSMs from the provided RPCs of PlanetScope Dove images. With IOPs of calibrated focal lengths, principal point location, symmetric radial lens distortion, and decentering distortion estimated by self-calibrating bundle adjustment, we found the differences in RMSE between RSM and RFM in object and image space to be 0.25 m and 0.10 pixels, respectively. This proves that an accurate description of the relationship between image and object points, as defined by the collinear equation, requires the application of all eight IOPs. This analysis provides reference accuracy for converting RFM RPCs to RSM EOPs for PlanetScope Dove images. Moreover, the retrieved EOPs can be effectively employed to precisely determine stereo geometry parameters, including convergence angle. This is particularly significant when analyzing PlanetScope Dove images, which involve a narrow off-nadir angle range (−5° to 5°) compared to the conventional satellite stereo-mode images like WorldView. Based on the retrieved EOPs of the reference image, we generated simulated images with varying external orientations by adjusting the ω , φ , k , scale, and imposed biases in the RPCs. We then generated DSMs from stereo pairs consisting of the simulated images to demonstrate the relative relationship between DSM accuracy and stereo geometry in isolation from variations in image quality or changes in surface characteristics. The analysis in terms of the convergence angle (CA) configured by φ differences, which is the primary determinant of CA between PlanetScope Dove images, showed that pairs with the maximum CA of 10° were able to generate DSMs with a 1.96 m RMSE, which is half the accuracy (i.e., double the RMSE) of the 0.89 m RMSE of DSMs generated from stereo pairs with CA between 30° and 40° typical of stereo-mode imagers such as WorldView. A CA less than 2° resulted in DSMs with a 17.11 m RMSE, which is 17 times greater than the RMSE with a CA of 40° and displayed high-frequency noise with little or no useful surface height information. Single stereo-photogrammetric DSM generated from a PlanetScope Dove stereo pair with a CA exceeding 10° can offer valuable insights for surface change detection and monitoring, providing an accuracy that is approximately half of that achieved by conventional WorldView stereo mode DSMs. While adding additional ω differences (across-track) to the stereo pairs increased DSM accuracy and quality, the difference in ω between PlanetScope Dove images was less than 2°, resulting in a negligible improvement of less than 3% for stereo pairs with a CA greater than 3°. In addition, the influence of ω was negligible when employing stereo pairs with CA greater than 6°. Differences in azimuth angle and GSD between stereo pairs had a strong impact on DSM accuracy and quality arising from the sensitivity of area-based image matching on feature orientations and the texture information per pixel in a stereo pair. A mere 2° difference in k led to a reduction in accuracy of over 9% when using a 40° CA stereo pair. The sensitivity of RMSE reduction to k was greater when using a narrower CA stereo pair. A significant difference in GSD within a stereo pair resulted in more blunders and matching failures, with even a 4% GSD difference causing a drastic 40% reduction in accuracy for a 10° CA stereo pair. Therefore, DSM quality can be improved when the azimuth angle and GSD differences are minimized by utilizing stereo image pairs with the same satellite path and GSD. In addition, we analyzed the impact of RPC biases on DSM accuracy, finding that imposing a bias of less than 0.5 pixels can result in half the DSM accuracy (double the RMSE). In the case of a 10° CA and 1-pixel bias, the RMSEs increased from 1.98 m with no bias to 7.52 m with φ -dominated CA and to 10.61 m with ω -dominated CA, respectively. Thus, biases in the RPCs should be compensated before generating DSMs. DSM accuracy is more sensitive to differences in the k and GSD and RPCs biases for stereo pairs with narrower convergence angles. In addition, we validated the accuracy and quality of multi-pair DSMs with simulated stereo pairs selected by minimum CA thresholds ranging from 3° to 10°. Using all possible stereo pairs, including those with a CA less than 5°, resulted in DSMs of lower accuracy and quality than those created with higher CA thresholds because the narrow CA stereo pairs contain extensive blunders and matching failures. Including only stereo pairs with a CA greater than 6° resulted in DSMs with 1.83 m and 2.01 m accuracies close to the best DSM accuracy of 1.74 m and 1.88 m, which were generated from single stereo pairs with more than 8° CA. Based on the result, a CA threshold of 6° was optimal for generating high-quality DSMs from PlanetScope multiple images. Further, surface roughness was effectively reduced by adding one or two more stereo pairs in multi-pair DSM processing and the RMSE difference between multi-pair and the stereo DSM was less than 0.30 m. These results are relative, in that they were derived from simulated images and a reference DSM based on a single DSM extraction algorithm (SETSM), so that the level of quality improvement and degradation of DSMs with real images will be variable depending on image properties and applicable matching algorithms.

5. Conclusions

This study focuses on analyzing the sensitivity of PlanetScope Dove DSM accuracy and quality to the geometric conditions of stereo pairs, including convergence angle, azimuth angle, ground sample distance, and RPCs bias. To isolate the impact of radiometric conditions and solely consider image geometric conditions, simulated images are generated from a reference nadir-view PlanetScope Dove image. These simulated images are generated by adjusting the EOPs of the reference image estimated from a self-calibrating bundle adjustment with IOPs of calibrated focal lengths, principal point location, symmetric radial lens distortion, and decentering distortion. By comparing a high-quality reference DSM with the DSMs generated from the simulated images, the relative relationship between the accuracy and quality of PlanetScope Dove DSMs and the geometric conditions of stereo pairs is quantitatively represented using RMSE and Q metrics. The findings of this analysis can be utilized in the selection of stereo pairs for generating single- and multi-pair DSMs from PlanetScope Dove Classic images, depending on the desired accuracy and the availability of images. Furthermore, these results can contribute to improving the accuracy and quality over previously published PlanetScope Dove DSMs, for which stereo pairs were selected manually and/or empirically. Thus, this study successfully provides quantified reference information that guides the best methodology for filtering and selecting stereo pairs during the process of multi-pair DSM generation using PlanetScope Dove data. Moreover, the experimental approach of utilizing simulated images with varying characteristics to create and analyze DSMs can be applied to design new satellite sensors. In the future, we plan to develop a fully automated multi-pair DSM generation algorithm optimized for PlanetScope Dove images. This algorithm will incorporate conditions for stereo pair selection, minimize differences in ground sample distances, and relatively compensate for RPC biases to maximize DSM accuracy and quality. Additionally, the algorithm will be extended to accommodate multi-sensor and/or multi-resolution images.

Author Contributions

Conceptualization, M.-J.N.; methodology, M.-J.N.; software, M.-J.N.; validation, M.-J.N.; formal analysis, M.-J.N.; investigation, M.-J.N.; resources, M.-J.N. and I.M.H.; data curation, M.-J.N. and I.M.H.; writing—original draft preparation, M.-J.N.; writing—review and editing, I.M.H.; visualization, M.-J.N.; supervision, I.M.H.; project administration, I.M.H.; funding acquisition, M.-J.N. and I.M.H. All authors have read and agreed to the published version of the manuscript.

Funding

This work was funded by grants #80NSSC22K1093 and #80NSSC20K1422 from the U.S. National Aeronautics and Space Administration, and #1559691 from the U.S. National Science Foundation Office of Polar Programs.

Data Availability Statement

Data sharing is not applicable to this article.

Acknowledgments

The Polar Geospatial Center provided the Planet Dove image as part of the NASA Commercial Smallsat Data Acquisition Program.

Conflicts of Interest

The authors declare no conflict of interest. The funders had no role in the design of the study; in the collection, analyses, or interpretation of data; in the writing of the manuscript; or in the decision to publish the results.

Glossary of Acronyms

ALOSAdvanced Land Observing Satellite
B/HBase-to-Height
CAConvergence Angle
CCDCharge-Coupled Device
DEMDigital Elevation Model
DNDigital Number
DSMDigital Surface Model
EOPExterior Orientation Parameter
GCPGround Control Point
GSDGround Sample Distance
IOPInterior Orientation Parameters
LiDARLight Detection And Ranging
NIRNear Infrared
NTSCNational Television System Committee
REMAReference Elevation Model of Antarctica
RFMRational Function Model
RMSERoot Mean Square Error
RPCRational Polynomial Coefficient
PRISMPanchromatic Remote-sensing Instrument for Stereo Mapping
RSMRigorous Sensor Model
SETSMSurface Extraction from TIN-based Search-space Minimization
SRTMShuttle Radar Topography Mission
TINTriangulated Irregular Network
USGSUnited State Geological Survey
UTMUniversal Transverse Mercator
3DEP3D Elevation Program
Glossary of Variables
Ln, Snnormalized line and sample image coordinates in RPCs
P, L, Hnormalized latitude, longitude, and height coordinates in RPCs
ρ , λ, hactual latitude and longitude coordinates, and height.
Lineimage line pixel number starting from the center of the first line
Samplesample pixel number starting from the center of the left-top sample
c, d, e, f78 RPCs (c and d are numerator and denominator of 38 RPCs for Ln, and e and f are numerator and denominator of 38 RPCs for Sn)
np, nlnumber of GCP spacing in latitude and longitude direction for GCP distribution by the provided RPCs
hlnumber of height layer for GCP distribution by the provided RPCs
X, Y, Z3D object coordinates
Xc, Yc, Zc3D projection center coordinates of image
xphoto, yphotox and y image coordinates in photo coordinate system
x, ymeasured photo coordinates corresponding to 3D object point
x 0 ,   y 0 photo coordinates of the projection center
x p ,   y p photo coordinates of the principal point
q 1 ,   q 2 ,   q 3 symmetric radial lens distortion coefficients
p 1 ,   p 2 decentering distortion coefficients
flcalibrated focal length
ω ,   φ ,   k omega, phi, and kappa angles corresponding to X, Y, and Z axes
mrotation matrix in terms of three angular attitudes ( ω ,   φ ,   k )
ω ICoriginorigin of the image coordinate system
PCoriginorigin of the photo coordinate system
Cimage point
PCprojection center point
Oobject point
Occenter object point of the reference object boundary
S ω ,   S φ shifted distance corresponding to ω and     φ rotations
DEuclidean distance
SCimage’s scale
Xadj, Yadjadjusted distance estimated from the photo coordinate difference between reference and simulated projection center
FPCprojection center after applying distance adjustment
UPCiteratively updated projection center by ray tracing
CScell size of the charge-coupled device sensor
dDdifference between Euclidean distance
ZDdistance in Z axis
niteration number
v projection ray vector
n x ,   n y ,   n z normalized vector corresponding to X, Y, and Z axes
Qpercentage of the pixels within ±10 m of height difference.

References

  1. Planet Imagery and Archive. Available online: https://www.planet.com/products/planet-imagery (accessed on 25 March 2023).
  2. Ghuffar, G. DEM generation from Multi Satellite PlanetScope Imagery. Remote Sens. 2018, 10, 1462. [Google Scholar] [CrossRef] [Green Version]
  3. Aati, S.; Avouac, J.-P. Optimization of Optical Image Geometric Modeling, Application to Topography Extraction and Topographic Change Measurements Using PlanetScope and Skysat Imagery. Remote Sens. 2020, 12, 3418. [Google Scholar] [CrossRef]
  4. D’angelo, P.; Reinartz, P. Digital Elevation Models from Stereo, Video and Multi-View Imagery Captured by Small Satellites. Int. Soc. Photogramm. Remote Sens. (ISPRS)-Int. Arch. Photogramm. Remote Sens. Spat. Inf. Sci. 2021, 43, 77–82. [Google Scholar] [CrossRef]
  5. Huang, D.; Tang, Y.; Qin, R. An evaluation of planetscope images for 3D reconstruction and change detection—Experimental validations with case studies. GIScience Remote Sens. 2022, 59, 744–761. [Google Scholar] [CrossRef]
  6. Jacobsen, K.; Topan, H. DEM generation with short base length Pleiades triplet. In Proceedings of the International Archives of the Photogrammetry, Remote Sensing and Spatial Information Sciences Joint ISPRS Conference, Munich, Germany, 25–27 March 2015. [Google Scholar]
  7. Noh, M.-J.; Howat, I.M. The Surface Extraction from TIN based Search-space Minimization (SETSM) algorithm. Int. Soc. Photogramm. Remote Sens. (ISPRS) J. Photogramm. Remote Sens. 2017, 129, 55–76. [Google Scholar] [CrossRef]
  8. Noh, M.-J.; Howat, I.M. Automated stereo-photogrammetric DEM generation at high latitudes: Surface Extraction with TIN-based Search-space Minimization (SETSM) validation and demonstration over glaciated regions. GIScience Remote Sens. 2015, 52, 198–217. [Google Scholar] [CrossRef]
  9. Howat, I.M.; Porter, C.; Smith, B.E.; Noh, M.-J.; Morin, P. The Reference Elevation Model of Antarctica. Cryosphere 2019, 13, 665–674. [Google Scholar] [CrossRef] [Green Version]
  10. Tao, C.V.; Hu, Y. A Comprehensive Study of the Rational Function Model for Photogrammetric Processing. Photogramm. Eng. Remote Sens. 2001, 64, 1347–1357. [Google Scholar]
  11. Grodecki, J.; Dial, G. Block adjustment of high-resolution satellite images described by rational polynomials. Photogramm. Eng. Remote Sens. 2003, 69, 59–68. [Google Scholar] [CrossRef]
  12. Wolf, P.R.; Dewitt, B.A.; Wilkinson, B.E. Elements of Photogrammetry with Applications in GIS, 4th ed.; McGraw-Hill Education: New York, NY, USA, 2014; pp. 490–491. [Google Scholar]
  13. USGS. Available online: https://www.sciencebase.gov/catalog/item/61b19badd34eb8f531255a27 (accessed on 30 May 2023).
  14. Understanding PlanetScope Instruments. Available online: https://developers.planet.com/docs/apis/data/sensors (accessed on 25 March 2023).
  15. Noh, M.-J.; Howat, I.M. Automated Coresistration of Repeat Digital Elevation Models for Surface Elevation Change Measurement Using Geometric Constraints. IEEE Trans. Geosci. Remote Sens. 2014, 52, 2247–2260. [Google Scholar] [CrossRef]
  16. Noh, M.-J.; Howat, I.M. Automatic relative RPC image model bias compensation through hierarchical image matching for improving DEM quality. Int. Soc. Photogramm. Remote Sens. (ISPRS) J. Photogramm. Remote Sens. 2018, 136, 120–133. [Google Scholar] [CrossRef]
Figure 1. Workflow for simulated image generation from the reference PlanetScope Dove image and DSM. (a) Reference Planet Dove image (left) and reference DSM (right). The DSM is in UTM projection with a unit of meter. (b) GCPs generation with horizontal layers of heights and the provided RPCs. The illustration is modified from Tao and Hu [10]. (c) simulated image.
Remotesensing 15 03496 g001
Figure 2. Comparison between image coordinate (Sample, Line) and photo coordinate ( x p h o t o , y p h o t o ) system. I C o r i g i n (top-left of image) and P C o r i g i n (center of image) are the origin of the image and photo coordinate system, respectively.
Remotesensing 15 03496 g002
Figure 3. Horizontal projection center position with positive (a) φ and (b) ω rotation under the assumption that the reference image is perpendicular to the horizontal plane. PC is the projection center. Oc is the object center point determined by the boundary of horizontal plane. C is the projected point on the image plane by the perspective ray connecting between Oc and PC. D r e f and D s i m are the Euclidean distances between PCref and Oc, and PCsim and Oc, respectively. The shift distances S φ and S ω correspond to the φ and ω rotations. The subscripts ref and sim denote the reference and simulated images, respectively. k rotation is not shown in the figure since k does not change the projection center location.
Remotesensing 15 03496 g003
Figure 4. Determination of the altitude of the projection center with distance adjustment. PCsim is the projection center determined by the horizontal adjustment with rotations. FPCsim is the projection center after the distance adjustment. UPCsim is the iteratively updated projection center determined from ray tracing. Dtarget is the Euclidean distance defined by the desired image resolution.
Remotesensing 15 03496 g004
Figure 5. Simulated image generation with the reference image and DSM.
Remotesensing 15 03496 g005
Figure 6. Two-dimensional frame detector of the PlanetScope Dove Classic sensor and an example image [14].
Remotesensing 15 03496 g006
Figure 7. Reference image and DSM. The DSM is projected by UTM with a unit of meter. The DSMs are generated over the target area from the simulated images.
Remotesensing 15 03496 g007
Figure 8. Examples of simulated images. In the top three rows, the image orientation angles ω , φ , and k are rotated by (left) +20° and (right) −20° relative to the reference image. The images in the fourth row are scaled with a ratio of (left) 120% (coarser resolution) and (right) 80% (finer resolution) of the distance relative to the reference image. All simulated images have the same image size as the reference image.
Remotesensing 15 03496 g008
Figure 9. Comparison between the reference DSM and the simulated DSM with 40° CA. The stereo pair is configured with +20° and −20° φ images.
Remotesensing 15 03496 g009
Figure 10. (a) RMSE of height difference (dH) between the reference DEM and simulated DSMs in terms of φ differences (CA). Note the y axis is in logarithmic scale. (b) Percentage, Q, of DSM pixels with dH ± 10 m in terms of φ differences (CA). Note the y axis is in exponential scale.
Remotesensing 15 03496 g010
Figure 11. DSMs (in meters above datum) and dH (in meters) comparison in terms of CA stereo pairs.
Remotesensing 15 03496 g011
Figure 12. (a) RMSE of height difference (dH) between the reference DEM and simulated DSMs in terms of the difference in ω based on CA of stereo pairs. RMSE of the CA case number 2 is 17.11, 9.40, 7.23, 6.38, 4.39, and 4.02 for each ω difference. (b) Percentage (Q) of DSM pixels with dH within ±10 m for each ω difference based on CA stereo pairs. Q of the second CA case is 81.88, 85.26, 89.59, 94.43, 96.99, and 98.30 at each ω difference case.
Remotesensing 15 03496 g012
Figure 13. (a) RMSE of height difference (dH) between the reference DEM and simulated DSMs for values of the difference in k between stereo pairs. (b) Percentage of DSM pixels (Q) within ±10 m dH for different values of k .
Remotesensing 15 03496 g013
Figure 14. (a) RMSE of height difference (dH) between the reference DEM and simulated DSMs for values of the relative difference in scale ratio between stereo pairs. (b) Percentage (Q) of DSM pixels within ±10 m height dH for values of the relative difference in scale ratio between stereo pairs.
Remotesensing 15 03496 g014
Figure 15. RMSE of height difference (dH) between the reference DEM and simulated DSMs in terms of imposed RPCs sample (a) and line (b) bias based on CA for differences in φ .
Remotesensing 15 03496 g015
Figure 16. RMSE of height difference (dH) between the reference DEM and simulated DSMs in terms of imposed PRCs sample (a) and line (b) bias based on CA for differences in ω .
Remotesensing 15 03496 g016
Figure 17. (a) RMSE of height difference (dH) between the reference DEM and simulated multi-pairs DSMs in terms of CA threshold based on image counts. The 10° threshold case has one stereo pair with −5° and 5° φ rotated images for all three cases. (b) Percentage (Q) of DSM pixels within ±10 m dH for CA thresholds based on image counts.
Remotesensing 15 03496 g017
Figure 18. DSM hillshade comparison between the reference USGS DSM and the scenario DSMs in the case of 9° CA threshold.
Remotesensing 15 03496 g018
Table 1. Accuracy comparison between the provided RPCs/RFM and RSM defined by the estimated orientations in terms of applied IOPs through a self-calibrating bundle adjustment.
CaseInterior Orientation
Parameters
RMSEMax Difference
Object (m)Image (Pixel)Object (m)Image (Pixel)
1fl9.922.6026.967.06
2fl, xp, yp9.762.5627.307.16
3fl, xp, yp, q1, q2, q30.700.201.630.45
4fl, xp, yp, q1, q2, q3, p1, p20.250.100.650.25
Disclaimer/Publisher’s Note: The statements, opinions and data contained in all publications are solely those of the individual author(s) and contributor(s) and not of MDPI and/or the editor(s). MDPI and/or the editor(s) disclaim responsibility for any injury to people or property resulting from any ideas, methods, instructions or products referred to in the content.