Article

High-Accuracy Filtering of Forest Scenes Based on Full-Waveform LiDAR Data and Hyperspectral Images

1
School of Remote Sensing and Information Engineering, Wuhan University, Wuhan 430079, China
2
Department of Oceanography, Dalhousie University, Halifax, NS B3H 4R2, Canada
3
Faculty of Resources and Environmental Science, Hubei University, Wuhan 430062, China
4
Zhejiang Academy of Surveying and Mapping Science and Technology, Hangzhou 310030, China
5
School of Resources Environment Science and Technology, Hubei University of Science and Technology, Xianning 437100, China
6
College of Marine Technology and Surveying and Mapping, Jiangsu Ocean University, Lianyungang 222005, China
*
Author to whom correspondence should be addressed.
Remote Sens. 2023, 15(14), 3499; https://doi.org/10.3390/rs15143499
Submission received: 5 June 2023 / Revised: 25 June 2023 / Accepted: 9 July 2023 / Published: 12 July 2023

Abstract

:
Airborne light detection and ranging (LiDAR) technology has been widely utilized for collecting three-dimensional (3D) point cloud data on forest scenes, enabling the generation of high-accuracy digital elevation models (DEMs) for the efficient investigation and management of forest resources. Point cloud filtering serves as the crucial initial step in DEM generation, directly influencing the accuracy of the resulting DEM. However, forest filtering presents challenges in dealing with sparse point clouds and selecting appropriate initial ground points. The introduction of full-waveform LiDAR data offers a potential solution to the problem of sparse point clouds. Additionally, advancements in multi-source data integration and machine learning algorithms have created new avenues that can address the issue of initial ground point selection. To tackle these challenges, this paper proposes a novel filtering method for forest scenes utilizing full-waveform LiDAR data and hyperspectral image data. The proposed method consists of two main steps. Firstly, we employ the improved dynamic graph convolutional neural network (IDGCNN) to extract initial ground points. In this step, we utilize three types of low-correlation features: LiDAR features, waveform features, and spectral features. To enhance its accuracy and adaptability, a self-attention module was incorporated into the DGCNN algorithm. Comparative experiments were conducted to evaluate the effectiveness of the algorithm, demonstrating that the IDGCNN algorithm achieves the highest classification accuracy with an overall accuracy (OA) value of 99.38% and a kappa coefficient of 95.95%. The second-best performer was the RandLA-net algorithm, achieving an OA value of 98.73% and a kappa coefficient of 91.68%. The second step involves refining the initial ground points using the cloth simulation filter (CSF) algorithm. By employing the CSF algorithm, non-ground points present in the initial ground points are effectively filtered out. To validate the efficacy of the proposed filtering method, we generated a DEM with a resolution of 0.5 using the ground points extracted in the first step, the refined ground points obtained with the combination of the first and second steps, and the ground points obtained directly using the CSF algorithm. A comparative analysis with 23 reference control points revealed the effectiveness of our proposed method, as evidenced by the median error of 0.41 m, maximum error of 0.75 m, and average error of 0.33 m.

Graphical Abstract

1. Introduction

Airborne LiDAR systems are used as a tool to accurately and quickly obtain 3D ground data [1], and the 3D point cloud data obtained with them are widely used in the rapid production of large-scale digital elevation models (DEMs) [2,3,4,5]. Extracting ground points from raw point cloud data, which is also called filtering, is the most important step in the process of generating high-accuracy DEMs [6,7,8]. Traditional manual-processing methods are inefficient for processing large-scale point cloud data due to low processing efficiency and unstable filtering results. To solve these problems, some high-accuracy automatic airborne LiDAR point cloud filtering algorithms have emerged. These algorithms can be grouped into the following five categories: slope-based approaches, morphology-based approaches, surface-based approaches, triangulated irregular network (TIN)-based approaches, and segmentation-based approaches [9].
These filtering algorithms perform well on flat and simple scenes. However, when these algorithms are used to process LiDAR data on forest areas, the accuracy of the filtering results drops significantly [10,11,12]. To obtain better filtering results for forest scenes, specific filtering algorithms have been developed in the past two decades to extract high-accuracy digital terrain models (DTMs) of forest canopies, some of which are shown in Table 1.
Although the above-mentioned methods perform well for most types of terrain, they usually cannot adapt automatically to different scenarios. Moreover, most of them require adjusting multiple parameters to achieve satisfactory filtering accuracy. Machine learning algorithms, with their superior efficiency and performance, are often used by the academic community to automatically process various remote-sensing images [22,23]. To improve the automation of algorithms and reduce parameter settings, various machine learning algorithms are continuously being applied to the classification and segmentation of LiDAR data, and great success has been achieved.
Nourzad et al. proposed an ensemble framework (Adaptive Boosting (AdaBoost) and bagging) to improve the generalization performance of filtering by minimizing type-II errors [24]; Shi et al. proposed an airborne LiDAR data filtering method based on an adaptive mapping least-squares support-vector machine (LSSVM) [25]; Ma et al. compared the performance of three machine learning algorithms (AdaBoost, SVM, and random forest (RF)) in point cloud filtering and introduced the concept of transfer learning in point cloud data processing for the first time [26]; Hui et al. proposed a filtering method that can iteratively build and update SVM models according to an active learning strategy [8]. Although machine learning methods can improve the efficiency and accuracy of point cloud classification, these traditional machine learning methods are greatly affected by parameter settings and feature selection.
The success of network- or deep-learning-based methods applied to image processing has promoted the application of data-driven methods in airborne LiDAR data processing. More and more researchers have utilized network-based or deep-learning-based methods instead of classical machine learning methods as filters and have achieved promising results. Jahromi et al. proposed a novel filtering algorithm using an artificial neural network (ANN), wherein the first echo was added to increase the reliable detection of vegetation areas, and the experimental results showed that the algorithm can effectively reduce type-II errors [27]. Hu and Yuan proposed a new filtering method using a deep convolutional neural network (CNN) based on deep learning. They first extract and convert the points adjacent to points with a spatial context within the same window into an image, and the deep CNN model is then used for training, and the experimental results show that the algorithm has a lower overall error rate [28]. Rizaldy et al. converted point clouds into multi-dimensional images and then used a fully convolutional network (FCN) with dilated kernels to perform image classification. The experimental results show low values for total errors and class-I errors [29].
The above network-based methods all convert the original point cloud into an image in the process of data processing, which inevitably leads to information loss. PointNet was the first deep learning algorithm into which raw point clouds could be input. It extracts features directly from the original point cloud and keeps transformation invariance by using a symmetric function to deal with permutation invariance and by normalizing the input points [30]. However, the PointNet algorithm only learns features from the 3D coordinates of each point, ignoring the direct topological relationship between points. As an extension of PointNet, PointNet++ uses the set abstraction structure to extract features layer by layer so that the sampled points fuse the feature information of neighboring points [31]. To improve the efficiency of the algorithm, RandLA-Net uses random sampling instead of the farthest point sampling (FPS) used in PointNet++ [32]. The random sampling method greatly reduces the computational consumption and also enhances the processing ability of the algorithm for large-scale scenes. Xiao et al. designed a convolutional fusion network named FPS-Net, which exploits the uniqueness and difference between projected image channels to achieve optimal point cloud segmentation [33]. To improve the point cloud classification accuracy of deep learning algorithms for regions with complex structures and extreme scale changes, [34] proposed a novel receptive field fusion layered network (RFFS-Net). The algorithm obtains a multi-receptive field feature representation through receptive field fusion and layering to improve the problem of a single receptive field.
The filtering of point clouds based on deep learning is not sufficient for extracting geometric information using traditional methods such as calculation or differentiation, so more powerful learning-based methods are needed. Compared with the former, the dynamic graph CNN (DGCNN) algorithm tends to search for semantic clues and consistency in point clouds, rather than salient geometric features such as corner and edge points [35]. Unlike previous CNN-like algorithms, DGCNN is a CNN architecture that can directly use point clouds as input. To obtain sufficient local information, DGCNN builds directed graphs in both Euclidean space and feature space and dynamically updates features layer by layer.
Algorithms such as PointNet and DGCNN are very common in the classification and segmentation of point clouds acquired with backpack and vehicle LiDAR, but there are few applications of these algorithms for airborne LiDAR point cloud filtering. The characteristics of a wide data range and low point cloud density make it more difficult to extract objects from airborne point cloud data via spatial three-dimensional information alone compared with the first two types of data. In addition to algorithmic issues, point cloud data also plays an important role in the filtering process.
Traditional laser emitters are susceptible to the impact of a dense forest canopy, resulting in a reduction in the number of laser pulses reaching the ground, and, therefore, only sparse ground points can be collected, although the interpolation method can simulate some points. The accuracy of these simulated points depends largely on the complexity of the terrain and the algorithms being utilized. In the past two decades, with the development of LiDAR systems and related technologies, a brand new airborne laser scanning system, the small-spot full-waveform LiDAR system, has emerged. This new LiDAR system brings hope as a solution to the sparse point cloud problem. Traditional discrete-echo LiDAR sensors only record a limited number of echoes (one or more echoes) per laser pulse, while full-waveform LiDAR sensors can record an entire echo signal at equal time intervals and obtain an almost continuous waveform [36]. Compared with the data obtained with discrete-echo LiDAR, full-waveform LiDAR data have the following two advantages: (1) An echo signal received by a full-waveform LiDAR system contains more comprehensive ground geometry information. Full-waveform LiDAR data can describe the roughness, horizontal distribution, and vertical structure of target objects in more detail than traditional LiDAR data (especially in forest scenes) [37]. (2) After full-waveform data are processed via waveform decomposition, more abundant high-density, high-accuracy 3D point cloud data and additional waveform information (pulse width, amplitude, etc.) can be obtained. The obtained waveform parameters not only make the waveform data processing more accurate but can also reflect the characteristics of ground objects, which can mitigate the shortcomings of traditional discrete LiDAR data with only three-dimensional spatial information. Therefore, this new type of LiDAR data demonstrates great advantages in forest scene filtering.
Doneus and Briese used a simple threshold to eliminate all the last echo points with echo widths that are significantly larger than the echo width of the system waveform to exclude low-vegetation points for a more reliable DTM [38]. Wagner et al. found that vegetation generally causes the backscatter pulse to broaden, and canopy echoes generally have a smaller backscatter cross-section than terrain echoes. Therefore, they established a simple decision tree method to remove vegetation echoes before filtering to improve the quality of a DEM. This method classifies all the last echo points with echo widths greater than 1.9 ns and total cross-sections of less than 0.08 m2 as vegetation echoes, while all other points (first and middle echoes) are also assigned to the vegetation class [39]. To further improve filtering accuracy, Lin et al. added pulse width information to the progressive densification filter developed by Axelsson. In their algorithm, points with echo widths smaller than 2.69 ns are classified as smooth surface points (i.e., potential ground points), and the remaining points are classified as rough surface points [40]. Hu et al. proposed a method based on “seed Gaussian decomposition” to detect weak pulses (with low amplitudes) generated by the terrain under trees to obtain a denser sampling of terrain points, using the newly detected terrain points to construct a new TIN. They iteratively performed echo detection, topographic point identification, and TIN generation until no new ground points were detected [41]. Xing et al. used half-wave width information to screen out abnormal ground seed points and added half-wave width information in the process of weighted surface fitting to improve the accuracy of ground point extraction [42]. Ma et al. calculated echo widths and backscatter coefficients according to the parameters extracted via decomposition to determine the threshold for distinguishing low-vegetation points and ground points through statistical means. Finally, all marked low-vegetation points were filtered out to obtain a higher-accuracy DEM [43].
Although full-waveform LiDAR can provide waveform features that are beneficial for forest scene filtering, results based on the integration of LiDAR and hyperspectral digital imagery data sources have been shown to be superior to those obtained using a single data source [44]. This is because the spectral curves of different ground objects have their own unique spectral characteristics, and a hyperspectral image (HI) can completely record the continuous spectral information of the measured area. For example, the reflectance of soil in the visible light band is positively correlated with the wavelength, whereby the reflectance of vegetation rises sharply at approximately 700 nm, forming the unique red edge feature of vegetation. Therefore, using the spectral information contained in hyperspectral images can effectively distinguish trees from the ground. In recent years, graph convolutional networks (GCNs) have been widely used in hyperspectral image (HSI) classification, while more excellent networks have been developed and applied, such as adaptive filter and aggregator fusion graph convolution (AF2GNN), unsupervised autocorrelation learning for large-scale HSI smooth enhanced locality preserving graph convolutional embedding clustering (LGCC), a novel multi-adaptive receptive-field-based graph neural framework for HSI classification (MARP), a new multi-scale receptive field map attention neural network (MRGAT) that exhibits high efficiency and high robustness in the classification process [45,46,47,48], etc.
Many studies have shown that the fusion of hyperspectral image information can effectively improve the classification of point cloud data. Dalponte et al. used hyperspectral and LiDAR data to achieve the classification of complex forest scenes. They found that the elevation values of LiDAR data are very effective for separating species with similar spectral characteristics but different average heights [49]. To enhance land cover classification based on point clouds, Wang et al. first proposed a “voxelization” method to synthesize a synthetic waveform (SWF) and also proposed a vertical energy distribution coefficient (VEDC) feature to extract features from the SWF. Finally, an SWF and HI were fused to form a complete feature space for classification [50]. Chu et al. developed an efficient multi-sensor data fusion method to integrate hyperspectral data and full-waveform LiDAR information based on minimum noise fraction and principal component analysis. Then, they used support-vector machines to classify mountainous land cover. The classification results showed that the tea garden classification results based on fusion data were more complete and compact [51].
In order to achieve the high-precision filtering of airborne point cloud data on forest scenes, this paper proposes a two-step data-processing method based on hyperspectral images and full-waveform LiDAR data, which is suitable for ground point cloud extraction in forest scenes. The main contributions of this paper are as follows:
  • We introduce a deep learning algorithm to implement the automatic filtering of point clouds. Aiming at the difficulty of the traditional DGCNN algorithm establishing correlations between multiple related inputs, we added a self-attention layer to enhance the connections between different types of features to improve the filtering accuracy of the DGCNN algorithm and its adaptability to the multiple features used in this paper. At the same time, in order to reduce the classification error of point clouds processed with the improved DGCNN algorithm, we also added a post-processing operation based on the cloth filter algorithm.
  • Considering the sparseness of ground point clouds in forest scenes, this paper uses airborne full-waveform LiDAR data as one of the data sources and uses a waveform decomposition algorithm to decompose the airborne full-waveform LiDAR data to increase the densities of point clouds. This paper also uses hyperspectral data on the sampled area and discusses the filtering effect of multi-source data composed of hyperspectral images and full-waveform LiDAR data on forest scenes.

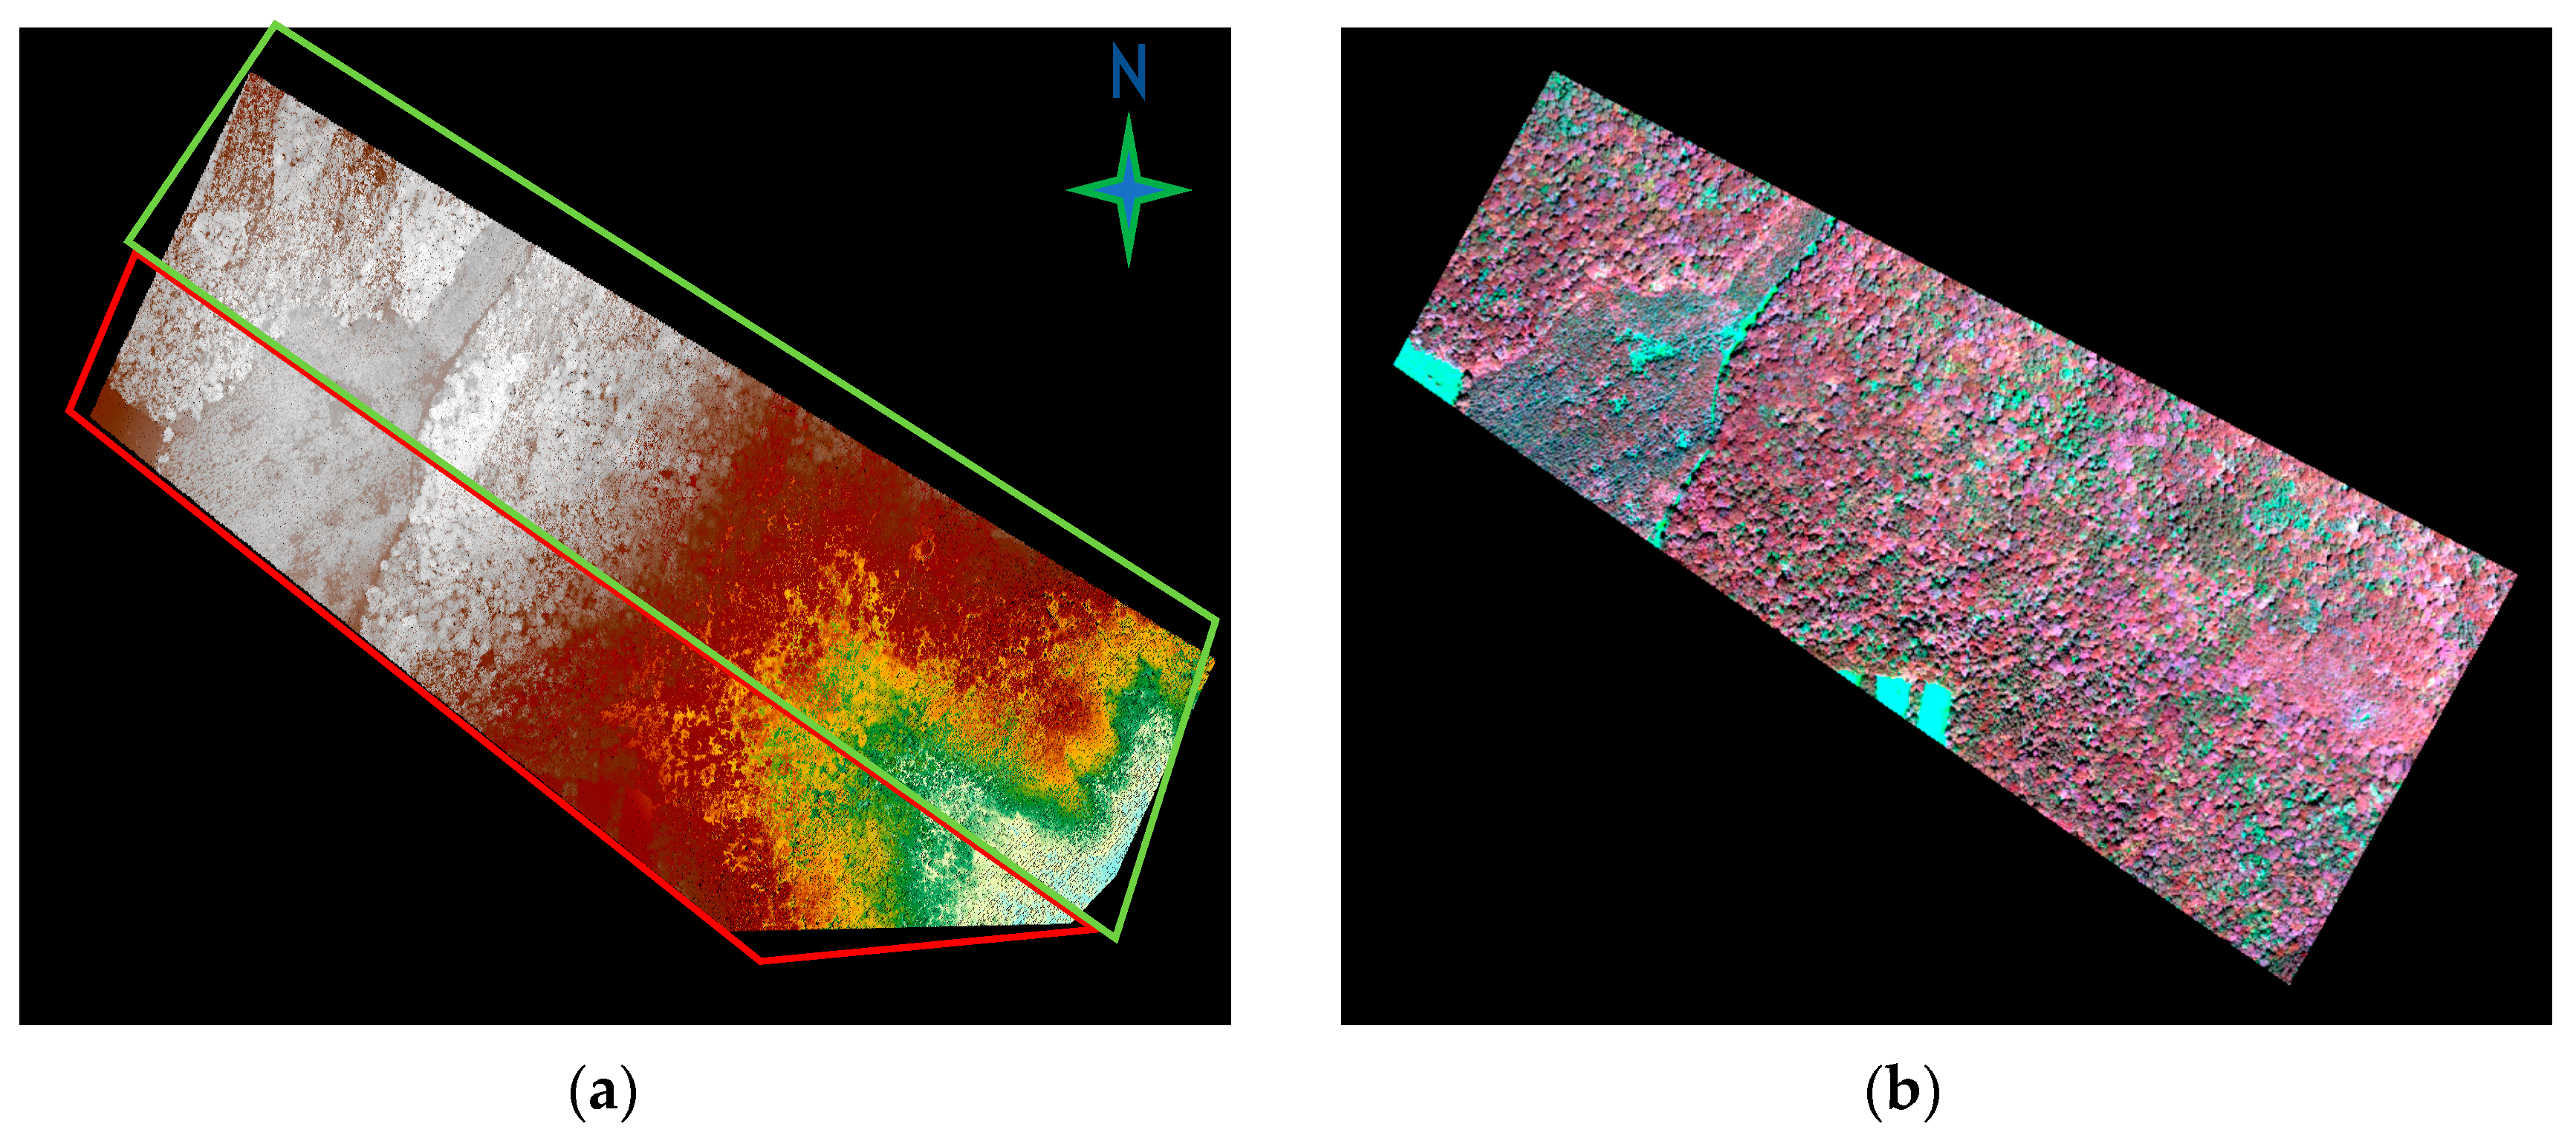
2. Study Area and Datasets

As shown in Figure 1a, the experimental data used in this paper were collected from Mengjiagang Forest Farm, Huanan County, Jiamusi City, Heilongjiang Province, China. Mengjiagang Forest Farm is located at the western foot of Wanda Mountain, with a total area of 167 square kilometers. Artificial afforestation accounts for 76.7% of the forest area and larch, and Pinus sylvestris and Korean pine account for approximately 80%. The actual data collection location was located at a latitude of 46.438757° north and a longitude of 130.833224° east. The region has a cold temperate continental monsoon climate with four distinct seasons. The data were collected in 2020, with an original point cloud density of approximately 14 points/m2. The elevation of the area ranges from 247.6 m to 591.2 m, and the area is thickly forested with mainly two species of trees: larch and red pine. Roads, bare soils, and agricultural lands are distributed sporadically. The area slopes from west to east, and the overall terrain is high in the northeast, flat in the middle, and hilly in the southwest.
A hyperspectral-imaging camera was integrated with the airborne LiDAR system to collect hyperspectral images synchronously, and the two devices were physically aligned so that the two datasets were registered without post-processing. The image contained 125 spectral bands, wherein the spectrum distribution ranged from 400.8 nm to 987.2 nm, with channels 1–80 being within the visible light spectrum and channels 81–125 being within the infrared spectrum. The hyperspectral image is shown in Figure 1b.
The total number of training data was approximately 9.76 million points. The total number of test data was approximately 5.96 million points. The algorithm randomly selected 30% of the training data for verification during each training process. As shown in Figure 1a, low vegetation, high forest areas, roads, and partially bare ground could be found in each dataset. The true categories of the training data were manually labeled, wherein there were 959,405 ground points and 14.778 million non-ground points.

3. Methodology

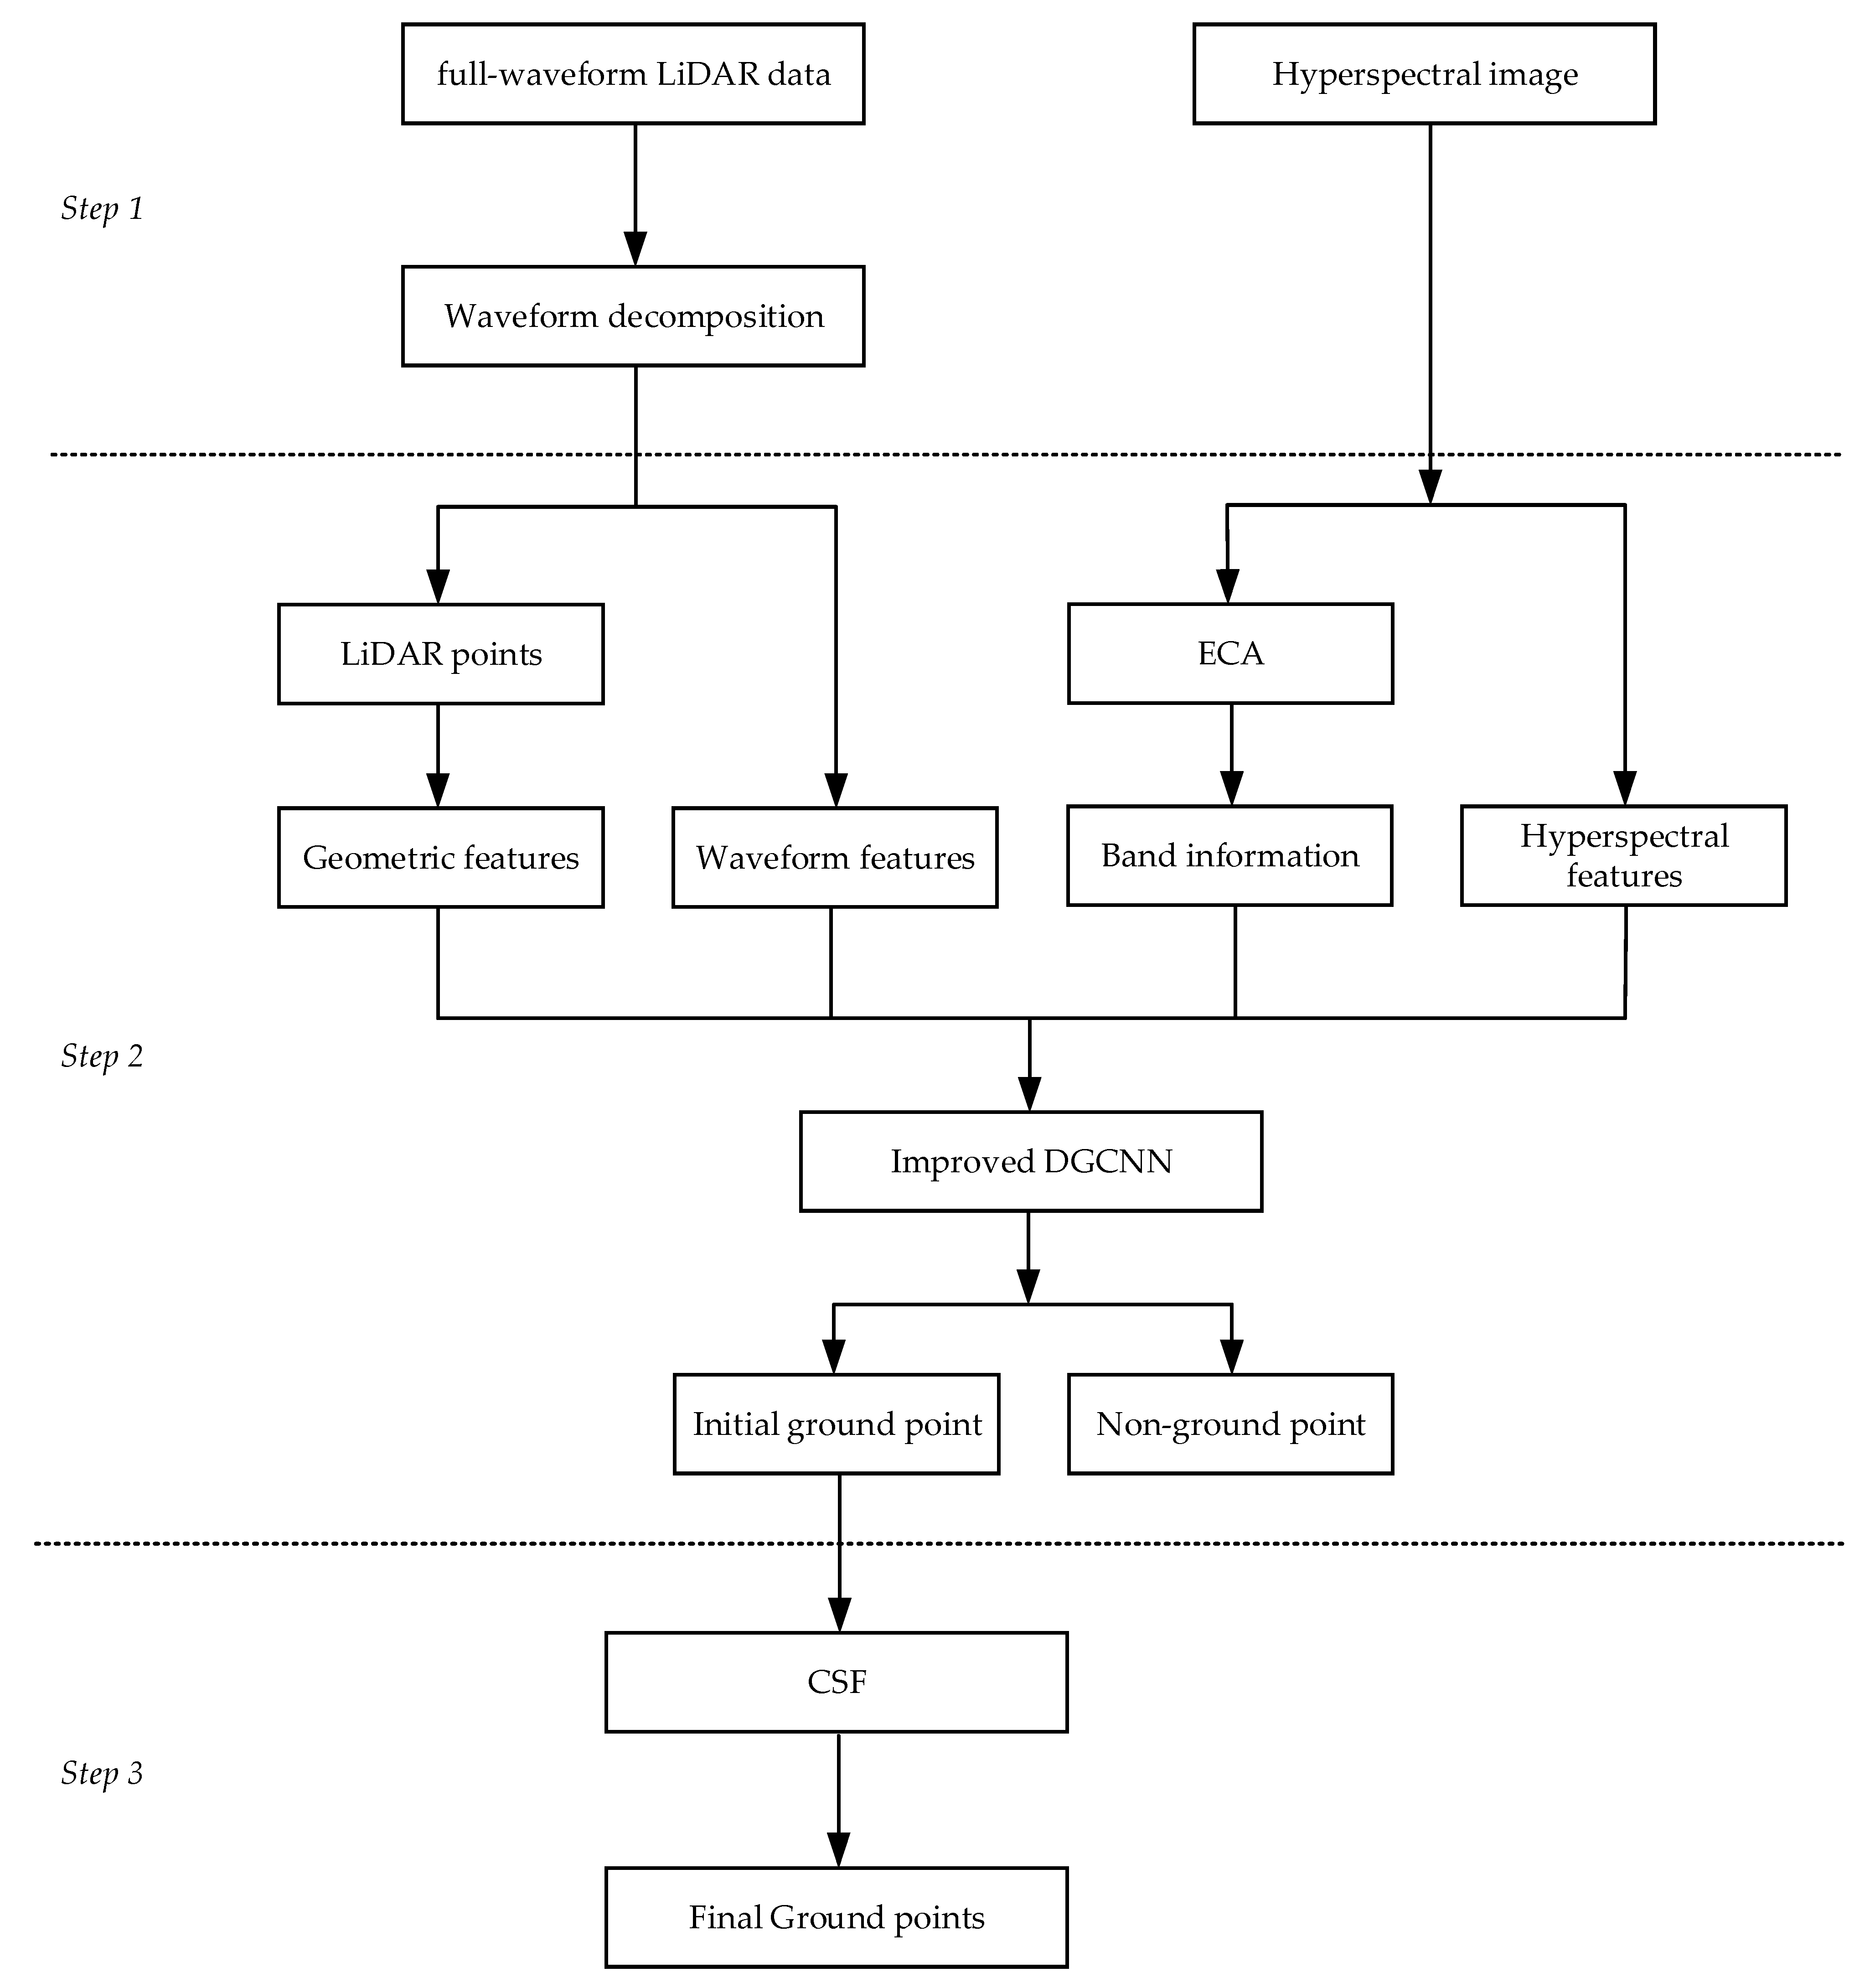
3.1. Workflow Overview

The workflow proposed in the paper is shown in Figure 2. It consisted of the following steps: waveform decomposition and feature extraction, the preliminary classification of the point cloud, the refinement of the preliminary labeling results, and accuracy evaluation. In the first step, the LM wave decomposition algorithm was employed to process the full-waveform data to obtain the discrete point cloud, whereby full-waveform features were extracted simultaneously. Twelve geometric features generated from the point cloud and three bands selected from the hyperspectral image, together with the waveform features, were input to the classifier in the next step. In the second step, the point cloud associated with all of the features extracted and generated in the first step was input to the IDGCNN, via which the input point cloud was preliminary labeled as ground and non-ground points. To improve the classification accuracy, the CSF took effect in the third step by refining the labeling results from the second step. The final filtering results were evaluated with several quantitative measures.

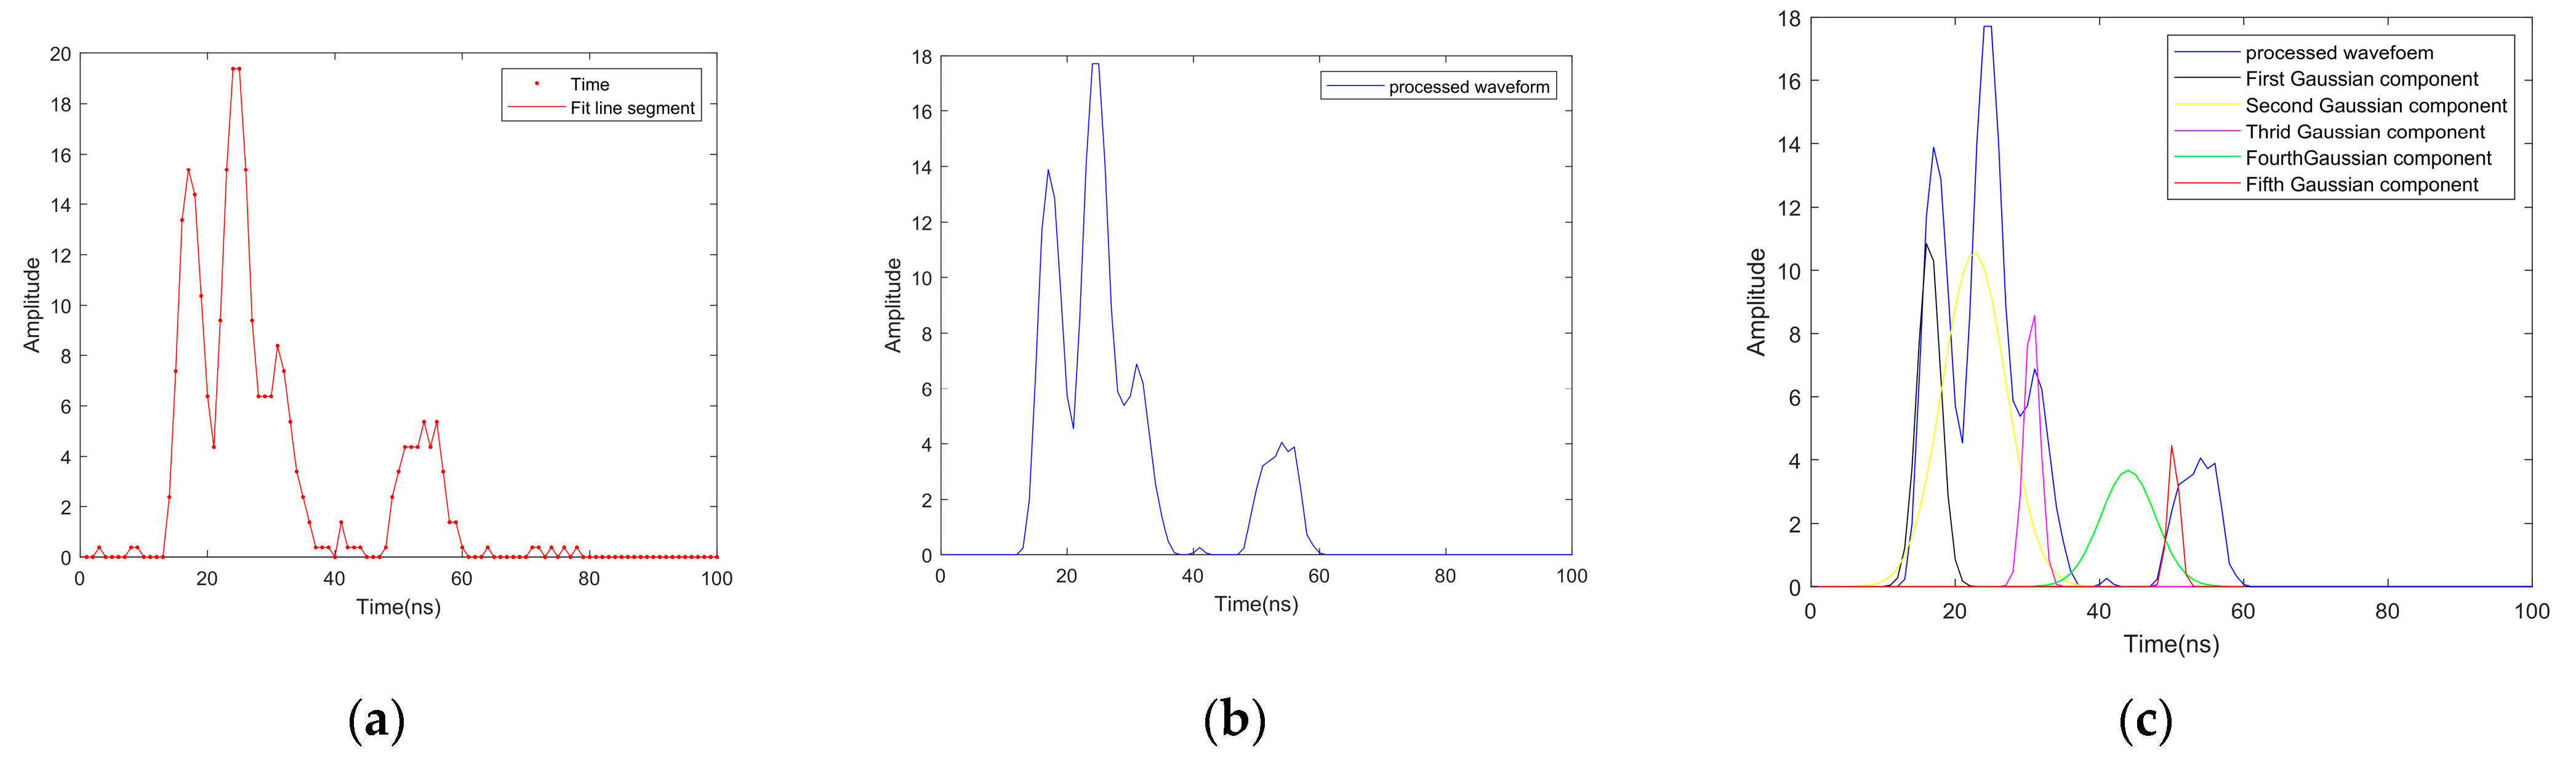
3.2. Waveform Decomposition

Wagner et al. [52] proved in theory that the shape of the waveform from an emitted laser signal is a Gaussian function and that the returned waveform is the superposition of one or several Gaussians depending on whether there are objects distributed along the laser beam pathway. Therefore, the waveform of an echo is determined by the objects contained within the area circled with the laser beam hitting the ground, as shown in Figure 3. Accurately fitting the echo waveform with the Gaussian functions and extracting the parameters associated with the Gaussians is the fundamental and first step in waveform data processing.
Hofton et al. [53] proposed using Levenberg–Marquardt (LM) optimization for the purpose of Gaussian function fitting for echo waveforms, which achieved satisfactory experimental results. To overcome the difficulty of determining the number of Gaussian functions, Ma et al. [43] introduced the F test into the LM-based decomposition process. The method initially assumes that the original waveform is superposed with at least two Gaussians (otherwise, no decomposition is needed) and then uses the LM algorithm to decompose the waveform, followed by the F test to check if the decomposition process continues or stops. Their experiments verified the effectiveness of the proposed algorithm. This paper adopted this algorithm for waveform decomposition.
Four extra features besides the three coordinate values of a point cloud can be extracted from a given decomposed waveform: the number of echoes (Gaussian functions) in the waveform, each echo’s width and amplitude, and the backscatter coefficient. These four parameters describe the physical and geometric characteristics of the target’s response to the laser pulse. In a complex forest scene, which is affected by the vertical structures of the trees, the number of echoes in most of the waveform data is more than four, and there is little difference in the number. This makes the feature of the number of echoes unable to effectively distinguish ground points from non-ground points in forest scenes. Secondly, the peak parameter is generally used to correct the original coordinate value, so this paper used the following two echo parameters as the full-waveform characteristics: (1) The echo width parameterized with the half-width at half-maximum (HWHM). This parameter quantitatively describes if there is more than one object distributed along the laser beam path. A wide echo width compared with the emitting echo indicates that the returned echo is unlikely reflected from bare soil or other smooth surfaces such as building roofs [42]. (2) The backscatter coefficient. As mentioned by Ma et al. [43], the backscatter or backscatter cross-section is often used to characterize the signal returned from laser scanning in radar remote sensing. Its cross-section per unit area, also called the backscatter coefficient, is considered to be a better property for comparing the scattering characteristics of area-wide targets that generate a single echo from different sensors and flight parameters. It can be calculated using Equation (1).
γ = σ A l
where σ is the cross-sectional area of the incident light, and Al refers to the surface spot area. According to [43], we can obtain the backscattering section σ of the current measured target by multiplying the fourth power of the distance from the sensor to the measured target, the echo amplitude, the echo width, and the calibration constant. At the same time, we multiply the square of the product of the divergence angle of the laser beam in radians and the distance from the sensor to the target by Π/4 to obtain the area Al produced by the incident laser light, as shown in Equation (2):
A l = π R 2 β t 2 4
where R is the distance from the laser beam to the ground, and βt is the small divergence angle of the laser beam.

3.3. Feature Generation

Compared with hyperspectral or high-resolution images with a lot of information, the information directly available in airborne LiDAR data only includes geometric information (plane coordinates and elevation information), intensity information, and echo information. As mentioned in [39], the generation of good and sufficient features is very important to achieve high-accuracy classification results. These features are often insufficient to effectively distinguish ground points from non-ground points. Secondly, although deep learning algorithms can learn feature representations from raw data in an end-to-end manner for some cases, generating additional features in ground point extraction tasks can provide richer feature information, guide prior knowledge, and increase the interpretability of the model, resulting in advantages in model performance and robustness.

3.3.1. Geometric Feature Generation from Point Cloud

Geometric features refer to the information extracted from point cloud data that describes the geometric attributes of objects’ surface shapes, structures, and positions. A point cloud is a 3D spatial data representation consisting of a large number of discrete points, wherein each point contains the coordinates of objects in 3D space. Therefore, various geometric features can be extracted from point cloud data to describe the geometric morphology of objects.
The geometric features are closely associated with the neighborhood from which the features were generated. Mainly three types of neighborhoods have been introduced in the literature [26]: cylinder neighborhoods, sphere neighborhoods, and grid neighborhoods, which are shown in Figure 4.
According to the statistics of Ma et al. [26], there are 38 commonly adopted geometric features. Based on their experimental results, and bearing in mind that the selected features were to be input to a classifier labeling ground and non-ground points in the forested area, this paper selected 12 features that are generated based on a cylinder neighborhood: (1) maximum negative height difference, mean height difference and point density; (2) height difference variance, height difference kurtosis, elevation value, number of continuous empty grids, distance from point to plane, and minimum eigenvalue; and (3) maximum positive height difference, plane parameter c, and the sum of the eigenvalues. The details of the definition and calculation of these features can be found in [26].

3.3.2. Band Selection from Hyperspectral Image

The hyperspectral data used in our experiment had 125 bands, a number that is not very large compared with other hyperspectral-imaging sensors, such as the EO-1 Hyperion sensor and visible shortwave infrared hyperspectral cameras, which are typically characterized by hundreds of bands. However, analyzing a 125-band hyperspectral image using machine learning methods still requires huge computational resources, which is unacceptable, so band selection from the hyperspectral image is indispensable.
Conventional band selection methods are based on data clustering, a process that is time-consuming and can be affected by the distribution of data points. Therefore, Sun et al. proposed a new band selection method named exemplar component analysis (ECA) [54]. The method seeks to prioritize bands based on their sample scores, which is an easy-to-compute metric that measures how likely a band is to be a sample. It characterizes high efficiency and is not affected by the pattern of the data distribution. In the ECA algorithm, the hyperspectral data of each band are viewed as a data instance (point) in the high-dimensional space. Hence, the image data can be expressed with an LN two-dimensional matrix at the beginning of the algorithm, where N is the number of pixels and L is the total number of bands. Then, selected example components are used to construct a subspace that spans lower-dimensional representations of the data. This subspace captures the most informative features of the data. Finally, a similarity matrix is used for ECA decomposition to obtain a set of exemplars and coefficients, where the exemplars represent the local structural patterns in the data set, and the coefficients represent the weight of each data point in the exemplars, that is, the exemplar score (ES). The larger the value of the exemplar score, the higher its importance. The formula of the ECA algorithm is as follows:
E S i = j = 1 L e x p d i j 2 σ 2 m i n d i j
where dij is the Euclidean distance between point i and point j. ESi is the exemplar score of exemplar i.
The band importance ranking calculated with the ECA algorithm in this paper is shown in Figure 5b.
In the ECA, the most important band is the first to be extracted, followed by less significant bands. The total number of bands selected is determined by visually inspecting the inflection point from the ES ranking plot shown in Figure 5b. Though such a method is simple and intuitively correct, it is subjective and difficult to automatically determine how many bands should be selected. Heuristic rules were proposed by Bolón et al. [55] after investigating 11 synthetic datasets and 12 feature selection algorithms, stating the following:
(1)
When n ≤ 10, select 75% of the features;
(2)
When 10 < n ≤ 75, select 40% of the features;
(3)
When 75 < n ≤ 100, select 10% of the features;
(4)
When n > 100, select 3% of the features.
Where n is the total number of features. Though the hyperspectral image used in our experiment was beyond the datasets in [55], we tried to use these rules to decide the number of bands the ECA ranking method should return. n in this paper was 125, and we floored the result of 125 times 3%; therefore, the top three bands were selected, which were band 63, band 59, and band 75. It can be seen in the figure above that the exemplar score of band 63 was the highest, and the wavelength of band 63 was 687.7 nm, which belongs to the red band. In hyperspectral images of forest scenes, the spectral characteristics of plants are mainly affected by comprehensive factors such as the internal structures of leaves and leaf area indexes (LAIs). Due to the existence of the specific reflection valley (also called “red valley”) of pine trees and the nearby absorption peak of chlorophyll (also called “green peak”), the reflectivity of pine trees, which were the main trees in the study area, was relatively high in the 687.7 nm band, while the surrounding vegetation had a reflectivity that was relatively low, so this band showed the highest exemplar score.
Besides the selection of three bands from the original data, the normalized vegetation index (NDVI) was calculated to estimate the density of green in the experimental area. The normalized difference vegetation index is calculated by comparing the radiance values of the red band and the near-infrared band, so these two bands need to be used in the calculation. The common red light band is 610–700 nm and the near-infrared band is 730–780 nm. In this paper, two bands that were close to the central wavelength were selected for calculation: band 56 (654.3 nm) and band 77 (755 nm).

3.4. Improved DGCNN Algorithm

After the generation and selection of features from both the point cloud and hyperspectral data, all the features were input to the deep learning algorithm, which was based on a graph neural network and was improved by introducing a self-attention layer.
In fields such as image processing and speech recognition, from which deep learning originated, data are often represented in Euclidean space. Deep learning can effectively capture the hidden patterns of Euclidean data; however, more and more data are generated from non-Euclidean domains and are represented as graphs with complex relationships and interdependencies between objects. The complexity of graph data poses significant challenges to existing deep learning algorithms. Since graphs may be irregular, they may have unordered nodes of variable sizes, and nodes from the graph may have different numbers of neighbors, causing some important operations such as convolutions, which can be easily computed in the image domain, to be difficult to apply to the graph domain. The emergence of graph neural networks (GNNs) has provided a new path for analyzing unstructured data.
The dynamic graph CNN (DGCNN) algorithm [34] is an algorithm that has successfully applied GNN to 3D point cloud data processing. PointNet [30] pioneers deep learning for the direct segmentation of unstructured point clouds. Many follow-up works have extended PointNet to consider neighborhoods of points rather than performing on individual points. Though these allow the network to exploit local features, they largely treat points independently at a local scale to maintain permutation invariance, leading to the neglection of the geometric relationships between points and limiting the model to capture local features. In contrast, DGCNN proposes EdgeConv, which captures local geometric structures while maintaining permutation invariance. It is easy to implement and ready to integrate with existing deep learning models. It can group points in both Euclidean space and semantic space.

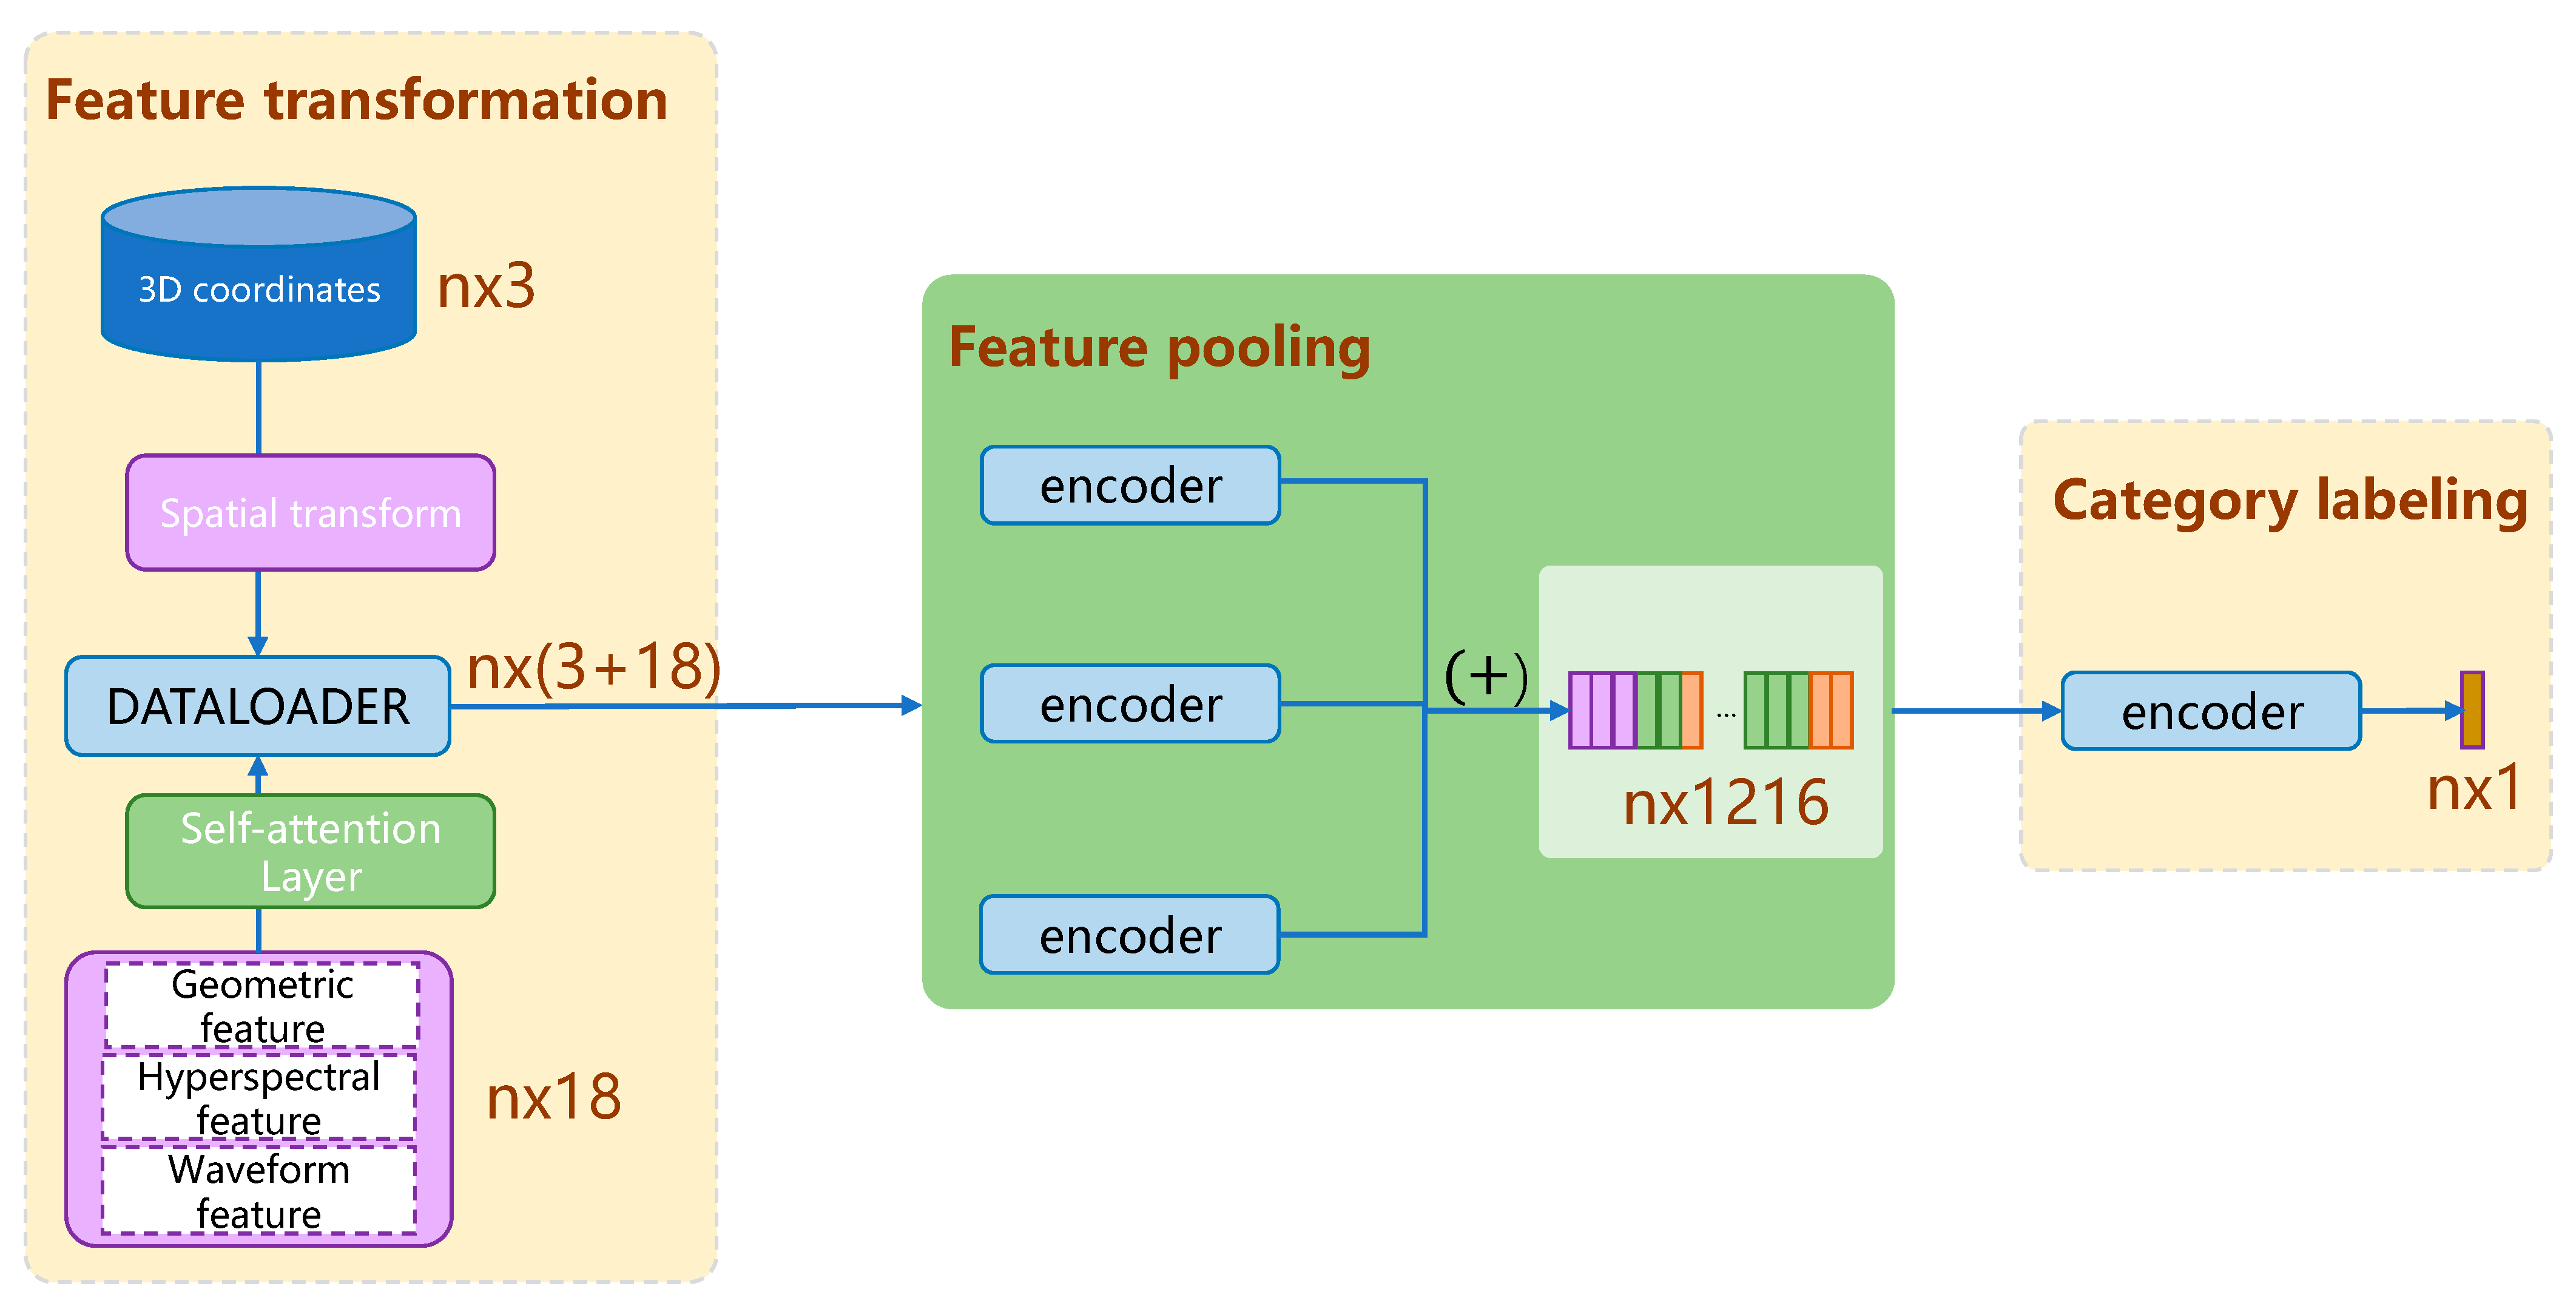
3.4.1. Self-Attention Layer

Although the traditional DGCNN algorithm expands its original features into many vectors of different sizes through feature expansion, it cannot fully utilize the relationships between these inputs during actual training, which results in poor model training results. This is because in the traditional DGCNN algorithm, all input channels for each convolutional layer are considered equally important, without considering the contribution of each channel to the output. However, in the real world, different features usually have different levels of importance and need to be weighted according to their contributions.
The three kinds of features used in this paper represent different physical meanings, and the quantities of these three kinds of features are also different. However, there are important relationships between these features. For example, the half-wave width coefficient as a waveform feature represents the spatial structure of the measured area and has a specific relationship with the geometric features generated based on LiDAR data. The backscatter coefficient as a waveform feature is related to the reflection of photons, that is, it has a certain relationship with the spectral feature. Therefore, in the process of model training, the algorithm must use all of the features, but it also needs to focus on this key relational information. This helps the model to comprehensively understand the input data and model them from a global perspective, which can improve the classification accuracy of terrain point cloud data.
The self-attention mechanism proposed by Vaswani et al. [56] has become one of the most popular modules and is widely used to improve neural network performance, achieving great success in image processing, natural language understanding, graph network representation, etc. Previous studies have shown that the self-attention mechanism can enhance the feature representation ability of graph networks, which inspired the introduction of the self-attention mechanism into the DGCNN algorithm. The role of the self-attention layer is to allow the algorithm to notice the correlation between different parts of the entire input layer. Meanwhile, the self-attention layer can convert low-correlation heterogeneous features into high-correlation ones without changing the feature dimension. The generalized operation of the self-attention layer is as follows: for each input vector a, a vector b is output by the self-attention layer, where the dimensions of a and b are the same.
The self-attention mechanism distinguishes different information attention levels from weight distribution. The calculation formula of the self-attention layer is shown in Formula (4).
A t t e n t i o n Q , K , V = s o f t m a x Q K T d k V
where dk is the dimension of the input vector, and KT is the transpose of the K matrix, and readers are referred to [56] for more details.

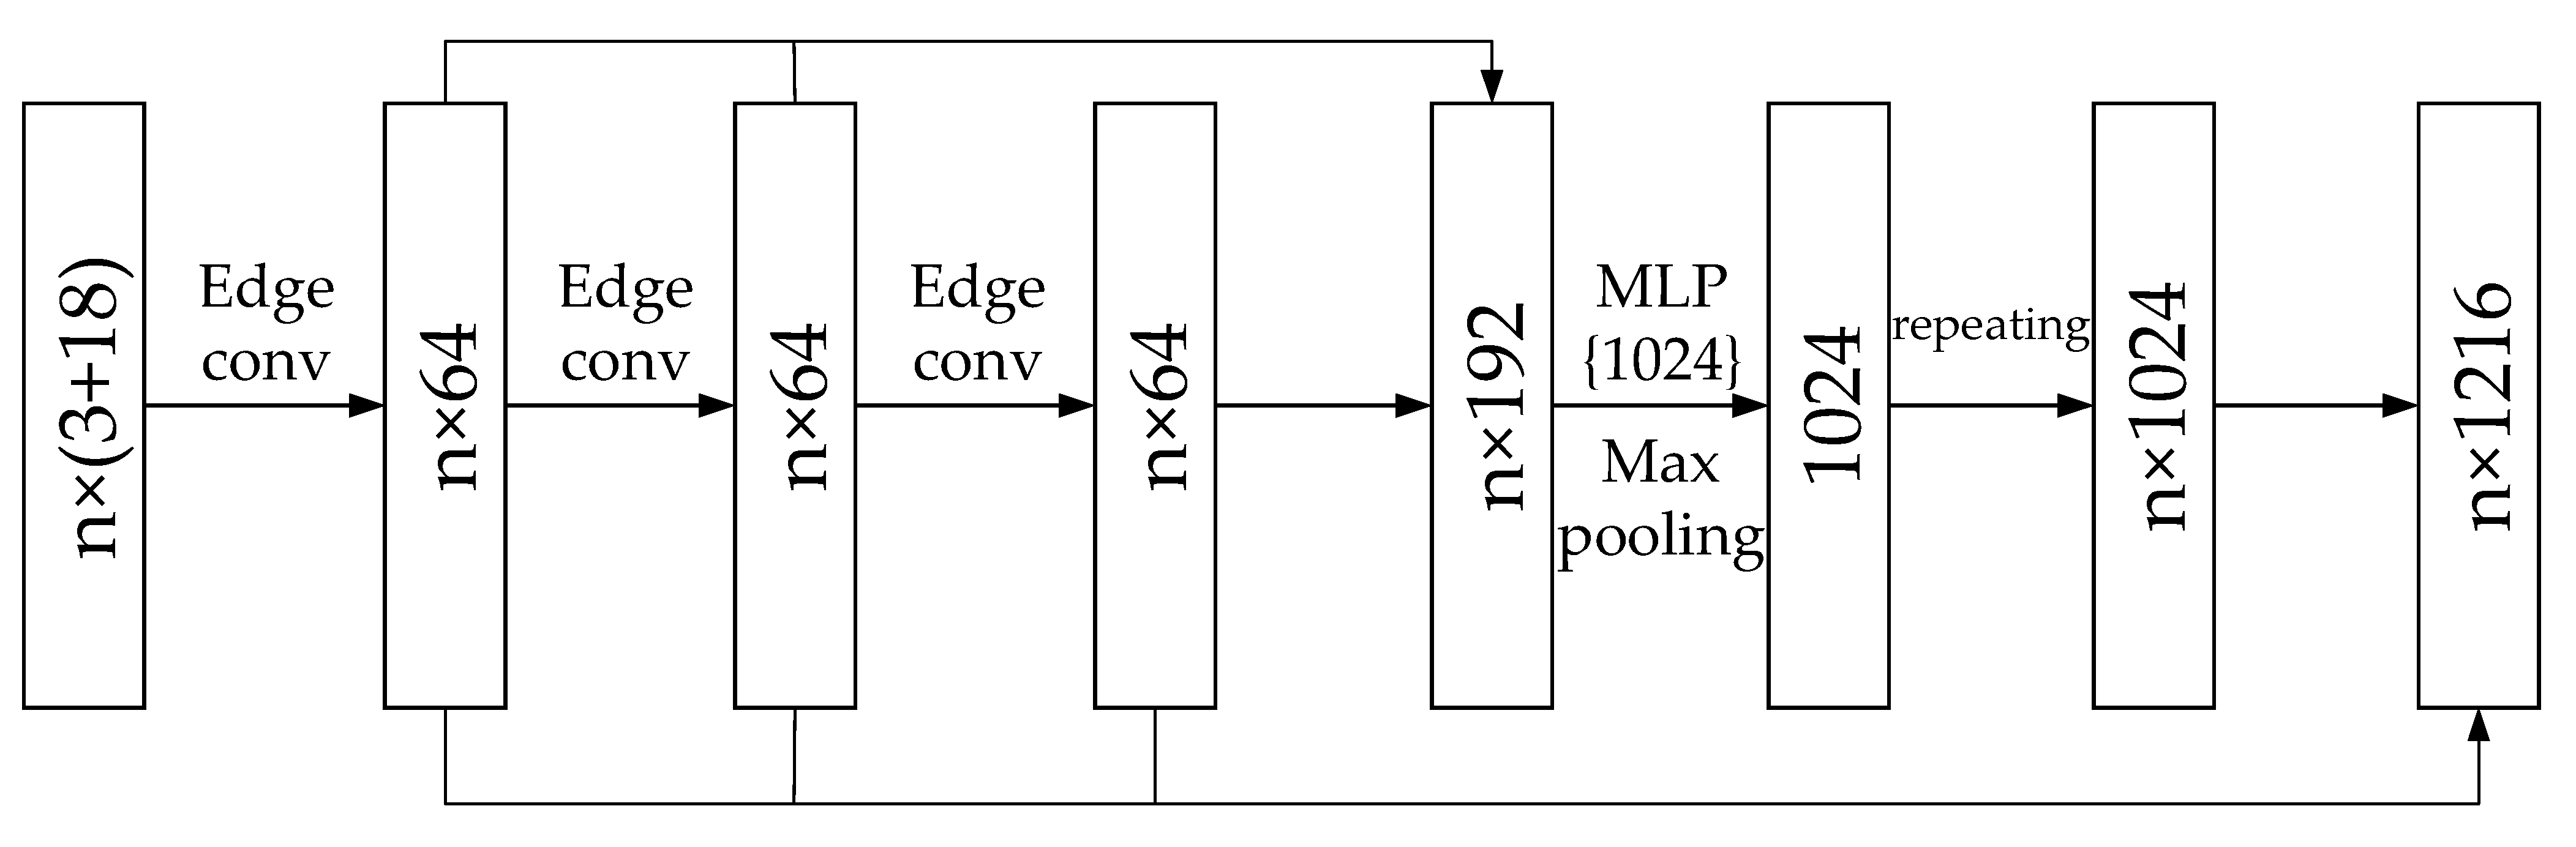
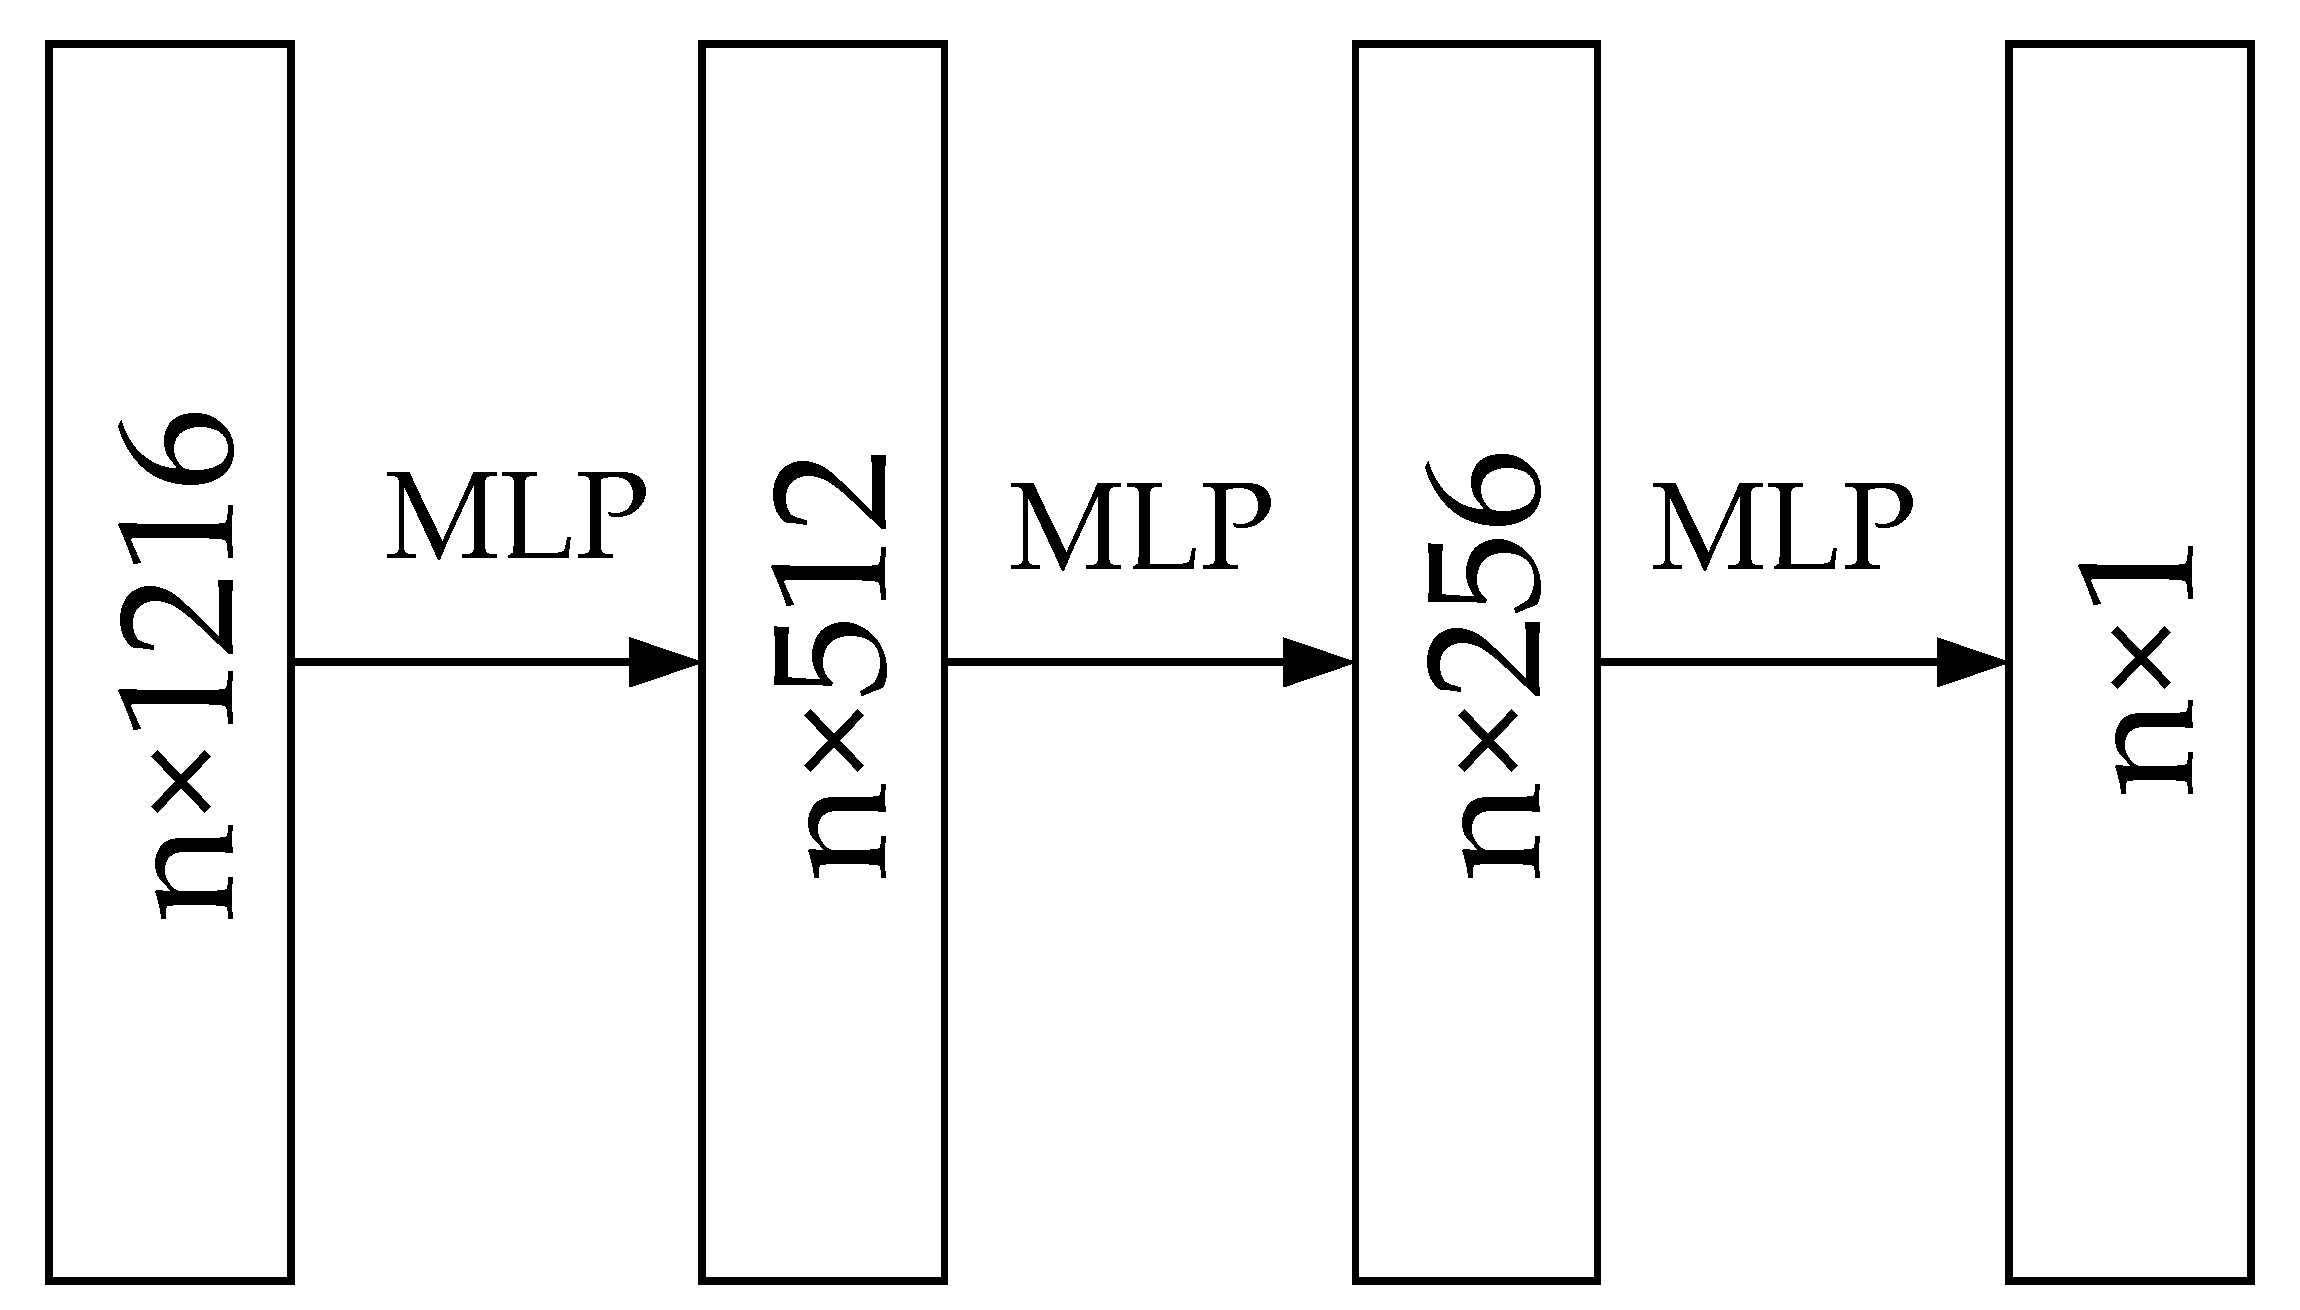
3.4.2. Network Architecture

Figure 6 shows the architecture of the improved DGCNN.
The architecture consists of three steps: feature transformation, feature pooling, and category labeling. (1) Feature transformation can be split into space transformation and feature transformation. Space transformation uses a transformation matrix (3 ∗ 3) to dot product the coordinates of the input raw point cloud with x-, y-, and z-coordinate values, and aligns all input point sets to a unified point set space according to the 3D coordinates. Feature transformation is then performed by adding a self-attention layer. (2) In the feature pooling step, we used the EdgeConv convolution operation multiple times to convert the input 18 feature values (12 LiDAR features, 4 spectral features, and 2 waveform features) and 3D coordinates into 1216 mixed features, as shown in Figure 7. (3) Finally, all the mixed features are up-sampled to convert the features into category labels.
In feature pooling, the initially input 21-dimensional features are transformed into 64-dimensional features after a one-time EdgeConv convolution (as shown in Figure 7), and then, after the second EdgeConv convolution, a total of 192 local features are generated. After the max-pooling of these 192 local features, 1024 global features are obtained. The max-pooling operation is repeated n times to obtain the global features of all points. The feature pooling is finished by stacking 192 local features and 1024 global features, which forms 1216 hybrid features.
Three MLPs were used to form the upsampling step, as shown in Figure 8, to output a value that was binarized into the final category label.

3.4.3. EdgeConv Convolution

EdgeConv dynamically constructs a graph structure on each layer of the network, which traverses the point set in the current layer. For a given point in the traversing, a neighborhood is defined and then aggregates those features obtained via EdgeCov to form a new representation of the point. The actual implementation of EdgeConv is to characterize each point by constructing a local neighborhood (this local neighborhood can be established in either the coordinate space or the feature space). That is, EdgeConv inputs NF and outputs NF′, as shown in Figure 9. Stacking multiple EdgeConv modules end to end yields a semantically richer multi-level representation.
The calculation of EdgeConv convolution consists of two steps: (1) the edge feature is calculated according to the graph structure; (2) edge features are aggregated to represent new features for their corresponding center points.
The detailed implementation of the first step is as follows. For a point xi in the point cloud, a graph G = (V, E) is constructed via K-nearest neighbor, where V denotes each vertex in the graph and E denotes an edge. Let the edge feature between points xi and adjacent point xj be eij, which is generally multidimensional, such that eij = hΘ(xi, xj), where hΘ is the feature extraction function.

3.5. Refinement with CSF Algorithm

There are still some non-ground points within the results from the IDGCNN algorithm. It is necessary to refine the initially extracted ground points in order to obtain a high-accuracy DEM. The cloth filter algorithm (CSF) was adopted in the paper, not only because of its robustness and effectiveness in extracting ground points but also because it is an open-source algorithm that has been integrated into open-source software such as CouldCompare. The CSF algorithm is based on the simulation of simple physical processes. It first flips the point cloud and then assumes that a piece of cloth soft enough to stick to the surface falls from above under gravity, and the final shape of the cloth can represent the current terrain. In the simulation of this physics, a technique called cloth simulation is used, and readers are referred to [57] for more details.

4. Experimental Results

4.1. Experimental Results of Waveform Decomposition

The total number of points originally provided by the airborne LiDAR system was 4,783,681, while 15,738,171 points were obtained after the waveform decomposition via the grouping LM algorithm mentioned in Section 3.2. Figure 10 shows one of the decomposition results. The algorithm was coded using Matlab2019a.
The original waveform is shown in Figure 10a, wherein the black dots are the sampling points of the waveform, which was fitted with red line segments simply connecting two consecutive samples. The original waveform was Gaussian smoothed, resulting in Figure 10b. Finally, grouping LM was performed to decompose the smoothed waveform, obtaining five individual Gaussians, as shown in Figure 10c. From the parameters associated with a Gaussian, namely, the amplitude, the position of the peak (corresponding to the mean value of the Gaussian), and the half-width at half-maximum (corresponding to the variance of the Gaussian), discrete points can be calculated. The point cloud calculated from the decomposition process is shown in Figure 11.
A profile view corresponding to the cross-section in Figure 11 is shown in Figure 12.
If the ground points were manually distinguished and connected to form the ground profile view, as shown in Figure 12, it is obvious that there were more ground points extracted thanks to the waveform decomposition. This is beneficial for the filtering of a point cloud acquired from a forested area, where initial ground points are often too sparse to obtain satisfactory results using conventional filters such as progressive TIN identification.

4.2. Experimental Results of IDGCNN Labeling

The IDGCNN was coded using Python 3.7 with the deep learning frameworks PyTorch 1.11.0 and CUDA 11.3. We chose cross-entropy as the loss function and stochastic gradient descent (SGD) as the optimizer. Other parameters were set as follows: The initial learning rate was set to 0.01, which declined by thirty percent after every fifty iterations. The epochs were set to 100. Seed points were collected randomly from the point cloud. According to the experimental results in [52], the best classification effect can be obtained when the number of neighbors in KNN is set to 20. The train_batch and test_batch sizes were set to four. The number of points for each batch input was 4096. The momentum of SGD was 0.9. LeakyReLU was adopted as the activation function with a −0.2 slope. The batch normalization strategy was applied to each MLP layer. After the model was trained, we picked the one with the best performance from the saved networks and used it to validate the test data.
Three measures were used to evaluate the performance of the IDGCNN: (1) kappa coefficient; (2) overall accuracy (OA); and (3) three types of errors, including omission error (type I), commission error (type II), and total error (total), where type-I error is the percentage of ground points misclassified as non-ground points, type-II error is the percentage of non-ground points misplaced, and the total error is the percentage of all misclassified points. The three types of error can be calculated using Formulas (5)–(7).
T y p e   I   e r r o r = b / ( a + b )
T y p e   I I   e r r o r = c / ( c + d )
T o t a l   e r r o r = ( b + c ) / e
where a denotes the ground points that are correctly classified; b represents the ground points that are incorrectly classified as non-ground points; c denotes the non-ground points that are incorrectly classified as ground points; d denotes the non-ground points that are correctly classified; and e denotes the total number of points in the point cloud.
In order to observe the influences of different feature sets on the IDGCNN results, a set of contrast experiments were conducted. The evaluation of the experimental results with the measures mentioned in the previous section is shown in Table 2.
LF denotes the geometric features, while 3C indicates that only three coordinate values were used in the model. HF denotes the hyperspectral features, WF denotes the waveform features, and ALL denotes the use of all features.
Table 2 displays the conclusion that the highest OA value of 99.38% was obtained when all the features were used by the IDGCNN, followed by when the waveform features were added to the three coordinate values, obtaining an OA value of 99.05%. Similarly, the highest kappa value of 95.95% was obtained when all features were used, followed by when the waveform features were added to the three coordinate values, which achieved a kappa coefficient of 94.24%. Similar results are observed in the percentage values of the three errors: when all the features were adopted by the model, the fewest errors occurred, which were 2.92%, 0.41%, and 0.62%, respectively. The highest levels for the three errors occurred when merely three coordinate values were employed as input features, indicating the lowest filtering accuracy. Therefore, the augmented features other than the three space coordinates can effectively improve the accuracy of point cloud filtering. Furthermore, for the three types of features proposed in this paper, namely, LF, HF, and WF, the following conclusions hold:
(1)
In general, the decreasing order of the three features’ impacts on the filtering was WF > HF > LF.
(2)
The addition of geometric features to 3C slightly increased (by approximately 0.5%) the overall accuracy while decreasing the type-II and total errors. This may be because most of the geometric features were generated based on the 3D spatial coordinates of the point cloud, while few of them were generated by considering the spatial structure embedded in the dataset, such as the number of steps, which improves the classification accuracy of non-ground points.
(3)
The hyperspectral features outweigh the geometric features in terms of the classification accuracy measured with all five parameters in Table 2. This is predictable because a point cloud lacks spectral information, so some objects such as bare soil and grass are difficult to distinguish via the point cloud alone, but they can be differentiated using NDVI.
(4)
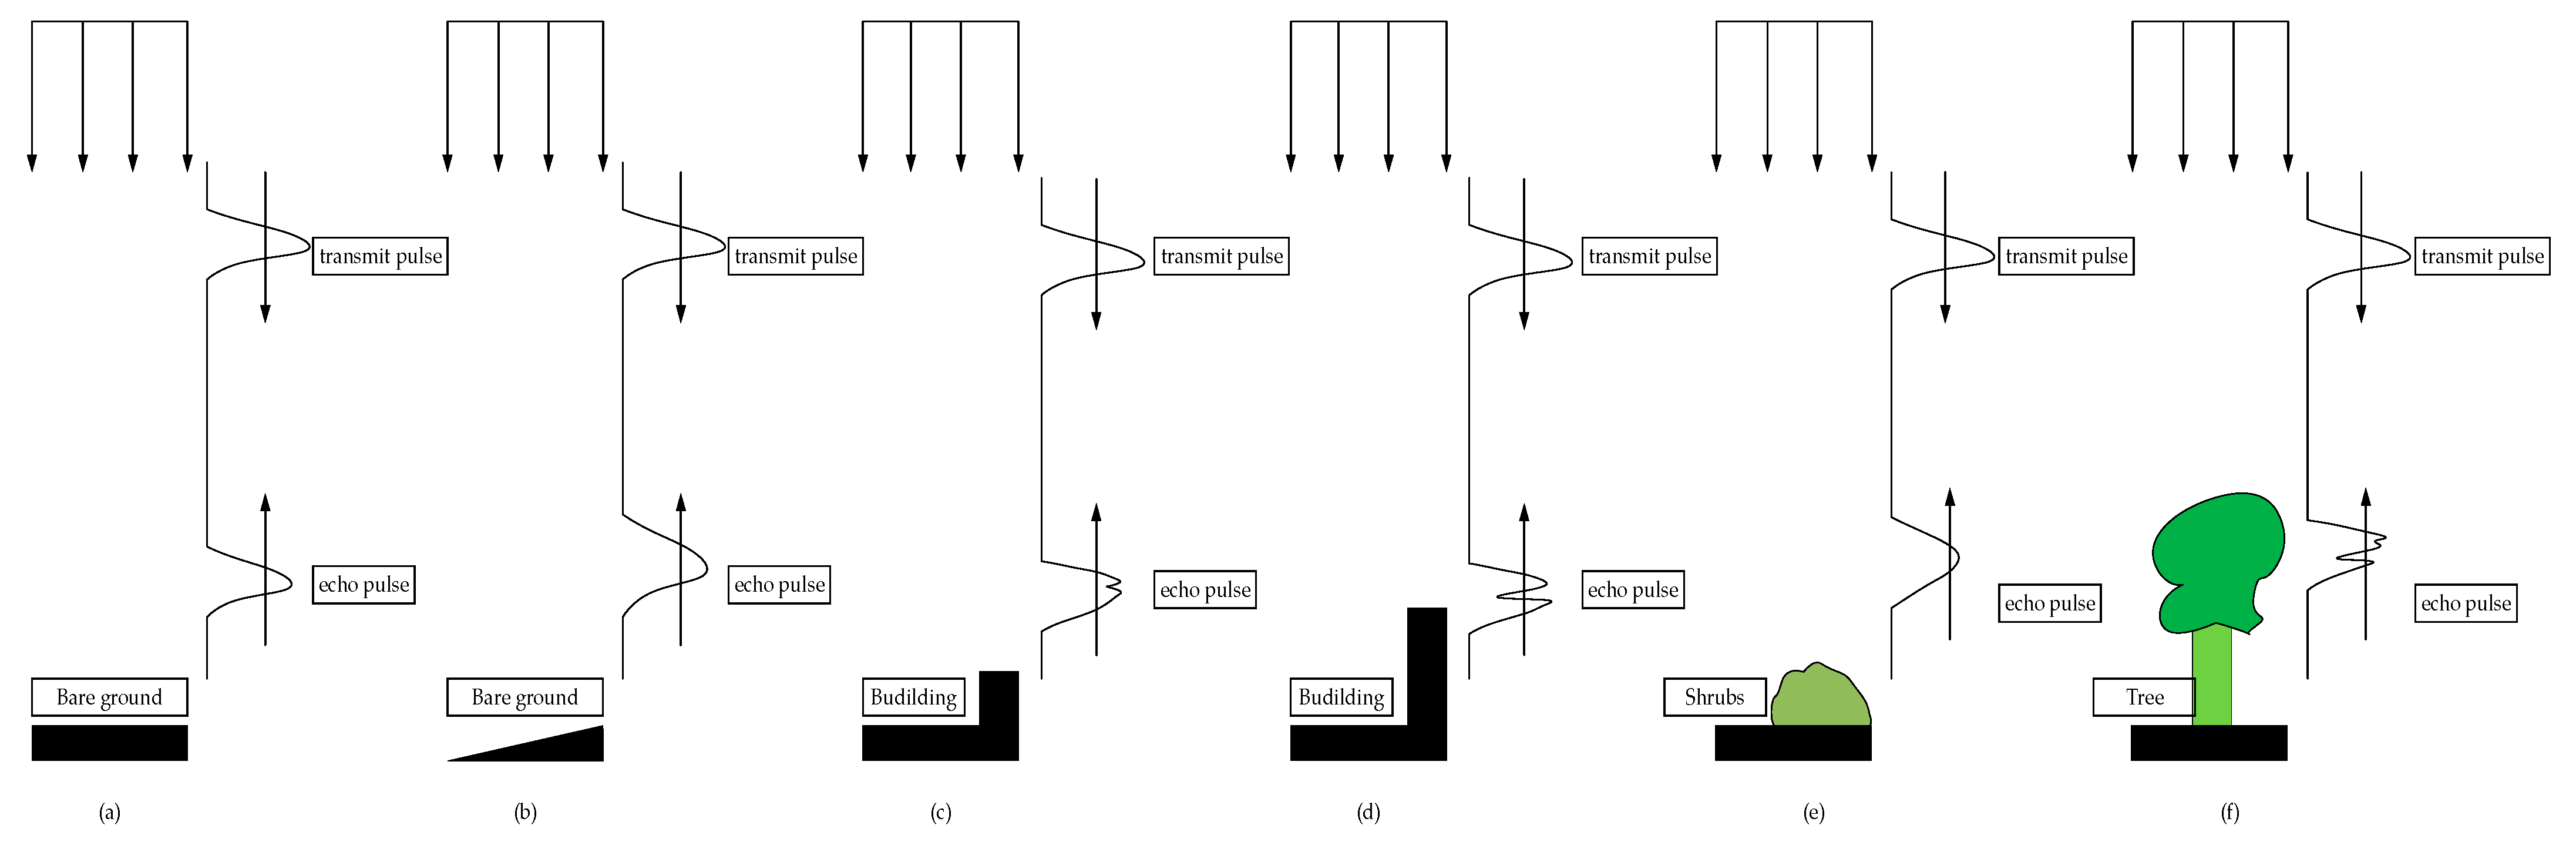
The waveform features, namely, the HWHM and the backscatter coefficient, allowed for the most significant improvement compared with the geometric and hyperspectral features. In the scenario of an airborne LiDAR signal, the HWHM describes the target distribution along the laser beam traveling path or in the spot area formed by the laser beam hitting the ground, as shown in Figure 3. The backscatter coefficient is a normalized measure of the reflectance of a target, which depends on the material and the size of the target as well as the incident and reflected angles. Combining these two features not only describes the structural characteristics of the targets but also indicates the differences in their material compositions. This explains why the addition of the waveform features achieved the greatest improvement in classification accuracy.
Part of the filtering results from the IDGCNN with the five sets of input features in Table 2 are terrain-rendered in Figure 13 to visually compare the results.
It can be seen via visual inspection that the highest classification accuracy was achieved by adopting all 21 features, resulting in the smoothest terrain. It is also noticeable that the feature combination of 3C + HF was inferior to other combinations in lower-vegetation-covered areas (see the middle region in Figure 13a–e), while the 3C+LF feature combination was prone to misclassifying the points in higher-vegetation-covered areas (see the left and right border areas in Figure 13a–e). In the former case, the ground was presumably covered with grass or bushes, while in the latter case, it was likely due to the complexity of the spatial structure of high vegetation being beyond that which the geometric features can accurately describe. Moreover, Figure 13e shows that even the results obtained using all 21 features show misclassifications.
Further visual analysis can be conducted by using the cross-sectional profiles, as shown in Figure 14.
It is obvious that there are more misclassifications in Figure 14a–c, while in Figure 14e, all ground points are extracted correctly in the given specific profile.
In order to verify the effectiveness of the improved DGCNN proposed in this paper, it was compared with other commonly used deep learning models in the literature, as shown in Table 3.
It can be concluded that the proposed IDGCNN model outperforms all the other models in terms of the five quantitative accuracy measures, followed by RandLA-net, DGCNN, PointNet++, and RFFS-Net. The DGCNN model performs poorly in ground point recognition. The RandLA-Net model performs more accurately in ground point recognition but has more misclassifications in non-ground point recognition. The RFFS-Net and PointNet++ models have a common misclassification issue in both ground point recognition and non-ground point recognition.
The processing process was the same as that used for the previous experimental results. The results obtained by taking a section view of an area are shown in Figure 15.

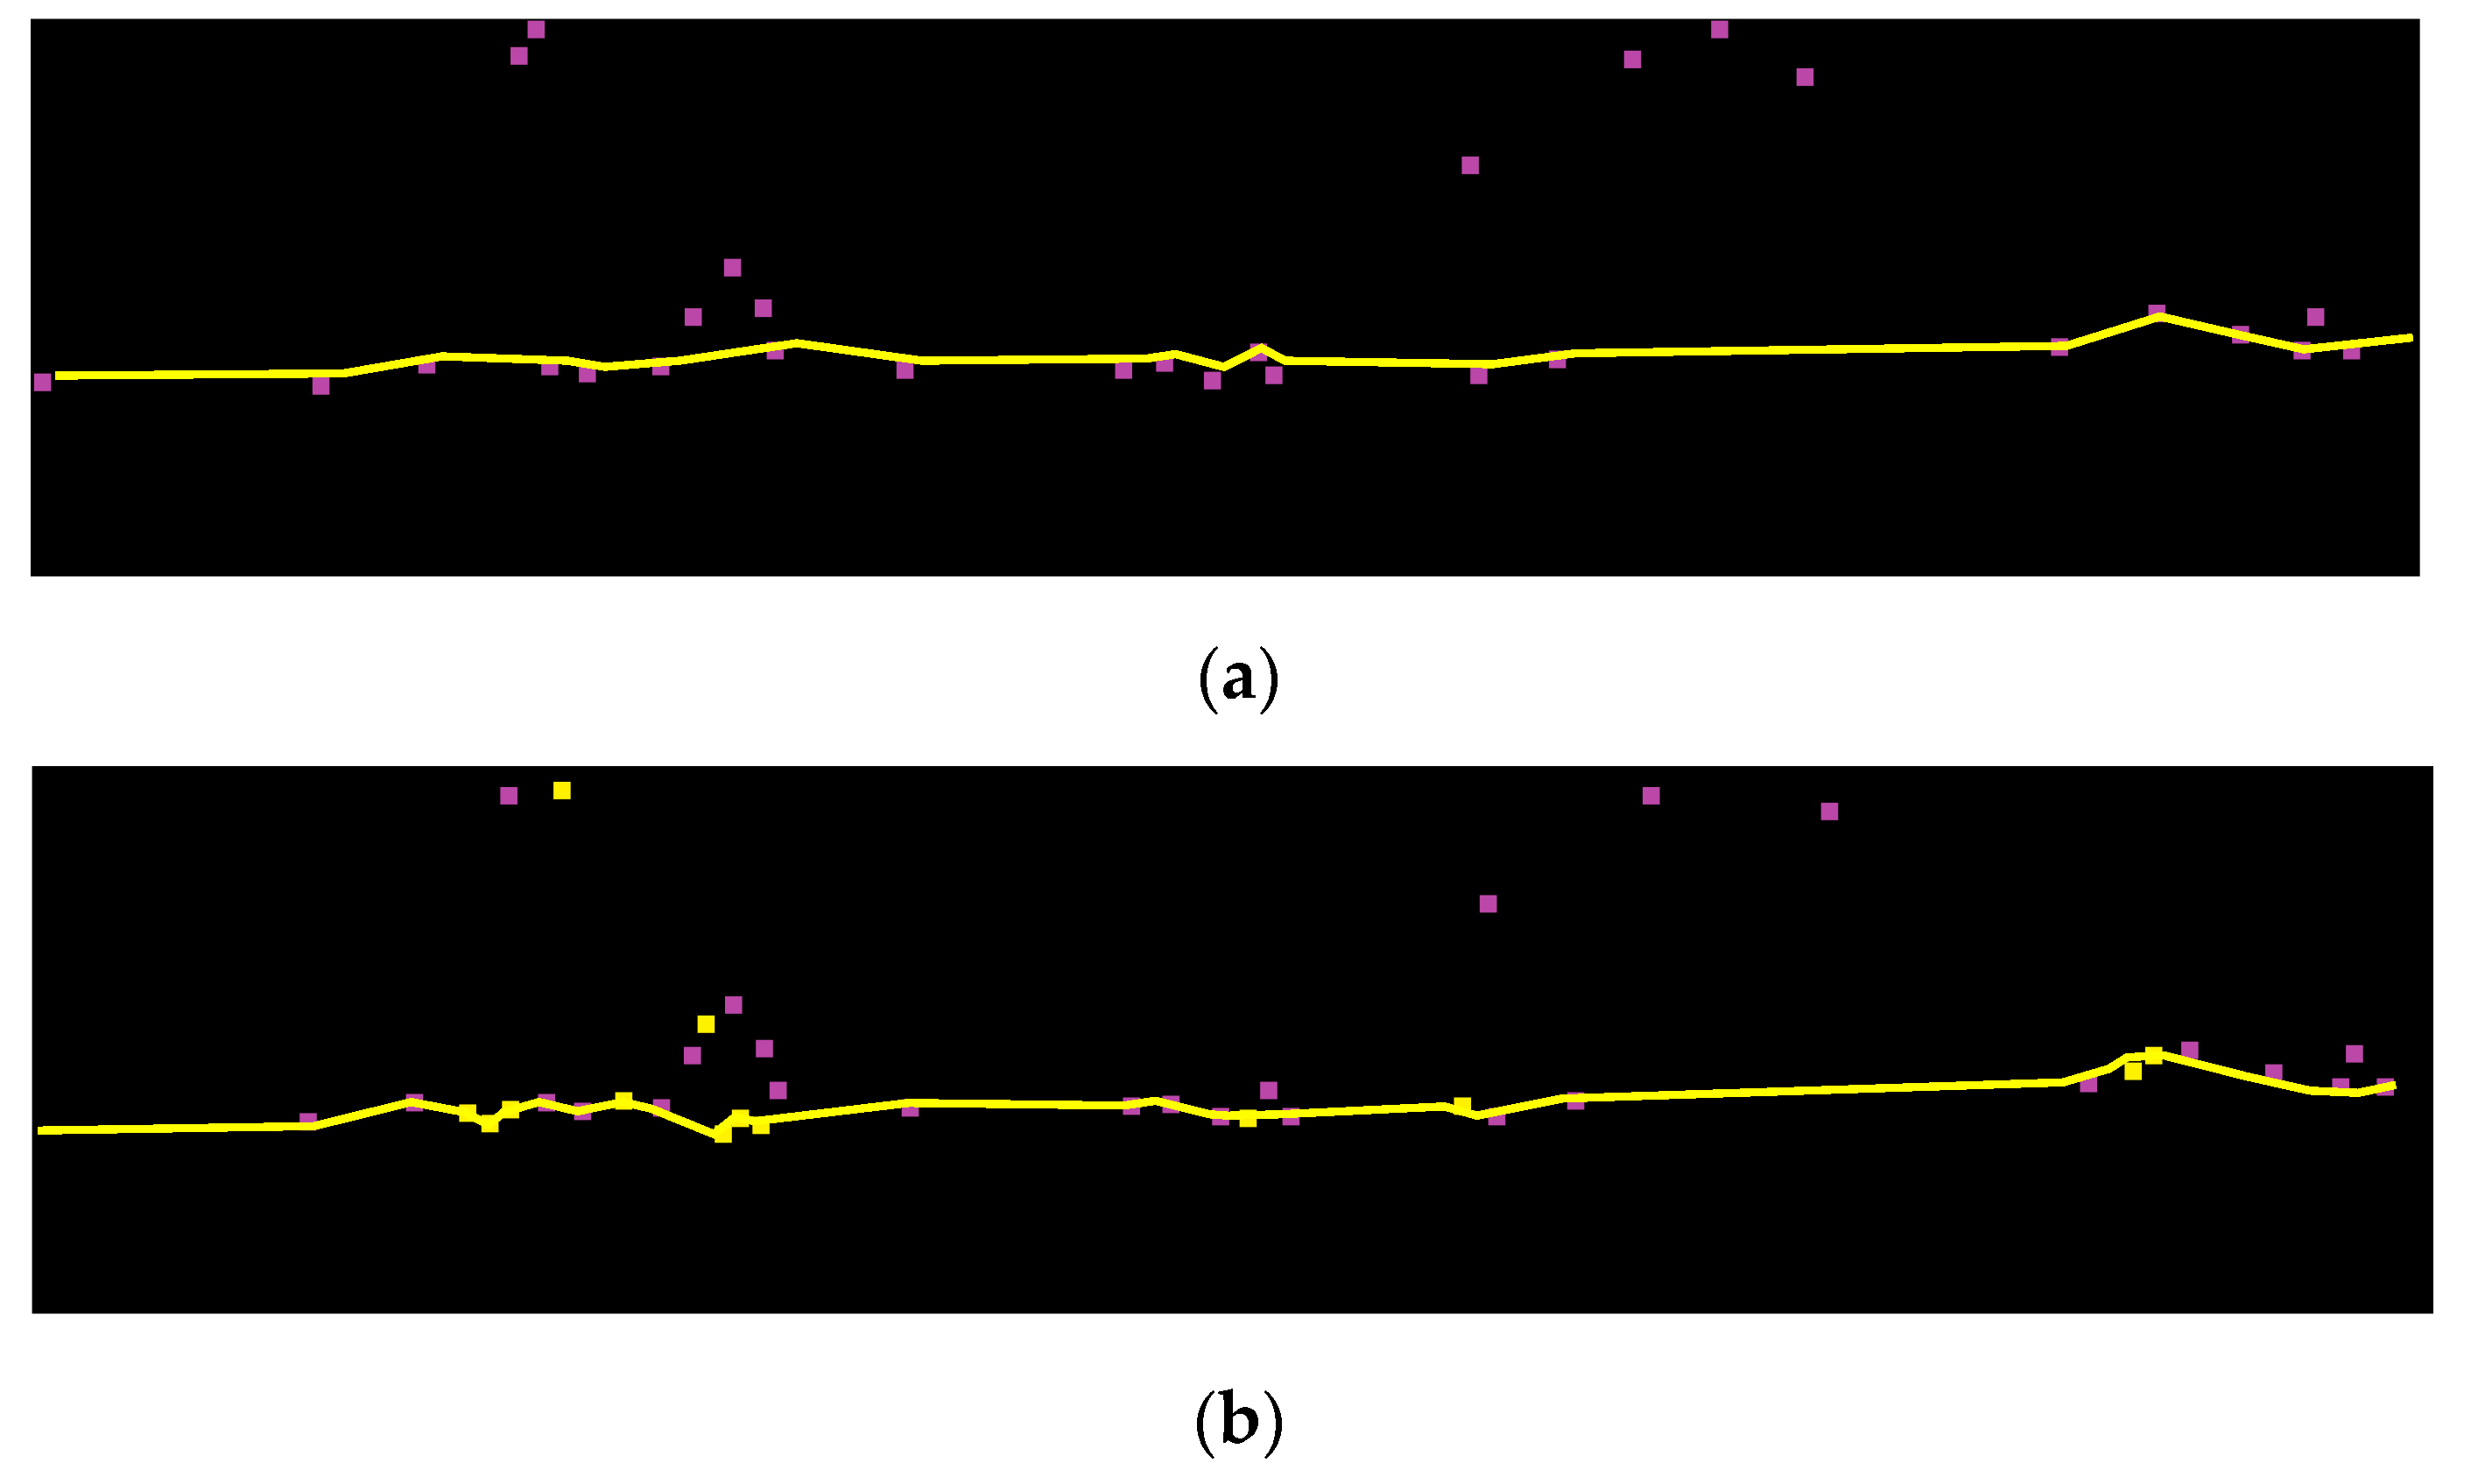
4.3. Refinement of Ground Points

As mentioned in the previous section, though the IDGCNN could extract ground points from the raw point cloud with high accuracy, there were still some non-ground points mislabeled as ground points. In order to further filter out the non-ground points mixed into the results from the IDGCNN, this paper used the CSF algorithm to refine the results before outputting the final product. Refinement was evaluated by comparing the three DEM sets generated from the ground points extracted with the three algorithms with 23 real ground points collected using real-time kinematic (RTK), which can be seen in Figure 16a. The three point-filtering algorithms used for comparison were the IDGCNN, the IDGCNN+CSF refinement, and CSF filtering. The LiDAR_SUITE V5.0 software developed by the authors’ research and development team was employed to manually label the point cloud and to display the DEM. The resolution of the DEM was 0.5 m, which was interpolated via Kriging. Table 4 shows the comparison results.
The DEMs are shown in Figure 16.
From Figure 16 and Table 4, we conclude that the IDGCNN+CSF workflow achieves the highest accuracy DEM. This two-step processing outperforms both single-step algorithms in ground point extraction.

5. Discussion

Although the experiments showed that the proposed point cloud filtering workflow can obtain satisfactory results, several open issues are worthy of further study. First, we generated three different types of features: geometric features generated from the LiDAR point cloud, waveform features generated from the waveform data, and spectral features generated from the spectral data. Although we applied the self-attention mechanism to improve the correlation between different features, they were essentially heterogeneous and may have contained redundant and irrelevant information, which could have deteriorated the performance of the model in classification. The experimental results show that the geometric features had less impact than the other two features in terms of filtering; notwithstanding, they contained 12 individual features, which is a phenomenon worthy of further studies.
Secondly, it can be seen by comparing Figure 16a,b that the DEM obtained after the CSF algorithm processing was much smoother, and comparing the values, it can be found that the maximum error of the DEM processed using our method was 1.34 m lower than that of the DEM obtained using only the traditional CSF, and the maximum error reduction rate was as high as 65.12%. However, the numerical comparison in Table 4 demonstrates that the median error and average error of the two DEMs were relatively close, and the maximum error only decreased by 0.26 m, which shows that the CSF algorithm showed little improvement in the subsequent data. This may be related to the fact that most of the control points were distributed on the west side of the DEM. If more control points from the raised area on the east could have been collected, the values in Table 4 would be significantly different.
Although deep-learning-based point cloud filtering algorithms have high automation and adaptability to various terrains, the need for large amounts of training data may be one of the limiting factors in using deep learning algorithms. For tasks such as point cloud filtering, a large amount of labeled data is required to obtain a mature model that can accurately distinguish ground points from non-ground points. Due to the high time and labor costs of data collection and labeling, this may limit the scope of deep learning algorithms in practical applications. In addition, even with sufficient data, deep learning algorithms require a lot of time to train models. Due to the complexity and computational requirements of deep learning algorithms, it may take hundreds of hours or even days to train a high-quality deep learning model. This may prove to be inconvenient in practical applications, especially in real-time applications that require quick responses. In summary, although deep learning shows great potential in airborne LiDAR point cloud processing, the scarcity of training data and time is still a major limitation. It is still a difficult problem to be solved for deep learning algorithms to efficiently obtain high-precision filtering models under the conditions of a lower data volume and insufficient fitting.
Another notable issue was the mismatch between the resolution of the hyperspectral image and the density of the point cloud used in this experiment, which were 1.5 m and 17.8 points/square meter, respectively. Since the image was georectified, the digital number of a given pixel in the hyperspectral image was assigned to the laser point that had the same 2D coordinate values as the pixel. Realistically, the area within a pixel contained approximately 30~40 laser points, which were assigned the same digital number. Such assignment results in the misclassification of ground and non-ground points, and improvement is required if higher-resolution hyperspectral images are to become available.

6. Conclusions

We proposed a new fully automated filtering method based on the combination of hyperspectral images and full-waveform airborne LiDAR data, which outperforms other methods for filtering in forested areas. This method first employs the point cloud generated from the waveform data via LM decomposition rather than the dataset provided by the system. The IDGCNN and 18 features of three categories screened out are used to extract high-precision initial ground points. The experimental results show that the addition of features to the three coordinate values of the point cloud effectively improved the classification accuracy, although the significance of geometric features was not as significant as that of waveform and hyperspectral features. The IDGCNN is an extension of DGCNN by introducing a self-attention module to improve the correlation between heterogeneous features. The IDGCNN achieved the highest classification accuracy in terms of all five quantitative evaluation measures compared with DGCNN, PointNet++, RandLA-Net, and RFFS-Net.
The CSF can further refine the extracted ground points, from which the final product DEM can be generated. Though the IDGCNN+CSF improved the DEM quality slightly, it obviously outperformed the DEM generated solely with the CSF. The maximum error improvement rate of 65.12% and the average error improvement rate of 11.43% demonstrate the effectiveness of the proposed workflow.
It is noteworthy that all modules in the workflow are mature and ready for use. However, whether it is applicable to other datasets acquired from various geomorphologic settings is worthy of further study.

Author Contributions

Conceptualization, H.M. (Hongchao Ma) and W.L.; data curation, L.Z.; formal analysis, W.L.; funding acquisition, W.Z.; investigation, W.L., Z.C. and J.Y.; methodology, W.L.; project administration, H.M. (Haichi Ma); resources, W.Z.; software, W.L. and J.Y.; supervision, H.M. (Hongchao Ma); validation, W.L., J.Y., and H.M. (Haichi Ma); visualization, H.M. (Haichi Ma); writing—original draft, W.L.; writing—review and editing, H.M. (Hongchao Ma). All authors have read and agreed to the published version of the manuscript.

Funding

This research was funded by the National Key R&D Program of China (2018YFB0504500), the Education Commission of Hubei Province of China (grant no. Q20202801), and the Nature Science Foundation of the Higher Education Institutions of Jiangsu Province (20KJB420003).

Acknowledgments

We would like to acknowledge Charles R. Qi, Qingyong Hu, Yue Wang, and Aoran Xiao for providing the source codes of their network. These source codes were a valuable reference and guide for our work. They allowed us to gain a deeper understanding of the problem and find solutions in terms of the code architecture and implementation details.

Conflicts of Interest

The authors declare no conflict of interest.

References

  1. Van Genderen, J.L. Airborne and terrestrial laser scanning. Int. J. Digit. Earth 2011, 4, 183–184. [Google Scholar] [CrossRef]
  2. Reutebuch, S.E.; Hans-Erik, A.; Mcgaughey, R.J. Light Detection and Ranging (LIDAR): An Emerging Tool for Multiple Resource Inventory. J. For. 2005, 103, 286–292. [Google Scholar]
  3. Hyypp, J.; Hyypp, H.; Leckie, D.; Gougeon, F.; Yu, X.; Maltamo, M. Review of methods of small-footprint airborne laser scanning for extracting forest inventory data in boreal forests. Remote Sens. 2008, 29, 1339–1366. [Google Scholar] [CrossRef]
  4. Andersen, H.E.; Strunk, J.; Temesgen, H. Using Airborne Light Detection and Ranging as a Sampling Tool for Estimating Forest Biomass Resources in the Upper Tanana Valley of Interior Alaska. West. J. Appl. For. 2011, 26, 157–164. [Google Scholar] [CrossRef] [Green Version]
  5. Zhu, X.; Skidmore, A.K.; Darvishzadeh, R.; Olaf Niemann, K.; Jing, L.; Shi, Y.; Wang, T. Foliar and woody materials discriminated using terrestrial LiDAR in a mixed natural forest. Int. J. Appl. Earth Obs. Geoinf. 2018, 64, 43–50. [Google Scholar] [CrossRef]
  6. Mongus, D.; Zalik, B. Parameter-free ground filtering of LiDAR data for automatic DTM generation. ISPRS J. Photogramm. Remote Sens. 2012, 67, 1–12. [Google Scholar] [CrossRef]
  7. Anderson, E.S.; Thompson, J.A.; Crouse, D.A.; Austin, R.E. Horizontal resolution and data density effects on remotely sensed LIDAR-based DEM. Geoderma 2006, 132, 406–415. [Google Scholar] [CrossRef]
  8. Hui, Z.; Jin, S.; Cheng, P.; Ziggah, Y.Y.; Wang, L.; Wang, Y.; Hu, H.; Hu, Y. An Active Learning Method for DEM Extraction from Airborne LiDAR Point Clouds. IEEE Access 2019, 7, 89366–89378. [Google Scholar] [CrossRef]
  9. Meng, X.; Currit, N.; Zhao, K. Ground Filtering Algorithms for Airborne LiDAR Data: A Review of Critical Issues. Remote Sens. 2010, 2, 833–860. [Google Scholar] [CrossRef] [Green Version]
  10. Montealegre, A.L.; Lamelas, M.T.; Juan, D. A Comparison of Open-Source LiDAR Filtering Algorithms in a Mediterranean Forest Environment. IEEE J. Sel. Top. Appl. Earth Obs. Remote Sens. 2015, 8, 4072–4085. [Google Scholar] [CrossRef] [Green Version]
  11. Hyyppä, H.; Yu, X.; Hyyppä, J.; Kaartinen, H.; Kaasalainen, S.; Honkavaara, E.; Rönnholm, P. Factors affecting the quality of DTM generation in forested areas. Int. Arch. Photogramm. Remote Sens. Spat. Inf. Sci. 2005, 36, 85–90. [Google Scholar]
  12. Zhao, X.; Su, Y.; Li, W.K.; Hu, T.; Liu, J.; Guo, Q. A comparison of LiDAR filtering algorithms in vegetated mountain areas. Can. J. Remote Sens. 2018, 44, 287–298. [Google Scholar] [CrossRef]
  13. Evans, J.S.; Hudak, A.T. A multiscale curvature algorithm for classifying discrete return LiDAR in forested environments. IEEE Trans. Geosci. Remote Sens. 2007, 45, 1029–1038. [Google Scholar] [CrossRef]
  14. Véga, C.; Durrieu, S.; Morel, J.; Allouis, T. A sequential iterative dual-filter for Lidar terrain modeling optimized for complex forested environments. Comput. Geosci. 2012, 44, 31–41. [Google Scholar] [CrossRef]
  15. Maguya, A.S.; Junttila, V.; Kauranne, T. Adaptive algorithm for large scale DTM interpolation from LiDAR data for forestry applications in steep forested terrain. ISPRS J. Photogramm. Remote Sens. 2013, 85, 74–83. [Google Scholar] [CrossRef]
  16. Zhao, X.; Guo, Q.; Su, Y.; Xue, B. Improved progressive TIN densification filtering algorithm for airborne LiDAR data in forested areas. ISPRS J. Photogramm. Remote Sens. 2016, 117, 79–91. [Google Scholar] [CrossRef] [Green Version]
  17. Chen, C.; Wang, M.; Chang, B.; Li, Y. Multi-level interpolation-based filter for airborne LiDAR point clouds in forested areas. IEEE Access 2020, 8, 41000–41012. [Google Scholar] [CrossRef]
  18. Maguya, A.S.; Junttila, V.; Kauranne, T. Algorithm for extracting digital terrain models under forest canopy from airborne LiDAR data. Remote Sens. 2014, 6, 6524–6548. [Google Scholar] [CrossRef] [Green Version]
  19. Bigdeli, B.; Amirkolaee, H.A.; Pahlavani, P. DTM extraction under forest canopy using LiDAR data and a modified invasive weed optimization algorithm. Remote Sens. Environ. 2018, 216, 289–300. [Google Scholar] [CrossRef]
  20. Liu, L.; Lim, S. A voxel-based multiscale morphological airborne lidar filtering algorithm for digital elevation models for forest regions. Measurement 2018, 123, 135–144. [Google Scholar] [CrossRef]
  21. Hui, Z.; Jin, S.; Xia, Y.; Nie, Y.; Xie, X.; Li, N. A mean shift segmentation morphological filter for airborne LiDAR DTM extraction under forest canopy. Opt. Laser Technol. 2021, 136, 106728. [Google Scholar] [CrossRef]
  22. Durbha, S.S.; King, R.L.; Younan, N.H. Support vector machines regression for retrieval of leaf area index from multiangle imaging spectroradiometer. Remote Sens. Environ. 2007, 107, 348–361. [Google Scholar] [CrossRef]
  23. Zhao, K.; Popescu, S.; Zhang, X. Bayesian learning with Gaussian processes for supervised classification of hyperspectral data. Photogramm. Eng. Remote Sens. 2008, 74, 1223–1234. [Google Scholar] [CrossRef] [Green Version]
  24. Nourzad, S.H.H.; Pradhan, A. Ensemble methods for binary classifications of airborne LiDAR data. J. Comput. Civ. Eng. 2014, 28, 04014021. [Google Scholar] [CrossRef]
  25. Shi, W.; Zheng, S.; Tian, Y. Adaptive mapped least squares SVM-based smooth fitting method for DSM generation of LIDAR data. Int. J. Remote Sens. 2009, 30, 5669–5683. [Google Scholar] [CrossRef]
  26. Ma, H.; Cai, Z.; Zhang, L. Comparison of the filtering models for airborne LiDAR data by three classifiers with exploration on model transfer. J. Appl. Remote Sens. 2018, 12, 016021. [Google Scholar] [CrossRef]
  27. Jahromi, A.B.; Zoej MJ, V.; Mohammadzadeh, A.; Sadeghian, S. A novel filtering algorithm for bare-earth extraction from airborne laser scanning data using an artificial neural network. IEEE J. Sel. Top. Appl. Earth Obs. Remote Sens. 2011, 4, 836–843. [Google Scholar] [CrossRef]
  28. Hu, X.; Yuan, Y. Deep-learning-based classification for DTM extraction from ALS point cloud. Remote Sens. 2016, 8, 730. [Google Scholar] [CrossRef] [Green Version]
  29. Rizaldy, A.; Persello, C.; Gevaert, C.; Elberink, S.O.; Vosselman, G. Ground and multi-class classification of airborne laser scanner point clouds using fully convolutional networks. Remote Sens. 2018, 10, 1723. [Google Scholar] [CrossRef] [Green Version]
  30. Qi, C.R.; Su, H.; Mo, K.; Guibas, L.J. PointNet: Deep learning on point sets for 3D classification and segmentation. In Proceedings of the 2017 IEEE Conference on Computer Vision and Pattern Recognition (CVPR), Honolulu, HI, USA, 21–26 July 2017; pp. 77–85. [Google Scholar] [CrossRef] [Green Version]
  31. Qi, C.R.; Yi, L.; Su, H.; Guibas, L.J. Pointnet++: Deep hierarchical feature learning on point sets in a metric space. Adv. Neural Inf. Process. Syst. 2017, 30, 5105–5114. [Google Scholar] [CrossRef]
  32. Hu, Q.; Yang, B.; Xie, L.; Rosa, S.; Guo, Y.; Wang, Z.; Trigoni, N.; Markham, A. Randla-net: Efficient semantic segmentation of large-scale point clouds. In Proceedings of the IEEE/CVF Conference on Computer Vision and Pattern Recognition, Seattle, WA, USA, 13–19 June 2020; pp. 11108–11117. [Google Scholar] [CrossRef]
  33. Xiao, A.; Yang, X.; Lu, S.; Guan, D.; Huang, J. FPS-Net: A convolutional fusion network for large-scale LiDAR point cloud segmentation. ISPRS J. Photogramm. Remote Sens. 2021, 176, 237–249. [Google Scholar] [CrossRef]
  34. Wang, Y.; Sun, Y.; Liu, Z.; Sarma, S.E.; Bronstein, M.M.; Solomon, J.M. Dynamic graph cnn for learning on point clouds. Acm. Trans. Graph. (Tog) 2019, 38, 1–12. [Google Scholar] [CrossRef] [Green Version]
  35. Mao, Y.; Chen, K.; Diao, W.; Sun, X.; Lu, X.; Fu, K.; Weinmann, M. Beyond single receptive field: A receptive field fusion-and-stratification network for airborne laser scanning point cloud classification. ISPRS J. Photogramm. Remote Sens. 2022, 188, 45–61. [Google Scholar] [CrossRef]
  36. Mallet, C.; Bretar, F. Full-waveform topographic lidar: State-of-the-art. ISPRS J. Photogramm. Remote Sens. 2009, 64, 1–16. [Google Scholar] [CrossRef]
  37. Wulder, M.A.; White, J.C.; Nelson, R.F.; Næsset, E.; Ørka, H.O.; Coops, N.C.; Hilker, T.; Bater, C.W.; Gobakken, T. LiDAR sampling for large-area forest characterization: A review. Remote Sens. Environ. 2012, 121, 196–209. [Google Scholar] [CrossRef] [Green Version]
  38. Doneus, M.; Briese, C. Digital terrain modelling for archaeological interpretation within forested areas using full-waveform laserscanning. In Proceedings of the 7th International Conference on Virtual Reality, Archaeology and Intelligent Cultural Heritage, Nicosia, Cyprus, 30 October–4 November 2006; pp. 155–162. [Google Scholar] [CrossRef]
  39. Wagner, W.; Hollaus, M.; Briese, C.; Ducic, V. 3D vegetation mapping using small-footprint full-waveform airborne laser scanners. Int. J. Remote Sens. 2008, 29, 1433–1452. [Google Scholar] [CrossRef] [Green Version]
  40. Lin, Y.C.; Mills, J.P. Integration of full-waveform information into the airborne laser scanning data filtering process. Int. Arch. Photogramm. Remote Sens. Spat. Inf. Sci. 2009, 36, 224–229. [Google Scholar]
  41. Hu, B.; Gumerov, D.; Wang, J.; Zhang, W. An integrated approach to generating accurate DTM from airborne full-waveform LiDAR data. Remote Sens. 2017, 9, 871. [Google Scholar] [CrossRef] [Green Version]
  42. Xing, S.; Li, P.; Xu, Q.; Wang, D.; Li, P. Surface Fitting Filtering of LiDAR Point Cloud with Waveform Information. ISPRS Ann. Photogramm. Remote Sens. Spat. Inf. Sci. 2017, 4, 179–184. [Google Scholar] [CrossRef] [Green Version]
  43. Ma, H.; Zhou, W.; Zhang, L. DEM refinement by low vegetation removal based on the combination of full waveform data and progressive TIN densification. ISPRS J. Photogramm. Remote Sens. 2018, 146, 260–271. [Google Scholar] [CrossRef]
  44. Pirotti, F. Analysis of full-waveform LiDAR data for forestry applications: A review of investigations and methods. Iforest-Biogeosciences For. 2011, 4, 100. [Google Scholar] [CrossRef] [Green Version]
  45. Ding, Y.; Zhang, Z.; Zhao, X.; Hong, D.; Li, W.; Cai, W.; Zhan, Y. AF2GNN: Graph convolution with adaptive filters and aggregator fusion for hyperspectral image classification. Inf. Sci. 2022, 602, 201–219. [Google Scholar] [CrossRef]
  46. Ding, Y.; Zhang, Z.; Zhao, X.; Cai, W.; Yang, N.; Hu, H.; Huang, X.; Cao, Y.; Cai, W. Unsupervised self-correlated learning smoothy enhanced locality preserving graph convolution embedding clustering for hyperspectral images. IEEE Trans. Geosci. Remote Sens. 2022, 60, 1–16. [Google Scholar] [CrossRef]
  47. Zhang, Z.; Ding, Y.; Zhao, X.; Siye, L.; Yang, N.; Cai, Y.; Zhan, Y. Multireceptive field: An adaptive path aggregation graph neural framework for hyperspectral image classification. Expert Syst. Appl. 2023, 217, 119508. [Google Scholar] [CrossRef]
  48. Ding, Y.; Zhang, Z.; Zhao, X.; Hong, D.; Cai, W.; Yang, N.; Wang, B. Multi-scale receptive fields: Graph attention neural network for hyperspectral image classification. Expert Syst. Appl. 2023, 223, 119858. [Google Scholar] [CrossRef]
  49. Dalponte, M.; Bruzzone, L.; Gianelle, D. Fusion of hyperspectral and LIDAR remote sensing data for classification of complex forest areas. IEEE Trans. Geosci. Remote Sens. 2008, 46, 1416–1427. [Google Scholar] [CrossRef] [Green Version]
  50. Wang, H.; Glennie, C. Fusion of waveform LiDAR data and hyperspectral imagery for land cover classification. ISPRS J. Photogramm. Remote Sens. 2015, 108, 1–11. [Google Scholar] [CrossRef]
  51. Chu, H.J.; Wang, C.K.; Kong, S.J.; Chen, K.C. Integration of full-waveform LiDAR and hyperspectral data to enhance tea and areca classification. GIScience Remote Sens. 2016, 53, 542–559. [Google Scholar] [CrossRef]
  52. Wagner, W.; Ullrich, A.; Ducic, V.; Melzer, T.; Studnicka, N. Gaussian decomposition and calibration of a novel small-footprint full-waveform digitising airborne laser scanner. ISPRS J. Photogramm. Remote Sens. 2006, 60, 100–112. [Google Scholar] [CrossRef]
  53. Hofton, M.A.; Minster, J.B.; Blair, J.B. Decomposition of laser altimeter waveforms. IEEE Trans. Geosci. Remote Sens. 2000, 38, 1989–1996. [Google Scholar] [CrossRef]
  54. Sun, K.; Geng, X.; Ji, L. Exemplar component analysis: A fast band selection method for hyperspectral imagery. IEEE Geosci. Remote Sens. Lett. 2014, 12, 998–1002. [Google Scholar] [CrossRef]
  55. Bolón-Canedo, V.; Sánchez-Maroño, N.; Alonso-Betanzos, A. Feature selection for high-dimensional data. Prog. Artif. Intell. 2016, 5, 65–75. [Google Scholar] [CrossRef]
  56. Vaswani, A.; Shazeer, N.; Parmar, N.; Uszkoreit, J.; Jones, L.; Gomez, A.N.; Kaiser, Ł.; Polosukhin, I. Attention is all you need. In Proceedings of the 31st Conference on Neural Information Processing Systems (NIPS 2017), Long Beach, CA, USA, 3–9 December 2017; Volume 30, p. 3058. [Google Scholar] [CrossRef]
  57. Zhang, W.; Qi, J.; Wan, P.; Wang, H.; Xie, D.; Wang, X.; Yan, G. An easy-to-use airborne LiDAR data filtering method based on cloth simulation. Remote Sens. 2016, 8, 501. [Google Scholar] [CrossRef]
Figure 1. Top view of the experimental dataset: (a) the airborne full-waveform LiDAR data; (b) false hyperspectral image. Training and test area correspond to green and red boxes in (a), respectively.
Remotesensing 15 03499 g001
Figure 2. Workflow of the proposed framework.
Remotesensing 15 03499 g002
Figure 3. The relationship between returned waveform and surface type: (a) a flat surface; (b) an oblique plane; (c) a short building; (d) a tall building; (e) low shrubs; and (f) tall trees.
Remotesensing 15 03499 g003
Figure 4. Neighborhood definitions: (a) cylinder neighborhood; (b) sphere neighborhood; and (c) grid neighborhood. The red point is the current point, and the blue points are other points in the neighborhood, respectively.
Remotesensing 15 03499 g004
Figure 5. ECA algorithm result: (a) ES for each band, where the horizontal axis is the band number, and the vertical axis is the exemplar score of each band. (b) Sorting the ESs from high to low.
Remotesensing 15 03499 g005
Figure 6. Overall structural framework of IDGCNN: (n, (3 + 18)) represents the number of points and feature dimensions, respectively. The (n × 1) in the last rectangle means that the model directly outputs the predicted label for each point.
Remotesensing 15 03499 g006
Figure 7. Architecture of feature pooling: MLP stands for multilayer perceptron. EdgeConv stands for EdgeConv convolution.
Remotesensing 15 03499 g007
Figure 8. Architecture of category labeling.
Remotesensing 15 03499 g008
Figure 9. Architecture of EdgeConv convolution.
Remotesensing 15 03499 g009
Figure 10. Waveform decomposition process: (a) raw waveform data; (b) smoothing processing results; and (c) waveform decomposition results.
Remotesensing 15 03499 g010
Figure 11. Waveform decomposition results. The black frame shows a selected part of the section that is shown in Figure 12.
Remotesensing 15 03499 g011
Figure 12. Sectional view of part of the point cloud: (a) raw point cloud data; (b) waveform decomposition results. The purple point cloud is the original system point cloud, and the yellow point cloud is the point cloud data processed with the waveform decomposition algorithm. The yellow line is the artificially drawn ground line.
Remotesensing 15 03499 g012
Figure 13. The terrain rendering of the filtering results: (a) the result of point extraction using only 3D coordinates as features; (b) the result of ground point extraction with LF feature added; (c) the result of ground point extraction with HF feature added; (d) the result of ground point extraction with WF feature added; and (e) the ground point extraction result using all features. The black frame shows the selected part of the section that is shown in Figure 14.
Remotesensing 15 03499 g013
Figure 14. The terrain rendering of the filtering results: (a) the result of point extraction using only 3D coordinates as features; (b) the result of ground point extraction with LF feature added; (c) the result of ground point extraction with HF feature added; (d) the result of ground point extraction with WF feature added; and (e) the ground point extraction result using all features. The green outlines in the figures identify the locations of the differences. The red points are ground points and the white points are non-ground points, respectively.
Remotesensing 15 03499 g014
Figure 15. Part calculation result section display: the white points are non-ground points, the red points are ground points, (a) is the ground point extraction result of the DGCNN algorithm, (b) is the ground point extraction result of the PointNet++ algorithm, (c) is the ground point extraction result of the RandLA-net algorithm, (d) is the ground point extraction result of the RFFS-Net algorithm, and (e) is the ground point extraction result of the IDGCNN algorithm. The green outlines in the figures identify the locations of the differences. The red points are ground points and the white points are non-ground points, respectively.
Remotesensing 15 03499 g015
Figure 16. Comparison between DEM generated results: (a) DEM generated with the ground points from IDGCNN; (b) DEM generated with the ground points from CSF filtering; (c) DEM generated with the ground points from IDGCNN labeling and CSF refinement DEM; and (d) altitude legend. The black dots represent the positions of the control points in (a).
Remotesensing 15 03499 g016
Table 1. Some of the point cloud filtering algorithms specifically for forest areas.
IDAuthor NameAlgorithm Name
1Evans and HudakMultiscale curvature classification (MCC) [13]
2Vega et al.Sequential iterative dual-filter [14]
3Almasi et al.Ground-fitting- and residual-filtering-based filter [15]
4Zhao et al.Improved progressive TIN densification (IPTD) [16]
5Chen et al.Multi-level-interpolation-based filter [17]
6Almasi et al.Fitting-based algorithm [18]
7Behnaz et al.Fused-morphology-based and slope-based filter [19]
8Li et al.Voxels-based morphological filter [20]
9Hui et al.Mean-shift segmentation morphological filter [21]
Table 2. Statistics of the contrast experiments by adopting different feature sets.
OA (%)Kappa (%)Type I (%)Type II (%)Total (%)
3C97.9084.427.291.632.10
3C + LF98.4789.945.531.181.53
3C + HF98.7691.684.031.001.24
3C + WF99.0594.243.850.610.95
ALL99.3895.952.920.410.62
Table 3. Statistics of selected deep learning models.
OA (%)Kappa (%)Type I (%)Type II (%)Total (%)
DGCNN98.3389.277.741.111.67
PointNet++98.2088.2010.081.051.80
RandLA-Net98.7391.686.750.781.27
RFFS-Net97.8286.367.041.742.18
IDGCNN99.3895.952.920.410.62
Table 4. DEM error statistics table.
Median Error (m) Maximum Error (m)Average Error (m)
IDCGNN0.451.010.35
CSF0.682.090.42
IDGCNN + CSF0.410.750.33
Disclaimer/Publisher’s Note: The statements, opinions and data contained in all publications are solely those of the individual author(s) and contributor(s) and not of MDPI and/or the editor(s). MDPI and/or the editor(s) disclaim responsibility for any injury to people or property resulting from any ideas, methods, instructions or products referred to in the content.

