Post-Shock Gravitational Erosion and Sediment Yield: A Case Study of Landscape Transformation along the Wenchuan–Yingxiu Section of the Minjiang River, Sichuan, China
Abstract
:1. Introduction
2. Materials and Methods
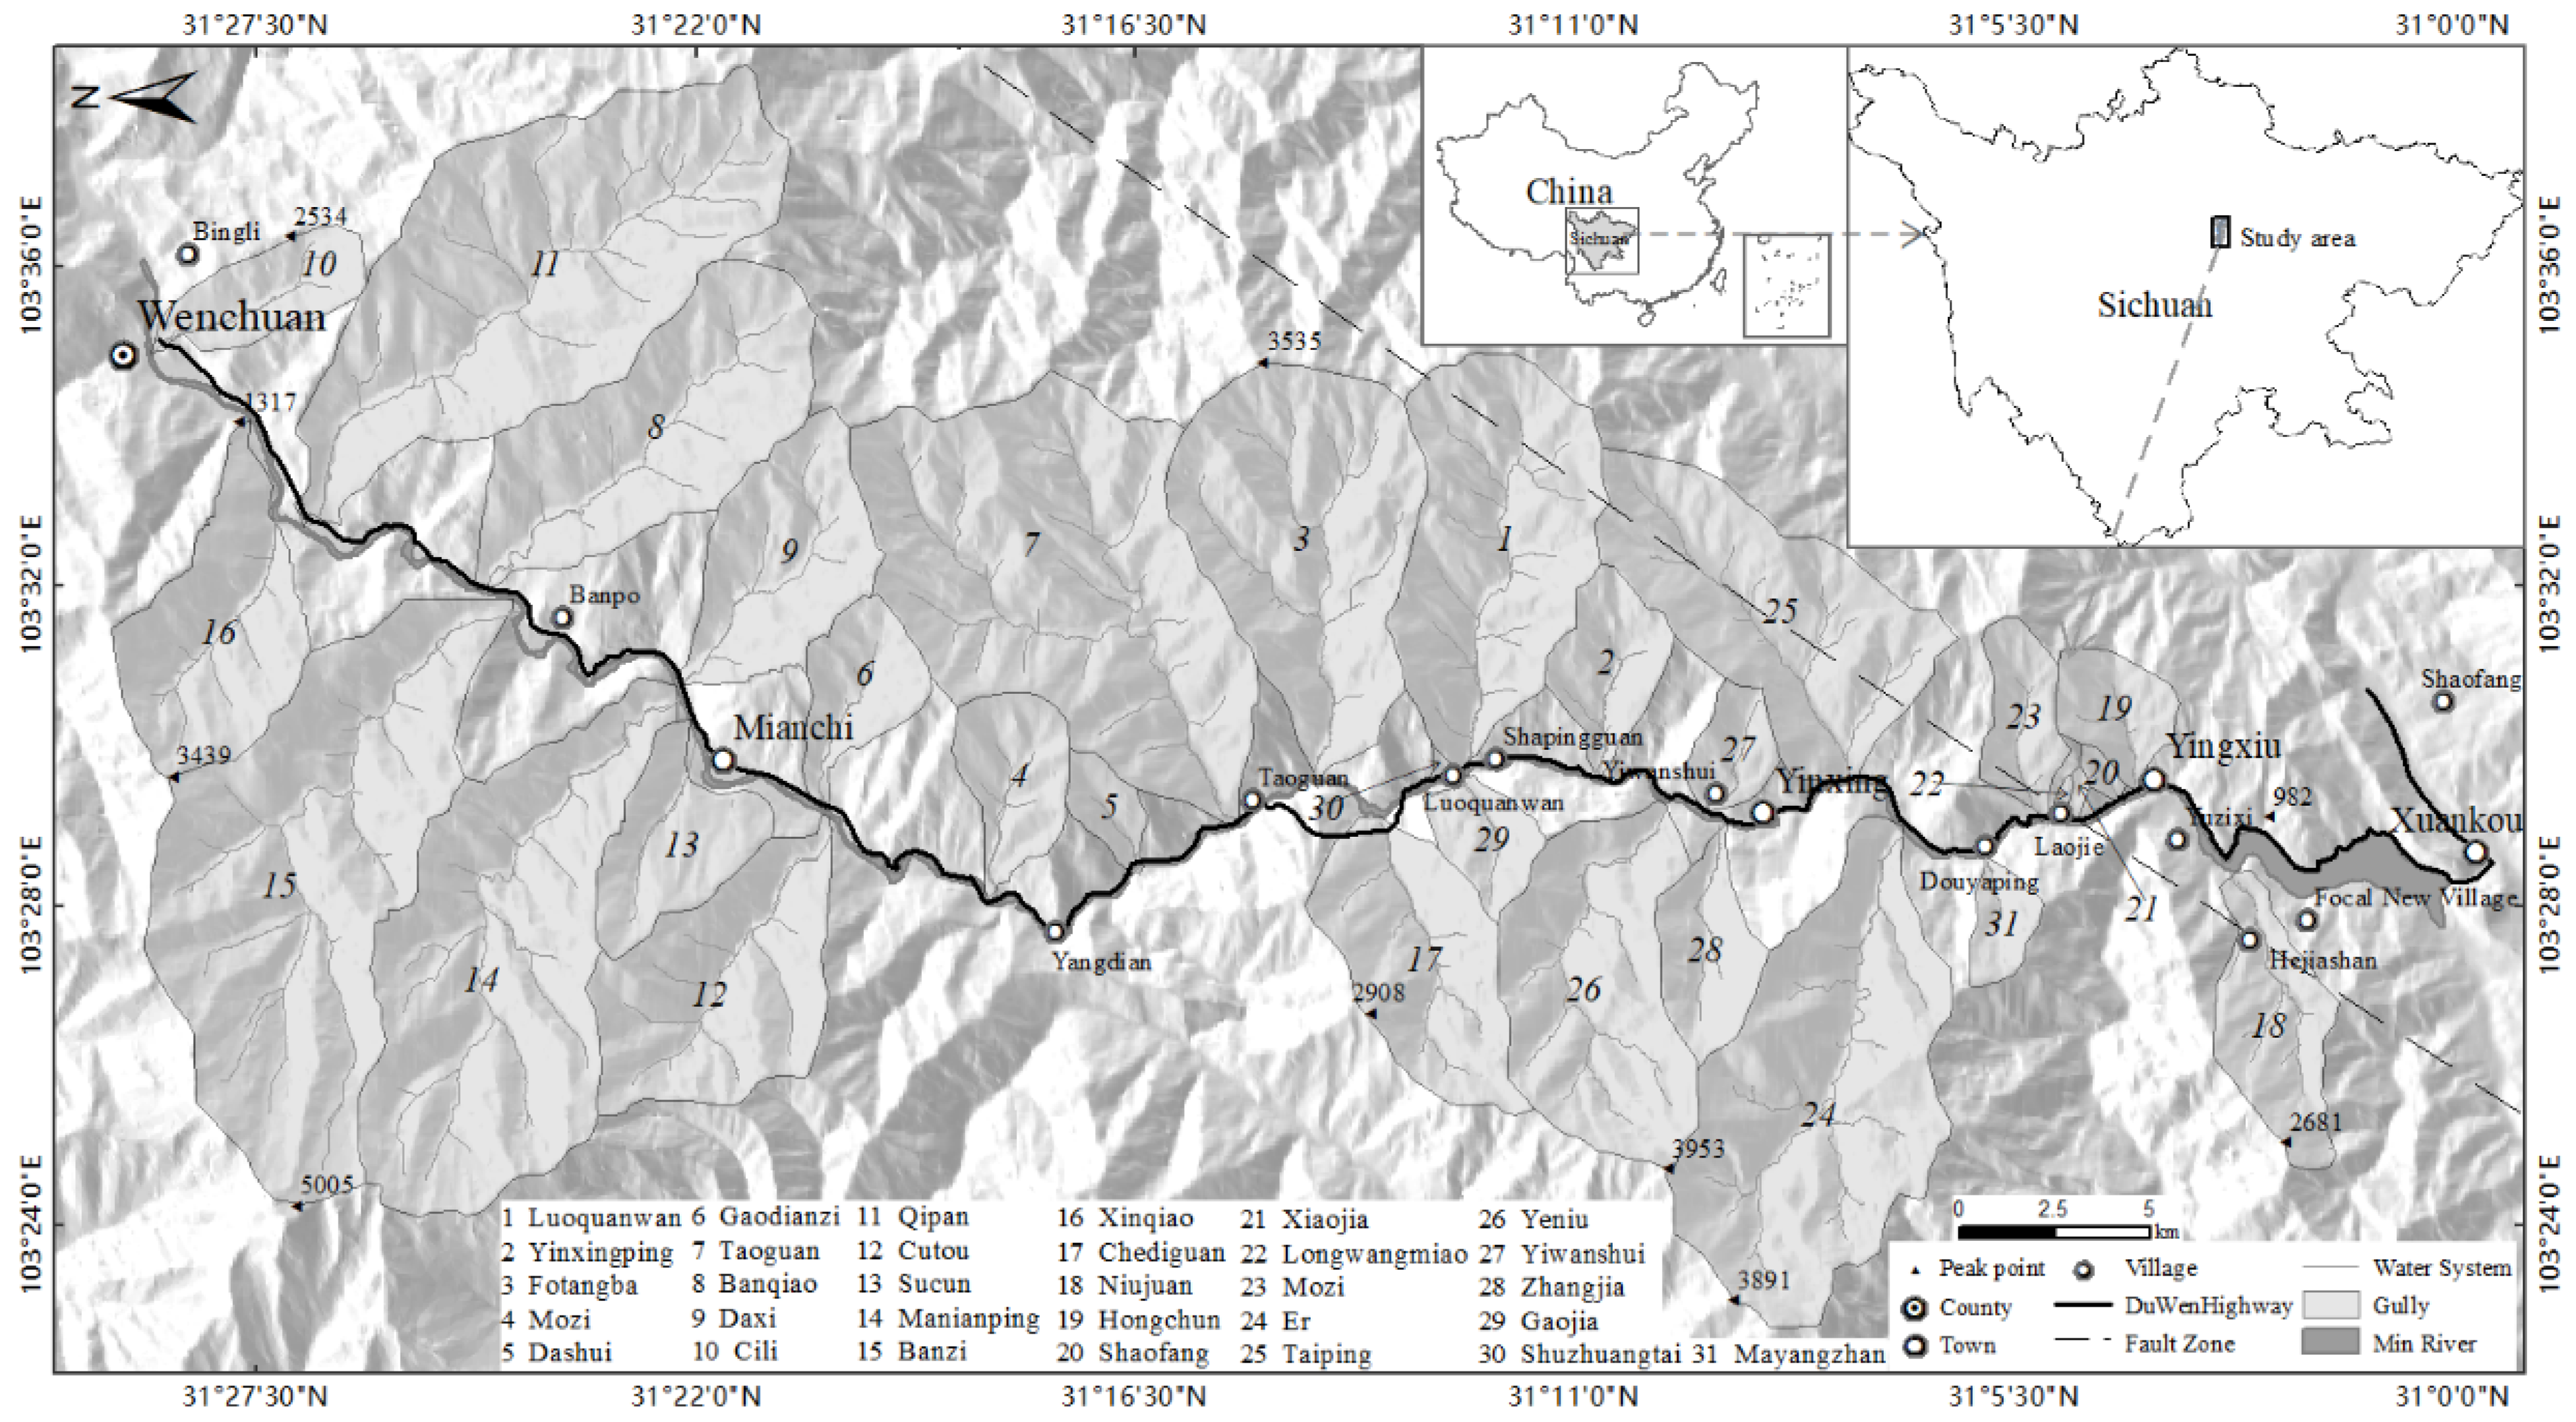
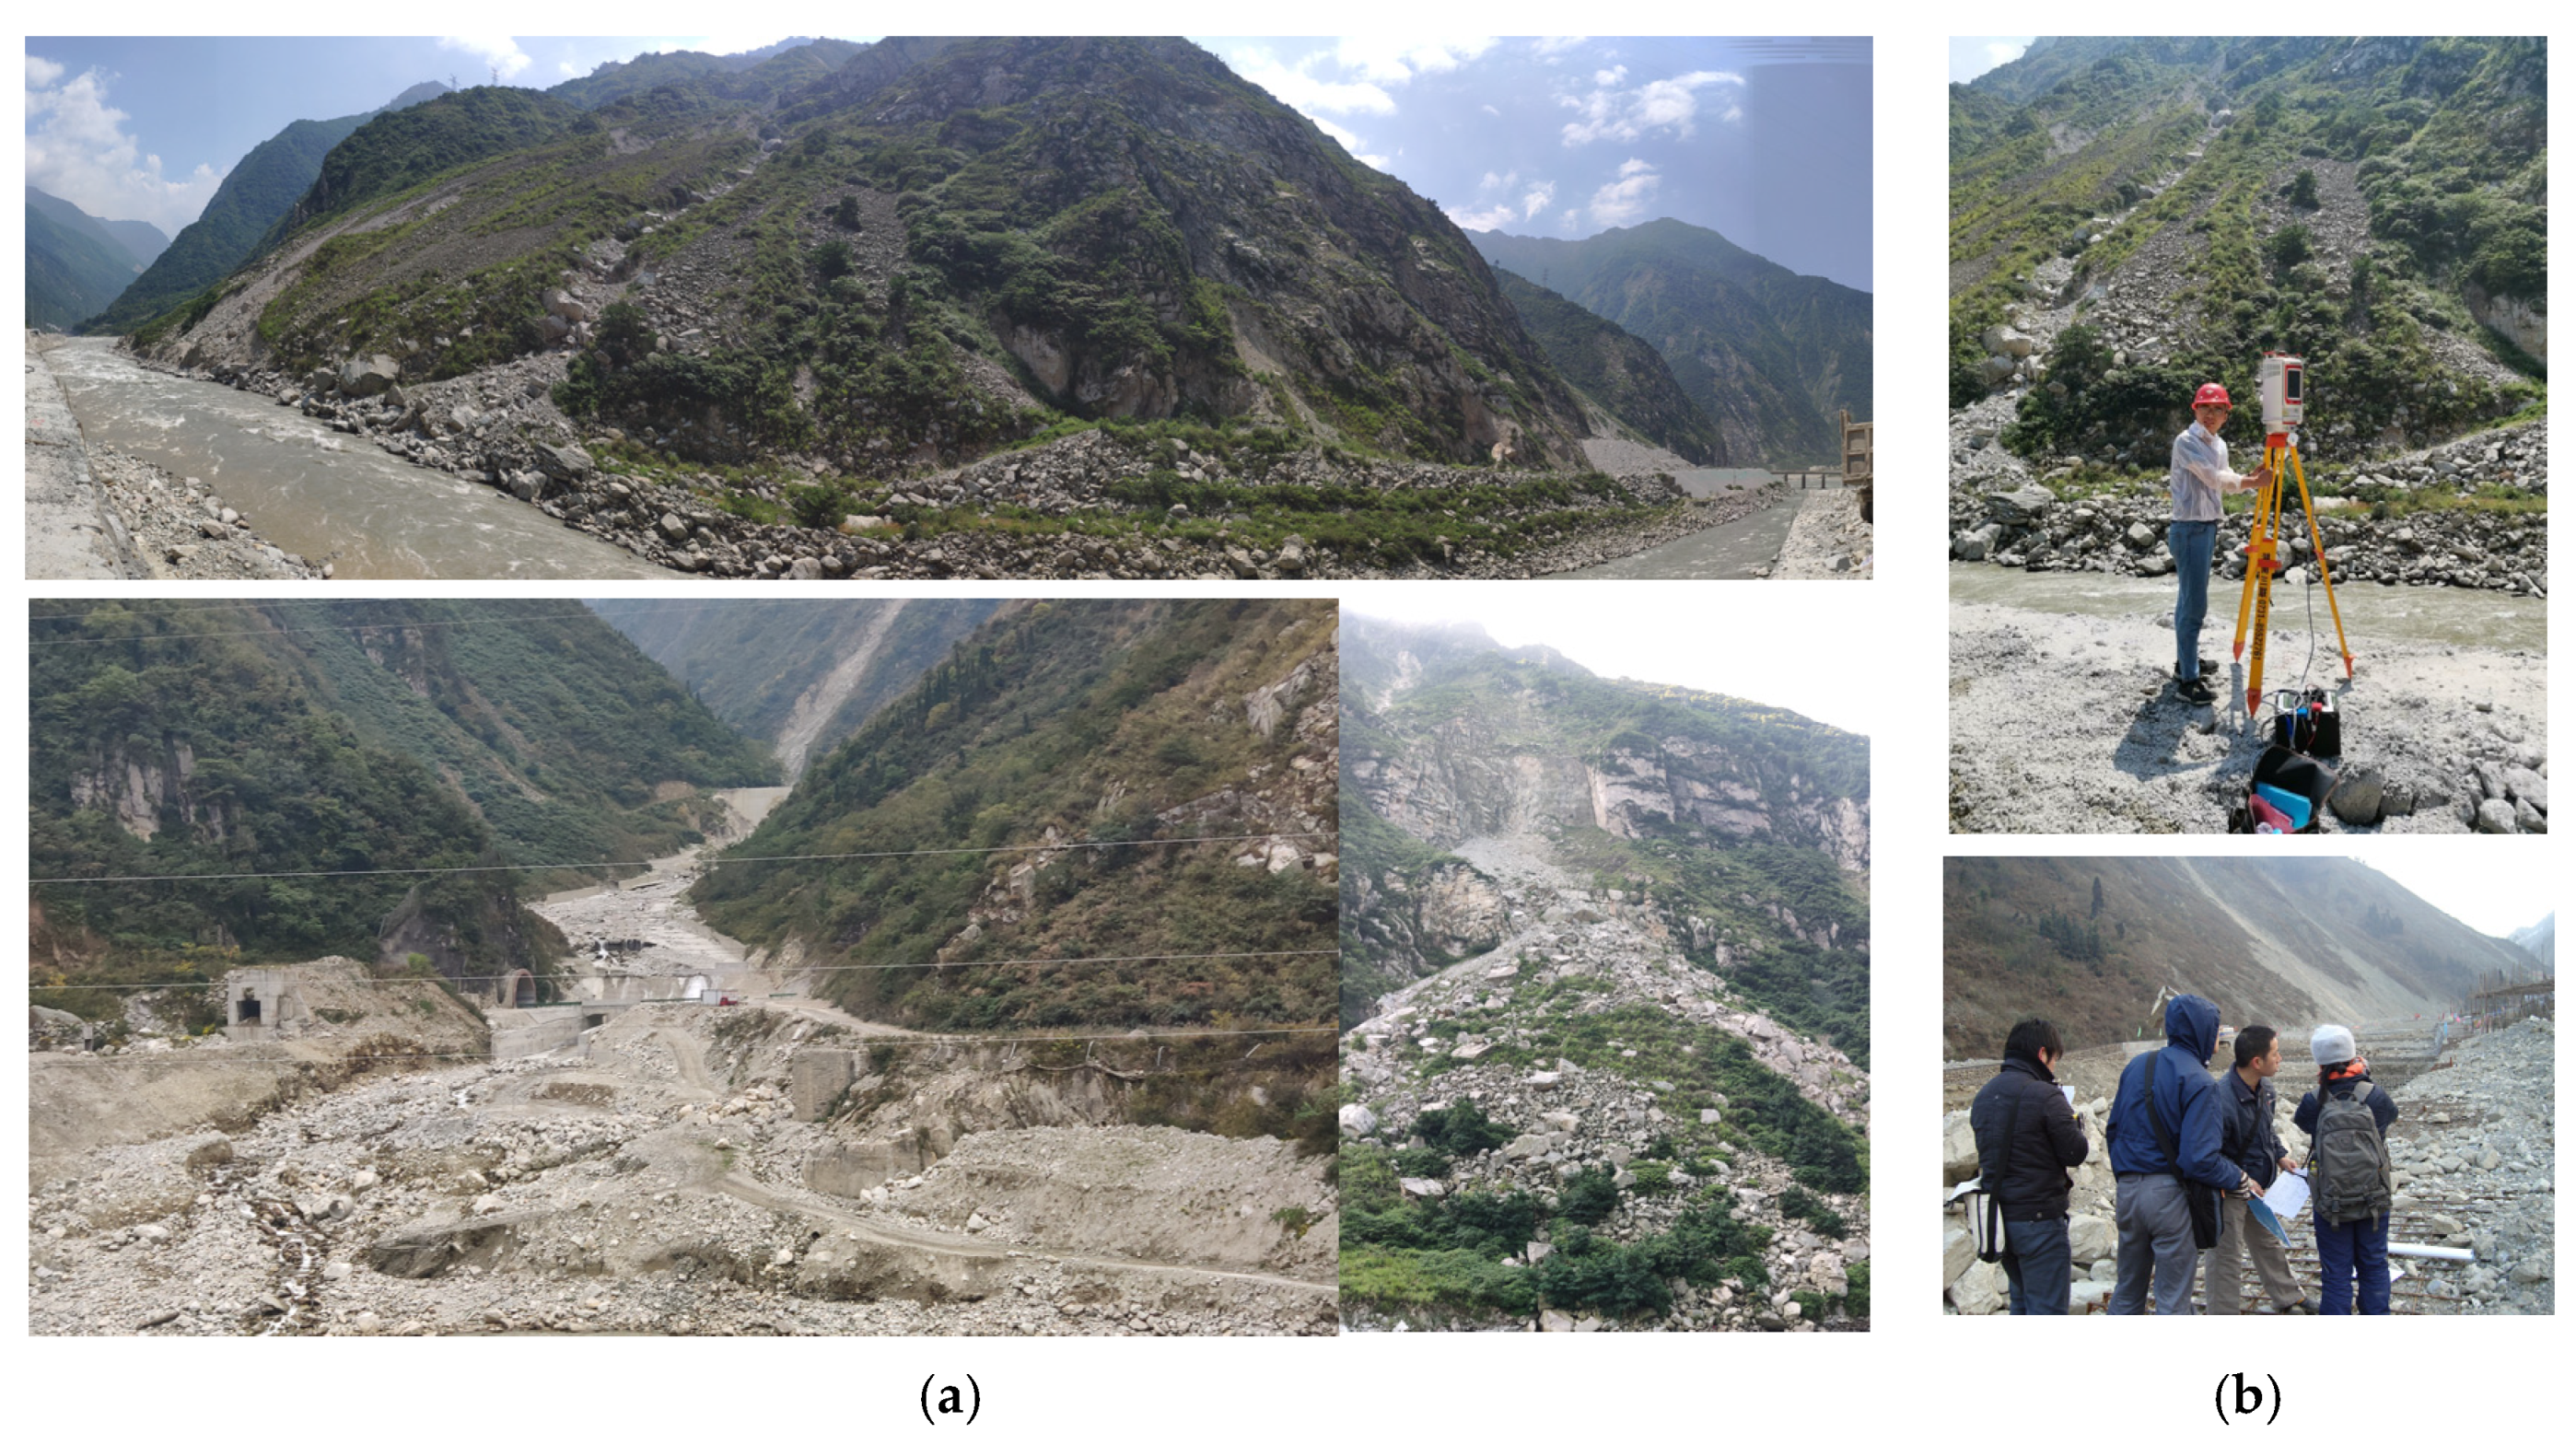
2.1. Study Area and Data Sources
2.2. Construction of Digital Slope–Ditch System
2.2.1. Micro-Geomorphic Factors
2.2.2. Macroscopic Geomorphic Factors
2.3. Gravity Erosion Deformation Field
2.4. Prediction Model of Gravity Erosion and Sediment Yield Due to Post-Shock Slope Movement
3. Results
3.1. Characteristics of Erosion and Sediment Production
3.1.1. Characteristics of Erosion and Sediment Yield at a Watershed Scale
3.1.2. Characteristics of Gravity Erosion and Sediment Production in the Main Stream of the Minjiang River
3.2. Geomorphic Effects of Gravity Erosion
3.2.1. Effect of Micro-Landform
3.2.2. Macro-Geomorphic Effect
3.2.3. Effect of a Collapsed Landslide on Sediment Yield under Multi-Factor Coupling
3.3. Activity Analysis of Gravity Erosion of Post-Shock Slope Movement
4. Discussion
- a.
- High-precision multi-source remote sensing technology enables the dynamic monitoring of post-earthquake geohazards and offers sophisticated and dependable technical methods for large-scale quantitative studies on gravity erosion and sediment [40]. However, its cost, hardware and software processing requirements, spatial and temporal resolution, and technical threshold have restricted its popularity and applicability [41], and it is challenging to implement real-time monitoring of the gravity erosion process [42]. Therefore, the accuracy and effectiveness of monitoring and evaluating gravity erosion of downslope movement can be further improved when combined with multi-source earth observation technologies such as the unmanned aerial vehicles, three-dimensional laser scanning systems, close-range photogrammetry, and ground-based radars [43,44].
- b.
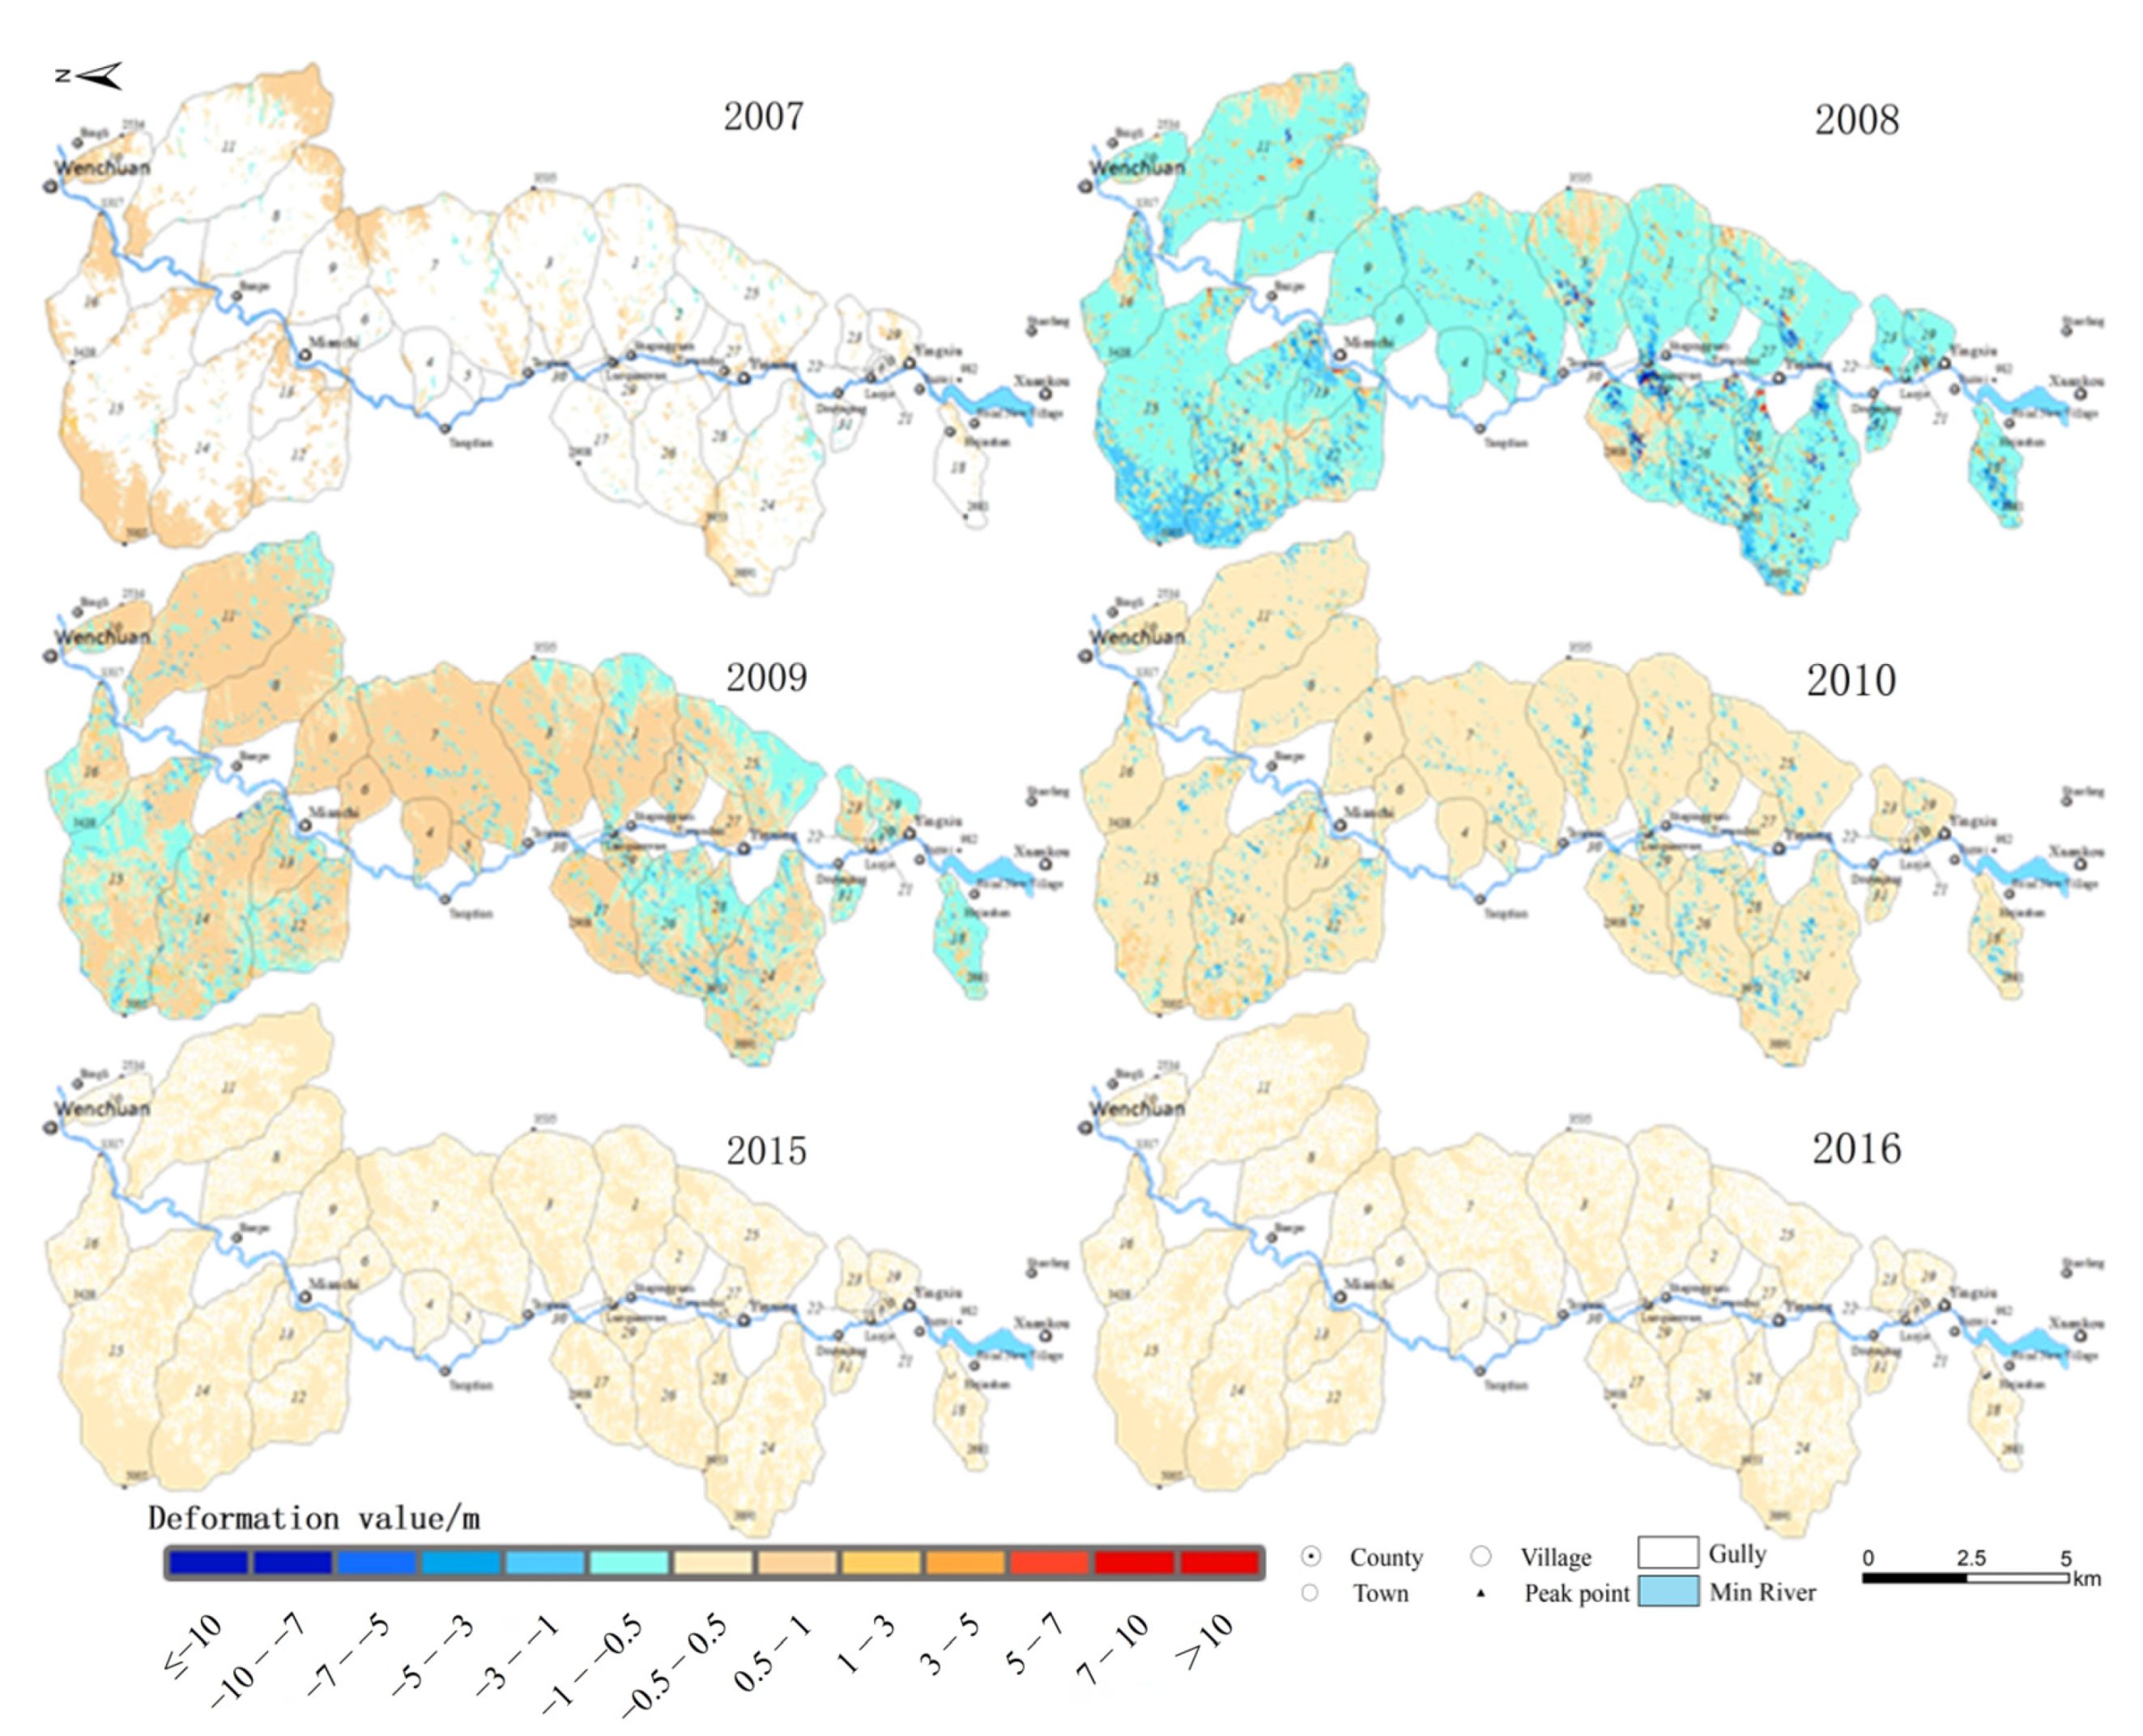
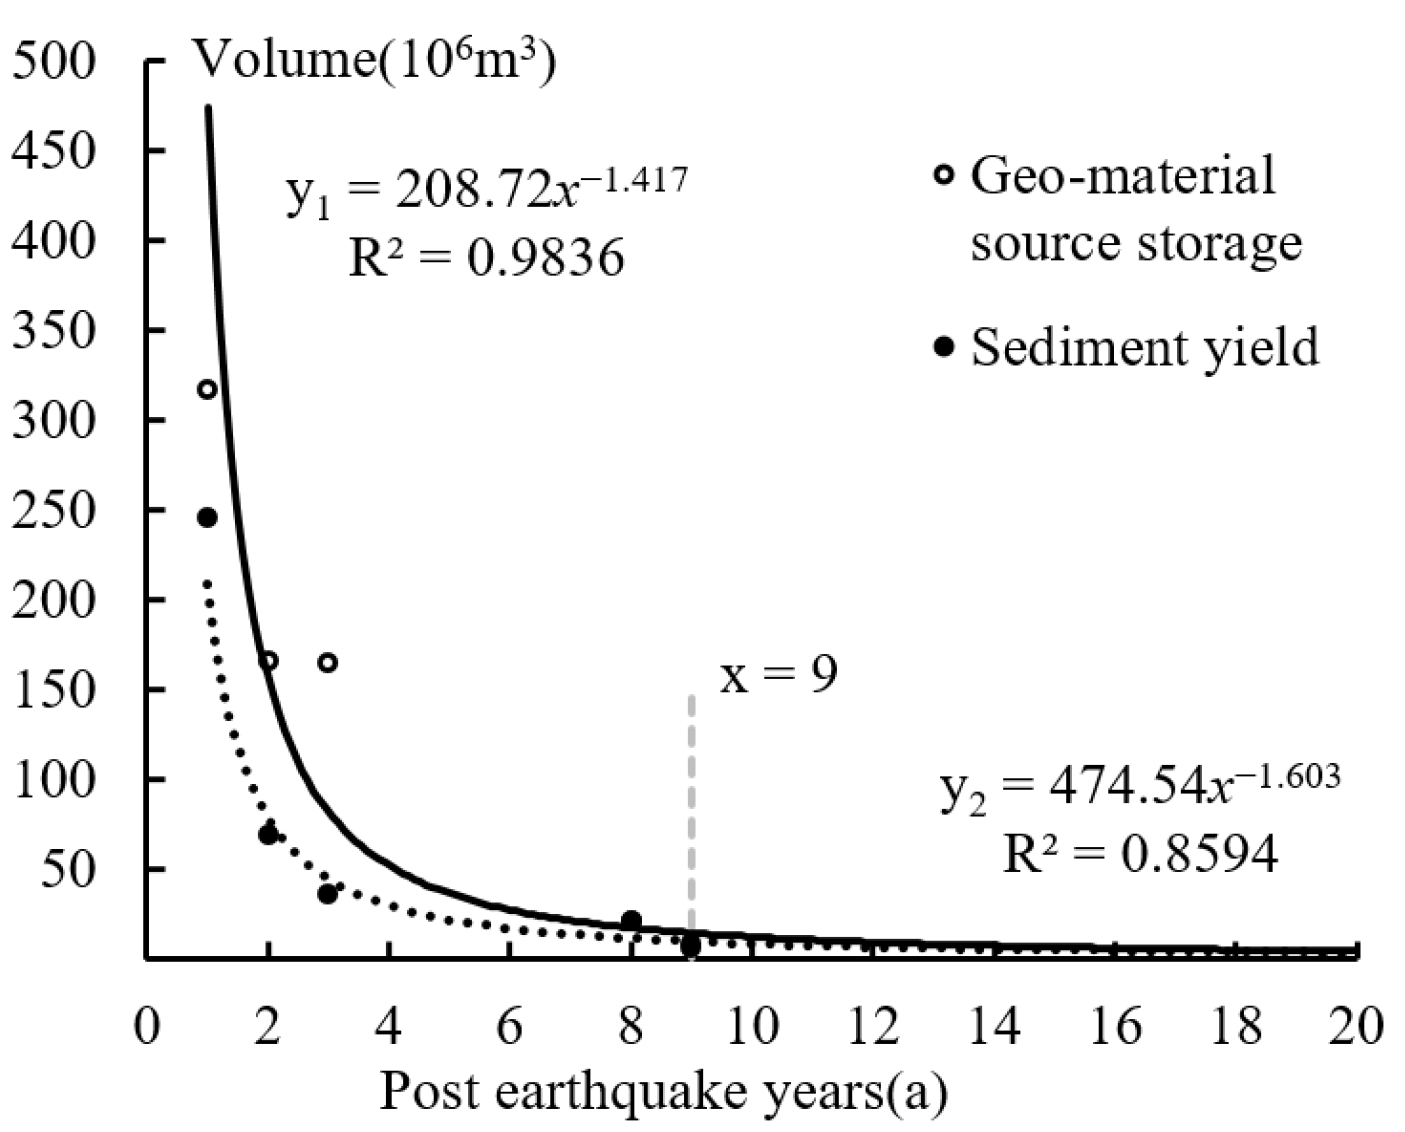
- The Minjiang River basin experienced significant accumulations of solid loose materials during the 2008 Wenchuan earthquakes, which could pose threats to surface material migration, erosion, and sediment yield (Figure 5 and Table 5). Geo-material aggregation would make it simple to create secondary geological disasters with high frequency, large scale, and clustered occurrence in the case of heavy rainfalls [45]. Although the activities of post-shock geo-disasters were undoubtedly more intense than those before the earthquake (Table 10), it appears that earthquake zones now require more rainfall to trigger secondary geo-disasters than in the past [46]. The geo-environment begins to noticeably improve with the regeneration of flora as solid loose materials are transported from steep slopes and gullies to gentle terrains and consecutive catastrophe avoidance measures are implemented in the basin. Following the earthquake, gravity erosion and sediment yield showed a variation attenuation pattern over time (Table 5, Table 10, and Figure 13). Additionally, the basin’s erosion and sediment output created a clear hanging wall effect (Figure 3 and Table 4). This is mostly due to the basin passing through the Wenchuan earthquake’s main fault zone, with the majority of the earthquake’s shaking occurring on its upper wall, which increased the generation of collapses and landslides, as was supported by related research [47]. Additionally, according to studies, the active period of secondary geo-disasters would be extended from 10 to 20 years, particularly in the first five years following an earthquake.
- c.
- The basin’s steep slopes, which are covered with an abundance of geomaterials in the upper mountains, were favorable for the rapid creation of runoff and the confluence of rainfall, and they offered a significant initial energy and power source for gravity erosion and material migration [48]. Gravity erosion in the basin produced a pattern of sediment output that included annual accumulation (Figure 5 and Table 5).
- d.
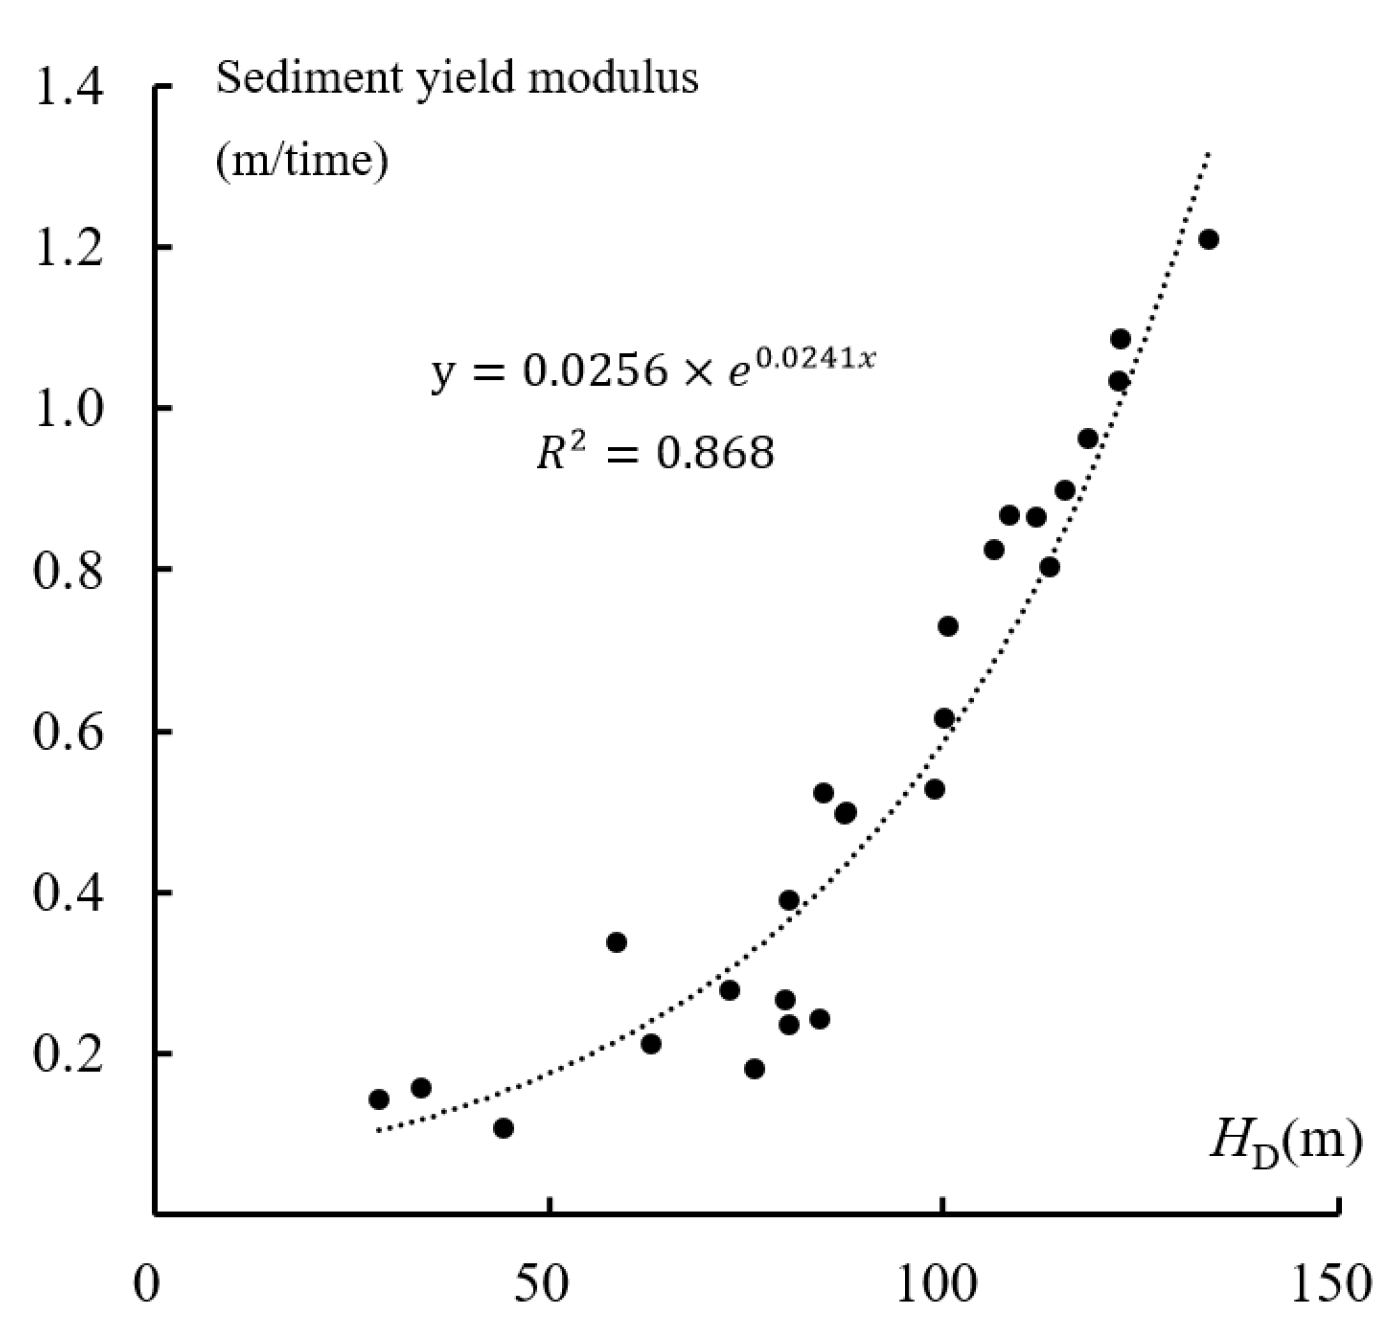
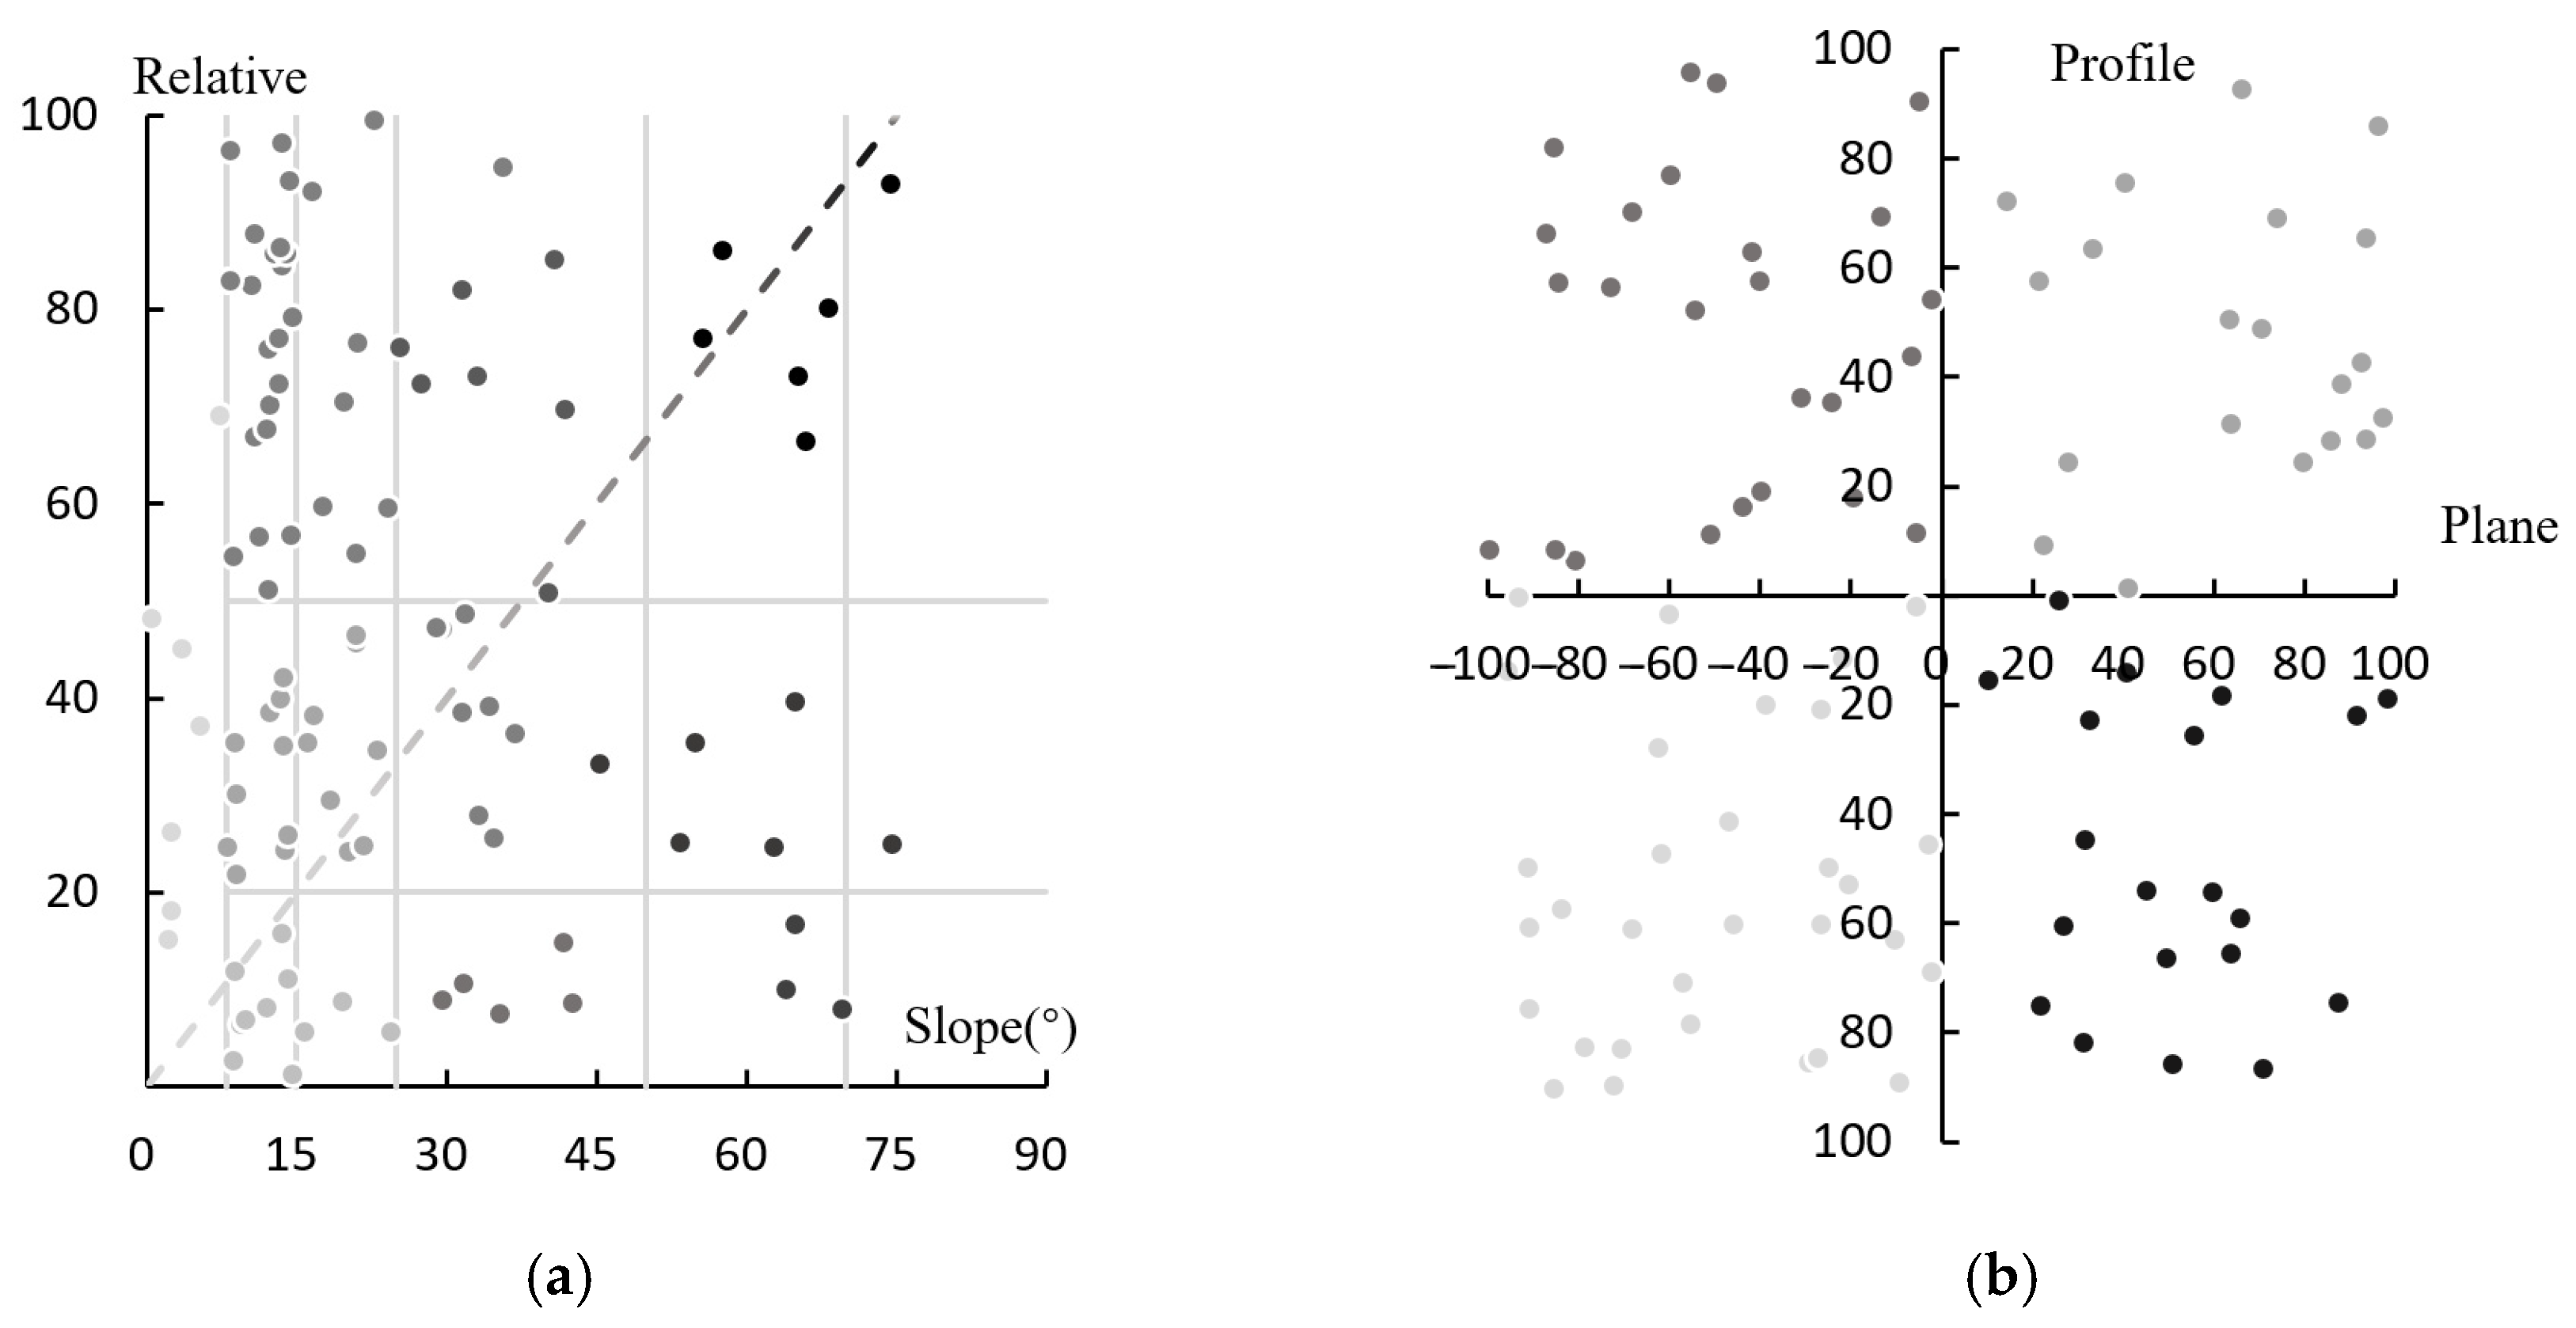
- The dynamic reactions of various landforms or slopes to earthquakes varied. The amplification effect of upper ground motion increased with slope steepness [49]. Sediment yield modulus with respect to a slope in the basin was positively linked with slope gradient and relative height (Figure 6b, Figure 7 and Figure 8a). More than 80% of the sediment yield from gravity erosion in the basin was concentrated on steep and extremely steep slopes with gradients ranging from 25° to 70° (Table 6 and Figure 6b), which is essentially in line with the findings of previous studies. Our data showed that, compared to straight and concave slopes, compound and convex slopes were more vulnerable to gravity erosion, including collapse and landslide. Gravity erosion was clearly influenced by slope types, and mixed and convex slopes showed low stabilities (Figure 8b).
- e.
- According to [50], gravity erosion and sediment production caused by post-shock downslope movement are nonlinear processes influenced by a variety of factors, including topography, geomorphology, geology, earthquake, meteorology, hydrology, soil, vegetation, and human activities [50]. However, in this study, the geomorphological effects of post-shock gravity erosion and sediment production were only examined using geomorphological features. The characteristics, process, and mechanism of gravity erosion and sediment yield under multi-factor coupling need to be further quantitatively analyzed based on field research, experimental observation [51], thorough monitoring, and indoor and outdoor simulation [52].
- f.
- Based on strengthening long-term series of experimental observations [53], it is important to establish quantitative expressions of watershed, channel, and slope body weight erosion and sediment yield in different time and space scales; to determine the scale effect and conversely [51], the main predominant factors and dynamic process of gravity erosion sediment production should be studied in depth [54].
5. Conclusions
- a.
- A model of a high-precision gravity erosion deformation field with a digital slope system was built in this study based on multi-source remote sensing and GIS technology to carefully extract information on post-shock gravity erosion under various time and space scales. This study offers new technical methods for dynamically monitoring and quantitatively analyzing large-scale gravity erosion processes. An approach to quantitative research and modeling analysis of regional gravity erosion sediment production was made possible by combining D-InSAR and Amplitude Tracking technology for the processing of radar data. The updated deformation field could be generated for each episode of downslope movement and parameters could be calculated, including gravity erosion, sediment production, transport, and accumulation. By combining high-resolution remote sensing images with highly accurate digital topographic maps, it introduced a classification criterion for building micro-geomorphological units of post-shock slopes, which is helpful to quantitatively analyze and reveal the process of gravity erosion and sediment production of collapse and landslide.
- b.
- In the research region, the post-earthquake geohazards (collapse and landslides) exhibited strong erosional, sedimentary, and accumulation transport features. The erosion modulus and sediment yield were both declining annually. Following the earthquake, obvious hanging wall effects were exposed by gravity erosion and sediment release, which were then subjected to drainage zones. A total of 80% of the total yearly sediment supply came from 12 watersheds that were located on the top plate of the main fault zone and had rather substantial land areas. The lengthy main channel and steep channel bed of the watershed where the sediments produced by gravity erosion occurred were characterized by transportation and buildup before intense erosion and erosion.
- c.
- Annual buildup defined the sediment outputs in the valleys along the Minjiang River. The Minjiang River deposited 5.16 m of silt in the three years following the earthquake, mostly in the river’s constrictions, channel bends, and debris flow gullies. The Douyaping–Yingxiu stretch of the river, on the other hand, had significant undercutting erosion, with a total undercutting of 3.79 m over three years, particularly in the straight sections of the river with large drops or in the sections going from narrow to wide.
- d.
- The erosion capacity of a slope was greatly influenced by the kind and form of the slope. Sediment yield modulus can be ordered by quantity according to slope types as follows: mixed slope with geohazards events > convex slope > linear slope > concave slope. As a result, this slope type accounted for the majority of post-shock sediment yield. The sediment yield modulus had a positive correlation with the slope gradient and relative height. More than 80% of the total sediment output from gravity erosion in the study area was concentrated in the steep and extremely steep slopes from 25 to 70 degrees.
- e.
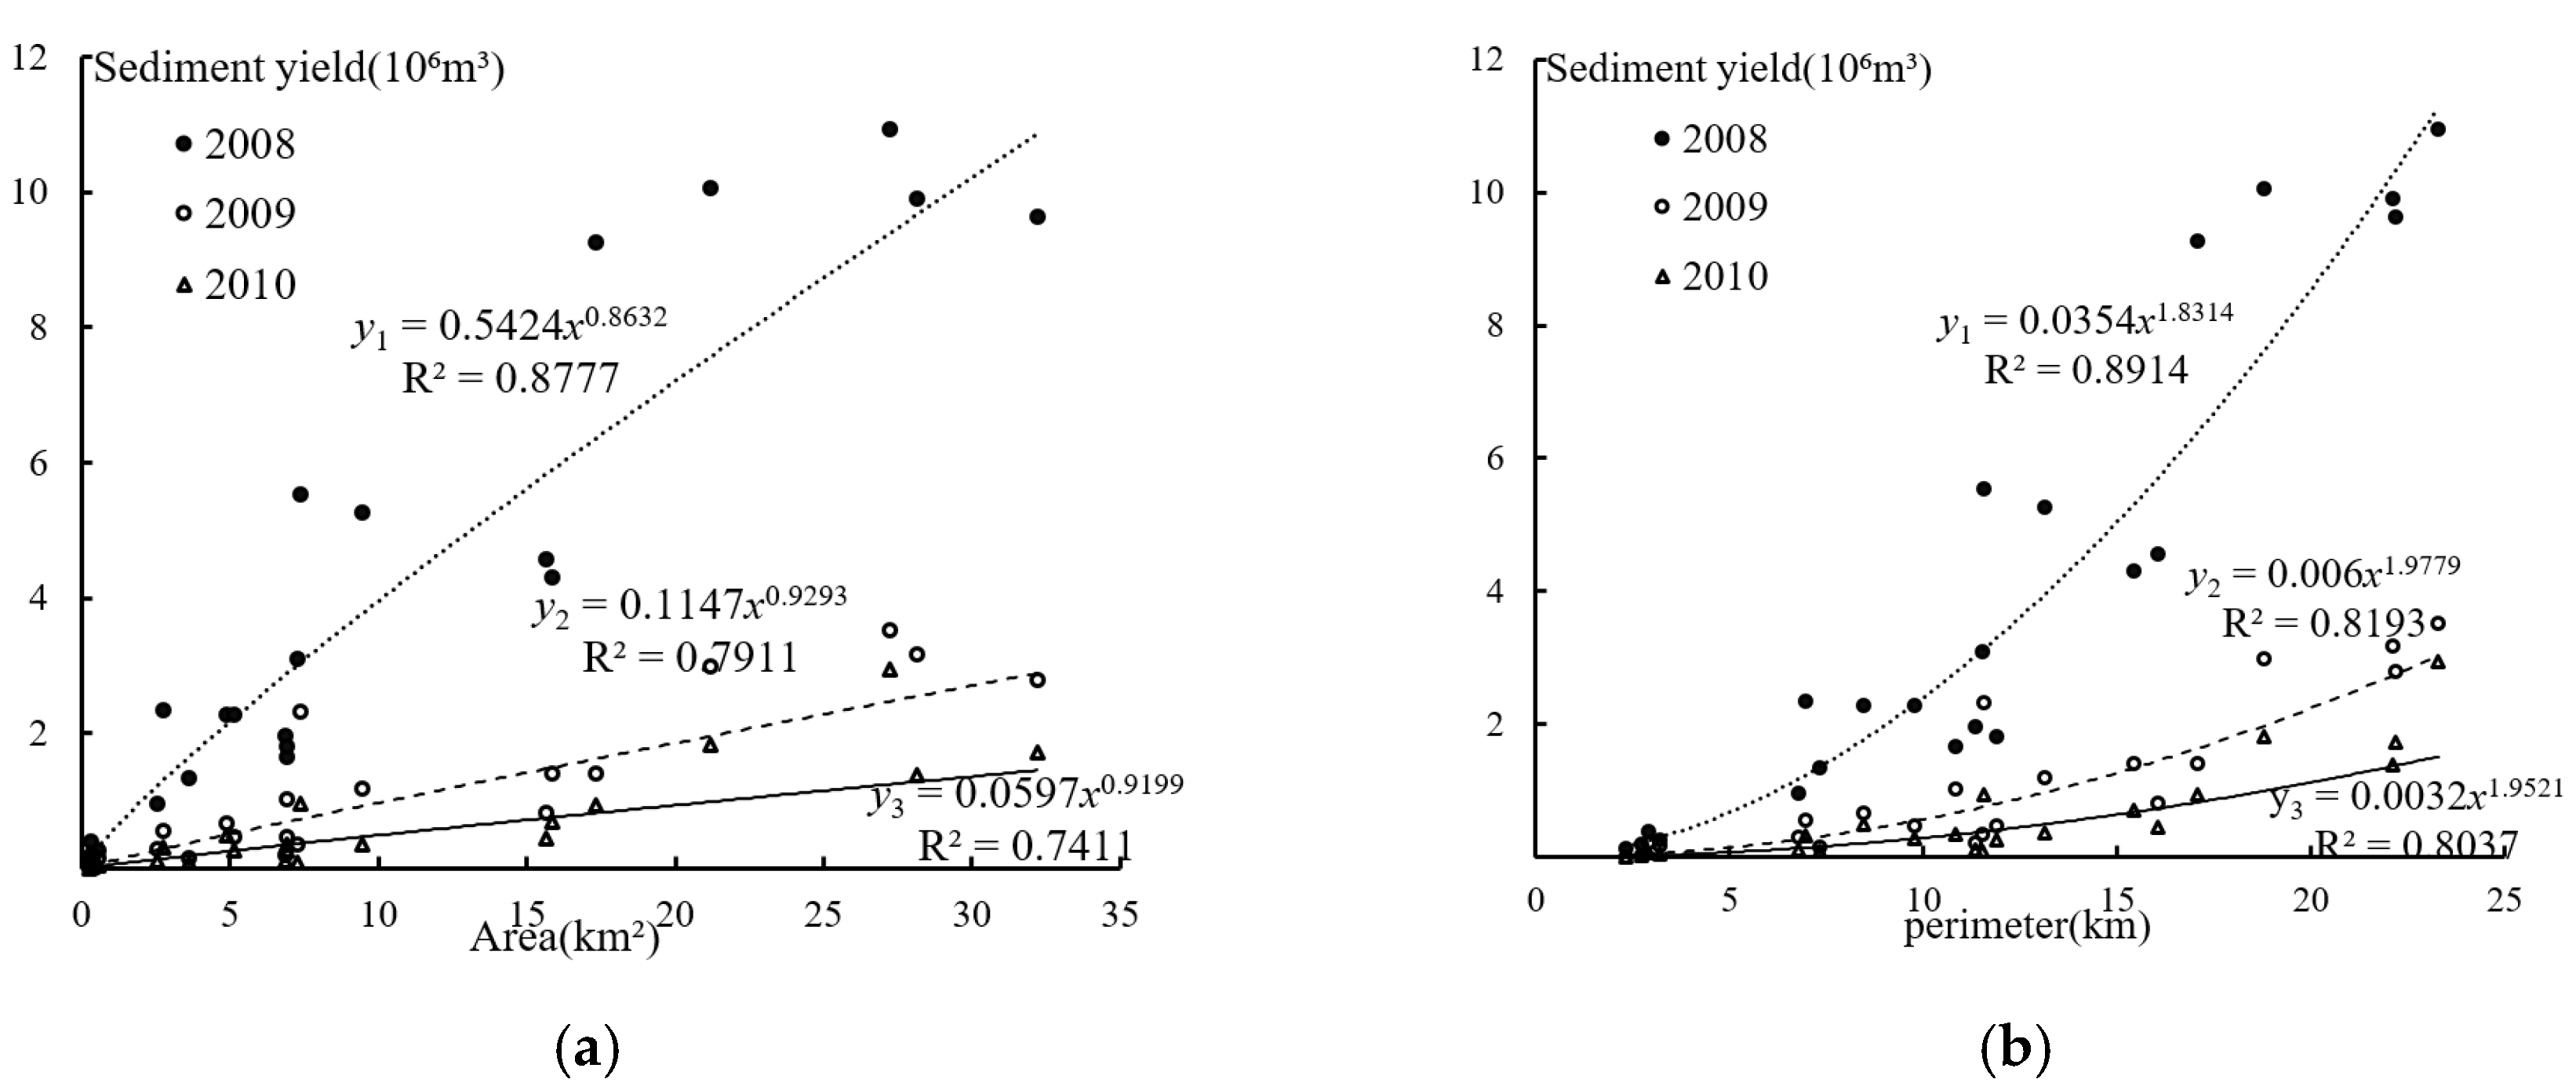
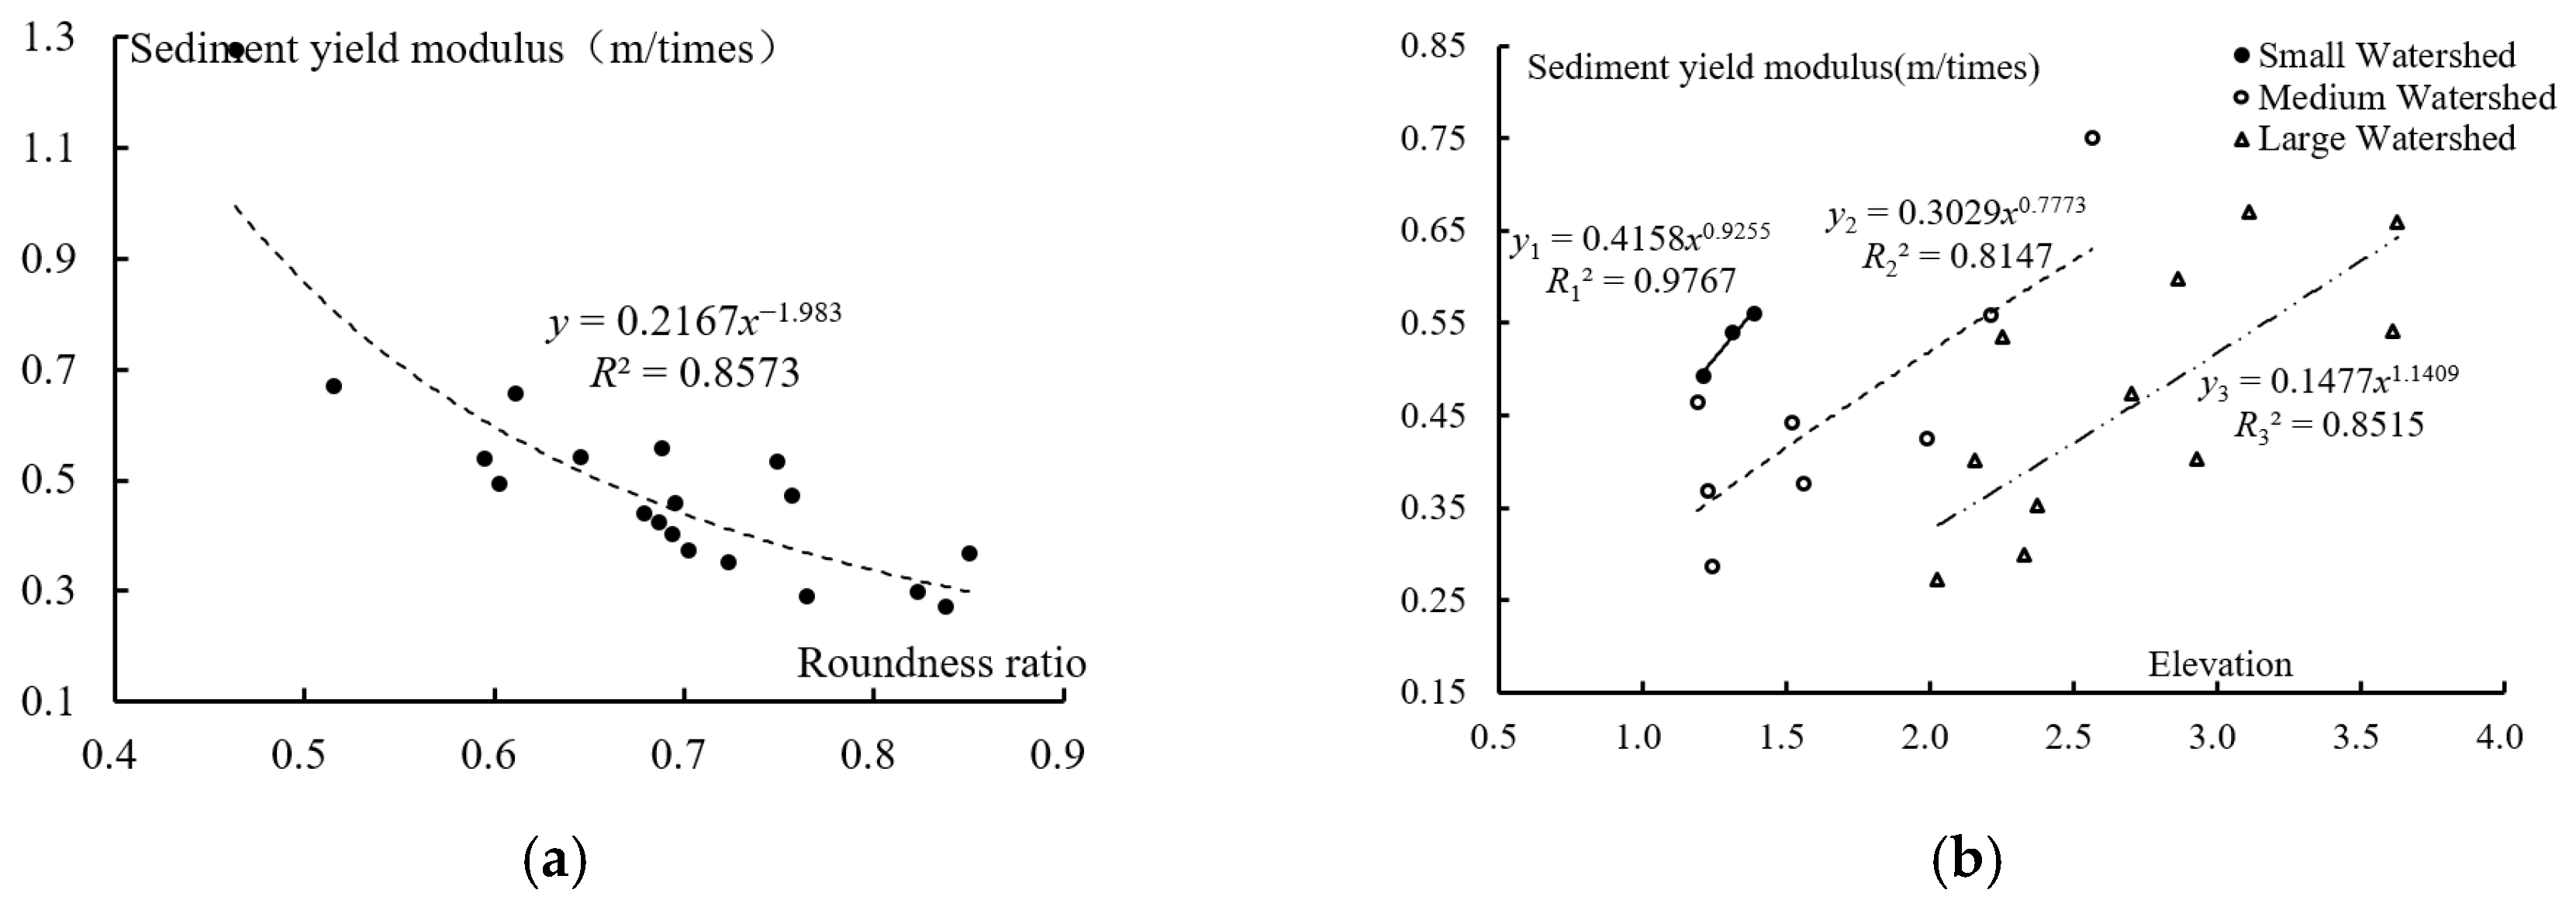
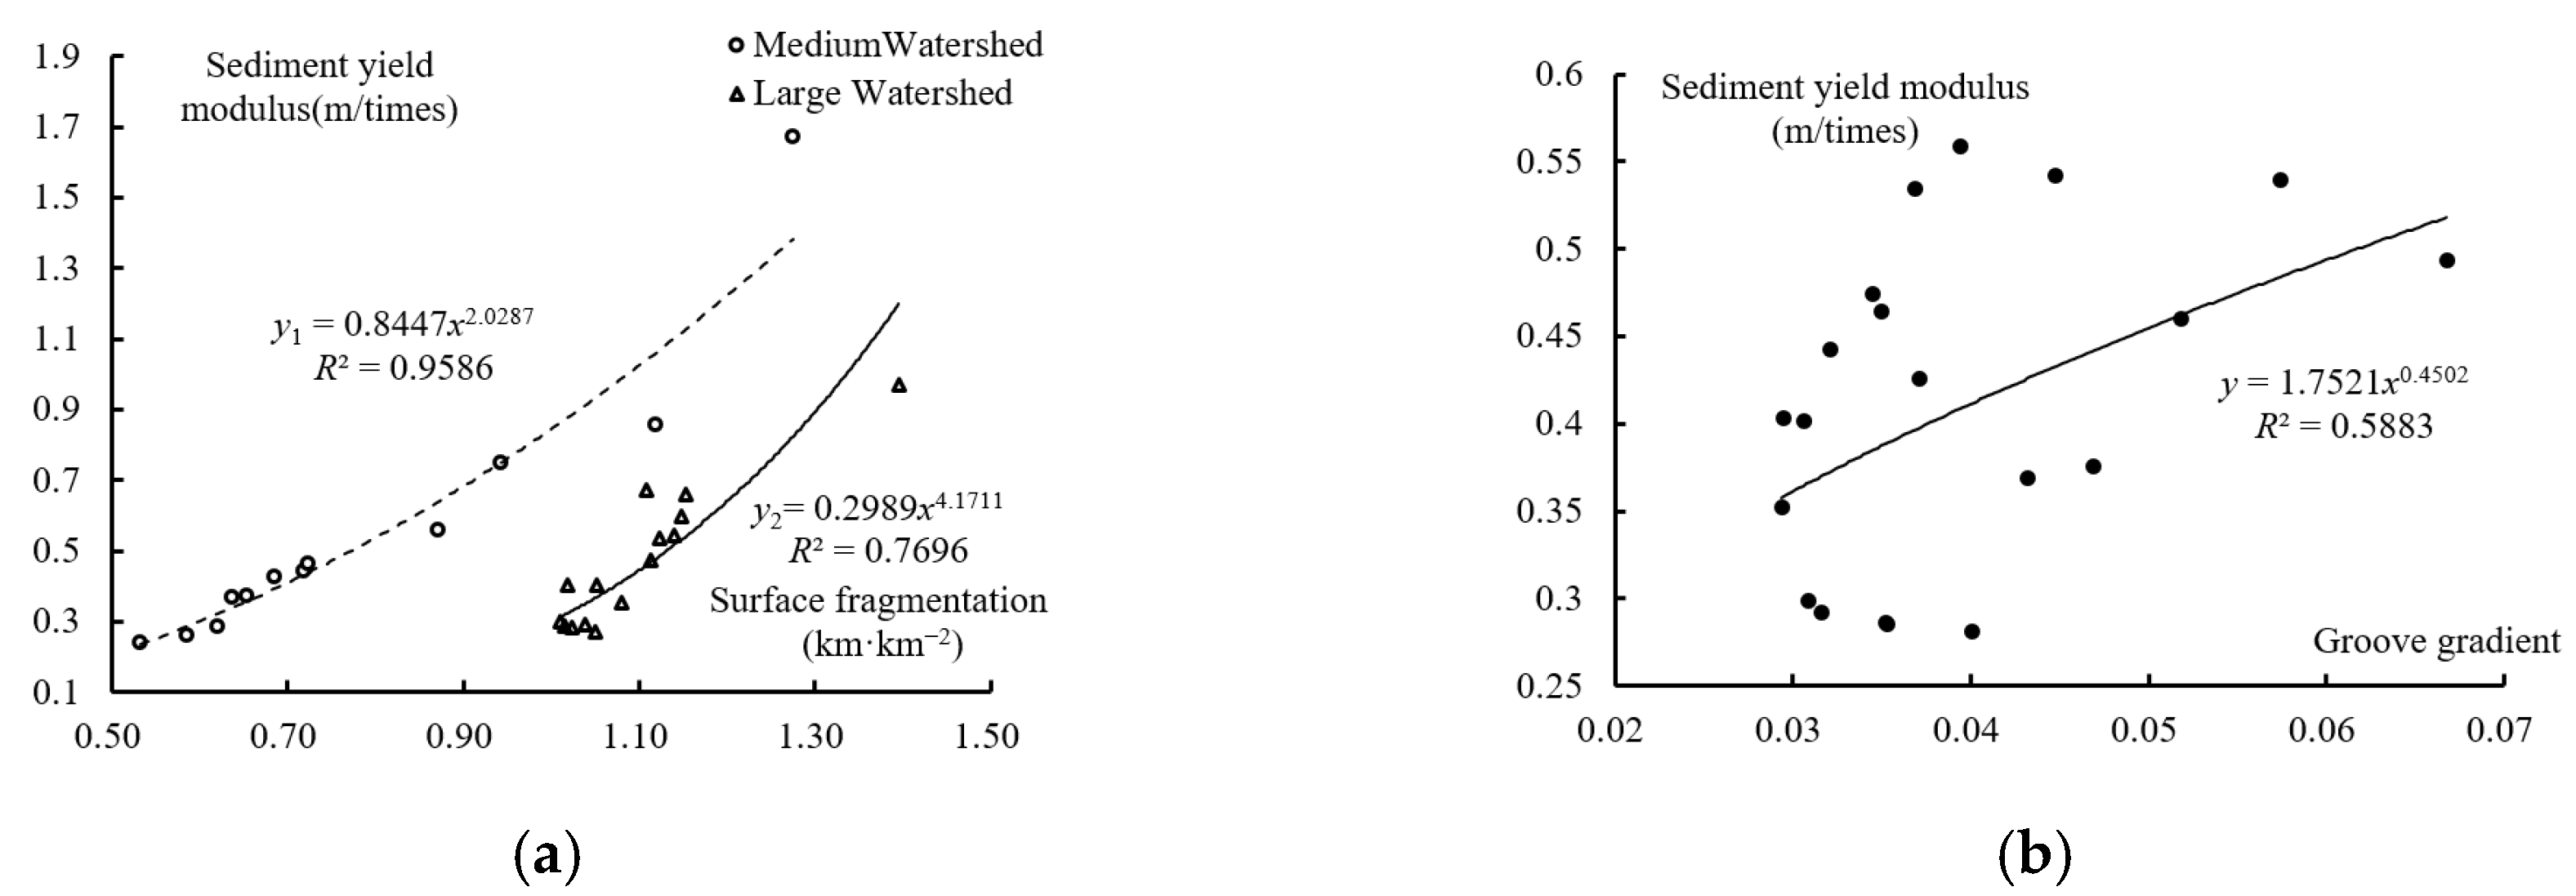
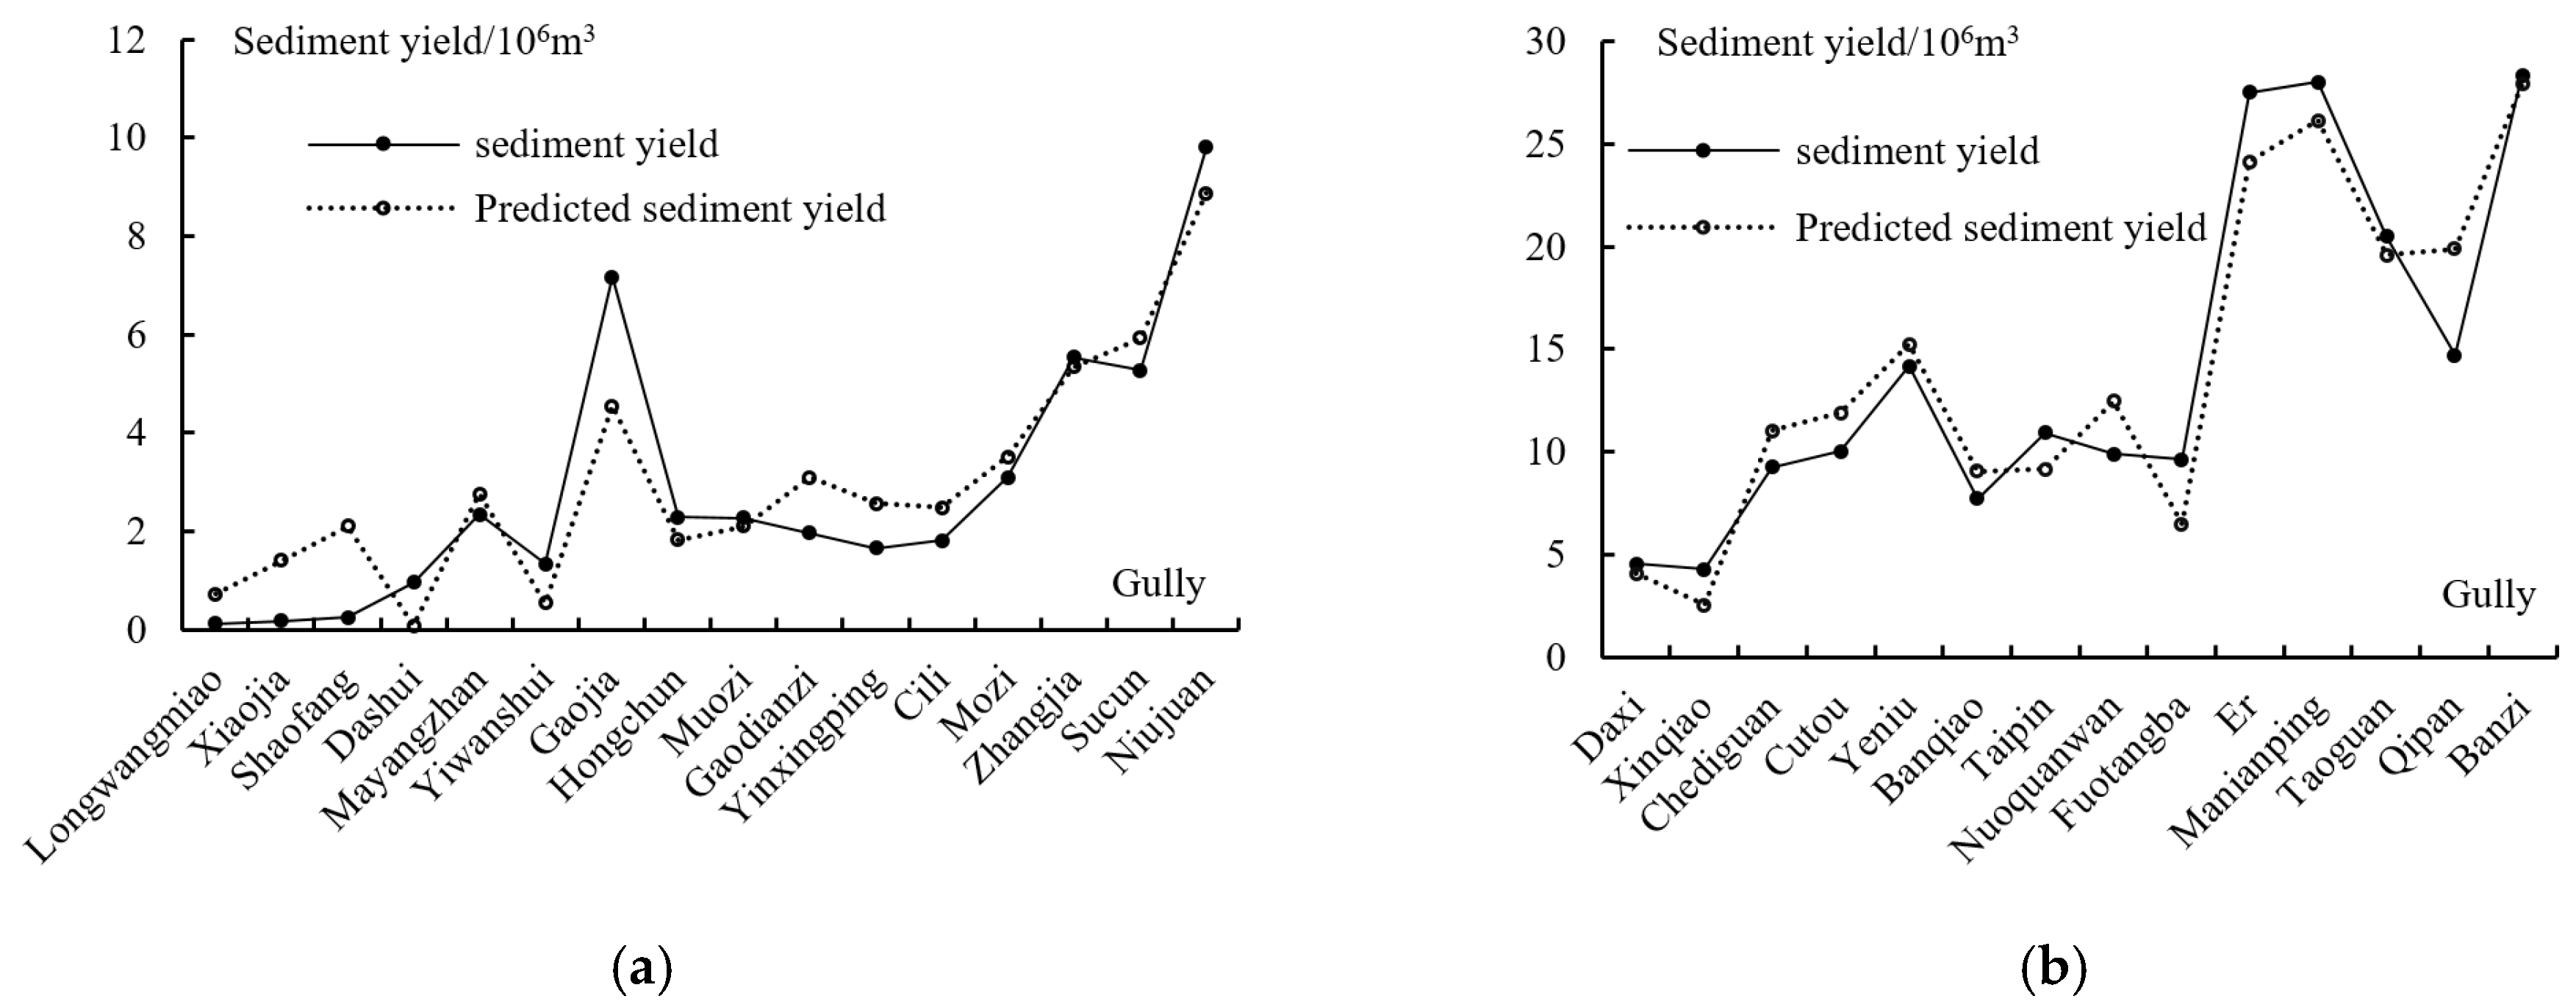
- The primary controlling elements for the sediment yield from gravity erosion at a watershed scale were five macro-geomorphological characteristics, including watershed area, watershed perimeter, elevation difference, gully bed gradient, and surface fragmentation. Our suggested prediction model has good accuracy and applicability for the sediment output from gravity erosion caused by post-shock downslope movement.
- f.
- Due to post-shock gravity erosion, both the volume of geo-material that was still present in the source area and the amount of sediment produced were steadily declining. However, the budget’s rate of decline was greater than that of the sediment production. It is anticipated that the gravity erosions in the earthquake-affected watershed will continue for 10–20 years.
Author Contributions
Funding
Data Availability Statement
Acknowledgments
Conflicts of Interest
Abbreviation
| GIS | Geographic Information System |
| D-InSAR | Differential Intereferometric Synthetic Aperture Radar |
| GESY | Gravity Erosion Sediment Yield |
| 3S | Remote Sensing, Global Position System and Geographic Information System |
| DTM | Digital Terrain Model |
| DEM | Digital Elevation Model |
| DLG | Digital Line Graphic |
| SYMS | Sediment Yield Modulus of Slopes |
| NDVI | Normalized Difference Vegetation Index |
References
- Parker, R.; Densmore, A.; Rosser, N.; De, M.; Li, Y.; Huang, R.; Whadcoat, S.; Petley, D. Mass wasting triggered by the 2008 wenchuan earthquake is greater than orogenic growth. Nat. Geosci. 2011, 4, 449–452. [Google Scholar] [CrossRef] [Green Version]
- Dadson, S.; Hovius, N.; Chen, H.; Chen, H.; Dade, W.; Lin, J.; Hsu, M.; Lin, C.; Horng, M.; Chen, T.; et al. Earthquake-triggered increase in sediment delivery from an active mountain belt. Geology 2004, 32, 733–736. [Google Scholar] [CrossRef]
- Huang, R.; Zhao, J.; Ju, N.; Li, G.; Lee, M.; Li, Y. Analysis of an anti-dip landslide triggered by the 2008 Wenchuan earthquake in China. Nat. Hazards (Dordr.) 2013, 68, 1021–1039. [Google Scholar] [CrossRef] [Green Version]
- Cui, P.; Chen, X.; Zhu, Y. The Wenchuan Earthquake (May 12, 2008), Sichuan Province, China, and resulting geohazards. Nat Hazards. 2011, 56, 19–36. [Google Scholar] [CrossRef]
- Cui, P.; Zhu, Y.; Han, Y. The 12 May Wenchuan earthquake-induced landslide lakes: Distribution and preliminary risk evaluation. Landslides 2009, 6, 209–223. [Google Scholar] [CrossRef]
- Han, Y.; Cui, P.; Zhu, Y.; Sun, F.; Zhang, Y.; Yang, C. Remote Sensing Monitoring and Assessment of Traffical Damage by Wenchuan Earthquake—A Case Study in Du-Wen Highway. J. Sichuan Univ. 2009, 41, 273–283. [Google Scholar]
- Xue, D.; He, Z.; Wang, Z.; Chen, X.; Yu, S. Remote sensing survey and image feature analysis of geo-logical hazards in Maoxian-Wenchuan section along G213. Earth Environ. 2012, 40, 261–265. [Google Scholar]
- Cui, P.; Zhuang, J.; Chen, X.; Zhang, J.; Zhou, X. Characteristics of debris flow after the earthquake in Wenchuan earthquake area and its prevention and control measures. J. Sichuan Univ. 2010, 42, 10–19. [Google Scholar]
- Wang, Y.; Qu, J.; Han, Y.; Du, L.; Wang, M.; Yang, Y.; Cao, G.; Tao, S.; Kong, Y. Impacts of linear transport infrastructure on terrestrial vertebrate species and conservation in China. Glob. Ecol. Conserv. 2022, 38, e02207. [Google Scholar] [CrossRef]
- Liu, J.; Ge, Y.; Zhang, J.; Chen, R. Characteristics and causes of “7·10”super-huge debris flows in Jian River section of Beichuan. J. Soil Water Conserv. 2014, 12, 44–50. [Google Scholar]
- Li, C.; Hu, X.; Li, G.; Ma, X. Formation Mechanism of the ‘8·13′ Catastrophic Debris Flow in Sichuan and the Principles of Controlling. Res. Soil Water Conserv. 2012, 19, 257–263. [Google Scholar]
- Han, M.; Hu, T.; Hong, M. Dynamics Character and River-Blocking Analysis of Narrow-Steep Channels Debris Flow in Wenchuan Earthquake Region—Illustrated with Case of MOZI Gully along DuWen Freeway. J. Eng. Geol. 2016, 24, 559–568. [Google Scholar]
- Basile, P.; Riccardi, G.; Zimmermann, E.; Stenta, H. Simulation of erosion-deposition processes at basin scale by a physically-based mathematical model. Int. J. Sediment Res. 2010, 25, 91–109. [Google Scholar] [CrossRef]
- Dagar, J. Ravines: Formation, Extent, Classification, Evolution and Measures of Prevention and Control; Springer: Singapore, 2018; pp. 19–67. [Google Scholar]
- Wilkinson, S.; Olley, J.; Furuichi, T.; Burton, J.; Kinsey-Henderson, A. Sediment source tracing with stratified sampling and weightings based on spatial gradients in soil erosion. J. Soils Sediments 2015, 15, 2038–2051. [Google Scholar] [CrossRef]
- Azim, F.; Shakir, A.; Habib, R.; Kanwal, A. Impact of climate change on sediment yield for Naran watershed, Pakistan. Int. J. Sediment Res. 2016, 31, 212–219. [Google Scholar] [CrossRef]
- López-Vicente, M.; Navas, A. Relating soil erosion and sediment yield to geomorphic features and erosion processes at the catchment scale in the Spanish Pre-Pyrenees. Environ. Earth Sci. 2010, 61, 143–158. [Google Scholar] [CrossRef] [Green Version]
- Wang, X.; Liu, S.; Ding, Y.; Guo, W.; Jiang, Z.; Lin, J.; Han, Y. An approach for estimating the breach probabilities of moraine-dammed lakes in the Chinese Himalayas using remote-sensing data. Nat. Hazards Earth Syst. 2012, 12, 3109–3122. [Google Scholar] [CrossRef] [Green Version]
- Da Silva, R.; Santos, C.; Dos Santos, J. Evaluation and modeling of runoff and sediment yield for different land covers under simulated rain in a semiarid region of Brazil. Int. J. Sediment Res. 2018, 33, 117–125. [Google Scholar] [CrossRef]
- Ngo, T.; Nguyen, D.; Rajendra, P. Effect of Land Use Change on Runoff and Sediment Yield in Da River Basin of Hoa Binh province, Northwest Vietnam. J. Mt. Sci. 2015, 12, 1051–1064. [Google Scholar] [CrossRef]
- Marden, M.; Rowan, D. The effect of land use on slope failure and sediment generation in the Coromandel region of New Zealand following a major storm in 1995. N. Z. J. For. Sci. 2015, 45, 10. [Google Scholar] [CrossRef] [Green Version]
- Ni, S.; Feng, S.; Wang, J.; Cai, C. Relationship between rill erosion morphology and hydraulic characteristics and sediment yield on artificial soils slope with different textures. Trans. Chin. Soc. Agric. Eng. 2018, 34, 149–156. [Google Scholar]
- Zhang, L.; Li, Z.; Wang, S. Impact of runoff regimes on sediment yield and sediment flow behavior at slope scale. Trans. Chin. Soc. Agric. Eng. 2015, 31, 124–131. [Google Scholar]
- Noori, H.; Karami, H.; Farzin, S.; Siadatmousavi, S.; Mojaradi, B.; Kisi, O. Investigation of RS and GIS techniques on MPSIAC model to estimate soil erosion. Nat. Hazards (Dordr.) 2018, 91, 221–238. [Google Scholar] [CrossRef]
- Chen, Z.; Zhang, B.; Han, Y.; Zuo, Z.; Zhang, X. Modeling Accumulated Volume of Landslides Using Remote Sensing and DTM Data. Remote Sens. 2014, 6, 1514–1537. [Google Scholar] [CrossRef] [Green Version]
- Long, S.; Tong, A.; Yuan, Y.; Li, Z.; Wu, W.; Zhu, C. New Approaches to Processing Ground-Based SAR (GBSAR) Data for Deformation Monitoring. Remote Sens. 2018, 10, 1936. [Google Scholar] [CrossRef] [Green Version]
- Saito, H.; Uchiyama, S.; Hayakawa, Y.; Obanawa, H. Landslides triggered by an earthquake and heavy rainfalls at Aso volcano, Japan, detected by UAS and SFM-MVS photogrammetry. Prog. Earth Planet. Sci. 2018, 5, 15–25. [Google Scholar] [CrossRef]
- Obanawa, H.; Hayakawa, Y. Variations in volumetric erosion rates of bedrock cliffs on a small inaccessible coastal island determined using measurements by an unmanned aerial vehicle with structure-from-motion and terrestrial laser scanning. Prog. Earth Planet. Sci. 2018, 5, 33–43. [Google Scholar] [CrossRef] [Green Version]
- Yang, Z.; Zhao, X.; Chen, M.; Zhang, J.; Yang, Y.; Chen, W.; Bai, X.; Wang, M.; Wu, Q. Characteristics, Dynamic Analyses and Hazard Assessment of Debris Flows in Niumiangou Valley of Wenchuan County. Appl. Sci. 2023, 15, 1161. [Google Scholar] [CrossRef]
- Xue, H.; Wang, G.; Li, T. Review of gravitational erosion researches in the middle reach of Yellow River. Shuikexue Jinzhan 2009, 20, 599–606. [Google Scholar]
- Zhang, G. Several Ideas Related to Soil Erosion Research. Shuikexue Jinzhan 2020, 34, 21–30. [Google Scholar]
- Guo, X.; Cui, P.; Ma, L.; Kong, Y. Triggering Rainfall Characteristics for Debris Flows along Dujiangyan—Wenchuan Highway of Sichuan. Mt. Res. Dev. 2014, 32, 739–764. [Google Scholar]
- Zhou, X.; Pei, L.; Xiang, L. Features of Distribution and Activity of Debris Flow Disasters Along Dujiangyan—Wenchuan Highway after Earthquake. Technol. Highw. Transp. 2013, 4, 5–10. [Google Scholar]
- Han, Y.; Dong, S.; Chen, Z. Assessment of Secondary Mountain Hazards along a Section of the Dujiangyan-Wenchuan Highway. J. Mt. Sci. 2014, 11, 51–65. [Google Scholar] [CrossRef]
- Han, Y.; Liu, H.; Cui, P.; Su, F.; Du, D. Hazard assessment on secondary mountain hazards triggered by the Wenchuan earthquake. J. Appl. Remote Sens. 2009, 3, 30–45. [Google Scholar]
- Han, Y.; Peng, S.; Chen, Z.; Liu, X.; Huang, P.; Dong, S. Disaster Insurance against Secondary Mountain Hazards in 32 Counties Severely Affected by the 2008 Wenchuan Earthquake. IDRiM Journal. 2013, 3, 196–218. [Google Scholar] [CrossRef] [Green Version]
- Li, D.; Xu, X.; Huao, H. Formation conditions and the movement characteristics of “8. 14” giant debris flow in Yingxiu Town, Wenchuan County, Sichuan province. Chin. J. Geol. Hazard Control. 2012, 23, 32–38. [Google Scholar]
- Pearce, A.; Watson, J. Effects of earthquake-induced landslides on sediment budget and transport over a 50-yr period. Geol. 1986, 14, 52–55. [Google Scholar] [CrossRef]
- Yang, Z.; Lan, H.; Zhang, Y.; Guo, C. Research Review on Long-term Activity of Post-earthquake Geohazard in Strong Seismic-disturbed Regions. J. Geomech. 2017, 23, 743–753. [Google Scholar]
- Xiong, K.; Zhan, Y.; Parcharidis, I.; Du, J.; Di, B. Detecting Surface Deformation and Calculating Colluvial Materials: The Case of the 2017 Jiuzhaigou Earthquake. Resour. Environ. Yangtze Basin 2019, 28, 163–169. [Google Scholar]
- Casagli, N.; Cigna, F.; Bianchini, S.; Hölbling, D.; Füreder, P.; Righini, G.; Del, C.; Friedl, B.; Schneiderbauer, S.; Iasio, C.; et al. Landslide mapping and monitoring by using radar and optical remote sensing: Examples from the EC-FP7 project SAFER. Remote Sens. Appl. Soc. Environ. 2016, 4, 92–108. [Google Scholar] [CrossRef] [Green Version]
- Fan, Y.; Yang, S.; Xu, L.; Li, S.; Feng, C.; Liang, B. Real-time monitoring instrument designed for the deformation and sliding period of colluvial landslides. Bull. Eng. Geol. Environ. 2016, 76, 829–838. [Google Scholar] [CrossRef] [Green Version]
- Fraštia, M.; Marčiš, M.; Kopecký, M.; Liščák, P.; Žilka, A. Complex Geodetic and Photogrammetric Monitoring of the Kral’ovany Rock Slide. J. Sustain. 2014, 13, 12–16. [Google Scholar] [CrossRef] [Green Version]
- Peternel, T.; Kumelj, Š.; Oštir, K.; Komac, M. Monitoring the Potoška planina landslide (NW Slovenia) using UAV photogrammetry and tachymetric measurements. Landslides 2017, 14, 395–406. [Google Scholar] [CrossRef]
- Huang, R.; Li, W. Post-earthquake landsliding and long-term impacts in the Wenchuan earthquake area, China. Eng. Geol. 2014, 182, 111–120. [Google Scholar] [CrossRef]
- Fan, X.; Scaringi, G.; Domènech, G.; Yang, F.; Guo, X.; Dai, L.; He, C.; Xu, Q.; Huang, R. Two multi-temporal datasets that track the enhanced landsliding after the 2008 Wenchuan earthquake. Earth Syst. Sci. Data 2019, 11, 35–55. [Google Scholar] [CrossRef] [Green Version]
- Lan, J.; Chen, X. Evolution characteristics of landslides triggered by 2008 Ms8.0 Wenchuan earthquake in Yingxiu area. Seismol. Geol. 2020, 421, 125–146. [Google Scholar]
- Li, N.; Tang, C.; Gong, L.; Yang, C.; Chen, M.; Gan, W. An experimental study of starting characteristics of steep-channel debris flow.a case study of the Futang gully in the Wenchuan County. Acta Geol. Sin. 2020, 94, 634–647. [Google Scholar]
- Chen, X.; Du, F.; Du, Y.; Jiang, L. Research on the Major Gravity Geological Disasters Distribution at Upper Minjiang River Valley. J. Railw. Eng. Soc. 2015, 32, 20–24. [Google Scholar]
- Kadkhodapour, J.; Pourkamali, A.; Taherkhani, B. Mechanism of Foreign Object Damage and Investigating Effect of Particle Parameters on Erosion Rate of a Rough Surface Using Experimental and Numerical Methods. J. Fail. Anal. Prev. 2015, 15, 272–281. [Google Scholar] [CrossRef]
- De, F.; Bezerra, U.; Da, S. Runoff-erosion modeling at micro-watershed scale: A comparison of self-organizing maps structures. Geoenviron. Disasters 2015, 2, 14. [Google Scholar]
- Sassa, K.; Dang, K.; Yanagisawa, H.; He, B. A new landslide-induced tsunami simulation model and its application to the 1792 Unzen-Mayuyama landslide-and-tsunami disaster. Landslides 2016, 13, 1405–1419. [Google Scholar] [CrossRef]
- Cui, S.; Wang, G.; Pei, X.; Huang, R.; Kamai, T. On the initiation and movement mechanisms of a catastrophic landslide triggered by the 2008 Wenchuan (Ms 8.0) earthquake in the epicenter area. Landslides 2017, 14, 805–819. [Google Scholar] [CrossRef]
- Ren, L.; Huang, J.; Huang, Q.; Lei, G.; Cui, W.; Yuan, Y.; Liang, Y. A fractal and entropy-based model for selecting the optimum spatial scale of soil erosion. Arab. J. Geosci. 2018, 11, 161–167. [Google Scholar] [CrossRef]



| Image Name | Acquiring Date (d-m-y) | Data Type | Resolution/m |
|---|---|---|---|
| ALPSRP054640610 | 2 February 2007 | FBS | 10 × 10 |
| ALPSRP101610610 | 21 December 2007 | ||
| ALPSRP108320610 | 5 February 2008 | ||
| ALPSRP128450610 | 22 June 2008 | ||
| ALPSRP162000610 | 7 February 2009 | ||
| ALPSRP202260610 | 10 November 2009 | ||
| ALPSRP215680610 | 10 February 2010 | ||
| ALPSRP262650610 | 29 December 2010 | ||
| S1A_IW_SLC__1SSV_20150314T230352_20150314T230418_005034_006511_0B1A | 14 March 2015 | IW | 5 × 20 |
| S1A_IW_GRDH_1SSV_20151016T230413_20151016T230438_008184_00B80E_6266 | 16 October 2015 | ||
| S1A_IW_GRDH_1SSV_20160120T230405_20160120T230430_009584_00DF1D_B83D | 20 January 2016 | ||
| S1B_IW_GRDH_1SSV_20161227T230331_20161227T230356_003588_006251_E403 | 27 December 2016 |
| Relative (m) | Very Low (0–20) | Low (20–50) | Medium (50–100) | High (100–200) | Extremely High (>200) | |
|---|---|---|---|---|---|---|
| Gradient (°) | ||||||
| Flat (0–8) | Terrace/Flat | |||||
| Gentle (8–15) | Gentle side slope | Gentle, low slope | Gentle, middle Slope | Gentle, high slope | Gentle, extremely high slopes | |
| Medium (15–25) | Gradual side slope | Gradual low slope | Gradual mid-slope | Gradual, high slope | Gradual, extremely high slope | |
| Steep (25–50) | Steep side slopes | Steep, low slope | Steep, mid-slope | Steep; high slope | Steep, extremely high slope | |
| Extreme steep (50–70) | Extremely steep side slope | Extremely steep, low slope | Extremely steep, middle slope | Extremely steep, high slope | Extremely steep, extreme slopes | |
| Vertical steep (70–90) | Vertical steep side slope | Vertical steep, low slope | Vertical steep, mid-slope | Vertical steep, high slope | Cliff | |
| SN. | Debris Flow Gully | 2007 | 2008 | 2009 | 2010 | 2015 | 2016 | Macro-Geomorphic Factors | ||||||||||||
|---|---|---|---|---|---|---|---|---|---|---|---|---|---|---|---|---|---|---|---|---|
| Sediment Yield (106 m3) | Sediment Production Modulus (m/Time) | Sediment Yield (106 m3) | Sediment Production Modulus (m/Time) | Sediment Yield (106 m3) | Sediment Production Modulus (m/Time) | Sediment Yield (106 m3) | Sediment Production Modulus (m/Time) | Sediment Yield (106 m3) | Sediment Production Modulus (m/Time) | Sediment Yield (106 m3) | Sediment Production Modulus (m/Time) | I | (km·km−2) | |||||||
| 1 | Luoquanwan | 0.0045 | 0.0002 | 9.9171 | 0.3526 | 3.1703 | 0.1127 | 1.38 | 0.05 | 0.9353 | 0.0332 | 0.3164 | 0.0112 | 28.13 | 22.1 | 0.72 | 2372.86 | 2250.79 | 0.03 | 1.08 |
| 2 | Yinxingping | 0.014 | 0.002 | 1.6615 | 0.2397 | 1.0219 | 0.1474 | 0.35 | 0.05 | 0.1116 | 0.0161 | 0.0406 | 0.0059 | 6.93 | 10.81 | 0.75 | 1983.9 | 2016.42 | 0.03 | 0.53 |
| 3 | Fotangba | 0.0169 | 0.0005 | 9.6362 | 0.2993 | 2.7999 | 0.087 | 1.73 | 0.06 | 1.3627 | 0.0423 | 0.9264 | 0.0288 | 32.19 | 22.18 | 0.82 | 2328.51 | 2357.38 | 0.03 | 1.01 |
| 4 | Muozi | 0.0006 | 0.0001 | 2.2771 | 0.4427 | 0.4634 | 0.0901 | 0.27 | 0.05 | 0.0859 | 0.0167 | 0.0103 | 0.002 | 5.14 | 9.76 | 0.68 | 1519.76 | 1723.93 | 0.03 | 0.72 |
| 5 | Dashui | 0 | 0 | 0.9657 | 0.3757 | 0.2951 | 0.1148 | 0.12 | 0.05 | 0.0504 | 0.0196 | 0.0064 | 0.0025 | 2.57 | 6.78 | 0.7 | 1560.34 | 2057.39 | 0.05 | 0.65 |
| 6 | Gaodianzi | 0.0018 | 0.0003 | 1.9723 | 0.2865 | 0.2115 | 0.0307 | 0.12 | 0.02 | 0.2356 | 0.0342 | 0.0189 | 0.0027 | 6.88 | 11.33 | 0.67 | 2244.76 | 2412.3 | 0.04 | 0.62 |
| 7 | Taoguan | 0.0863 | 0.0017 | 20.5043 | 0.4034 | 3.3878 | 0.0667 | 1.99 | 0.04 | 1.6542 | 0.0325 | 1.1493 | 0.0226 | 50.83 | 30.36 | 0.69 | 2932.14 | 2501.53 | 0.03 | 1.05 |
| 8 | Banqiao | 0.2972 | 0.011 | 7.7322 | 0.2854 | 1.5591 | 0.0575 | 0.69 | 0.03 | 1.1204 | 0.0413 | 0.0462 | 0.0017 | 27.1 | 23.03 | 0.64 | 2874.57 | 2894.91 | 0.04 | 1.02 |
| 9 | Daxi | 0.0846 | 0.0054 | 4.5705 | 0.2922 | 0.8168 | 0.0522 | 0.45 | 0.03 | 0.5447 | 0.0348 | 0.0546 | 0.0035 | 15.64 | 16.04 | 0.76 | 2772.47 | 2796.61 | 0.03 | 1.04 |
| 10 | Cili | 0.0727 | 0.0105 | 1.8136 | 0.2614 | 0.4726 | 0.0681 | 0.26 | 0.04 | 0.2814 | 0.0406 | 0.1033 | 0.0149 | 6.94 | 11.9 | 0.62 | 1810.44 | 2147.41 | 0.06 | 0.59 |
| 11 | Qipan | 0.3728 | 0.0071 | 14.7269 | 0.2819 | 5.827 | 0.1115 | 2.75 | 0.05 | 2.2107 | 0.0423 | 0.4712 | 0.009 | 52.24 | 33.26 | 0.59 | 3029.69 | 2878.6 | 0.04 | 1.02 |
| 12 | Cutou | 0.0021 | 0.0001 | 10.0538 | 0.4744 | 2.9899 | 0.1411 | 1.82 | 0.09 | 1.0084 | 0.0476 | 0.11 | 0.0052 | 21.19 | 18.77 | 0.76 | 2702.21 | 2521.32 | 0.03 | 1.11 |
| 13 | Sucun | 0 | 0 | 5.2727 | 0.5588 | 1.1861 | 0.1257 | 0.36 | 0.04 | 0.377 | 0.0399 | 0.0247 | 0.0026 | 9.44 | 13.13 | 0.69 | 2211.35 | 2165.96 | 0.04 | 0.87 |
| 14 | Manianping | 0.009 | 0.0002 | 28.0181 | 0.6592 | 7.6888 | 0.1809 | 3.87 | 0.09 | 1.9087 | 0.0449 | 0.2335 | 0.0055 | 42.5 | 29.57 | 0.61 | 3627.41 | 2965.94 | 0.04 | 1.15 |
| 15 | Banzi | 0.0382 | 0.0007 | 28.3444 | 0.5422 | 7.3768 | 0.1411 | 2.81 | 0.06 | 2.3197 | 0.0444 | 0.5263 | 0.0101 | 52.28 | 31.9 | 0.65 | 3612.64 | 3090.2 | 0.05 | 1.14 |
| 16 | Xinqiao | 0.0044 | 0.0003 | 4.3108 | 0.272 | 1.4012 | 0.0884 | 0.7 | 0.05 | 0.7694 | 0.0485 | 0.2763 | 0.0174 | 15.85 | 15.42 | 0.84 | 2026.88 | 2489.44 | 0.06 | 1.05 |
| 17 | Chediguan | 0 | 0 | 9.2659 | 0.5349 | 1.4078 | 0.0813 | 0.94 | 0.06 | 1.1989 | 0.0692 | 0.1916 | 0.0111 | 17.32 | 17.05 | 0.75 | 2252.66 | 2271.29 | 0.04 | 1.12 |
| 18 | Niujuan | 0.002 | 0.0002 | 9.8063 | 0.9684 | 2.4652 | 0.2435 | 1.25 | 0.13 | 0.4847 | 0.0479 | 0.0944 | 0.0093 | 10.13 | 14.86 | 0.58 | 1821.78 | 1831.86 | 0.03 | 1.4 |
| 19 | Hongchun | 0.0111 | 0.0023 | 2.283 | 0.4649 | 0.6608 | 0.1346 | 0.49 | 0.1 | 0.118 | 0.024 | 0.0071 | 0.0015 | 4.91 | 8.47 | 0.86 | 1193.44 | 1462.16 | 0.04 | 0.72 |
| 20 | Shaofang | 0 | 0 | 0.2594 | 0.5604 | 0.1648 | 0.2925 | 0.04 | 0.07 | 0.0191 | 0.0341 | 0.0003 | 0.0005 | 0.56 | 3.19 | 0.7 | 785.77 | 1308.21 | 0.05 | 1.39 |
| 21 | Xiaojia | 0 | 0 | 0.1898 | 0.5399 | 0.0208 | 0.0592 | 0.02 | 0.04 | 0.0075 | 0.0214 | 0.0014 | 0.004 | 0.35 | 2.72 | 0.6 | 706.74 | 1194.55 | 0.06 | 1.31 |
| 22 | Longwangmiao | 0 | 0 | 0.128 | 0.4937 | 0.0077 | 0.0297 | 0.01 | 0.02 | 0.0059 | 0.0228 | 0.0006 | 0.0023 | 0.26 | 2.33 | 0.6 | 608.76 | 1103.81 | 0.07 | 1.21 |
| 23 | Mozi | 0 | 0 | 3.092 | 0.4258 | 0.3519 | 0.0485 | 0.08 | 0.01 | 0.1723 | 0.0237 | 0.0321 | 0.0044 | 7.26 | 11.53 | 0.69 | 1993.16 | 2276.48 | 0.04 | 0.69 |
| 24 | Er | 0.0202 | 0.0005 | 27.5118 | 0.6706 | 8.4869 | 0.2069 | 4.99 | 0.12 | 1.5806 | 0.0385 | 0.8007 | 0.0195 | 41.03 | 31.63 | 0.52 | 3109.45 | 2739.45 | 0.03 | 1.11 |
| 25 | Taiping | 0.0061 | 0.0002 | 10.9445 | 0.4019 | 3.5221 | 0.1293 | 2.95 | 0.11 | 0.6201 | 0.0228 | 0.1199 | 0.0044 | 27.23 | 23.28 | 0.63 | 2156.78 | 1989.09 | 0.03 | 1.02 |
| 26 | Yeniu | 0.0195 | 0.0008 | 14.1861 | 0.5987 | 6.334 | 0.2673 | 2.9 | 0.12 | 1.009 | 0.0426 | 0.1811 | 0.0076 | 23.7 | 19.56 | 0.78 | 2866.03 | 2545.82 | 0.03 | 1.15 |
| 27 | Yiwanshui | 0 | 0 | 1.3363 | 0.3691 | 0.1488 | 0.0411 | 0.09 | 0.03 | 0.0059 | 0.0016 | 0.059 | 0.0163 | 3.62 | 7.32 | 0.85 | 1229.8 | 1601.95 | 0.04 | 0.64 |
| 28 | Zhangjia | 0.0008 | 0.0001 | 5.543 | 0.7499 | 2.33 | 0.3152 | 0.95 | 0.13 | 0.1423 | 0.0193 | 0.0451 | 0.0061 | 7.39 | 11.56 | 0.7 | 2565.99 | 2390.27 | 0.02 | 0.94 |
| 29 | Gaojia | 0.0013 | 0.0003 | 7.1662 | 1.6745 | 1.3592 | 0.3176 | 0.53 | 0.12 | 0.1692 | 0.0395 | 0.0685 | 0.016 | 4.28 | 8.5 | 0.75 | 1752 | 1954.09 | 0.04 | 1.28 |
| 30 | Shuzhuangtai | 0 | 0 | 0.3939 | 1.2788 | 0.2077 | 0.6745 | 0.06 | 0.17 | 0.0056 | 0.0182 | 0.0003 | 0.0011 | 0.31 | 2.89 | 0.46 | 713.04 | 1232.65 | 0.08 | 0.79 |
| 31 | Mayangzhan | 0 | 0 | 2.3478 | 0.8604 | 0.5605 | 0.2054 | 0.32 | 0.12 | 0.0795 | 0.0291 | 0.0374 | 0.0137 | 2.73 | 6.96 | 0.71 | 1647.49 | 1891.74 | 0.03 | 1.12 |
| Gully | Erosion Episode | Calculated Volume/m3 | Measured Volume/m3 | Absolute Error/m3 | Relative Error/% | Source |
|---|---|---|---|---|---|---|
| Linhuaxin | 12 May 2008 | 62.26 | 64.40 | 2.14 | 3.32 | Han Y.S. et al., 2018 |
| Linhuaxin | 22 August 2009 | 37.77 | 33.60 | 4.17 | 12.42 | Han Y.S. et al., 2018 |
| Linhuaxin | 14 August 2010 | 33.16 | 30.20 | 2.96 | 9.81 | Han Y.S. et al., 2018 |
| Hongchun | 14 August 2010 | 81.77 | 80.50 | 1.27 | 1.58 | Li, D.H. et al., 2012 |
| Mozi | 13 August 2010 | 52.56 | 55.00 | 2.44 | 4.44 | Han M. et al., 2016 |
| Niujuan | 14 August 2010 | 116.40 | 102 | 14.40 | 14.12 | Han Y.S. et al., 2012 |
| Time | River Area (km2) | Erosion Area (km2) | Deposition Area (km2) | Sediment Input (106 m3) | Sediment Output (106 m3) | Accumulation Sediment (106 m3) |
|---|---|---|---|---|---|---|
| 2008 | 8.99 | 2.98 | 6.01 | 11.2962 | 16.6518 | 5.3556 |
| 2009 | 8.99 | 3.77 | 5.22 | 6.8760 | 8.6201 | 1.7441 |
| 2010 | 8.99 | 4.48 | 4.51 | 8.9056 | 10.3137 | 1.4080 |
| 2015 | 8.99 | 5.52 | 3.47 | 0.2673 | 0.0004 | 0.2669 |
| 2016 | 8.99 | 3.89 | 5.10 | 0.0457 | 0.0240 | 0.0217 |
| Slope Range (°) | Area (106 m2) | Total Area Ratio of Geomorphic Units (%) | Sediment Yield (106 m3) | Total Sediment Yield Ratio of Landform Unit (%) | Sediment Yield Modulus (m/Time) |
|---|---|---|---|---|---|
| 0–8 | 3.32 | 0.73 | 2.03 | 0.82% | 0.61 |
| 8–15 | 10.72 | 2.35 | 5.98 | 2.42% | 0.56 |
| 15–25 | 42.76 | 9.38 | 21.78 | 8.81% | 0.51 |
| 25–50 | 140.11 | 30.75 | 66.33 | 26.84% | 0.47 |
| 50–70 | 239.64 | 52.60 | 134.94 | 54.60% | 0.56 |
| 70–90 | 19.08 | 4.19 | 16.06 | 6.50% | 0.84 |
| Geomorphic Factor | |||||||
|---|---|---|---|---|---|---|---|
| Y | 0.892 | 0.894 | 0.732 | 0.818 | 0.299 | 0.521 | 0.765 |
| Principal Component Parameters | Eigenvalues | Variance Contribution Rate | Variable | ||||||
|---|---|---|---|---|---|---|---|---|---|
| The first principal component | 4.457 | 63.670 | 0.917 | 0.242 | 0.392 | 0.960 | 0.116 | −0.896 | −0.426 |
| The second principal component | 1.101 | 15.725 | −0.237 | −0.212 | 0.904 | −0.147 | −0.146 | −0.338 | −0.159 |
| The third principal component | 0.953 | 14.038 | 0.083 | −0.059 | 0.012 | −0.014 | −0.126 | −0.428 | 0.879 |
| Model | Sum of Square | Freedom | Mean Square | F | Significance |
|---|---|---|---|---|---|
| regression | 95.687 | 5 | 19.137 | 9.781 | 0.001 |
| residual error | 21.522 | 11 | 1.957 | 9.781 | |
| total | 117.209 | 16 |
| Year (a) | 2007 | 2008 | 2009 | 2010 | 2015 | 2016 |
|---|---|---|---|---|---|---|
| Geo-material source storage (106 m3) | 1.071 | 317.66 | 165.74 | 164.41 | 20.64 | 8.04 |
| Sediment yield (106 m3) | 1.066 | 246.23 | 68.71 | 35.29 | 20.59 | 5.95 |
Disclaimer/Publisher’s Note: The statements, opinions and data contained in all publications are solely those of the individual author(s) and contributor(s) and not of MDPI and/or the editor(s). MDPI and/or the editor(s) disclaim responsibility for any injury to people or property resulting from any ideas, methods, instructions or products referred to in the content. |
© 2023 by the authors. Licensee MDPI, Basel, Switzerland. This article is an open access article distributed under the terms and conditions of the Creative Commons Attribution (CC BY) license (https://creativecommons.org/licenses/by/4.0/).
Share and Cite
Han, Y.; Wang, Z.; Chang, Y.; Zhang, D.; Li, L.; Qiu, Z.; Xia, Y. Post-Shock Gravitational Erosion and Sediment Yield: A Case Study of Landscape Transformation along the Wenchuan–Yingxiu Section of the Minjiang River, Sichuan, China. Remote Sens. 2023, 15, 3506. https://doi.org/10.3390/rs15143506
Han Y, Wang Z, Chang Y, Zhang D, Li L, Qiu Z, Xia Y. Post-Shock Gravitational Erosion and Sediment Yield: A Case Study of Landscape Transformation along the Wenchuan–Yingxiu Section of the Minjiang River, Sichuan, China. Remote Sensing. 2023; 15(14):3506. https://doi.org/10.3390/rs15143506
Chicago/Turabian StyleHan, Yongshun, Zhenlin Wang, Yulong Chang, Dongshui Zhang, Lelin Li, Zhuoting Qiu, and Yangdelong Xia. 2023. "Post-Shock Gravitational Erosion and Sediment Yield: A Case Study of Landscape Transformation along the Wenchuan–Yingxiu Section of the Minjiang River, Sichuan, China" Remote Sensing 15, no. 14: 3506. https://doi.org/10.3390/rs15143506
APA StyleHan, Y., Wang, Z., Chang, Y., Zhang, D., Li, L., Qiu, Z., & Xia, Y. (2023). Post-Shock Gravitational Erosion and Sediment Yield: A Case Study of Landscape Transformation along the Wenchuan–Yingxiu Section of the Minjiang River, Sichuan, China. Remote Sensing, 15(14), 3506. https://doi.org/10.3390/rs15143506


