Article

Combined PS-InSAR Technology and High-Resolution Optical Remote Sensing for Identifying Illegal Underground Mining in the Suburb of Yangquan City, Shanxi Province, China

1
School of Surveying and Geoinformation Engineering, East China University of Technology (ECUT), Nanchang 330013, China
2
School of Earth Sciences, East China University of Technology (ECUT), Nanchang 330013, China
3
NASG Key Laboratory of Land Environment and Disaster Monitoring, China University of Mining and Technology (CUMT), Xuzhou 221116, China
4
Jiangxi Institute of Land Space Survey and Planning, Nanchang 330025, China
*
Author to whom correspondence should be addressed.
Remote Sens. 2023, 15(14), 3565; https://doi.org/10.3390/rs15143565
Submission received: 6 June 2023 / Revised: 2 July 2023 / Accepted: 4 July 2023 / Published: 16 July 2023

Abstract

:
Illegal mining is one of the biggest problems in many coal mines. With the rapid development of the economy, driven by huge economic benefits, some outlaws illegally exploit mineral resources without a mining license, which is destructive and a potential safety hazard. In order to avoid inspection by law enforcement officials, some outlaws, regardless of the cost or risk, privately and surreptitiously excavate coal mines in self-built houses. The coal resources they excavate are shallow coal resources. Because surface buildings can maintain strong and stable radar scattering characteristics over a long time series, in this study, we combined PS-InSAR technology and high-resolution optical remote sensing to extract the subsidence information of surface buildings corresponding to PS point sets and analyzed their spatiotemporal characteristics. Finally, we developed a fast and accurate method for detecting suspected illegal mining sites from building subsidence information over a larger area. We also carried out a case study using Shandi Village, a suburb of Yangquan City, Shanxi Province, China, as our research object. QuickBird-2, WorldView-2 data, and 20 PALSAR scenes were selected for the experimental research, and two illegal mining sites were detected from 29 December 2006 to 9 January 2011. By comparing our results with previous investigation data, it was found that the accuracy rate reached 40% in local areas, and the detection rate reached 66.67%. In addition, the mining periods were basically consistent. This research shows that our method is feasible and has certain engineering applicability and practical value.

1. Introduction

Mineral resources are state-owned. According to the needs of strategic and economic development, relevant units or individuals can acquire mining licenses to carry out mining activities in a rational and orderly way. However, driven by economic interests, many illegal miners exploit mineral resources without obtaining their appropriate licenses, which not only damages the ecological environment but also causes natural disasters such as surface subsidence, and has triggered a series of serious mine accidents [1]. In order to ban illegal mining, authorities have enacted a variety of regulatory measures. In spite of this, there are still illegal mining activities because it is extremely difficult to identify illegal underground mining. Nowadays, these illegal mining activities are seriously affecting normal mining and increasing the potential for accidents.
In recent years, with the rapid development of remote-sensing technology and the continuous improvement of image resolution, scholars have carried out research on the monitoring and management of illegal mining combined with remote-sensing technology. In 2013, Zhou et al. performed the dynamic monitoring of mining in the Shenfu Coal Mine area in Shaanxi Province by combining RS and GIS technology [2]. In 2016, Jia used high-resolution IKONOS, Gaofen-1, and UAV remote-sensing image data to identify illegal activities in important mining areas in Anhui Province [3]. In 2019, Liu et al. used high-resolution remote-sensing images from 2011 to 2015 to monitor cross-border mining in an open-pit mine in Hunan Province [4]. The above research mainly involved interpreting optical remote-sensing images with different resolutions. Then, the characteristics of auxiliary facilities, such as roads and buildings, could be used and interpreted to determine whether illegal mining existed or not. Obviously, remote-sensing images should be interpreted professionally. In the case of data elimination or interference, this method does not work.
In order to detect illegal mining activities in a timely and effective manner, researchers have collected underground data using a microseismic monitoring technique and information technology. In 2014, based on the principle of cross-border mining positioning technology, Yang analyzed the characteristics of blasting signals in cross-border mining and general microseismic signals and studied the method of identifying cross-border mining blasting [5]. In 2015, Xu used the precise location of microseismic sources to carry out an experimental study on locating and tracking underground working faces. The results proved that this method could effectively monitor illegal and cross-border mining [6]. The above research mainly used microseismic monitoring techniques and spatiotemporal positioning methods to realize the real-time monitoring of illegal mining. However, the monitored areas were limited, and the location accuracy was insufficient. In addition, geophysical, geochemical, and drilling prospecting techniques have also been applied to detect underground mining areas; however, they are time-consuming and laborious, with a limited monitoring scope [7,8,9]. Therefore, it is significant to use the method proposed in this paper for anti-interference and the fast monitoring of illegal underground mining.
When underground resources are exploited to a certain extent, surface deformation can be observed [10]. The information on surface deformation is useful in revealing mining areas and identifying illegal mining by comparing it against the mining license. Hu et al. proposed a D-InSAR-based underground mining monitoring system according to the surface deformation characteristics of mining subsidence and successfully identified illegal mining [11,12]. In another study, a combined D-InSAR–GIS technology based on the characteristics of the surface mining subsidence extracted by D-InSAR differential interferograms was developed to dynamically monitor underground illegal mining, which achieved good results [13]. However, when there was little exploitation and no obvious subsidence characteristics on the ground, the above two methods were unable to extract surface deformation characteristics from differential interferograms, making it impossible to accurately identify unlicensed mining. Investigations have shown that some culprits have even conducted mining activities in private houses regardless of the cost or risk. They can only exploit shallow coal resources, and houses on the ground can maintain strong and stable radar scattering characteristics over a very long time. Therefore, using the combination of PS-InSAR technology and high-resolution optical remote sensing, in this paper, we extracted the information of such subsidence, analyzed the spatiotemporal development characteristics, and developed an algorithm for identifying suspected illegal mining sites based on the subsidence information of surface buildings in mining areas. This research aimed to provide technical support for the early identification, key monitoring, and effective prevention and control of illegal underground mining.

2. Study Area and Dataset
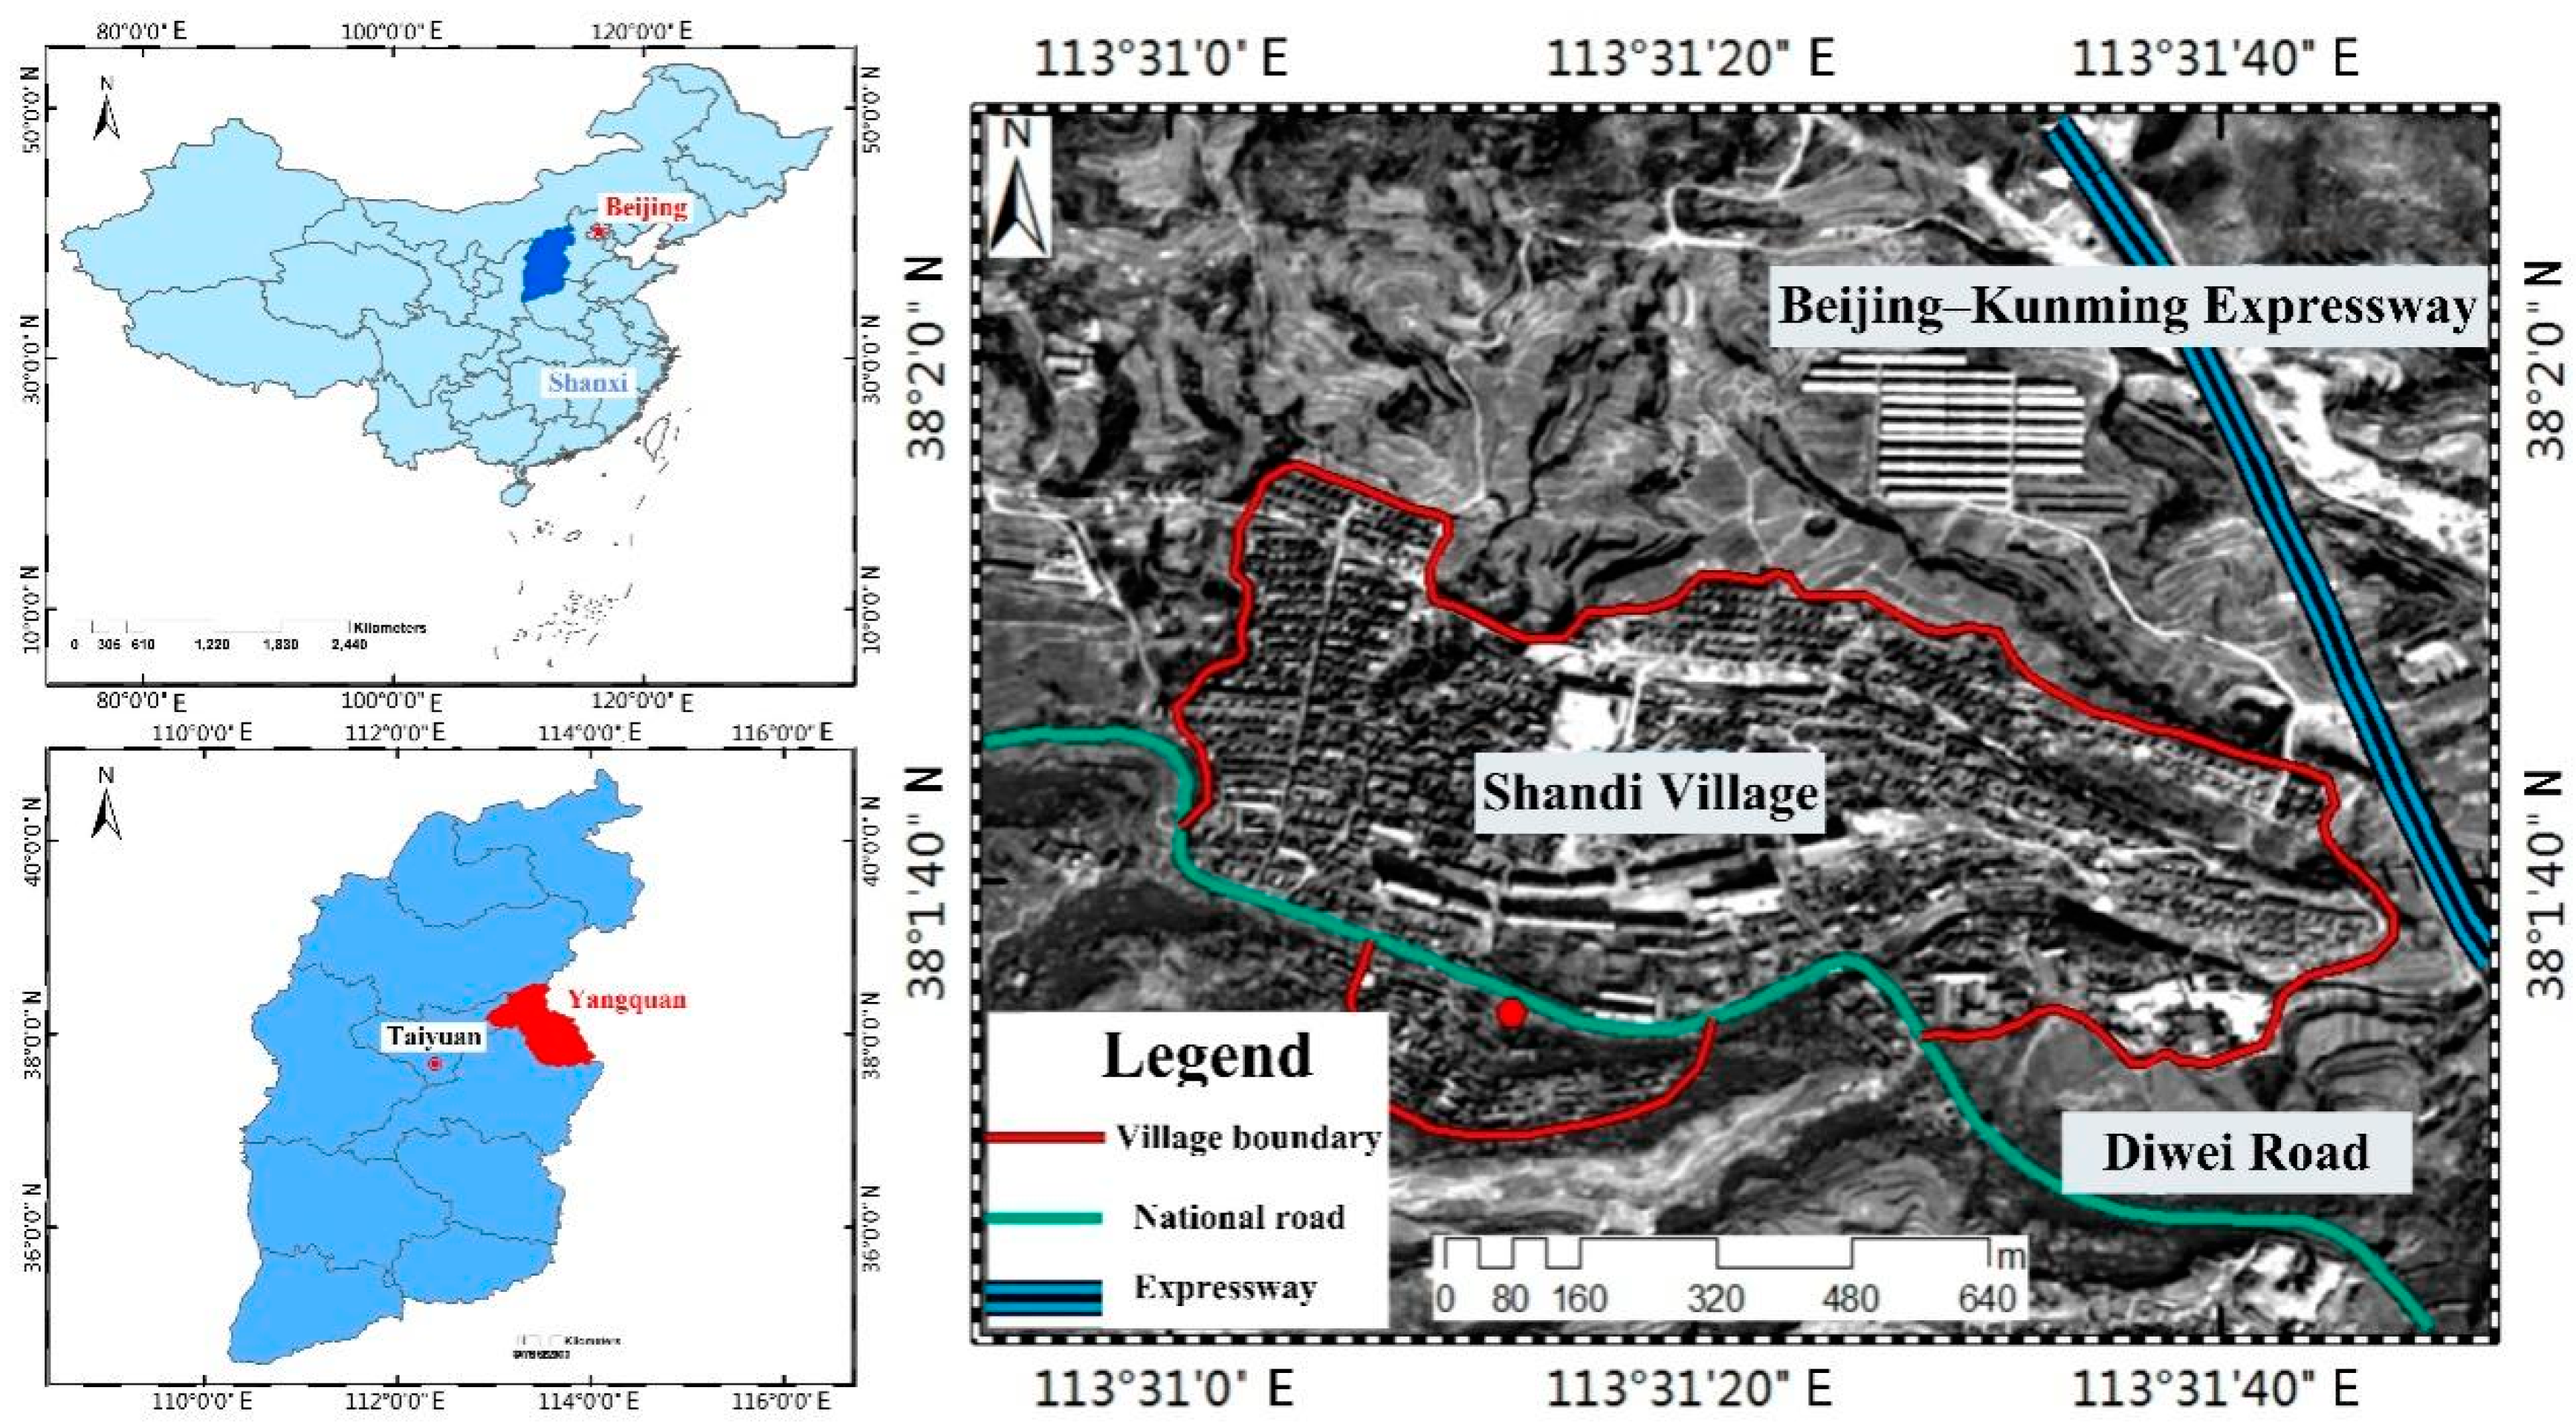
2.1. Study Area

As one of China’s coal production bases, Shanxi Province is rich in mineral resources and is characterized by wide distribution and thick coal seams. According to statistics, the accumulated coal resources in Shanxi Province account for about one-third of the national total, and coal mining accounts for about 39.6% of Shanxi’s total area [14]. Yangquan City, located in the northeast of the Qinshui coalfield in Shanxi Province, is the largest anthracite production base in China [15,16,17]. Illegal mining is rampant in this area because coal resources, with a simple geological structure, shallow buried depth, and low mining costs, are easy to exploit. The local government takes action to eliminate illegal mining every year; however, it still occurs. From 2011 to 2012, miners carried out illegal mining in a residential compound in Qianzhuang Village, a suburb of Yangquan City, and mined more than 100 tons of coal. Even worse, more than 3000 tons of mineable coal resources, worth more than RMB 1.16 million, were damaged by illegal mining. From 2012 to 2013, illegal miners mined more than 600 tons of coal resources from residential houses in Dayangquan Village, another suburb of Yangquan City [18]. In order to verify the effectiveness and reliability of the combination of PS-InSAR technology and high-resolution optical remote sensing to identify such illegal mining, Shandi Village in Hedi Town, another suburb of Yangquan City, Shanxi Province, was selected as the main research area in this paper, as shown in Figure 1.

2.2. Dataset

2.2.1. PALSAR Data

Yangquan has a complex terrain, a variable climate, and rich surface vegetation, with various trees, shrubs, and grasses, which makes it easy for interferograms to be affected by incoherence. Therefore, to identify illegal mining in the Yangquan area, high-precision observation was required to obtain information on surface deformation. Considering that the parameters of radar image data, such as the wavelength and ground resolution, could affect the monitoring accuracy and ability, it was crucial to select an appropriate SAR data source. Among the conventional spaceborne SAR satellites, L-band PALSAR data demonstrated strong phase-preserving ability with longer wavelengths and a spatial resolution of 10 m, which could better reduce the effects of incoherence and phase discontinuity.
In view of the advantages of ALOS PALSAR data, with strong penetration and wide spatial coverage, 20 PALSAR scenes from 29 Dec. 2006, to 9 Jan. 2011, were selected to obtain the surface subsidence information of mining areas in Yangquan. Table 1 shows the specific parameter information of the PALSAR data.

2.2.2. Optical Remote Sensing Images

In this paper, in order to obtain the surface deformation information of targeted buildings in the study area from the PS target dataset, the archived high-resolution data of QuickBird-2 from 20 September 2008 and data of WorldView-2 from 11 October 2010, were used to extract the vector contours of buildings on the surface of the mining area. The data parameters are shown in Table 2 and Table 3, respectively.

2.2.3. DEM Data

SRTM data include a variety of formats and levels of precision, with a resolution of 30, 90, and 900 m [19]. In order to ensure the spatial resolution of the experimental data and reduce the error introduced by external DEM data, external SRTM DEM data with a spatial resolution of 30 m were selected for PALSAR image interference processing and terrain phase removal. At the same time, multi-view processing could reduce the spatial resolution of the image data; therefore, a multi-view coefficient of 1:2 was used in the PALSAR data imaging processing.

3. Methodology

Optical and radar remote sensing images are two data sources that are widely used in surveying and mapping. In this research, based on the characteristics of typical ground features in high-resolution optical satellite images and taking the surface buildings in a large range of mining areas as the main research object, the aim was to extract buildings from remote sensing images in an automatic, fast, and accurate way. Then, PS-InSAR technology could be used to process the multi-temporal radar remote sensing images obtained from repeated observations, and PS targets with stable scattering characteristics in the study area could be extracted. Finally, the average deformation rate and time series deformation information of surface buildings in the study area could be obtained by analyzing the time series phase signals of each PS target, solving their deformation values, and using optical remote sensing to extract building contours.

3.1. Extraction of Surface Building Subsidence Information by Using Combined PS-InSAR Technology and Optical Remote Sensing

3.1.1. Extraction of Building Elements in Mining Area Based on Optical Remote Sensing

In order to improve the quality and efficiency of extracting major elements of surface buildings in the mining area and efficiently identifying illegal underground mining, we studied typical elements in optical remote sensing images, taking surface buildings in the mining area as our main research object. Finally, the pixel-level building contours were extracted based on depth convolution features. Figure 2 shows the technical process. First, the optical remote sensing image data were preprocessed. Second, the characteristics of ground features in the images were analyzed, and a sample database was built for extraction. Third, depth convolution features were used to extract the contours of pixel-level surface buildings from the perspective of semantic segmentation. The network reasoning and smoothing of the extracted elements were carried out. The specific steps were as follows:
(I).
Construct sample database
After the preprocessing of optical remote sensing data, including atmospheric orthorectification, radiometric calibration, image registration, image fusion, and image denoising and enhancement, the characteristics of the elements of residential areas in the mining area were analyzed. Then, the original vector information was corrected by combining it with OMS data and using contour matching and cross-correlation processing. The sample errors were eliminated to ensure the integrity of the sample data and the accuracy of the label data. Sample databases of surface buildings in the mining area were made using the construction method and open network data resources.
(II).
Construct semantic segmentation (SegNet) model
Semantic segmentation was used to define categories for each image pixel; therefore, remote-sensing images could be classified based on the pixel unit. Thus, pixels with similar characteristics were matched. Semantic segmentation was used to study remote-sensing images with pixels as the basic unit. The main advantage of the SegNet model is that it uses up-sampling to decode lower-resolution feature maps without sampling in learning. In addition, sparse feature maps were generated, and dense feature maps could be obtained through convolution processing [20]. Therefore, based on the sample database of the residential area and the mining area, SegNet network training was first conducted for high-resolution remote-sensing images. Then, the discriminable features learned by the encoder were semantically mapped to the pixel space, and the SegNet network model was established. Finally, the surface-building elements in the mining area could be extracted.
(III).
Extract buildings
The preprocessed remote sensing images to be extracted were adaptively cut, and the image subsegments were sent to the depth model. Then, images in each subsegment were classified through the SegNet network model. That is, convolution was applied to extract high-dimensional features, and pooling was used to make the images smaller and obtain a dense classification. Then, deconvolution and de-pooling were applied to up-sample the feature map in the decoder in order to ensure the integrity of the images in the segmentation and reproduce the features of each image that were subsegment after classification. Finally, based on the subsegment feature extraction results, the vector outlines of the building elements in the remote sensing images were extracted by analyzing the conditions and principles of regularization in the building element contours and using the CRF smoothing method.

3.1.2. Surface Deformation Monitoring by PS-InSAR Technology in Mining Area

Conventional differential interferometry is vulnerable to spatiotemporal decorrelation, atmospheric delay, etc., which makes it difficult to detect the cumulative deformation of areas covered by vegetation and obtain the surface deformation accurately. When InSAR technology was used to process data, the pixels of surface objects such as bridges, railways, and houses in SAR images still had certain spatiotemporal correlations, even with larger spatiotemporal baselines [21]. In order to overcome the negative consequences of spatiotemporal decorrelation and improve the monitoring accuracy of surface deformation, Ferretti developed persistent scatterer interferometry (PSI) in 2000 [22].
Figure 3 shows the time series analysis of SAR images based on PS point targets. First, the reflection information of surface PS points was obtained through a single observation, and the spatial distance between the SAR satellite and PS points was calculated. If there was deformation at the surface of PS points during repeated observations, deformation information could be measured according to the movement and deformation during two observation periods by repeatedly observing the same range. Therefore, the key to processing and analyzing multi-temporal SAR data was to detect PS targets with stable radar wave scattering characteristics and high coherence.
In practical applications, whether a surface target can be successfully identified is mainly affected by the stability of the surface target itself, including humidity, dielectric constants, etc. The commonly used methods for detecting PS points are the amplitude dispersion index (ADI), phase dispersion threshold, and double-threshold method [24]. That is, M 1 SAR images could be obtained after the differential processing of M SAR images in the study area. For the resolution unit in the image, the average amplitude ( m A ) and amplitude dispersion index ( D A ) could be expressed as follows:
m A = i = 1 M m i K + 1 D A = σ A m A
where m i is the amplitude value in the i-th image of the pixel and σ A is the standard deviation of the time-varying sequence amplitude. Targets with a high signal-to-noise ratio, D A could be used to measure the phase noise level. With a high SNR, when the pixel met the condition of Equation (1), it could be identified as a PS target and expressed as follows:
m A A ¯ + σ A D A T D A
where A ¯ is the average amplitude of the images and T D A is the amplitude deviation index threshold. When m A A ¯ + σ A , it indicated that the resolution unit with higher A ¯ had a higher coherence. When the threshold of D A was smaller than the given threshold, D A was smaller, and the target point was more stable. In this paper, the amplitude dispersion index threshold was mainly used to detect PS targets.
According to the detected PS targets and the differential interference phase time series, a reasonable phase model could be constructed. Then, the deformation components and error components of the PS targets could be calculated, and the residual phase obtained. Finally, the deformation results of the PS target dataset could be calculated by eliminating the atmospheric phase and residual terrain phase in the differential interference phase through space-time filtering.

3.1.3. Extraction of Deformation Information of Surface Buildings (Structures) in the Mining Area

In SAR images, rocks, streetlights, concrete dams, bridges, houses, and other objects can be detected as PS targets because they can maintain the strong and stable backscattering of radar waves over a long time series. Therefore, the surface deformation information obtained by the PS-InSAR technology includes not only buildings but also other scatterers. Thus, in order to detect illegal underground mining based on the subsidence information of surface buildings, it is first necessary to separate the deformation information of houses (buildings) from the surface PS target dataset in the study area.
Figure 4 shows the method of extracting the deformation information of surface buildings in the mining area. First, based on high-resolution optical satellite data, the contours of the buildings could be extracted accurately by analyzing their geometric and spectral characteristics. Based on this, PS-InSAR technology could be used to obtain the deformation information of the surface PS target dataset. Then, spatial overlay analysis was used to extract the PS point sets of each building. Finally, buildings with abnormal deformation could be screened using the extracted time-series PS point, which was set to conduct the spatiotemporal characteristic analysis of each building’s deformation difference, deformation gradient, and cumulative deformation, which could provide technical support for the rapid identification of illegal underground mining.

3.2. Method of Identifying Illegal Underground Mining Based on Spatiotemporal Characteristics of Building Subsidence

In the PS point set within a nearby area, the PS points of the surface building subsidence had specific abnormal deformation characteristics due to underground mining. Summarizing these deformation characteristics could be helpful to automatically screen out the PS points of building subsidence from PS point sets in larger areas so as to rapidly and accurately detect illegal underground mining sites. The spatiotemporal characteristics of an abnormal deformation in adjacent point sets within a certain distance are mainly shown in the following three aspects. First, the difference in the settlement of PS points of buildings with abnormal deformation is relatively large in short-term monitoring, and this settlement rate can also be larger. Second, compared with the deformation points of normal buildings, the average gradient change rate of PS points for abnormal deformation buildings is relatively large. Third, the cumulative deformation of PS points is relatively large in long-term monitoring.
Based on the above three aspects, in this paper, we mainly adopted a step-by-step method to detect the PS points of buildings when subjected to abnormal deformation, as shown in Figure 5. First, the settlement of two PS points during short-term monitoring was calculated, and the PS point with a relatively larger settlement was taken as the candidate set of abnormal PS points. Then, each PS point was traversed in the candidate point set. Next, the gradient change rate of each point was calculated, and PS points with low rates of change were removed from the abnormal candidate point set. Finally, the cumulative settlement changes for each point were calculated, and the points with relatively larger rates of change were selected as PS points for the buildings subjected to abnormal deformation.
It was assumed that there were n PS points P i , i = 1 , 2 , , n . To find out m points with abnormal or obvious subsidence, the specific steps are as follows:
I. Calculate the difference in settlement between the two points.
δ z p i = z p i t 1 z p i t 2 , i = 1 , 2 , , n ;
II. Calculate the initial settlement of the seed point set.
S e e d = p i S δ z p i Δ , i = 1 , 2 , , n
where S is the set of n points and Δ is the settlement threshold, which is a constant in this paper.
III. Traverse each point in the initial settlement of the seed point set and calculate the adjacent point sets within the range of d , expressed as Equation (5):
S p i = p k S s q r t x p k x p i 2 + y p k y p i 2 d , p i S e e d , i = 1 , 2 , , m k = 1 , 2 , , n
where S p i is the point set adjacent to point p i , whose coordinates are x p i , y p i , and m is the number of seed point sets.
IV. Calculate the average gradient change rate g r a d i e n t p i of each point in the initial settlement point set S e e d , i = 1 , 2 , , m , which can be expressed by Equation (6):
g r a d i e n t p i = k = 1 n p i δ z p i / δ z p k / n p i
where p k is one point in the point set adjacent to p i ; that is, p k S p i ; n p i is the number of the point set adjacent to p i , and δ z p i and δ z p k are the settlement variation of p i and p k , respectively.
V. Traverse each point in the initial settlement point set S e e d . In the case of the mean ( g r a d i e n t p i ) > η , the point can be taken as an abnormal point, which could be:
S e t = p i S e e d g r a d i e n t p i > η
where η can be calculated by Equation (8):
η = m e a n g r a d i e n t p + s t d g r a d i e n t p
where m e a n · refers to the mean of the average gradient change rate of each point in the region and s t d · is the corresponding standard deviation.
VI. Calculate the cumulative settlement of each point during long-term monitoring. The points where the cumulative settlement is greater than the threshold value can be determined as the PS points of the buildings subjected to abnormal deformation, which can be expressed by Equation (9):
P s = p i S e t t = t 0 t 1 δ z p t > Δ Z
where t 0 , t 1 is the interval of the monitoring time and Δ Z is the threshold of cumulative settlement change.
Therefore, based on the PS point set of surface buildings subjected to deformation extracted by optical remote sensing and PS-InSAR technology, the PS points of abnormal deformation could be more accurately screened from the PS point set by summarizing the spatiotemporal characteristics of building subsidence. Moreover, illegal underground mining could be further identified by comparing the spatial correspondence between the abnormal deformation characteristics of the PS points of surface buildings and underground mining activities.

4. Results

4.1. Acquisition of Settlement Information by PS-InSAR

The persistent scatterer synthetic aperture radar interferometry (PS-InSAR) technique was used to monitor the deformation of residential areas in the study area. SAR images from 3 October 2009, were selected as the main public images, forming 20 interference pairs, among which the shortest baseline time was 46 days, and the shortest baseline spatial distance was 109 m. Table 4 shows the specific baseline data.
Then, the interference pairs were processed by differential interference, and 20 PALSAR interferograms were obtained, as shown in Figure 6. Then, external DEM data were used to eliminate the terrain phase caused by image processing, and the adaptive filtering method was used to obtain clearer differential interference fringes. Next, the three-dimensional phase unwrapping algorithm was used for phase unwrapping, and a cubic polynomial model was used to eliminate the phase trend. The unwrapping interferograms are shown in Figure 7.
Figure 8 shows the time series diagrams of Shandi Village in Hedi Town from 29 December 2006 to 9 January 2011. The cumulative deformation in each diagram was based on the reference time of 29 December 2006, and the date in the lower right corner represents the corresponding imaging time of each SAR scene.

4.2. Extraction of Building Contours by Optical Images

First, the acquired QuickBird-2 and WorldView-2 images were preprocessed through atmospheric correction, atmospheric correction, data fusion, etc. Moreover, in order to give two-scene images uniform spatial resolution, all data were resampled to a spatial resolution of 0.5 m. After the preprocessing, the characteristics of the ground objects in the images were analyzed, and the sample database of residential areas was constructed. Then, the depth-wise convolution features were used to extract the contours of surface buildings at the pixel level from the perspective of semantic segmentation. The scale, shape, and compactness parameters used in image segmentation were 40, 0.6, and 0.5, respectively. Figure 9 and Figure 10 show the QuickBird-2 image from 2008 and the WorldView-2 image from 2010, along with the extraction results in the residential area, respectively. The accuracy of automatic extraction in 2008 and 2010 was 90.5 and 91.2%, respectively.
Finally, based on the principles and conditions of building contour regularization, network reasoning, and smoothing processing were performed for the extracted surface objects in residential areas. At the same time, in order to better show the contours of the surface objects, visual correction was carried out to optimize the automatic extraction results for buildings with obvious mistakes. Figure 11 and Figure 12 show the extraction results of residential area contours in 2008 and 2010, respectively.

4.3. Identification of Illegal Underground Mining

According to the above high-resolution remote sensing images, the vector contours of surface objects in Shandi Village in 2008 and 2010 were extracted. The spatial analysis tool in ArcGIS was applied. Then, the surface buildings separated from the PS target dataset were detected by PS-InSAR technology. Next, the PS point sets of residential areas could be extracted. The PS point set within the boundary of Shandi Village was kept. Figure 13 shows the specific information of the PS deformation point set in Shandi Village from 29 December 2006 to 9 January 2011.
Using the step-by-step method of detecting PS points for the buildings subjected to abnormal deformation proposed in Section 3.2, the difference in settlement amount between these two successive points was calculated. Then, according to the settlement threshold, the initial settlement seed point sets were obtained for each time series, as shown in Figure 14. The date in the upper left corner of each image is the corresponding time of each SAR imaging. In fact, illegal mining activities in cave mining have relatively shallow depths, generally about 6 m, which makes it easier for them to cause surface deformation. On the other hand, the PALSAR data used for monitoring have a long round-trip cycle, and the deformation monitored in each cycle is larger. Therefore, combined with the overall situation of monitoring data in the study area, the settlement threshold was set to 10 mm in the experiment.
According to the extracted PS deformation point set results of the residential area in Shandi Village, each point in the initial settlement point set was successively traversed, and the point sets adjacent to each point within 100 m were obtained. The average gradient change rate for each point in the initial settlement point set was calculated. If the value was greater than the threshold, this point was initially considered abnormal. The change rate threshold was calculated based on the adaptive equation of the average gradient change rate of each seed point (Equation (8)). Finally, the cumulative settlement of each abnormal point was calculated, in turn, for certain time series during the monitoring process. The points with a cumulative settlement greater than 80 mm were determined to be PS points of the buildings subjected to abnormal deformation, that is, suspected illegal mining sites, as shown in Figure 15. Then, the cumulative settlement threshold value was determined by the empirical value of the maximum average deformation of surface buildings caused by non-coal mining during monitoring in the study area.

5. Discussion

Based on changes to the deformation adjacent to suspected illegal mining sites, periods of illegal mining could be inferred. The first suspected illegal coal mining likely occurred from December 2006 to January 2008, and the second may have been from February 2007 to July 2008, the third was likely to have been from October 2009 to January 2011, the fourth from February 2008 to April 2009, and the fifth from February 2009 to April 2010.
In order to verify the reliability and applicability of the detection results, we looked up the historical data on illegal coal mining in Shandi Village maintained by the local land and resource supervision department. The data comparison and analysis showed that the third and fourth illegal mining periods were recorded in the previous data but not the first, second, and fifth suspected illegal mining periods from December 2006 to January 2011. From December 2007 to February 2009, illegal miners organized workers to exploit coal resources from private houses at the fourth illegal coal mining site. In March 2009, these resources were seized by the local land and resource supervision department, resulting in the destruction of more than 9000 tons of minable coal resources, causing economic losses of nearly RMB 4 million. Figure 16 shows the profile map of the third illegal coal mining site. Coal miners carried out illegal mining activities in their own houses by cave mining. The elevation of the opening was 848.633 m. The No. 15 coal seam was under active mining. The No. 5 point was the deepest coal mining point, where the floor elevation was 838.437 m.
Figure 17 shows the estimation plan of the resource reserves of the No. 15 coal seam destroyed by illegal mining. The coordinates of the shaft mouth were X = 4,210,531.655 and Y = 38,457,885.871 according to the 1980 Geodetic Reference System, where abscissa 38 represents the number of the 3-degree zone. The elevation of the No. 3 coal point was 841.759 m, and the floor elevations of Nos. 5, 6, and 7 coal points were 838.437, 839.326, and 838.754 m, respectively.
From August 2009 to October 2010, 476 tons of coal resources were illegally extracted from this mining site, where the mining block section area was 170 m2, the coal seam thickness was 2 m, the apparent density was 1.4 t/m3, and the coal mining recovery rate was 100%. The total area of the No. 15 coal seam was 2417 m2, the thickness was 5.38 m, the apparent density was 1.4 t/m3, the recovery rate of coal mining was 75%, and the total amount of destroyed minable coal resources was 13,654 tons, with an economic value of more than RMB 5 million.
The analysis of the illegal coal mining sites detected in Shandi Village compared with the historical data from 29 December 2006 to 9 January 2011, indicated that two of the five suspected illegal mining sites proved to be illegal sites that were previously detected and recorded. The accuracy rate in local areas could reach 40%, and the detection rate was 66.67%. Moreover, the detection results were basically consistent with the actual situation, as well as the mining period. There was a deviation of about 50 m between the detected illegal coal mining site and the actual mining location, mainly because the detected PS points of the buildings subjected to abnormal deformation were located above the deepest coal point rather than the opening. There is a certain distance from the opening to the mined coal seam through the roadway; therefore, the deviation in the spatial location was reasonable. In summary, the above case’s analysis and verification show that the proposed method is feasible and has a certain practical application value.

6. Conclusions

Currently, illegal mining is still carried out in self-built houses, which causes lasting surface deformation. In this paper, the spatiotemporal subsidence characteristics of surface buildings in a mining area were analyzed. On this basis, a novel method was developed to identify illegal underground mining by combining PS-InSAR and optical remote sensing technology. First, the contours of the surface buildings were extracted using depth-wise convolution features from the perspective of semantic segmentation. Then, the PS point set subsidence information of surface buildings was extracted by PS-InSAR technology. Through the spatiotemporal feature analysis of the deformation difference, deformation gradient, and cumulative deformation of the time series PS point set, the buildings subjected to abnormal deformation were screened out, which was helpful when obtaining more accurate and comprehensive assessment results for the rapid identification of illegal mining in self-built residential buildings. Finally, taking Shandi Village, a suburb of Yangquan City, Shanxi Province, as the research object, two illegal coal mining sites were detected based on QuickBird-2 and WorldView-2 high-resolution data and PALSAR image data from 29 December 2006 to 9 January 2011. Through comparative analysis and precision evaluation, the detection rate of illegal mining sites was 66.67% in some areas, and the accuracy rate was 40%. This study provides a new monitoring method to investigate and impede illegal mining in self-built houses.

Author Contributions

Conceptualization, Y.X. and F.X.; methodology, Y.X.; software, Z.H. and H.L.; validation, Y.X. and Z.H.; formal analysis, Y.X. and H.L.; investigation, F.X. and H.L.; resources, Y.X. and H.L.; writing—original draft preparation, Y.X. and F.X.; writing—review and editing, R.W. and J.A.; visualization, Y.X. and R.W.; funding acquisition, Y.X. and F.X. All authors have read and agreed to the published version of the manuscript.

Funding

This work was supported by the National Natural Science Foundation of China (grant numbers 42174055, 42172098, 41962018).

Data Availability Statement

Not applicable.

Conflicts of Interest

The authors declare no conflict of interest.

References

  1. Zhao, X.; Jiang, X. Coal Mining: Most Deadly Job in China [EB]. 13 November 2004. Available online: http://www.chinadaily.com.cn/english/doc/2004-11/13/content_391242.htm (accessed on 12 March 2005).
  2. Zhou, X.; Yue, C.; Xu, T.; Gao, H.; Man, S. Monitoring of Mining Order in Shenfu Coal Based on RS and GIS. Geospat. Inf. 2013, 11, 58–60. [Google Scholar]
  3. Jia, L. Research on Application of Remote Sensing Investigation and Monitoring of Mine Development Based on High Resolution Image. West. Resour. 2016, 3, 11–13. [Google Scholar]
  4. Liu, L.; Gao, J.; Yu, D.; Li, C.; Li, G. Remote Sensing Study on the Relationship between Cross-border Mining and Mining Rights Area. Geospat. Inf. 2019, 17, 47–50+55+9. [Google Scholar]
  5. Yang, X. Research and Implementation on Location Monitoring Algorithm for Mining Cross-Border Areas; Guilin University of Electronic Technology: Guilin, China, 2015. [Google Scholar]
  6. Xu, S.; Li, Q.; Li, Y.; Xie, R.; Yang, L. Application of the Dense Network Micro-Seismic Location Method to Dynamic Mining Monitoring. China Earthq. Eng. J. 2015, 37, 266–270. [Google Scholar]
  7. Li, W.; Mu, Y.; Zhang, J.; Xu, Y. Optimization of Surface Detection Technology and Method of Mine Goaf. Coal Sci. Technol. 2011, 39, 102–106. [Google Scholar]
  8. Panigrahi, D.C.; Bhattacherjee, R.M. Development of Modified Gas Indices for Early Detection of Spontaneous Heating in Coal Pillars. J. S. Afr. Inst. Min. Metall. 2004, 104, 367–380. [Google Scholar]
  9. Huang, C.; Huang, X. Method and Application of Mine Water Disaster Monitoring Warning. J. N. China Inst. Sci. Technol. 2009, 6, 11–18. [Google Scholar]
  10. Azcue, J.M.; Ripley, E.A.; Redman, R.E. Environmental Impacts of Mining Activities; Springer: New York, NY, USA, 1999. [Google Scholar]
  11. Hu, Z.; Ge, L.; Li, X.; Rizos, C. Designing an Illegal Mining Detection System Based on DinSAR. In Proceedings of the 2010 IEEE International Geoscience and Remote Sensing Symposium, Honolulu, HI, USA, 25–30 July 2010; pp. 3952–3955. [Google Scholar]
  12. Hu, Z.; Ge, L.; Li, X.; Zhang, K.; Zhang, L. An Underground-Mining Detection System Based on DInSAR. IEEE Trans. Geosci. Remote Sens. 2013, 51, 615–625. [Google Scholar] [CrossRef]
  13. Xia, Y.; Wang, Y.; Du, S.; Liu, X.; Zhou, H. Integration of D-InSAR and GIS Technology for Identifying Illegal Underground Mining in Yangquan District, Shanxi Province, China. Environ. Earth Sci. 2018, 77, 319. [Google Scholar] [CrossRef]
  14. Liu, S.; Meng, J.; Zhang, C. An Analysis on Types and Causes of Land Desertification in the Coal Mining Area of Shanxi Province. Res. Soil Water Conserv. 2006, 13, 163–165. [Google Scholar]
  15. Xie, H. Thoughts about Current Situation and Future Development of Yangquan learning from the Development Experience of Ruhr in Germany. Econ. Probl. 2007, 5, 124–126. [Google Scholar]
  16. Zhang, W.; Zhang, Z. Status Quo and Its Tendency of High-production and High-effective Mine Construction in Yangquan Mine Area. Coal Min. Technol. 2007, 12, 8–10. [Google Scholar]
  17. Liao, C. Study on Landscape Ecological Effects and Restoration of Yangquan Coal Mine; Tsinghua University: Beijing, China, 2009. [Google Scholar]
  18. Available online: http://www.jcrb.com/prosecutor/thepractice/201411/t20141112_1448862.html (accessed on 20 June 2023).
  19. Hennig, T.A.; Kretsch, J.L.; Pessagno, C.J.; Salamonowicz, P.H.; Stein, W.L. The Shuttle Radar Topography Mission. In Proceedings of the Digital Earth Moving: First International Symposium, DEM 2001, Manno, Switzerland, 5–7 September 2001. [Google Scholar]
  20. Badrinarayanan, V.; Kendall, A.; Cipolla, R. SegNet: A Deep Convolutional Encoder-Decoder Architecture for Image Segmentation. IEEE Trans. Pattern Anal. Mach. Intell. 2019, 39, 2481–2495. [Google Scholar] [CrossRef] [PubMed]
  21. Hanssen, R.; Usai, S. Interferometric Phase Analysis for Monitoring Slow Deformation Processes. Eur. Space Agency 1997, 414, 487–491. [Google Scholar]
  22. Ferretti, A.; Prati, C.; Rocca, F. Nonlinear Subsidence Rate Estimation Using Permanent Scatterers in Differential SAR Interferometry. IEEE Trans. Geosci. Remote Sens. 2000, 38, 2202–2212. [Google Scholar] [CrossRef] [Green Version]
  23. Available online: https://www.enea.it/it/seguici/events/duomoorvieto_9apr13/Borfecchia_Orvieto.pdf (accessed on 20 June 2023).
  24. Wang, Y.; Liao, M.-S.; Li, D.-R.; Wei, Z.-X.; Fang, Z. Subsidence Velocity Retrieval from Long-term Coherent Targets in Radar Interferometric Stacks. Chin. J. Geophys. 2007, 50, 598–604. [Google Scholar]
Figure 1. Overview map of the research area.
Remotesensing 15 03565 g001
Figure 2. Building elements extraction based on depth convolution features.
Remotesensing 15 03565 g002
Figure 3. Time series analysis of SAR images based on PS [23].
Remotesensing 15 03565 g003
Figure 4. Extraction of deformation information of surface buildings in the mining area.
Remotesensing 15 03565 g004
Figure 5. Detection method of PS point of abnormal deformation buildings.
Remotesensing 15 03565 g005
Figure 6. PALSAR interferograms.
Remotesensing 15 03565 g006
Figure 7. Unwrapping interferograms of PALSAR.
Remotesensing 15 03565 g007
Figure 8. Time series diagrams of deformation in Shandi Village.
Remotesensing 15 03565 g008
Figure 9. (a) Quickbird02 image in 2008. (b) Residential area extraction results.
Remotesensing 15 03565 g009
Figure 10. (a) Worldview02 image in 2010. (b) Residential area extraction results.
Remotesensing 15 03565 g010
Figure 11. Extraction results of residential area contour in 2008.
Remotesensing 15 03565 g011
Figure 12. Extraction results of residential area contour in 2010.
Remotesensing 15 03565 g012
Figure 13. Extraction results of PS deformation point set in Shandi Village.
Remotesensing 15 03565 g013
Figure 14. Extraction results of initial settlement seed point sets.
Remotesensing 15 03565 g014
Figure 15. Results of suspected illegal mining sites.
Remotesensing 15 03565 g015
Figure 16. Profile of No.3 illegal coal mining point in Shandi Village.
Remotesensing 15 03565 g016
Figure 17. No.3 illegal coal mining point destroyed the No.15 coal seam reserve estimation plan.
Remotesensing 15 03565 g017
Table 1. Parameter information of PALSAR data.
SCNID DATE OPEMD POLARIZATION PATHNO PASS
129 Dec. 2006FBSHH454A
213 Feb. 2007FBSHH454A
31 Jul. 2007FBSHH454A
416 Aug. 2007FBDHH454A
51 Oct. 2007FBDHH454A
61 Jan. 2008FBSHH454A
716 Feb. 2008FBSHH454A
82 Apr. 2008FBSHH454A
918 May 2008FBDHH454A
103 Jul. 2008FBDHH454A
113 Jan. 2009FBSHH454A
1218 Feb. 2009FBSHH454A
136 Jul. 2009FBDHH454A
1421 Aug. 2009FBDHH454A
156 Oct. 2009FBDHH454A
166 Jan. 2010FBSHH454A
178 Apr. 2010FBSHH454A
189 Jul. 2010FBDHH454A
199 Oct. 2010FBDHH454A
209 Jan. 2011FBSHH454A
Table 2. Data parameters of Quickbird02 images.
DataBandsBand Width (nm)Spatial resolution (m)
QuickBird02
(2008)
Blue450–5202.4 (panchromatic 0.61)
Green529–600
Red630–690
Near-infrared (NIR)760–900
Table 3. Data parameters of Worldview02 images.
DataBandsBand Width (nm)Spatial Resolution (m)
Worldview02
(2010)
Blue450–5101.8 (panchromatic 0.5)
Green510–580
Red630–690
Near-infrared (NIR)770–895
Table 4. Interference image pairs.
IDMain ImageSecondary ImageSpatial Baseline (m)Time Baseline (d)
13 Jan. 200929 Dec. 2006−109.7−736
23 Jan. 200913 Feb. 20071403.7−690
33 Jan. 20091 Jul. 20071983.6−552
43 Jan. 200916 Aug. 20072258.9−506
53 Jan. 20091 Oct. 20072476.5−460
63 Jan. 20091 Jan. 20082792.8−368
73 Jan. 200916 Feb. 20083824.4−322
83 Jan. 20092 Apr. 20084059.8−276
93 Jan. 200918 May 20084156.1−230
103 Jan. 20093 Jul. 20081097.4−184
113 Jan. 20093 Jan. 200900
123 Jan. 200918 Feb. 2009482.346
133 Jan. 20096 Jul. 2009−854.1184
143 Jan. 200921 Oct. 20091282.8230
153 Jan. 20096 Oct. 20091717.8276
163 Jan. 20096 Jan. 20102114.3368
173 Jan. 20098 Apr. 20102945.7460
183 Jan. 20099 Jul. 20103005.3552
193 Jan. 20099 Oct. 20103760.5644
203 Jan. 20099 Jan. 20114199.8736
Disclaimer/Publisher’s Note: The statements, opinions and data contained in all publications are solely those of the individual author(s) and contributor(s) and not of MDPI and/or the editor(s). MDPI and/or the editor(s) disclaim responsibility for any injury to people or property resulting from any ideas, methods, instructions or products referred to in the content.

