Article

Experiences with the RTM Method in Local Quasi-Geoid Modeling

1
College of Civil Engineering, Xiangtan University, Xiangtan 411105, China
2
College of Geodesy and Geomatics, Shandong University of Science and Technology, Qingdao 266590, China
3
School of Geospatial Engineering and Science, Sun Yat-sen University, Zhuhai 519082, China
4
Key Laboratory of Comprehensive Observation of Polar Environment, Ministry of Education, Sun Yat-sen University, Zhuhai 519082, China
5
School of Geosciences and Info-Physics, Central South University, Changsha 410083, China
*
Author to whom correspondence should be addressed.
Remote Sens. 2023, 15(14), 3594; https://doi.org/10.3390/rs15143594
Submission received: 15 June 2023 / Revised: 13 July 2023 / Accepted: 14 July 2023 / Published: 18 July 2023

Abstract

:
In local quasi-geoid modeling, the residual terrain modeling (RTM) method is often used to remove short-wavelength gravity field signals from the measured gravity on the ground in order to obtain a regularized and smooth gravity field that is suited for field interpolation and modeling. Accurate computation of RTM corrections plays a crucial role in computing an accurate local quasi-geoid, and it requires a set of fine-tuned parameters, including the combination of DEMs with different resolutions for suitably representing the real topography, the choice of integration radius for properly defining the extent of the computation zone, and the determination of reference topography to properly describe the RTM-reduced Earth’s surface. To our knowledge, this has not been systematically documented, despite its obvious importance. This study aims to systematically investigate the impact of these factors on RTM correction computation and, consequently, on local quasi-geoid modeling to provide practical guidelines for real-world applications. The tesseroid-based gravity forward modeling technique is employed to investigate the following issues existing in the practical use of the RTM method: ① Can the combination of a high-resolution DEM and a DEM with a lower resolution replace the single use of the high-resolution DEM for RTM correction computation while maintaining accuracy and improving efficiency? If it does, how do I properly choose the resolution of this coarse DEM as well as the integration radius r1 for the inner zone and r2 for the outer zone? ② How large would the differences between the RTM corrections computed by three types of reference topographies, which are obtained from the direct averaging (DA) approach, the moving averaging (MA) approach, and the spherical harmonic (SH) approach, be, and how large would their impact on quasi-geoid modeling be? To obtain objective findings, two research regions were selected for this investigation. One is the Colorado test area (USA) with rugged terrain, and the other is the Auvergne test area (France) with moderate terrain. The main numerical findings are: (1) the combination of the 3” resolution DEM (inner zone) and the 30″ resolution DEM (outer zone) is sufficient for accurate and efficient RTM correction computation; (2) if the resolution of the reference topography is 5′ or slightly lower, all three types of reference topographies are able to obtain local quasi-geoid models at a similar accuracy level, while the values of r1 and r2 are preferred to be at least 20 km and 111 km, respectively; (3) if the reference topography has a resolution of 30′ or lower, the MA or SH reference topography is recommended, especially for the latter one, and the values of r1 and r2 are suggested to be at least 20 km and 222 km, respectively. The above numerical findings can be taken as a reference for local quasi-geoid determination in areas with different topographic regimes than the two selected test areas.

1. Introduction

Local quasi-geoid modeling is one of the routine tasks in physical geodesy [1,2], since the quasi-geoid serves as the reference surface for the normal height, which is adopted in many countries [3,4,5,6,7,8,9]. In order to obtain an accurate local quasi-geoid model, the remove-compute-restore (RCR) technique is widely applied [4], and it is briefly described as follows: First, the contributions of a global geopotential model (GGM) and of the topography are removed from the gravity data. The former reduces the long-wavelength signals in the data, so that the effect of the data far away from the area of interest can possibly be ignored in computing the local quasi-geoid model. The latter ensures that the short-wavelength signals have less energy in the residual field, making it smoother than the original one and easier for field interpolation and modeling. Second, the residual gravity data are transformed into the residual height anomalies via various methods, such as the Stokes’s integral [10,11,12], the least-squares collocation [13,14,15], and the radial basis functions [6,16,17,18]. Third, the height anomaly contributions from the GGM and the topography are added to the residual height anomalies, yielding the final quasi-geoid model.
Obviously, besides the data coverage and quality, accurate determination of the local quasi-geoid model greatly depends on the selection of the most appropriate GGM, modeling method, and topography reduction scheme for the research area. In this study, we only focus on the topographic reduction, and more specifically, the so-called residual terrain modeling (RTM) reduction [19,20]. For other types of topographic reductions that may be used in local quasi-geoid modeling, we refer to the reviews in [21,22].
In the RCR procedure, the RTM reduction aims to reduce the gravity data for the gravitational signals of topographic masses that are not captured by the used GGM. To achieve this, the real Earth’s topography is replaced by a smoothed reference topography with a resolution relevant to the half-wavelength resolution of the GGM, but only in approximation. In fact, the filtering of DEM heights in the topography domain is not exactly equivalent to the filtering in the gravity domain, leading to the so-called spectral filter problem of the RTM method. For more in-depth discussions on this issue, refer to [23]. After determining the reference topography based on the real topography, the residual terrain is defined by the masses between the two topographies. The terrain above the reference topography has actual masses with a positive density, while the parts below the reference topography are filled by masses with a negative density (see Figure 1). The data are then reduced by removing the gravitational effects of these masses. For the sake of conciseness, we refer to the Earth after the RTM reduction as the RTM-reduced Earth, which is bounded by the reference topography, and call the gravitational effects caused by the residual terrain the RTM corrections or effects.
To obtain an accurate local quasi-geoid model, accurate RTM correction computation is necessary, and it is affected by several factors, such as the selection of high-resolution digital elevation models (DEMs) for suitably representing the real topography, the choice of integration radius for properly defining the extent of the computation zone, and the determination of reference topography to properly describe the RTM-reduced Earth’s surface (see Figure 1).
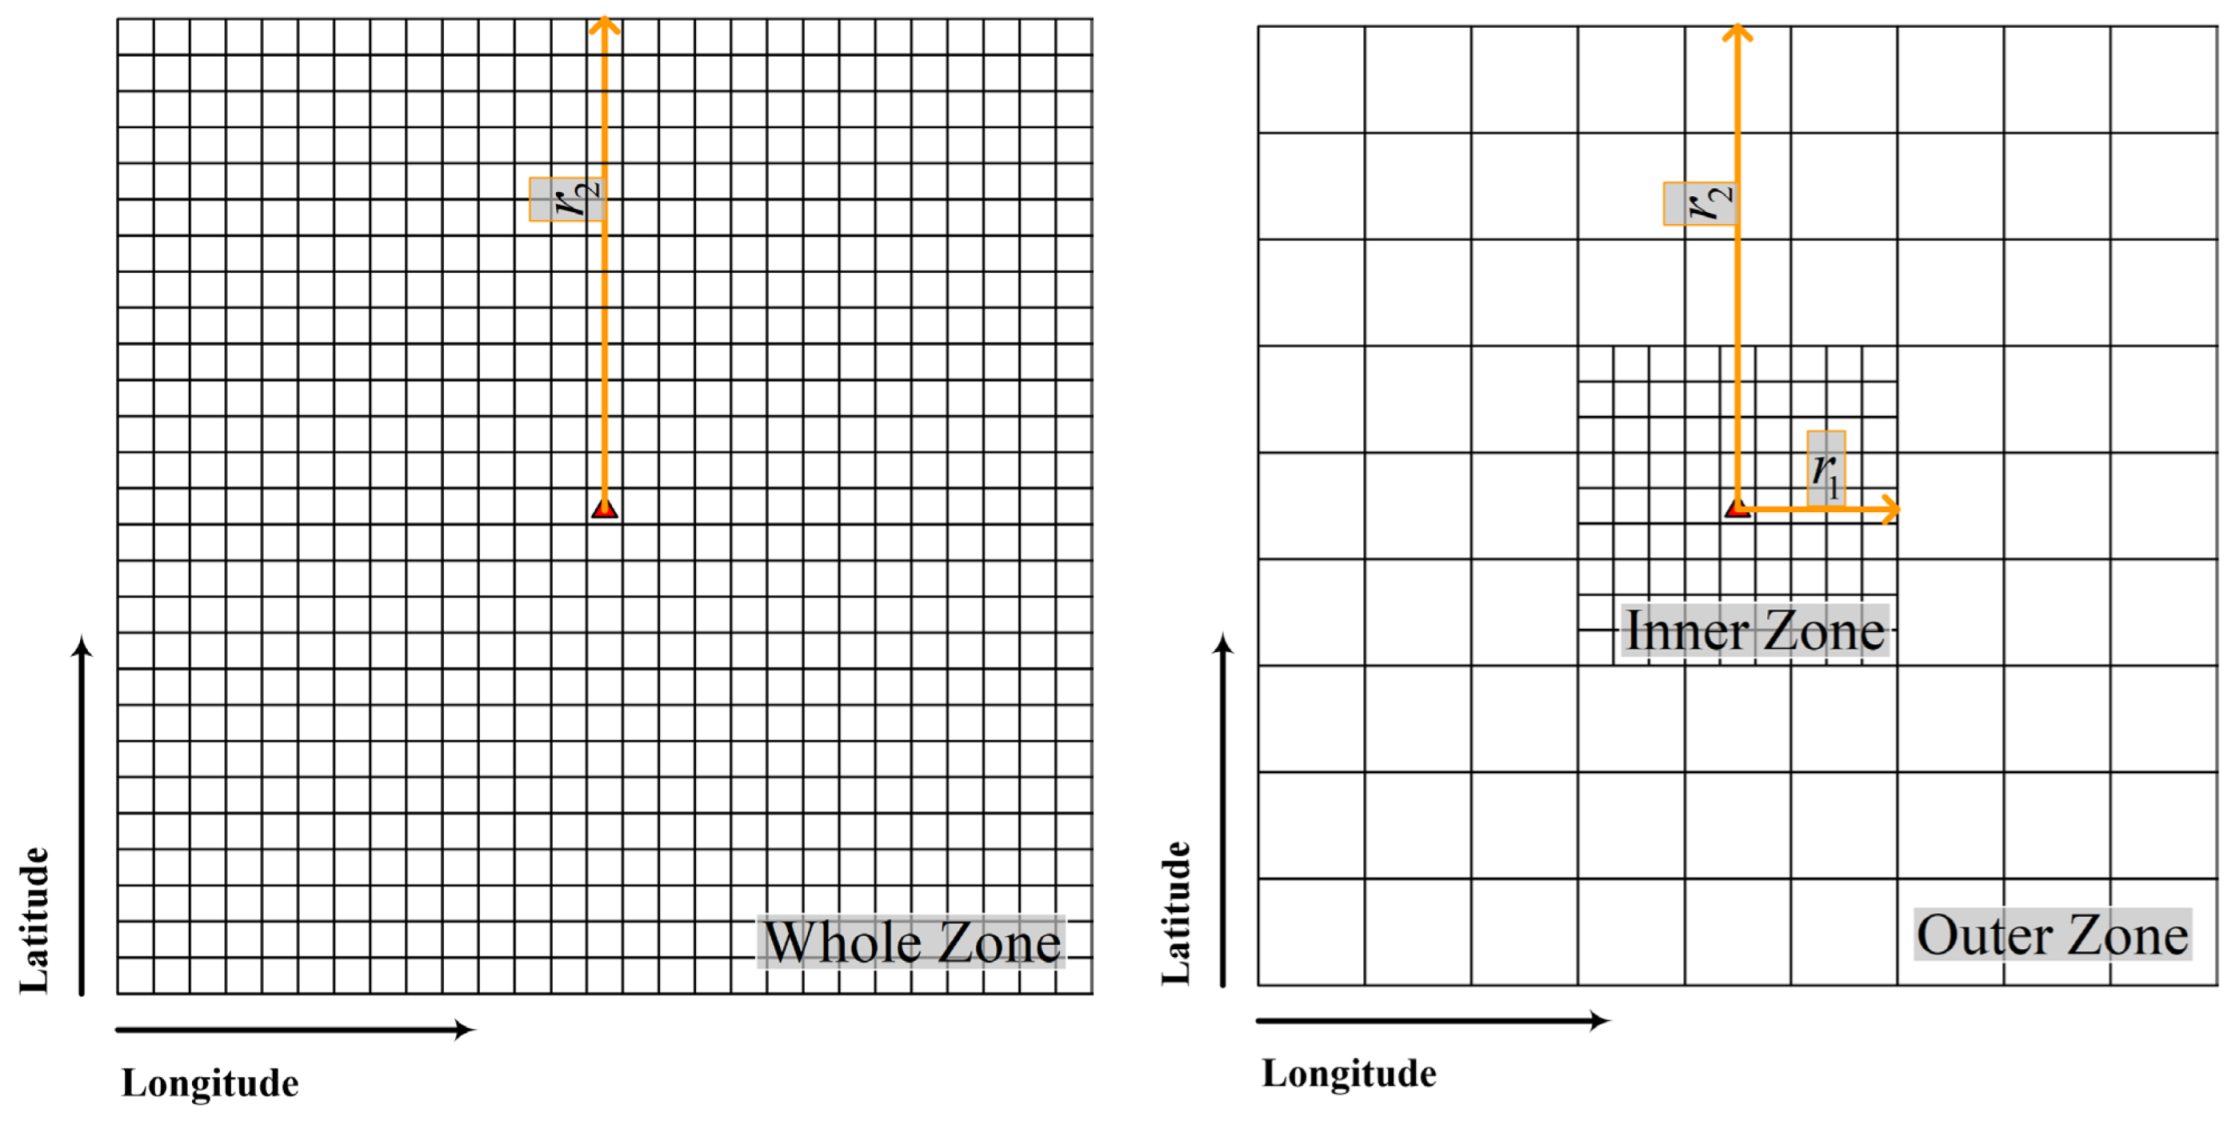
An ideal case for representing the real topography over the whole research area is to use an ultra-high resolution DEM, for example, the shuttle radar topography mission (SRTM) DEM [24] and the MERIT DEM [25], both with a resolution of 3” (see the left panel of Figure 2). In this case, the computational burden would be high since the number of mass elements included in one-point computation is usually large, especially for large-scale research areas. Considering the fact that the gravitational potential and its derivatives decay with the distance of the mass element to the computation point, the whole computation zone centered at each computation point is usually divided into two zones. The inner zone uses a high-resolution DEM and is defined by the integration radius r1. The outer zone employs a DEM with a lower resolution and is defined by the integration radius r2 (see the right panel of Figure 2). In some studies, more than two computation zones are selected [26,27,28]. In this study, we focus on the two-zone scheme, which has been implemented in the widely-used prism-based “tc.for” program in the GRAVSOFT software [29] and the recently developed tesseroid-based programs in the TCTESS software [30]. While considering the accuracy and efficiency of the RTM correction computation for practical use, it is straightforward for us to ask the question, “can the combination of a high-resolution DEM and a DEM with a lower resolution really replace the single use of the high-resolution DEM while maintaining accuracy and improving efficiency?” If it does, how do I properly choose the resolution of this coarse DEM as well as the integration radius r1 for the inner zone and r2 for the outer zone? This is the first research question to be addressed in this study. Recently, the performance of using different combinations of DEM resolutions on terrain correction computation was investigated in [31]. It verified that the use of the 1” resolution DEM in the inner zone and the 15” resolution DEM in the outer zone can lead to sub-mGal accuracy with less computational time in rough topography. Here we focus on the RTM correction computation and use the original 3” resolution DEM.
In local quasi-geoid modeling using the RCR technique and the RTM reduction, the reference topography should be chosen as the one closest to the topography that is captured by the GGM, so that the errors caused by spectral inconsistencies can be reduced significantly, although such errors cannot be totally eliminated. To do so, the resolution of the reference topography is usually set to be equal to the half-wavelength resolution of the GGM, albeit in approximation [23]. When the resolution is known, three commonly used approaches, namely the direct averaging (DA) approach (i.e., block-mean values), the moving averaging (MA) approach, and the spherical harmonic (SH) approach, can be applied to filter the original high-resolution DEM to generate the reference topography. The former two approaches can be implemented by the “tcgrid.for” program in the GRAVSOFT software. The SH approach first estimates the SH coefficients of the detailed topography via the surface SH analysis and then computes the heights of the reference topography via the SH synthesis. For more details about this approach, we refer to [32,33]. It should be noted that the RTM method utilizing the reference topography obtained from the SH approach has been successfully used for high-frequency GGM augmentation in many areas with different topographic regimes [26,28,33,34,35]. In addition to the above-mentioned three approaches, the reference topography can also be obtained by applying a circular sharp cutoff filter [7] or a spherical Gaussian low-pass filter [36] to a high-resolution DEM. To our understanding, both filters are similar to the MA approach and thus are not further discussed here. It is clear that the reference topographies obtained by different approaches would differ from each other, and so the resulting residual terrain would also differ. The performance of using them on RTM correction computation and quasi-geoid modeling has not been investigated yet. Therefore, the second research question is: how large would the differences between the RTM corrections computed by using different types of reference topographies be, and how large would their impact on quasi-geoid modeling be?
Although the importance of these factors (i.e., combination of DEM resolutions, choice of integration radius, and determination of reference topography type) is obvious, to the best of our knowledge, they have not been systematically investigated. Therefore, the main purpose of this study is to systematically investigate the impact of these factors on RTM correction computation and quasi-geoid modeling to provide practical guidelines for real-world applications.
The remainder of this paper is organized as follows: Section 2 explains why we compute RTM corrections to gravity anomalies and height anomalies in local quasi-geoid modeling and gives corresponding mathematical descriptions. Various numerical experiments with the aim of investigating the DEM resolution combination effect, integration radius effect, and reference topography effect on RTM correction computation are first presented in Section 3. Secondly, the impact of the integration radius for the outer zone and of the type of reference topography on local quasi-geoid modeling is investigated. Finally, some conclusions and suggestions on using the RTM method in local quasi-geoid determination are given in Section 4.

2. RTM Corrections to Gravity Anomalies and Height Anomalies

The real Earth is replaced by the RTM-reduced Earth after the RTM reduction. Since mass redistribution exists during this procedure, gravity and potential actually change. In this section, we try to mathematically describe how gravity observations on the Earth’s surface are reduced by the RTM method; more specifically, how the free-air gravity anomalies on the Earth’s surface are transformed into the so-called RTM-reduced gravity anomalies and how the height anomalies referring to the RTM-reduced Earth are converted to those referring to the real Earth.
Let P be an arbitrary point on the Earth’s surface, g P and W P are denoted as the measured gravity and potential at this point, respectively. The RTM-reduced gravity and potential after removing the gravitational attraction δ g RTM P = δ V RTM r P and gravitational potential δ V RTM P caused by the residual terrain are expressed as
g RTM P = g P δ g RTM P ,
W RTM P = W P δ V RTM P .
Equation (2) shows that the potential on the Earth’s surface also changes due to the mass redistribution occurring in the RTM reduction. According to the definition of the telluroid, on which the normal potential is equal to the potential on the Earth’s surface [1,2], it is easy to infer that a displacement of the telluroid happens after the RTM reduction. Let H N P be the distance from the real telluroid to the reference ellipsoid with the normal potential of U = W 0 along the normal to the reference ellipsoid, which can be explicitly expressed as
H N P = W 0 W P γ ¯ ,
where γ ¯ is the mean value of the normal gravity between the reference ellipsoid and the real telluroid. It should be emphasized that H N P is actually equal to the normal height of the point P, referring to the real topography.
In a similar way, the distance of the RTM-reduced telluroid to the reference ellipsoid (i.e., the normal height of the point P referring to the RTM-reduced Earth) is given as
H N RTM P = W 0 W RTM P γ ¯ RTM ,
where γ ¯ RTM is the mean value of the normal gravity between the reference ellipsoid and the RTM-reduced telluroid. Since the displacement between the real and RTM-reduced telluroids is quite small, γ ¯ RTM can be approximated by γ ¯ , resulting in a negligible error in H N RTM P . Upon this approximation, we have the following relation:
H N RTM P H N P = W P W RTM P γ ¯ = δ V RTM P γ ¯ .
Let ζ and ζ RTM be the height anomaly before and after the RTM reduction, respectively, and we then obtain the following relation:
ζ + H N = ζ RTM + H N RTM .
Inserting Equation (6) into Equation (5), we then have
ζ P ζ RTM P = δ V RTM P γ ¯ ζ RTM P .
The above correction can be considered analogous to the primary indirect effect appearing in Helmert’s method of condensation [37,38,39]. When the height anomalies referring to the RTM-reduced Earth are computed, the right-hand side term of Equation (7) must be added back in order to generate the height anomalies referring to the real Earth. Because this term has the same form as that of the Bruns’ formula that estimates the height anomaly by means of dividing the disturbing potential by the normal gravity [1,2], we refer to it as the RTM correction to height anomalies ζ RTM .
Since the gravity anomaly on the Earth’s surface is defined as the difference between the measured gravity and the normal gravity at the corresponding point on the telluroid, the RTM-reduced gravity anomaly on the Earth’s surface is defined as
Δ g RTM P = g RTM P γ r P ζ RTM P = g RTM P γ r 0 + H N RTM P ,
where r 0 is the geocentric radius of the reference ellipsoid and r P is the geocentric radius of the point P.
Taking the following approximation
γ r 0 + H N RTM P γ r 0 + H N P + γ n H N RTM P H N P = γ r 0 + H N P + γ n δ V RTM P γ ¯ γ r 0 + H N P 2 δ V RTM P r P
and Equation (1) into account, Equation (8) can be rewritten as
Δ g RTM P = g P γ r 0 + H N P Δ g obs P δ g RTM P 2 δ V RTM P r P Δ g RTM P .
On the right-hand side of Equation (10), the first two terms actually denote the free-air gravity anomaly on the Earth’s surface, such as the observed terrestrial gravity anomaly. The third term is the gravitational attraction caused by the residual terrain, and the fourth term can be considered analogous to the second indirect effect appearing in Helmert’s method of condensation [37,38,39]. Note that the expression in the second square bracket of Equation (10) has the same form as the fundamental equation of physical geodesy that defines the gravity anomaly based on the disturbing potential [1,2]. Therefore, we refer to it as the RTM correction to gravity anomalies Δ g RTM .
In principle, the RTM correction should be harmonic. It satisfies this condition for points above the reference topography but fails for points below the reference topography. In the latter case, harmonic correction is added in order to obtain a harmonically downward continued value. Various harmonic correction approaches have been studied in the past decades [3,19,20,32,33,36,40,41,42]. In this study, we follow the classical approach of [19,20], in which the harmonic correction is computed based on the concept of mass condensation and is only applied to gravity.

3. Numerical Experiments

The experiments are divided into two parts. First, RTM corrections to gravity anomalies and height anomalies computed by different parameter settings are compared and analyzed with the goal of quantifying their impact on RTM correction computation. Second, local quasi-geoid models are computed by using various RTM corrections and then validated against GNSS/leveling data in order to illustrate how these parameter settings affect the determination of quasi-geoid.
Numerical experiments are carried out in two regions with different topographic regimes. The first region is located in the Colorado area of the USA and has quite rugged terrain. Recently, this area has been selected as the test area for “the 1 cm geoid experiment” [43]. The second region is located in the Auvergne area of France and has moderate terrain. In the past, it has been chosen as the test area to compare different methods for local quasi-geoid modeling [44,45].
The “tctessv3omp.f90” program from the TCTESS software is used for all RTM correction computations. It has almost the same structure as that of the “tc.for” program and is further parallelized by OpenMP. For more details about this program and the TCTESS software, refer to [30]. All computations are performed on a single node of a cluster equipped with two 12-core Intel(R) Xeon(R) Gold 6126 @ 2.60 GHz CPUs with one thread per core. The used FORTRAN compiler is an Intel compiler (ifort version 18.0.1) executed in GNU/Linux.

3.1. Data Sets

In the Colorado test area, there are 59,303 terrestrial gravity observations irregularly distributed in the area bounded by 35 N φ 40 N and 250 E λ 258 E . After deleting those observations with absolute values of the differences between the given heights and the corresponding heights from the DEM that were larger than 100 m, 58,913 observations are left for the numerical experiments. 222 GSVS17 (Geoid Slop Validation Survey 2017) [46] GNSS/leveling benchmarks would provide geoid undulations with an accuracy of about 1.5 cm and height anomalies with an accuracy of about 1.2 cm for validation purposes. The DEM used for precisely representing the topography of the test area is chosen as the MERIT DEM with a resolution of 3”, covering the area of 34 N φ 41 N and 249 E λ 259 E . For more details about this data set, refer to [43].
The Auvergne data set contains 243,954 terrestrial gravity observations, which are irregularly distributed in the area bounded by 43 N φ 49 N and 1 E λ 7 E ; the SRTM DEM with a resolution of 3”, covering a larger area bounded by 42 N φ 50 N and 2 E λ 8 E ; and 75 GNSS/leveling benchmarks located in the middle of the test area. For more details about this data set, refer to [44].
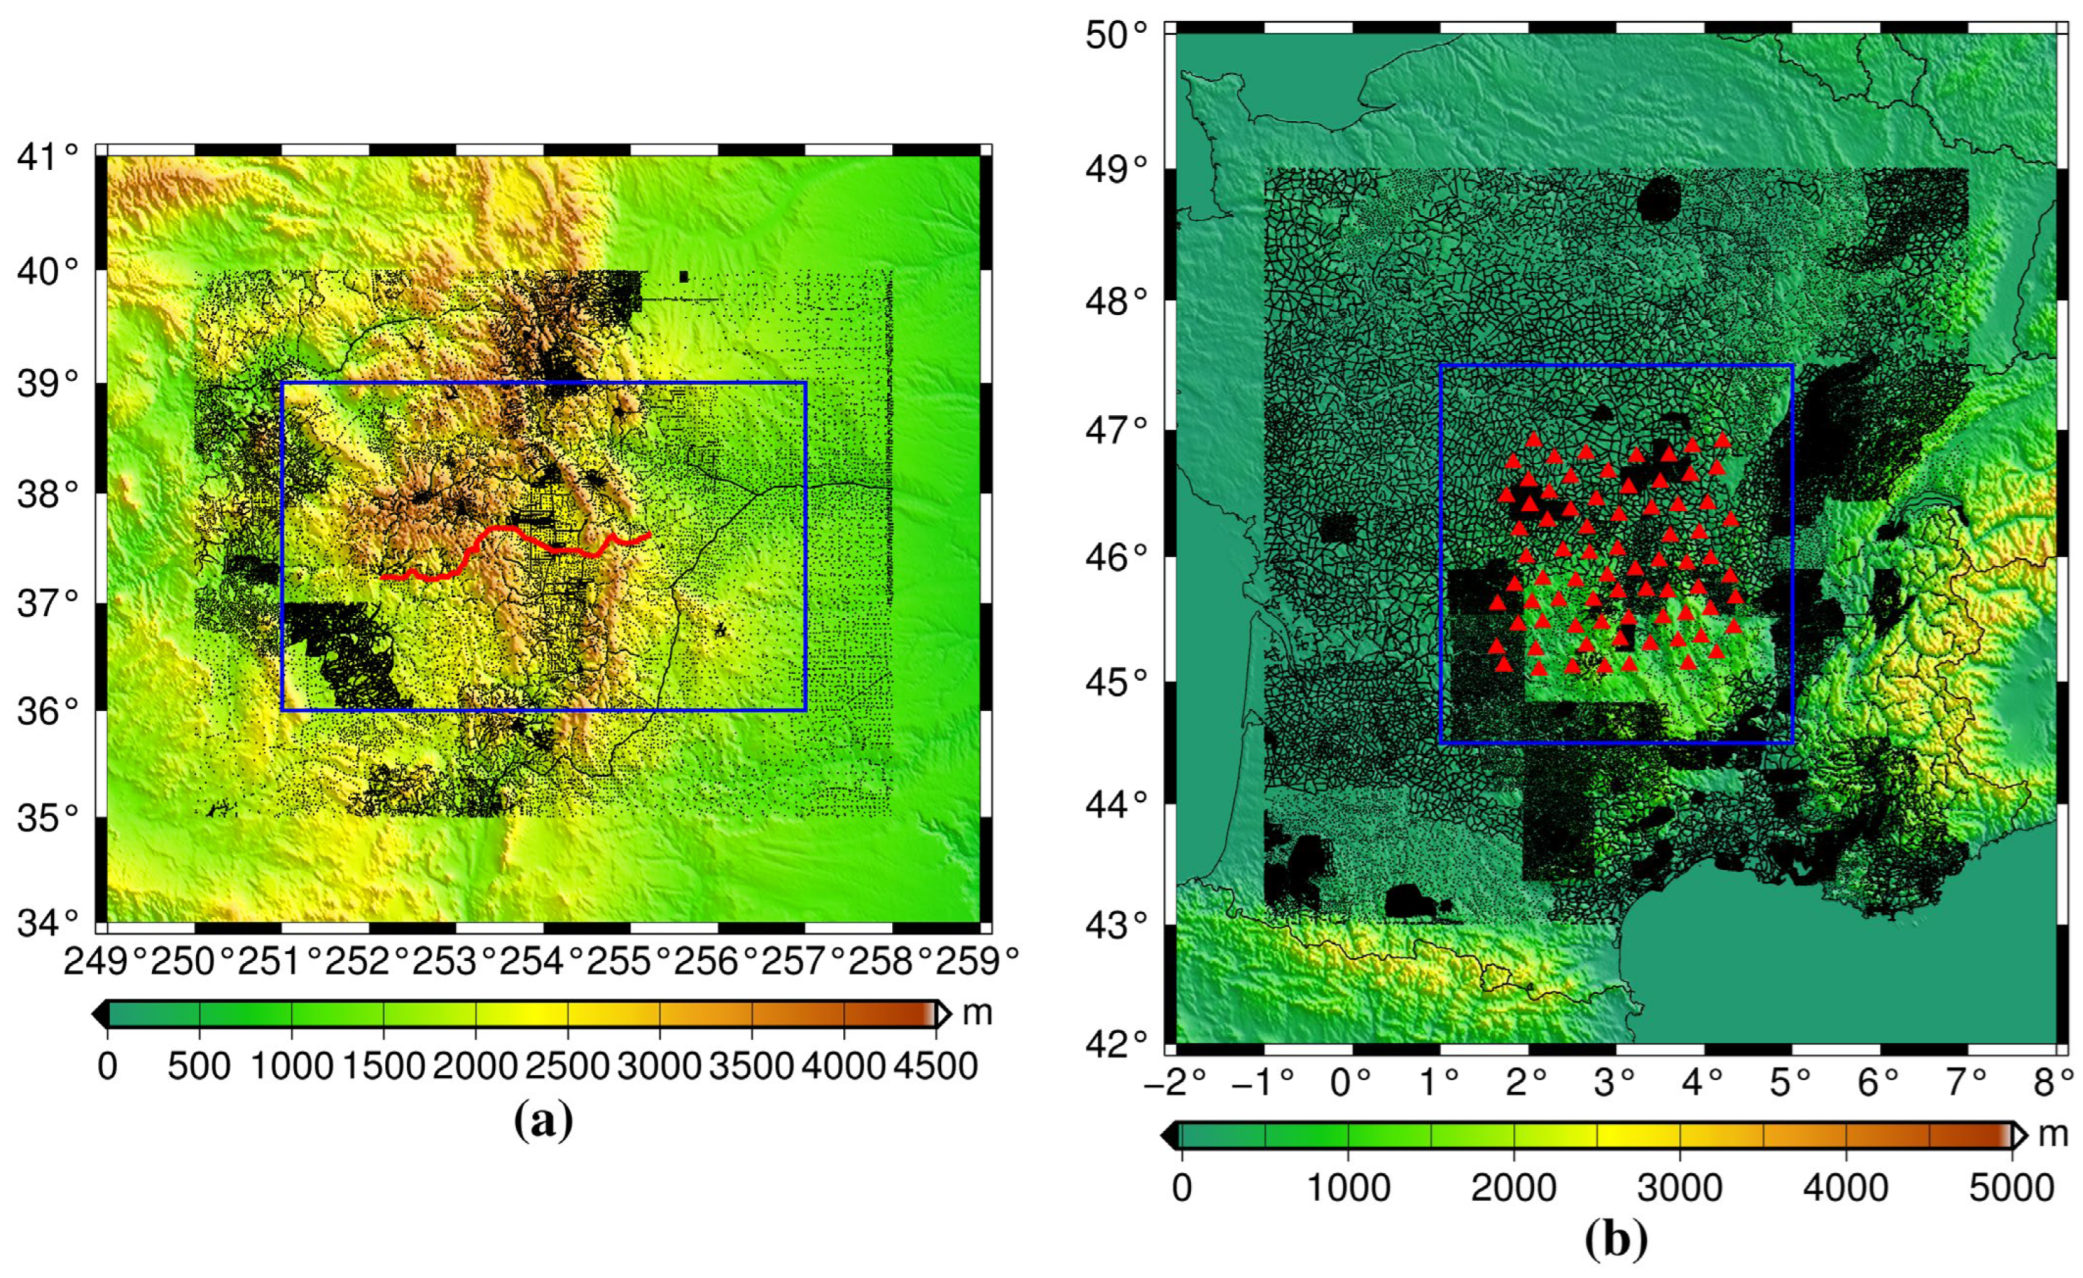
In each test area, the quasi-geoid computation area is selected to be smaller than that covered by gravity observations and DEM, in order to avoid edge effects. The computation points are regularly distributed in this area with a resolution of 1′, resulting in 65,341 points in the Colorado test area and 43,621 points in the Auvergne test area. Figure 3 shows the locations of all data points, the DEM, as well as the quasi-geoid computation area.

3.2. Parameter Settings

According to the two research questions posed in Section 1, the issues to be investigated in this study can be summarized as the DEM resolution combination effect, the integration radius effect, and the reference topography effect. For the DEM resolution combination effect, we will design several scenarios using two DEMs with different resolutions and compare the differences between RTM corrections computed by using different DEM resolution combination scenarios. The integration radius effect includes the effect of the integration radius r1 for the inner zone and the effect of the integration radius r2 for the outer zone. For each case, the RTM corrections computed by using various values of r1 and r2 will be compared and analyzed. The reference topography effect is used to investigate how large the differences between RTM corrections will be if using the reference topographies obtained by the DA approach, the MA approach, and the SH approach. In addition, these RTM corrections are also compared for gravity anomaly reduction. Table 1 summarizes the details of the parameter settings that will be used in the following numerical experiments.
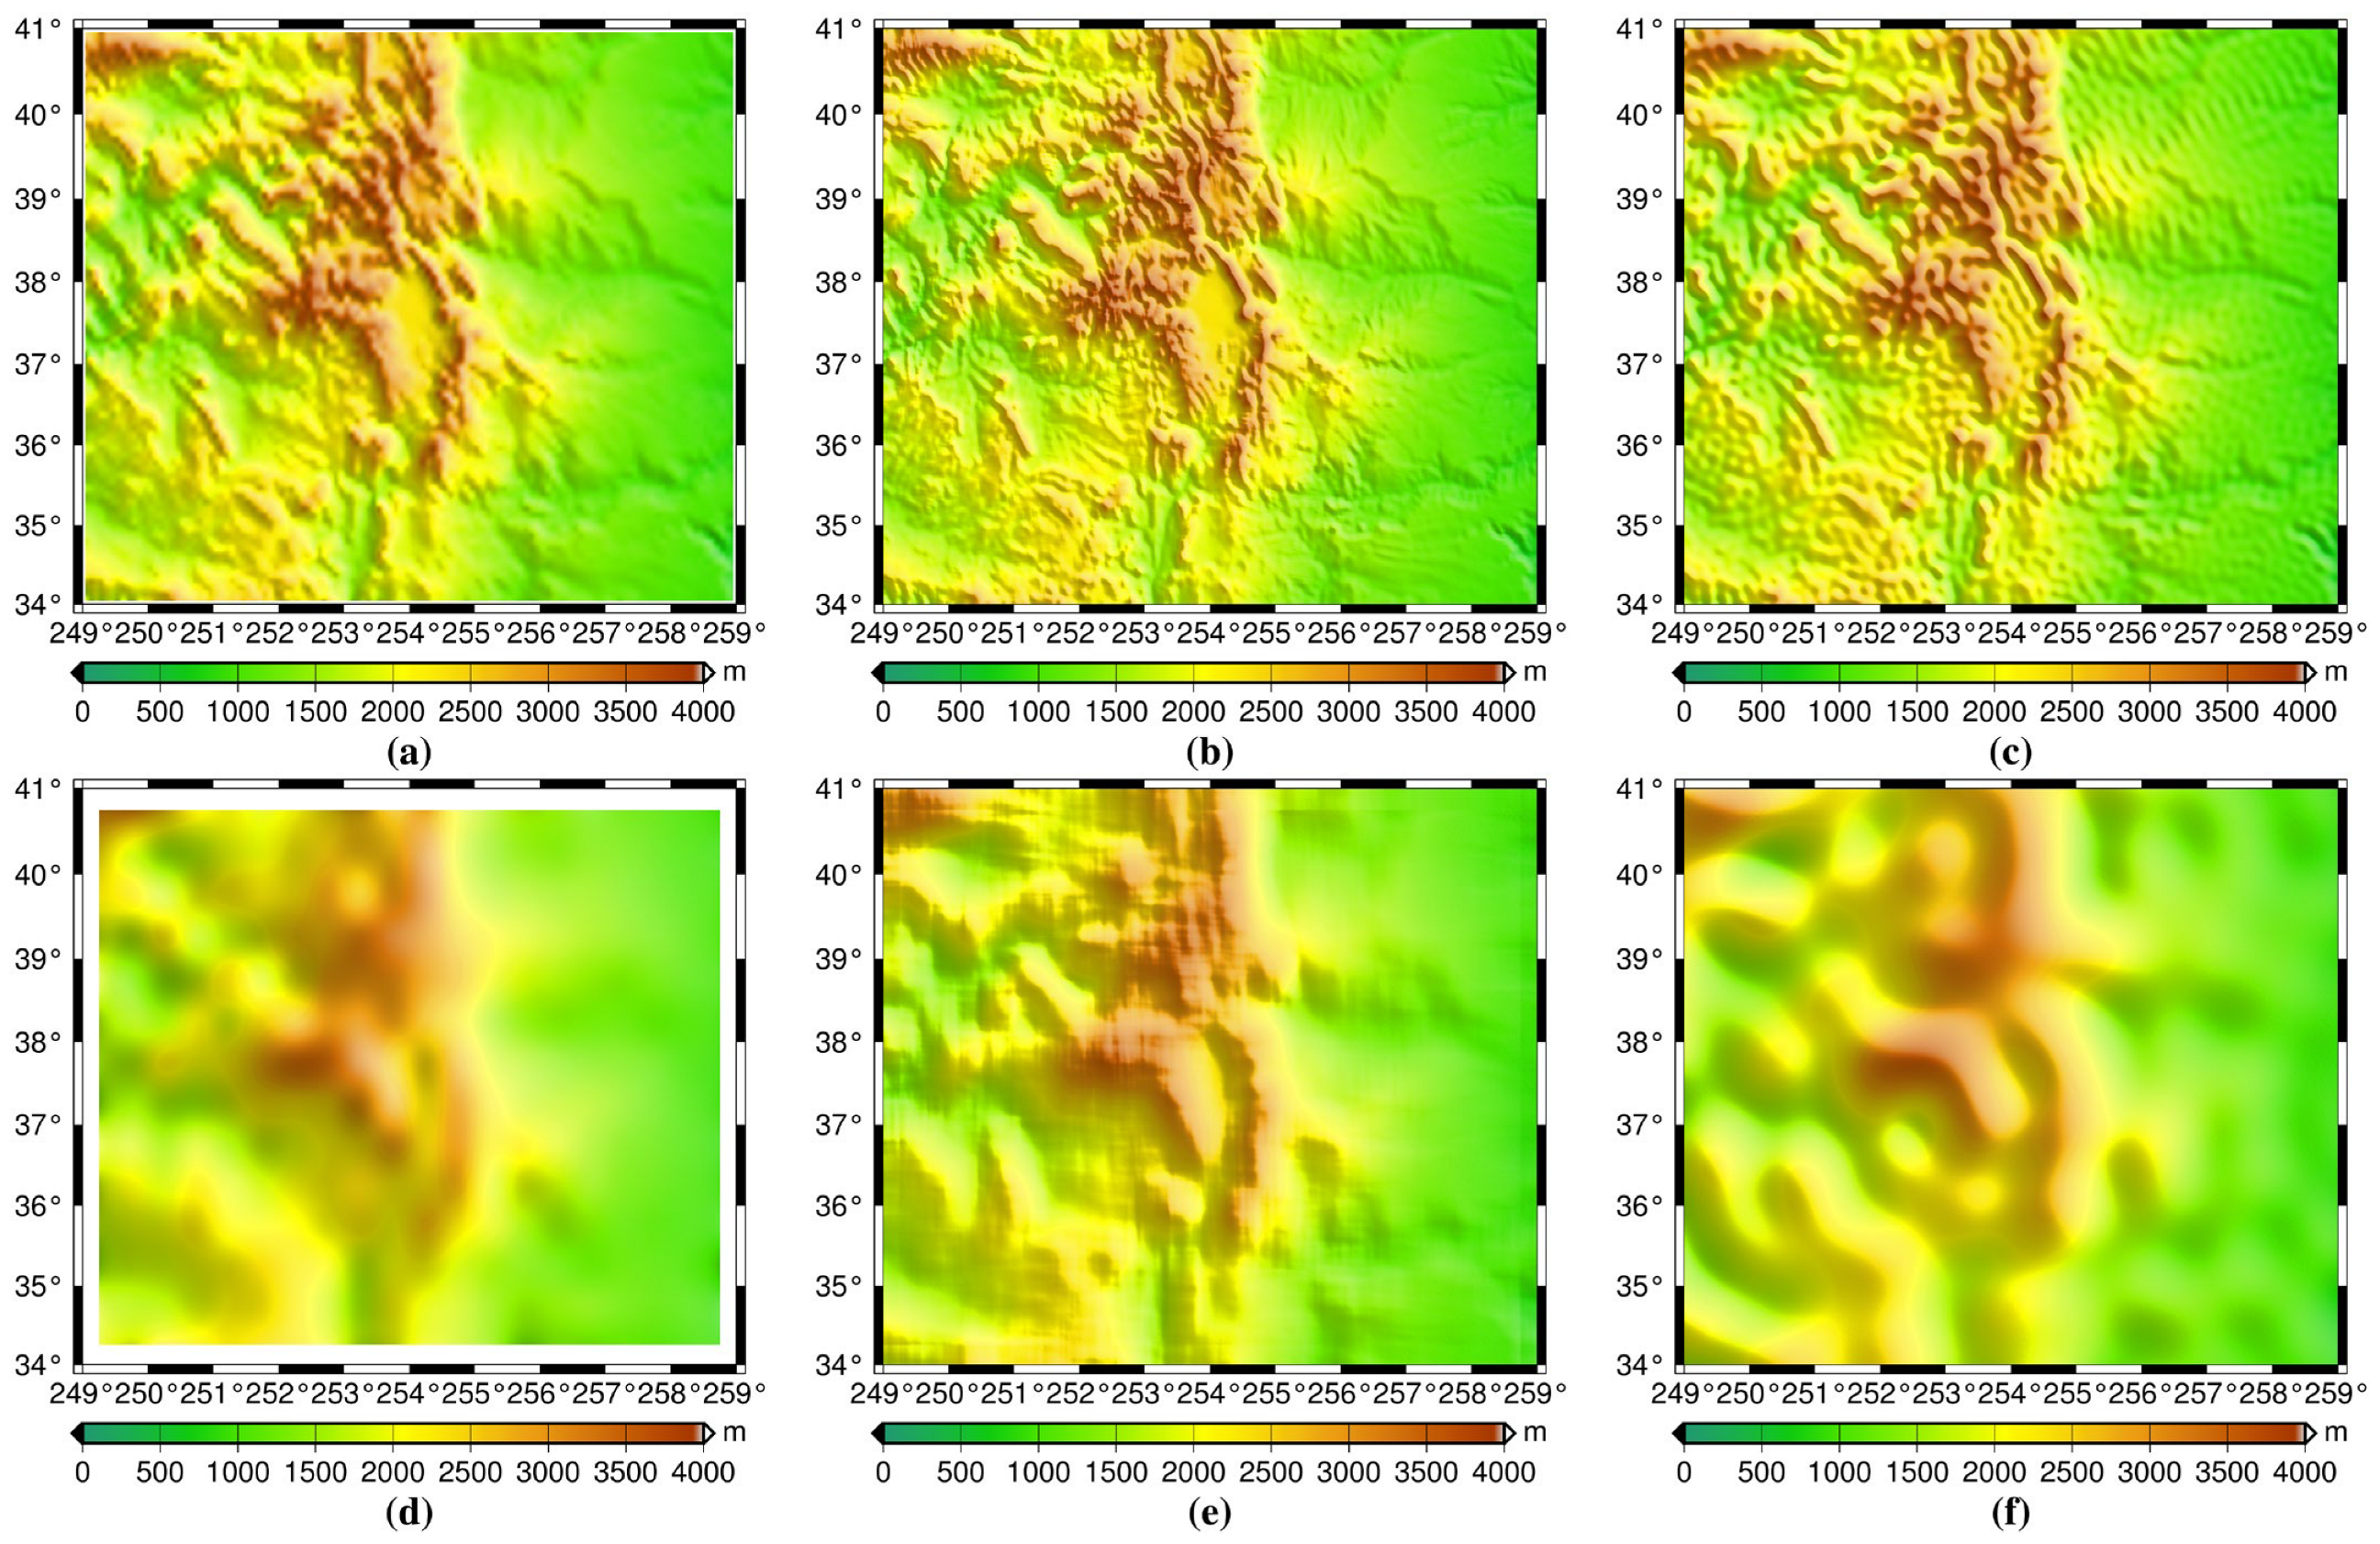
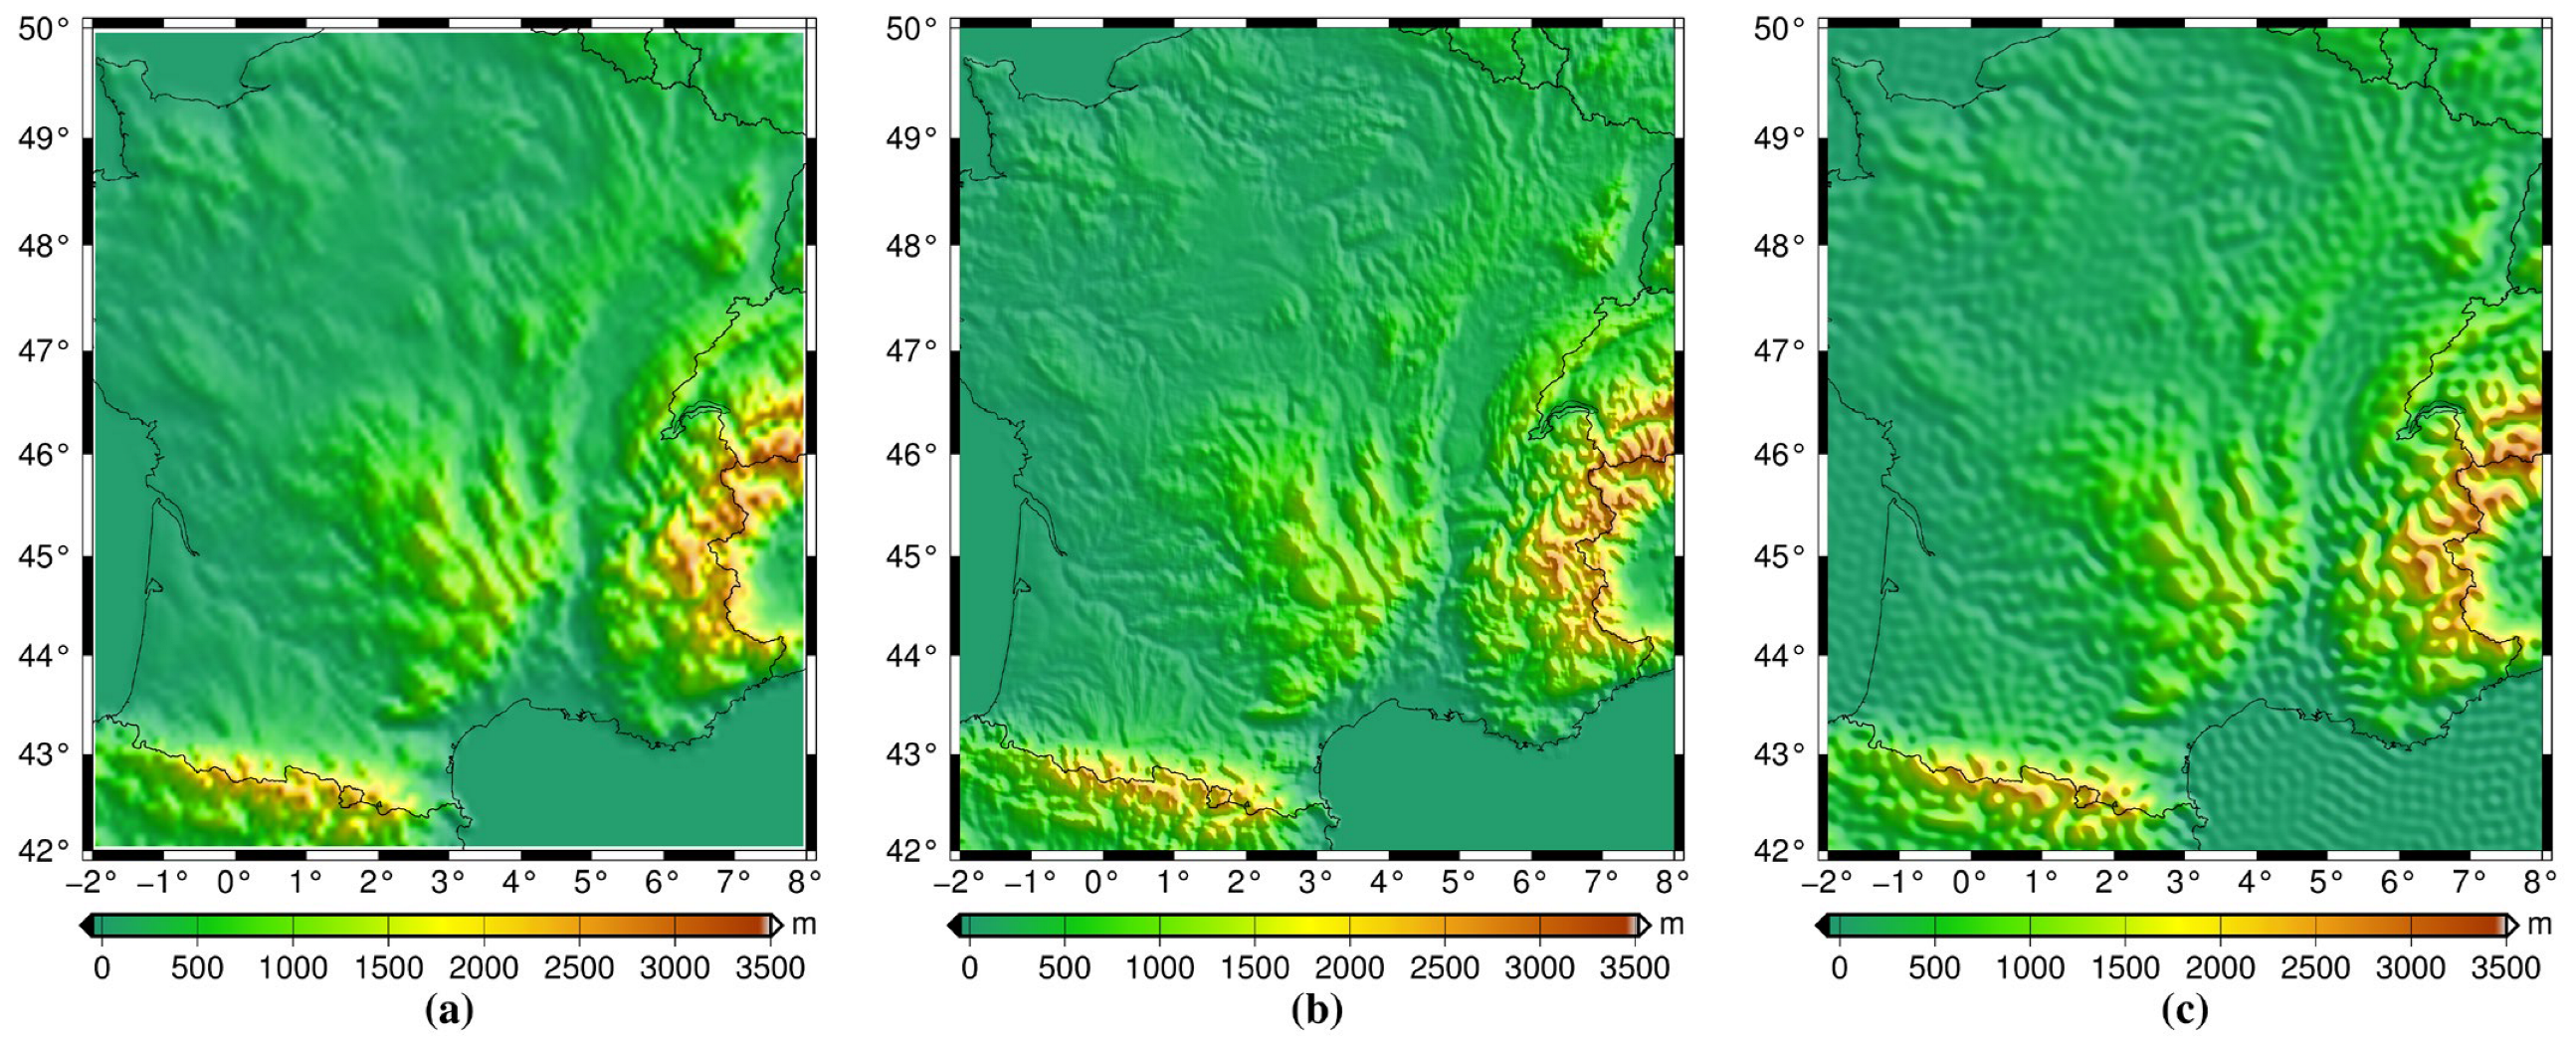
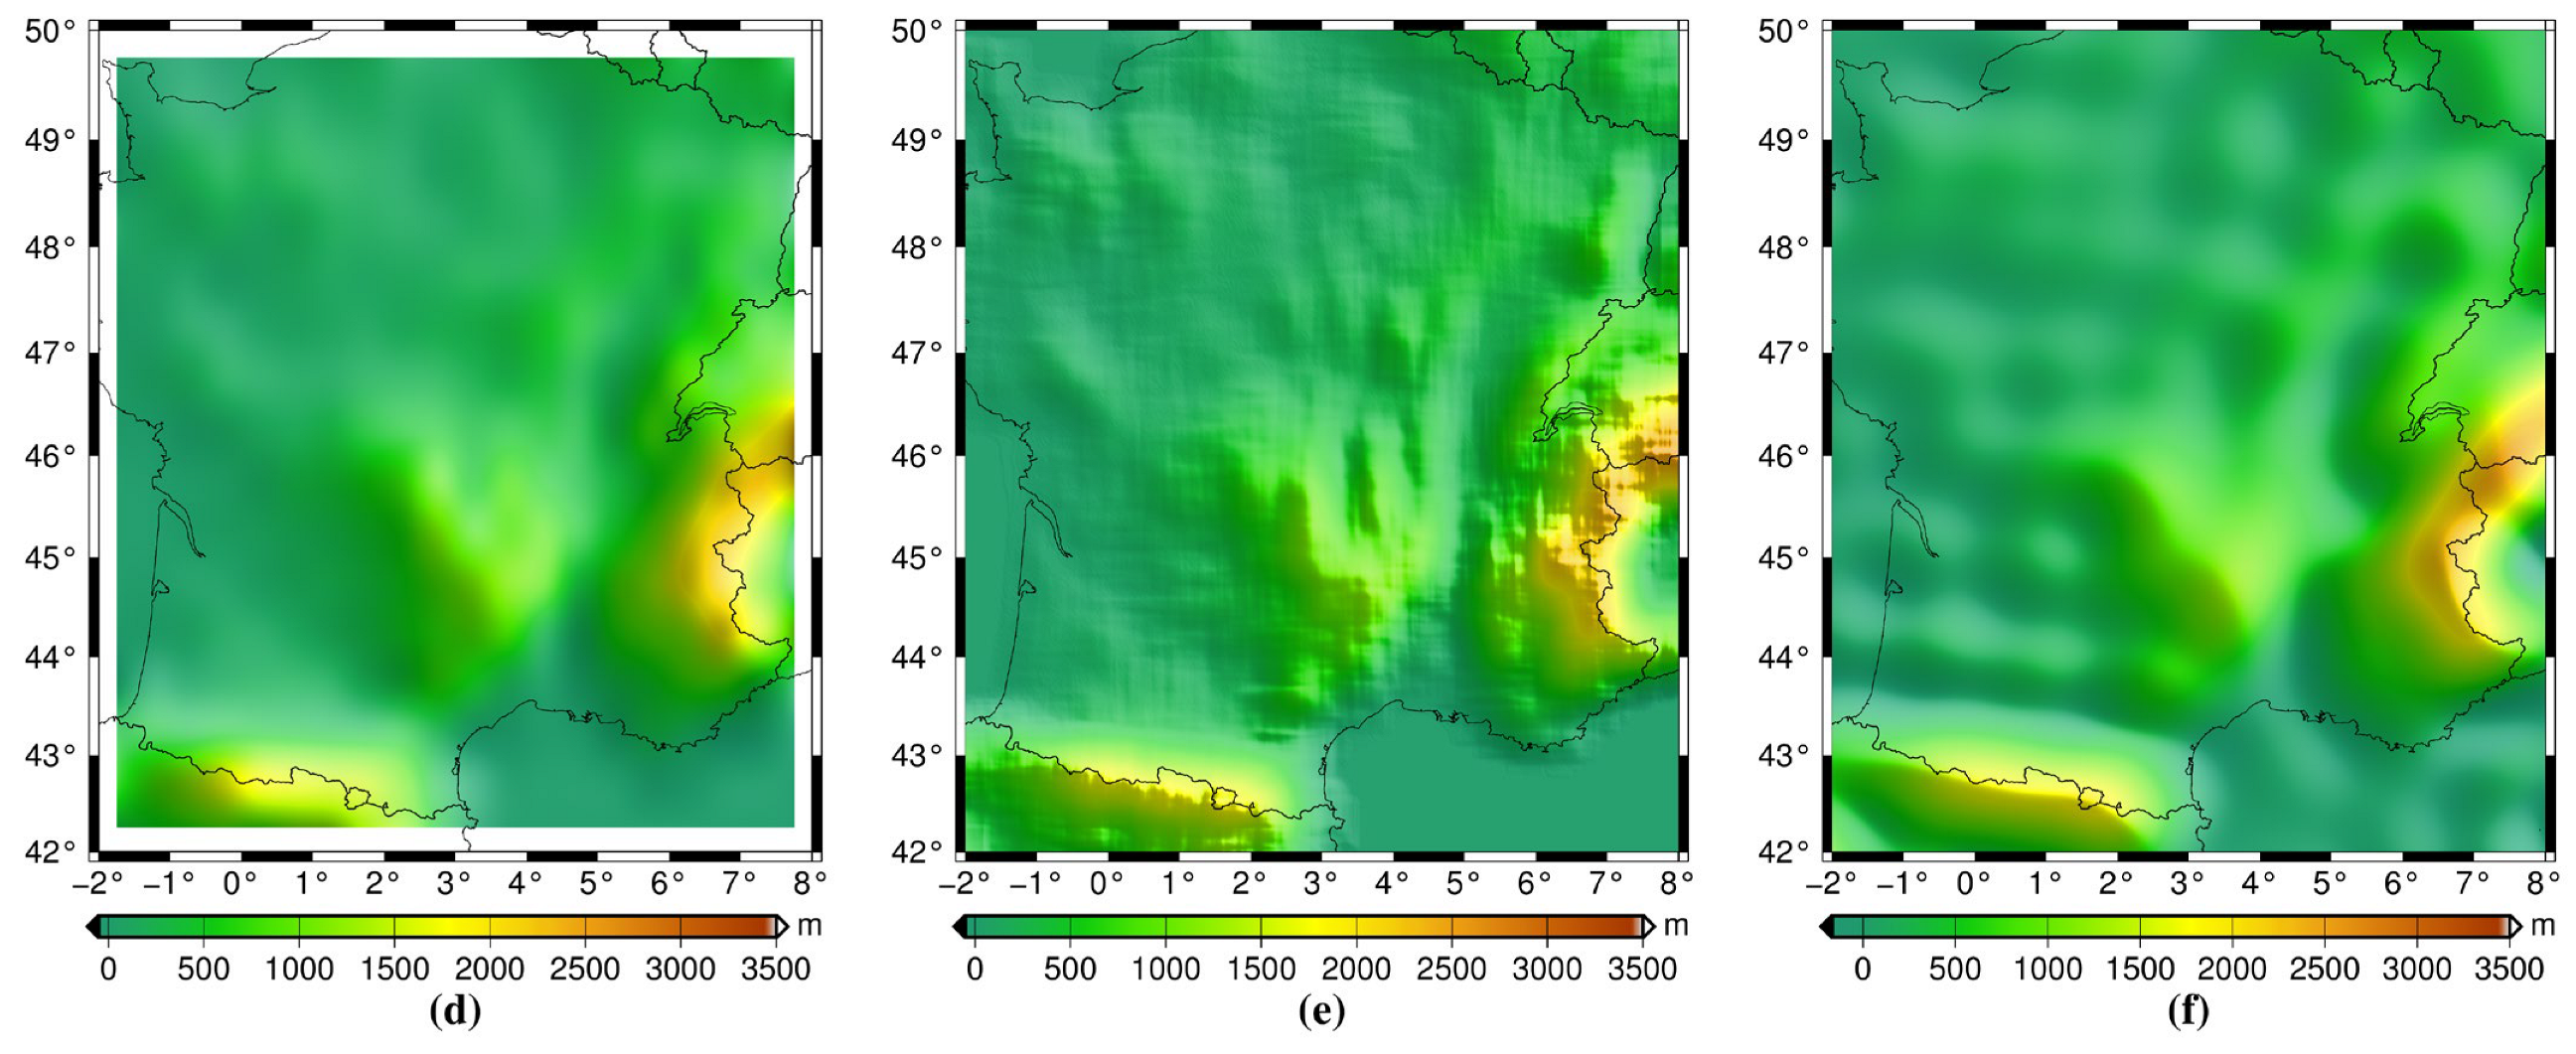
For each test case, two reference topographies with different smoothnesses are computed. The first one assumes that the data are reduced by the contribution of an ultra-high-resolution GGM up to d/o 2160 (e.g., EGM2008 [47], EIGEN-6C4 [48]). The second reference topography assumes that the contribution of the GGM is only complete to d/o 360. Since the resolution of the reference topography is set equal to the half-wavelength resolution of the GGM, i.e., 180 / N with N being the maximum degree of the GGM, the resolution of the reference topography is equal to 5′, corresponding to N = 2160, and 30′, corresponding to N = 360. For the sake of simplicity, we refer to the two reference topographies as REF5′ and REF30′, respectively. Furthermore, if REF5′ is obtained by the DA approach, we then denote it as REF 5 DA . As a consequence, there are six reference topographies for each test area, which are denoted as REF 5 DA , REF 5 MA , REF 5 SH , REF 3 0 DA , REF 3 0 MA , and REF 3 0 SH . The details of obtaining the reference topographies REF 5 SH and REF 3 0 SH are briefly described as follows: First, the original 3″ resolution DEM that provides point heights is spatially averaged to the 15″ resolution DEM; second, the SH coefficients of the 15″ resolution DEM are computed up to degree 43,200 via the surface SH analysis; and finally, the point heights of the reference topographies REF 5 SH and REF 3 0 SH are calculated via the SH synthesis from the estimated SH coefficients to maximum degrees 2160 and 360, respectively. Figure 4 and Figure 5 show three types of reference topographies with two resolutions over the Colorado test area and the Auvergne test area, respectively. For the same resolution, different types of reference topographies display similar long-wavelength topographic features but have different details. The reference topographies obtained by the DA and SH approaches look smoother than those from the MA approach. As expected, REF5′ contains much more details than REF30′ due to its higher resolution. It should be noted that, since the DA reference topography actually presents block-mean heights, its extent is slightly smaller than the other two types of reference topographies.

3.3. RTM Correction Comparison

In this section, various RTM corrections computed using different parameter settings (see Table 1) will be compared and analyzed. RTM corrections to gravity anomalies are calculated on the observation points, while corrections to height anomalies are computed on the 1 × 1 grid nodes of the quasi-geoid computation area (see Section 3.1 and Figure 3).

3.3.1. DEM Resolution Combination Effect on RTM Corrections

First, let us see how large the effect of a combined use of a dense DEM and a coarse DEM instead of fully using the dense DEM on RTM correction computation would be.
In this experiment, as illustrated in Table 1, the inner zone always uses the 3″ resolution DEM, while the resolution of the DEM used in the outer zone is selected as 3″, 30″, and 1′ to 5′. The integration radius r1 and r2 are fixed at 50 km and 167 km, respectively. The RTM corrections obtained by fully using the 3″ resolution DEM are taken as references, and the results of other scenarios are evaluated in terms of the RMS of the differences with respect to the reference (see Figure 6).
Figure 6 shows that the RMS of gravity anomaly differences ranges from about 1 to 20 μGal in both test areas. If the DEM resolution for the outer zone is equal to or smaller than 1′, the RMS difference is less than 3 μGal. The RMS of height anomaly differences ranges from about 0.1 to 8.0 mm. If the resolution of the DEM for the outer zone is equal to or smaller than 1′, the RMS difference is less than 0.5 mm. The DEM resolution combination effect looks similar regardless of the resolution of the reference topography. The lower the resolution of the DEM used in the outer zone, the larger the RMS difference is.
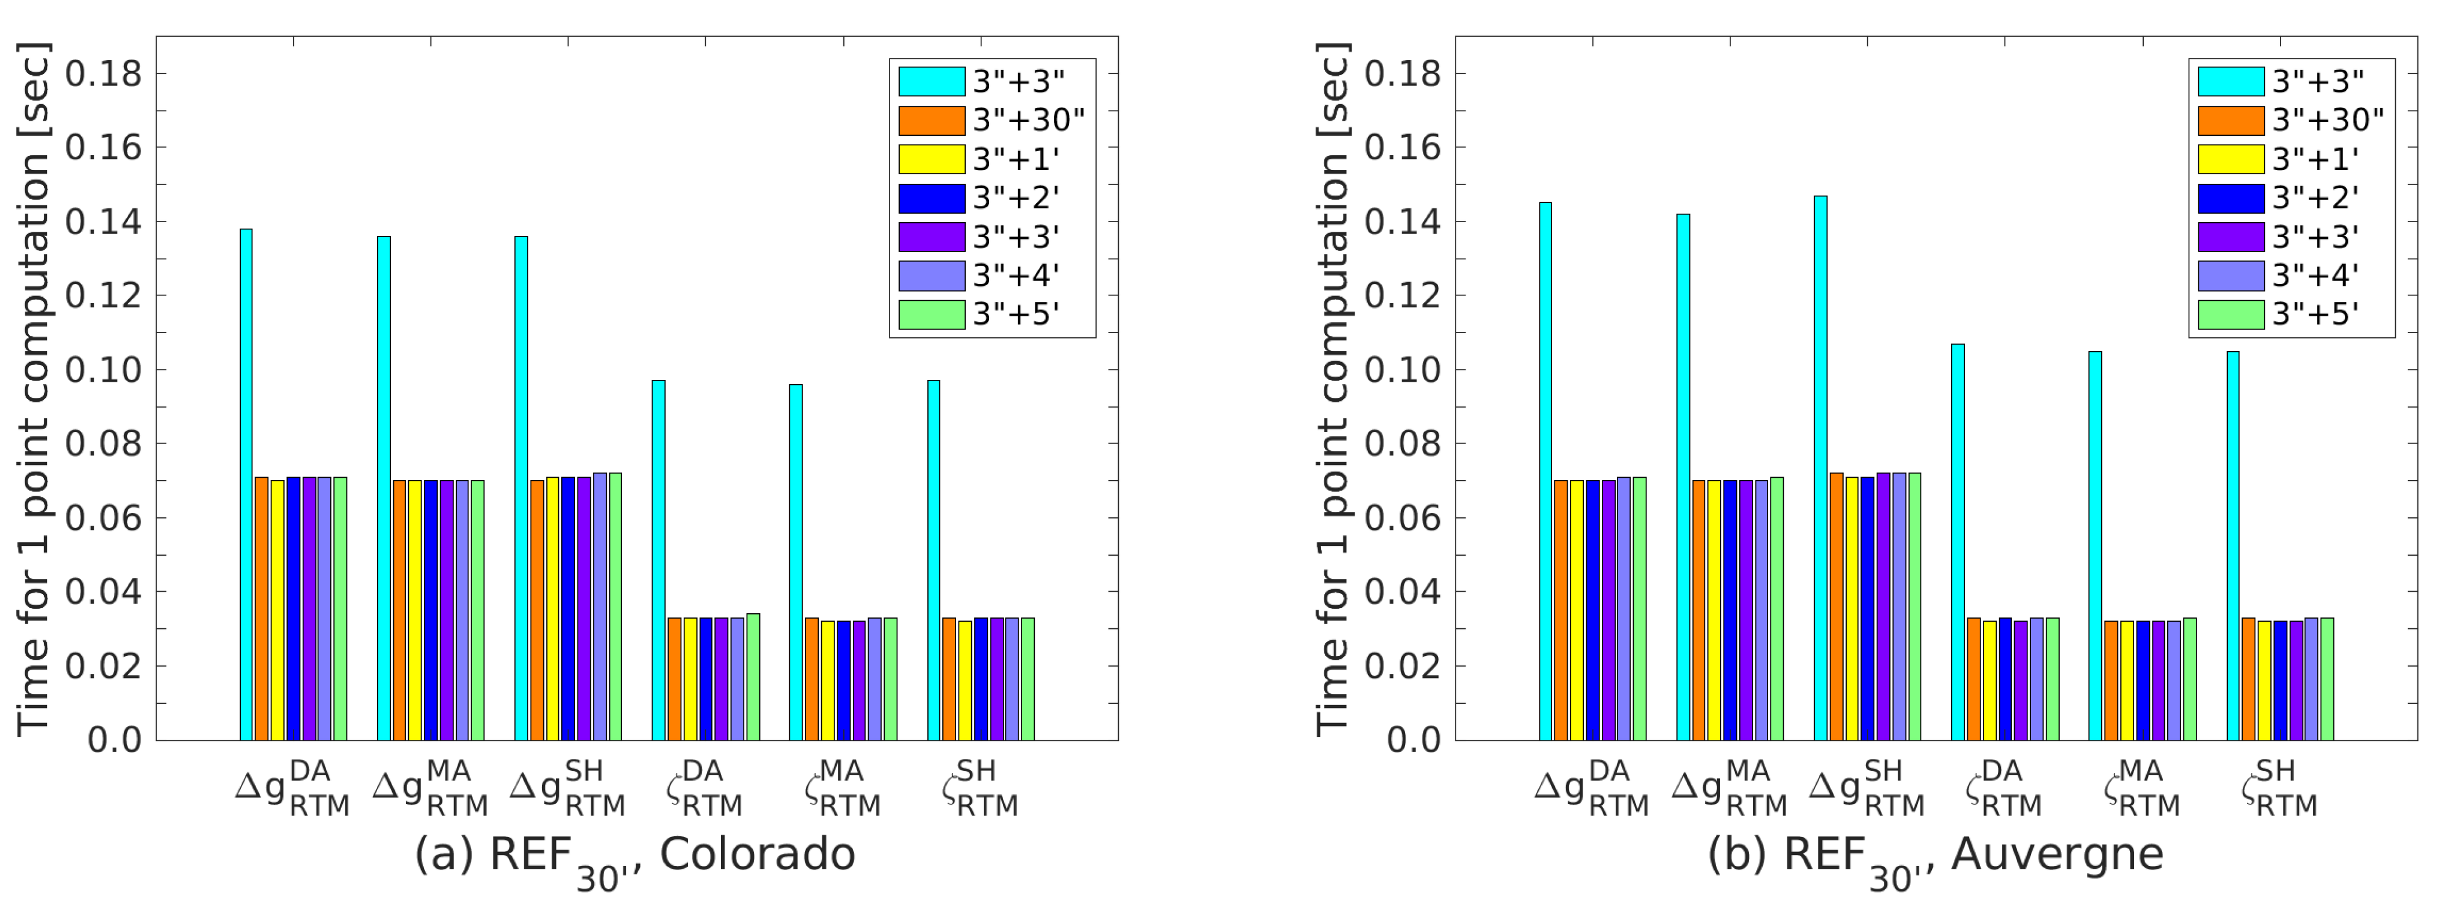
Figure 7 shows the computational time for 1 point computation for different DEM resolution combination scenarios when using REF30′ in the two test areas. It can be seen that, in comparison with fully using the 3″ resolution DEM, the replacement of the 30″ resolution DEM in the outer zone can improve the numerical efficiency by about two times for gravity anomalies and three times for height anomalies in both test areas. However, the use of coarser DEMs cannot further improve efficiency but will increase the RMS difference. The possible reason is given as follows: Although the number of mass elements (i.e., tesseroids) would be reduced by using a coarser DEM, the tesseriodal approach applied to those tesseroids having the same center but different sizes might be different because the selection of the tesseroidal approach actually depends on the so-called distance-size ratio. This implies that, for those tesseroids having the same distance to the computation point, the tesseroids with a larger size might be evaluated by a more time-consuming tesseroidal approach than those with a smaller size [30]. It should be noted that similar results are obtained when using REF5′, and thus they are not presented here.
According to the above numerical results, the combination of the 3″ resolution DEM and the 30″ resolution DEM is preferred regarding both accuracy and efficiency. And this combination scenario will be applied to the rest of the numerical experiments.

3.3.2. Integration Radius Effect on RTM Corrections

The integration radius effect consists of the effect of the integration radius r1 for the inner zone and the effect of the integration radius r2 for the outer zone (see Figure 2). Let us first see the r2 effect.
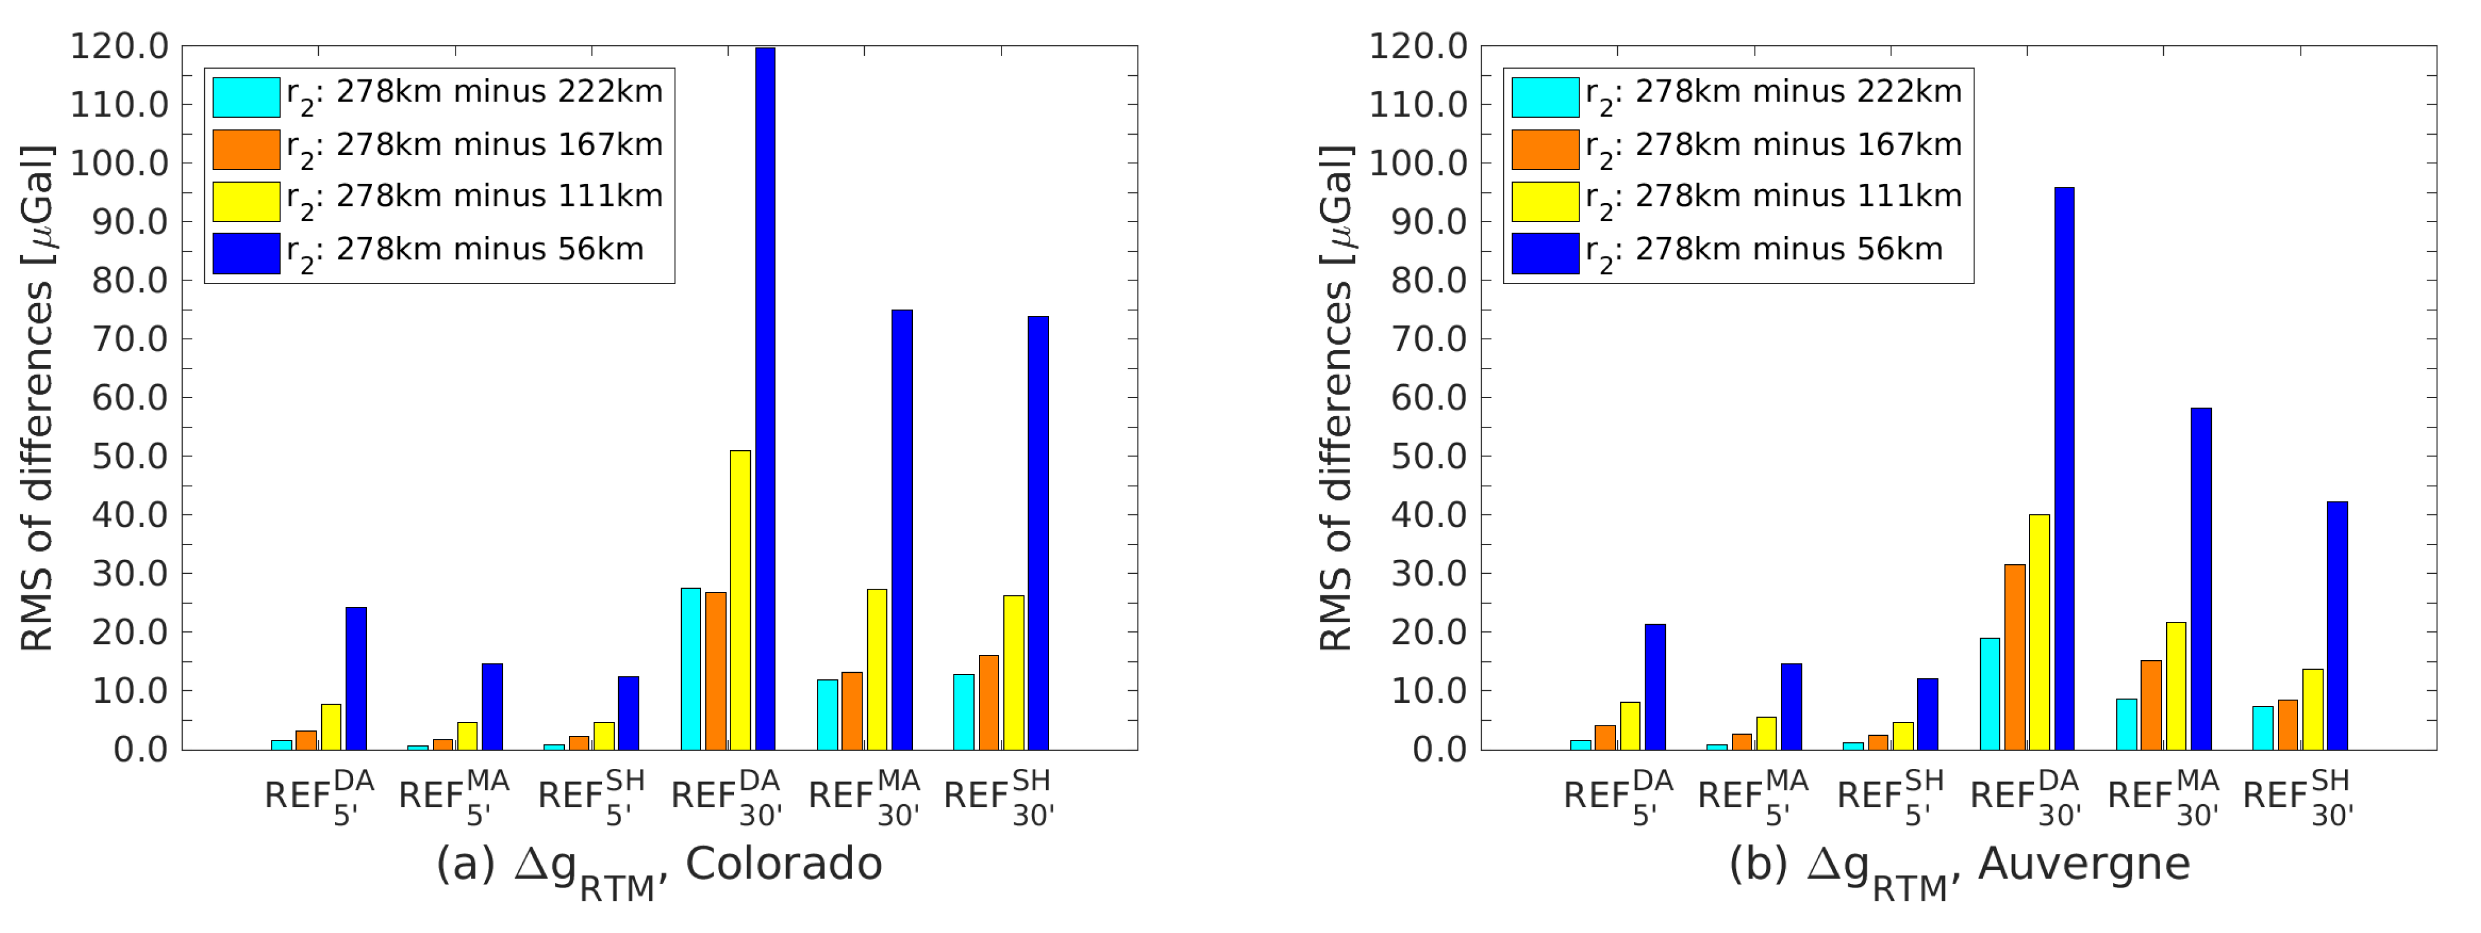
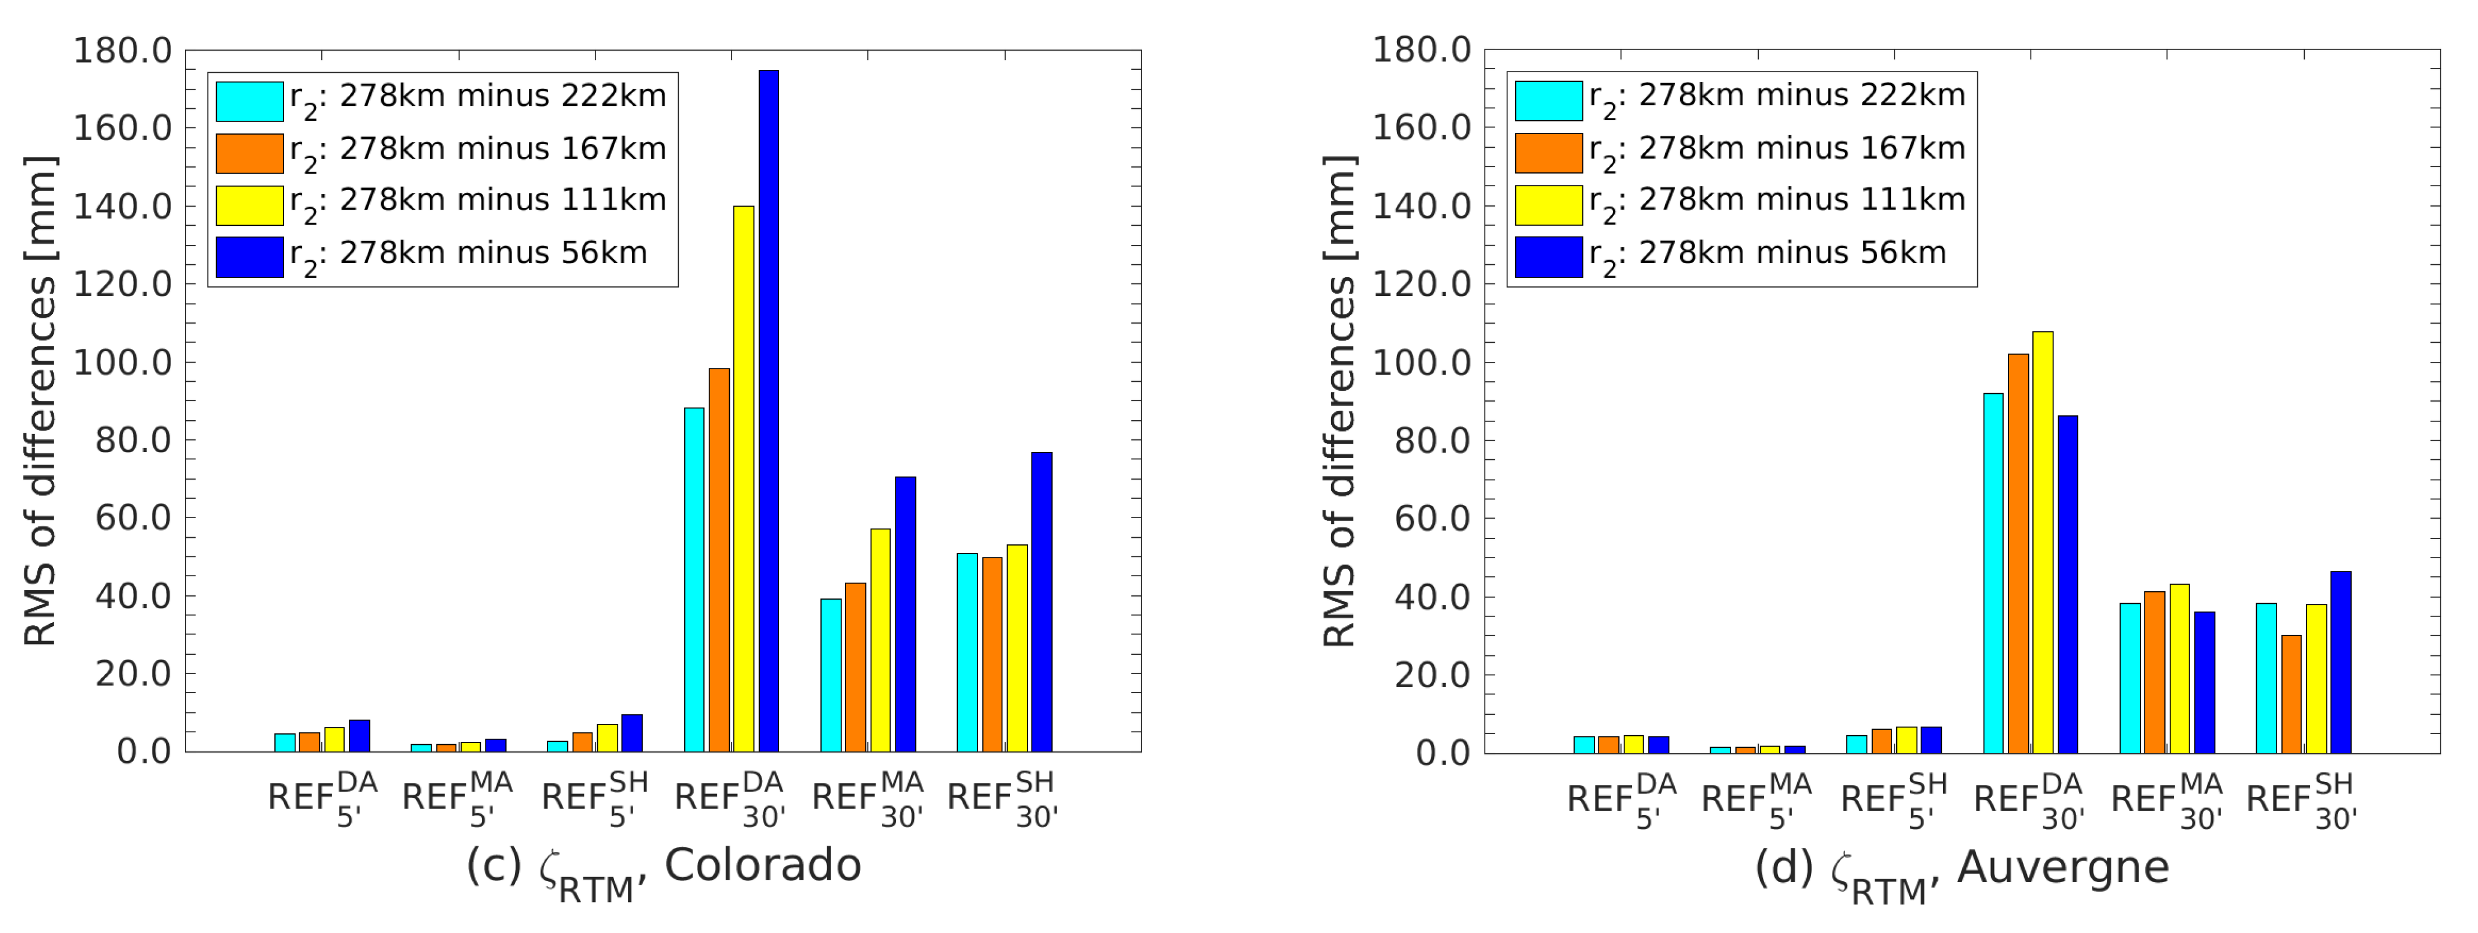
In this experiment, the value of r1 is fixed at 50 km, while the value of r2 is selected at 56, 111, 167, 222, and 278 km, approximately corresponding to 0.5°, 1.0°, 1.5°, 2.0°, and 2.5°, respectively. The results obtained by using r2 = 278 km are taken as references, as we assume that the larger the value of r2, the higher the accuracy of the computed RTM corrections. The results of other scenarios are evaluated in terms of the RMS of the differences with respect to the reference (see Figure 8). An obvious feature that can be seen from Figure 8 is that the r2 effect is much larger when using REF30′ than when using REF5′ in both test areas. This is due to the fact that the residual terrain contains more long-wavelength signal in the former case, and hence the contributions from distant tesseroids are still significant.
In the case of using REF5′, the RMS values of differences are generally within 25 μGal for gravity anomalies and within 1 cm for height anomalies. The RMS difference becomes much smaller if the value of r2 is chosen to be equal to or larger than 111 km. In the case of using REF30′, the RMS of differences ranges from about 7 to 120 μGal for gravity anomalies and from about 3 to 17.5 cm for height anomalies. Definitely, the r2 effect is significant in this case, especially for the height anomaly. And thus, the value of r2 should be selected with caution when using REF30′. We can also infer that more attention should be paid to choosing the value of r2 when using a satellite-derived GGM whose maximum degree is smaller than 360 in the RCR procedure because the corresponding resolution of reference topography is lower than 30′.
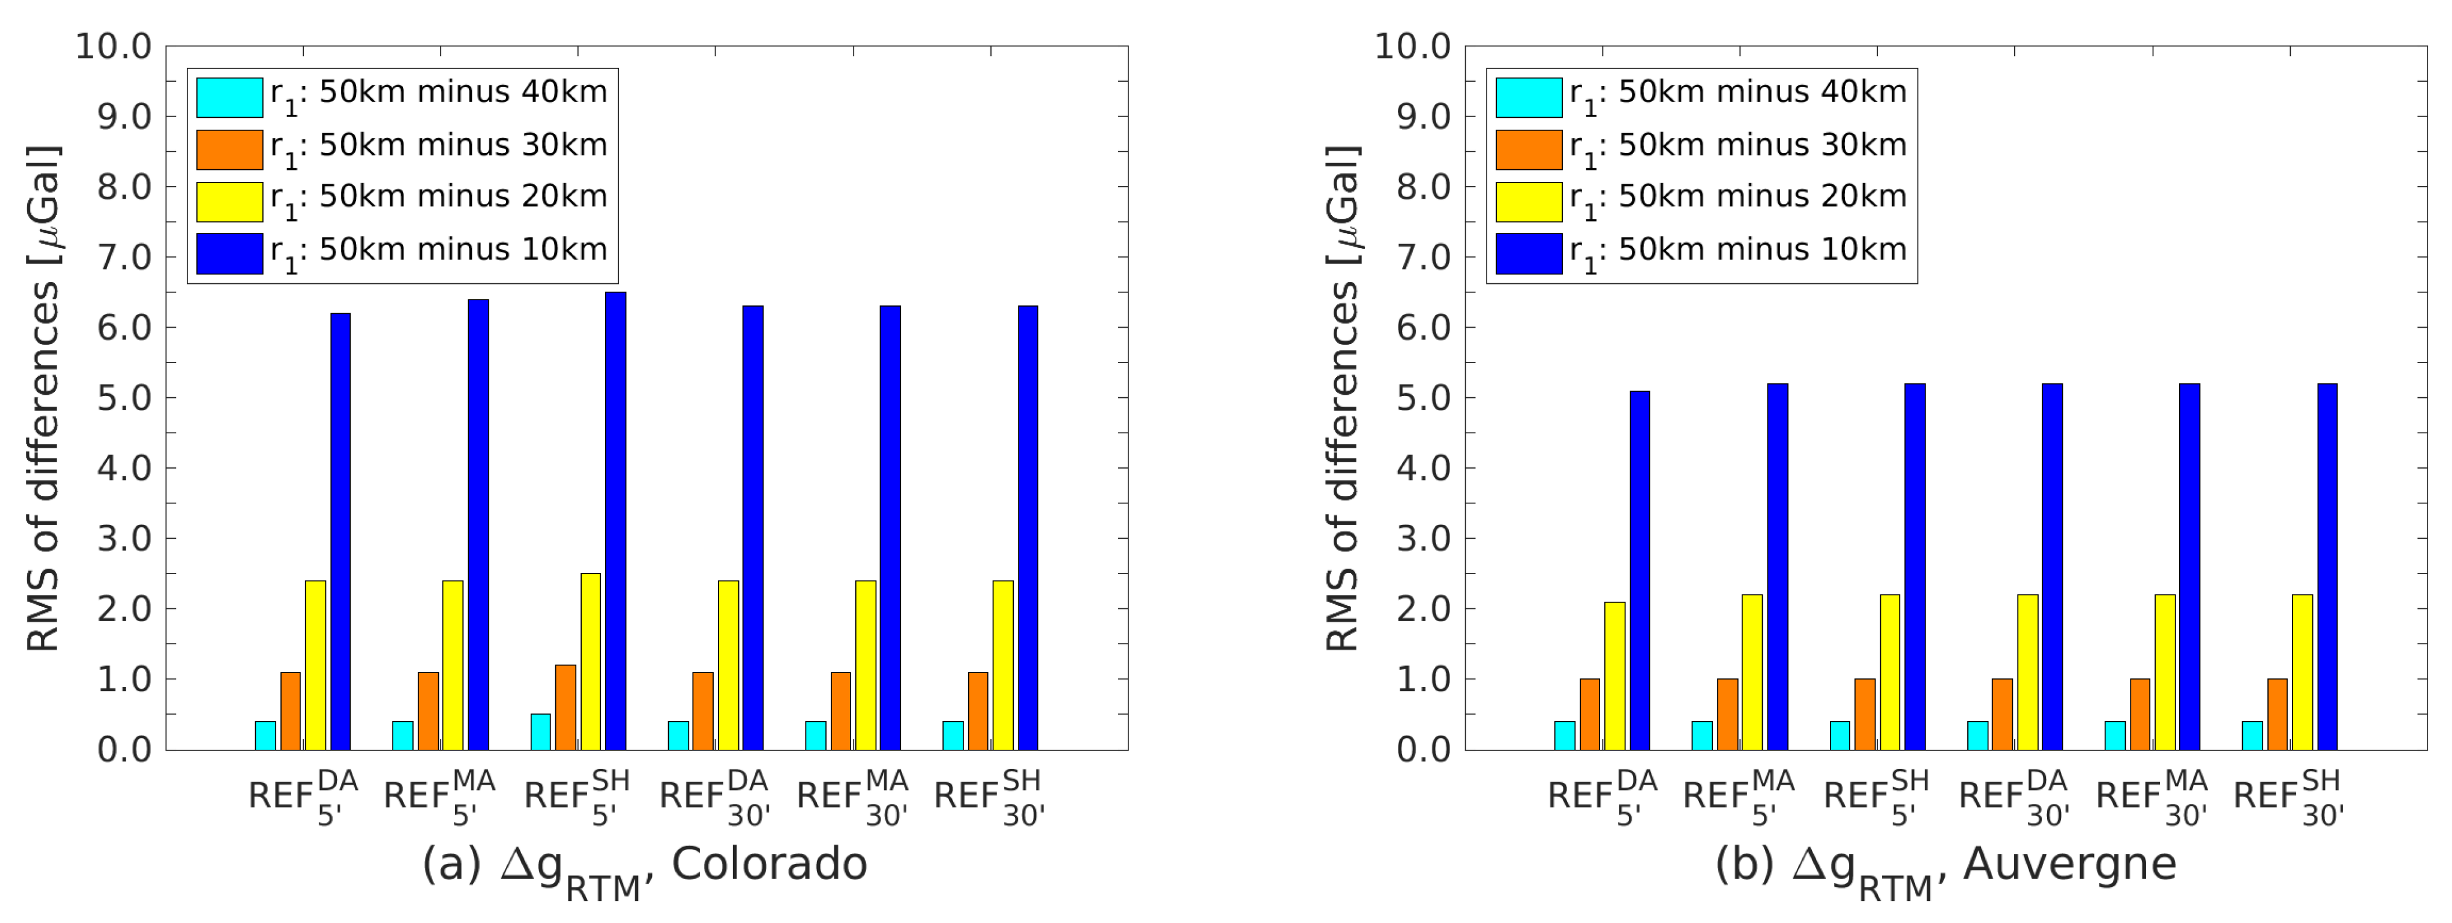
We then consider the r1 effect. In this experiment, the value of r2 is chosen as 167 km for REF5′ and 278 km for REF30′ based on the numerical results regarding the r2 effect, while the value of r1 varies from 10 to 50 km with a step of 10 km (see Table 1). The results computed by using r1 = 50 km are taken as references, and the results of other scenarios are evaluated in terms of the RMS of the differences with respect to the reference (see Figure 9). Because the computed RTM corrections to height anomalies are almost the same for the five selected values of r1, we only present RTM corrections to gravity anomalies here. It is clear that the RMS values of differences are within 6.5 μGal in the two test areas, demonstrating that the r1 effect is quite small in computing RTM corrections to gravity anomalies. If the value of r1 is equal to 20 km or larger, the RMS values of differences are less than 2.5 μGal in the Colorado test area and 2.0 μGal in the Auvergne test area. From the two experiments, it is easy to see that the r2 effect is sensitive to the resolution of the reference topography but not to the r1 effect.

3.3.3. Reference Topography Effect on RTM Corrections

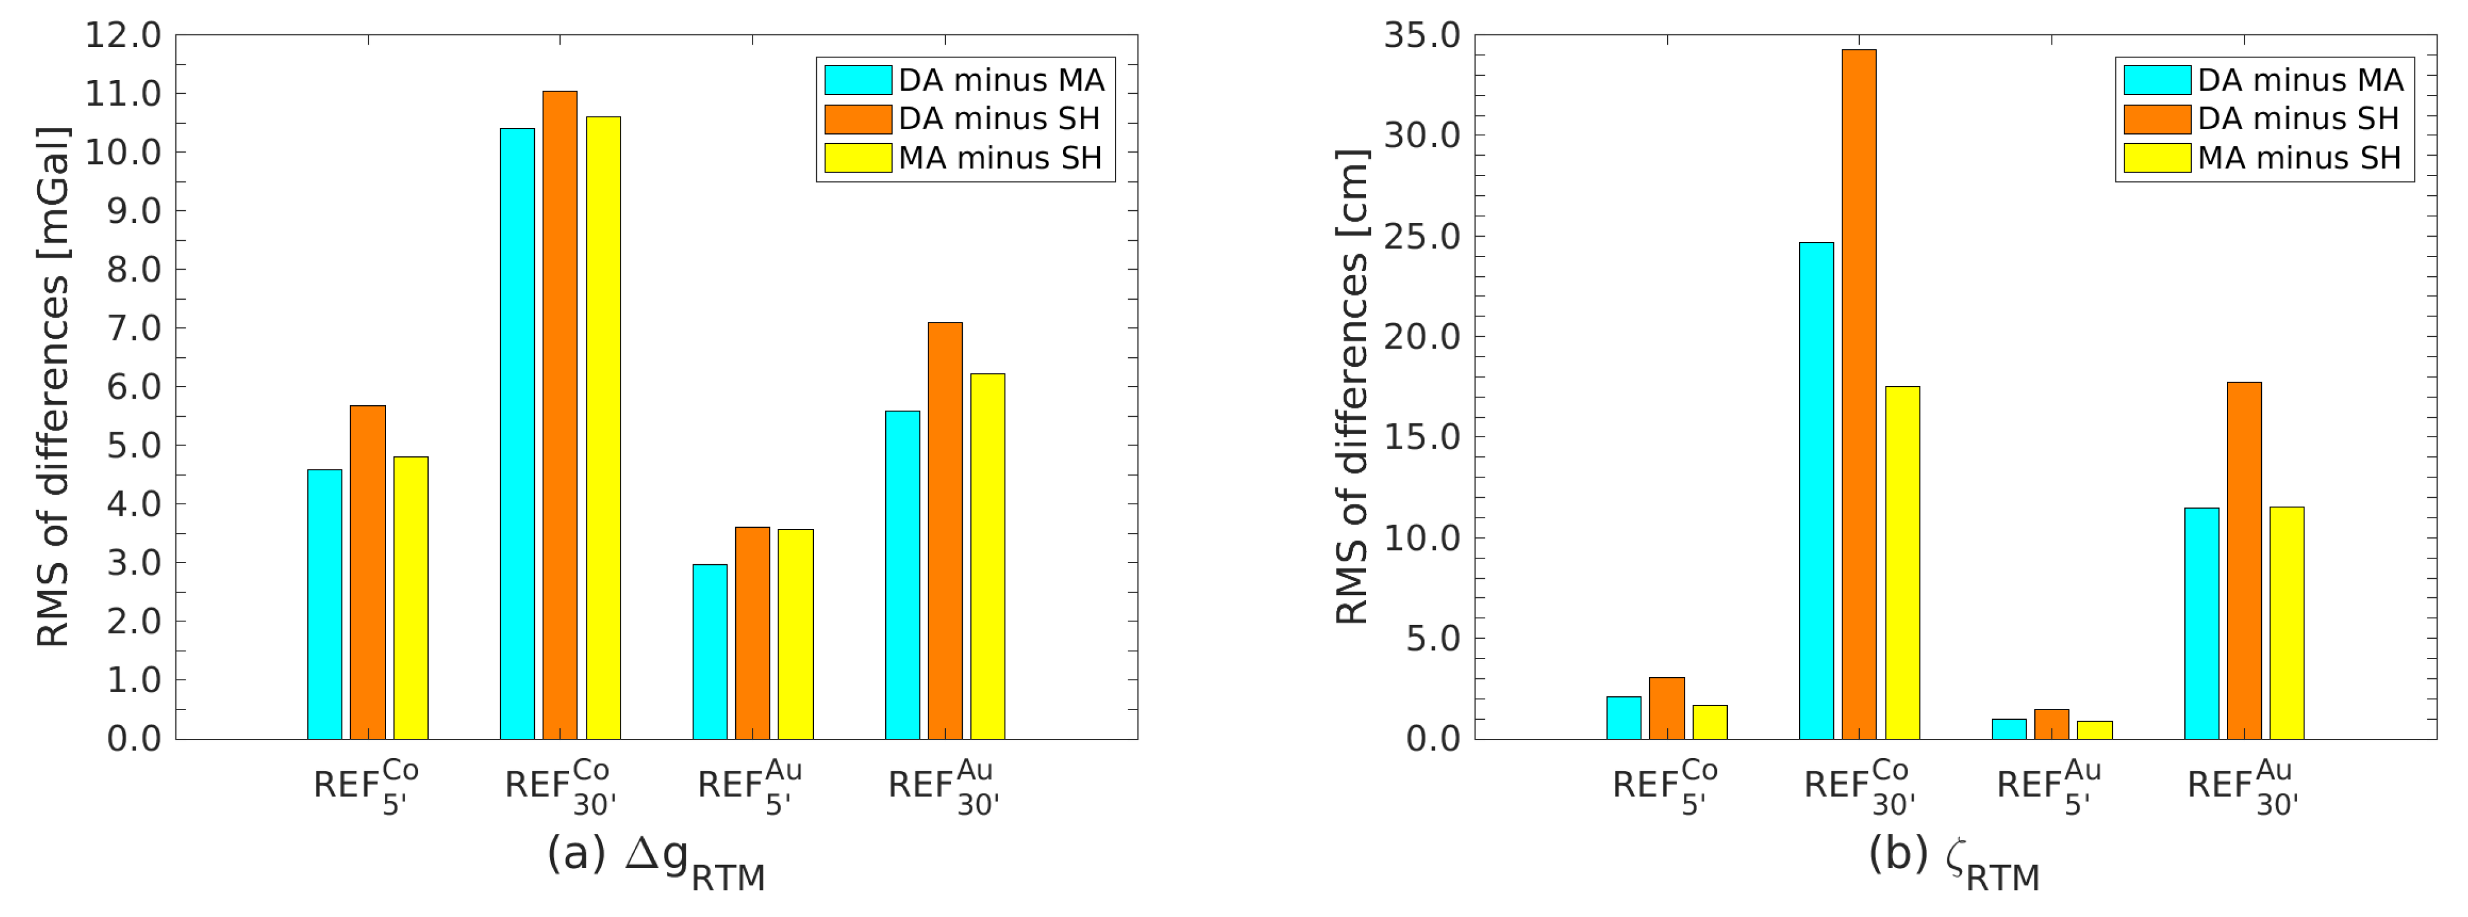
As shown in Figure 4 and Figure 5, the details of the reference topographies obtained from the DA, MA, and SH approaches are different. Here we show an inter-comparison of RTM corrections computed by three types of reference topographies. On the basis of previous numerical results, the value of r1 is fixed to be 30 km (see Figure 9), while the value of r2 is chosen as 167 km in the case of using REF5′ and 278 km in the case of using REF30′ (see Figure 8). The RMS values of differences are displayed in Figure 10. As can be seen, the RMS of differences ranges from about 3 to 11 mGal for gravity anomalies and from about 1 to 34 cm for height anomalies. This clearly indicates that the reference topography effect is quite large on the RTM correction computation, especially for height anomalies. Moreover, the RMS values of differences corresponding to REF5′ are much smaller than those for REF30′ in both test areas, implying that the magnitude of the reference topography effect depends on the resolution of the reference topography.
From the above experiment, the fact that the RTM corrections computed by different types of reference topographies deviate much from each other has been verified. However, this experiment does not provide any information about which reference topography is best for gravity anomalies. One commonly used way to assess this issue is to remove the contributions of both GGM and RTM from the observed gravity anomalies and then analyze the resulting residual gravity anomalies for smoothness. Here we choose the GGM as the EIGEN-6C4 model. When using REF5′ and REF30′, the contribution of the EIGEN-6C4 model is computed up to d/o 2160 and 360, respectively. The statistics of residual gravity anomalies are presented in Table 2 for the Colorado test case and Table 3 for the Auvergne test case. Both tables clearly show that the use of the SH reference topography is able to yield the most smooth residual gravity anomalies in terms of both SD and RMS, followed by the MA reference topography. From this perspective, the SH reference topography performs the best for gravity anomaly reduction.
Because our final goal is to determine a local quasi-geoid model, the next issue of interest is which type of reference topography is more suited for quasi-geoid modeling. In the following, another two experiments will be conducted to investigate this issue.

3.4. Local Quasi-Geoid Model Comparison

In this study, the local quasi-geoid computation uses the RCR technique, the RTM method, and the Stokes integral. Assuming that the DA reference topography is employed, the computation and validation steps are briefly described as follows:
① The reference gravity anomalies Δ g GGM N are computed at the observation points by a selected GGM up to d/o N and then subtracted from the observed gravity anomalies Δ g obs , yielding Δ g obs Δ g GGM N ;
② The RTM corrections to gravity anomalies Δ g RTM DA are computed at the observation points and then subtracted from Δ g obs Δ g GGM N , yielding the residual gravity anomalies Δ g res DA = Δ g obs Δ g GGM N Δ g RTM DA ;
③ The irregularly distributed residual gravity anomalies are interpolated at the grid nodes of the quasi-geoid computation area by bicubic spline interpolation, yielding the gridded residual gravity anomalies. They are then transformed into the gridded residual height anomalies ζ res DA by using the Stokes’s integral with modified kernels [49] (i.e., the low degree terms of the Stokes kernel are removed), assuming that the contribution from the gravity data far away from the computation point is negligible after removing the GGM contribution;
④ The RTM corrections to height anomalies ζ RTM DA and the reference height anomalies ζ GGM N derived from the GGM are calculated at the grid nodes and then added to the gridded residual height anomalies, yielding the local quasi-geoid model ζ DA = ζ GGM N + ζ RTM DA + ζ res DA ;
⑤ The computed local quasi-geoid model is finally validated by comparing the interpolated height anomalies to the observed values at the given GNSS/leveling benchmarks. The standard deviation (SD) of differences is used to measure the accuracy of the local quasi-geoid model.
In the following two experiments, the GGM is directly selected as EIGEN-6C4 without additional comparisons because the selection of an optimal GGM is out of the scope of this study. Since the GSVS17 GNSS/leveling benchmarks actually provide geoid heights, they are transformed into height anomalies via the equation ζ = N Δ g SB γ ¯ H , with Δ g SB the simple Bouguer gravity anomaly, γ ¯ the mean normal gravity, and H the orthometric height [1,2,50,51], before validating the local quasi-geoid model.
The first experiment uses the RTM corrections computed by REF30′ for quasi-geoid modeling. As demonstrated by previous numerical experiments, the choice of the integration radius r2 causes large RTM correction changes when using REF30′. In addition to considering the effect of using different types of reference topographies, the effect of using different values of r2 is also taken into account in this experiment. The value of r1 is fixed to be 30 km for all computations, while the selected values of r2 are the same as those used in Section 3.3.2 (see also Figure 8). The results of validating various local gravimetric quasi-geoid models by GNSS/leveling benchmarks are presented in Figure 11.
In the Colorado test area, while using the same type of reference topography, the local quasi-geoid model obtained by using r2 = 222 km has a smaller SD value than those obtained from the other values of r2. Using the SH reference topography provides local quasi-geoid models with a smaller SD value, followed by the models obtained by using the MA reference topography.
In the Auvergne test area, while using the MA and SH reference topographies (i.e., REF 3 0 MA and REF 3 0 SH ), using larger values of r2 (e.g., 222 and 278 km) can yield local quasi-geoid models with a smaller SD value. However, this rule does not work well in the case of using the DA reference topography (i.e., REF 3 0 DA ). In general, the use of REF 3 0 MA and REF 3 0 SH can produce more accurate local quasi-geoid models than those obtained by using REF 3 0 DA .
Table 4 and Table 5 summarize the validation results for various local quasi-geoid models, including the ones obtained purely from the EIGEN-6C4 model (denoted as the GGM-based model), the ones obtained as a combination of the GGM and RTM (denoted as the GGM+RTM-based model), and the ones shown in Figure 11 using the optimal values of truncation degree and r2 (denoted as the final model). It is easy to see that adding the RTM contribution to the GGM contribution can significantly improve quasi-geoid models in terms of SD, except in the case of using the reference topography REF 3 0 DA . This implies that the reference topography REF 3 0 DA is not a proper choice in this case, and it would introduce additional errors into RTM corrections. For the GGM+RTM-based models, the use of the reference topography REF 3 0 SH provides better quasi-geoid models than those obtained by using REF 3 0 MA , indicating that spectral inconsistencies between the GGM and RTM are well reduced by using REF 3 0 SH . Therefore, the SH reference topography is highly recommended for high-frequency GGM augmentation [52,53]. For the final quasi-geoid models presented in Figure 11, the addition of residual height anomalies, which are transformed from the Stokes’s integral, indeed improves the quasi-geoid models in comparison with the GGM+RTM-based models. In the Colorado test area, the quasi-geoid model with the smallest SD is obtained by using REF 3 0 SH . However, REF 3 0 MA yields the best model in the Auvergne test area. Although REF 3 0 SH performs the best in GGM augmentation, either REF 3 0 SH or REF 3 0 MA is able to yield an accurate local quasi-geoid model. To this end, we may conclude that the MA and SH reference topographies are preferred in local quasi-geoid determination when using REF30′, while the value of r2 is better at 222 km or larger.
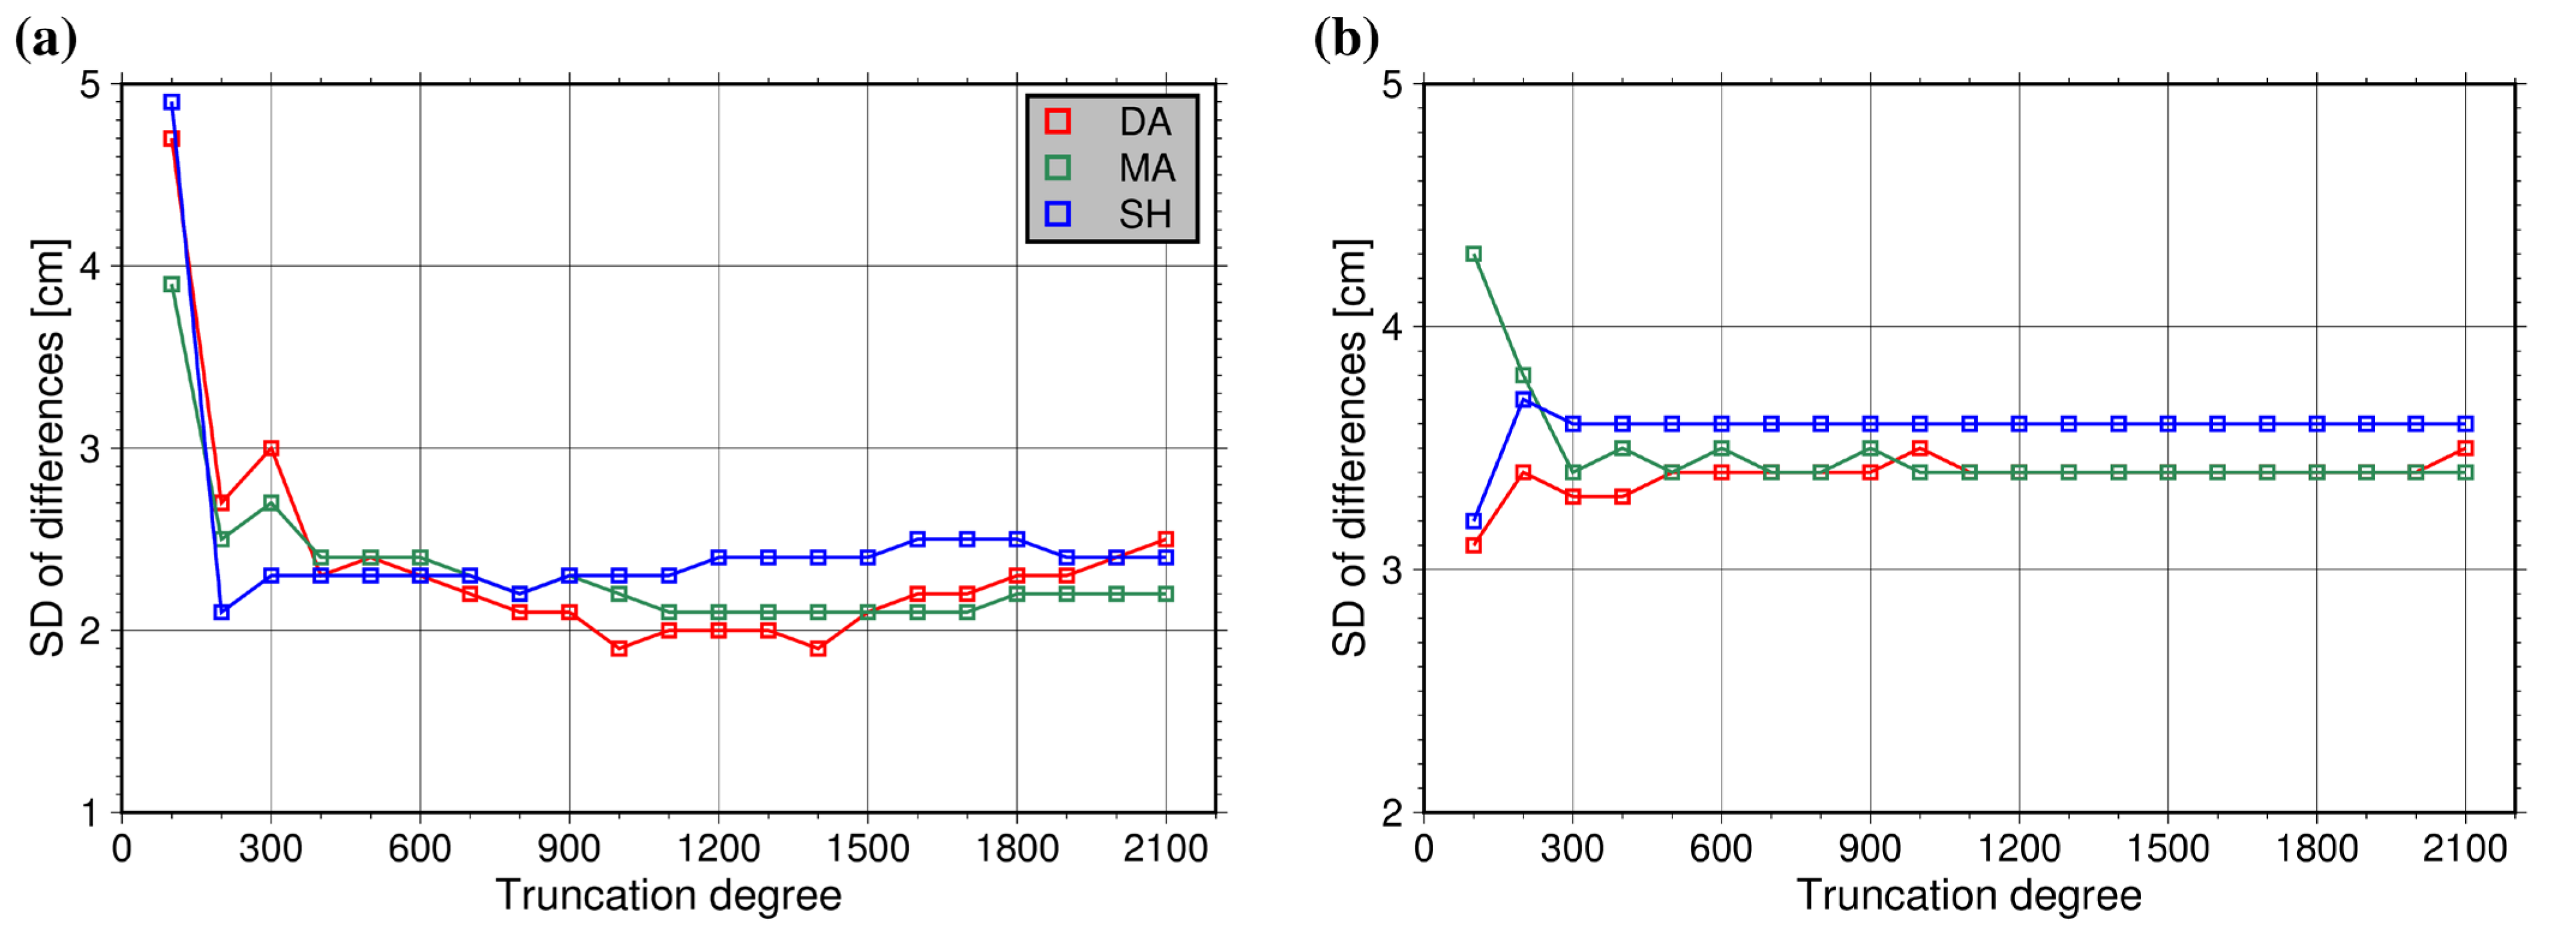
The second experiment uses the RTM corrections computed by REF5′ for local quasi-geoid modeling. As shown in Section 3.3.2, the integration radius effect, including r1 and r2, is insignificant on computing RTM corrections when using REF5′. Therefore, only the performance of using different types of reference topographies is investigated here on local quasi-geoid determination by fixing the values of r1 and r2 to be 30 km and 167 km, respectively. The results of validating various local quasi-geoid models by GNSS/leveling benchmarks are presented in Figure 12. It is easy to see that the quasi-geoid models computed by different reference topographies are at a similar accuracy level in each test area, demonstrating that the quality of local quasi-geoid is not significantly influenced by the type of reference topography if the resolution of the reference topography is high. This finding is quite different from the previous experiment, in which the resolution of the reference topography was much lower.
Table 6 and Table 7 present validation results similar to those in Table 4 and Table 5. In this case, the GGM+RTM-based models have a smaller SD value than the GGM-based models, regardless of the type of reference topography used. This means the RTM corrections computed by all reference topographies have a positive impact on local quasi-geoid modeling. Furthermore, the use of REF 5 SH is able to compute a GGM+RTM-based model with a slightly smaller SD value than the cases of using REF 5 DA and REF 5 MA in both test areas, demonstrating again the suitability of using the SH reference topography for high-frequency GGM augmentation. When optimal values of the truncation degree are chosen, the final quasi-geoid models shown in Figure 12 have an SD value of about 2.0 cm in the Colorado test area and 3.2 cm in the Auvergne test area. It should be noted that the best final quasi-geoid models in terms of SD are obtained by using the DA reference topography in both test areas. This is in fact beyond our expectations, and now the true reason is not clear to us. A possible reason is that the GNSS/leveling benchmarks are located in the valleys for the Colorado test case and in the flat area for the Auvergne test case, making the RTM corrections computed by different types of reference topographies to these points quite close to each other. In-depth investigations on this issue should be conducted in our future work. In comparison with the GGM+RTM-based models, the final models are slightly improved in terms of SD. However, the rate of improvement is smaller than that given in Table 4 and Table 5. This is because the GGM up to d/o 2160 is used in this experiment, containing most of the powers of the local quasi-geoid. And thus, the contribution from residual height anomalies is much smaller but still important.

4. Summary and Conclusions

In this paper, we have studied the impact of three factors, i.e., the combination of DEMs with different resolutions for suitably representing the real topography, the choice of integration radius for properly defining the extent of the computation zone, and the determination of reference topography for properly describing the RTM-reduced Earth’s surface, on accurate RTM correction computation and, furthermore, on local quasi-geoid modeling. To do so, various numerical experiments concerning the DEM resolution combination effect, the integration radius effect, and the reference topography effect were conducted in the Colorado test area with rugged terrain and the Auvergne test area with moderate terrain. The numerical findings are given as follows.
The combination of a dense DEM and a coarse DEM can replace the sole use of the dense DEM while maintaining accuracy and improving efficiency. If the resolution of the dense DEM is 3”, the resolution of the coarse DEM used in the outer zone is recommended to be 30”. The changes in RTM corrections caused by this replacement are negligible, while the numerical efficiency is improved about two times in computing the gravity anomaly and three times in computing the height anomaly. The decreasing resolution of the coarse DEM will increase the changes but cannot further improve the efficiency.
The integration radius r2 for the outer zone has a minor impact on computing RTM corrections when the reference topography has a resolution of 5′. In this case, its value is preferred to be 111 km or larger. However, if the resolution of the reference topography decreases to 30′, its impact becomes significant. For gravity anomalies, the RMS of changes ranges from about 7 to 120 μGal. For height anomalies, the RMS of changes ranges from about 3 to 17.5 cm. Therefore, the value of r2 should be selected with caution in this case. In general, we prefer the value of r2 to be as large as possible if the computation burden is acceptable. In comparison with r2, the changes in RTM corrections computed by using different values of r1 are insignificant no matter whether the reference topography has a resolution of 5′ or 30′, especially for computing the height anomaly. Its value is preferred to be 20 km or larger.
The impact of using three types of reference topographies is significant in computing RTM corrections. When using the 5′ resolution reference topography, it causes gravity anomaly changes with an RMS value ranging from about 3 to 6 mGal and height anomaly changes with an RMS value ranging from about 1 to 3 cm. When using the 30′ resolution reference topography, it causes gravity anomaly changes with an RMS value ranging from about 6 to 11 mGal and height anomaly changes with an RMS value ranging from about 11 to 34 cm. The lower the resolution of the used reference topography, the more significant the effect of the type of reference topography on RTM correction computation is. For gravity anomaly reduction, the SH reference topography performs better than the other two types of reference topographies.
The determination and validation of the local quasi-geoid models calculated by various RTM corrections in two test areas demonstrated that the choice of the integration radius r2 and the type of reference topography indeed affect the quality of the computed quasi-geoid models when using the 30′ resolution reference topography. In both test areas, the value of r2 ≥ 222 km outperforms the other values if using the same type of reference topography. The SH reference topography usually yields better results than the other two, while the DA reference topography delivers the worst models. In the case of using the 5′ resolution reference topography, local quasi-geoid models obtained by using three types of reference topographies are at a similar accuracy level in both test areas. This indicates that the type of reference topography is not critical in the determination of local quasi-geoid if the resolution of the reference topography is high.
According to the above-mentioned numerical findings, we summarized some guidelines that might be helpful for using the RTM method in local quasi-geoid modeling: (1) The combination of the 3″ resolution DEM and the 30″ resolution is sufficient for accurate and efficient RTM correction computation if the highest resolution of the DEM we have is 3″; (2) if the reference topography has a resolution of 5′ or slightly lower, such as 10′, all three types of reference topographies can be used for RTM correction computation and, consequently, in local quasi-geoid modeling. The values of r1 and r2 are preferred to be at least 20 km and 111 km, respectively; (3) if the reference topography has a resolution of 30′ or lower, the MA or SH reference topography is suggested, especially for the latter one. The advantage of using the MA reference topography is that it is much easier to calculate than the SH reference topography. The values of r1 and r2 are recommended to be at least 20 km and 222 km, respectively. Finally, we would like to mention that the guidelines may also work when using those programs that have a similar structure as that of the “tctessv3omp.f90” program used in this study, such as the “tc.for” program, to accurately compute RTM corrections.

Author Contributions

Conceptualization, M.L. and M.Y.; methodology, M.L.; computation, M.L. and M.Y.; analysis and validation, M.L., M.Y. and J.Z.; writing—original draft preparation, M.L.; writing—review and editing, M.Y. and J.Z.; visualization, M.L.; supervision, J.Z. All authors have read and agreed to the published version of the manuscript.

Funding

This research was funded by the National Natural Science Foundation of China (Grant No. 42004009). Meng Yang was supported by the National Natural Science Foundation of China (Grant No. 42104083) and the Natural Science Foundation of Guangdong Province, China (Grant No. 2021A1515011425). Jianjun Zhu was supported by the National Natural Science Foundation of China (Grant No. 42227801).

Data Availability Statement

The global geopotential model EIGEN-6C4 used in the current study is available at ICGEM (http://icgem.gfz-potsdam.de/tom_longtime/, accessed on 12 June 2022). The Colorado data used in the current study are available at NGS (https://www.ngs.noaa.gov/GEOID/research/co-cm-experiment/, accessed on 23 June 2022). The Auvergne data used in the current study are available from the first author ML upon reasonable request.

Acknowledgments

We thank two anonymous reviewers for their constructive comments that helped to improve this manuscript. We also would like to thank Xiaopeng Li from NGS for valuable discussions when preparing this manuscript. Part of figures were plotted by the Generic Mapping Tools (GMT) [54].

Conflicts of Interest

The authors declare no conflict of interest.

References

  1. Heiskanen, W.; Moritz, H. Physical Geodesy; W.H. Freeman: San Francisco, CA, USA, 1967. [Google Scholar]
  2. Hofmann-Wellenhof, B.; Moritz, H. Physical Geodesy; Springer: Wien, Austria, 2006. [Google Scholar]
  3. Bucha, B.; Janák, J.; Papčo, J.; Bezděk, A. High-resolution regional gravity field modelling in a mountainous area from terrestrial gravity data. Geophys. J. Int. 2016, 207, 949–966. [Google Scholar] [CrossRef] [Green Version]
  4. Denker, H. Regional Gravity Field Modeling: Theory and Practical Results. In Science of Geodesy—II; Xu, G., Ed.; Springer: Berlin, Germany, 2013; pp. 185–291. [Google Scholar]
  5. Featherstone, W.E.; McCubbine, J.C.; Brown, N.J.; Claessens, S.J.; Filmer, M.S.; Kirby, J.F. The first Australian gravimetric quasigeoid model with location-specific uncertainty estimates. J. Geod. 2018, 92, 149–168. [Google Scholar] [CrossRef] [Green Version]
  6. Klees, R.; Tenzer, R.; Prutkin, I.; Wittwer, T. A data-driven approach to local gravity field modelling using spherical radial basis functions. J. Geod. 2008, 82, 457–471. [Google Scholar] [CrossRef] [Green Version]
  7. Slobbe, C.; Klees, R.; Farahani, H.; Huisman, L.; Alberts, B.; Voet, P.; De Doncker, F. The impact of noise in a GRACE/GOCE global gravity model on a local quasi-geoid. J. Geophys. Res. 2019, 124, 3219–3237. [Google Scholar] [CrossRef]
  8. Scheinert, M.; Müller, J.; Dietrich, R.; Damaske, D.; Damm, V. Regional geoid determination in Antarctica utilizing airborne gravity and topography data. J. Geod. 2008, 82, 403–414. [Google Scholar] [CrossRef]
  9. Vu, D.T.; Bruinsma, S.; Bonvalot, S. A high-resolution gravimetric quasigeoid model for Vietnam. Earth Planets Space 2019, 71, 65. [Google Scholar] [CrossRef]
  10. Li, X.; Ahlgren, K.; Hardy, R.; Krcmaric, J.; Wang, Y. The Development and Evaluation of the Experimental Gravimetric Geoid Model 2019. 2019. Available online: https://beta.ngs.noaa.gov/GEOID/xGEOID19/xGeoid19_tech_details.v10.pdf (accessed on 15 July 2021).
  11. Wang, Y.; Li, X.; Ahlgren, K.; Krcmaric, J. Colorado geoid modeling at the US National Geodetic Survey. J. Geod. 2020, 94, 106. [Google Scholar] [CrossRef]
  12. Jiang, T.; Dang, Y.; Zhang, C. Gravimetric geoid modeling from the combination of satellite gravity model, terrestrial and airborne gravity data: A case study in the mountainous area, Colorado. Earth Planets Space 2020, 72, 189. [Google Scholar] [CrossRef]
  13. Tscherning, C.C. Comparison of some methods for the detailed representation of the Earth’s gravity field. Rev. Geophys. 1981, 19, 213–221. [Google Scholar] [CrossRef]
  14. Tscherning, C.C. Geoid Determination by 3D Least-Squares Collocation. In Geoid Determination Theory and Methods; Sansò, F., Sideris, M.G., Eds.; Springer: Berlin, Germany, 2013; pp. 311–336. [Google Scholar]
  15. Grigoriadis, V.N.; Vergos, G.S.; Barzaghi, R.; Carrion, D.; Koç, Ö. Collocation and FFT-based geoid estimation within the Colorado 1 cm geoid experiment. J. Geod. 2021, 95, 52. [Google Scholar] [CrossRef]
  16. Li, X. Using radial basis functions in airborne gravimetry for local geoid improvement. J. Geod. 2018, 92, 471–485. [Google Scholar] [CrossRef]
  17. Lin, M.; Denker, H.; Müller, J. A comparison of fixed- and free-positioned point mass methods for regional gravity field modeling. J. Geodyn. 2019, 125, 32–47. [Google Scholar] [CrossRef]
  18. Schmidt, M.; Fengler, M.; Mayer-Guerr, T.; Eicker, A.; Kusche, J.; Sanchez, L.; Han, S.C. Regional gravity field modeling in terms of spherical base functions. J. Geod. 2007, 81, 17–38. [Google Scholar] [CrossRef] [Green Version]
  19. Forsberg, R.; Tscherning, C.C. The use of height data in gravity field approximation by collocation. J. Geophys. Res. 1981, 86, 7843–7854. [Google Scholar] [CrossRef]
  20. Forsberg, R. A Study of Terrain Reductions, Density Anomalies and Geophysical Inversion Methods in Gravity Field Modeling; OSU Report 355; Ohio State University: Columbus, OH, USA, 1984. [Google Scholar]
  21. Tziavos, I.N.; Vergos, G.S.; Grigoriadis, V.N. Investigation of topographic reductions and aliasing effects on gravity and the geoid over Greece based on various digital terrain models. Surv. Geophys. 2010, 31, 23–67. [Google Scholar] [CrossRef]
  22. Tziavos, I.N.; Sideris, M.G. Topographic Reductions in Gravity and Geoid Modeling. In Geoid Determination Theory and Methods; Sansò, F., Sideris, M.G., Eds.; Springer: Berlin, Germany, 2013; pp. 337–400. [Google Scholar]
  23. Rexer, M.; Hirt, C.; Bucha, B.; Holmes, S. Solution to the spectral filter problem of residual terrain modelling (RTM). J. Geod. 2018, 92, 675–690. [Google Scholar] [CrossRef]
  24. Farr, T.G.; Rosen, P.; Caro, E.; Crippen, R.; Duren, R.; Hensley, S.; Kobrick, M.; Paller, M.; Rodriguez, E.; Roth, L.; et al. The shuttle radar topography mission. Rev. Geophys. 2007, 45, RG2004. [Google Scholar] [CrossRef] [Green Version]
  25. Yamazaki, D.; Ikeshima, D.; Tawatari, R.; Yamaguchi, T.; O’Loughlin, F.; Neal, J.C.; Sampson, C.C.; Kanae, S.; Bates, P.D. A high-accuracy map of global terrain elevations. Geophys. Res. Lett. 2017, 44, 5844–5853. [Google Scholar] [CrossRef] [Green Version]
  26. Yang, M.; Hirt, C.; Tenzer, R.; Pail, R. Experiences with the use of mass-density maps in residual gravity forward modeling. Stud. Geophys. Geod. 2018, 62, 596–623. [Google Scholar] [CrossRef]
  27. Yang, M.; Hirt, C.; Rexer, M.; Pail, R.; Yamazaki, D. The tree-canopy effect in gravity forward modeling. Geophys. J. Int. 2019, 219, 271–289. [Google Scholar] [CrossRef]
  28. Yang, M.; Hirt, C.; Pail, R. TGF: A new MATLAB-based software for terrain-related gravity field calculations. Remote. Sens. 2020, 12, 1063. [Google Scholar] [CrossRef] [Green Version]
  29. Forsberg, R.; Tscherning, C.C. An Overview Manual for the GRAVSOFT Geodetic Gravity Field Modelling Programs; DTU: Copenhagen, Denmark, 2008. [Google Scholar]
  30. Lin, M.; Li, X. Impacts of using the rigorous topographic gravity modeling method and lateral density variation model on topographic reductions and geoid modeling: A case study in Colorado, USA. Surv. Geophys. 2022, 43, 1497–1538. [Google Scholar] [CrossRef]
  31. Olgun, S.; Üstün, A.; Akyılmaz, O. tc-cylinder: An optimized algorithm for accurate topography effect from high-resolution digital elevation models. Comput. Geosci. 2023, 170, 105264. [Google Scholar] [CrossRef]
  32. Bucha, B.; Hirt, C.; Yang, M.; Kuhn, M.; Rexer, M. Residual terrain modelling (RTM) in terms of the cap-modified spectral technique: RTM from a new perspective. J. Geod. 2019, 93, 2089–2108. [Google Scholar] [CrossRef]
  33. Hirt, C.; Bucha, B.; Yang, M.; Kuhn, M. A numerical study of residual terrain modeling (RTM) techniques and the harmonic correction using ultra-high-degree spectral gravity modelling. J. Geod. 2019, 93, 1469–1486. [Google Scholar] [CrossRef]
  34. Hirt, C. RTM gravity forward-modeling using topography/bathymetry data to improve high-degree global geopotential models in the coastal zone. Mar. Geod. 2013, 36, 183–202. [Google Scholar] [CrossRef] [Green Version]
  35. Hirt, C.; Yang, M.; Kuhn, M.; Bucha, B.; Kurzmann, A.; Pail, R. SRTM2gravity: An Ultrahigh Resolution Global Model of Gravimetric Terrain Corrections. Geophys. Res. Lett. 2019, 46, 4618–4627. [Google Scholar] [CrossRef] [Green Version]
  36. Klees, R.; Seitz, K.; Slobbe, D.C. The RTM harmonic correction revisited. J. Geod. 2022, 96, 39. [Google Scholar] [CrossRef]
  37. Vaníček, P.; Huang, J.; Novák, P.; Pagiatakis, S.; Véronneau, M.; Martinec, Z.; Featherstone, E. Determination of the boundary values for the Stokes-Helmert problem. J. Geod. 1999, 73, 180–192. [Google Scholar]
  38. Heck, B. On Helmert’s methods of condensation. J. Geod. 2003, 77, 155–170. [Google Scholar] [CrossRef]
  39. Ellmann, A.; Vaníček, P. UNB application of Stokes-Helmert’s approach to geoid computation. J. Geodyn. 2007, 43, 200–213. [Google Scholar] [CrossRef]
  40. Klees, R.; Seitz, K.; Slobbe, D.C. Exact closed-form expressions for the complete RTM correction. J. Geod. 2023, 97, 33. [Google Scholar] [CrossRef]
  41. Omang, O.C.; Tscherning, C.C.; Forsberg, R. Generalizing the Harmonic Reduction Procedure in Residual Topographic Modeling. In VII Hotine-Marussi Symposium on Mathematical Geodesy; Springer: Berlin/Heidelberg, Germany, 2012. [Google Scholar]
  42. Yang, M.; Hirt, C.; Wu, B.; Deng, X.; Tsoulis, D.; Feng, W.; Wang, C.; Zhong, M. Residual Terrain Modelling: The Harmonic Correction for Geoid Heights. Surv. Geophys. 2022, 43, 1201–1231. [Google Scholar] [CrossRef]
  43. Wang, Y.; Sánchez, L.; Ågren, J.; Huang, J.; Forsberg, R.; Abd-Elmotaal, H.A.; Ahlgren, K.; Barzaghi, R.; Bašić, T.; Carrion, D.; et al. Colorado geoid computation experiment: Overview and summary. J. Geod. 2021, 95, 127. [Google Scholar] [CrossRef]
  44. Duquenne, H. A data set to test geoid computation methods. In Proceedings of the 1st International Symposium of the International Gravity Field Service “Gravity Field of the Earth”, Harita Dergisi, Istanbul, Turkey, 28 August–1 September 2006. [Google Scholar]
  45. Ågren, J.; Barzaghi, R.; Carrion, D.; Denker, H.; Grigoriadis, V.N.; Kiamehr, R.; Sona, G.; Tscherning, C.C.; Tziavos, I.N. Different geoid computation methods applied on a test dataset: Results and considerations. In Proceedings of the Hotine-Marussi Symposium, Rome, Italy, 6–12 July 2009. [Google Scholar]
  46. van Westrum, D.; Ahlgren, K.; Hirt, C.; Guillaume, S. A Geoid Slope Validation Survey (2017) in the rugged terrain of Colorado, USA. J. Geod. 2021, 95, 9. [Google Scholar] [CrossRef]
  47. Pavlis, N.K.; Holmes, S.A.; Kenyon, S.C.; Factor, J.K. The development and evaluation of the Earth Gravitational Model 2008 (EGM2008). J. Geophys. Res. 2012, 117, B04406. [Google Scholar] [CrossRef] [Green Version]
  48. Förste, C.; Bruinsma, S.L.; Abrikosov, O.; Lemoine, J.M.; Marty, J.C.; Flechtner, F.; Balmino, G.; Barthelmes, F.; Biancale, R. EIGEN-6C4 the Latest Combined Global Gravity Field Model Including GOCE Data Up to Degree and Order 2190 of GFZ Potsdam and GRGS Toulouse; GFZ Data Services: Potsdam, Germany, 2014. [Google Scholar]
  49. Wong, L.; Gore, R. Accuracy of geoid heights from modified Stokes kernels. Geophys. J. R. Astron. Soc. 1969, 18, 81–91. [Google Scholar] [CrossRef] [Green Version]
  50. Rapp, R.H. Use of potential coefficient models for geoid undulation determinations using a spherical harmonic representation of the height anomaly/geoid undulation difference. J. Geod. 1997, 71, 282–289. [Google Scholar] [CrossRef]
  51. Tenzer, R.; Chen, W.; Rathnayake, S.; Pitoňák, M. The effect of anomalous global lateral topographic density on the geoid-to-quasigeoid separation. J. Geod. 2021, 95, 12. [Google Scholar] [CrossRef]
  52. Pavlis, N.K.; Factor, J.K.; Holmes, S.A. Terrain-related gravimetric quantities computed for the next EGM. In Proceedings of the 1st International Symposium of the International Gravity Field Service (IGFS), Istanbul, Turkey, 28 August–1 September 2006; pp. 318–323. [Google Scholar]
  53. Hirt, C. Prediction of vertical deflections from high-degree spherical harmonic synthesis and residual terrain model data. J. Geod. 2010, 84, 179–190. [Google Scholar] [CrossRef] [Green Version]
  54. Wessel, P.; Smith, W.H.F. New, improved version of generic mapping tools released. Eos Trans. Am. Geophys. Union 1998, 79, 579. [Google Scholar] [CrossRef]
Figure 1. Sketch of the RTM reduction. The residual terrain is defined by the real topography and the reference topography, resulting in masses with a positive density above the reference topography (blue part) and masses with a negative density below the reference topography (grey part). The integration radius determines the extent of the computation zone in which the corresponding residual terrain is used for RTM correction computation.
Remotesensing 15 03594 g001
Figure 2. Representation of the real topography by a high-resolution DEM over the whole computation zone (left) and by a combination of a high-resolution DEM in the inner zone and a DEM with a lower resolution in the outer zone (right). r1 and r2 denote the integration radius for defining the inner zone and the outer zone, respectively.
Remotesensing 15 03594 g002
Figure 3. (a) Locations of 58,913 gravity observations (black dots) and 222 GSVS17 GNSS/leveling benchmarks (red triangles) in the Colorado test area; (b) Locations of 243,954 gravity observations (black dots) and 75 GNSS/leveling points (red triangles) in the Auvergne test area. In each test area, the quasi-geoid computation area is bound by the blue rectangle. The background displays the MERIT DEM for the Colorado test area and the SRTM DEM for the Auvergne test area.
Remotesensing 15 03594 g003
Figure 4. Colorado test area: reference topographies REF 5 DA (a), REF 5 MA (b), REF 5 SH (c), REF 3 0 DA (d), REF 3 0 MA (e), and REF 3 0 SH (f).
Remotesensing 15 03594 g004
Figure 5. Auvergne test area: reference topographies REF 5 DA (a), REF 5 MA (b), REF 5 SH (c), REF 3 0 DA (d), REF 3 0 MA (e), and REF 3 0 SH (f).
Remotesensing 15 03594 g005aRemotesensing 15 03594 g005b
Figure 6. RMS of differences between RTM corrections to gravity anomalies (a,b) and height anomalies (c,d) which were computed by different DEM resolution combination scenarios in the Colorado test area (a,c) and the Auvergne test area (b,d). The results computed by fully using the 3” resolution DEM are taken as references. Reference topographies REF 5 DA , REF 5 MA , REF 5 SH , REF 3 0 DA , REF 3 0 MA , and REF 3 0 SH are used for comparison.
Remotesensing 15 03594 g006aRemotesensing 15 03594 g006b
Figure 7. Time for 1 point computation of the RTM correction to gravity anomalies and height anomalies while using different DEM resolution combination scenarios in the Colorado test area (a) and the Auvergne test area (b). Reference topographies REF 3 0 DA , REF 3 0 MA , and REF 3 0 SH are used for comparison.
Remotesensing 15 03594 g007
Figure 8. RMS of differences between RTM corrections to gravity anomalies (a,b) and height anomalies (c,d) which were computed by using different values of r2 in the Colorado test area (a,c) and the Auvergne test area (b,d). The results computed by using r2 = 278 km are taken as references. Reference topographies REF 5 DA , REF 5 MA , REF 5 SH , REF 3 0 DA , REF 3 0 MA , and REF 3 0 SH are used for comparison.
Remotesensing 15 03594 g008aRemotesensing 15 03594 g008b
Figure 9. RMS of differences between RTM corrections to gravity anomalies which were computed by using different values of r1 in the Colorado test area (a) and the Auvergne test area (b). The results computed by using r1 = 50 km are taken as references. Reference topographies REF 5 DA , REF 5 MA , REF 5 SH , REF 3 0 DA , REF 3 0 MA , and REF 3 0 SH are used for comparison.
Remotesensing 15 03594 g009
Figure 10. RMS of differences between RTM corrections to gravity anomalies (a) and height anomalies (b) which were computed by using three types of reference topographies in both test areas. Here the superscripts ‘Co’ and ‘Au’ denote the Colorado test area and the Auvergne test area, respectively.
Remotesensing 15 03594 g010
Figure 11. SD of differences between the height anomalies derived from GNSS/leveling data and various local quasi-geoid models as a function of the truncation degree for the Stokes integral kernel in the Colorado test area (ac) and the Auvergne test area (df). RTM corrections are computed by using five different values of r2 and three types of reference topographies REF 3 0 DA (a,d), REF 3 0 MA (b,e), and REF 3 0 SH (c,f).
Remotesensing 15 03594 g011aRemotesensing 15 03594 g011b
Figure 12. SD of differences between the height anomalies derived from GNSS/leveling data and various local quasi-geoid models as a function of the truncation degree for the Stokes integral kernel in the Colorado test area (a) and the Auvergne test area (b). RTM corrections are computed by using three types of reference topographies REF 5 DA , REF 5 MA , and REF 5 SH .
Remotesensing 15 03594 g012
Table 1. Details of the parameters used for the numerical experiments in this study. In the row of DEM resolution combinations, for example, 3″ + 30″ means the 3″ resolution DEM is used in the inner zone and the 30″ resolution DEM is employed in the outer zone. The other DEM resolution combination scenarios have a similar meaning as that of 3″ + 30″.
ParametersScenariosRemarks
DEM resolution combination3″ + 3″
3″ + 30″
3″ + 1′
3″ + 2′
3″ + 3′
3″ + 4′
3″ + 5′
In this case, the values of r1 and r2, the type of reference topography are pre-fixed
Integration radius r1r1 = 10 km
r1 = 20 km
r1 = 30 km
r1 = 40 km
r1 = 50 km
In this case, the DEM resolution combination scenario, the value of r2, and the type of reference topography are pre-fixed
Integration radius r2r2 = 56 km
r2 = 111 km
r2 = 167 km
r2 = 222 km
r2 = 278 km
In this case, the DEM resolution combination scenario, the value of r1, and the type of reference topography are pre-fixed
Reference topographyDA approach
MA approach
SH approach
In this case, the DEM resolution combination scenario, the values of r1 and r2 are pre-fixed
Table 2. Statistics of residual gravity anomalies (mGal) computed by using three types of reference topographies in the Colorado test area.
Residual Gravity AnomalyReference TopographyMeanSDRMSMinMax
Δ g obs Δ g EIGEN - 6 C 4 2160 Δ g RTM DA REF 5 DA 1.3695.9616.117−39.69843.531
Δ g obs Δ g EIGEN - 6 C 4 2160 Δ g RTM MA REF 5 MA 0.2835.4505.458−33.18438.287
Δ g obs Δ g EIGEN - 6 C 4 2160 Δ g RTM SH REF 5 SH 0.3443.5273.544−27.43629.674
Δ g obs Δ g EIGEN - 6 C 4 360 Δ g RTM DA REF 3 0 DA 0.28715.68115.684−57.72954.017
Δ g obs Δ g EIGEN - 6 C 4 360 Δ g RTM MA REF 3 0 MA −1.95314.33214.464−51.35454.711
Δ g obs Δ g EIGEN - 6 C 4 360 Δ g RTM SH REF 3 0 SH 0.20110.00710.009−40.86855.576
Table 3. Statistics of residual gravity anomalies (mGal) computed by using three types of reference topographies in the Auvergne test area.
Residual Gravity AnomalyReference TopographyMeanSDRMSMinMax
Δ g obs Δ g EIGEN - 6 C 4 2160 Δ g RTM DA REF 5 DA 0.5404.6444.676−63.66364.943
Δ g obs Δ g EIGEN - 6 C 4 2160 Δ g RTM MA REF 5 MA 0.1954.6684.672−63.41765.381
Δ g obs Δ g EIGEN - 6 C 4 2160 Δ g RTM SH REF 5 SH 0.2962.7302.746−19.59221.382
Δ g obs Δ g EIGEN - 6 C 4 360 Δ g RTM DA REF 3 0 DA 1.4549.6239.732−50.12172.149
Δ g obs Δ g EIGEN - 6 C 4 360 Δ g RTM MA REF 3 0 MA −0.4069.0829.091−42.87452.153
Δ g obs Δ g EIGEN - 6 C 4 360 Δ g RTM SH REF 3 0 SH −0.2157.5647.567−27.35649.728
Table 4. Statistics of differences (cm) between the height anomalies derived from 222 GSVS17 GNSS/leveling benchmarks and various local quasi-geoid models in the Colorado test area. The quasi-geoid models include the ones obtained from the EIGEN-6C4 model, the ones obtained as a combination of GGM and RTM, and the ones shown in Figure 11a–c using the optimal values of r2 and truncation degree.
Quasi-Geoid ModelIntegration Radius r2Truncation DegreeMeanSDRMSMinMax
ζ EIGEN - 6 C 4 360 //−31.322.238.3−73.129.8
ζ EIGEN - 6 C 4 360 + ζ RTM DA 222 km/−46.324.052.1−95.6−5.0
ζ EIGEN - 6 C 4 360 + ζ RTM MA 222 km/−28.216.132.5−58.54.3
ζ EIGEN - 6 C 4 360 + ζ RTM SH 222 km/−22.012.025.1−47.93.2
ζ EIGEN - 6 C 4 360 + ζ RTM DA + ζ res DA 222 km100−47.89.548.7−65.3−24.5
ζ EIGEN - 6 C 4 360 + ζ RTM MA + ζ res MA 222 km200−24.56.325.3−39.5−10.4
ζ EIGEN - 6 C 4 360 + ζ RTM SH + ζ res SH 222 km200−16.44.517.0−25.9−3.5
Table 5. Statistics of differences (cm) between the height anomalies derived from 75 GNSS/leveling benchmarks and various local quasi-geoid models in the Auvergne test area. The quasi-geoid models include the ones obtained from the EIGEN-6C4 model, the ones obtained as a combination of GGM and RTM, and the ones shown in Figure 11d–f using the optimal values of r2 and truncation degree.
Quasi-Geoid ModelIntegration Radius r2Truncation DegreeMeanSDRMSMinMax
ζ EIGEN - 6 C 4 360 //−9.917.119.7−54.627.9
ζ EIGEN - 6 C 4 360 + ζ RTM DA 56 km/−13.617.922.4−53.322.4
ζ EIGEN - 6 C 4 360 + ζ RTM MA 222 km/−12.611.717.2−41.415.1
ζ EIGEN - 6 C 4 360 + ζ RTM SH 278 km/−9.78.612.9−24.411.7
ζ EIGEN - 6 C 4 360 + ζ RTM DA + ζ res DA 56 km100−12.96.514.5−29.5−0.1
ζ EIGEN - 6 C 4 360 + ζ RTM MA + ζ res MA 222 km100−12.73.213.1−22.9−6.4
ζ EIGEN - 6 C 4 360 + ζ RTM SH + ζ res SH 278 km100−9.73.510.3−19.1−0.4
Table 6. Statistics of differences (cm) between the height anomalies derived from 222 GSVS17 GNSS/leveling benchmarks and various local quasi-geoid models in the Colorado test area. The quasi-geoid models include the ones obtained from the EIGEN-6C4 model, the ones obtained as a combination of GGM and RTM, and the ones shown in Figure 12a using the optimal truncation degree.
Quasi-Geoid ModelTruncation DegreeMeanSDRMSMinMax
ζ EIGEN - 6 C 4 2160 /−11.93.612.4−21.8−1.4
ζ EIGEN - 6 C 4 2160 + ζ RTM DA /−9.52.79.9−18.2−2.6
ζ EIGEN - 6 C 4 2160 + ζ RTM MA /−10.62.811.0−17.9−2.7
ζ EIGEN - 6 C 4 2160 + ζ RTM SH /−11.92.412.1−17.2−4.2
ζ EIGEN - 6 C 4 2160 + ζ RTM DA + ζ res DA 1000−10.21.910.4−17.5−5.4
ζ EIGEN - 6 C 4 2160 + ζ RTM MA + ζ res MA 1100−10.92.111.1−16.2−3.7
ζ EIGEN - 6 C 4 2160 + ζ RTM SH + ζ res SH 200−11.72.111.9−17.9−4.1
Table 7. Statistics of differences (cm) between the height anomalies derived from 75 GNSS/leveling benchmarks and various local quasi-geoid models in the Auvergne test area. The quasi-geoid models include the ones obtained from the EIGEN-6C4 model, the ones obtained as a combination of GGM and RTM, and the ones shown in Figure 12b using the optimal truncation degree.
Quasi-Geoid ModelTruncation DegreeMeanSDRMSMinMax
ζ EIGEN - 6 C 4 2160 /−9.83.810.5−18.84.7
ζ EIGEN - 6 C 4 2160 + ζ RTM DA /−10.03.610.6−18.23.0
ζ EIGEN - 6 C 4 2160 + ζ RTM MA /−9.93.610.5−18.23.7
ζ EIGEN - 6 C 4 2160 + ζ RTM SH /−9.73.610.3−18.40.9
ζ EIGEN - 6 C 4 2160 + ζ RTM DA + ζ res DA 100−10.43.110.9−17.9−2.4
ζ EIGEN - 6 C 4 2160 + ζ RTM MA + ζ res MA 300−9.93.410.5−19.1−0.9
ζ EIGEN - 6 C 4 2160 + ζ RTM SH + ζ res SH 100−10.13.210.6−17.9−0.6
Disclaimer/Publisher’s Note: The statements, opinions and data contained in all publications are solely those of the individual author(s) and contributor(s) and not of MDPI and/or the editor(s). MDPI and/or the editor(s) disclaim responsibility for any injury to people or property resulting from any ideas, methods, instructions or products referred to in the content.