Abstract
With the rapid development of the Internet of Things (IoT)-based near-Earth remote sensing technology, the problem of network intrusion for near-Earth remote sensing systems has become more complex and large-scale. Therefore, seeking an intelligent, automated, and robust network intrusion detection method is essential. Many researchers have researched network intrusion detection methods, such as traditional feature-based and machine learning methods. In recent years, network intrusion detection methods based on graph neural networks (GNNs) have been proposed. However, there are still some practical issues with these methods. For example, they have not taken into consideration the characteristics of near-Earth remote sensing systems, the state of the nodes, and the temporal features. Therefore, this article analyzes the factors of existing near-Earth remote sensing systems and proposes a spatio-temporal graph attention network (N-STGAT) that considers the state of nodes and applies them to the network intrusion detection of near-Earth remote sensing systems. Finally, the proposed method in this article is validated using the latest flow-based datasets NF-BoT-IoT-v2 and NF-ToN-IoT-v2. The results demonstrate that the binary classification accuracy for network intrusion detection exceeds 99%, while the multi-classification accuracy exceeds 93%. These findings provide substantial evidence that the proposed method outperforms existing intrusion detection techniques.
1. Introduction
Remote sensing technology has undergone rapid development in recent years. High-resolution satellite remote sensing technology has provided convenience for meteorology, terrain surveying, military, agriculture, and other fields [1,2]. However, due to distance and equipment constraints, satellite remote sensing is restricted in some remote sensing fields that necessitate ultra-high precision and multimodal information [3]. To address these issues, the development of the Internet of Things (IoT)-based near-Earth remote sensing technology has made significant progress. Near-Earth remote sensing technology plays a crucial role in agriculture analysis, mining, water monitoring [4], and other fields. The near-Earth remote sensing technology consists of a vertical structure, as shown in Figure 1, which includes a large number of IoT devices [5], such as weather balloons, airplanes, drones, and sensors. These devices are connected to the base station via an IoT network and collect various remote sensing information, providing hardware support for subsequent data analysis. Figure 2 shows the deployment of near-Earth remote sensing devices for monitoring crops in farmland.
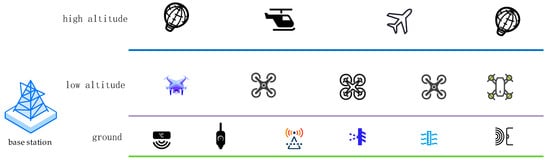
Figure 1.
Schematic diagram of near-ground remote sensing system based on the Internet of Things.
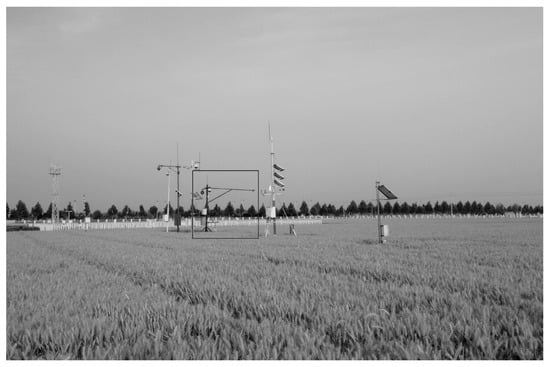
Figure 2.
Example of near-ground remote sensing technology for agriculture.
The deployment of a large number of Internet of Things (IoT) devices is required for the near-ground remote sensing system, and most of these devices are outdoors, exposed to the elements, and unsupervised, which makes them vulnerable to physical or network-based intrusions. Once a remote sensing device is compromised, it may send incorrect data or attack other devices, causing problems for the near-Earth remote sensing system. Therefore, it is essential to deploy a network intrusion detection system designed explicitly for the near-ground remote sensing system.
A network intrusion detection system is a system that can quickly respond when an IoT device is invaded, and at the core, there is a network intrusion detection method. There are mainly two network intrusion detection methods: feature-based and machine learning-based [6,7]. Feature-based detection methods require pre-set attack features, and the captured data packets are compared with those features. The accuracy of this detection method depends entirely on the set of features, and this method does not/will not respond well to new attacks. Machine learning-based detection methods have been enhanced with the development and application of machine learning in recent years. However, these methods directly use data flow information for identification [8,9,10,11,12]. Although these methods can effectively solve the problem of feature dependence and are good at detecting new attacks, the identification accuracy is not high, and they are challenging to apply to practical networks. Recently, researchers have studied the unique subfield of machine learning, graph neural networks (GNNs), and proposed intrusion detection methods based on GNNs [7,13,14]. However, these methods have low identification accuracy in multi-classification tasks and cannot be effectively applied to near-Earth remote sensing systems.
Network intrusion behaviors exhibit several characteristics. When a node engages in an attack, its various parameters become abnormal. For example, during a DOS attack, the node’s network connections and memory usage may significantly increase. Additionally, there is a temporal correlation in the node’s attack behavior, meaning that if the current data flow of a node is an attack, there is a high likelihood that subsequent data flows will also be attacks. Moreover, when two nodes have similar parameter values, their data flow behaviors may be similar. Based on these observations, this article takes into account node states, the temporal relationships of data flow, and the similarity between data flows among nodes in the intrusion detection process.
Additionally, devices such as weather balloons, airplanes, and drones have their operating systems and a near-Earth sensing system composed of these devices so they can provide additional information. Therefore, this article considers the characteristics of the near-Earth remote sensing system and proposes a spatio-temporal graph attention network (N-STGAT) that considers the node status, applying spatio-temporal graph neural networks (STGNN) [15] to network intrusion detection in the near-Earth remote sensing system. To the best of our knowledge, this is the first time that spatio-temporal graph neural networks have been applied to network intrusion detection in the near-Earth remote sensing system.
The contributions of this article are as follows:
- Expanding the latest IoT network intrusion detection dataset by incorporating the status of the node, which better reflects the situation of the near-Earth remote sensing system and enables better evaluation of the proposed method.
- This article proposes for the first time the application of spatio-temporal graph neural networks to network intrusion detection in near-Earth remote sensing systems and further improves the method to better align with the characteristics of near-Earth remote sensing systems, providing a new solution for network intrusion detection.
- The proposed method is validated by the extended dataset and compared with some recently effective IoT network intrusion detection methods. The results show that the proposed method outperforms other methods.
The other chapters of this article are as follows: Section 2 introduces the research from various scholars in the field of network intrusion detection methods. Section 3 briefly introduces some information about GNN, LSTM and STGNN and then explains how to extend the latest network intrusion detection dataset. The proposed network intrusion detection system is described in great depth in Section 4. The experimental procedures and findings are presented in Section 5. The last Section sums up everything.
2. Related Work
In recent years, many researchers have developed machine learning-based methods for network intrusion detection. However, most of these methods directly use data flow information for identification.
Casas et al. [16]. proposed an unsupervised network intrusion detection system named UNIDS, which employs a subspace clustering-based and multi-evidence accumulation-based unsupervised outlier detection method to detect unknown network attacks. It does not require using any features, labeled traffic, or training to detect various types of network attacks, such as DoS/DDoS, probing attacks, worm propagation, buffer overflow, illegal access to network resources, etc. The proposed method’s effectiveness was demonstrated through experiments using KDD99 and actual traffic data from two operational networks. However, the KDD99 dataset is quite old and may not reflect the attack characteristics present in modern IoT networks.
In [9], authors proposed a hybrid anomaly mitigation framework for IoT using fog computing to ensure faster and more accurate anomaly detection. The framework employs signature-based and anomaly-based detection methodologies for the two modules. The BoT-IoT dataset was used for experimentation, and the effectiveness of the proposed method was ultimately validated. Results showed an accuracy of 99% in binary and multi-class classification problems, with at least 97% average recall, average precision, and average F1 score.
In [17], authors proposed a federated learning-based intrusion detection system, named FELIDS, for securing agricultural-IoT infrastructures. The FELIDS system employs three deep learning classifiers: deep neural networks, convolutional neural networks, and recurrent neural networks. Furthermore, impressive classification results were achieved by the CSE-CIC-IDS2018, MQTTset, and InSDN datasets. The method proposed in this article performs well on the CSE-CIC-IDS2018 and InSDN datasets, but it does not perform well on the MQTTset dataset, indicating a lack of generality in the method.
Ferrag, M.A et al. [18] analyzed the characteristics of Agriculture 4.0 and expressed their own views on the existing device security issues associated with it. They proposed a deep learning-based intrusion detection system for DDoS attacks based on three models: convolutional neural networks, deep neural networks, and recurrent neural networks. Each model’s performance is studied within two classification types (binary and multiclass) using two new real traffic datasets, namely, the CIC-DDoS2019 dataset and the TON_IoT dataset, which contain different types of DDoS attacks. The author’s research indicates that the three models, namely, convolutional neural networks, deep neural networks, and recurrent neural networks, have lower recognition rates on certain datasets, particularly for multi-classification problems. Therefore, the three methods are not applicable to real-world applications based on the findings presented in this article.
In [19], the researchers analyzed the relevant characteristics of the agricultural IoT and developed a framework for detecting and classifying network intrusions in agricultural IoT. In this framework, the NSL KDD data set is used as an input data set. In preprocessing the NSL-KDD data set, all symbolic features are first converted to numeric features. Feature extraction is performed using principal component analysis. Then, machine learning algorithms such as support vector machine, linear regression, and random forest are used to classify preprocessed datasets. The final results indicated that some traditional machine learning algorithms achieved an accuracy of only 78%. Therefore, these methods are not applicable in practical scenarios.
The five methods mentioned above use traditional machine learning techniques for network intrusion detection, such as decision trees, MDAE, LSTM, random forests, and XGBoost. These methods directly train on the dataset without considering the graph topology information, resulting in each training data being relatively singular and unable to fully explore the information in each data. Therefore, these methods have limited capability in detecting complex network attacks, such as Botnet attacks [20], distributed port scans [21], or DNS amplification attacks [22], which require a more global network view and traffic.
Leichtnam et al. [23] introduced a unique graph representation called security objects’ graphs that linked events of different kinds and allowed for a detailed description of the analyzed activities. They proposed an unsupervised learning approach based on auto-encoders to detect anomalies in these graphs. The authors hypothesized that auto-encoders could build a relevant model of the usual situation based on the rich vision provided by security objects’ graphs. To validate their approach, they applied it to the CICIDS2017 dataset and showed that their unsupervised method performed as well as, or even better than, many supervised approaches.
Due to the excellent performance of GNN on graph-structured data and the fact that a network is a natural graph, in recent years, some scholars have applied GNN to intrusion detection systems.
Wai Weng Lo et al. [6] proposed the E-GraphSAGE architecture based on GraphSAGE, which allows for capturing the edge features and topology information of the graph for network intrusion detection in the Internet of Things. Experiments on the four latest NIDS benchmark datasets show that the method has achieved perfect results for binary classification problems but not multi-classification problems. When constructing the graph, this method uses the IP address and port of the network flow as nodes and the network flow as edges. When this method uses GraphSAGE for neighborhood aggregation, it may cause some neighborhoods to be aggregated multiple times and the whole neighborhood to be aggregated, which will affect the identification accuracy.
Cheng Q et al. [13] proposed an Alert-GCN framework that uses graph convolutional networks (GCN) to associate alerts coming from the same attack for the prediction of the alert system. Then, the DARPA99 data set was adopted for experiments, achieving good results in the experiment. However, this method used a custom similarity method to define the edges in the graph when constructing an alarm-related graph, which will cause the neighbors of any node in the graph to be highly similar to themselves. This article recognizes that a graph constructed by this method will cause overfitting in the graph neural network.
Evan Caville et al. [14] proposed an intrusion and anomaly detection method called Anomal-E, based on E-GraphSAGE, which utilized edge features and graph topology in a self-supervised process. Then, they validated the proposed method using the NF-UNSW-NB15-v2 and NF-CSE-CIC-IDS2018-v2 datasets. Ultimately, they achieved results with at least 97.5% accuracy and at least 92% F1-Score. Additionally, the article was the first to apply a self-supervised graph neural network solution to network intrusion detection. Although this method applies graph neural networks to network intrusion detection, it does not consider the characteristics of the remote sensing system, node status, and temporal information.
Due to the similarities between network flow prediction considering time and space and traffic flow prediction, this article has drawn significant inspiration from the relevant work in traffic flow prediction.
In [24], the authors proposed a new deep spatio-temporal neural network called DHSTNet to overcome the challenges posed by spatial relationships between regions and the dynamic temporal relationships between periods. DHSTNet was explicitly designed to predict the traffic volume of pedestrian flow. After extensive experiments on two real-world datasets, they demonstrated the advantage of this proposed model over the compared baseline methods. Moreover, to verify the generalization of the proposed model, the authors applied the proposed attention-based mechanism with a previously proposed model, resulting in a hybrid approach known as AttDHSTNet, to forecast short-term crowd flows. The experimental results also confirmed improved performance.
Ali A et al. [25] proposed a unified dynamic deep spatio-temporal neural network model based on convolutional neural networks and long short-term memory, termed “DHSTNet” to predict crowd flows in every city region simultaneously. Moreover, to verify the generalization and scalability of the proposed model, the authors applied a Graph Convolutional Network (GCN) based on Long Short Term Memory (LSTM) with the previously published model, termed GCN-DHSTNet. The GCN-DHSTNet model not only depicted the spatio-temporal dependencies but also revealed the influence of different time granularity, which were recent, daily, weekly periodicity, and external properties, respectively. Finally, a fully connected neural network was utilized to fuse the spatio-temporal features and external properties together. Using two different real-world traffic datasets, the evaluation suggests that the proposed GCN-DHSTNet method is approximately 7.9–27.2% and 11.2–11.9% better than the AAtt-DHSTNet method in terms of RMSE and MAPE metrics, respectively.
The two articles mentioned above addressed the complex combination of time and space in traffic flow prediction. They provided significant inspiration for us in tackling the task of network flow recognition. Therefore, this article combines GAT and LSTM to better utilize the spatial information of the graph and the temporal information of the data flow, increasing the reliability of network intrusion detection.
3. Background
This article argues that when identifying data flows, the state of the nodes should be considered simultaneously. When a network attack occurs, the state of the attacking node is significantly different from that of a normal node. Therefore, considering the state of the nodes is very beneficial for identifying attacks. In addition, identifying attacks should also consider the topological relationship between data flows and the temporal information of data flows.
Intrusion detection systems are generally deployed at the entry point in order to detect network intrusions. However, with the development of IoT, more and more networks are structured as shown in Figure 3, which this article refers to as an “IoT domain”. Such IoT domains are increasingly prevalent in industrial IoT systems, such as those used by companies such as Apple, Huawei, and Xiaomi. Most of the devices in an IoT domain are monitored by a central server, which can obtain information about the status of the nodes. This situation is similar to a ground-based remote sensing system based on the IoT. As the situation, where certain nodes within a domain are controlled to attack other nodes, becomes more and more common, intrusion detection systems need to be deployed at the exit points of the domain to detect attacks on nodes.
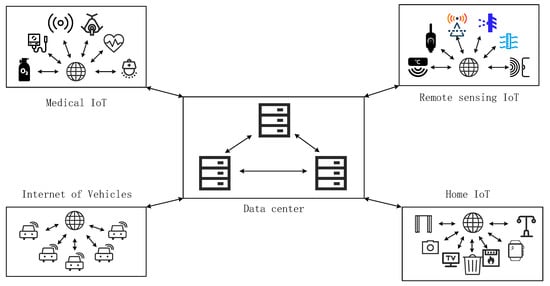
Figure 3.
Characteristics of IoT structure.
3.1. GNN and LSTM
3.1.1. GNN
GNNs are a new type of neural network specifically designed to handle the properties of graphs. In recent years, GNNs have been widely applied in graph processing [26], networking [27], intelligent transportation [28], recommendation systems [29], and distributed computing [30], among other fields. A key feature of GNNs is that they can process non-Euclidean data and utilize the topological structure data through message passing. When identifying nodes in a graph, GNNs can aggregate the data features of neighboring nodes, allowing them to influence each other [31]. This process is called embeddings [32]. There are many different types of GNNs, among which Graph Attention Network (GAT) [33], Graph Convolutional Network (GCN) [34], and GraphSAGE [35] are top-rated among researchers.
GAT (Graph Attention Network) is a type of graph neural network that incorporates an attention mechanism to aggregate neighborhood nodes by computing attention coefficients. This enables GAT to capture the influence of different nodes within the neighborhood. GAT has two core components: computing the attention coefficients () and the hidden layer features () of nodes.
GAT is a type of graph neural network that incorporates an attention mechanism to aggregate neighborhood nodes by computing attention coefficients. This enables GAT to capture the influence of different nodes within the neighborhood. GAT has two core components: computing the attention coefficients () and the hidden layer features () of nodes.
The calculation process for the attention coefficients () between neighboring nodes is shown in Figure 4a. The original GAT article mentions two types of neighborhoods: node neighbors (nodes directly connected to the current node) and entire neighborhoods (all nodes). In this article, we use node neighbors as the neighborhood to prevent the aggregation of a large amount of neighborhood node information that may cause the features to become blurry. Using node neighbors can also reduce time and space complexity. The calculation formula is
is a single-layer feedforward neural network, which is parameterized by a weight vector (), is a shared linear transformation matrix, is a nonlinear function, and is the neighbor node of node . The equation finally uses a function for normalization.
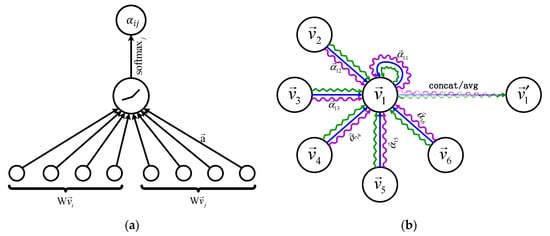
Figure 4.
(a) The calculation process of attention coefficient; (b) the calculation process of hidden layer features.
The calculation process of hidden layer features () is shown in Figure 4b. The calculation formula is
is a nonlinear function. Since GAT uses a multi-head attention mechanism, K represents the number of attention heads.
3.1.2. LSTM
LSTM is a special type of recurrent neural network (RNN) architecture used for processing and predicting sequence data [36]. It uses gate mechanisms to better capture long-term dependencies in time series data, making it better suited for handling such data. An LSTM network consists of a series of LSTM cells, each containing an input gate, a forget gate, and an output gate. The input gate and forget gate are used to control the flow of information, with the input gate determining which information should be updated in the memory cell and the forget gate deciding which information should be discarded from the memory cell. The output gate determines how much influence the memory cell should have on the current output. The core cell unit of LSTM is shown in Figure 5.
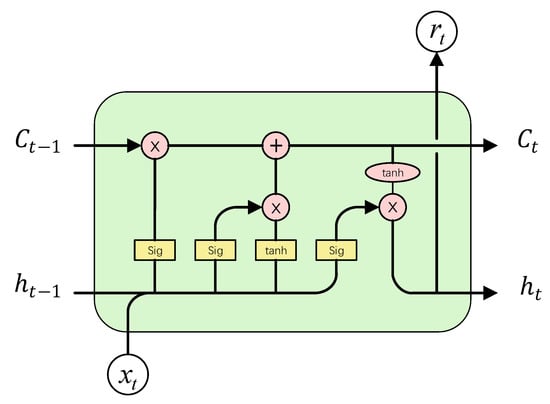
Figure 5.
The core cell unit of LSTM.
3.1.3. STGNN
STGNN is a class of neural network models specifically designed to analyze data with both spatial and temporal dependencies. They combine the power of GNNs with the ability to model temporal dynamics, making them well-suited for tasks involving dynamic graphs or spatiotemporal data, such as behavior recognition, traffic prediction [25,37], and human trajectory prediction [15].
Traditional GNNs operate on static graphs, treating each node and its connections independently without considering the temporal aspect. However, in many real-world scenarios, data evolves over time, and the relationships between entities are not fixed but change dynamically. STGNNs address this limitation by incorporating both spatial and temporal information, enabling them to capture the evolving dynamics in the data.
The STGAT mentioned in [15] is an actual application of STGNN. It combines the derived form of GNN, called GAT, with LSTM for human trajectory prediction. The fusion process is illustrated in Figure 6. The core method of combining the two is to use Graph Attention Networks (GAT) to aggregate neighbor node information without altering the temporal order. The fused information is then used as the input to the LSTM. In Figure 6, can represent both the time sequence and the preceding or succeeding positions. In this article, the improved version of STGAT is applied to training and recognition in network intrusion detection.
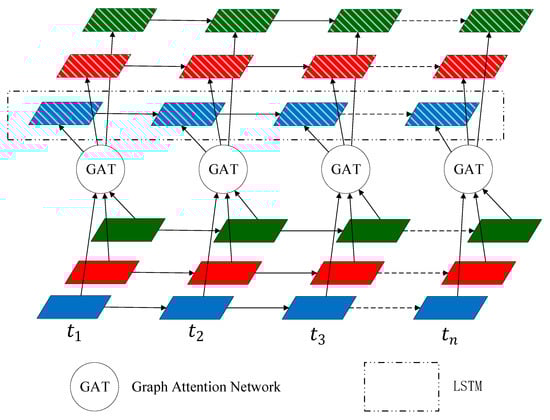
Figure 6.
The structure of STGAT demonstrates the fusion process of LSTM and GAT.
3.2. Datasets
In order to describe the proposed method more clearly, it is necessary to first introduce the datasets used in this article. The datasets used are NF-BoT-IoT-v2 and NF-ToN-IoT-v2 [38], and their descriptions are shown in Table 1:

Table 1.
Basic information of the datasets.
These two datasets are improved based on the original BoT-IoT [39] and ToN-IoT [40], where the network data are integrated into a stream fashion to make a complete network behavior.
The features in the aforementioned datasets are referred to as flow features, denoted as FI in this article. Since this article requires the use of node status information, but the dataset mentioned above’s feature space does not include these fields, 14 additional features were added to these two datasets based on the original datasets, outlined below.
This article refers to the features in Table 2 as node features, denoted as NI. With the above fields, the dataset is expanded into two parts, with a total of 57 fields.
Table 2.
Details of the newly added features.
Here is an explanation of the specific method we used to expand these datasets. The NF-BoT-IoT-v2 and NF-ToN-IoT-v2 datasets were obtained by processing the BoT-IoT and ToN-IoT datasets. In addition to the traffic features, the datasets for BoT-IoT and ToN-IoT also collected the state information of the nodes. Both the traffic features and the node state information include timestamps, allowing us to establish the correspondence between the traffic features and the node state information. The node state information is stored in the form of structured strings, and batch processing programs were used to format this information. Therefore, we expanded the datasets used in this paper by leveraging the original datasets of BoT-IoT and ToN-IoT. Table 3 and Table 4 provide some real examples of the expanded datasets.
Table 3.
Real example of the extended dataset NF-BoT-IoT-v2.
Table 4.
Real example of the extended dataset NF-ToN-IoT-v2.
4. Method Description
4.1. Problem Definition
Suppose there are nodes in a near-Earth sensing system, defined as . The data flows sent by each node are defined in chronological order as , where is the sequential number of the data flow. The purpose of this article is to identify the attack type () of the data flow () sent by node , as shown in Figure 7.
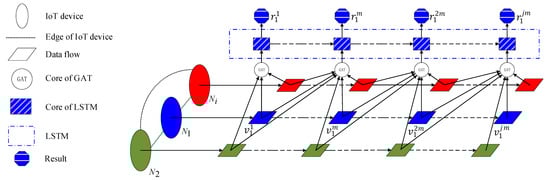
Figure 7.
Problem definition structure.
To solve the aforementioned issues, this article proposes the N-STGAT network intrusion detection system. As the goal of this article is to solve network intrusion detection problems in time series, a spatiotemporal graph neural network combining GAT and LSTM is used, which has good performance in identifying data flows with spatiotemporal sequences.
Figure 8 illustrates the system flow of N-STGAT. First, the extended dataset is preprocessed, and then , for training, and , for testing, are generated based on the graph construction rules. Then, the is fed into the training process of N-STGAT to obtain a trained model. Finally, the is input into the model for data flow classification.
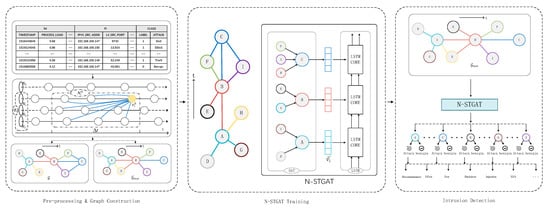
Figure 8.
The workflow of the proposed N-STGAT intrusion detection system. First, the dataset is preprocessed, and a graph is constructed for training and testing based on time-axis relationships and similarity rules (left). N-STGAT is used to train the model on the training graph, and the trained model is output (middle). Finally, the generated testing graph is input into the trained model for intrusion detection classification (right).
4.2. Pre-Processing and Graph Construction
To input the training data into GAT, the dataset needs to be transformed into a graph structure. Before constructing the graph, the dataset needs to be formatted to seamlessly apply to GAT. The flow-based dataset is collected through network monitoring tools, which capture and save packets that pass through nodes, switches, and routers. Then, the data packets are aggregated into flows using analysis tools. These datasets contain a wealth of important network information, including source and destination IP addresses, source and destination ports, byte counts, and other useful packet information. However, there are many data formats in the dataset that cannot be directly used for training, such as enumeration type, null value, and invalid value. Figure 9 shows the data processing process.
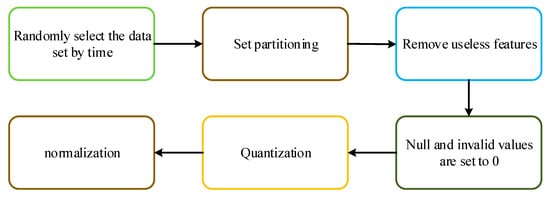
Figure 9.
Data preprocessing process.
The source IP address groups the dataset, and the time sequence of the data sorts each group flows. In this way, the dataset comprises thousands of chains of data flows. The data from time to is selected as the training dataset, and the data from to is selected as the testing dataset, as shown in Figure 10. Useless features such as IP addresses and ports are removed. There are also some invalid and empty values in the dataset, which are set to 0. Since the values of some fields in the dataset have an extensive range, quantification is needed. Finally, the remaining fields are normalized using L2 normalization.
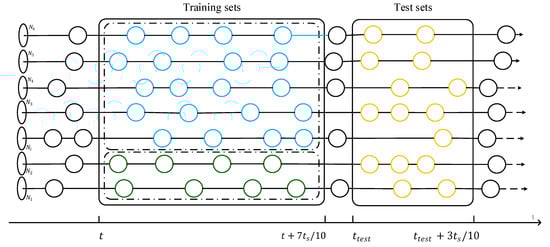
Figure 10.
Random selection of datasets. The blue circle represents the dataset used for training, the green represents the validation set, and the yellow represents the test set.
Once the datasets for training and testing are selected, it is necessary to build graphs based on specific rules. Graph construction is performed to find neighbors for nodes, so knowing the neighbor-finding process for one node is enough to construct the entire graph. The process of finding neighbors for nodes can be divided into two parts: finding neighborhood for node and finding neighborhood for node .
is obtained using the cosine similarity with the NI field of the dataset, as shown in Formula (3). The method is as follows: assuming the time when exists is , and the latest node before the time for any is , calculate the cosine similarity between and , if is more significant than 0.7, then add to . Here, represents the i-th feature value in ’s NI field, and represents the i-th feature value in ’s NI field.
In , all nodes (, including ) within ( to are neighbors of , and these nodes form the neighborhood of . Then, connect A and C to form an edge (E), which is a directed edge from to . In this article, is set to 3 s when constructing the graph using the method described above, resulting in the graph structure shown in Formula (4).
4.3. N-STGAT Training
The dataset contains two labels, “Label” and “Attack”. The “Label” indicates whether the data flow is an attack or not, while the “Attack” label defines the type of data flow. Therefore, the labels can be used for binary and multi-class classification training.
N-STGAT is described in Algorithm 1, and the pseudocode shows the process of integrating GAT and LSTM. In lines 3 to 6, GAT is used to calculate the hidden layer feature . Then, in line 7, is assigned to to participate in the LSTM calculation process. Lines 8 to 13 represent the LSTM calculation process. Finally, in line 16, the output (C) of LSTM is fed into a fully connected layer to obtain the final recognition result ).
| Algorithm 1: Pseudocode of the N-STGAT algorithm. | |
| Input: ) node features ; GAT weight matrices ; non-linearity ; LSTM weight matrices ; LSTM initialization | |
| Output: node features ; | |
| 1 | for = 1 to do |
| 2 | for to length() do |
| 3 | for to length() do |
| 4 | |
| 5 | end |
| 6 | |
| 7 | |
| 8 | |
| 9 | |
| 10 | |
| 11 | |
| 12 | |
| 13 | |
| 14 | end |
| 15 | end |
| 16 | //FC is fully connected layers |
The algorithm uses only one layer of the GAT model instead of multiple layers because multiple layers can make the features blur and not be conducive to recognition. Specifically, we add the cosine similarity between two nodes as a constraint to the calculation of attention coefficients in the attention coefficient calculation process in the 4th line, so that the graph information constructed in Section 4.2 can be better expressed. Its calculation method is shown in Equation (5). The similarity constraint is introduced because the aggregation of neighboring nodes may significantly impact the target node. By using the similarity constraint, we can effectively balance this situation. This improvement is not present in the original GAT and is a modification made in this paper.
In the equation, represents the similarity value between the k-th data stream of the i-th node and its j-th neighbor. denotes the p-th feature value of data stream , while represents the p-th feature value of data stream .
We conducted experiments with the hyperparameters shown in Table 5 for each dataset mentioned in the experiments to obtain the best training model. As mentioned above, we used a single-layer GAT model instead of a multi-layer one. To better represent node features, we expanded the original 53 features to 256 hidden layer features. GAT supports multi-head attention, but we only used single-head attention in this case since we introduced cosine similarity as a constraint for attention coefficient calculation. We used ReLU as the activation function and did not use a dropout rate. The cross-entropy function was used to calculate the training loss, and Adam was used for backpropagation optimization with a learning rate set to 0.002.
Table 5.
Hyperparameter values used in N-STGAT.
4.4. N-STGAT Detection
In the previous section, the N-STGAT model was obtained through model training. In the detection task, the test graph is input into the model . The 16th line of Algorithm 1 uses a fully connected layer to recognize the specific classification. Whether it is a binary or multi-classification problem, the softmax function is used to calculate the classification in the final layer of the fully connected layer to obtain the exact classification result.
5. Experimental Evaluation
5.1. Evaluation Metrics
To evaluate the performance of N-STGAT, experiments were conducted using the datasets mentioned in Section 3.2. Due to the large size of these datasets, 10% of the datasets were selected using the method described in Section 4.2 for experimentation, with 70% of the experimental dataset used for training and 30% for testing. Since only a portion of the dataset was used for experimentation, experiments were conducted multiple times for each algorithm and each dataset.
The proposed method was compared in the experiments with graph neural network-based methods (GAT, E-ResGAT, Anomal-E) and traditional machine learning methods (SVM, Random Forest). Therefore, evaluation metrics, as shown in Table 6, were used to assess the performance of all methods. TP, FP, FN, and TN represent true positive, false positive, true negative, and true negative in the confusion matrix, respectively. These evaluation metrics provide a comprehensive comparison of the superiority of the proposed method.
Table 6.
Performance comparison metrics for experiments.
5.2. Result
In the experiments, the accuracy and loss changes during the training process were first recorded, and then the recognition results for both binary and multi-class classification were evaluated based on the performance metrics in Section 5.1.
5.2.1. Loss and Accuracy Comparison in Training
The training accuracy changes for multi-class classification on different datasets are shown in Figure 11. The training accuracy of dataset NF-BoT-IoT-v2 quickly reached 90% before 20 epochs and remained stable above 95% after 100 epochs. Its validation accuracy was lower than the training accuracy throughout the entire training process but also stabilized above 92% in the end. The training accuracy of dataset NF-ToN-IoT-v2 was slightly lower than that of dataset NF-BoT-IoT-v2, with continuous growth before 600 epochs and stability above 93% after 700 epochs. The validation accuracy was also lower than the training accuracy throughout the entire training process but stabilized above 90% in the end.
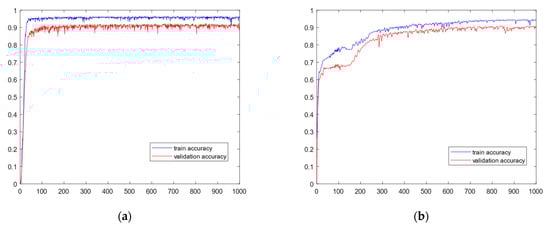
Figure 11.
The accuracy changes on different datasets. (a) Dataset NF-BoT-IoT-v2. (b) Dataset NF-ToN-IoT-v2.
The cross-entropy loss during the training process for multi-classification on different datasets is shown in Figure 12. For the dataset NF-BoT-IoT-v2, the training loss rapidly decreased to 0.6 before 100 epochs and stabilized around 0.4 after 200 epochs. The validation loss was higher than the training loss throughout the training process but also stabilized at about 0.7 in the end. For the dataset NF-ToN-IoT-v2, the training loss was slightly worse than that of NF-BoT-IoT-v2, and it continued to decrease before 600 epochs and then stabilized at 0.4 after 700 epochs. The validation loss was higher than the training loss throughout the training process but stabilized at 0.6 in the end.
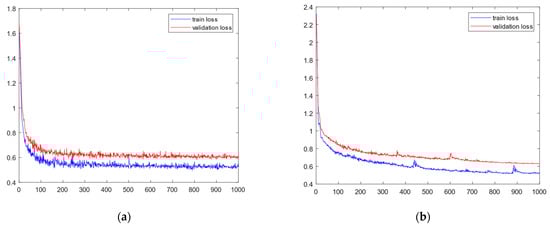
Figure 12.
The loss changes on different datasets. (a) Dataset NF-BoT-IoT-v2. (b) Dataset NF-ToN-IoT-v2.
5.2.2. Binary Classification Results
The results of the binary classification experiment using the “Label” label of the test set are shown in Table 7. In the binary classification task, the proposed method in this article outperforms the other 5 methods in terms of recall and accuracy, indicating that the proposed method has a better recognition accuracy. Additionally, the proposed method also performs well in precision, with results only 0.4% lower than E-GraphSAG in the NF-ToN-IoT-v2 dataset but higher than the other 5 methods. In terms of the F1-score, the proposed method outperforms the other 5 methods, indicating better stability of the proposed method.
Table 7.
Results of each method on binary classification.
5.2.3. Multiclass Classification Results
The results of the multi-class classification experiment using the “Attack” label of the test set are shown in Table 8 and Table 9. It can be seen from the results that the proposed method has superiority in multi-class problems, with high recognition rates for each category of different datasets. On the NF-BoT-IoT-v2 dataset, the proposed method has a 3.53–20.49% improvement in “Weighted Recall” and an 8.03–23.16% improvement in “Weighted F1-Score” compared to other methods. On the NF-ToN-IoT-v2 dataset, the proposed method has a 4.05–18.69% improvement in “Weighted Recall” and a 7.17–17.78% improvement in “Weighted F1-Score” compared to other methods.
Table 8.
Performance results for each algorithm over multiple classifications.
Table 9.
Recall results per class on the two datasets.
6. Conclusions
This article proposes a spatio-temporal graph attention network (N-STGAT) that considers node states and applies it to network intrusion detection in near-Earth remote sensing systems. A method is proposed for constructing graphs based on node state and the temporal characteristics of data flow, where data flow is viewed as nodes in the graph, and edges between nodes are constructed based on cosine similarity and time series features. A spatio-temporal graph neural network combining GAT and LSTM is applied to intrusion detection systems. Finally, experiments are conducted using the latest flow-based network intrusion detection dataset, and the proposed method is compared with existing methods to demonstrate its superiority and feasibility.
Author Contributions
Conceptualization, Y.W. and J.L.; data curation, H.Z.; formal analysis, Z.H.; investigation, Z.H.; methodology, Y.W. and W.Z.; project administration, J.L.; resources, Y.W.; software, Z.H.; supervision, X.H.; validation, Y.W., J.L. and W.Z.; writing—original draft, Y.W.; writing—review & editing, W.Z., L.W. and X.H. All authors have read and agreed to the published version of the manuscript.
Funding
This work was supported by the Key Science and Technology Project of Henan Province (201300210400).
Data Availability Statement
This article references four datasets: NF-BoT-IoT-v2, NF-ToN-IoT-v2, BoT-IoT, and ToN-IoT. The datasets NF-BoT-IoT-v2 and NF-ToN-IoT-v2 can be found at the following link: https://staff.itee.uq.edu.au/marius/NIDS_datasets/ (accessed on 22 September2022). The link for the BoT-IoT dataset is https://research.unsw.edu.au/projects/bot-iot-dataset (accessed on 24 September 2022). The link for the ToN_IoT dataset is https://research.unsw.edu.au/projects/toniot-datasets (accessed on 24 September 2022).
Conflicts of Interest
The authors declare no conflict of interest.
References
- Wang, D.; Zhang, J.; Du, B.; Xia, G.-S.; Tao, D. An Empirical Study of Remote Sensing Pretraining. IEEE Trans. Geosci. Remote. Sens. 2023, 61, 5608020. [Google Scholar] [CrossRef]
- Goswami, A.; Sharma, D.; Mathuku, H.; Gangadharan, S.M.P.; Yadav, C.S.; Sahu, S.K.; Pradhan, M.K.; Singh, J.; Imran, H. Change Detection in Remote Sensing Image Data Comparing Algebraic and Machine Learning Methods. Electronics 2022, 11, 431. [Google Scholar] [CrossRef]
- Sun, X.; Zhang, Y.; Shi, K.; Zhang, Y.; Li, N.; Wang, W.; Huang, X.; Qin, B. Monitoring water quality using proximal remote sensing technology. Sci. Total. Environ. 2022, 803, 149805. [Google Scholar] [CrossRef]
- Chen, J.; Chen, S.; Fu, R.; Li, D.; Jiang, H.; Wang, C.; Peng, Y.; Jia, K.; Hicks, B.J. Remote Sensing Big Data for Water Environment Monitoring: Current Status, Challenges, and Future Prospects. Earth’s Future 2022, 10, e2021EF002289. [Google Scholar] [CrossRef]
- Li, J.; Hong, D.; Gao, L.; Yao, J.; Zheng, K.; Zhang, B.; Chanussot, J. Deep learning in multimodal remote sensing data fusion: A comprehensive review. Int. J. Appl. Earth Obs. Geoinf. 2022, 112, 102926. [Google Scholar] [CrossRef]
- Lo, W.W.; Layeghy, S.; Sarhan, M.; Gallagher, M.; Portmann, M. E-GraphSAGE: A Graph Neural Network based Intrusion Detection System for IoT. In Proceedings of the NOMS 2022-2022 IEEE/IFIP Network Operations and Management Symposium, Budapest, Hungary, 25–29 April 2022; pp. 1–9. [Google Scholar] [CrossRef]
- Ferrag, M.A.; Shu, L.; Friha, O.; Yang, X. Cyber Security Intrusion Detection for Agriculture 4.0: Machine Learning-Based Solutions, Datasets, and Future Directions. IEEE/CAA J. Autom. Sin. 2022, 9, 407–436. [Google Scholar] [CrossRef]
- He, H.; Sun, X.; He, H.; Zhao, G.; He, L.; Ren, J. A Novel Multimodal-Sequential Approach Based on Multi-View Features for Network Intrusion Detection. IEEE Access 2019, 7, 183207–183221. [Google Scholar] [CrossRef]
- Lawal, M.A.; Shaikh, R.A.; Hassan, S.R. An Anomaly Mitigation Framework for IoT Using Fog Computing. Electronics 2020, 9, 1565. [Google Scholar] [CrossRef]
- Sarhan, M.; Layeghy, S.; Moustafa, N.; Portmann, M. NetFlow Datasets for Machine Learning-Based Network Intrusion Detection Systems. In Big Data Technologies and Applications; Deze, Z., Huang, H., Hou, R., Rho, S., Chilamkurti, N., Eds.; BDTA WiCON 2020; Lecture Notes of the Institute for Computer Sciences, Social Informatics and Telecommunications Engineering; Springer: Cham, Switzerland, 2020; Volume 371. [Google Scholar] [CrossRef]
- Kumar, P.; Gupta, G.P.; Tripathi, R. An ensemble learning and fog-cloud architecture-driven cyber-attack detection framework for IoMT networks. Comput. Commun. 2020, 166, 110–124. [Google Scholar] [CrossRef]
- Churcher, A.; Ullah, R.; Ahmad, J.; Rehman, S.U.; Masood, F.; Gogate, M.; Alqahtani, F.; Nour, B.; Buchanan, W.J. An Experimental Analysis of Attack Classification Using Machine Learning in IoT Networks. Sensors 2021, 21, 446. [Google Scholar] [CrossRef]
- Cheng, Q.; Wu, C.; Zhou, S. Discovering Attack Scenarios via Intrusion Alert Correlation Using Graph Convolutional Networks. IEEE Commun. Lett. 2021, 25, 1564–1567. [Google Scholar] [CrossRef]
- Caville, E.; Lo, W.W.; Layeghy, S.; Portmann, M. Anomal-E: A self-supervised network intrusion detection system based on graph neural networks. Knowl.-Based Syst. 2022, 258, 110030. [Google Scholar] [CrossRef]
- Huang, Y.; Bi, H.; Li, Z.; Mao, T.; Wang, Z. Stgat: Modeling Spatial-Temporal Interactions for Human Trajectory Prediction. In Proceedings of the IEEE/CVF International Conference on Computer Vision, Seoul, Korea, 27 October 2019–2 November 2019; pp. 6272–6281. Available online: https://openaccess.thecvf.com/content_ICCV_2019/html/Huang_STGAT_Modeling_Spatial-Temporal_Interactions_for_Human_Trajectory_Prediction_ICCV_2019_paper.html (accessed on 4 August 2022).
- Casas, P.; Mazel, J.; Owezarski, P. Unsupervised Network Intrusion Detection Systems: Detecting the Unknown without Knowledge. Comput. Commun. 2012, 35, 772–783. [Google Scholar] [CrossRef]
- Friha, O.; Ferrag, M.A.; Shu, L.; Maglaras, L.; Choo, K.-K.R.; Nafaa, M. FELIDS: Federated learning-based intrusion detection system for agricultural Internet of Things. J. Parallel Distrib. Comput. 2022, 165, 17–31. [Google Scholar] [CrossRef]
- Ferrag, M.A.; Shu, L.; Djallel, H.; Choo, K.-K.R. Deep Learning-Based Intrusion Detection for Distributed Denial of Service Attack in Agriculture 4.0. Electronics 2021, 10, 1257. [Google Scholar] [CrossRef]
- Raghuvanshi, A.; Singh, U.K.; Sajja, G.S.; Pallathadka, H.; Asenso, E.; Kamal, M.; Singh, A.; Phasinam, K. Intrusion Detection Using Machine Learning for Risk Mitigation in IoT-Enabled Smart Irrigation in Smart Farming. J. Food Qual. 2022, 2022, 1–8. [Google Scholar] [CrossRef]
- Vormayr, G.; Zseby, T.; Fabini, J. Botnet Communication Patterns. IEEE Commun. Surv. Tutor. 2017, 19, 2768–2796. [Google Scholar] [CrossRef]
- Bhuyan, M.H.; Bhattacharyya, D.K.; Kalita, J.K. Surveying Port Scans and Their Detection Methodologies. Comput. J. 2011, 54, 1565–1581. [Google Scholar] [CrossRef]
- Kambourakis, G.; Moschos, T.; Geneiatakis, D.; Gritzalis, S. Detecting DNS Amplification Attacks. In Critical Information Infrastructures Security; Lopez, J., Hämmerli, B.M., Eds.; CRITIS 2007; Lecture Notes in Computer Science; Springer: Berlin/Heidelberg, Germany, 2007; Volume 5141. [Google Scholar] [CrossRef]
- Leichtnam, L.; Totel, E.; Prigent, N.; Mé, L. Sec2graph: Network Attack Detection Based on Novelty Detection on Graph Structured Data. In Detection of Intrusions and Malware, and Vulnerability Assessment, Proceedings of the DIMVA 2020, 24–26 June 2020, Lisbon, Portugal; Lecture Notes in Computer Science; Maurice, C., Bilge, L., Stringhini, G., Neves, N., Eds.; Springer: Cham, Switzerland, 2020; Volume 12223. [Google Scholar] [CrossRef]
- Ali, A.; Zhu, Y.; Zakarya, M. Exploiting dynamic spatio-temporal correlations for citywide traffic flow prediction using attention based neural networks. Inf. Sci. 2021, 577, 852–870. [Google Scholar] [CrossRef]
- Ali, A.; Zhu, Y.; Zakarya, M. Exploiting dynamic spatio-temporal graph convolutional neural networks for citywide traffic flows prediction. Neural Netw. 2021, 145, 233–247. [Google Scholar] [CrossRef]
- Hao, J.; Liu, J.; Pereira, E.; Liu, R.; Zhang, J.; Zhang, Y.; Yan, K.; Gong, Y.; Zheng, J.; Zhang, J.; et al. Uncertainty-guided graph attention network for parapneumonic effusion diagnosis. Med. Image Anal. 2021, 75, 102217. [Google Scholar] [CrossRef]
- Jiang, W. Graph-based deep learning for communication networks: A survey. Comput. Commun. 2021, 185, 40–54. [Google Scholar] [CrossRef]
- Jiang, W.; Luo, J. Graph neural network for traffic forecasting: A survey. Expert Syst. Appl. 2022, 207, 117921. [Google Scholar] [CrossRef]
- He, X.; Deng, K.; Wang, X.; Li, Y.; Zhang, Y.; Wang, M. LightGCN: Simplifying and Powering Graph Convolution Network for Recommendation. In Proceedings of the 43rd International ACM SIGIR Conference on Research and Development in Information Retrieval (SIGIR ‘20), New York, NY, USA, 25 July 2020; pp. 639–648. [Google Scholar] [CrossRef]
- Sun, P.; Guo, Z.; Wang, J.; Li, J.; Lan, J.; Hu, Y. Deepweave: Accelerating Job Completion Time with Deep Reinforcement Learning-Based Coflow Scheduling. In Proceedings of the International Joint Conferences on Artificial Intelligence, Virtual, 19–26 August 2021; pp. 3314–3320. Available online: https://www.ijcai.org/proceedings/2020/0458.pdf (accessed on 4 October 2022).
- Xu, K.; Hu, W.; Leskovec, J.; Jegelka, S. How powerful are graph neural networks? arXiv 2018, arXiv:1810.00826. [Google Scholar] [CrossRef]
- Cai, H.; Zheng, V.W.; Chang, K.C.-C. A Comprehensive Survey of Graph Embedding: Problems, Techniques, and Applications. IEEE Trans. Knowl. Data Eng. 2018, 30, 1616–1637. [Google Scholar] [CrossRef]
- Veličković, P.; Cucurull, G.; Casanova, A.; Romero, A.; Liò, P.; Bengio, Y. Graph attention networks. arXiv 2017, arXiv:1710.10903. [Google Scholar] [CrossRef]
- Kipf, T.N.; Welling, M. Semi-supervised classification with graph convolutional networks. arXiv 2016, arXiv:1609.02907. [Google Scholar] [CrossRef]
- Hamilton, W.; Ying, Z.; Leskovec, J. Inductive Representation Learning on Large Graphs. In Proceedings of the Advances in Neural Information Processing Systems, Long Beach, CA, USA, 4 December 2017; Volume 30. Available online: https://proceedings.neurips.cc/paper_files/paper/2017/file/5dd9db5e033da9c6fb5ba83c7a7ebea9-Paper.pdf (accessed on 7 August 2022).
- Smagulova, K.; James, A.P. A survey on LSTM memristive neural network architectures and applications. Eur. Phys. J. Spéc. Topics 2019, 228, 2313–2324. [Google Scholar] [CrossRef]
- Yu, B.; Yin, H.; Zhu, Z. Spatio-temporal graph convolutional networks: A deep learning framework for traffic forecasting. arXiv 2017, arXiv:1709.04875. [Google Scholar] [CrossRef]
- Sarhan, M.; Layeghy, S.; Portmann, M. Towards a Standard Feature Set for Network Intrusion Detection System Datasets. Mob. Netw. Appl. 2021, 27, 357–370. [Google Scholar] [CrossRef]
- Koroniotis, N.; Moustafa, N.; Sitnikova, E.; Turnbull, B. Towards the development of realistic botnet dataset in the Internet of Things for network forensic analytics: Bot-IoT dataset. Futur. Gener. Comput. Syst. 2019, 100, 779–796. [Google Scholar] [CrossRef]
- Moustafa, N. A new distributed architecture for evaluating AI-based security systems at the edge: Network TON_IoT datasets. Sustain. Cities Soc. 2021, 72, 102994. [Google Scholar] [CrossRef]


Disclaimer/Publisher’s Note: The statements, opinions and data contained in all publications are solely those of the individual author(s) and contributor(s) and not of MDPI and/or the editor(s). MDPI and/or the editor(s) disclaim responsibility for any injury to people or property resulting from any ideas, methods, instructions or products referred to in the content. |
© 2023 by the authors. Licensee MDPI, Basel, Switzerland. This article is an open access article distributed under the terms and conditions of the Creative Commons Attribution (CC BY) license (https://creativecommons.org/licenses/by/4.0/).