

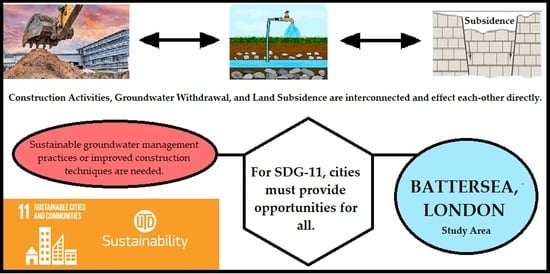
Lessons for Sustainable Urban Development: Interplay of Construction, Groundwater Withdrawal, and Land Subsidence at Battersea, London


Abstract
:
1. Introduction
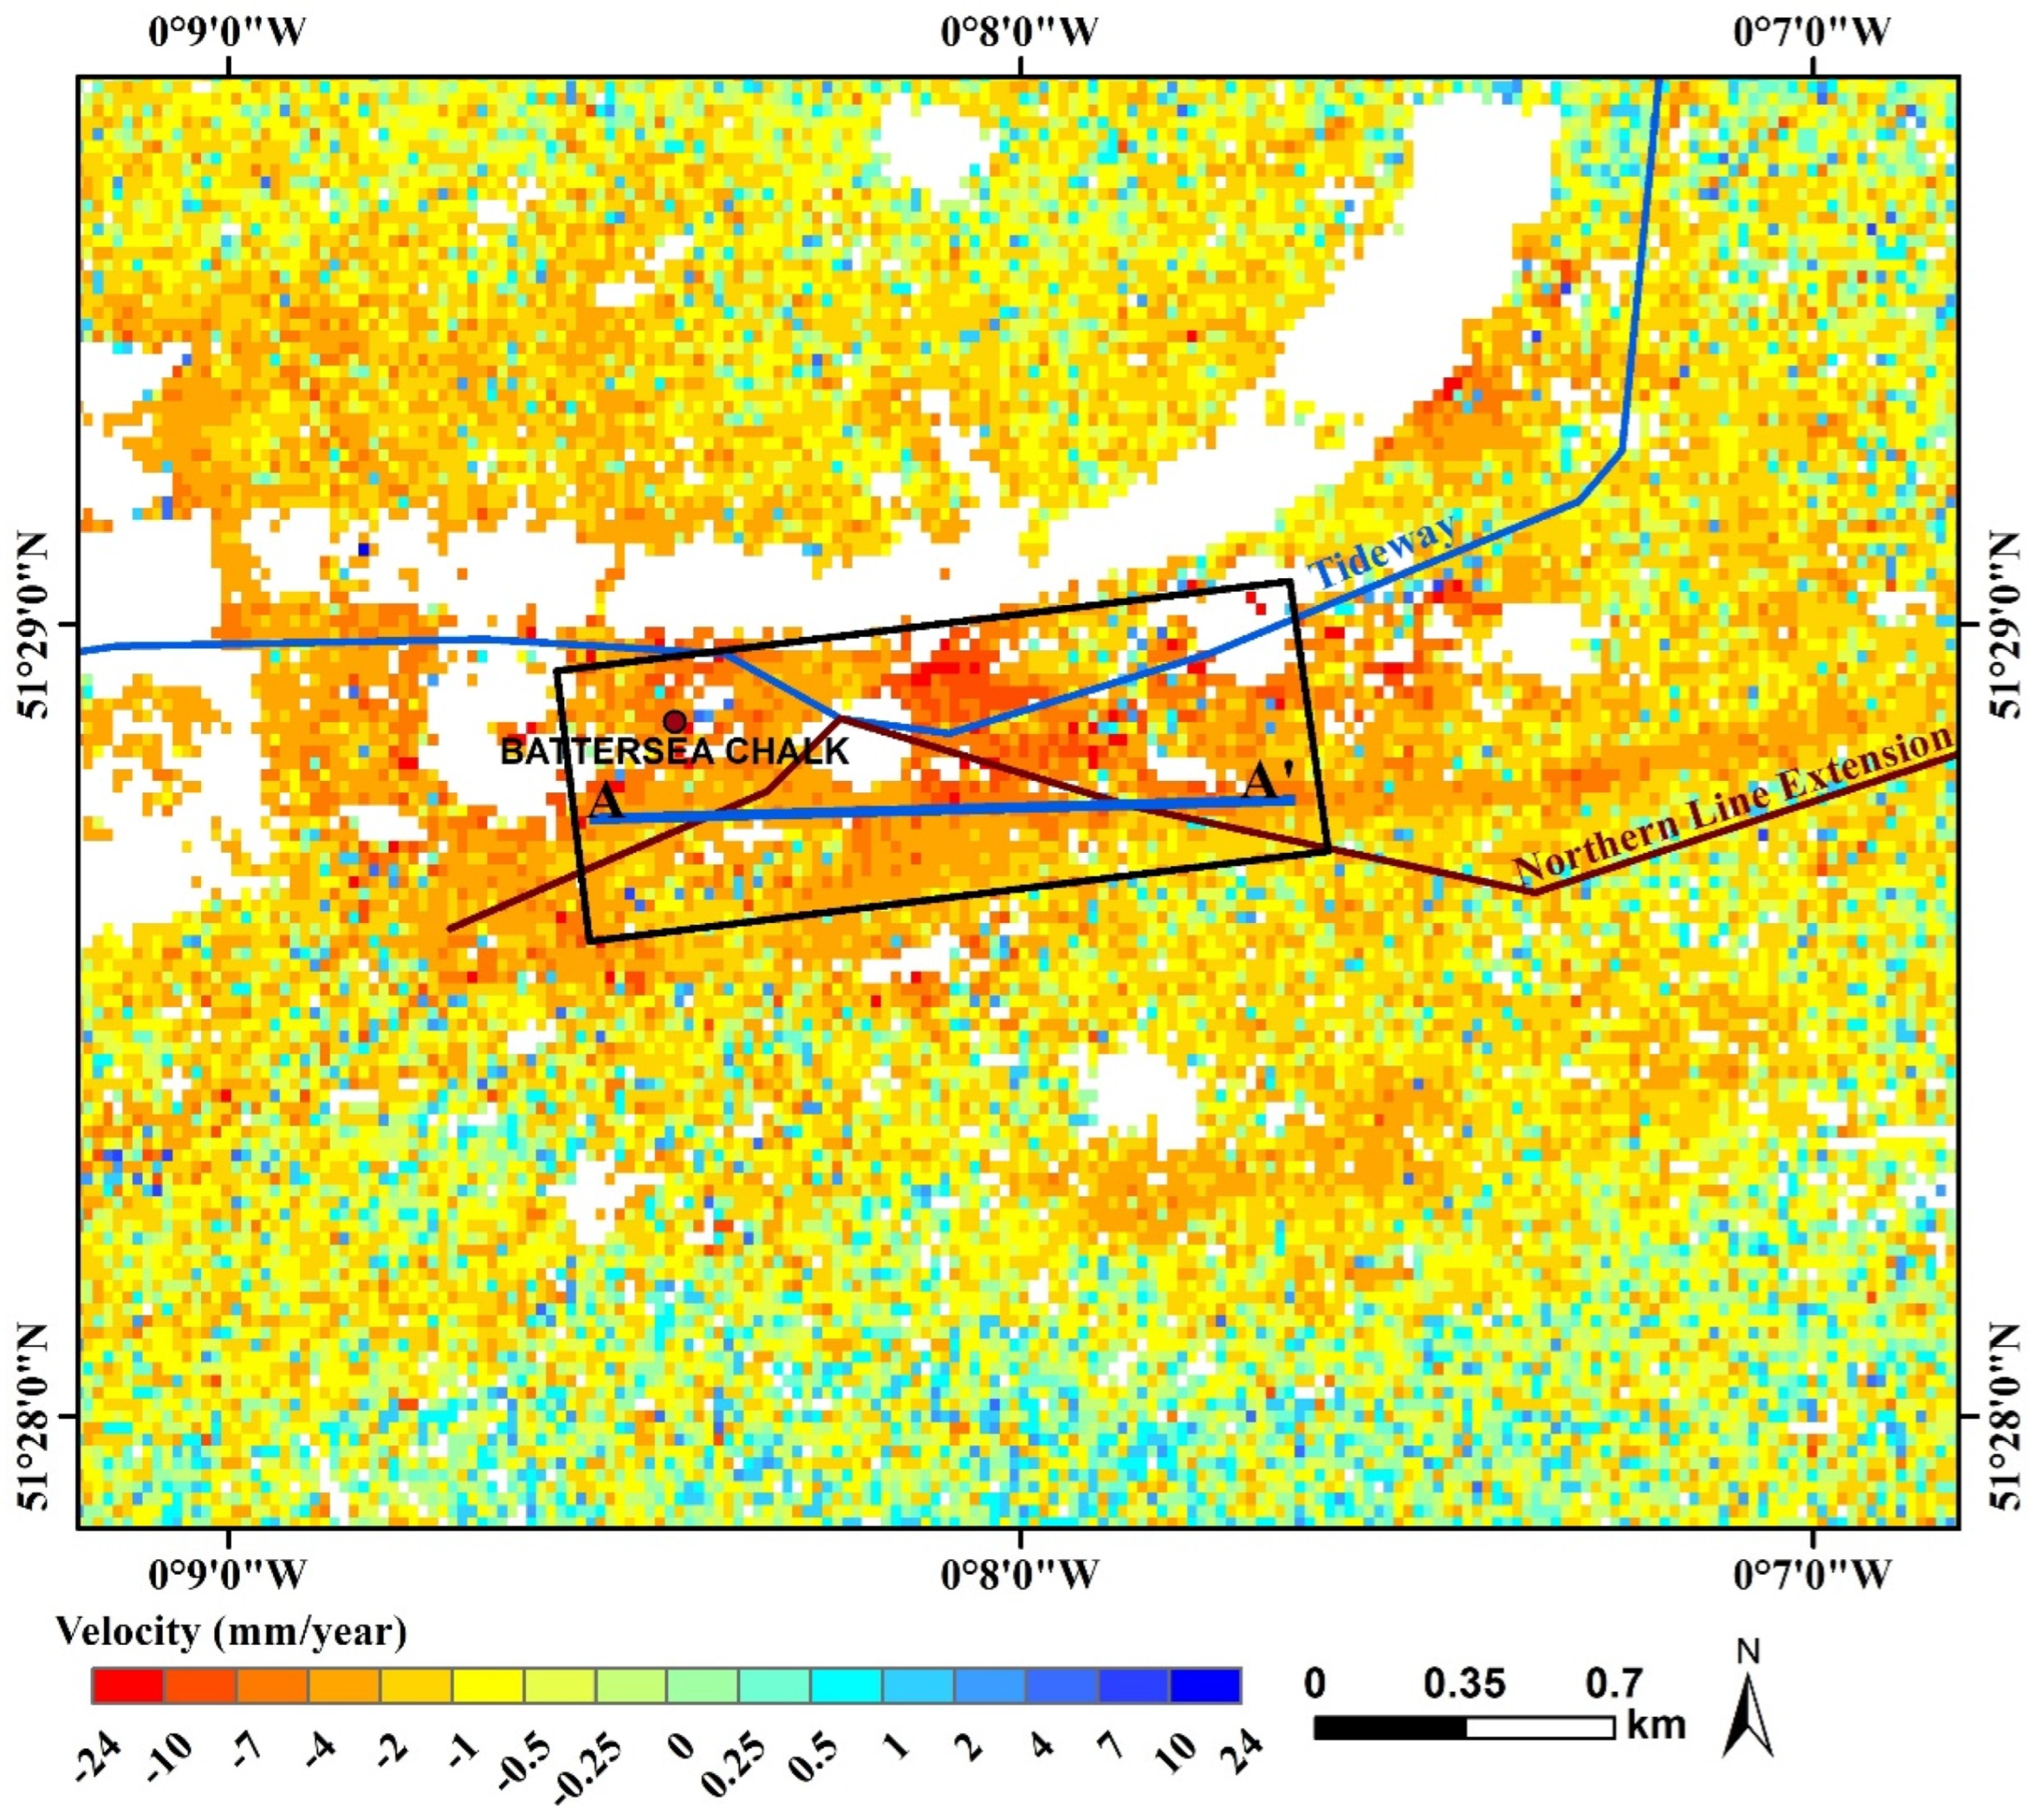
2. Study Area
3. Materials and Methods
3.1. Land Subsidence
3.2. Groundwater Variation
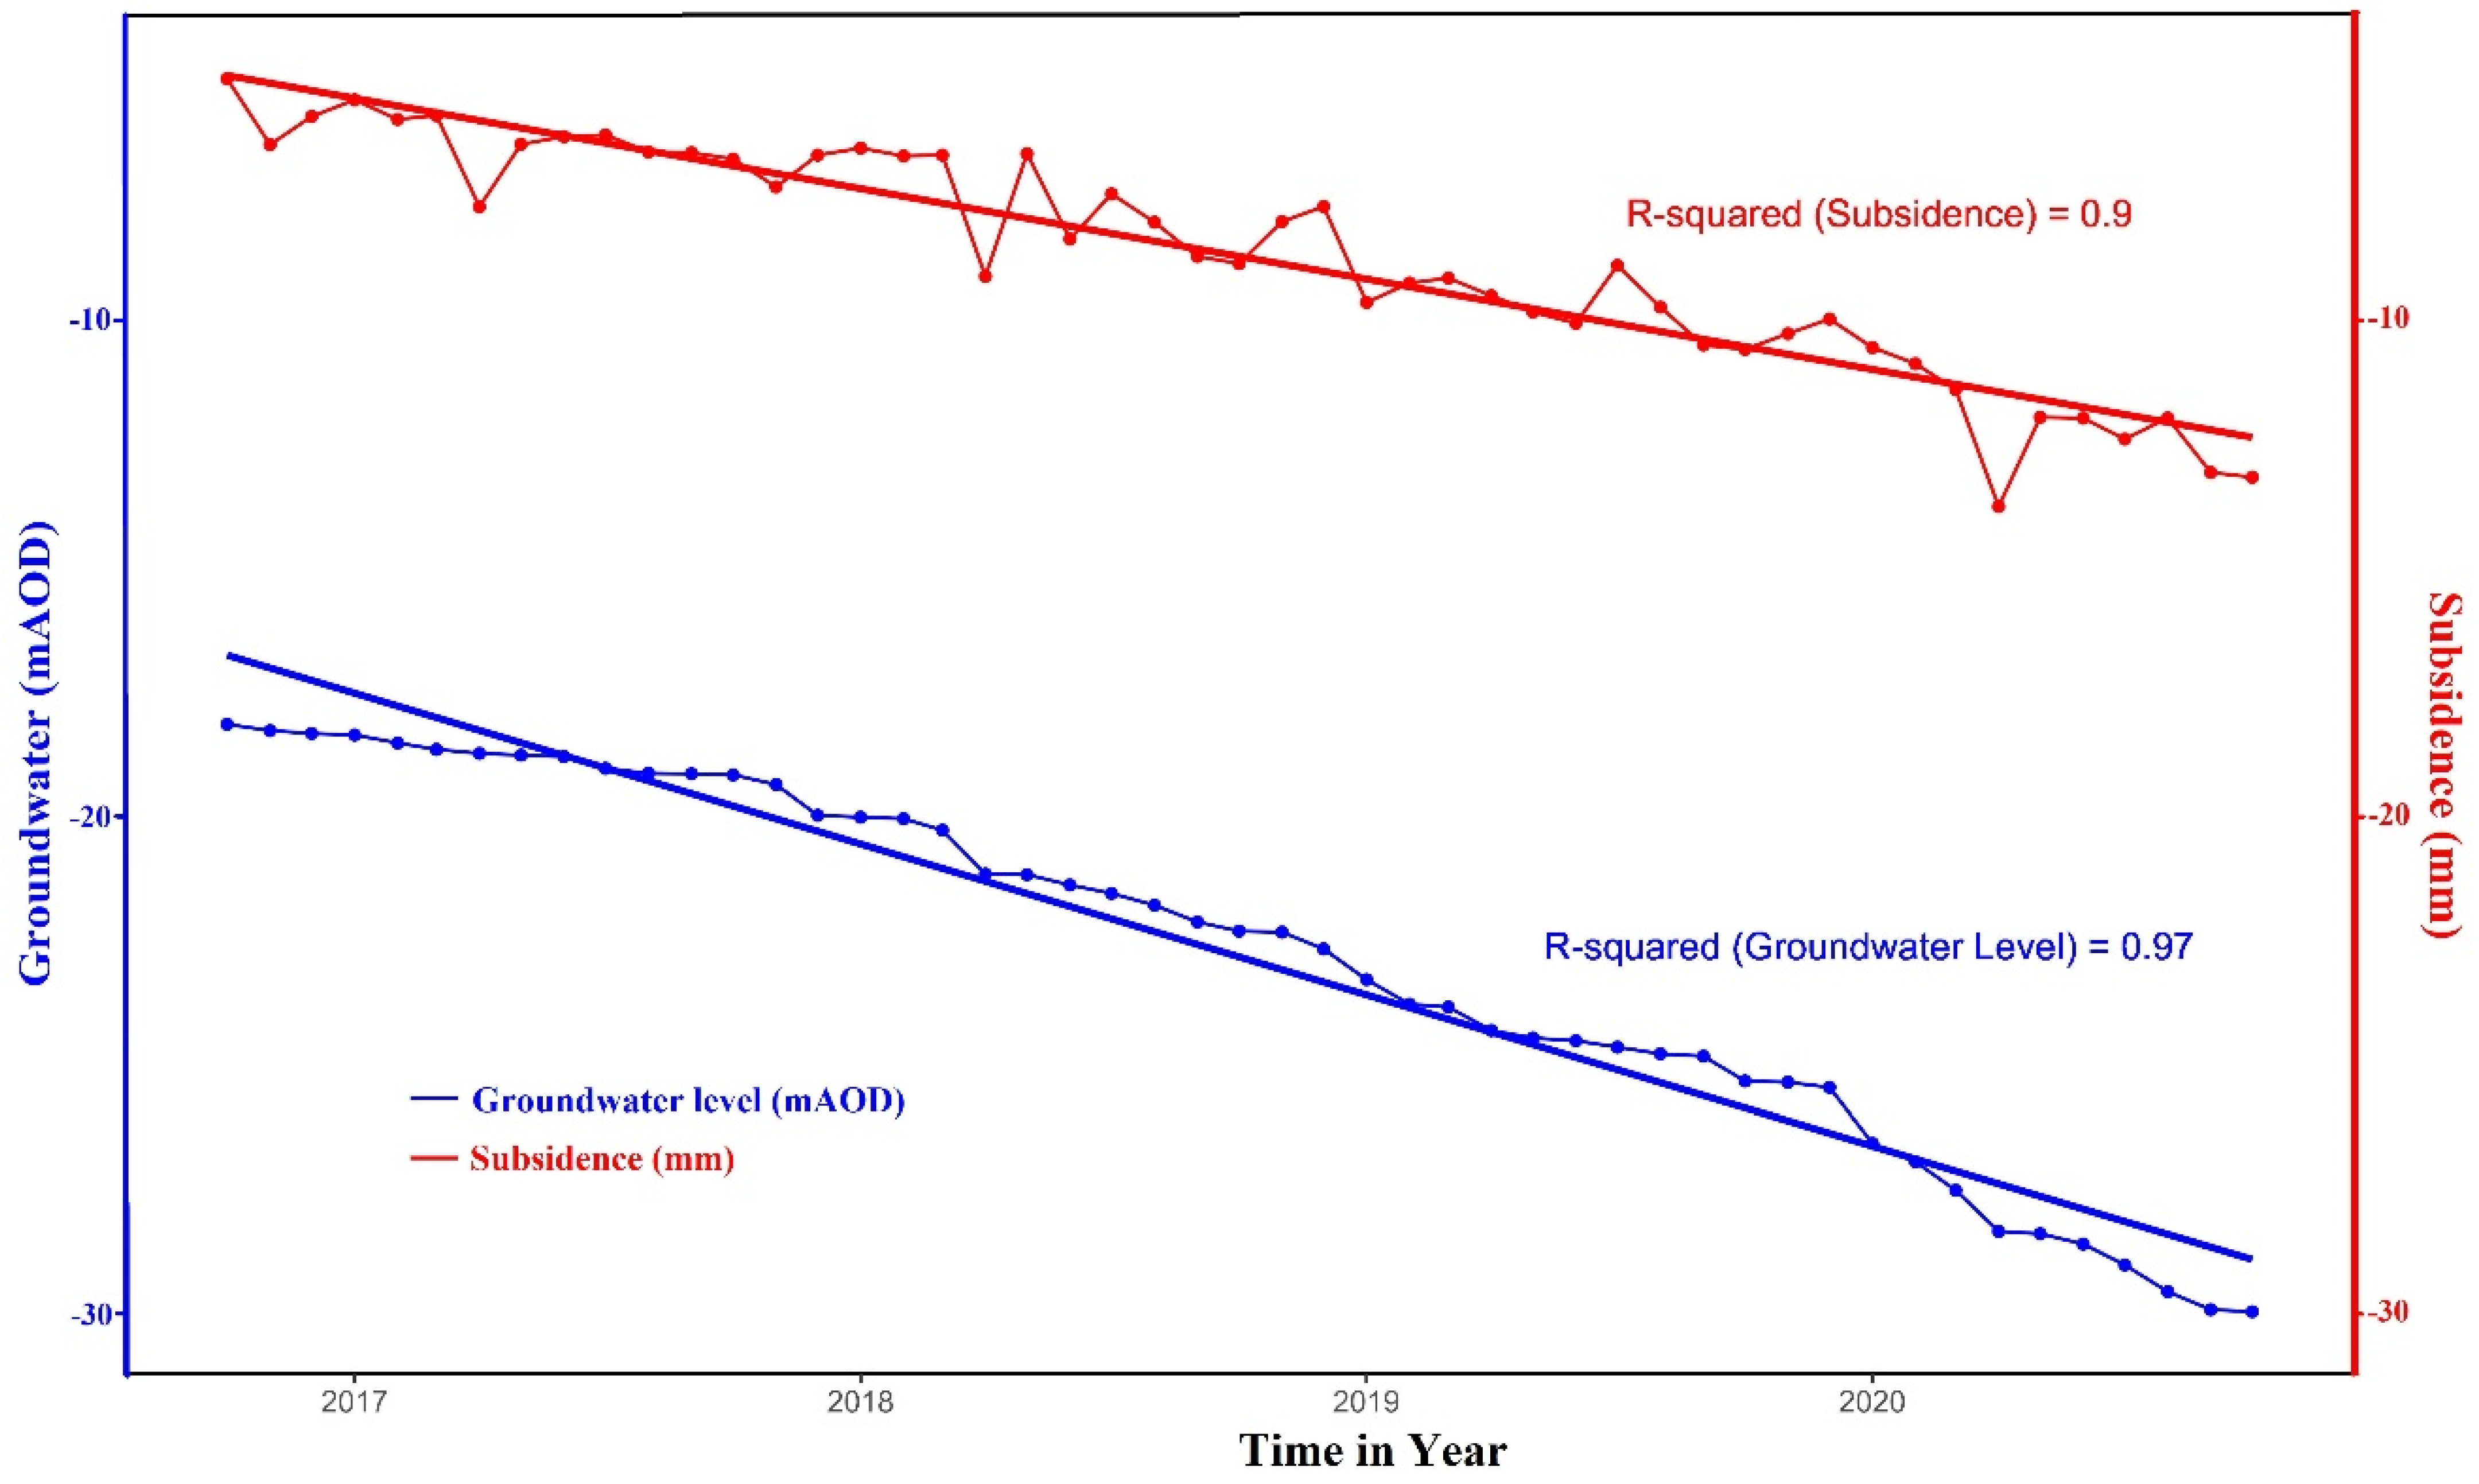
- The time-series dataset for groundwater levels and subsidence in the Battersea area were aligned for the same time periods. To align the time periods, the missing values were filled using ARIMA (autoregressive integrated moving average) [66], which combines three components: autoregression (AR), differencing (I), and moving average (MA).
- The data were normalised for both variables (groundwater level and subsidence) by converting the values into relative changes or percentage changes. This made the trends of both variables more comparable without being affected by the difference in units.
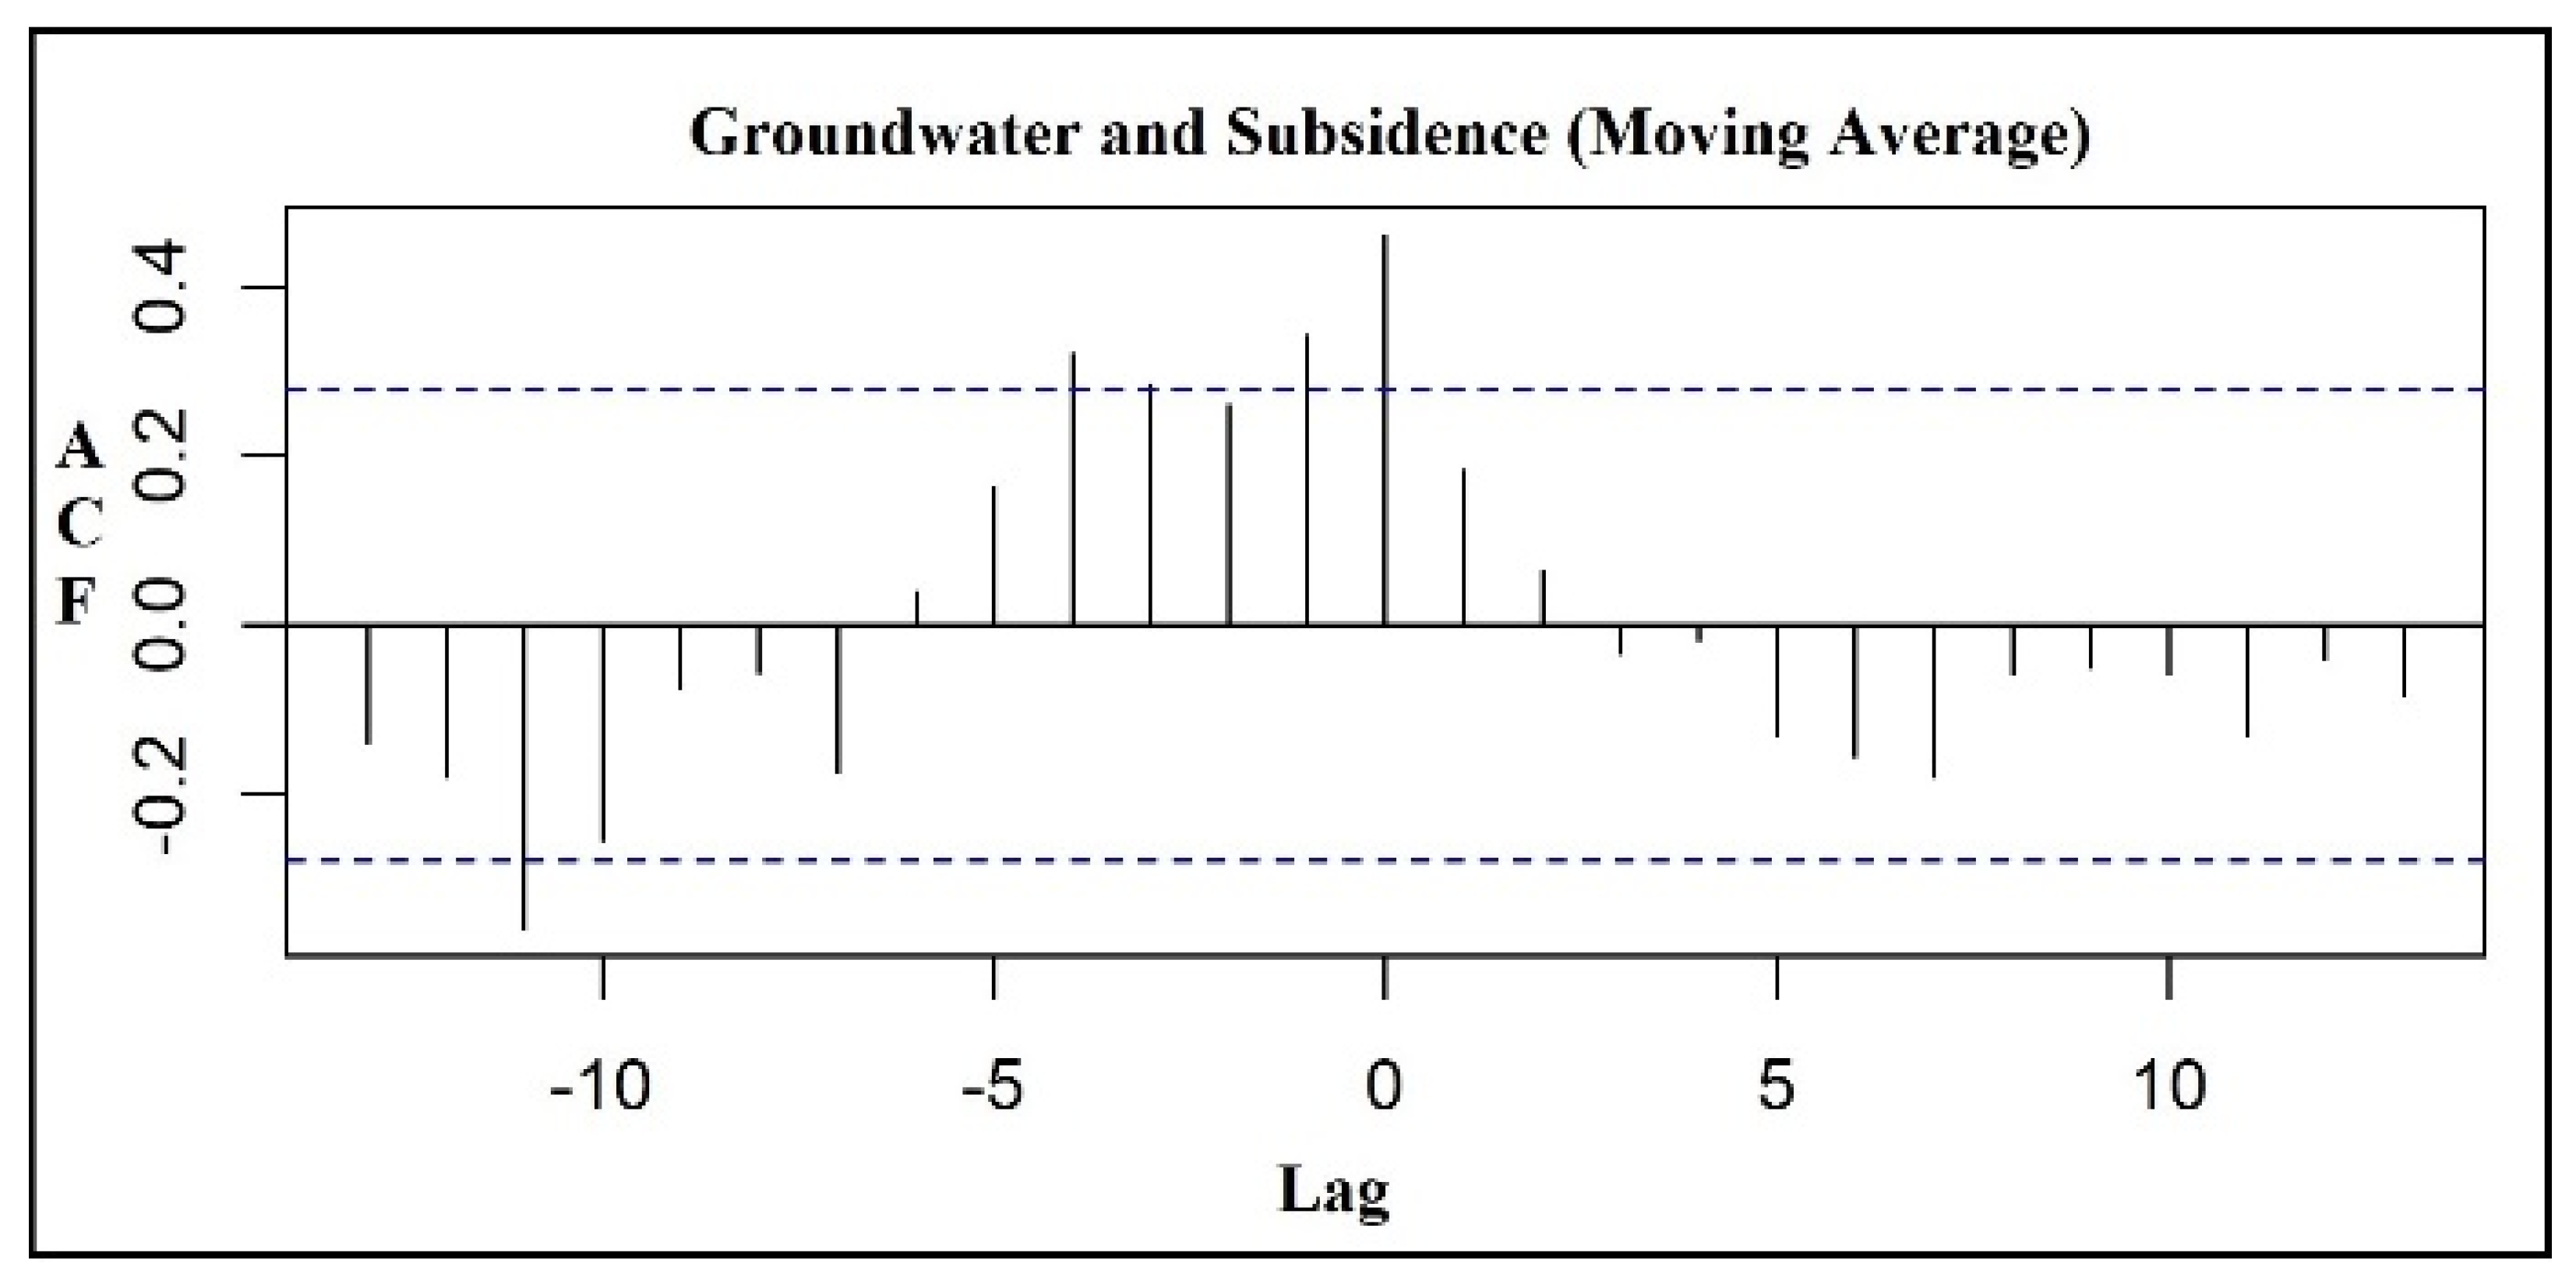
- The moving average was calculated for both variables to smooth the time-series data and highlight the underlying trends.
- Cross-correlation analysis [67]: The cross-correlation function was computed between the normalised time-series data for groundwater levels and subsidence rates. This helped to assess the strength and direction of the relationship between the two variables, as well as the time lag between them, if any.
- Based on the results of the trend analysis, cross-correlation analysis, and Granger causality test, the relationship between the temporal trends of groundwater levels and subsidence in the Battersea area was interpreted.
3.3. Construction Work Assessment
3.4. Trend Analysis
4. Results and Discussions
4.1. Land Subsidence
4.2. Correlation with Groundwater
4.2.1. Cross-Correlation Analysis
4.2.2. The Granger Causality Test
4.2.3. Correlation of Subsidence with Construction (Piling) Work
5. Conclusions
Author Contributions
Funding
Acknowledgments
Conflicts of Interest
References
- Werner, C.; Wegmüller, U.; Strozzi, T.; Wiesmann, A. Interferometric Point Target Analysis for Deformation Mapping. In Proceedings of the IGARSS 2003. 2003 IEEE International Geoscience and Remote Sensing Symposium, Toulouse, France, 21–25 July 2003. [Google Scholar] [CrossRef]
- Mora, O.; Mallorqui, J.J.; Broquetas, A. Linear and nonlinear terrain deformation maps from a reduced set of interferometric SAR images. IEEE Trans. Geosci. Remote Sens. 2003, 41, 2243–2253. [Google Scholar] [CrossRef]
- Cigna, F.; Jordan, H.; Bateson, L.; McCormack, H.; Roberts, C. Natural and Anthropogenic Geohazards in Greater London Observed from Geological and ERS-1/2 and ENVISAT Persistent Scatterers Ground Motion Data: Results from the EC FP7-SPACE PanGeo Project. Pure Appl. Geophys. 2015, 172, 2965–2995. [Google Scholar] [CrossRef] [Green Version]
- Changming, L.; Jingjie, Y.; Kendy, E. Groundwater exploitation and its impact on the environment in the North China Plain. Water Int. 2001, 26, 265–272. [Google Scholar] [CrossRef]
- Guppy, L.; Uyttendaele, P.; Villholth, K.G.; Smakhtin, V. Groundwater and Sustainable Development Goals: Analysis of Interlinkages; UNU: Shibuya, Japan, 2018. [Google Scholar]
- Massonnet, D.; Feigl, K.L. Radar interferometry and its application to changes in the earth’s surface. Rev. Geophys. 1998, 36, 441–500. [Google Scholar] [CrossRef] [Green Version]
- Zhou, X.; Chang, N.B.; Li, S. Applications of SAR interferometry in earth and environmental science research. Sensors 2009, 9, 1876–1912. [Google Scholar] [CrossRef] [Green Version]
- Zeevaert, L. Foundation problems related to ground surface subsidence in Mexico City. In Field Testing of Soils; ASTM International: West Conshohocken, PA, USA, 1962. [Google Scholar]
- Hannigan, P.J.; Goble, G.G.; Thendean, G.; Likins, G.E.; Rausche, F. Design and Construction of Driven Pile Foundations—Volume I; Office of Technology Applications, Federal Highway Administration: Washington, DC, USA, 1998.
- Sandanayake, M.; Zhang, G.; Setunge, S.; Thomas, C.M. Environmental emissions of construction equipment usage in pile foundation construction process—A case study. In Proceedings of the 19th International Symposium on Advancement of Construction Management and Real Estate; Springer: Berlin/Heidelberg, Germany, 2015; pp. 327–339. [Google Scholar]
- Kumar, M.; Panday, D.P.; Bhagat, C.; Herbha, N.; Agarwal, V.; Jain, V. Demystifying the decadal shift in the extent of groundwater in the coastal aquifers of Gujarat, India: A case of reduced extent but increased magnitude of seawater intrusion. Sci. Total Environ. 2023, 898, 165451. [Google Scholar] [CrossRef]
- Agarwal, V.; Kumar, A.; Gee, D.; Grebby, S.; Gomes, R.L.; Marsh, S. Comparative Study of Groundwater-Induced Subsidence for London and Delhi Using PSInSAR. Remote Sens. 2021, 13, 4741. [Google Scholar] [CrossRef]
- Agarwal, V.; Kumar, A.; Gomes, R.L.; Marsh, S. Monitoring of Ground Movement and Groundwater Changes in London Using InSAR and GRACE. Appl. Sci. 2020, 10, 8599. [Google Scholar] [CrossRef]
- Toms, E.; Mason, P.J.; Ghail, R.C. Drift-filled hollows in Battersea: Investigation of the structure and geology along the route of the Northern Line Extension, London. Q. J. Eng. Geol. Hydrogeol. 2016, 49, 147–153. [Google Scholar] [CrossRef]
- SLC. Sentinel-1A. 2020. Available online: https://sentinel.esa.int/web/sentinel/user-guides/sentinel-1-sar/resolutions/level-1-single-look-complex/ (accessed on 25 September 2020).
- Kang, Y.; Lu, Z.; Zhao, C.; Xu, Y.; Kim, J.W.; Gallegos, A.J. InSAR monitoring of creeping landslides in mountainous regions: A case study in Eldorado National Forest, California. Remote Sens. Environ. 2021, 258, 112400. [Google Scholar] [CrossRef]
- Kang, Y.; Zhao, C.; Zhang, Q.; Lu, Z.; Li, B. Application of InSAR techniques to an analysis of the Guanling landslide. Remote Sens. 2017, 9, 1046. [Google Scholar] [CrossRef] [Green Version]
- Even, M. Advanced InSAR processing in the footsteps of SqueeSAR. In Proceedings of the Fringe Workshop, Frascati, Italy, 23–27 March 2015. [Google Scholar]
- Ferretti, A. Satellite InSAR Data: Reservoir Monitoring from Space; EAGE Publications: Dubai, United Arab Emirates, 2014. [Google Scholar]
- Peltier, A.; Bianchi, M.; Kaminski, E.; Komorowski, J.C.; Rucci, A.; Staudacher, T. PSInSAR as a new tool to monitor pre-eruptive volcano ground deformation: Validation using GPS measurements on Piton de La Fournaise. Geophys. Res. Lett. 2010, 37. [Google Scholar] [CrossRef]
- Gonnuru, P.; Kumar, S. PsInSAR based land subsidence estimation of Burgan oil field using TerraSAR-X data. Remote Sens. Appl. Soc. Environ. 2018, 9, 17–25. [Google Scholar] [CrossRef]
- Karanam, V.; Motagh, M.; Garg, S.; Jain, K. Multi-sensor remote sensing analysis of coal fire induced land subsidence in Jharia Coalfields, Jharkhand, India. Int. J. Appl. Earth Obs. Geoinf. 2021, 102, 102439. [Google Scholar] [CrossRef]
- Scoular, J.; Ghail, R.; Mason, P.J.; Lawrence, J.; Bellhouse, M.; Holley, R.; Morgan, T. Retrospective InSAR analysis of East London during the construction of the Lee Tunnel. Remote Sens. 2020, 12, 849. [Google Scholar] [CrossRef] [Green Version]
- Milillo, P.; Giardina, G.; DeJong, M.J.; Perissin, D.; Milillo, G. Multi-temporal InSAR structural damage assessment: The London crossrail case study. Remote Sens. 2018, 10, 287. [Google Scholar] [CrossRef] [Green Version]
- Giardina, G.; Milillo, P.; DeJong, M.J.; Perissin, D.; Milillo, G. Evaluation of InSAR monitoring data for post-tunnelling settlement damage assessment. Struct. Control Health Monit. 2019, 26, e2285. [Google Scholar] [CrossRef] [Green Version]
- Chatterjee, R.; Fruneau, B.; Rudant, J.; Roy, P.; Frison, P.-L.; Lakhera, R.; Dadhwal, V.; Saha, R. Subsidence of Kolkata (Calcutta) City, India during the 1990s as observed from space by Differential Synthetic Aperture Radar Interferometry (D-InSAR) technique. Remote Sens. Environ. 2006, 102, 176–185. [Google Scholar] [CrossRef]
- Malik, K.; Kumar, D.; Perissin, D. Assessment of subsidence in Delhi NCR due to groundwater depletion using TerraSAR-X and persistent scatterers interferometry. Imaging Sci. J. 2019, 67, 1. [Google Scholar] [CrossRef]
- Malik, K.; Kumar, D.; Perissin, D.; Pradhan, B. Estimation of ground subsidence of New Delhi, India using PS-InSAR technique and Multi-sensor Radar data. Adv. Space Res. 2022, 69, 1863–1882. [Google Scholar] [CrossRef]
- Mishra, V.; Jain, K. Satellite based assessment of artificial reservoir induced landslides in data scarce environment: A case study of Baglihar reservoir in India. J. Appl. Geophys. 2022, 205, 104754. [Google Scholar] [CrossRef]
- Qin, Z.; Agarwal, V.; Gee, D.; Marsh, S.; Grebby, S.; Chen, Y.; Meng, N. Study of Ground Movement in a Mining Area with Geological Faults Using FDM Analysis and a Stacking InSAR Method. Front. Environ. Sci. 2021, 9, 787053. [Google Scholar] [CrossRef]
- Ge, D.; Zhang, L.; Li, M.; Liu, B.; Wang, Y. Beijing subway tunnelings and high-speed railway subsidence monitoring with PSInSAR and TerraSAR-X data. In Proceedings of the 2016 IEEE International Geoscience and Remote Sensing Symposium (IGARSS), Beijing, China, 10–15 June 2016; pp. 6883–6886. [Google Scholar]
- Jiang, H.; Balz, T.; Cigna, F.; Tapete, D. Land subsidence in Wuhan revealed using a non-linear PSInSAR approach with long time series of COSMO-SkyMed SAR data. Remote Sens. 2021, 13, 1256. [Google Scholar] [CrossRef]
- Heimlich, C.; Gourmelen, N.; Masson, F.; Schmittbuhl, J.; Kim, S.-W.; Azzola, J. Uplift around the geothermal power plant of Landau (Germany) as observed by InSAR monitoring. Geotherm. Energy 2015, 3, 1. [Google Scholar] [CrossRef]
- Arangio, S.; Calò, F.; Di Mauro, M.; Bonano, M.; Marsella, M.; Manunta, M. An application of the SBAS-DInSAR technique for the assessment of structural damage in the city of Rome. Struct. Infrastruct. Eng. 2014, 10, 1469–1483. [Google Scholar] [CrossRef]
- García, A.J.; Marchamalo, M.; Martínez, R.; González-Rodrigo, B.; González, C. Integrating geotechnical and SAR data for the monitoring of underground works in the Madrid urban area: Application of the Persistent Scatterer Interferometry technique. Int. J. Appl. Earth Obs. Geoinf. 2019, 74, 27–36. [Google Scholar] [CrossRef]
- Dzurisin, D.; Lisowski, M.; Wicks, C.W. Continuing inflation at Three Sisters volcanic center, central Oregon Cascade Range, USA, from GPS, leveling, and InSAR observations. Bull. Volcanol. 2009, 71, 1091–1110. [Google Scholar] [CrossRef]
- Liu, L.; Millar, C.I.; Westfall, R.D.; Zebker, H.A. Surface motion of active rock glaciers in the Sierra Nevada, California, USA: Inventory and a case study using InSAR. Cryosphere 2013, 7, 1109–1119. [Google Scholar] [CrossRef] [Green Version]
- Akcin, H.; Kutoglu, H.S.; Kemaldere, H.; Deguchi, T.; Koksal, E. Monitoring subsidence effects in the urban area of Zonguldak Hardcoal Basin of Turkey by InSAR-GIS integration. Nat. Hazards Earth Syst. Sci. 2010, 10, 1807–1814. [Google Scholar] [CrossRef]
- Dang, V.K.; Nguyen, T.D.; Dao, N.H.; Duong, T.L.; Dinh, X.V.; Weber, C. Land subsidence induced by underground coal mining at Quang Ninh, Vietnam: Persistent scatterer interferometric synthetic aperture radar observation using Sentinel-1 data. Int. J. Remote Sens. 2021, 42, 3563–3582. [Google Scholar] [CrossRef]
- Solarski, M.; Machowski, R.; Rzetala, M.; Rzetala, M.A. Hypsometric changes in urban areas resulting from multiple years of mining activity. Sci. Rep. 2022, 12, 2982. [Google Scholar] [CrossRef] [PubMed]
- Przyłucka, M.; Herrera, G.; Graniczny, M.; Colombo, D.; Béjar-Pizarro, M. Combination of conventional and advanced DInSAR to monitor very fast mining subsidence with TerraSAR-X data: Bytom City (Poland). Remote Sens. 2015, 7, 5300–5328. [Google Scholar] [CrossRef] [Green Version]
- Nádudvari, Á. Using radar interferometry and SBAS technique to detect surface subsidence relating to coal mining in Upper Silesia from 1993–2000 and 2003–2010. Environ. Socio-Econ. Stud. 2016, 4, 24–34. [Google Scholar] [CrossRef] [Green Version]
- Lu, Z.; Danskin, W.R. InSAR analysis of natural recharge to define structure of a ground-water basin, San Bernardino, California. Geophys. Res. Lett. 2001, 28, 2661–2664. [Google Scholar] [CrossRef] [Green Version]
- Carbognin, L.; Teatini, P.; Tosi, L. Eustacy and land subsidence in the Venice Lagoon at the beginning of the new millennium. J. Mar. Syst. 2004, 51, 345–353. [Google Scholar] [CrossRef]
- Hole, J.K.; Bromley, C.J.; Stevens, N.F.; Wadge, G. Subsidence in the geothermal fields of the Taupo Volcanic Zone, New Zealand from 1996 to 2005 measured by InSAR. J. Volcanol. Geotherm. Res. 2007, 166, 125–146. [Google Scholar] [CrossRef]
- Klemm, H.; Quseimi, I.; Novali, F.; Ferretti, A.; Tamburini, A. Monitoring horizontal and vertical surface deformation over a hydrocarbon reservoir by PSInSAR. First Break 2010, 28, 5. [Google Scholar] [CrossRef] [Green Version]
- Fan, H.D.; Cheng, D.; Deng, K.Z.; Chen, B.Q.; Zhu, C.G. Subsidence monitoring using D-InSAR and robability integral prediction modelling in deep mining areas. Surv. Rev. 2015, 47, 438–445. [Google Scholar] [CrossRef]
- Bateson, L.; Cigna, F.; Boon, D.; Sowter, A. The application of the Intermittent SBAS (ISBAS) InSAR method to the South Wales Coalfield, UK. Int. J. Appl. Earth Obs. Geoinf. 2015, 34, 249–257. [Google Scholar] [CrossRef] [Green Version]
- Zhou, L.; Guo, J.; Hu, J.; Li, J.; Xu, Y.; Pan, Y.; Shi, M. Wuhan surface subsidence analysis in 2015–2016 based on sentinel-1A data by SBAS-InSAR. Remote Sens. 2017, 9, 982. [Google Scholar] [CrossRef] [Green Version]
- Castellazzi, P.; Longuevergne, L.; Martel, R.; Rivera, A.; Brouard, C.; Chaussard, E. Quantitative mapping of groundwater depletion at the water management scale using a combined GRACE/InSAR approach. Remote Sens. Environ. 2018, 205, 408–418. [Google Scholar] [CrossRef]
- Cigna, F.; Tapete, D. Satellite InSAR survey of structurally-controlled land subsidence due to groundwater exploitation in the Aguascalientes Valley, Mexico. Remote Sens. Environ. 2021, 254, 112254. [Google Scholar] [CrossRef]
- Block, F.M.; Kho, T.-S. Engineering an icon or the probabilistic-based structural fire engineering of the battersea power station. Struct. Fire 2016. [Google Scholar]
- Penz, F.; Reid, A.; Thomas, M. Cinematic Urban Archaeology: The Battersea Case. In Cinematic Urban Geographie; Springer: Berlin/Heidelberg, Germany, 2017; pp. 191–221. [Google Scholar]
- Bowler, C.; Brimblecombe, P. Battersea Power Station and environmental issues 1929–1989. Atmos. Environ. Part B Urban Atmos. 1991, 25, 143–151. [Google Scholar] [CrossRef]
- Smith, A. Justifying and resisting public park commercialisation: The battle for Battersea Park. Eur. Urban Reg. Stud. 2019, 26, 171–185. [Google Scholar] [CrossRef]
- Suckling, T.P.; Gates, S.J. Challenging Piling Works Within Battersea Power Station. In Piling 2020: Proceedings of the Piling 2020 Conference; ICE Publishing: London, UK, 2021; pp. 97–102. [Google Scholar]
- Edgell, G.; Brooke, P.M. The rehabilitation of Battersea power station. In Proceedings of the International Masonry Society Conferences, Milan, Italy, 9–11 July 2018; pp. 917–935. [Google Scholar]
- Newman, T.; Hueso, O.; Goirigolzarri, M.M. Effects of changing geology on the performance of a tunnel boring machine for the Thames Tideway Tunnel, London, UK. In Proceedings of the Institution of Civil Engineers-Geotechnical Engineering; ICE Publishing: London, UK, 2022; pp. 1–14. [Google Scholar]
- Morley, M. The Battersea Channel: A former course of the River Thames? Lond. Archaeol. 2010, 12, 7. [Google Scholar]
- Flynn, A.; Collins, P.; Skipper, J.A.; Pickard, T.; Koor, N.; Reading, P.; Davis, J.A. Buried (drift-filled) hollows in London—A review of their location and key characteristics. Q. J. Eng. Geol. Hydrogeol. 2021, 54, 3. [Google Scholar] [CrossRef]
- Ferretti, A.; Prati, C.; Rocca, F. Nonlinear subsidence rate estimation using permanent scatterers in differential SAR interferometry. IEEE Trans. Geosci. Remote Sens. 2000, 38, 2202–2212. [Google Scholar] [CrossRef] [Green Version]
- Sarmap. PS Tutorial. 2014. Available online: http://www.sarmap.ch/tutorials/PS_Tutorial_V_0_9.pdf (accessed on 12 June 2023).
- Kim, J.; Kim, D.-J.; Kim, S.-W.; Won, J.-S.; Moon, W.M. Monitoring of urban land surface subsidence using PSInSAR. Geosci. J. 2007, 11, 59–73. [Google Scholar] [CrossRef]
- Sarmap. SARscape Help Manual. 2014. Available online: http://sarmap.ch/tutorials/Basic.pdf (accessed on 10 June 2023).
- EA. Management of the London Basin Chalk Aquifer; Environment Agency of England and Wales, Thames Region: Hertfordshire, UK, 2022.
- Ho, S.L.; Xie, M. The use of ARIMA models for reliability forecasting and analysis. Comput. Ind. Eng. 1998, 35, 213–216. [Google Scholar] [CrossRef]
- Podobnik, B.; Stanley, H.E. Detrended cross-correlation analysis: A new method for analyzing two nonstationary time series. Phys. Rev. Lett. 2008, 100, 84102. [Google Scholar] [CrossRef] [Green Version]
- Lopez, L.; Weber, S. Testing for Granger causality in panel data. Stata J. 2017, 17, 972–984. [Google Scholar] [CrossRef] [Green Version]
- Maziarz, M. A review of the Granger-causality fallacy. J. Philos. Econ. Reflect. Econ. Soc. Issues 2015, 8, 86–105. [Google Scholar] [CrossRef]
- Ward, E.J.; Dimitriou, H.T.; Wright, P.; Dean, M. Application of policy-led multi-criteria analysis to the project appraisal of the Northern Line Extension, London. Res. Transp. Econ. 2016, 58, 46–80. [Google Scholar] [CrossRef]
- Ward, E.J. Phase 2 Desk Study Report of Northern Line Extension; UCL Discovery: London, UK, 2014. [Google Scholar]
- Christine, H. Community, authenticity and newness: Obscuring financial motivations in transport and development projects through discourse at Battersea Power Station. In Discourse Analysis in Transport and Urban Development; Edward Elgar Publishing: Cheltenham, UK, 2023; pp. 199–211. [Google Scholar]
- Agarwal, V. Study of Groundwater Properties and Behaviour Using Geospatial Techniques. Ph.D. Thesis, University of Nottingham, Nottingham, UK, 2022. [Google Scholar]
- Grebby, S.; Sowter, A.; Gluyas, J.; Toll, D.; Gee, D.; Athab, A.; Girindran, R. Advanced analysis of satellite data reveals ground deformation precursors to the Brumadinho Tailings Dam collapse. Commun. Earth Environ. 2021, 2, 1–9. [Google Scholar] [CrossRef]
- Findeisen, F. Financing the Northern Line Extension: The politics of governing Greater London. Territ. Politics Gov. 2022, 10, 608–627. [Google Scholar] [CrossRef]
- Hannigan, C. Financialisation in Planning: Examining the Planning and Funding of the Vauxhall Nine Elms Battersea Opportunity Area and Northern Line Extension. Ph.D. Thesis, UCL (University College London), London, UK, 2019. [Google Scholar]
- Transport for London. Northern Line Extension—Transport for London. 2021. Available online: https://tfl.gov.uk/corporate/publications-and-reports/northern-line-extension (accessed on 21 May 2023).


| Parameter Measured | Study Area | Observation Period | SAR Sensor/Other Data Used | Result | Reference |
|---|---|---|---|---|---|
| Land uplift due to groundwater variation | San Bernardino, California | 1992–1993 | ERS 1,2 | 0.87 cm/month | [43] |
| Land subsidence due to groundwater variation | Venice | 1971–2002 | ERS-1, 2 and others | 3–5 mm/year | [44] |
| Land subsidence and groundwater variation | Kolkata, India | December 1992 to July 1998 | ERS 1,2 | 5 mm/year | [26] |
| Subsidence in the geothermal fields | Taupo Volcanic Zone (TVZ), New Zealand | 1996 to 2005 | ERS 1,2 and Envisat | −10 and +15 mm/year | [45] |
| Surface deformation monitoring over a hydrocarbon reservoir | Middle East | 2004–2007 | Envisat satellite and Radarsat-1 | Horizontal Deformations (1.8 mm/year), Vertical Deformation (4.8 mm/year). | [46] |
| Land subsidence due to groundwater and mining | Pangzhuang mining field, China | September 2004–December 2010 | ALOS PALSAR | 42 ± 15 mm | [47] |
| Ground motion over Coalfield | South Wales Coalfield, United Kingdom | 1992 and 1999 | ERS-1/2 | Uplift at centre of coalfield 1 cm/year. | [48] |
| Land subsidence and groundwater variation | Wuhan, China | April 2015 to April 2016 | Sentinel-1A | −82 mm/year to 18 mm/year | [49] |
| Groundwater depletion and land subsidence | Central Mexico | 2006–2011 | ALOS-1, GRACE, and others | 3620 MCm/year | [50] |
| Structurally controlled land subsidence due to groundwater exploitation | Aguascalientes Valley, Mexico | 1996–2020 | ERS-1/2, ENVISAT, Sentinel-1 | −10 cm/year to −14 cm/year | [51] |
| Data | Description |
|---|---|
| InSAR data | 99 Sentinel-1 SLC images, VV polarisation, Frame 422, Descending, IW Beam mode, Resolution: Azimuth: 20 m by Range: 5 m, Repeat Cycle: 12 days, Wavelength: 5.6 cm, C-band, Master Image: 1 November 2018, Time period: October 2016 to October 2020, Digital Elevation Model: SRTM V4, Software Used: ENVI SARscape, ArcGIS (ArcMap 10.2.2) |
| Groundwater Data | Borehole groundwater data from the United Kingdom Environment Agency |
| Piling Data | Projects by sheet piling and Martello piling |
| Location | Area (km2) | No. of PS | PS Density | Land Deformation (mm/year) | |||
|---|---|---|---|---|---|---|---|
| Max | Min | Mean | St. Dev. | ||||
| Battersea | 0.72 | 8124 | 11,745 | 0.5 | −18.71 | −6.8 | 1.6 |
| Granger Causality Test | ||||
|---|---|---|---|---|
| Model 1: Groundwater~Lags (Groundwater, 1:1) + Lags (Subsidence, 1:1) | ||||
| Model 2: Groundwater~Lags (Groundwater, 1:1) | ||||
| Res.Df | Res.Df | F | P r (>F) | |
| 1 | 38 | |||
| 2 | 39 | −1 | 6.5242 | 0.01477 * |
Disclaimer/Publisher’s Note: The statements, opinions and data contained in all publications are solely those of the individual author(s) and contributor(s) and not of MDPI and/or the editor(s). MDPI and/or the editor(s) disclaim responsibility for any injury to people or property resulting from any ideas, methods, instructions or products referred to in the content. |
© 2023 by the authors. Licensee MDPI, Basel, Switzerland. This article is an open access article distributed under the terms and conditions of the Creative Commons Attribution (CC BY) license (https://creativecommons.org/licenses/by/4.0/).
Share and Cite
Agarwal, V.; Kumar, A.; Qin, Z.; Gomes, R.L.; Marsh, S. Lessons for Sustainable Urban Development: Interplay of Construction, Groundwater Withdrawal, and Land Subsidence at Battersea, London. Remote Sens. 2023, 15, 3798. https://doi.org/10.3390/rs15153798
Agarwal V, Kumar A, Qin Z, Gomes RL, Marsh S. Lessons for Sustainable Urban Development: Interplay of Construction, Groundwater Withdrawal, and Land Subsidence at Battersea, London. Remote Sensing. 2023; 15(15):3798. https://doi.org/10.3390/rs15153798
Chicago/Turabian StyleAgarwal, Vivek, Amit Kumar, Zhengyuan Qin, Rachel L. Gomes, and Stuart Marsh. 2023. "Lessons for Sustainable Urban Development: Interplay of Construction, Groundwater Withdrawal, and Land Subsidence at Battersea, London" Remote Sensing 15, no. 15: 3798. https://doi.org/10.3390/rs15153798
APA StyleAgarwal, V., Kumar, A., Qin, Z., Gomes, R. L., & Marsh, S. (2023). Lessons for Sustainable Urban Development: Interplay of Construction, Groundwater Withdrawal, and Land Subsidence at Battersea, London. Remote Sensing, 15(15), 3798. https://doi.org/10.3390/rs15153798