
I–D Threshold Analysis of Rainfall-Triggered Landslides Based on TRMM Precipitation Data in Wudu, China

1
School of Marine Science and Engineering, Jiangsu Center for Collaborative Innovation in Geographical Information Resource Development and Application, Nanjing Normal University, Nanjing 210023, China
2
Key Laboratory of Mountain Hazards and Earth Surface Processes, Institute of Mountain Hazards and Environment, Chinese Academy of Sciences, Chengdu 610029, China
3
China-Pakistan Joint Research Center on Earth Sciences, Institute of Mountain Hazards and Environment, Chinese Academy of Sciences, Chengdu 610029, China
*
Author to whom correspondence should be addressed.
Remote Sens. 2023, 15(15), 3892; https://doi.org/10.3390/rs15153892
Submission received: 9 July 2023
/
Revised: 1 August 2023
/
Accepted: 3 August 2023
/
Published: 6 August 2023
(This article belongs to the Topic Earth Observation Systems in Geology Mass Identification, Investigation and Inventory Mapping)
Abstract
:This study explored the applicability of TRMM, TRMM nonlinear downscaling, and ANUSPLIN (ANU) interpolation of three different types of precipitation data to define regional-scale rainfall-triggered landslide thresholds. The spatial resolution of TRMM precipitation data was downscaled from 0.25° to 500 m by the downscaling model considering the relationship between humidity, NDVI, and numerous topographic factors and precipitation. The rainfall threshold was calculated using the rainfall intensity–duration threshold model. The calculation showed that TRMM downscaled precipitation data have better detection capability for extreme precipitation events than the other two, the TRMM downscaling threshold was better than the ANU interpolation, and the cumulative effective rainfall of TRMM downscaling was preferred as the macroscopic critical rainfall-triggered landslide threshold for the early warning of the Wudu. The predictive performance of the rainfall threshold of 50% was better than the other two (10% and 90%). When the probability of landslide occurrence was 50%, the TRMM downscaled threshold curve was given by . The authors also analyzed the influence of factors such as topography landform and soil type on the rainfall threshold of landslides in the study area. The rainfall intensity of small undulating mountains was higher than that of medium and large undulating mountains, and the rainfall intensity of landslides peaks at high altitude mountains of 3500–5000 m.
1. Introduction
Physically-based models and empirical models are the main methods used to determine rainfall thresholds that trigger slope failure [1]. The availability of physically-based models is limited to specific slopes or small areas [2], whereas empirical models are more broadly applicable for regional-scale areas, including globally [3,4,5], Central America [6], the Ubaye Valley region of France [7], Papua New Guinea [8], the Bogowonto catchment, central Java, Indonesia [9], the Oltrepó Pavese basin, the northern Italian Apennines [10], the Rwanda region [11], and the Bailong River Basin, Gansu Province, China [12]. The accuracy of the statistical empirical model is highly dependent on the integrity of historical landslide inventories and the spatial–temporal characteristics of the available precipitation data [8,13,14]. As for the available precipitation data, in addition to being obtained through ground observation stations [10,11], they can also be obtained from several satellite precipitation products and reanalyzed precipitation products. The common gridded precipitation products are TRMM satellite products [3,4,5,6,8,9,12], ERA-Interim reanalysis products [7,9], IMERG satellite products [10,11], and SM2RAIN satellite products [10]. The most common statistical models are: “intensity–duration (I-D)” [6,8,12], “cumulative event rainfall–rainfall duration (E-D)” [8,11], and “antecedent rainfall” [9,10]. In addition, other statistical models have been proposed by some scholars [7]. The study shows that the I–D threshold model is widely used to construct rainfall thresholds for the occurrence of shallow landslides, and the gridded precipitation product has some potential for landslide early warning.
The maximum area of a single landslide obtained from global statistics does not exceed 20 km2 [15,16]. Most gridded precipitation data products have a low spatial resolution (0.25° × 0.25°, about 27.5 km × 27.5 km) and poor accuracy [17,18,19]. If gridded precipitation data products are used directly, the precipitation of multiple landslides will likely be the same, which will further increase the uncertainty of landslide event detection [9,10]. Spatial downscaling techniques can further improve resolution and data accuracy, which provides a possibility to solve the above problems. Mei et al. [20] downscaled MERRA-2 precipitation data using Random Forest (RF) and regression algorithms in High-mountain Asia regions and compared the applicability of original MERRA-2 precipitation data and MERRA-2 downscaled precipitation data (1 km spatial resolution) in this region. Jiang et al. [21] downscaled ERA5 precipitation data using Kriging and RF methods on the Tibetan Plateau and evaluated the detection capability of both data products for detecting extreme precipitation events. Ning et al. [22] obtained various TRMM downscaled precipitation data in the Tianshan Mountains based on RF, Partial Least Squares (PLS), and Random Forest-Partial Least Squares (RF-PLS) algorithms. They found that the spatial downscaling technology can improve the fit between TRMM precipitation data and observation station precipitation data, with the RF-PLS downscaling model’s spatial resolution of 500 m downscaled data the best applicable. The above research used different algorithms to downscale satellite precipitation products. It was found that the downscaled data can describe the spatial distribution pattern of regional precipitation in more detail and can better detect extreme precipitation events, which also indicates that downscaling is feasible in non-homogeneous terrain areas with a complex topography and high elevation.
This study considers the relationship between humidity, NDVI, and numerous topographic factors and precipitation, improves the spatial resolution of TRMM precipitation data from 0.25° to 500 m based on the RF machine learning method and compares and analyzes the ANUSPLIN (ANU) interpolated precipitation data and the original TRMM data. Based on different probabilities of landslide occurrence, the relationship between rainfall in the run-up to landslides and landslides was analyzed using different precipitation data, to establish a landslide rainfall threshold model to assess its prediction potential. The authors also discussed the correlation of thresholds with different intense rainfall events, topographic landforms, and soil types. This work attempts to answer two questions: (1) How applicable are remote sensing satellite data, remote sensing satellite nonlinear downscaling data based on the machine learning algorithm, and ANU interpolation data, for rainfall-triggering landslide-threshold prediction at regional scales where the station data are scarce? (2) What influencing factors are associated with rainfall thresholds for rainfall-triggered landslides in Wudu and where are they mainly manifested?
2. Wudu County
The Wudu area belongs to the high mountain valley area, and as one of the most serious landslide disaster areas in the Bailong River basin of Gansu Province, and even China, its precipitation changes mainly under the influence of the subtropical monsoon climate. It has been found that cumulative rainfall reaching a certain threshold could saturate soil, which in turn leads to ground susceptibility to landslides [23]. Bai et al. [24] analyzed the triggering of landslides and debris flows in Wudu using an antecedent soil moisture content model based on Wudu station precipitation data. In contrast, there are few ground observation stations in Wudu, and it is difficult to establish a landslide rainfall-threshold model for disaster prediction based on station data only. Wudu County is located in southeastern Gansu Province (Figure 1), in the middle reaches of the Bailong River, a tributary of the Jialing River. It spans latitude 32°47′–33°42′N and longitude 104°34′–105°38′E, and is 100.8 km long from north to south and 76.2 km wide from east to west, with a total area of 4683 km2. It sits in the Qinling Mountains, which are surrounded by three geomorphological units: the Tibetan Plateau, the Loess Plateau, and the Sichuan Basin [25]. Due to the strong uplift of neotectonic movement, the sharp down-cutting of river rush, and the formation of the mountain slope, the study area is characterized by interleaving terrain of precipitous mountains and valley basins with a general terrain of high in the north west and low in the south east [26].
Wudu County is influenced by a warm and humid subtropical monsoon climate. Due to the mountainous topography (deep valleys and high mountains), climatic conditions in the region vary considerably depending on the altitude and topographic position [27]. Its climatic characteristics include the following: rainfall is mostly concentrated in summer and autumn, with drier spring and winter months; the average annual precipitation amounts to 400–900 mm, with 75–85% of the precipitation concentrated in May–September; and rainfall events often last for several days and occur in short high-intensity events, such as the maximum precipitation of 40 mm in 1 h and 16.2 mm in 10 min, which is prone to cause landslides [24]. There are mainly seven types of soils in the Wudu area, including tidal soil, cinnamon soil, brown soil, rice soil, and yellow-brown soil. Soil-forming matrices are mainly flooded matrices, yellowish matrices, residual matrices, and slope-deposited matrices. Soil texture is mainly sandy gravel soil, and chalky soil is mainly distributed along the river banks and valleys in the territory, mostly alluvial and flooded materials [28].
3. Data and Methods
3.1. Data
Five data types were used: multi-source remote sensing type data (TRMM 3B42 precipitation data, MOD13A3 NDVI data, SRTM DEM data), landslide data, landform data, soil texture data, and ground observation station data (Table 1). The TRMM 3B42 precipitation data were extracted, coordinated, and cropped with the help of ENVI to obtain daily precipitation data. The MOD13A3 NDVI data reflect subsurface features such as vegetation cover in the study area. The SRTM DEM data characterize elevation and extract relevant topographic factors. There were 295 pieces of landslide data, of which 260 were randomly selected for the calculation of rainfall thresholds for landslide occurrence, the remaining 35 pieces of data were used for accuracy verification after the calculation of thresholds, and an additional 1/4 of the grid numbers were randomly selected as a non-landslide sample in the calculation. Landform data and soil texture data were used in the analysis of rainfall thresholds for different types of landslides. The data from ground observation stations included daily precipitation and relative humidity data from 75 stations in and around the study area (Figure 1). Overall, 67 stations were randomly selected for precipitation data for ANUSPLIN interpolation and the construction of downscaling models. The remaining eight stations were checked for accuracy, while the relative humidity data were only used in the construction of downscaling models. The time series of all data used in this study are consistent with Bai et al. [24], as detailed in Bai et al. [24].
3.2. Methods
3.2.1. Downscaling Model Construction
Precipitation is affected by many factors in the formation process [29], including geographical location and geomorphology, which directly determine the amount of moisture available. The formation of clouds that cause rain when air humidity reaches supersaturation, and topographic factors such as altitude, slope, and aspect, influence the cooling process of the air. Plant transpiration can increase air humidity, and vegetation coverage can also reflect the abundance of precipitation in the region. In addition, the NDVI values of the water body can introduce a large bias to the statistical results of TRMM precipitation values. Therefore, the NDVI values of the water body were excluded from the construction of the model to simulate better precipitation values. In this study, based on precipitation data from 67 ground observation stations, seven geo-environmentally influential factors such as longitude (Figure 2a), latitude (Figure 2b), DEM (Figure 1), slope (Figure 2c) and aspect (Figure 2d), NDVI (Figure 2e), and humidity (Figure 2f) indicators were selected as independent variables. The Random Forest (RF) spatial downscaling model was constructed by using the Random Forest module of the R language.
Random Forest, a typical representative of the Bagging algorithm, is a categorizer that uses multiple trees to exercise and test sample data and is essentially an improvement on the decision tree algorithm [30,31]. The RF model combines multiple classifications and regression trees, inheriting and developing the advantages of categorical regression trees [32]. The main idea of the RF model is to establish a nonlinear function between input variables and output precipitation variables based on a regression tree:
where: denotes the precipitation values at the observation station during the training stage; is the input vector that represents the input variables, including longitude, latitude, elevation, slope, aspect, NDVI, relative humidity, and TRMM precipitation data; and is a nonlinear function that establishes a relationship between the input variables and the output PER.
Several decision trees are first built during the training period, each built from bootstrap samples, the training input data account for about 2/3 of the total samples, and the remaining (1/3) samples are used to validate each tree. To further improve the generalization ability of the Random Forest model, the final model’s prediction value is generated by arithmetically averaging the results of many independent regression trees, and the final model’s result is expressed as:
where: is the final prediction result, m is the number of regression trees, and represents the prediction result of the ith tree.
The specific process of downscaling is as follows: Firstly, the longitude, latitude, topography, NDVI, and humidity are resampled to be consistent with the spatial resolution (0.25° × 0.25°) of the TRMM precipitation data; then, the daily precipitation of the corresponding pixel of the TRMM data and the corresponding geographic and topographic, NDVI, and humidity factors of the point are extracted and included in the calculation of the RF downscaling model and verify its accuracy by using the precipitation data of the station not involved in the modeling. Currently, most downscaling studies are limited to 1 km × 1 km spatial resolution, but according to Ning et al. [22], it was found that downscaling precipitation data to a spatial resolution of 500 m can more finely describe the spatial and temporal characteristics of precipitation in mountainous areas. This study also found that more than 82% of the landslide points could be guaranteed to correspond to a single image element when using precipitation data with a spatial resolution of 500 m (Figure 1), while only 68% could be achieved when using precipitation data with a spatial resolution of 1 km. For this reason, combined with the downscaling model, the TRMM precipitation data with 500 m × 500 m resolution were obtained by using bilinear interpolation, thus enabling spatial scale conversion and comparative assessment of the accuracy of the downscaling model.
3.2.2. ANUSPLIN Interpolation
ANUSPLIN (ANU) is a tool for analyzing and interpolating multivariate data using planar smoothing spline functions, a synthesis and promotion of multiple linear regression, and is currently very widely used [26]. It is based on the interpolation theory of ordinary thin disks and local thin disk spline functions. The local thin disk smoothing spline is an extension of the thin disk smoothing spline prototype. The local thin disk smooth spline uses the optimal smoothing parameters to balance fidelity and smoothness and ensure reliable accuracy [33]. Compared to other interpolation methods (Kriging interpolation and inverse distance weighted interpolation) it allows the introduction of linear covariate sub-models in addition to the ordinary spline independent variables, such as coastline distance, elevation, and several other geographical factors as covariates.
The theoretical statistical model of local thin disk smoothing spline is:
where: is the dependent variable located at point i in space; is the unknown smoothing function to be estimated about , and is an independent variable; is the independent covariate; b is the coefficient of independent covariate; and is random error.
The function f and coefficient b are determined by least-squares estimation as follows.
where: is the roughness measure function of function , defined as the m order partial derivative of function (called spline number, also called roughness number); is a positive smoothing parameter that acts as a balance between data fidelity and the roughness of the surface and is usually determined in ANU using the minimization of the generalized cross-validation GCV and the minimization of the maximum likelihood method GML.
Using the ANU interpolation method and SRTM DEM elevation data as covariates, spatially interpolate the ground station precipitation data, and generate a cell size of 500 m × 500 m precipitation grid data (consistent with the spatial resolution of the TRMM downscaling in Section 3.2.1).
3.2.3. Calculation of landslide Rainfall Threshold
Caine threshold curves for the use of exponential functions to characterize the relationship between rainfall intensity and duration have profound implications for subsequent research on precipitation and landslides [1]. The authors use a rainfall intensity–duration forecast model, which is theoretically more scientific than single-factor forecast thresholds (minimum inspired rainfall intensity, minimum induced rainfall, etc.) due to the indirect consideration of rainfall process factors, and therefore has become the most common critical rainfall model internationally [34]. The effective rainfall duration and average rainfall intensity of landslide disasters satisfy the distribution of an exponential function:
where: and are coefficients, is the effective rainfall duration (day) and is the average effective rainfall intensity (mm/day). Thresholds for different landslide probabilities were calculated and evaluated. Before and can be determined, the effective precipitation for the first part of the landslide disaster has to be calculated as follows [35]:
where: is the effective rainfall, is the precipitation (mm) on the day before the landslide occurred, is the time between the day of that precipitation process and the occurrence of the landslide, and is the attenuation coefficient.
Taking into account the influence of the previous rainfall and the current day rainfall, and the variability of different regions, the k attenuation coefficient was set to 0.84, a value chosen based on Crozier [36], where the same value was used [24]. In addition, the correlation between the pre-accumulated rainfall of different durations and the landslide event data was analyzed, and it was found that the correlation between the pre-accumulated rainfall and the landslide event in the study area from the day of landslide occurrence to the first ten days showed a trend of increasing and then decreasing, and the correlation between the accumulated rainfall and landslide event data in the first two days had the highest peak value, and Jiang et al. [12] were consistent with the findings. For this reason, the authors consider the accumulated rainfall two days before the occurrence of landslides as the critical rainfall amount for inducing rainfall landslides in Wudu, which can be used as the key parameter to calculate the critical rainfall threshold in the study area.
The exact process can be seen in Figure 3.
3.2.4. Validation of Interpolation and Downscaling Model
The precipitation data calculated by the ANU interpolation and TRMM downscaling have some discrepancies with the precipitation data from ground observation stations. For this reason, two common evaluation indicators, the correlation coefficient ( ) and the root mean squared error ( ), were used in this study to verify and analyze their accuracy. indicates the correlation between the two, with a value closer to one indicating a better correlation, better interpolation, or higher downscaling model accuracy; measures bias and reflects the overall level of assessment error, with a smaller value indicating that the two are closer. The calculation formula for each index is as follows.
where: Pc represents interpolation or downscaling precipitation, Po represents station measured precipitation, and is the number of observation stations.
3.2.5. Validation of Landslide Rainfall Threshold
The work evaluated the predictive performance at different thresholds using Receiver Operating Characteristic (ROC) curves, the most common approach used in landslide warning research [37]. True-positive rate () is used to measure the proportion of landslides that are correctly predicted:
The false-positive rate () is used to measure the proportion of false positives in events when landslides do not occur:
where: true-positive () indicates that the threshold successfully predicts the number of landslides occurring; false-negative () means that the threshold does not predict the occurrence of landslides, but the number of landslides occurring is present; false-positive () indicates that the threshold predicted the number of landslides that occurred, however, no landslides occurred; true negative () indicates that the threshold correctly predicts the number of landslides that will not occur.
The values of TPR and FPR range from 0 to 1, with the highest performance when TPR = 1 and FPR = 0. To better measure the distance to the most optimal performing point, the Euclidean distance () was calculated for each threshold scenario. A smaller distance indicates a better prediction [38].
4. Results
4.1. Interpolation and Downscaling Validation
Our statistical analysis of the ANU interpolation, TRMM, and TRMM downscaling daily average precipitation data with the ground observation station daily average precipitation data showed (Figure 4) that the correlation coefficient (CC) between the interpolation results and the station data was 0.82 (Figure 4a) and passed the confidence test of 0.01, indicating that there was a significant linear correlation between them; the root mean square error (RMSE) of the interpolation results was 2.17 mm/day, indicating a small error. The CC of TRMM daily average precipitation data and station data was 0.64 (Figure 4b) and the RMSE was 4 mm/day, with the data passing the confidence test of 0.01. After downscaling, the CC was found to increase by 0.06 (Figure 4c) and the RMSE decreased by 0.36 mm/day, indicating that the TRMM results after downscaling were better than the original TRMM precipitation data. In contrast, the downscaling daily results were compared with the interpolation; both data effects passed the test, but the interpolated results correlated better with the ground stations and had less error, indicating that the interpolated daily results were better than the downscaling ones.
The above accuracy validation was carried out in terms of the coefficient of determination and the root mean square error, and to explore this more specifically, the authors also analyzed the differences between the three types of daily precipitation data, ANU interpolation, TRMM, and TRMM downscaled, and the data from ground stations (Figure 5). Looking at the trends throughout the year (Figure 5—Year), the four precipitation data trends were generally consistent, especially in September (Figure 5—Sep). Even so, the interpolated precipitation data are consistent with the station precipitation data, which is also the reason for the accurate daily average fit to the interpolated precipitation data. The precipitation data obtained from TRMM and TRMM downscaled were more consistent with the trends of the station data, mainly concentrated in February and April–December (Figure 5–Feb, Apr–Dec). In January (Figure 5–Jan) and March (Figure 5–Mar), some of the lower peaks of change in precipitation were often ignored. For example, the precipitation change from 1 to 2 January of the station was 0.34 mm, the interpolation change was 0.39 mm, and the downscaling was 0.02 mm, while TRMM had no change; also, the change from 3 to 5 March is not shown. However, in months with high precipitation, the interpolated precipitation data sometimes underestimated the precipitation, for example, the precipitation at the station on 5 May (Figure 5–May) was 16.95 mm, the interpolation was 13.41 mm, and the downscaled was 15.71 mm, also, on 10 June (Figure 5–Jun), 16 July (Figure 5–Jul), 29 August (Figure 5–Aug) and 6 September (Figure 5–Sep), etc., while in July-September the interpolated data were mostly lower than the station data. It can be seen that ANU interpolated precipitation data and TRMM downscaled data had their advantages and disadvantages. When compared to TRMM precipitation data, the former two types of data can be used. In addition, TRMM downscaled data are based on the original TRMM data, which improves the shortcomings of “overestimation of low values and underestimation of high values” of the original TRMM data. Especially in mountainous areas with complex topography landforms, TRMM downscaled data are better than the original TRMM data in all aspects. Therefore, it was sufficient to use TRMM downscaled data and ANU interpolated data in the subsequent study, and the corresponding two types of precipitation data are obtained by cropping the boundary data of the study area, and subsequently calculating the landslide rainfall thresholds for disaster prediction and early warning in Wudu.
4.2. Analysis and Validation of Landslide Rainfall Threshold
According to the different probabilities of occurrence of geological disasters, combined with the recommendations of local disaster prevention and mitigation departments and the contents of the study by Bai et al. [24], the probability warning levels of landslide disasters in the Wudu area were classified into four levels: extremely low (probability of occurrence ≤ 10%), low (10–50%), medium (50–90%) and high (≥90%). The extremely low probability ANU interpolated rainfall threshold curve for a 10% probability of landslide disaster was (Figure 6) and the TRMM downscaled rainfall threshold curve was (Figure 7); the previous two-day ANU interpolated cumulative effective rainfall was 1.54 mm (i.e., the actual rainfall was 1.56 mm) and the TRMM downscaled cumulative effective rainfall was 4.84 mm (i.e., the actual rainfall was 6.21 mm). The medium probability ANU interpolated rainfall threshold curve for a 50% probability of landslide disaster was , and the TRMM downscaled threshold curve was ; the previous two-day ANU interpolated cumulative effective rainfall was 18.57 mm (i.e., the actual rainfall was 20.1 mm) and the TRMM downscaled cumulative effective rainfall was 32.89 mm (i.e., the actual rainfall was 33.28 mm). The high probability ANU interpolated rainfall threshold curve for 90% probability of landslide disaster was , and the TRMM downscaling curve was ; the previous two-day ANU interpolated cumulative effective rainfall was 34.76 mm (i.e., the actual rainfall was 36.62 mm) and the TRMM downscaled cumulative effective rainfall was 56.16 mm (consistent with the actual rainfall). In this study, the two-day effective rainfall corresponding to the disaster threshold curve with a high probability of landslide occurrence of 90% was first selected for early warning, i.e., the previous two-day ANU interpolated cumulative effective rainfall was 34.76 mm and the TRMM downscaled cumulative effective rainfall was 56.16 mm, meaning that the probability of landslide disaster in Wudu area can reach 90%.
The ROC curve of the rainfall threshold is shown in Figure 8, and the statistical indicators of the threshold are summarized in Table 2. In Figure 8, a point represents one scenario of rainfall thresholds for one type of rainfall data, determined by thresholds for different landslide disaster probabilities, from right to left, with rainfall thresholds determined by three different percentile values (10, 50, and 90). Although the TRMM downscaled rainfall threshold had a lower TPR than that of the ANU interpolation (Figure 8), the TRMM downscaled threshold reduced the FPR, resulting in a higher AUC value (0.69) than the ANU interpolation (0.61). To determine the optimal threshold that satisfies the balance between TPR and FPR, six rainfall thresholds were compared for d. The rainfall threshold that possessed the shortest distance from the optimum point was the TRMM downscaled threshold for a 50% probability of landslide occurrence, where TPR was 0.5429 and FPR was 0.3912, and d was 0.6017 (Table 2). The ANU interpolation threshold of 50% probability of landslide occurrence outperformed the other two landslide occurrence probabilities (10% and 90%) with a TPR of 0.6571, FPR of 0.5644, and d of 0.6603. The furthest from the optimum point was the TRMM downscaled threshold with 90% probability, where TPR was 0.1429, FPR was 0.1064, and d was 0.8783.
4.3. Different Influencing Factors and Landslide Rainfall Thresholds
As rainfall-triggered landslides are the result of rainfall in combination with several other factors, such as geology, topography, and soil, based on the findings in Section 4.2 the correlation between different intense rainfall events, topographic landforms, soil types, and landslide rainfall thresholds was analyzed to within 50% probability of landslide occurrence using TRMM downscaled precipitation data.
4.3.1. Different Intense Rainfall Events and Thresholds
This time, the results showed that our collection of 295 rainfall-triggered landslides was mainly caused by six intense rainfall events (Figure 9). Figure 10 represents the relationship between these six intense rainfall events and rainfall intensity. Different intense rainfall events have different rainfall intensities and different expressions of rainfall threshold curves. The 9–10 June and 19–22 August events had about the same number of landslides, occurred in the northern part of the study area, and resulted in the same rainfall intensity (20 mm/day) (Figure 10b,d). The 14–16 May event had more landslides than the previous two events, but it occurred over a larger span of landslide locations (northwest to central), so it had the lowest rainfall intensity (Figure 10a). Although the number of landslides in the 30 July–2 August event was not as many as those in the 24 August and 16–19 September events, most of them were located in the southeast, with high rainfall and longer duration, while the landslides in the 24 August event were distributed in the northern part of the study area. The landslides that occurred in the 16–19 September event, although many, were similar to those that occurred in the 24 August event and were mostly distributed in the northern part of the study area, so the rainfall intensity of the 30 July–2 August event (Figure 10c) was higher than that of 24 August (Figure 10e) and 16–19 September (Figure 10f) events. The authors found that the higher the number of landslides triggered, the higher the intensity of rainfall, but this was also subject to geospatial influences, i.e., topography landform and subsurface, the values of which fluctuated somewhat.
4.3.2. Landforms and Thresholds
The spatial distribution of geomorphological types in the Wudu area is shown in Figure 11a. The geomorphological units in the study area are mainly LUMM (41.89% of the total area of the study area), MUMM (36.84%), SUMM (6.66%) and MULM (4.46%), in which the areas of plains, platforms, and hills are about the same, the area of hills is slightly lower than the other two, and the sum of the three accounts for 7.6%. Figure 11b indicates that the geomorphic units associated with the 295 landslides studied are MUMM (18.98%), SUMM (16.61%), LUMM (16.61%), and MULM (12.88%), with about the same number of landslides occurring in plains, platforms, and hills geomorphic units (the sum of the three accounts for 1/3 of the total number of landslides). The authors found that the landslides occurring in each geomorphic unit are not proportional to its area, which indicates that there may be some differences in the landslide sensitivity of different geomorphic units. Figure 12 represents the relationship between landform type and rainfall intensity at the time of landslide occurrence. The rainfall intensities of plains and platform landform units are similar, and those of hills are slightly lower than the other two. In terms of undulation, the rainfall intensity of the small undulating mountainous areas (above 40 mm/day) is significantly higher than that of the medium undulating mountainous area and the large undulating mountains, while the rainfall intensity of the large undulating mountainous areas (around 28 mm/day) is higher than that of the medium undulating mountainous area. From the aspect of altitude, the rainfall intensity is shown to rise first and then fall as the altitude rises, the performance effect is consistent with the distribution of precipitation, the rainfall intensity reaches the highest value in the high-altitude mountainous area, and this effect is most obvious in the middle undulating mountainous area, where the rainfall intensity in the MUHM reaches 34.95 mm/day.
4.3.3. Topographic Slopes and Thresholds
The spatial distribution of slope types in the Wudu area is shown in Figure 13a. The slope units in the study area are mainly steep slopes (35.57% of the total area of the study area), slopes (26.68%), sharp slopes (19.35%), gentle slopes (12.64%), dangerous slopes (3.19%) and flat slopes (2.57%). Figure 13b indicates that the slope units associated with the 295 landslides studied were slopes (31.86%), steep slopes (25.42%), gentle slopes (24.75%), sharp slopes (10.85%), flat slopes (4.75%), and dangerous slopes (2.37%). Figure 14 represents the relationship between slope type and rainfall intensity at the time of landslide occurrence. Among the six slope types, rainfall intensity is lowest for sharp slopes, about 20 mm/day for slopes, steep slopes, and dangerous slopes, and up to 40 mm/day for the other two types of flat and gentle slopes. The rainfall intensity fluctuates more as the slope increases but shows an overall trend of decreasing, which is consistent with the results of Ma et al. [39]. The rainfall intensity is lower for sharp and dangerous slopes because their slope is at about 45°, so the fraction perpendicular to the incline is greater in this case and will serve to hold the object in place.
4.3.4. Soils and Thresholds
The spatial distribution of soil types in the Wudu area is shown in Figure 15a. The soil units in the study area are mainly loam (88.64% of the total study area), sandy loam (8.74%), clay loam (2.31%), sandy clay loam (0.25%) and clay loam (0.06%). Figure 15b indicates that the soil units associated with the 295 landslides studied were loam (96.27%), sandy loam (2.03%), and clay loam (1.69%). Figure 16 represents the relationship between soil type and rainfall intensity at the time of landslide occurrence. Among the loam, sandy loam, and clay loam, the rainfall intensity of the sandy loam is the lowest, at less than 10 mm/day; the rainfall intensity of the clay loam is the highest, at over 40 mm/day; and the area and the number of landslides occurring on the loam are the highest, but its rainfall intensity is about 20 mm/day, which is about the same as the rainfall intensity used for modeling landslides in Section 4.2. The reasons for this occurrence may be that landslides are widely distributed in various areas of the study area, spanning a large area, and the same soil type can originate from different parent rock weathering materials and therefore have different hydrological properties.
5. Discussion
A total of three types of precipitation data, such as ANU interpolation, TRMM satellite, and TRMM downscaling were used in this study, which had their advantages and disadvantages. The data obtained from ANU interpolation were based on the interpolation of precipitation data from ground observation stations and elevation data, and these data performed better throughout the year (Figure 5 and Figure 17). The TRMM satellite precipitation data, obtained by satellite remote sensing inversion, performs better in months with more precipitation and worse in months with less precipitation (Figure 5 and Figure 18). The third type of data, obtained by downscaling using the RF model, shares and develops the advantages of the TRMM data in months with more precipitation, and was consistent with the findings of Ning et al. [22]. Especially, the detection ability for extreme precipitation was far better than ANU interpolation data and TRMM data. TRMM downscaled data performed better in months with less precipitation compared to TRMM data (Figure 5 and Figure 19), but the error was still larger compared to ANU interpolated data. The result might be related to the choice of the downscaling model, as the RF downscaling model is nonlinear and the laws of a small number of linear precipitation patterns for the study area cannot be fully described.
In summary, only TRMM downscaled precipitation data and ANU interpolated precipitation data need to be considered when using the rainfall intensity–duration threshold model for predictive analysis of landslide rainfall thresholds. The rainfall threshold prediction results based on TRMM downscaled precipitation data and ANU interpolated precipitation data were better, which indicated that the application of the two types of precipitation data in landslide prediction research was effective and could reflect the precipitation conditions before the occurrence of landslides more accurately. The authors also compared the two prediction results and found that TRMM downscaled data had better prediction performance than ANU interpolation for rainfall thresholds, indicating that TRMM downscaled data were more suitable for landslide rainfall threshold prediction. Meanwhile, the landslide dataset for the Wudu region was organized, and it was found that landslides in the area mostly occurred in May-September, which is basically consistent with the occurrence of extreme precipitation events. Therefore, the authors believe that TRMM downscaled precipitation data were best adapted for landslide rainfall threshold prediction in Wudu.
In addition, in terms of landslide occurrence probability, the rainfall threshold with 50% probability had better predictive performance than the other two, and Jiang et al. [12] are consistent with the findings. Furthermore, the correlation between the cumulative rainfall 2 days before the landslide occurrence and the landslide event data reached the highest peak value, which could be used as the key rainfall amount to induce the Wudu rainfall-triggered landslide. For this reason, a landslide rainfall threshold with a probability of 50% 2 days before the occurrence of the landslide was selected for early warning in this study. With 2-day TRMM downscaled cumulative effective rainfall of 32.89 mm (actual rainfall of 33.28 mm), the probability of landslide disaster in the Wudu area could reach 50%, and the TRMM downscaled cumulative effective rainfall (32.89 mm) should be prioritized to be chosen as the macroscopic critical threshold for rainfall-triggered landslide disaster early warning in the study area.
Subsequently, the authors also analyzed the relationship with landslide rainfall thresholds based on TRMM downscaled precipitation data in terms of different intense rainfall events, topographic landform types, and soil types. The rainfall intensity of small undulating mountainous areas is higher than that of medium undulating mountainous areas and large undulating mountainous areas in different topographic landform units, probably because the undulation of small undulating mountainous areas is 200–500 m, which is more suitable for the occurrence of shallow rainfall landslides. There are also reasons why most of the soil types in the study area are loams, which have moderate voids, good permeability, and strong water retention. In terms of altitude, the distribution of landslide rainfall intensity was consistent with that of rainfall. As the elevation increased, the landslide rainfall intensity showed a trend of first increasing and then decreasing and reached a peak in the high-altitude mountainous area of 3500–5000 m. Landslides originated mostly in high-altitude areas, where people were rare and rainfall stations were scarce, making it difficult for us to obtain real-time rainfall information. Therefore, the development of meteorological satellite downscaling technology is of great significance for the early warning of landslide disasters. To accurately analyze the relationship between landslides and precipitation, multiple downscaling models will be compared in the subsequent research.
6. Conclusions
In this study, the predictive performance of landslide rainfall thresholds in the Wudu area was evaluated based on different precipitation data and landslide occurrence probabilities, and landslide rainfall thresholds were analyzed in terms of intense rainfall events, topographic landform types, and soil types. The main conclusions were as follows: (1) ANU interpolated and TRMM downscaled data were more accurate than TRMM data. TRMM downscaled precipitation data had better detection capability for extreme precipitation events than the other two. (2) The TRMM downscaling threshold reduced the false alarm rate, resulting in its AUC value (0.69) being higher than that of the ANU interpolation (0.61), and the TRMM downscaling cumulative effective rainfall (32.89 mm) was preferred as the macroscopic critical threshold for rainfall-triggered landslide hazard early warning in the Wudu area. (3) The rainfall threshold with the shortest distance from the best point was the TRMM downscaling threshold, with a 50% probability of landslide occurrence and d of 0.6017. The rainfall threshold with a 50% probability of landslide occurrence had better prediction performance than the other two (10% and 90%). (4) The variability of rainfall thresholds in the study area is mainly influenced by landform and topography slope. The rainfall intensity of small undulating mountains was higher than that of medium undulating mountains and large undulating mountains, and the rainfall intensity for landslides peaks at high-altitude mountains of 3500–5000 m.
Author Contributions
Methodology, C.M.; Resources, Y.G.; Data curation, Y.S.; Writing—original draft, S.N.; Writing—review & editing, S.B. All authors have read and agreed to the published version of the manuscript.
Funding
This study was supported by the National Natural Science Foundation of China (Grant No. 41941017 and 41877522), the National Key Research and Development Program of China (Grant No. 2021YFE0116800), and Jiangsu Province Key R&D Program (Social Development) Project of China (Grant No. BE2019776).
Data Availability Statement
The data download sources used in this paper are shown in Table 1. Due to privacy and ethical concerns, the results data of this paper cannot be made available.
Acknowledgments
We are grateful to the editorial team and anonymous reviewers for their efforts to improve this manuscript.
Conflicts of Interest
The authors declare no conflict of interest.
References
- Guzzetti, F.; Peruccacci, S.; Rossi, M.; Stark, C.P. Rainfall thresholds for the initiation of landslides in central and southern Europe. Meteorol. Atmos. Phys. 2007, 98, 239–267. [Google Scholar] [CrossRef]
- Rossi, M.; Kirschbaum, D.; Valigi, D.; Mondini, A.; Guzzetti, F. Comparison of Satellite Rainfall Estimates and Rain Gauge Measurements in Italy, and Impact on Landslide Modeling. Climate 2017, 5, 90. [Google Scholar] [CrossRef] [Green Version]
- Hong, Y.; Adler, R.; Huffman, G. Evaluation of the potential of NASA multi-satellite precipitation analysis in global landslide hazard assessment. Geophys Res. Lett. 2006, 33, L22402. [Google Scholar] [CrossRef]
- Hong, Y.; Adler, R.F.; Huffman, G. An Experimental Global Prediction System for Rainfall-Triggered Landslides Using Satellite Remote Sensing and Geospatial Datasets. IEEE Trans. Geosci. Remote Sens. 2007, 45, 1671–1680. [Google Scholar] [CrossRef]
- Kirschbaum, D.B.; Adler, R.; Hong, Y.; Lerner-Lam, A. Evaluation of a preliminary satellite-based landslide hazard algorithm using global landslide inventories. Nat. Hazards Earth Syst. Sci. 2009, 9, 673–686. [Google Scholar] [CrossRef] [Green Version]
- Kirschbaum, D.B.; Adler, R.; Hong, Y.; Kumar, S.; Peters-Lidard, C.; Lerner-Lam, A. Advances in landslide nowcasting: Evaluation of a global and regional modeling approach. Environ. Earth Sci. 2011, 66, 1683–1696. [Google Scholar] [CrossRef] [Green Version]
- Turkington, T.; Ettema, J.; van Westen, C.J.; Breinl, K. Empirical atmospheric thresholds for debris flows and flash floods in the southern French Alps. Nat. Hazards Earth Syst. Sci. 2014, 14, 1517–1530. [Google Scholar] [CrossRef] [Green Version]
- Robbins, J.C. A probabilistic approach for assessing landslide-triggering event rainfall in Papua New Guinea, using TRMM satellite precipitation estimates. J. Hydrol. 2016, 541, 296–309. [Google Scholar] [CrossRef]
- Chikalamo, E.E.; Mavrouli, O.C.; Ettema, J.; van Westen, C.J.; Muntohar, A.S.; Mustofa, A. Satellite-derived rainfall thresholds for landslide early warning in Bogowonto Catchment, Central Java, Indonesia. Int. J. Appl. Earth Obs. Geoinf. 2020, 89, 102093. [Google Scholar] [CrossRef]
- Bordoni, M.; Vivaldi, V.; Lucchelli, L.; Ciabatta, L.; Brocca, L.; Galve, J.P.; Meisina, C. Development of a data-driven model for spatial and temporal shallow landslide probability of occurrence at catchment scale. Landslides 2021, 18, 1209–1229. [Google Scholar] [CrossRef]
- Uwihirwe, J.; Riveros, A.; Wanjala, H.; Schellekens, J.; Sperna Weiland, F.; Hrachowitz, M.; Bogaard, T.A. Potential of satellite-derived hydro-meteorological information for landslide initiation thresholds in Rwanda. Nat. Hazards Earth Syst. Sci. 2022, 22, 3641–3661. [Google Scholar] [CrossRef]
- Jiang, W.; Chen, G.; Meng, X.; Jin, J.; Zhao, Y.; Lin, L.; Li, Y.; Zhang, Y. Probabilistic rainfall threshold of landslides in Data-Scarce mountainous Areas: A case study of the Bailong River Basin, China. Catena 2022, 213, 106190. [Google Scholar] [CrossRef]
- Li, J.; Liu, Z.; Wang, R.; Zhang, X.; Liu, X.; Yao, Z. Analysis of Debris Flow Triggering Conditions for Different Rainfall Patterns Based on Satellite Rainfall Products in Hengduan Mountain Region, China. Remote Sens. 2022, 14, 2731. [Google Scholar] [CrossRef]
- Tiranti, D.; Rabuffetti, D. Estimation of rainfall thresholds triggering shallow landslides for an operational warning system implementation. Landslides 2010, 7, 471–481. [Google Scholar] [CrossRef]
- Malamud, B.D.; Turcotte, D.L.; Guzzetti, F.; Reichenbach, P. Landslide inventories and their statistical properties. Earth Surf. Process. Landf. 2004, 29, 687–711. [Google Scholar] [CrossRef]
- Chen, C.-Y. Landslide and basin self-organized criticality in the Lushan Hot Spring area. J. Mt. Sci. 2012, 9, 463–471. [Google Scholar] [CrossRef]
- Toté, C.; Patricio, D.; Boogaard, H.; van der Wijngaart, R.; Tarnavsky, E.; Funk, C. Evaluation of Satellite Rainfall Estimates for Drought and Flood Monitoring in Mozambique. Remote Sens. 2015, 7, 1758–1776. [Google Scholar] [CrossRef] [Green Version]
- Ullah, W.; Wang, G.; Ali, G.; Tawia Hagan, D.; Bhatti, A.; Lou, D. Comparing Multiple Precipitation Products against In-Situ Observations over Different Climate Regions of Pakistan. Remote Sens. 2019, 11, 628. [Google Scholar] [CrossRef] [Green Version]
- Tang, G.; Clark, M.P.; Papalexiou, S.M.; Ma, Z.; Hong, Y. Have satellite precipitation products improved over last two decades? A comprehensive comparison of GPM IMERG with nine satellite and reanalysis datasets. Remote Sens. Environ. 2020, 240, 111697. [Google Scholar] [CrossRef]
- Mei, Y.; Maggioni, V.; Houser, P.; Xue, Y.; Rouf, T. A Nonparametric Statistical Technique for Spatial Downscaling of Precipitation Over High Mountain Asia. Water Resour. Res. 2020, 56, e2020WR027472. [Google Scholar] [CrossRef]
- Jiang, Y.; Yang, K.; Qi, Y.; Zhou, X.; He, J.; Lu, H.; Li, X.; Chen, Y.; Li, X.; Zhou, B.; et al. TPHiPr: A long-term (1979–2020) high-accuracy precipitation dataset (1∕30°, daily) for the Third Pole region based on high-resolution atmospheric modeling and dense observations. Earth Syst. Sci. Data 2023, 15, 621–638. [Google Scholar] [CrossRef]
- Ning, S.; Zhou, H.-W.; Zhang, Z.-Y.; Bai, S.-B.; Liu, L. Precipitation scale effect of the TRMM satellite in Tianshan, China. J. Mt. Sci. 2023, 20, 1349–1368. [Google Scholar] [CrossRef]
- Kumar Thakur, M.; Desamsetti, S.; Naga Rajesh, A.; Koteswara Rao, K.; Narayanan, M.S.; Lakshmi Kumar, T.V. Exploring the rainfall data from satellites to monitor rainfall induced landslides—A case study. Adv. Space Res. 2020, 66, 887–894. [Google Scholar] [CrossRef]
- Bai, S.; Wang, J.; Thiebes, B.; Cheng, C.; Yang, Y. Analysis of the relationship of landslide occurrence with rainfall: A case study of Wudu County, China. Arab. J. Geosci. 2014, 7, 1277–1285. [Google Scholar] [CrossRef]
- Bai, S.-B.; Cheng, C.; Wang, J.; Thiebes, B.; Zhang, Z.-G. Regional scale rainfall- and earthquake-triggered landslide susceptibility assessment in Wudu County, China. J. Mt. Sci. 2013, 10, 743–753. [Google Scholar] [CrossRef]
- Guo, B.; Zhang, J.; Meng, X.; Xu, T.; Song, Y. Long-term spatio-temporal precipitation variations in China with precipitation surface interpolated by ANUSPLIN. Sci. Rep. 2020, 10, 81. [Google Scholar] [CrossRef] [Green Version]
- Rainer, B.; Thomas, G.; Xi, Y.; Bai, S.; Benni, T. Combining landslide susceptibility maps and rainfall thresholds using a matrix approach. Rev. Geomorfol. 2017, 19, 58–74. [Google Scholar] [CrossRef]
- Zhang, S.; Sun, P.; Li, R.; Zhang, Y.; Ren, J. Distribution feature and development characteristics of geohazards in Wudu district, Gansu province, Northwest China. Geoenviron. Disasters 2022, 9, 23. [Google Scholar] [CrossRef]
- Zhang, Q.; Singh, V.P.; Li, J.; Jiang, F.; Bai, Y. Spatio-temporal variations of precipitation extremes in Xinjiang, China. J. Hydrol. 2012, 434–435, 7–18. [Google Scholar] [CrossRef]
- Breiman, L. Random forests. Mach. Learn. 2001, 45, 5–32. [Google Scholar] [CrossRef] [Green Version]
- He, X.; Chaney, N.W.; Schleiss, M.; Sheffield, J. Spatial downscaling of precipitation using adaptable random forests. Water Resour. Res. 2016, 52, 8217–8237. [Google Scholar] [CrossRef]
- Tan, J.; Xie, X.; Zuo, J.; Xing, X.; Liu, B.; Xia, Q.; Zhang, Y. Coupling random forest and inverse distance weighting to generate climate surfaces of precipitation and temperature with Multiple-Covariates. J. Hydrol. 2021, 598, 126270. [Google Scholar] [CrossRef]
- Zhang, X.; Shao, J.; Luo, H. Spatial interpolation of air temperature with ANUSPLIN in Three Gorges Reservoir Area. In Proceedings of the 2011 International Conference on Remote Sensing, Environment and Transportation Engineering, Nanjing, China, 24–26 June 2011; pp. 3465–3468. [Google Scholar]
- Tang, C.; van Asch, T.W.J.; Chang, M.; Chen, G.Q.; Zhao, X.H.; Huang, X.C. Catastrophic debris flows on 13 August 2010 in the Qingping area, southwestern China: The combined effects of a strong earthquake and subsequent rainstorms. Geomorphology 2012, 139–140, 559–576. [Google Scholar] [CrossRef]
- Mandal, P.; Sarkar, S. Estimation of rainfall threshold for the early warning of shallow landslides along National Highway-10 in Darjeeling Himalayas. Nat. Hazards 2021, 105, 2455–2480. [Google Scholar] [CrossRef]
- Crozier, M.J. Prediction of rainfall-triggered landslides: A test of the Antecedent Water Status Model. Earth Surf. Process. Landf. 1999, 24, 825–833. [Google Scholar] [CrossRef]
- Mirus, B.B.; Becker, R.E.; Baum, R.L.; Smith, J.B. Integrating real-time subsurface hydrologic monitoring with empirical rainfall thresholds to improve landslide early warning. Landslides 2018, 15, 1909–1919. [Google Scholar] [CrossRef]
- Zhao, B.; Dai, Q.; Han, D.; Dai, H.; Mao, J.; Zhuo, L.; Rong, G. Estimation of soil moisture using modified antecedent precipitation index with application in landslide predictions. Landslides 2019, 16, 2381–2393. [Google Scholar] [CrossRef]
- Ma, T.; Li, C.; Lu, Z.; Bao, Q. Rainfall intensity–duration thresholds for the initiation of landslides in Zhejiang Province, China. Geomorphology 2015, 245, 193–206. [Google Scholar] [CrossRef]
Figure 1.
Geographical location and distribution of landslides and ground observation stations in and around Wudu.
Figure 1.
Geographical location and distribution of landslides and ground observation stations in and around Wudu.

Figure 2.
Spatial distribution characteristics of six geo-environmentally influential factors in and around Wudu ((a) longitude, (b) latitude, (c) slope, (d) aspect, (e) NDVI, (f) humidity).
Figure 2.
Spatial distribution characteristics of six geo-environmentally influential factors in and around Wudu ((a) longitude, (b) latitude, (c) slope, (d) aspect, (e) NDVI, (f) humidity).

Figure 3.
Technical flow chart.
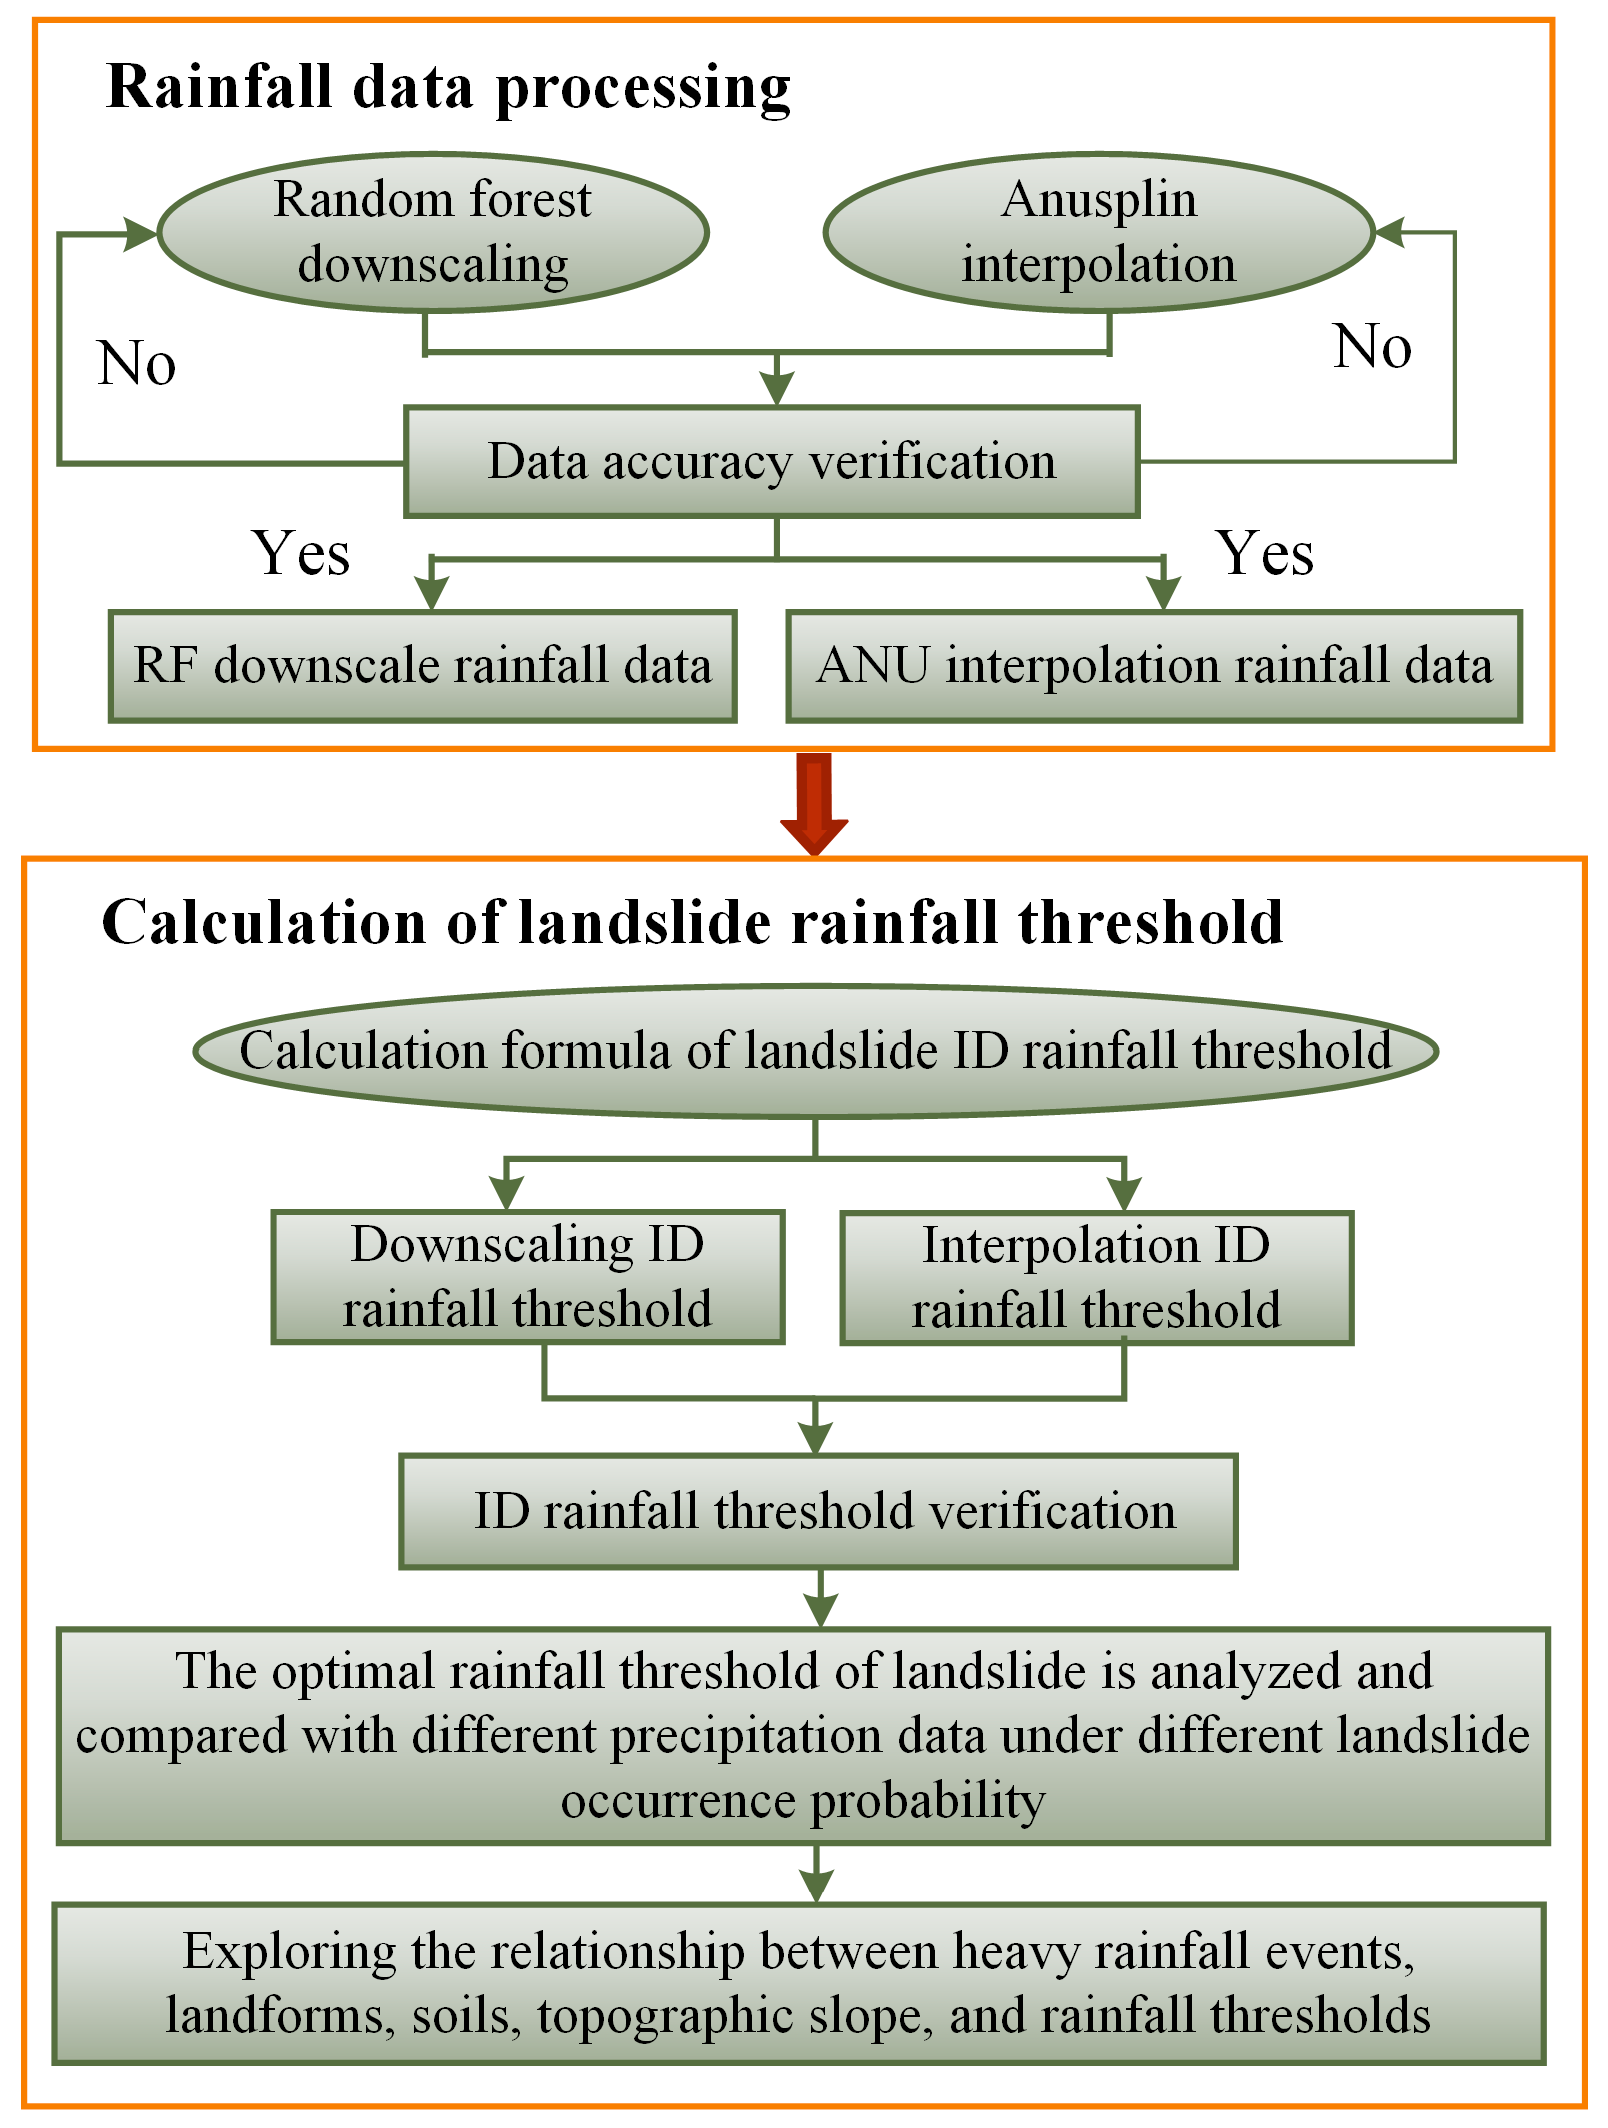
Figure 4.
A linear relationship between daily average precipitation data of different precipitation products and precipitation data of ground observation stations ((a) AUN interpolation, (b) TRMM, (c) TRMM downscaling). Note: **, p < 0.01; Unit: mm/day.
Figure 4.
A linear relationship between daily average precipitation data of different precipitation products and precipitation data of ground observation stations ((a) AUN interpolation, (b) TRMM, (c) TRMM downscaling). Note: **, p < 0.01; Unit: mm/day.
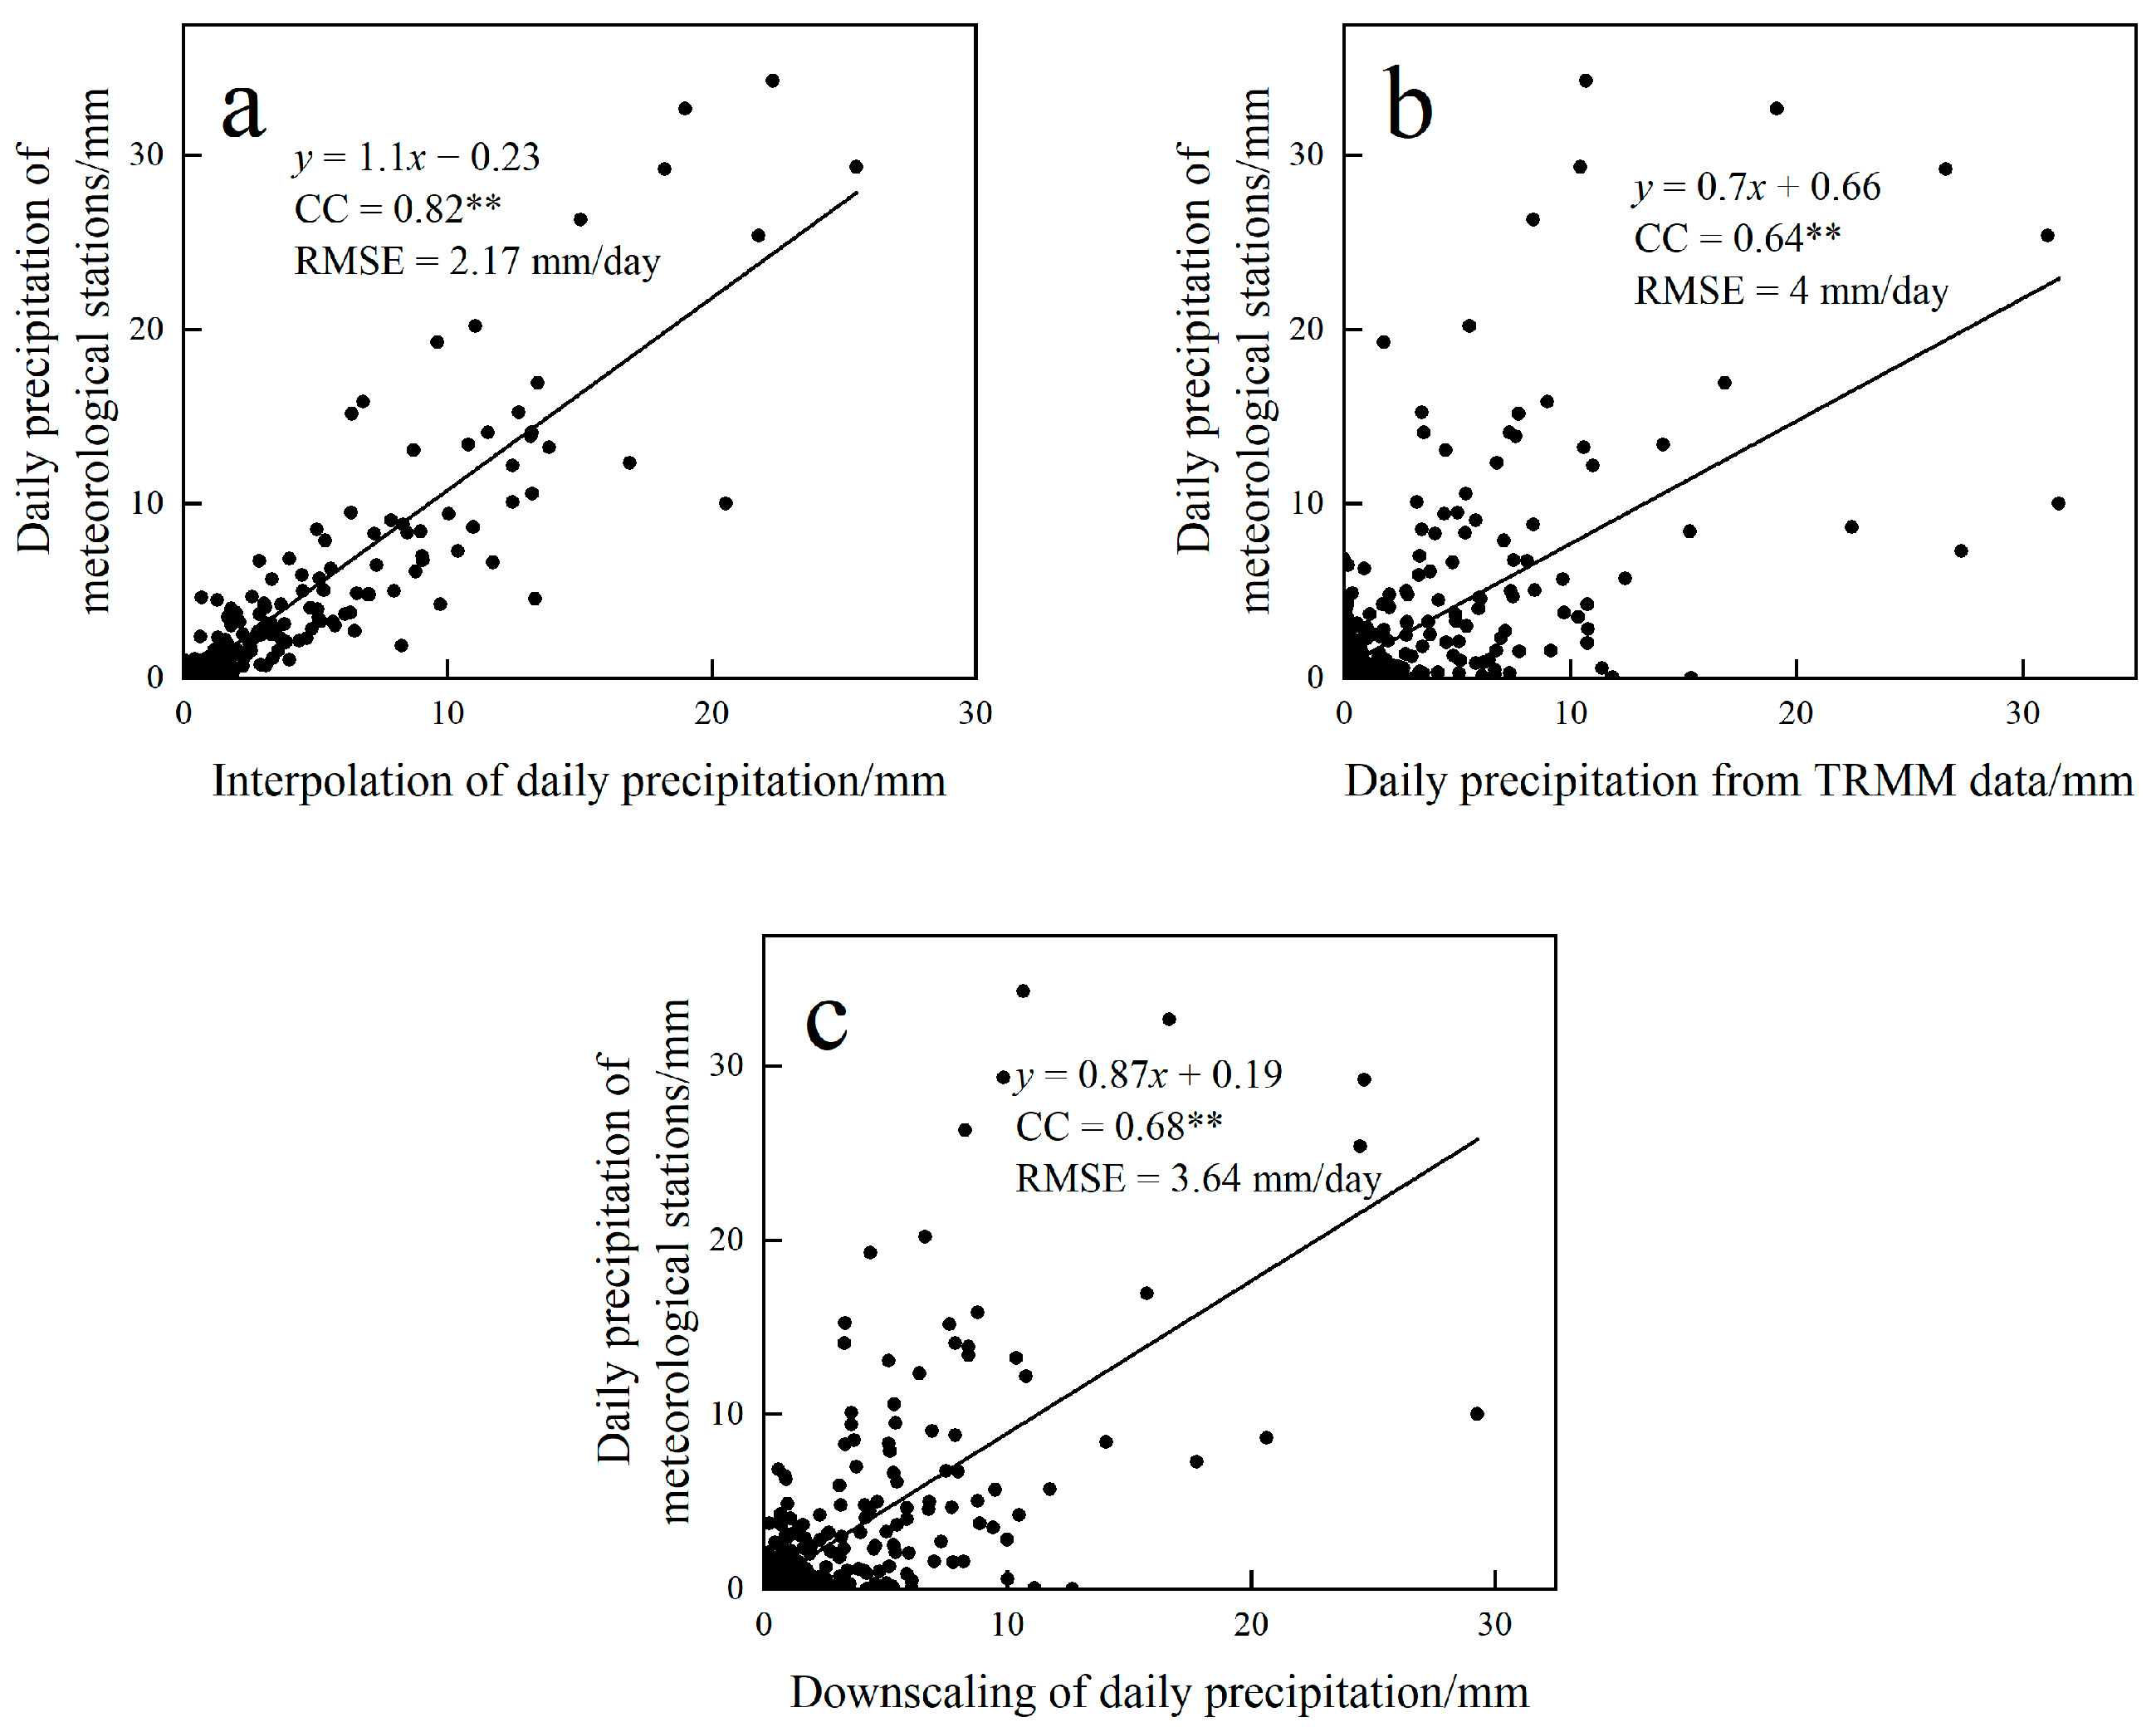
Figure 5.
Variation trend of monthly daily precipitation at ground observation stations, interpolation, TRMM, and downscaling.
Figure 5.
Variation trend of monthly daily precipitation at ground observation stations, interpolation, TRMM, and downscaling.
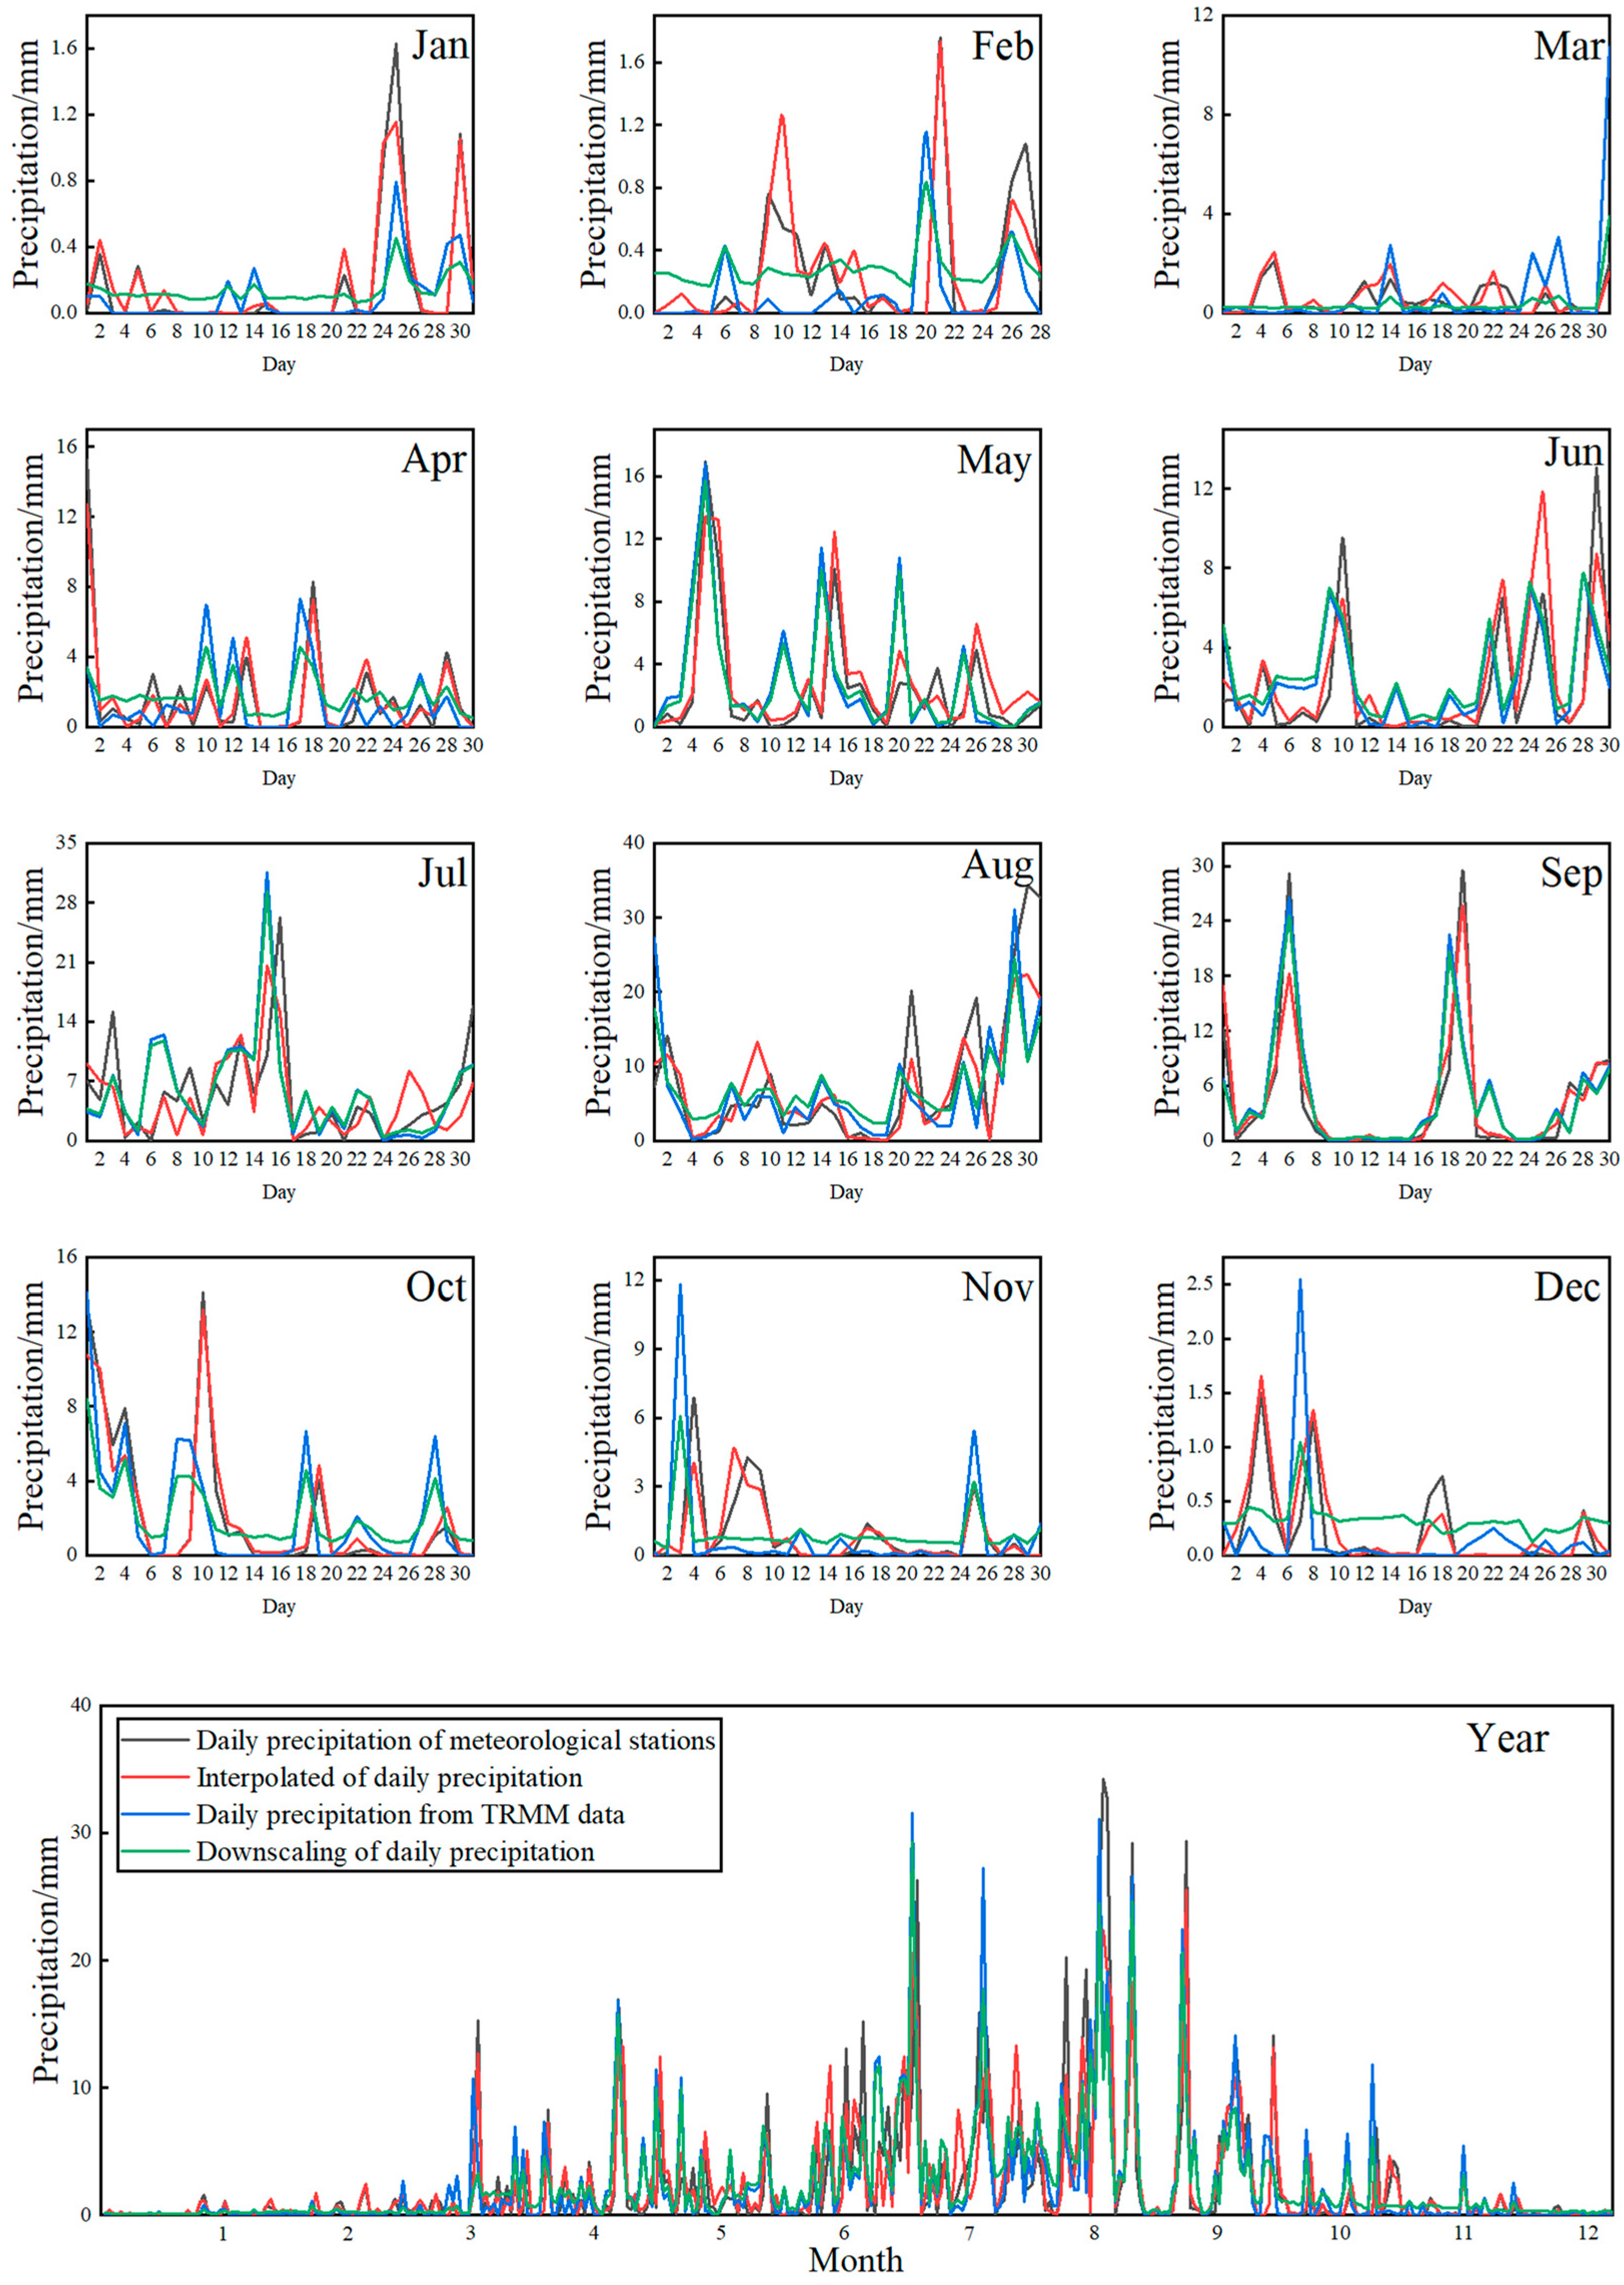
Figure 6.
ANU interpolation rainfall threshold calculation.

Figure 7.
TRMM downscaling rainfall threshold calculation.

Figure 8.
Receiver operating characteristic curve of interpolated rainfall threshold and downscaling rainfall threshold.
Figure 8.
Receiver operating characteristic curve of interpolated rainfall threshold and downscaling rainfall threshold.
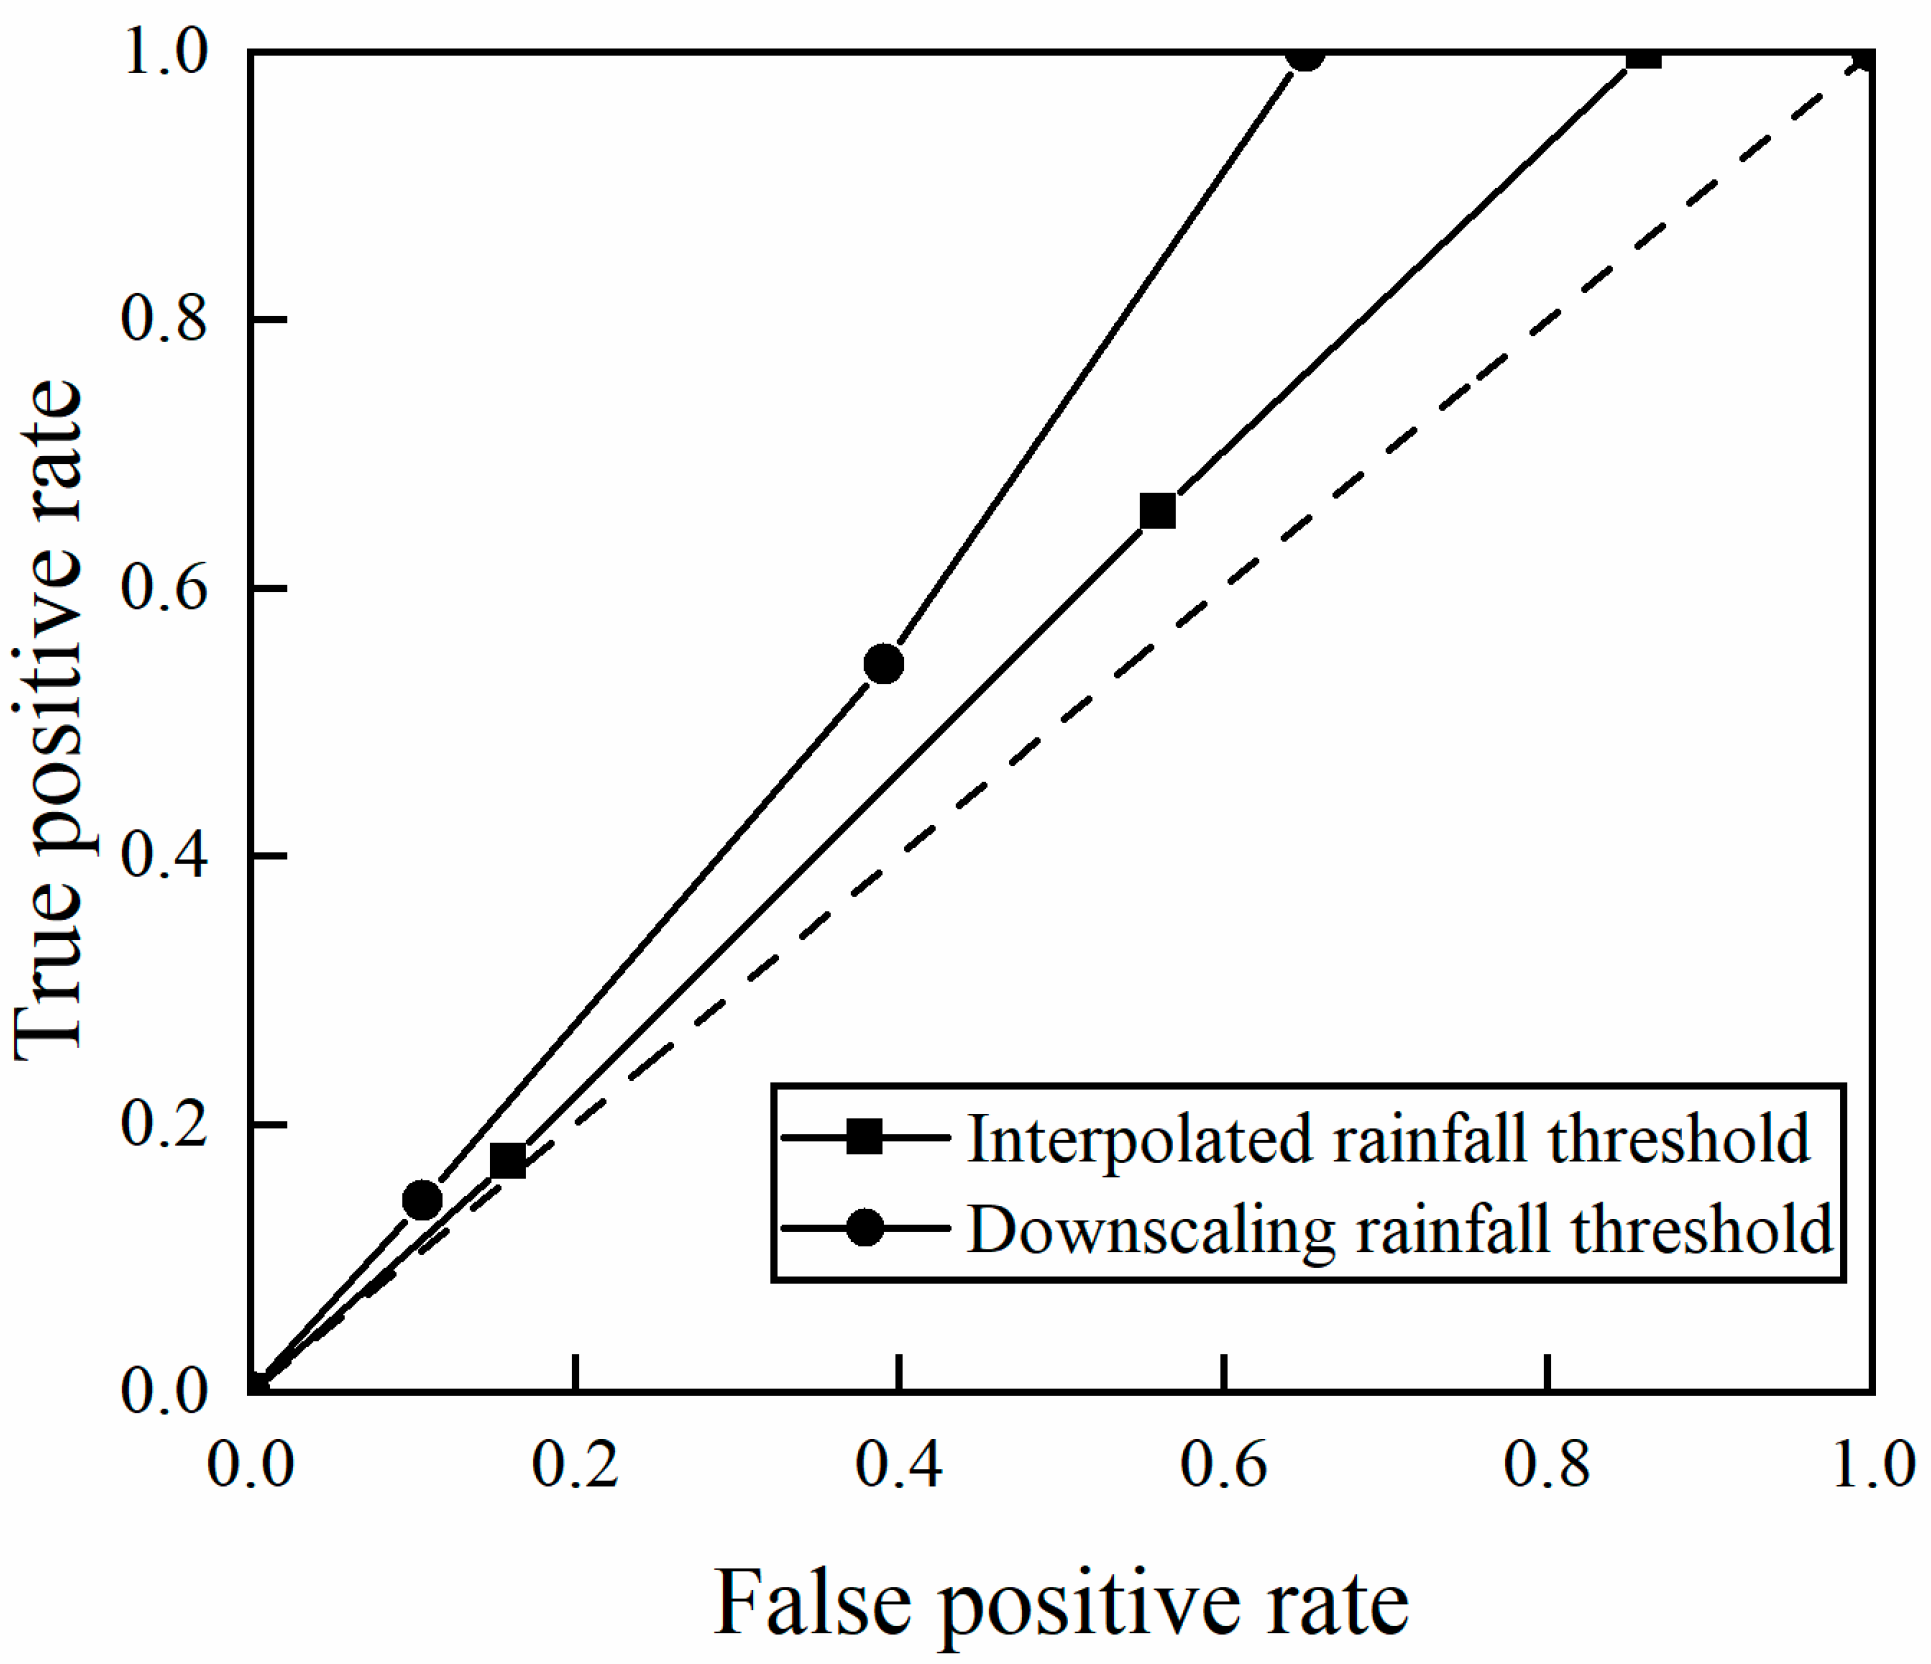
Figure 9.
Major landslide-triggering rainfall events in Wudu County.
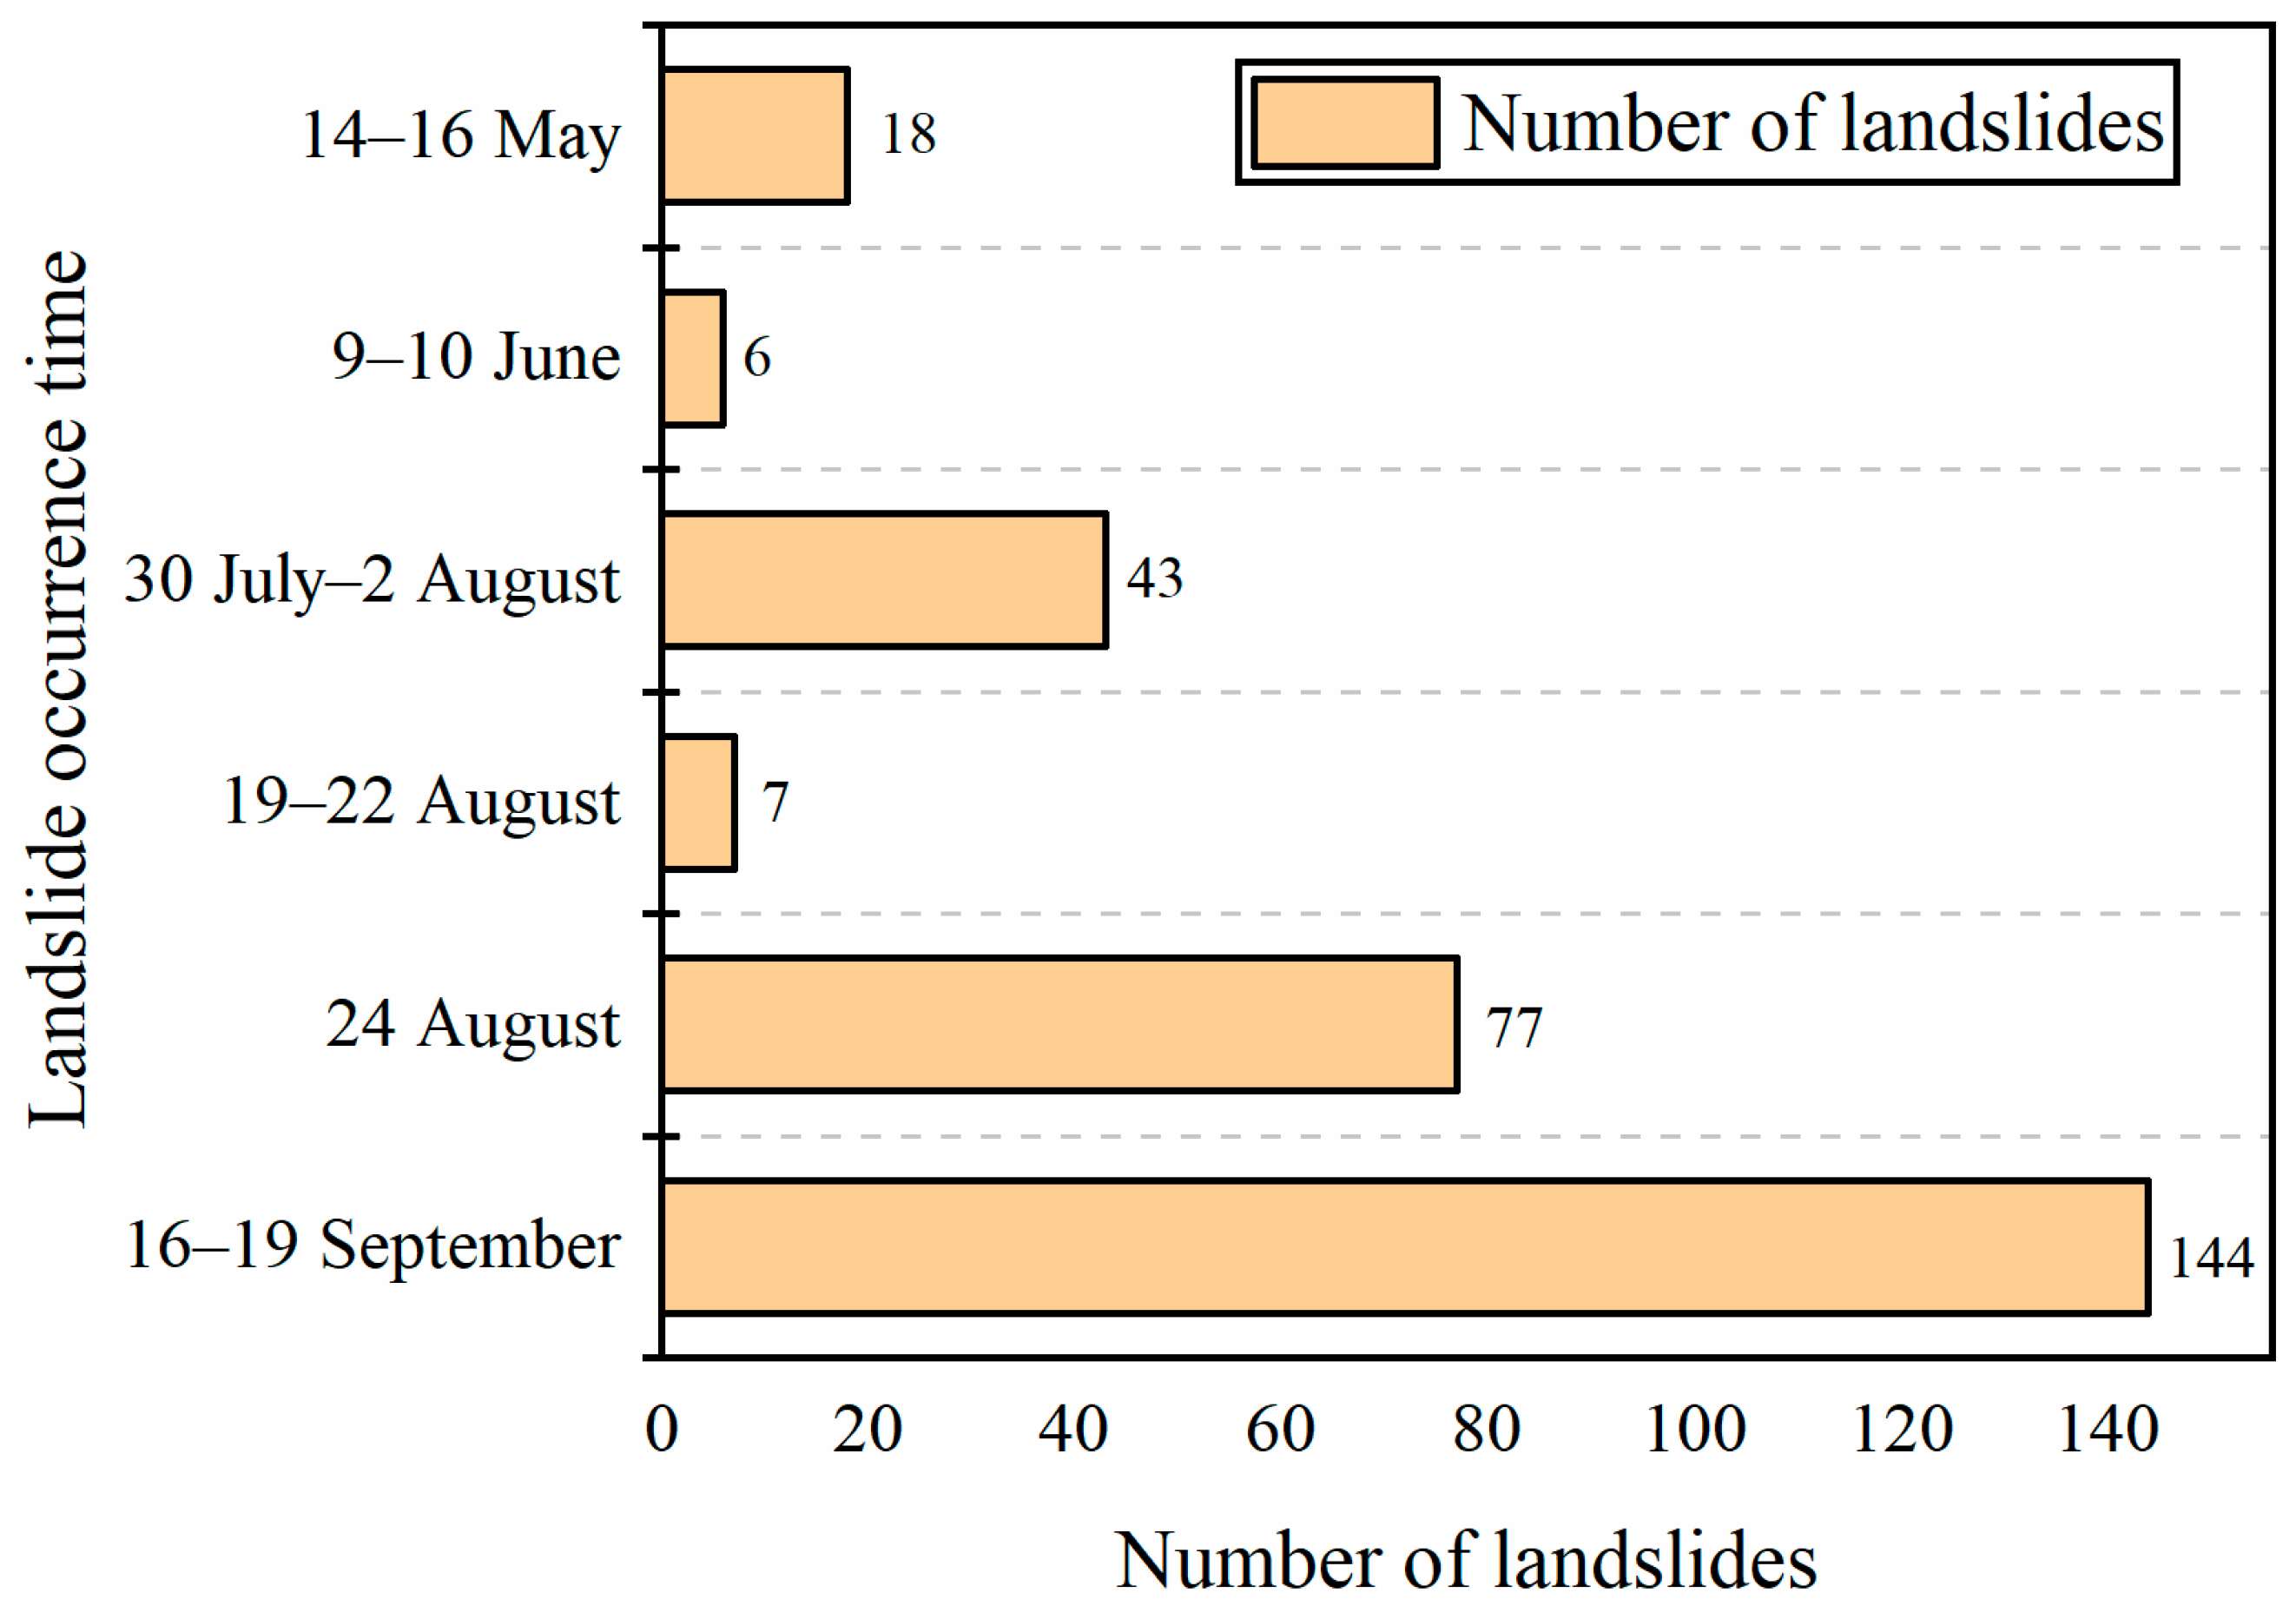
Figure 10.
Calculation of rainfall thresholds for major landslide rainfall events ((a) 14–16 May, (b) 9–10 June, (c) 30 July–2 August, (d) 19–22 August, (e) 24 August, (f) 16–19 September).
Figure 10.
Calculation of rainfall thresholds for major landslide rainfall events ((a) 14–16 May, (b) 9–10 June, (c) 30 July–2 August, (d) 19–22 August, (e) 24 August, (f) 16–19 September).
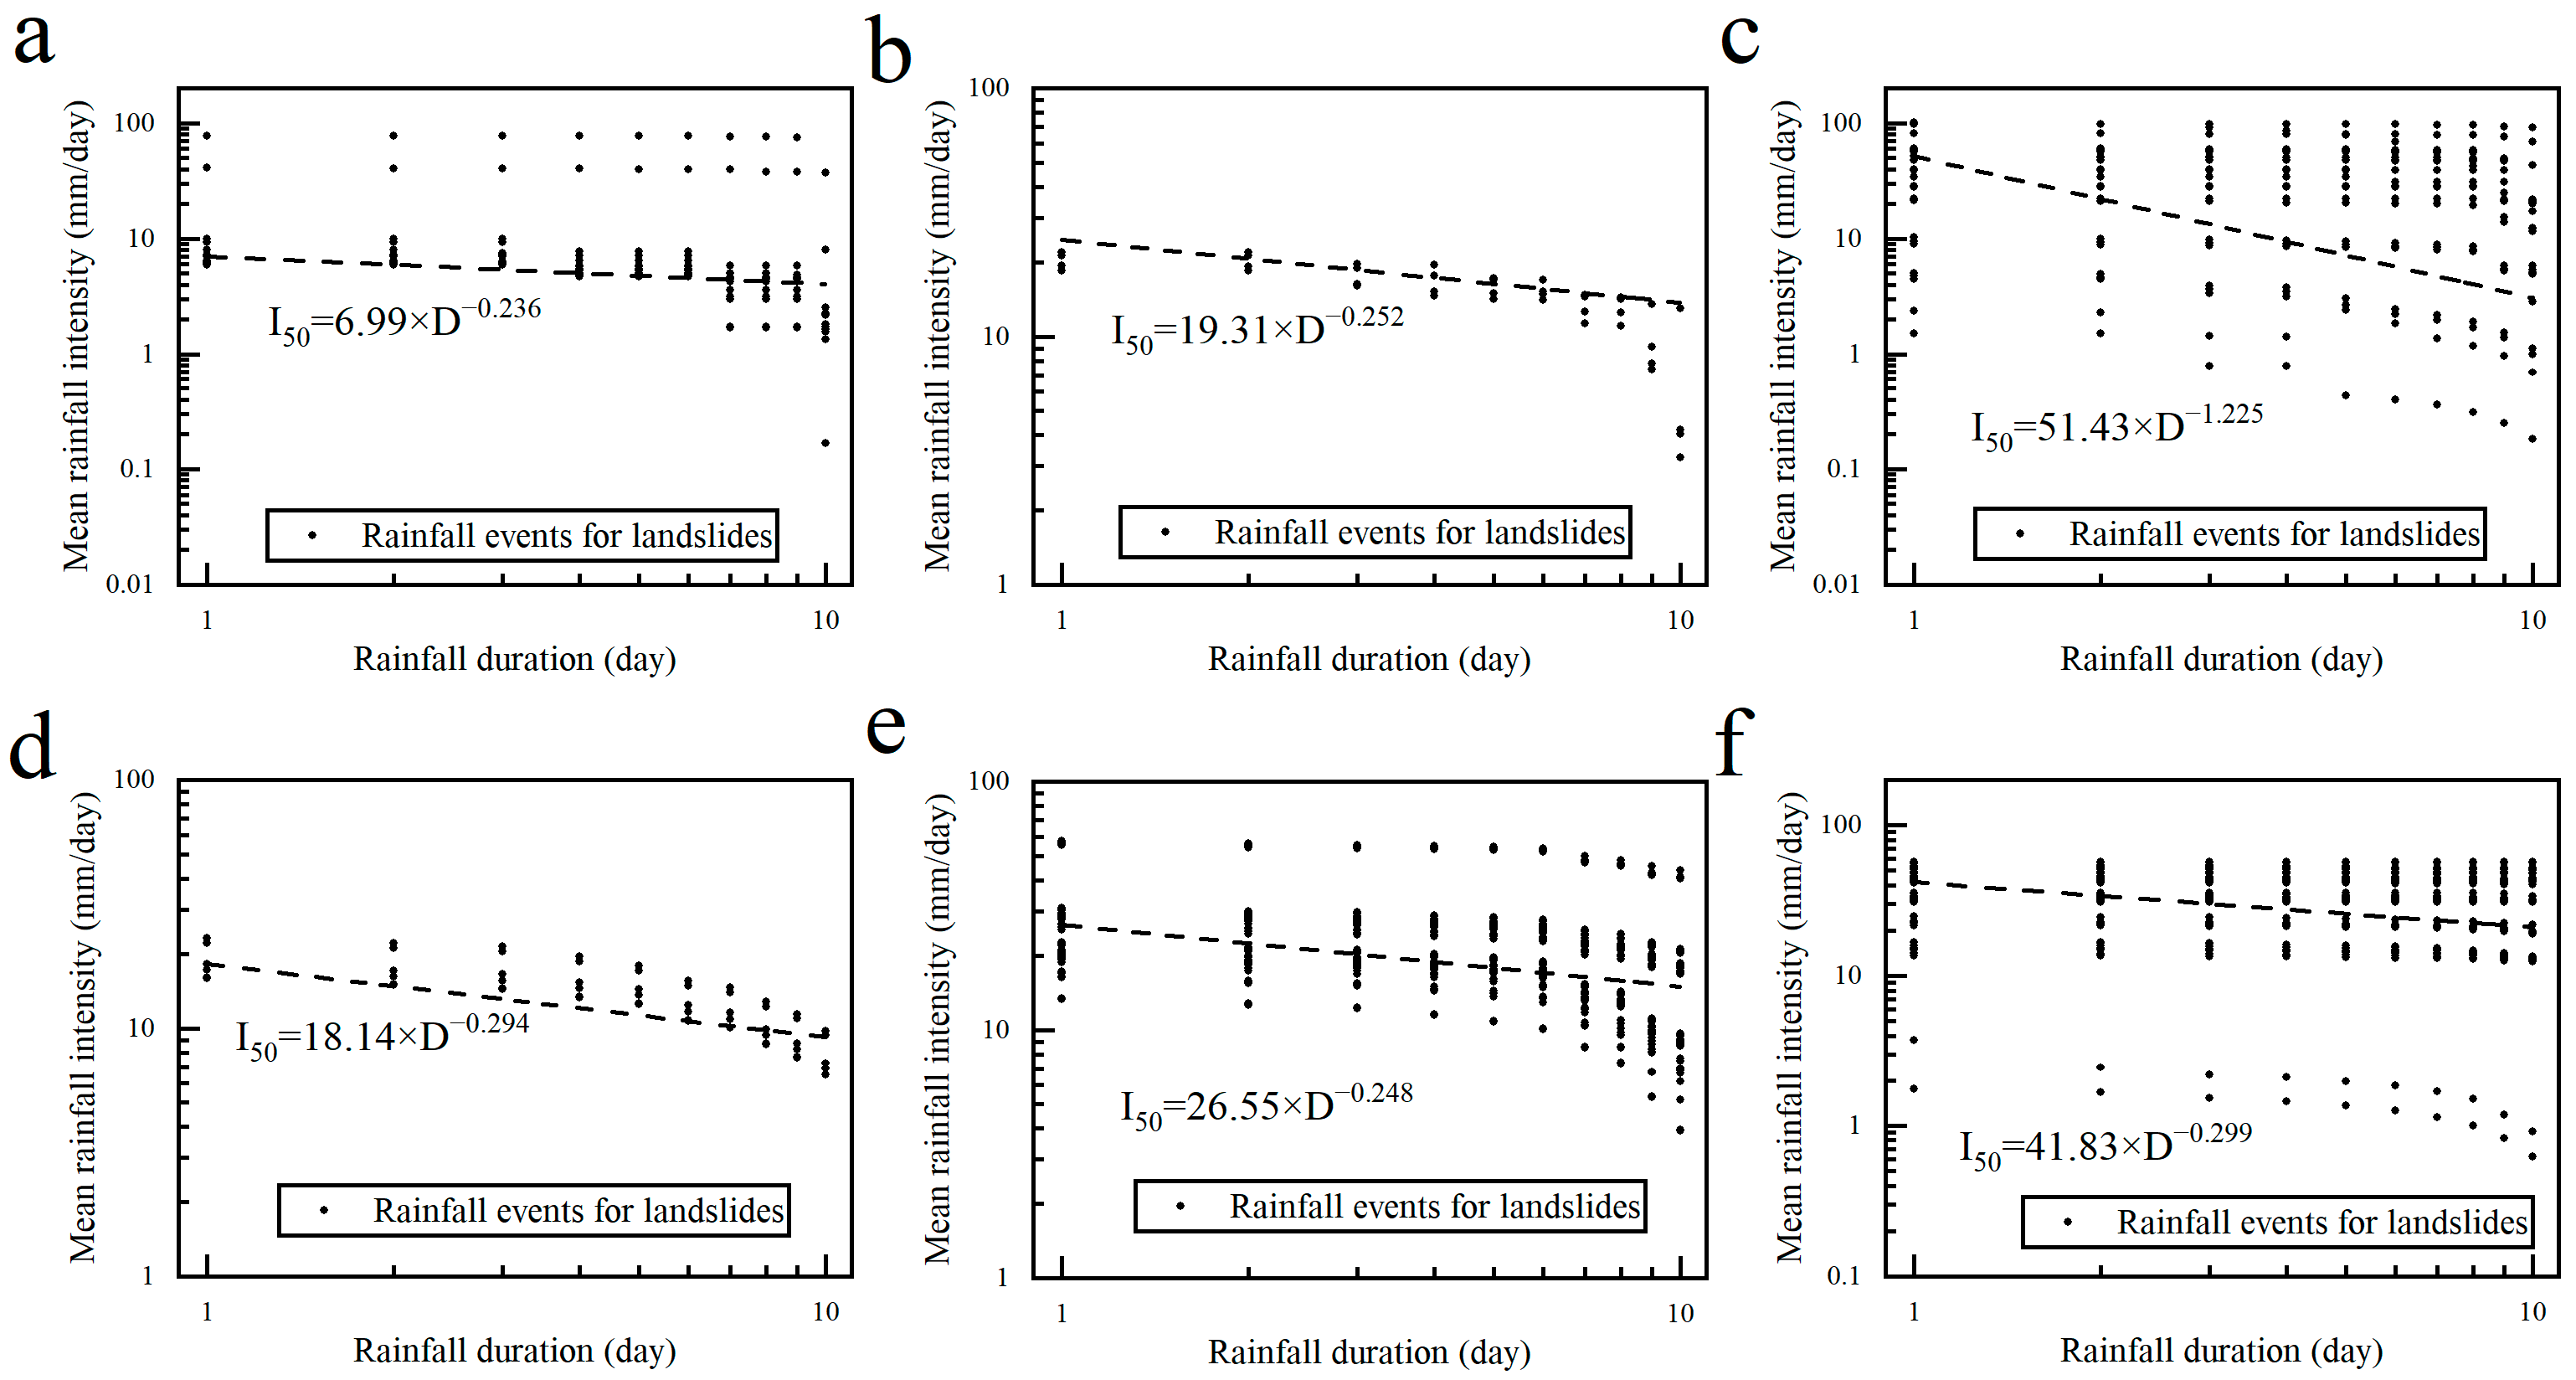
Figure 11.
Spatial distribution of topography and landforms in Wudu (a), statistics on the number of landslides in different landform types (b). Note: SUMM: Small Undulating Medium Mountain, SUHM: Small Undulating High Mountain, SUEHM: Small Undulating Extremely High Mountain, MULM: Medium Undulating Low Mountain, MUMM: Medium Undulating Medium Mountain, MUHM: Medium Undulating High Mountain, MUEHM: Medium Undulating Extremely High Mountain, LUMM: Large Undulating Medium Mountain.
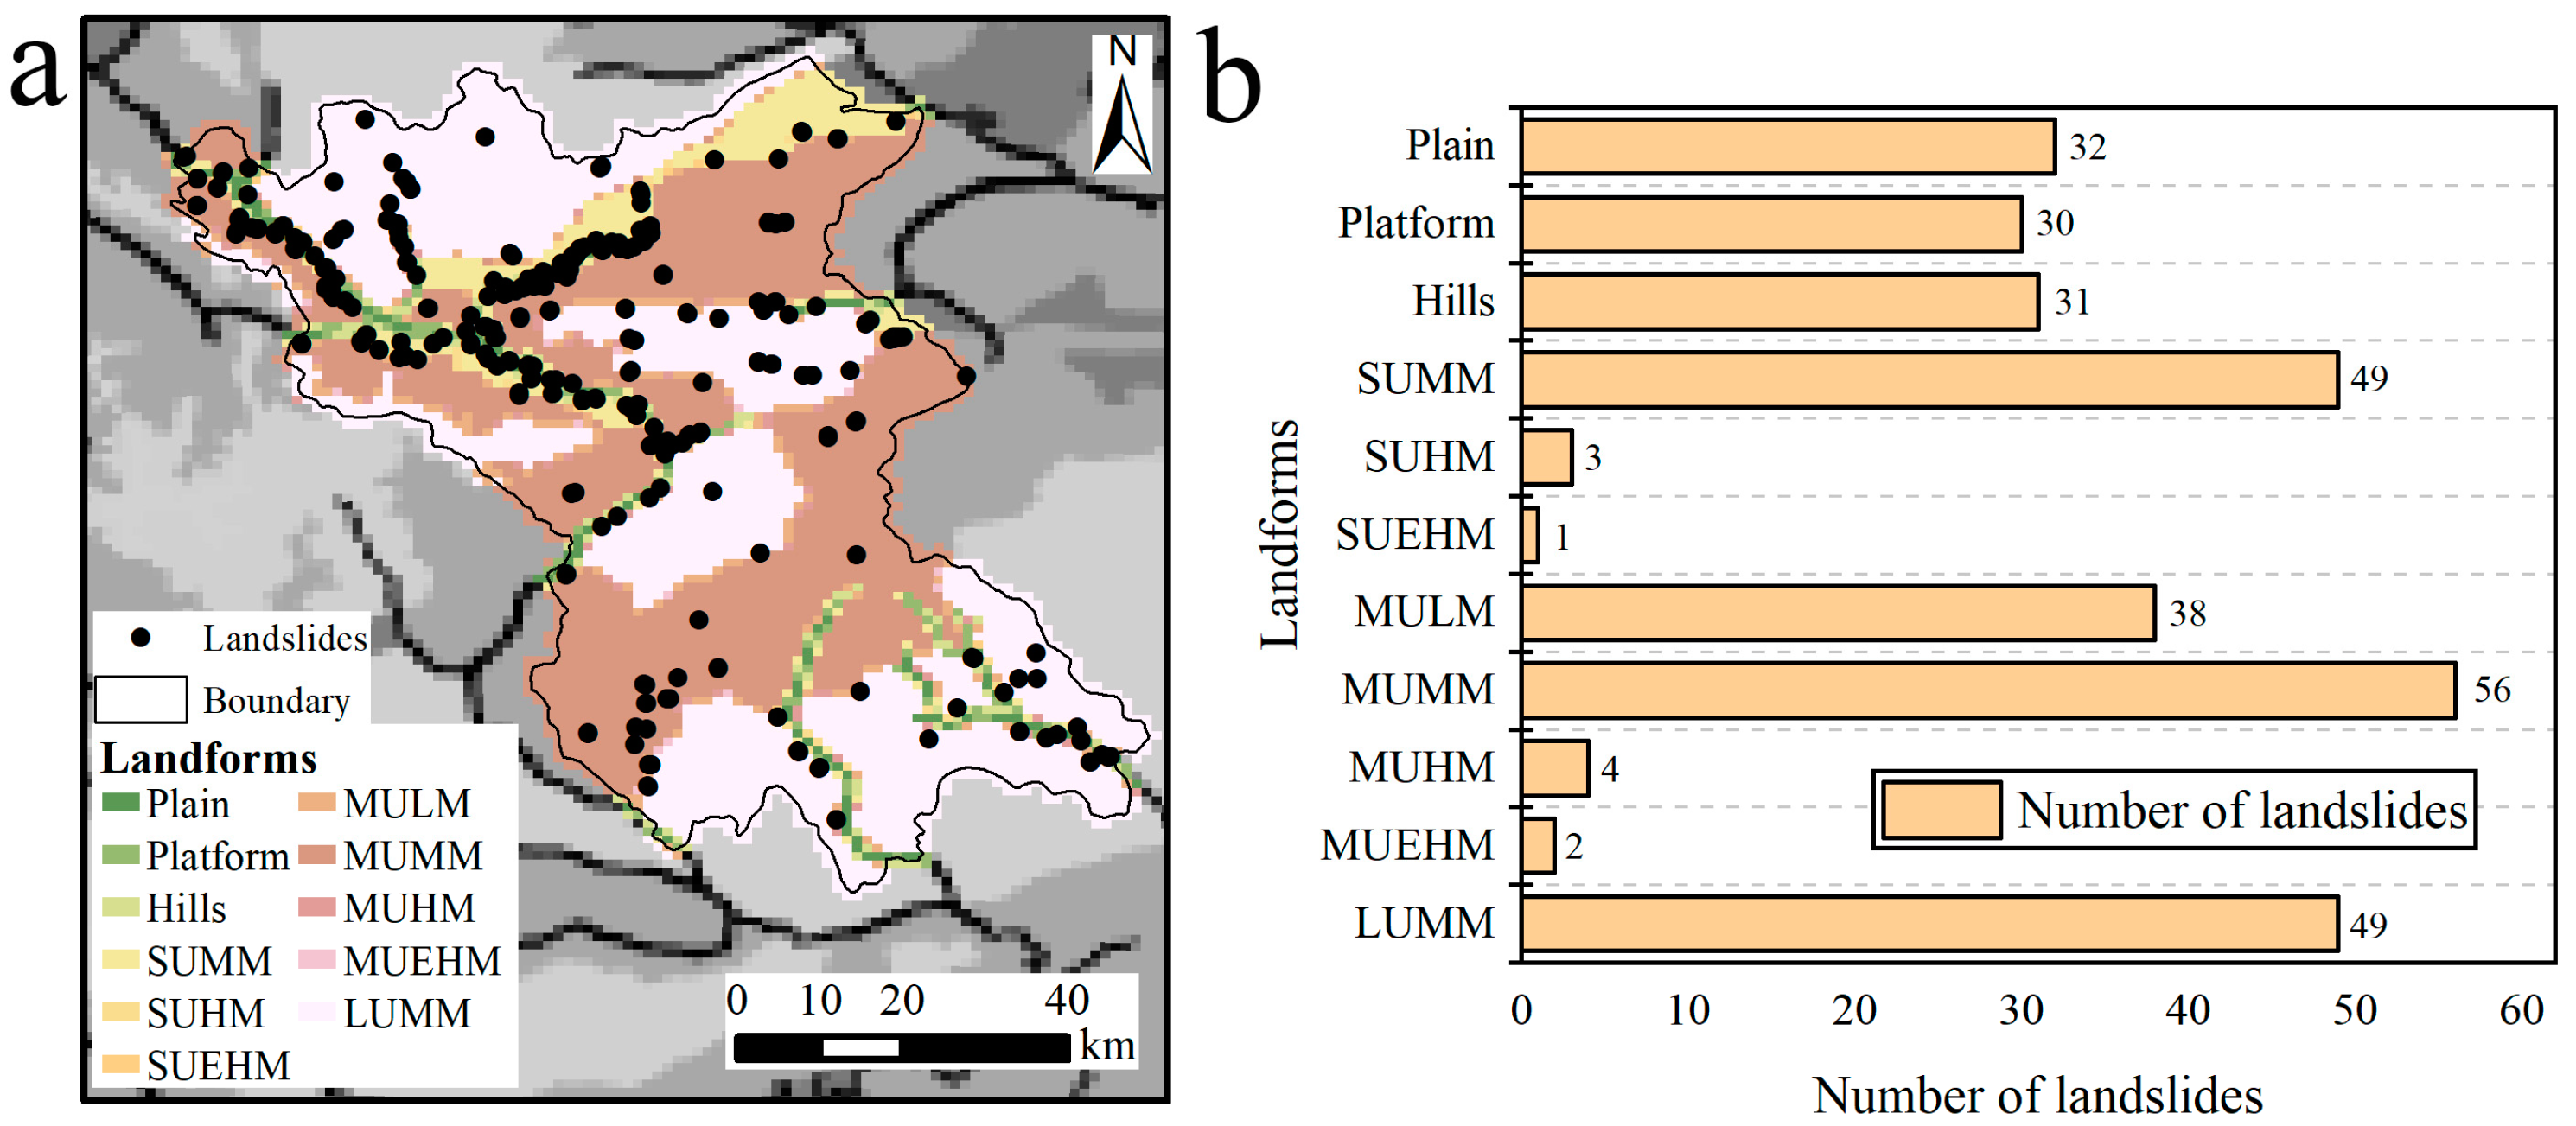
Figure 12.
Calculation of rainfall thresholds for landslides of different landform types ((a) Plain, (b) Platform, (c) Hill, (d) SUMM, (e) SUHM, (f) SUEHM, (g) MULM, (h) MUMM, (i) MUHM, (j) MUEHM, (k) LUMM).
Figure 12.
Calculation of rainfall thresholds for landslides of different landform types ((a) Plain, (b) Platform, (c) Hill, (d) SUMM, (e) SUHM, (f) SUEHM, (g) MULM, (h) MUMM, (i) MUHM, (j) MUEHM, (k) LUMM).
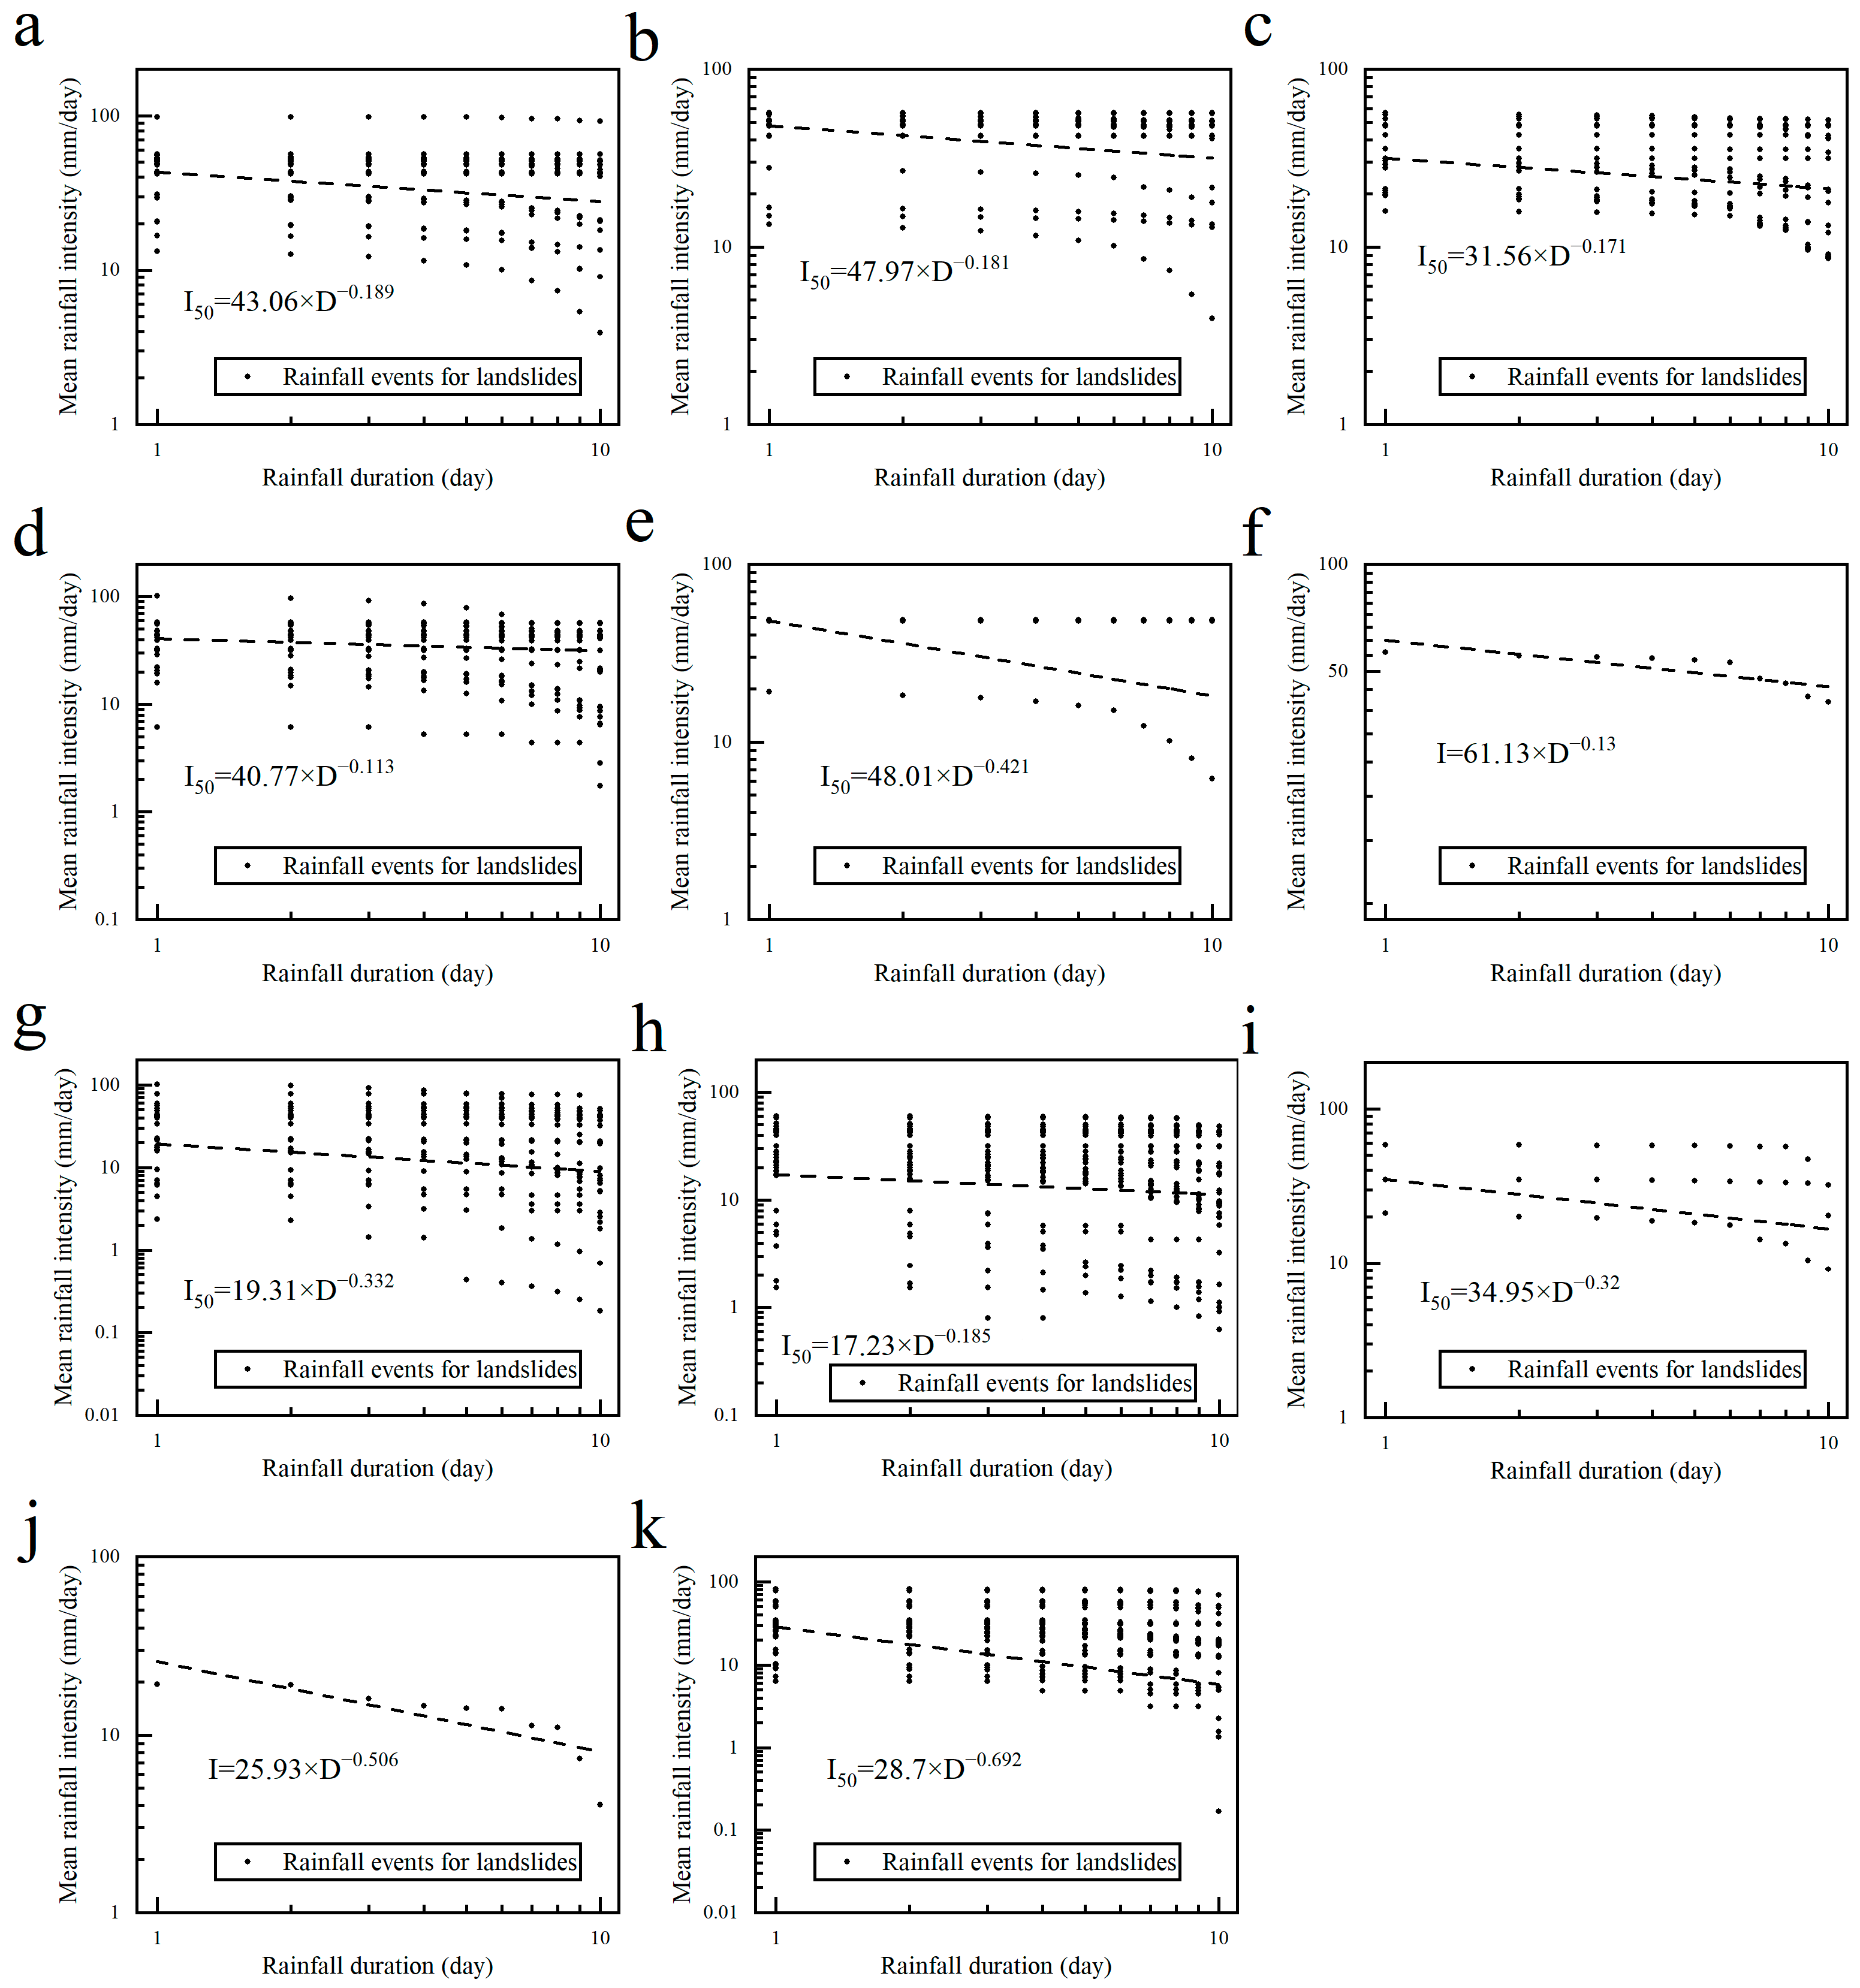
Figure 13.
Spatial distribution of slope types in Wudu (a), statistics on the number of landslides of different slope types (b).
Figure 13.
Spatial distribution of slope types in Wudu (a), statistics on the number of landslides of different slope types (b).
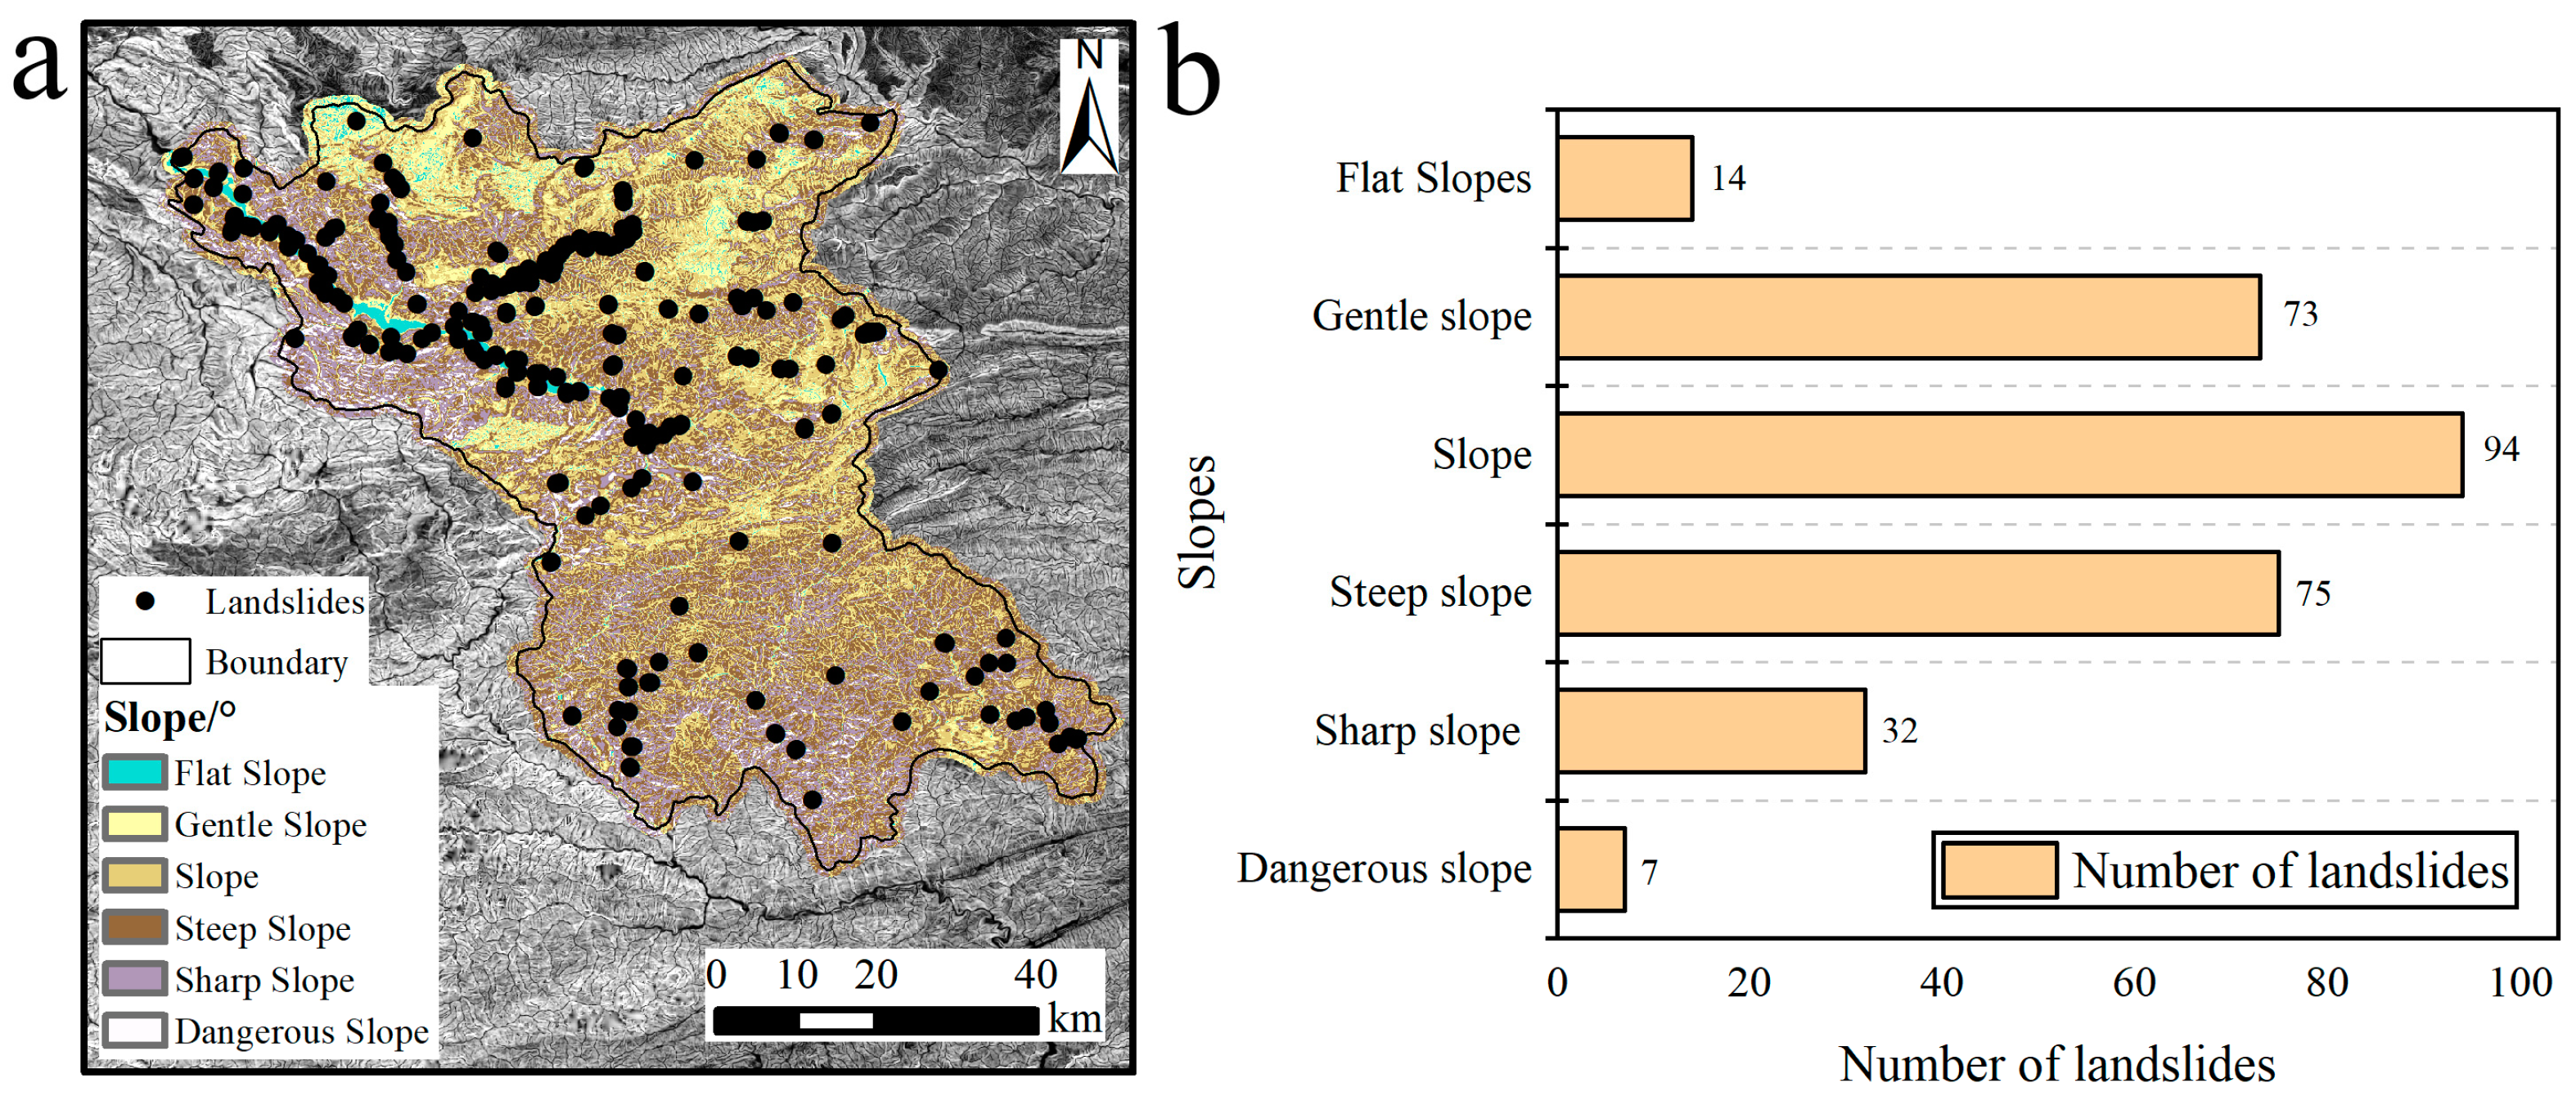
Figure 14.
Calculation of rainfall thresholds for landslides with different slope types ((a) Flat slope, (b) Gentle slope, (c) Slope, (d) Steep slope, (e) Sharp slope, (f) Dangerous slope).
Figure 14.
Calculation of rainfall thresholds for landslides with different slope types ((a) Flat slope, (b) Gentle slope, (c) Slope, (d) Steep slope, (e) Sharp slope, (f) Dangerous slope).

Figure 15.
Spatial distribution of soil types in Wudu (a), statistics on the number of landslides in different soil types (b).
Figure 15.
Spatial distribution of soil types in Wudu (a), statistics on the number of landslides in different soil types (b).
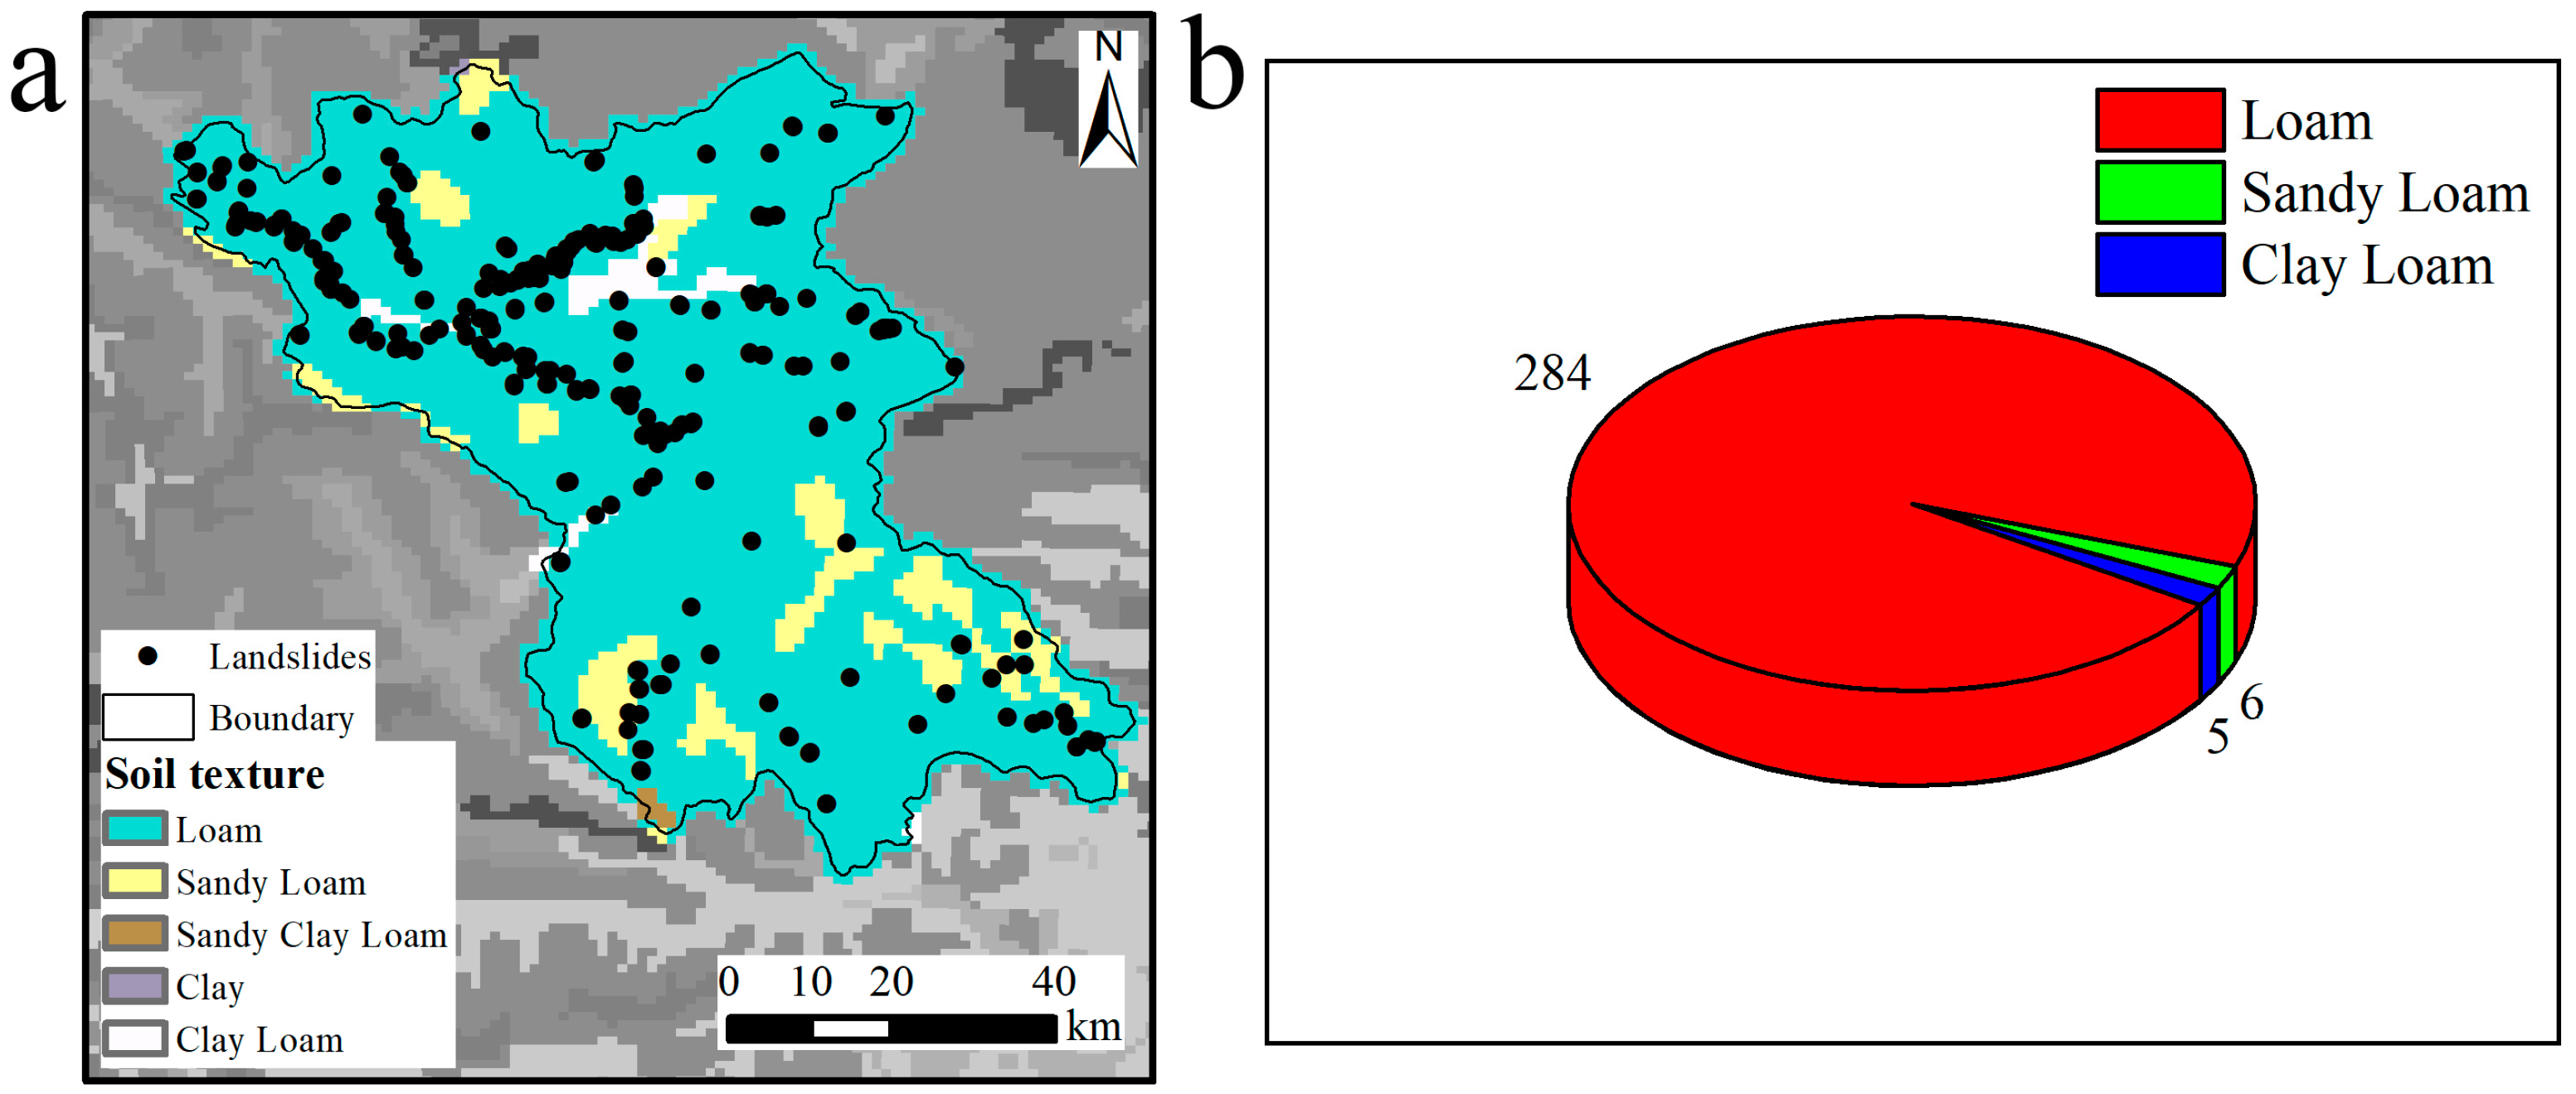
Figure 16.
Calculation of landslide rainfall thresholds for different soil types ((a) Loam, (b) Sandy Loam, (c) Clay Loam).
Figure 16.
Calculation of landslide rainfall thresholds for different soil types ((a) Loam, (b) Sandy Loam, (c) Clay Loam).

Figure 17.
Spatial distribution characteristics of ANU interpolated precipitation data in 12 months.
Figure 17.
Spatial distribution characteristics of ANU interpolated precipitation data in 12 months.
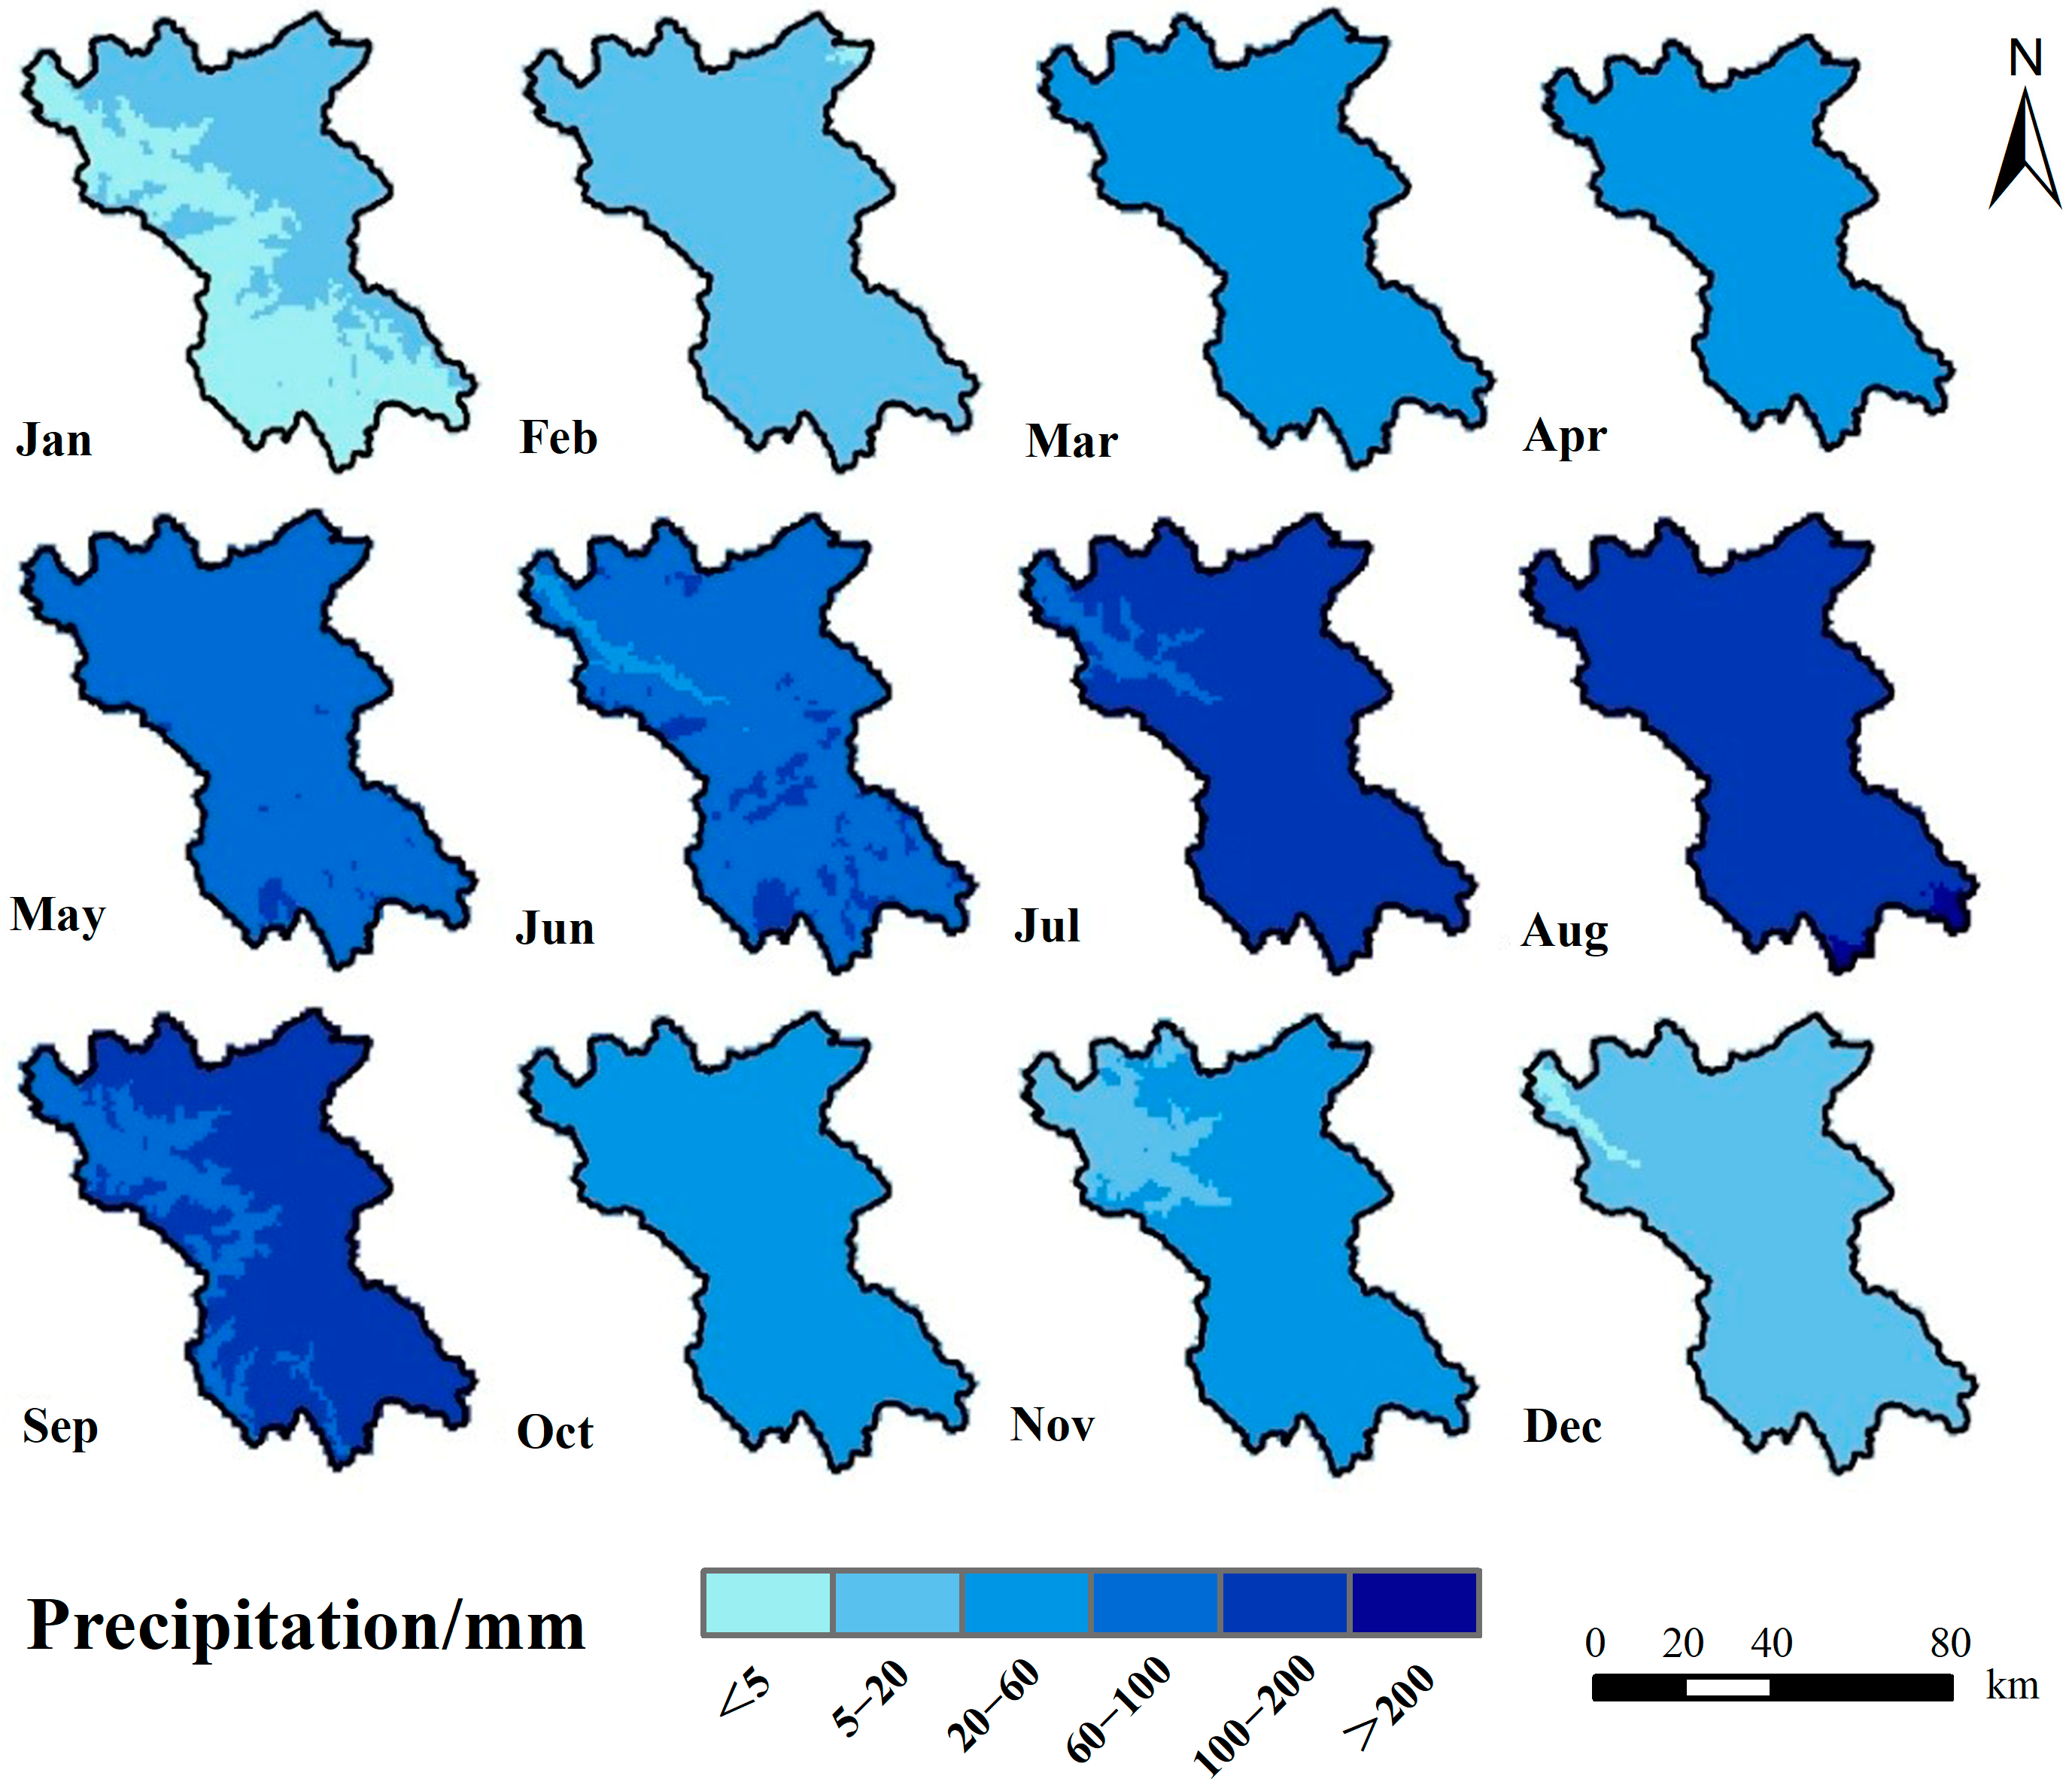
Figure 18.
Spatial distribution characteristics of TRMM precipitation data in 12 months.
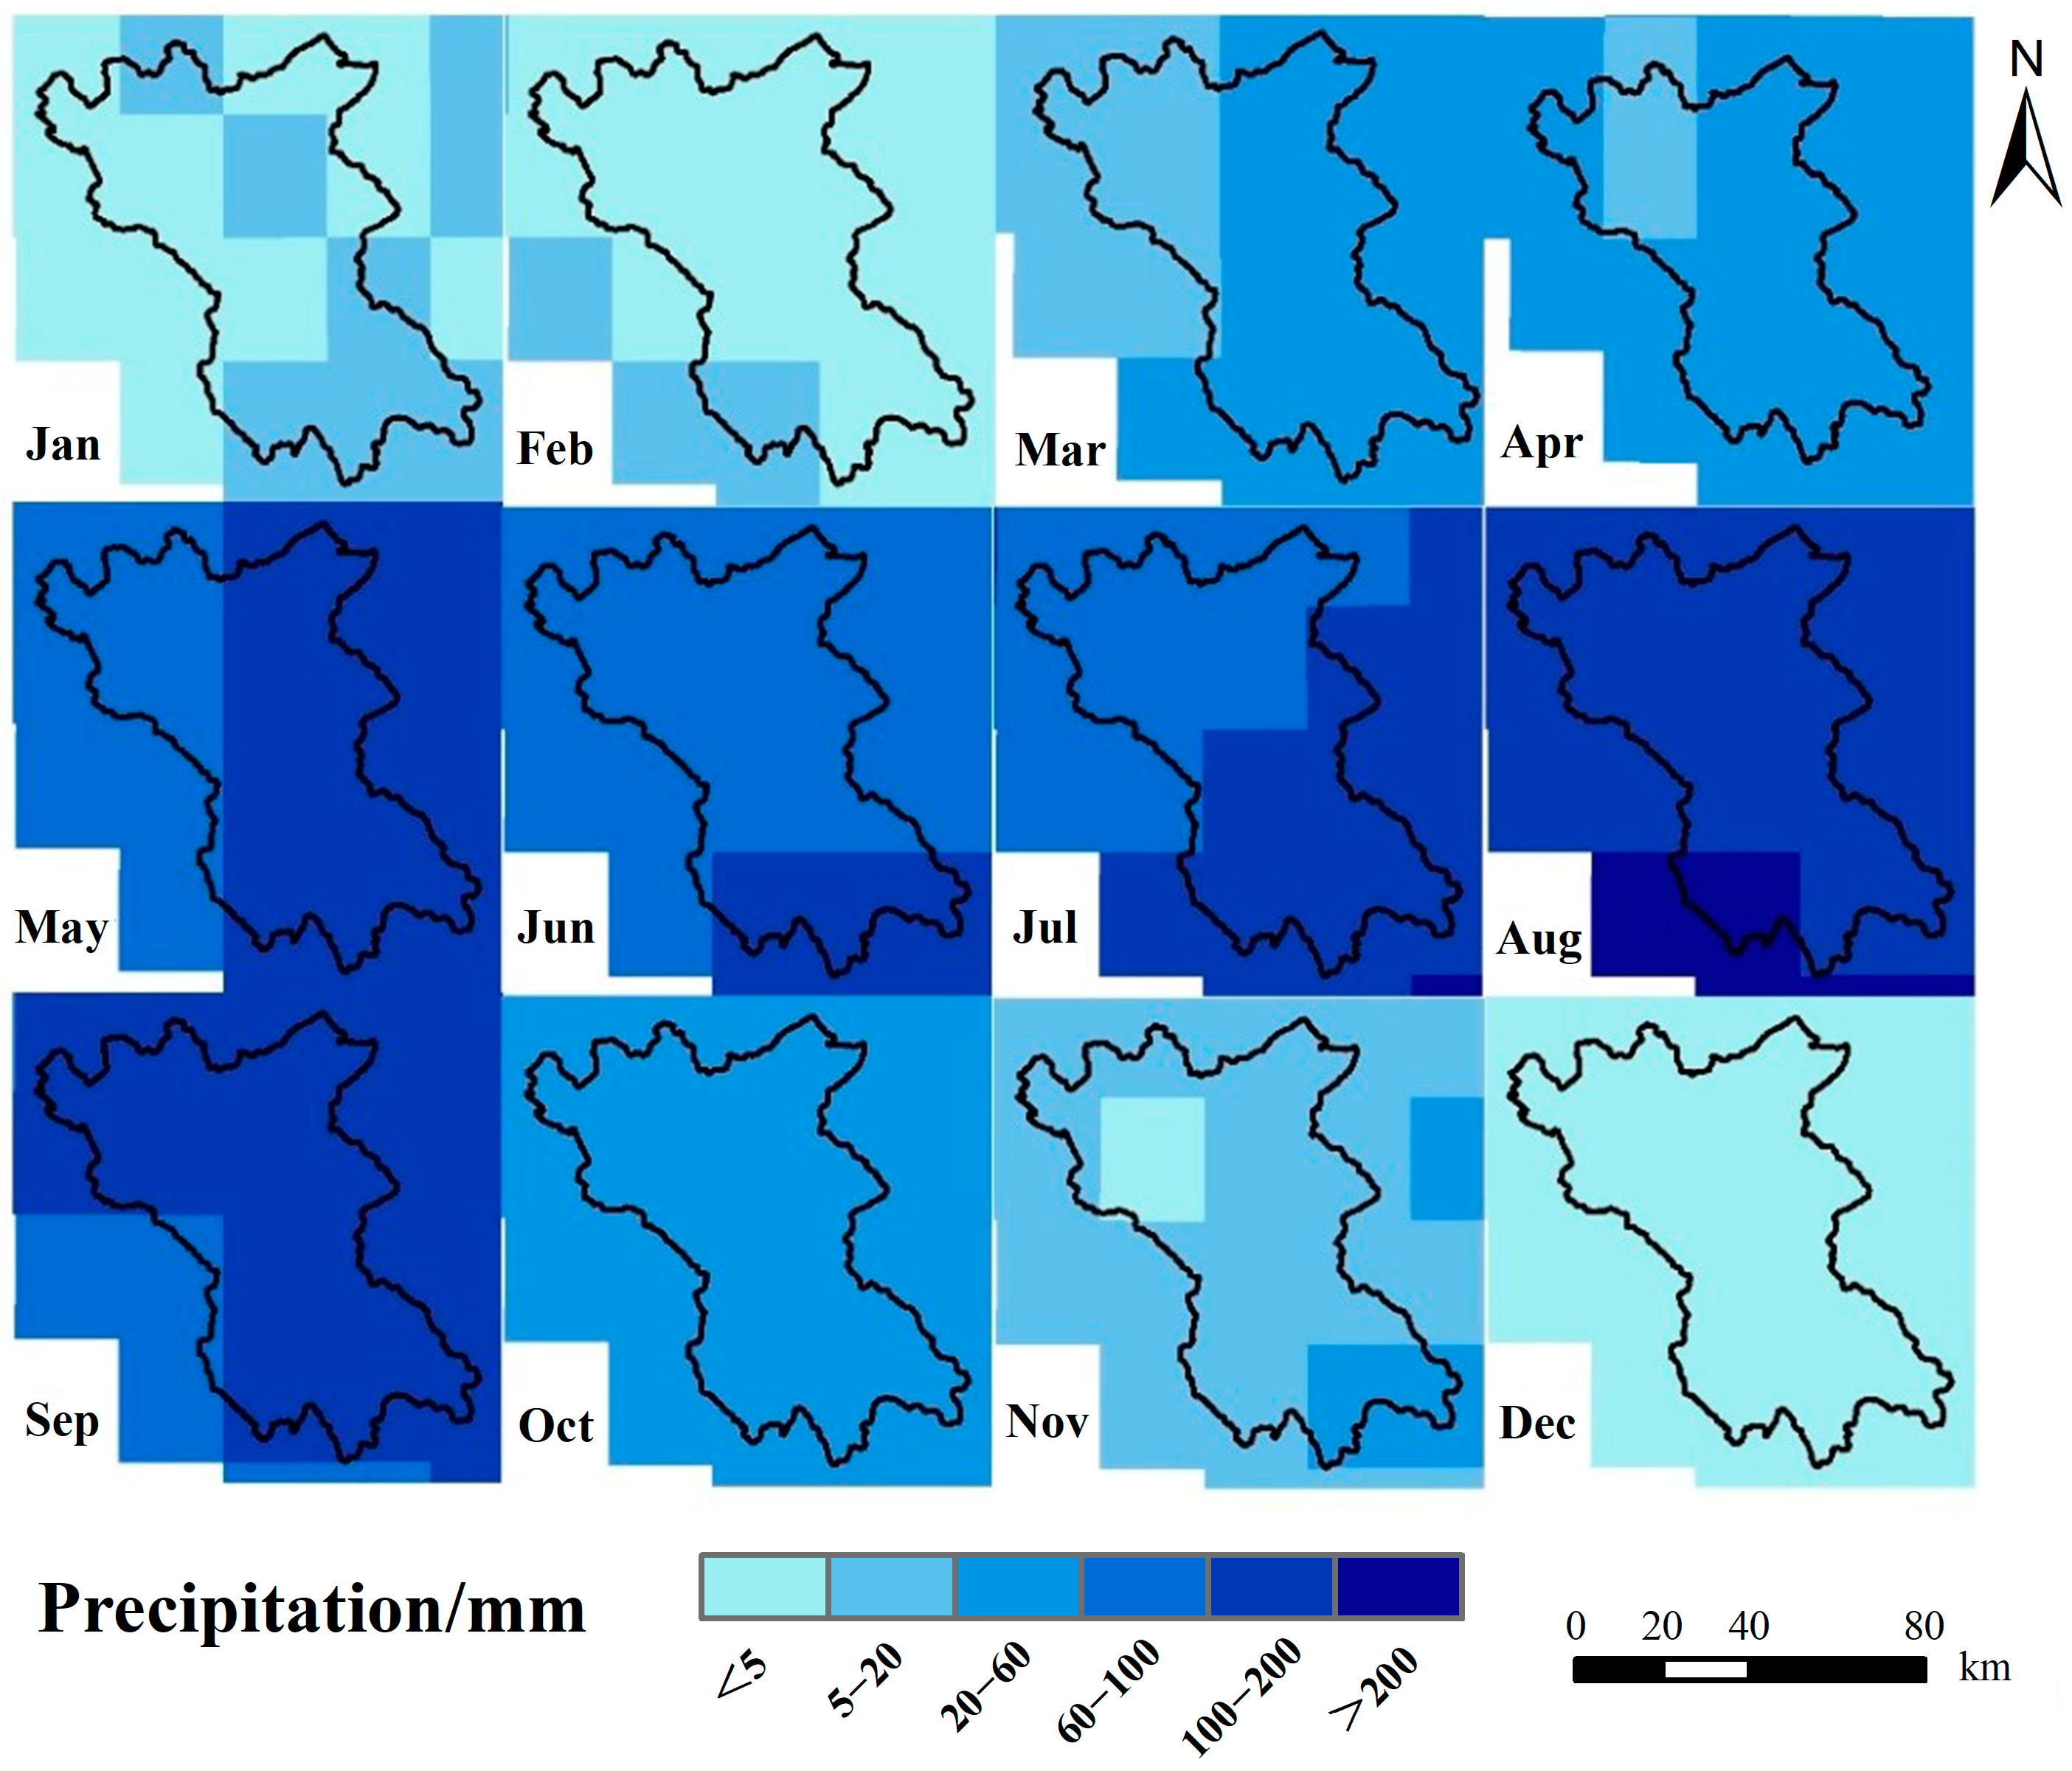
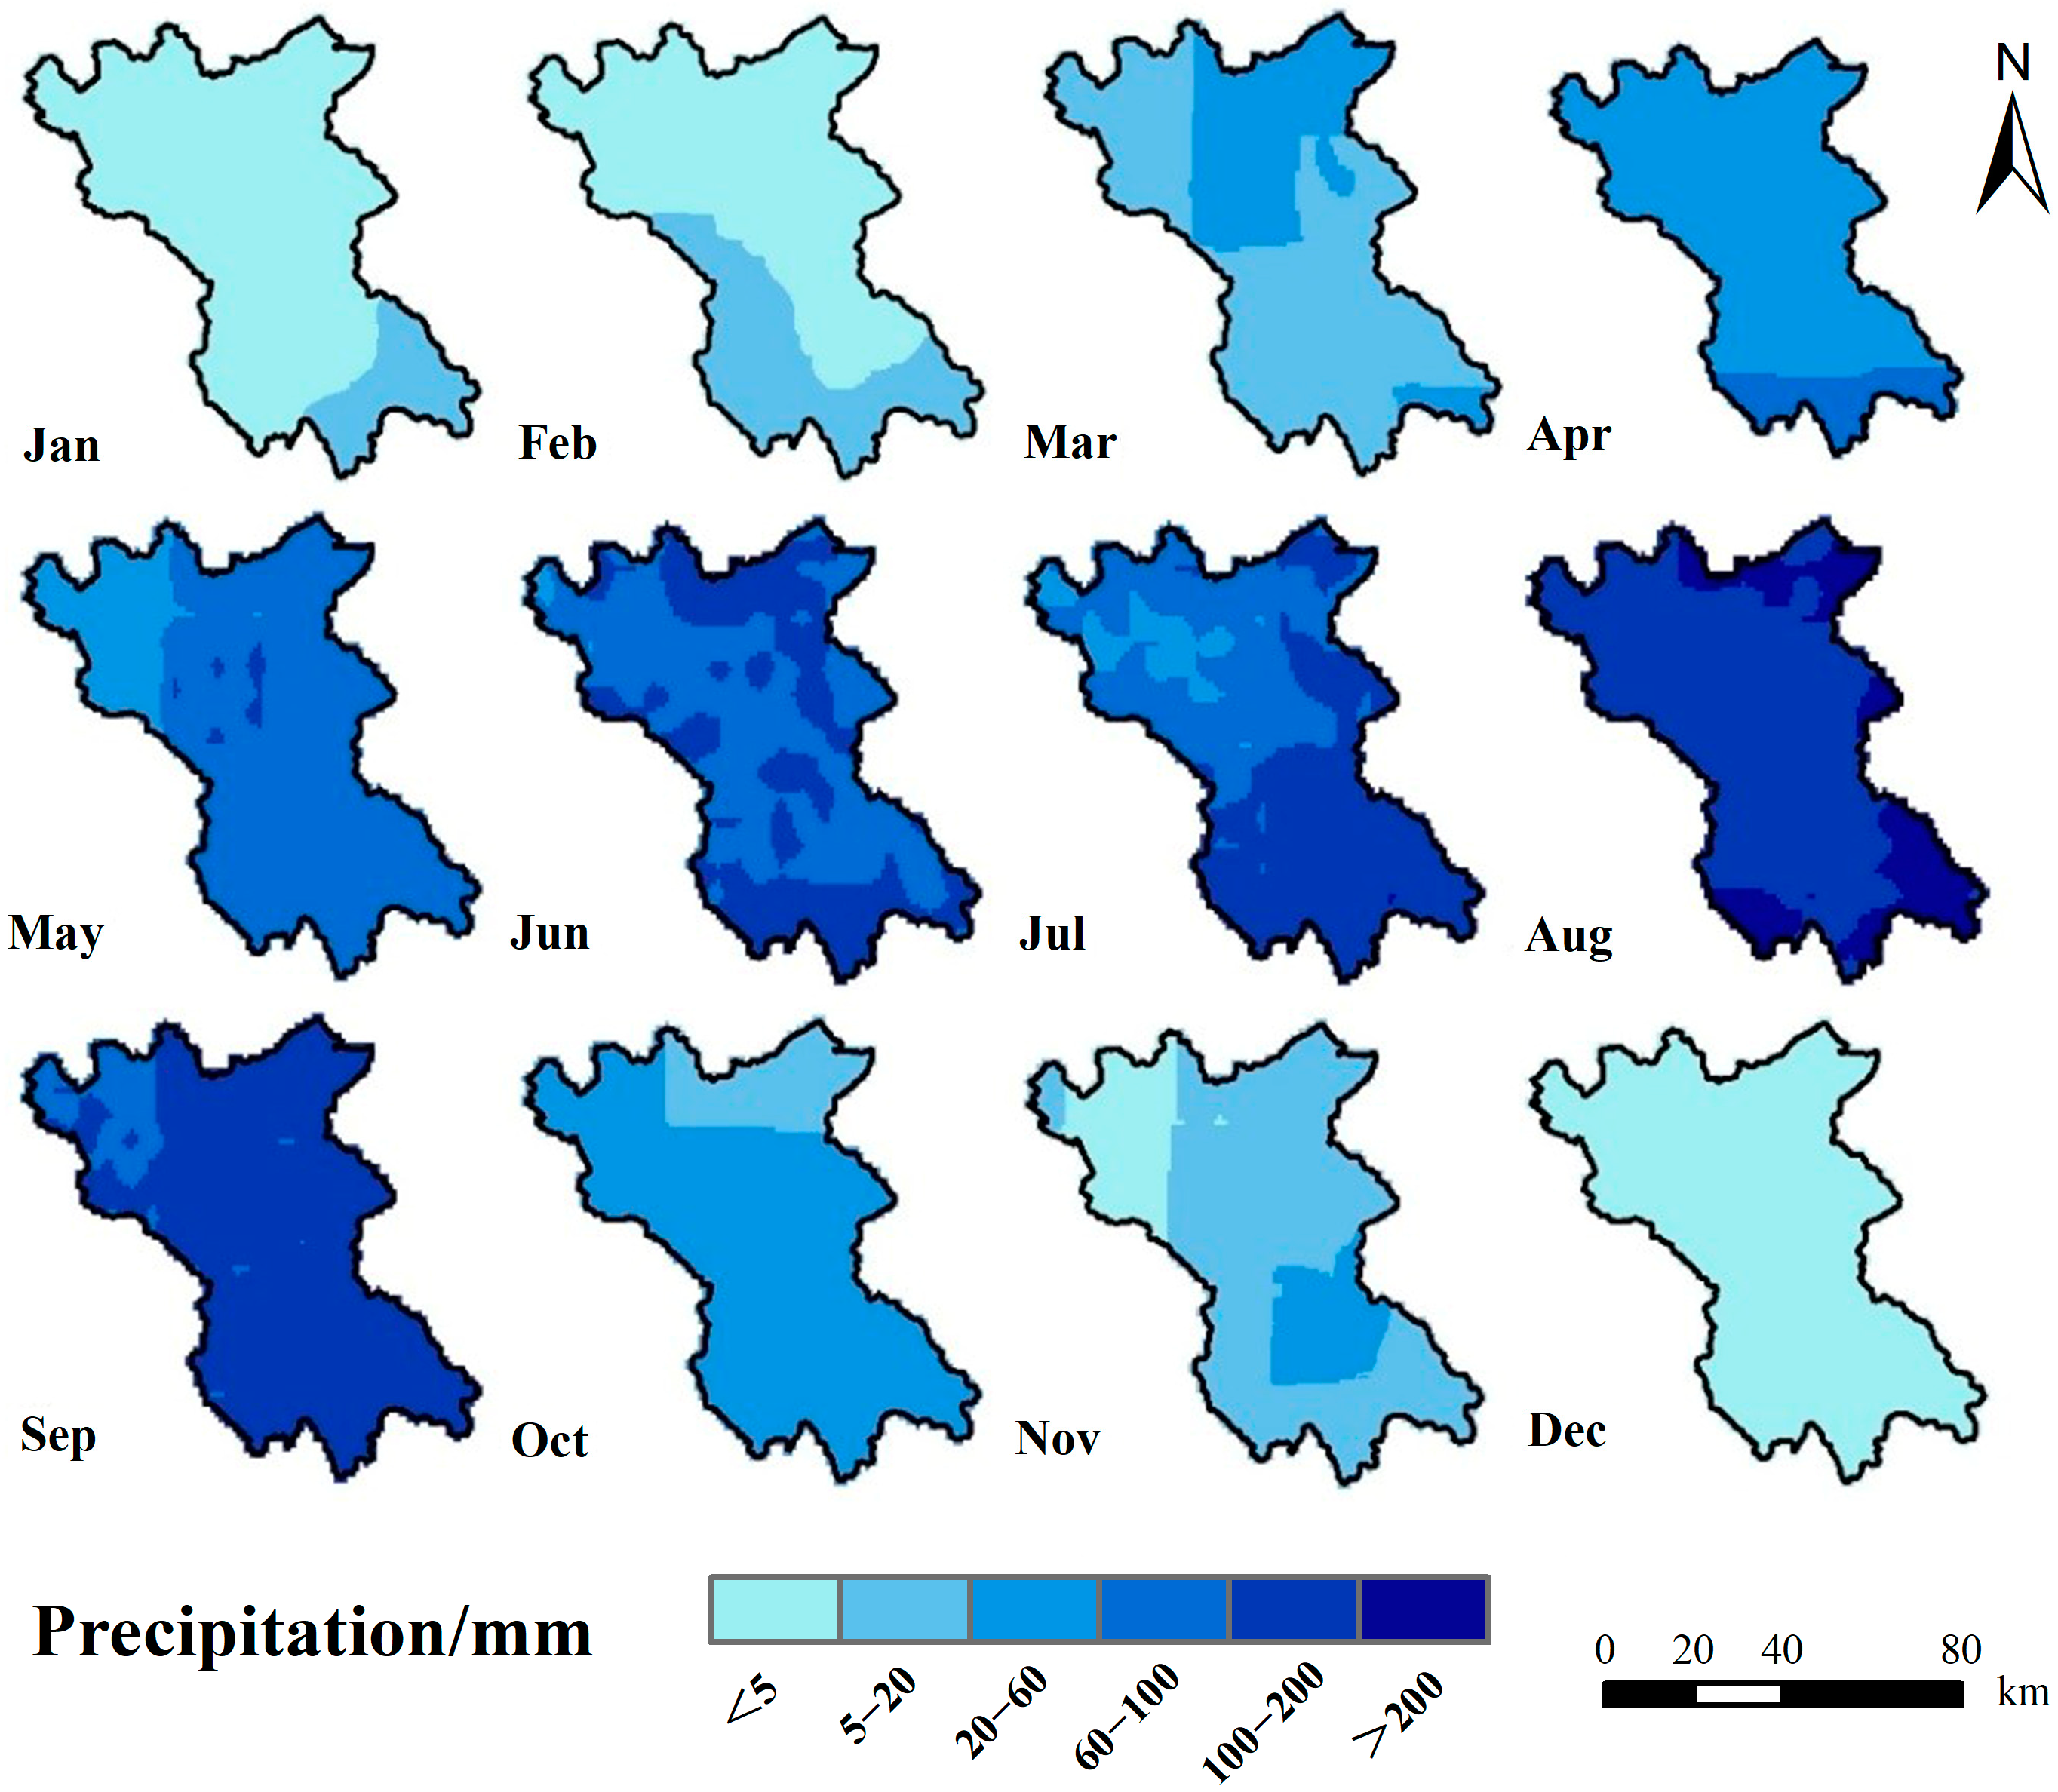
Figure 19.
Spatial distribution characteristics of TRMM downscale precipitation data in 12 months.

Table 1.
Data sources.
| Data | Spatial Resolution | Time Resolution | Source |
|---|---|---|---|
| TRMM 3B42 | 0.25° × 0.25° | 1 day | National Aeronautics and Space Administration (https://www.nasa.gov/, format: 28 April 2021) |
| MOD13A3 NDVI | 250 m × 250 m | 0.5 day | |
| SRTM DEM | 90 m × 90 m | — | Geospatial data cloud (http://www.gscloud. cn/, format: 5 May 2021) |
| Landslide data | — | 1 day | Bai et al. [24] |
| Landform data | 1 km × 1 km | — | Resource and Environment Science and Data Center (https://www.resdc.cn/, format: 28 July 2022) |
| Soil texture data | 1 km × 1 km | — | |
| Precipitation data | — | 1 day | China National Meteorological Information Center (http://data.cma.cn/, format: 5 May 2021) |
| Relative humidity data | — | 1 day |
Table 2.
Prediction results of three rainfall thresholds according to ID, TP, FN, FP, TN, TPR, FPR, and Euclidean distance (d).
Table 2.
Prediction results of three rainfall thresholds according to ID, TP, FN, FP, TN, TPR, FPR, and Euclidean distance (d).
| Interpolated Rainfall Threshold | |||||||||
| P | I = α × Dγ | TP | FN | FP | TN | TPR | FPR | d | |
| α | γ | ||||||||
| 10 | 1.62 | −0.986 | 35 | 0 | 1078 | 172 | 1 | 0.8624 | 0.8624 |
| 50 | 7.65 | −0.986 | 23 | 12 | 513 | 396 | 0.6571 | 0.5644 | 0.6603 |
| 90 | 26.8 | −0.986 | 6 | 29 | 187 | 976 | 0.1714 | 0.1608 | 0.8440 |
| Downscaling Rainfall Threshold | |||||||||
| P | I = α × Dγ | TP | FN | FP | TN | TPR | FPR | d | |
| α | γ | ||||||||
| 10 | 3.96 | −1.004 | 35 | 0 | 813 | 437 | 1 | 0.6504 | 0.6504 |
| 50 | 21.03 | −1.004 | 19 | 16 | 589 | 726 | 0.5429 | 0.3912 | 0.6017 |
| 90 | 50.73 | −1.004 | 5 | 30 | 133 | 1117 | 0.1429 | 0.1064 | 0.8637 |
Disclaimer/Publisher’s Note: The statements, opinions and data contained in all publications are solely those of the individual author(s) and contributor(s) and not of MDPI and/or the editor(s). MDPI and/or the editor(s) disclaim responsibility for any injury to people or property resulting from any ideas, methods, instructions or products referred to in the content. |
© 2023 by the authors. Licensee MDPI, Basel, Switzerland. This article is an open access article distributed under the terms and conditions of the Creative Commons Attribution (CC BY) license (https://creativecommons.org/licenses/by/4.0/).
Share and Cite
MDPI and ACS Style
Ning, S.; Ge, Y.; Bai, S.; Ma, C.; Sun, Y. I–D Threshold Analysis of Rainfall-Triggered Landslides Based on TRMM Precipitation Data in Wudu, China. Remote Sens. 2023, 15, 3892. https://doi.org/10.3390/rs15153892
AMA Style
Ning S, Ge Y, Bai S, Ma C, Sun Y. I–D Threshold Analysis of Rainfall-Triggered Landslides Based on TRMM Precipitation Data in Wudu, China. Remote Sensing. 2023; 15(15):3892. https://doi.org/10.3390/rs15153892
Chicago/Turabian StyleNing, Shan, Yonggang Ge, Shibiao Bai, Chicheng Ma, and Yiran Sun. 2023. "I–D Threshold Analysis of Rainfall-Triggered Landslides Based on TRMM Precipitation Data in Wudu, China" Remote Sensing 15, no. 15: 3892. https://doi.org/10.3390/rs15153892
Note that from the first issue of 2016, this journal uses article numbers instead of page numbers. See further details here.