Article

Downscaled Satellite Solar-Induced Chlorophyll Fluorescence Detects the Early Response of Sugarcane to Drought Stress in a Major Sugarcane-Planting Region of China

1
School of Geography and Information Engineering, China University of Geosciences, Wuhan 430074, China
2
School of Management Science and Engineering, Guangxi University of Finance and Economics, Nanning 530003, China
3
School of Computer Science, China University of Geosciences, Wuhan 430074, China
4
National Engineering Research Center for Geographic Information System, China University of Geosciences, Wuhan 430074, China
5
School of Geography and Planning, Nanning Normal University, Nanning 530001, China
*
Author to whom correspondence should be addressed.
Remote Sens. 2023, 15(16), 3937; https://doi.org/10.3390/rs15163937
Submission received: 23 June 2023 / Revised: 24 July 2023 / Accepted: 2 August 2023 / Published: 9 August 2023

Abstract

:
Under the background of global warming, seasonal drought has become frequent and intensified in many parts of the world in recent years. Drought is one of the most widespread and severe natural disasters, and poses a serious threat to normal sugarcane growth and yield. However, a deep understanding of sugarcane responses to drought stress remains limited, especially at a large spatial scale. In this work, we used the traditional vegetation index (enhanced vegetation index, EVI) and newly downscaled satellite solar-induced chlorophyll fluorescence (SIF) to investigate the impacts of drought on sugarcane in a major sugarcane-planting region of China (Chongzuo City, Southwest China). The results showed that Chongzuo City experienced an extremely severe drought event during the critical growth periods of sugarcane from August to November 2009. During the early stage of the 2009 drought, sugarcane SIF exhibited a quick negative response with a reduction of approximately 2.5% from the multiyear mean in late August 2009, while EVI was not able to capture the drought stress until late September 2009. Compared with EVI, sugarcane SIF shows more pronounced responses to drought stress during the later stage of drought, especially after late September 2009. SIF anomalies can closely capture the spatial and temporal dynamics of drought stress on sugarcane during this drought event. We also found that sugarcane SIF can provide earlier and much more pronounced physiological responses (as indicated by fluorescence yield) than structural responses (as indicated by the fraction of photosynthetically active radiation) to drought stress. Our results suggest that the satellite SIF has a great potential for sugarcane drought monitoring in a timely manner at a large spatial scale. These results are important for developing early warning models for sugarcane drought monitoring, and provide reliable information for developing measures to relieve the negative impacts of drought on sugarcane yield and regional economics.

1. Introduction

Drought is one of the most destructive natural disasters, and there has been wide concern about it for a long time [1,2,3]. In recent decades, seasonal drought has become more frequent and intensified under the background of global warming [2,3,4]. In particular, drought has become widespread and has long-lasting impacts on crops, such as sugarcane [5,6]. Sugarcane needs to consume a large amount of water during critical growth periods, such as the tillering, elongation, and maturity periods, but drought occurs frequently during these periods [7]. Drought, thus, tends to seriously affect the normal growth of sugarcane during the critical growth periods, which ultimately causes serious sugarcane yield losses [8]. Therefore, timely and effective drought monitoring is essential for sugarcane management and national sugar safety.
Ground experimental research can only reveal the drought condition in a small region near the observation site, but cannot monitor drought at a large spatial scale. Remote sensing technology has the characteristics of fast data acquisition, short cycle, and low cost [9,10,11,12]. It can obtain long-term, large-scale, spatially continuous observation data with a fine spatial resolution [12]. Traditional remote-sensing-based vegetation indices (VIs), such as the normalized difference vegetation index (NDVI) and enhanced vegetation index (EVI), reflect the greening rate of crops [13]. VIs can track the spatiotemporal characteristics of persistent drought, and are widely used to evaluate drought-related vegetation conditions [14,15,16]. For most types of vegetation, VIs generally show a downwards trend under the impacts of drought stress [13,17,18]. The greenness indices can only reflect changes in canopy structure, but the canopy structure remains unchanged during the early stage of drought [19,20,21]. Previous studies have suggested that the response of crop VIs to drought stress has a considerably long lag time [22]. For example, the response of NDVI to water stress typically lags from 10 days to 2 months [23]. Therefore, VIs are not able to capture the early response of crops to drought.
The recently developed solar-induced chlorophyll fluorescence (SIF), which serves as a direct probe of photosynthesis, provides an earlier and more direct method for accurately diagnosing changes in vegetation functions [1,24,25,26]. SIF is the red and far-red light (650–800 nm) emitted by chlorophyll, a pigment after light absorption for a few nanoseconds [21,25]. SIF is different from traditional reflectance-based VIs. It contains information on the biochemical, physiological, and metabolic functions of plants, and the amount of absorbed photosynthetically active radiation (APAR) [27,28]. Vegetation photosystems consume light from three pathways: photochemical reactions, thermal dissipation, and chlorophyll fluorescence emission [28,29,30]. Environmental stress affects the ability of plants to absorb APAR through photochemical reactions [31], thereby changing the fraction of absorbed energy that flows along these three pathways. Thus, SIF is related to photosynthesis and environmental stress [32,33]. Previous studies have suggested that the photosynthesis of many crops shows a quick negative response during the early stage of drought stress [1], so SIF may have great potential for capturing the early response of sugarcane to drought stress.
Atmospheric satellite sensors from several missions, including SCIAMACHY [34,35], GOME-2 [35,36,37], GOSAT [38,39,40], OCO-2 [41,42], and TROPOMI [43,44,45], have been used to observe the SIF of terrestrial vegetation. The chlorophyll fluorescence signal was mainly derived from the fluorescence emission of vegetation chlorophyll, while soil and cloud layers did not produce fluorescence signals [21,46]. Thus, satellite SIF products are less contaminated by cloud and soil background compared with traditional satellite-based VIs [47]. Satellite SIF provides a feasible method for large-scale diagnosis of sugarcane drought at a large spatial scale.
As SIF is sensitive to environmental stresses, such as drought and extreme temperature, it has been used to monitor the response of crops to environmental stresses [27,48,49,50,51]. For example, previous studies suggested that satellite SIF is more sensitive than VIs in terms of capturing the responses of wheat, maize, and rice to drought or extreme temperature stresses [1,25,27]. However, our understanding of the different response patterns of sugarcane SIF and VIs to drought stress is limited, and the possible response mechanism of sugarcane SIF to drought is also unclear thus far. As sugarcane-planting areas are relatively fragmented, the spatial resolution of SIF observed by satellite measures is coarse, which makes it difficult to detect the responses of sugarcane to drought stress using the original satellite SIF. Recently, the spatial resolution of satellite SIF was enhanced by fusing the original satellite SIF with additional products from different remote sensing platforms based on spatial downscaling methods. Downscaled satellite SIF products, such as SIF* [52], RSIF [53], CSIF [54], Downscaled-GOME2-SIF [55], DSIF [56], GOSIF [57], SIFnet [58], and HSIF [59], have been produced. These downscaled satellite SIF products are of finer spatial resolutions (0.05 degrees), but with different time periods. The GOSIF dataset covers a long time period, has high spatiotemporal continuity, and has been successfully used to monitor the response of crops to drought [60], vegetation dynamics [61], and photosynthetic phenology [62]. In this work, we explore the potential of downscaled satellite SIF for assessing the impacts of drought on sugarcane.
China is the third-largest sugarcane-planting region in the world [8]. Sugarcane is mainly planted in subtropical areas of southwest China, especially in the Guangxi Province. Chongzuo City is the most important sugarcane-planting region in the Guangxi Province and is also the largest sugarcane-planting region and sugar production base in China. Annual sugar production from sugarcane in Chongzuo City is approximately 2 million tons, and accounts for approximately 1/5 of the total production of China [8,63,64]. The area of the sugarcane-planting region has been relatively stable for many years in this city [8,63,65]. However, more than 80% of sugarcane is planted in dry and hilly land where irrigation is also commonly not accessible, and sugarcane-planting regions are much more vulnerable to drought stress. Therefore, we explore the potential of utilizing satellite observations of SIF and EVI to assess the impacts of drought stress on sugarcane, with a special focus on an extremely severe drought event in Chongzuo City, in this work. The main objectives of this work are to explore the different response patterns of sugarcane SIF and a traditional vegetation index to drought, analyze the sensitivity of SIF to drought stress in the critical growth periods of sugarcane, and analyze whether SIF can serve as an effective indicator for estimating sugarcane yields or GPP.

2. Materials and Methods

2.1. Study Area

Chongzuo City is located in the southwest of Guangxi, China. Sugarcane is mainly planted in the central parts of Chongzuo City (Figure 1a). The critical growth periods of sugarcane in Chongzuo City are approximately from April to November. Following Wang, Xiao [7], we extracted the spatial distribution of sugarcane-planting areas from Sentinel-2 remote sensing datasets in 2019. To match the spatial resolution of the downscaled SIF data (0.05°, ~5.5 km), 0.05° grid data were first created, and the area of sugarcane-planting areas were counted in each grid. As suggested by Chen, Mo [25], grids with sugarcane-planting areas above 50% were finally selected as the target grids (Figure 1b).

2.2. Data

2.2.1. Satellite SIF

This work used GOSIF monthly downscaled SIF data from 2000 to 2020 produced by Li and Xiao [57]. It is a new, global, and OCO-2-based SIF dataset with high spatial and temporal resolutions (i.e., 0.05°, 8-day). GOSIF monthly SIF integrates discrete OCO-2 SIF, remote sensing data from the moderate resolution imaging spectroradiometer (MODIS), and meteorological reanalysis data, by using the spatial downscaling method [57]. GOSIF data have a finer spatial resolution, continuous global coverage, and longer records than coarse-resolution SIF aggregated directly from OCO-2 probes.

2.2.2. MODIS Products

MODIS products, including EVI, fraction of photosynthetic active radiation (fPAR), photosynthetic active radiation (PAR), gross primary productivity (GPP), land surface temperature (LST), and evaporation (ET), were used in this work. The algorithms of NDVI and EVI are similar, but EVI reduces the influence of atmospheric and canopy background and enhances the vegetation signal [66]. EVI is an upgraded algorithm of NDVI [67]. We selected MODIS EVI as a traditional vegetation index in this study. The 16-day MODIS EVI product (MOD13C1 collection 6) is the Terra MODIS level 3 vegetation index product with 0.05° spatial resolution, and contains reliability and QA layers. MODIS EVI data were quality filtered by excluding pixels contaminated by clouds or aerosols using quality flags.
MODIS fPAR and PAR products were used to further interpret the dynamics of SIF. The MODIS fPAR is the standard 1 km spatial resolution product with a temporal resolution of 8 days [68]. The MODIS-based PAR dataset from GLASS products was used, and is available from http://www.glass.umd.edu/PAR/ (accessed on 22 November 2021). In addition, the GPP dataset derived from FLUXNET was used. This dataset provides global daily estimates of GPP and uncertainties at 0.05-degree resolution from 2000-03 to near recent. The 16-day MODIS LST product (MOD11C3) and ET were used to analyze possible changes in thermal dynamics under drought conditions. MODIS products are mainly available from https://lpdaac.usgs.gov/ (accessed on 13 February 2022).

2.2.3. Meteorological Data and Drought Index

The monthly precipitation dataset with 1 km spatial resolution was downloaded from the Science Data Bank (http://www.scidb.cn/cstr/31253.11.sciencedb.01607 (accessed on 10 January 2023)). This dataset was derived from monthly precipitation data observed at more than 2400 meteorological stations in China from 1960 to 2020. The daily air temperature dataset (1979–2018) produced by Fang, Mao [69] was used. This temperature dataset is of 0.1° spatial resolution, and is available from https://doi.org/10.5281/zenodo.5502275 (accessed on 9 December 2022).
Standardized precipitation evapotranspiration index (SPEI) not only takes into account the sensitivity of drought to temperature, but also preserves multiple time scales and allows for flexible comparability [70]. This index is calculated based on a water balance equation represented by the difference between precipitation and potential evapotranspiration [71]. SPEI is suitable for multi-scale and multi-spatial comparisons, and has been widely used to monitor drought at regional and global scales [70,72,73]. According to Vicente-Serrano, Begueria [70] and Wang, Ding [74], SPEI was calculated on a 3-month time scale to indicate meteorological drought conditions in this work.

2.2.4. Statistical Data

The annual statistical sugarcane-planting areas and annual yield from statistical yearbooks were used to analyze the impact of drought on sugarcane yield. The statistical yearbooks were downloaded from the national bureau of statistics of China (http://www.stats.gov.cn/tjsj/ndsj/ (accessed on 8 September 2021)). Sugarcane yield per unit area, which is the annual yield divided by annual statistical sugarcane-planting areas, was finally calculated in Chongzuo City. Because Chongzuo City was officially established in 2003, there is not statistical data until 2004.

2.3. Analysis

Interannual variations and seasonal cycles of all aforementioned variables were calculated by taking the average over sugarcane-planting areas, and were also calculated at each grid over sugarcane-planting areas in Chongzuo city during 2001–2020 (2001–2018 for SPEI, precipitation, and air temperature, and 2001–2018 for evaporation). Monthly or 16-day anomalies of regional means and each grid for all variables were computed as the departures from the corresponding multiyear means. The 16-day relative changes in LST, ET, EVI, SIF, PAR, fPAR, SIFpar, and SIFyield were defined as the anomalies divided by their corresponding multiyear means. We also used the monthly normalized anomalies of LST, ET, EVI, SIF, PAR, fPAR, SIFpar, and SIFyield, which were calculated as the monthly anomalies divided by the standard deviation of the monthly anomalies during the periods, to better compare their temporal and spatial dynamics.
To further analyze the different responses of sugarcane EVI and SIF to drought, we used fPAR, SIFpar and SIFyield to interpret SIF. The SIF, SIFpar, and SIFyield can be described as follows:
S I F = P A R f P A R S I F y i e l d η
S I F p a r = S I F η P A R
S I F y i e l d = S I F η A P A R
A P A R = P A R f P A R
where PAR is the photosynthetically active radiation, APAR is the absorbed PAR, fPAR is the fraction of APAR, and ƞ is the proportion of fluorescence escaping from the canopy to the space. Considering the low absorption and relatively simple plant structure, when infrared SIF is applied to grasses and crops, it can be assumed that ƞ ≈ 1 [25,26,75]. SIFpar is PAR-normalized fluorescence, and contains comprehensive information on vegetation structure (such as chlorophyll content) and SIFyield [22,51]. SIFyield is the APRA-normalized fluorescence that quantifies the proportion of energy used for fluorescence emission in each absorbed PAR and is the light utilization efficiency (LUE) of SIF [25].
Due to the linear relationship between crop yield and GPP, sugarcane yield loss can be directly compared to GPP loss [25,76]. In this work, we analyzed the correlation of sugarcane EVI, SIF, and yield during 2004–2020, and also compared the correlations of sugarcane EVI, SIF, and GPP during 2001–2020. Correlation analysis was quantified by using the Pearson correlation coefficient, and statistical significance was the coefficient of determination R2 [27].
Note that most of the datasets were resampled to a spatial resolution of 0.05° by using the nearest interpolation method, and further recalculated to 16-day and monthly datasets by averaging data from corresponding periods.

3. Results

3.1. Interannual Variations in Sugarcane Yield/GPP and EVI/SIF

We first analyze the interannual variations in sugarcane yield and the mean EVI and SIF during the critical growth periods in the entire study area (Figure 2a). We found that the mean EVI and SIF showed a significant increasing trend from 2001–2020, and the sugarcane yield also increased significantly from 2004–2020. The mean SIF is significantly and highly correlated with sugarcane yield (R2 = 0.76, p < 0.01), which indicates that SIF can explain approximately 76% of the interannual variations in sugarcane yield. The correlation of the EVI and yield (R2 = 0.67, p < 0.01) was lower than that of SIF and yield. The results show that the capability of SIF to capture the interannual variations in sugarcane yield is better than that of the EVI.
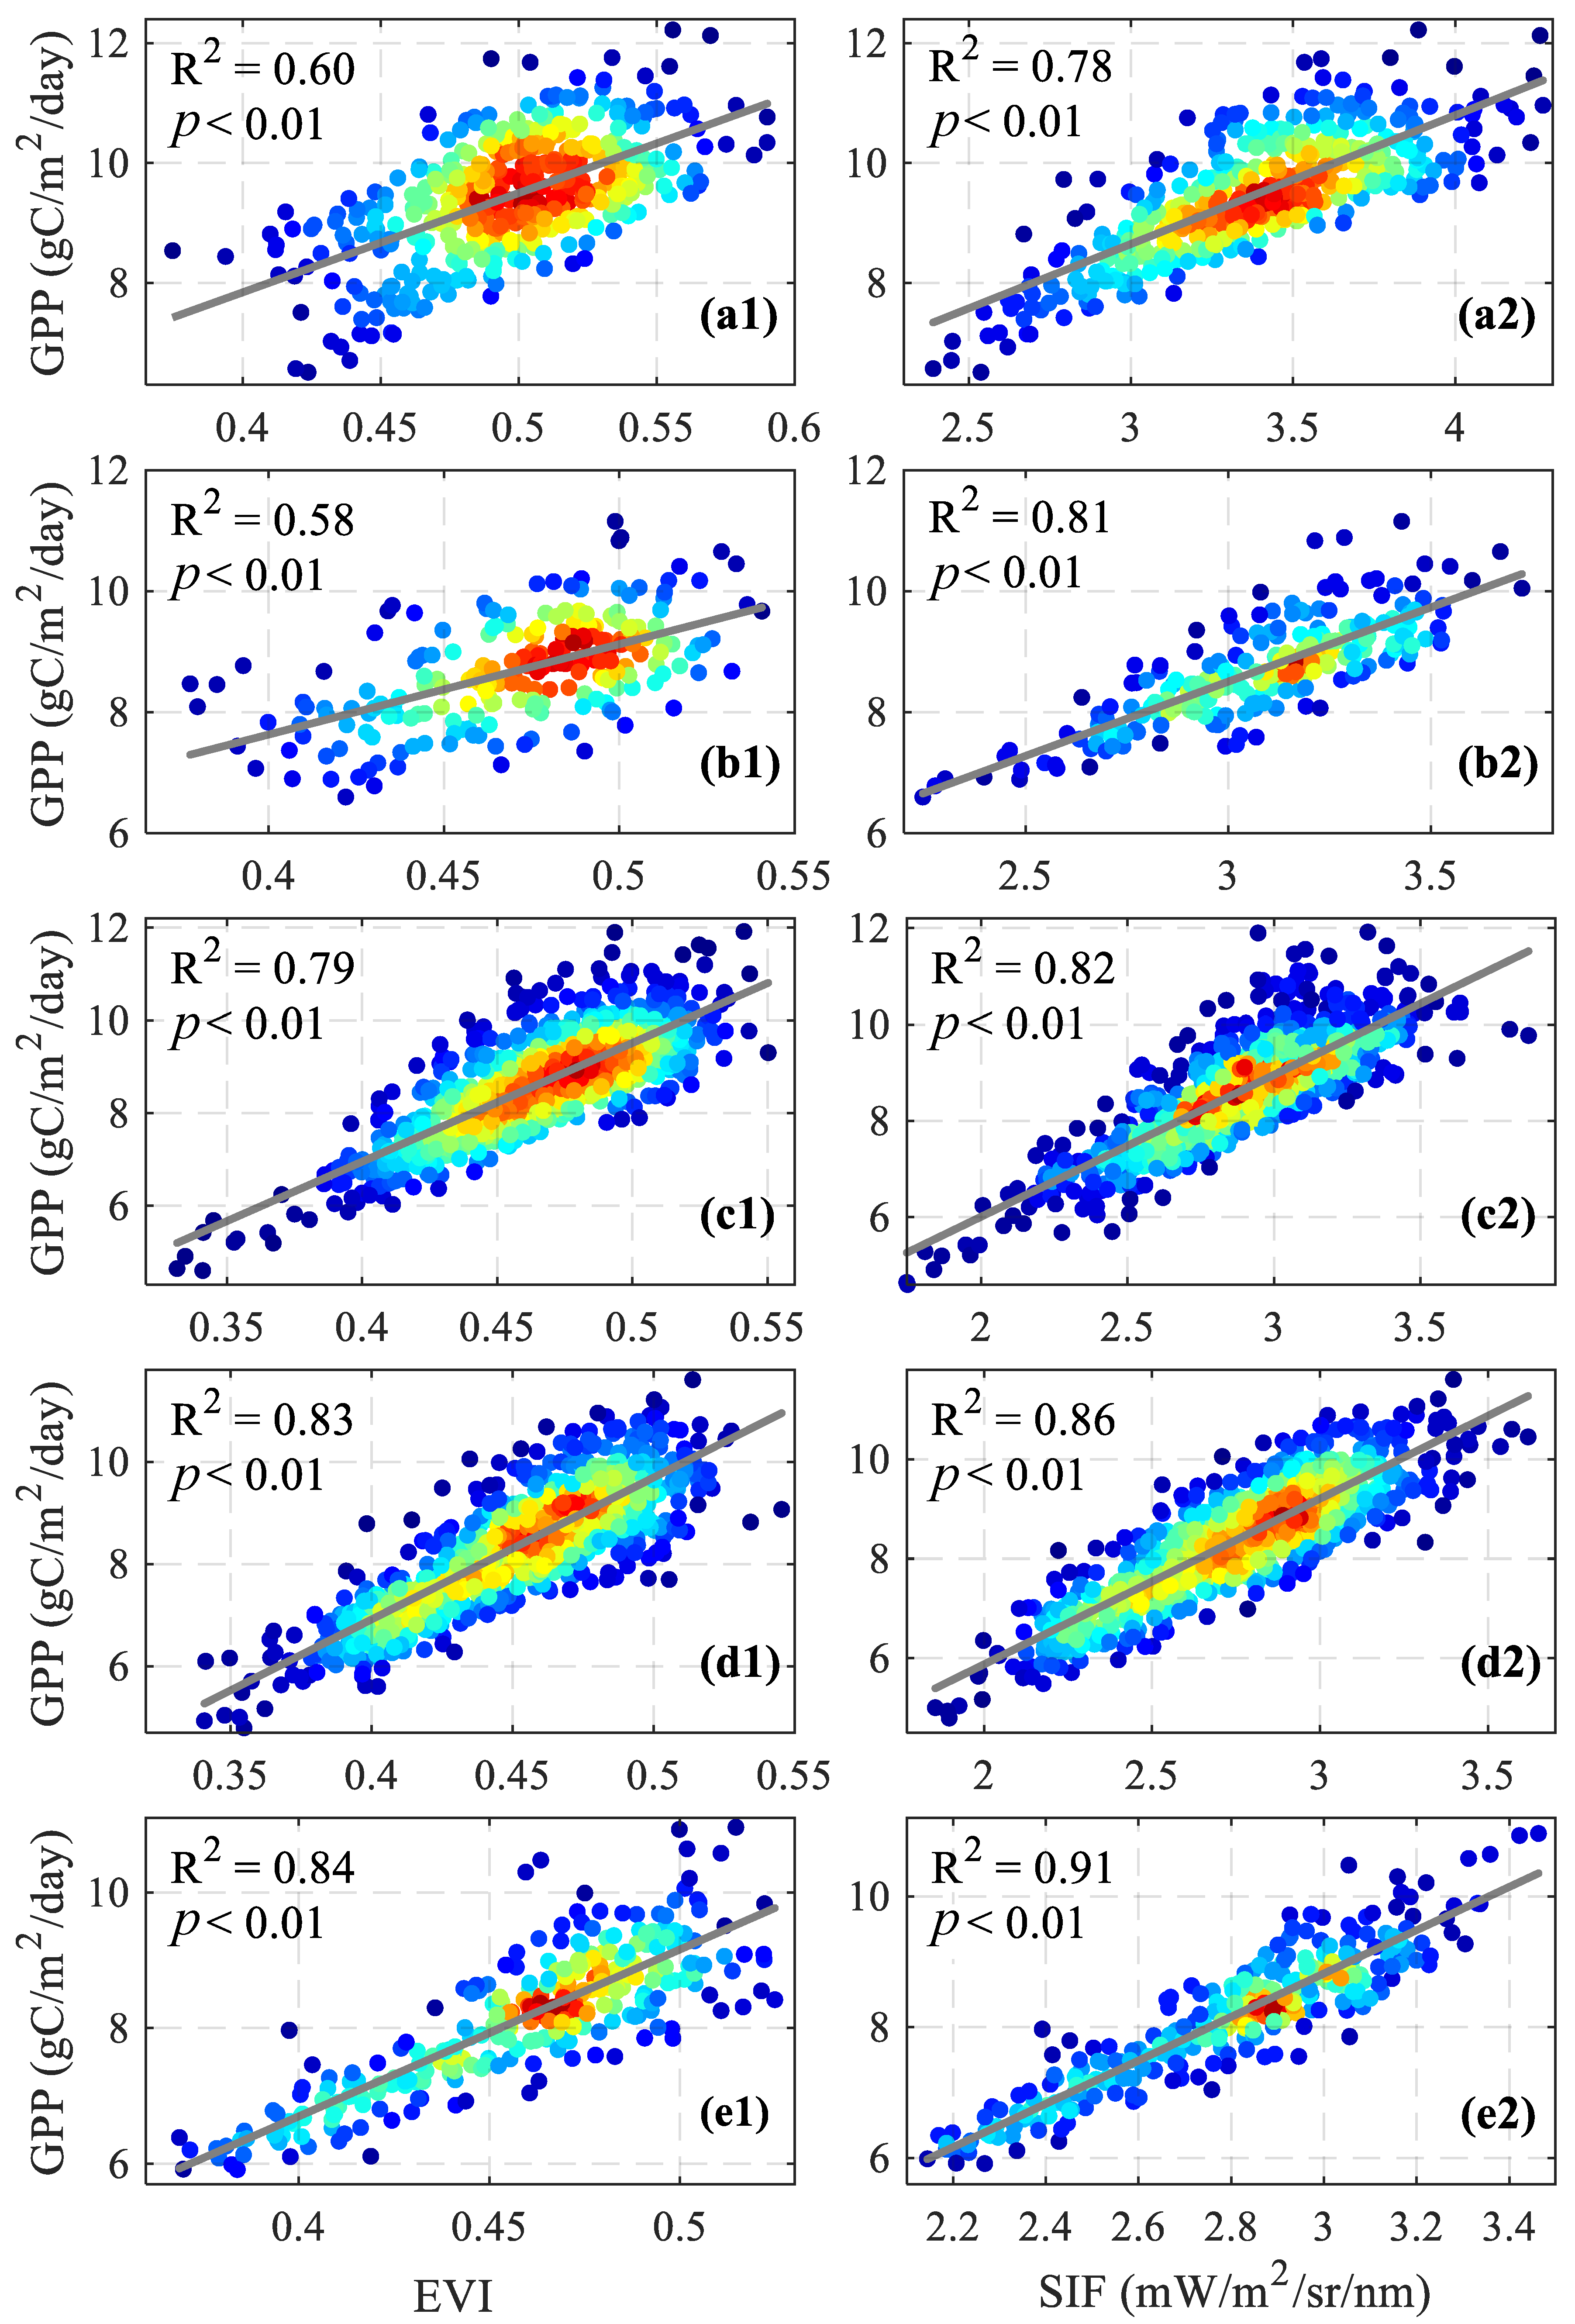
To further validate the results, we compared the correlations of the mean EVI, SIF, and GPP during the critical growth periods of sugarcane at the regional and county levels. We found that SIF (EVI) explained approximately 83% (79%) of the interannual variations in sugarcane GPP in the entire study area (Figure 2b,c). The relationships of sugarcane SIF and GPP are stronger than those of sugarcane EVI and GPP in all counties (Figure 3). For example, SIF can capture approximately 81% of the interannual variations in sugarcane GPP, whereas this value is 58% for EVI in Daxin County. This is because the EVI tends to underestimate (overestimate) the GPP for high (low) GPP ranges, leading to a larger error in approximating sugarcane GPP. All of these results indicate that the capability of SIF to capture the interannual variations in sugarcane GPP is better than that of the EVI at both the regional scale and county level.

3.2. Spatiotemporal Dynamics of SPEI, Precipitation, and Air Temperature during the Sugarcane Growth Period

We use the seasonal variations in the anomalies of SPEI, precipitation, and air temperature to analyze the temporal dynamics of drought in the entire study area during the critical growth period of sugarcane (Figure 4). We find that the SPEI is less than −1 from August to November 2009, and is also much lower than the corresponding values in all other years from August to November. In particular, the SPEI was smaller than −2 in September 2009. These results indicate that the study area experienced the most severe drought in 2009 in recent years. Thus, we take the 2009 drought as a case study. The reasons for the 2009 drought event are mainly attributed to significantly reduced precipitation (Figure 4b) and higher air temperature (Figure 4c). Precipitation was approximately 100 mm lower than the multiyear mean, and air temperature was approximately 2.5 °C higher than the multiyear mean in August and September 2009.
To further explore the spatial dynamics of the 2009 drought, the spatial distributions of the SPEI and the anomalies of precipitation and air temperature from July to November 2009 are analyzed, and are shown in Figure 5. In July 2009, the SPEI starts to show negative values in the western parts, which indicates that drought is more likely to occur in these regions. After that, the entire study area experienced continuous and dry conditions (SPEI < −0.5) until November 2009. The regions with the highest drought level are located in the western parts (extreme dry, −2.0 < SPEI < −1.5) in August, but move to the central and eastern parts (exceptional dry, SPEI < −2.0) in September and stay in the central parts (extreme dry) until November. The central parts are always the drought center from September to November 2009. In the 2009 drought, precipitation was lower than the multiyear mean from July to November in almost the entire study area, and this situation became extremely serious in August (<100 mm). This drought event is also accompanied by a higher air temperature from August to October in the entire study area, especially in September (>1.2 °C).

3.3. Spatiotemporal Dynamics of LST and ET during the 2009 Drought

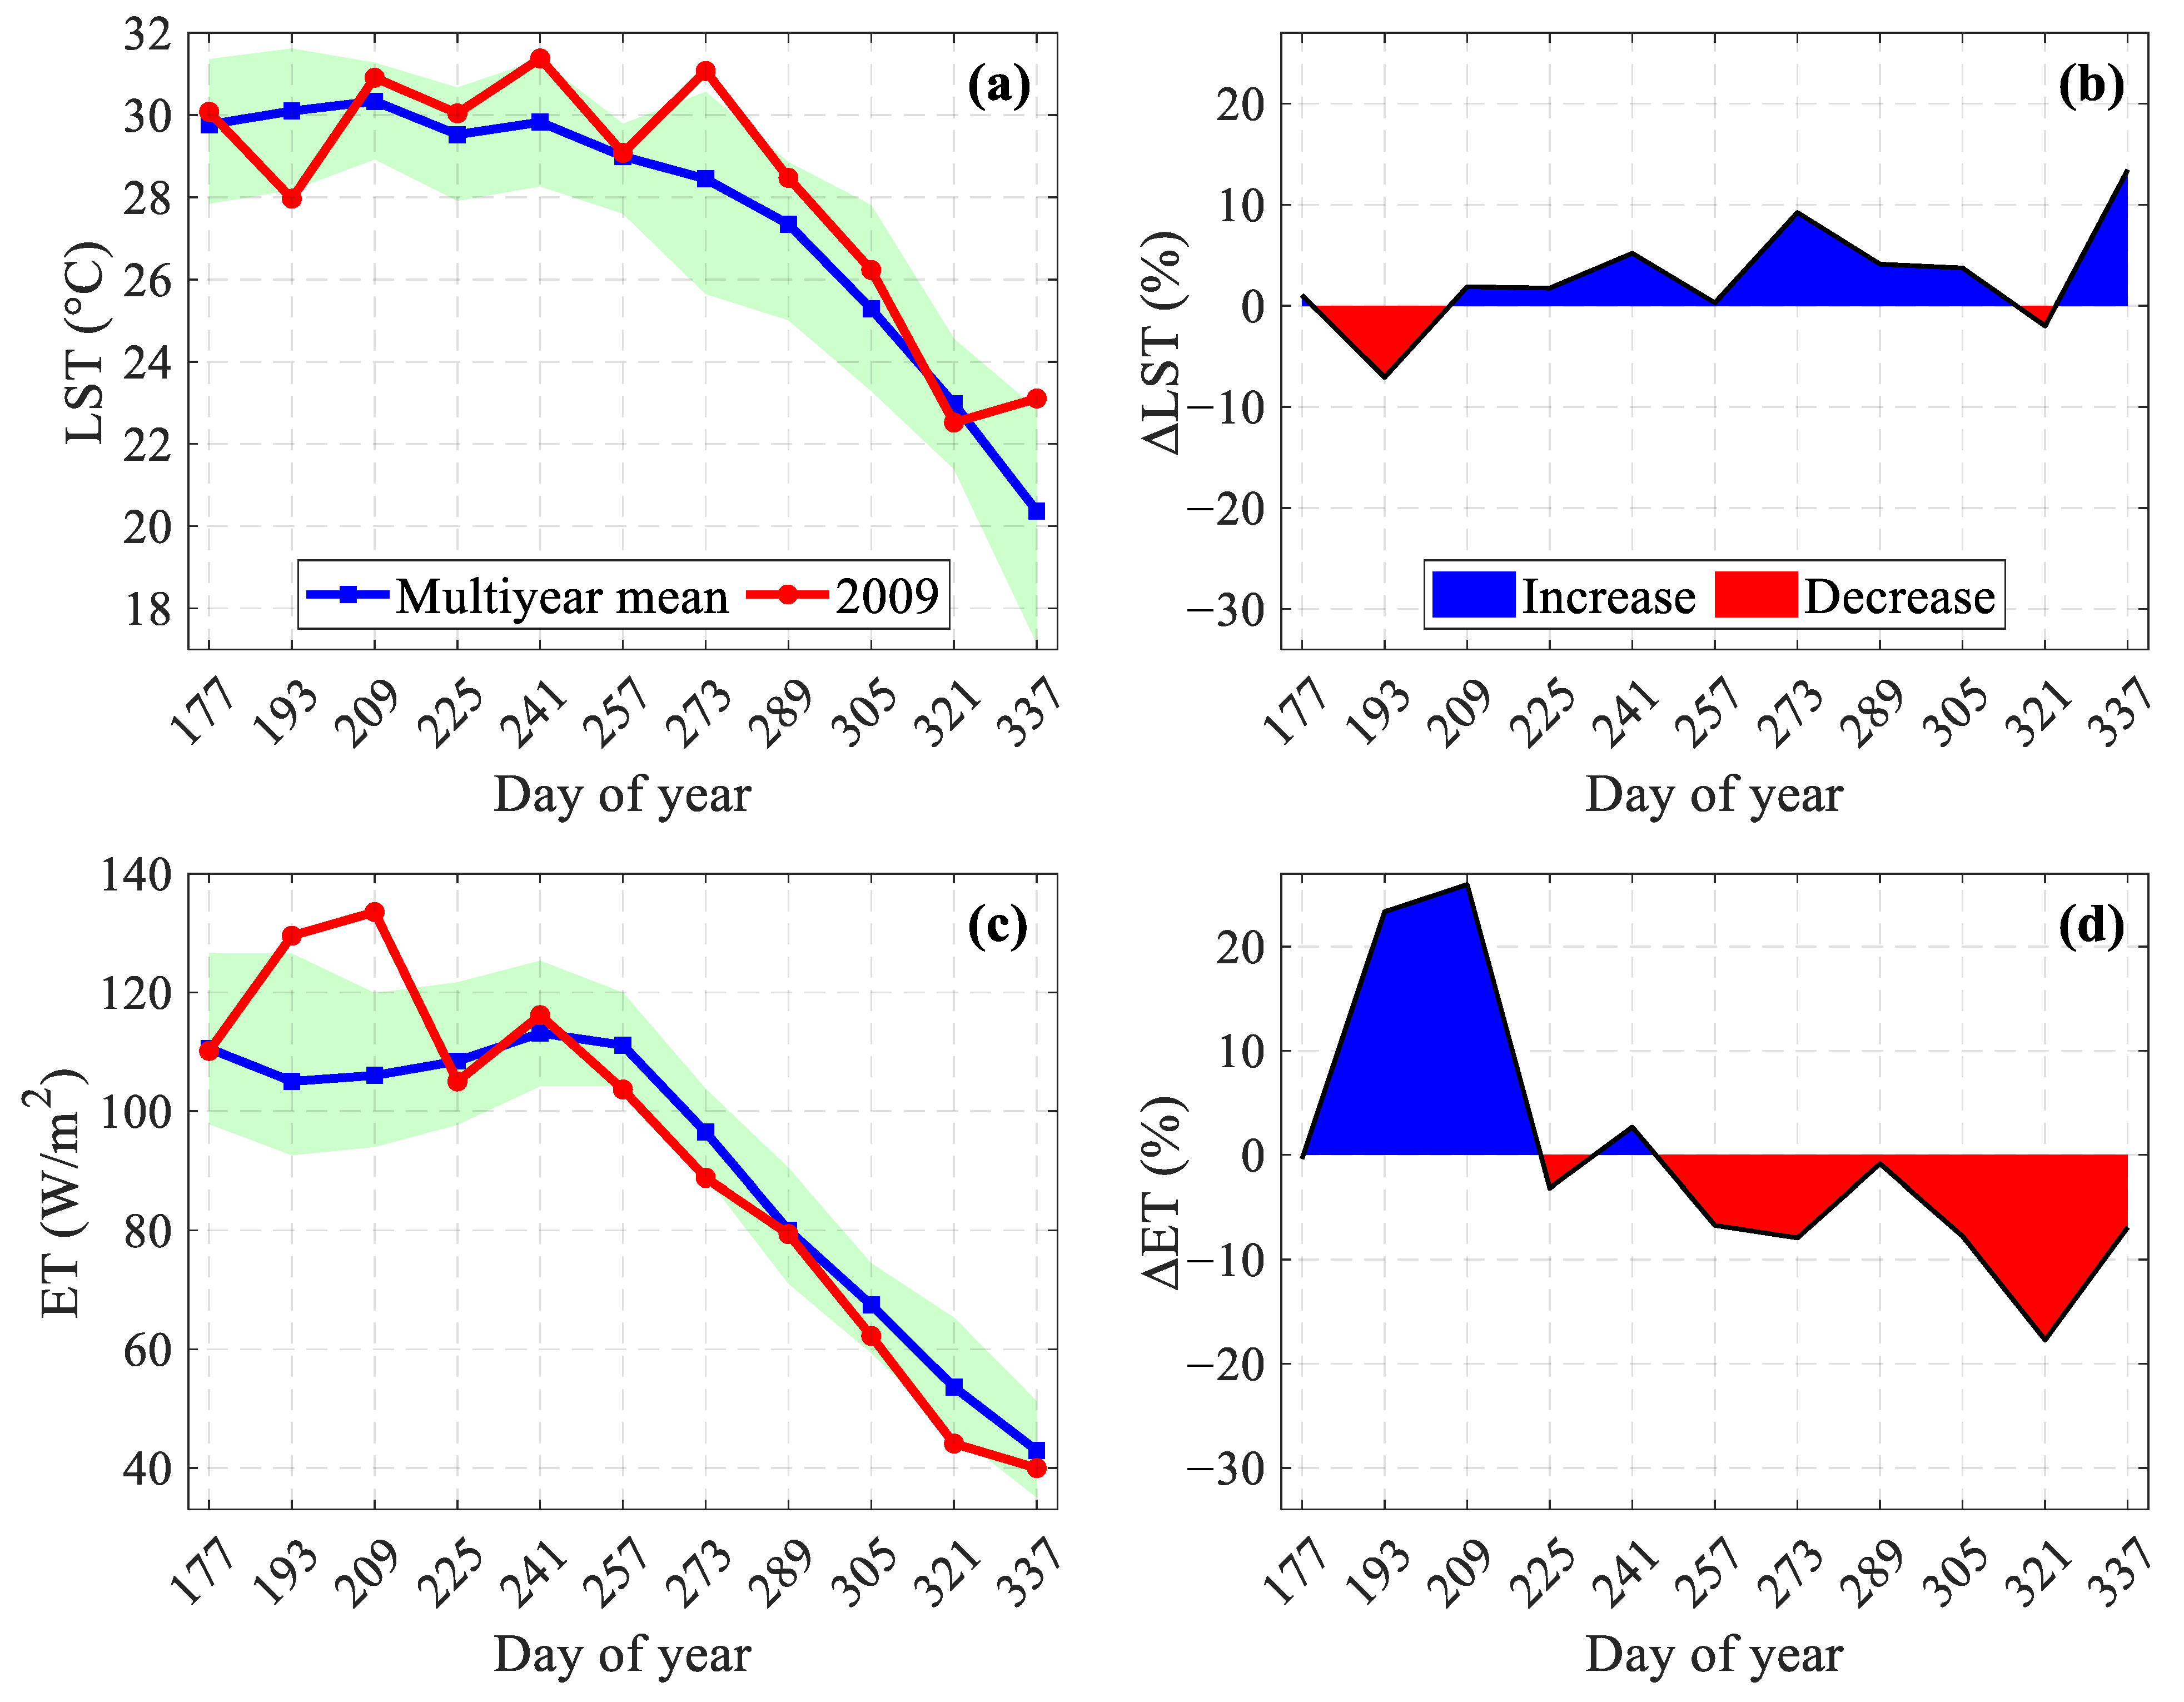
To explore more potential thermal dynamics of the 2009 drought from satellite remote sensing, we analyze seasonal variations in the 16-day mean and multiyear mean and change percent of LST and ET from July to November 2009 over the entire study area (Figure 6). During the 2009 drought, LST started to become higher than the multiyear mean on the day of year (DOY) 209 (which corresponds with the second half of July), which lasted until November. ET showed negative anomalies from the multiyear mean on DOY 257 (which corresponds with the first half of September), and the anomaly magnitudes were approximately −18% to −2% from September to November 2009.
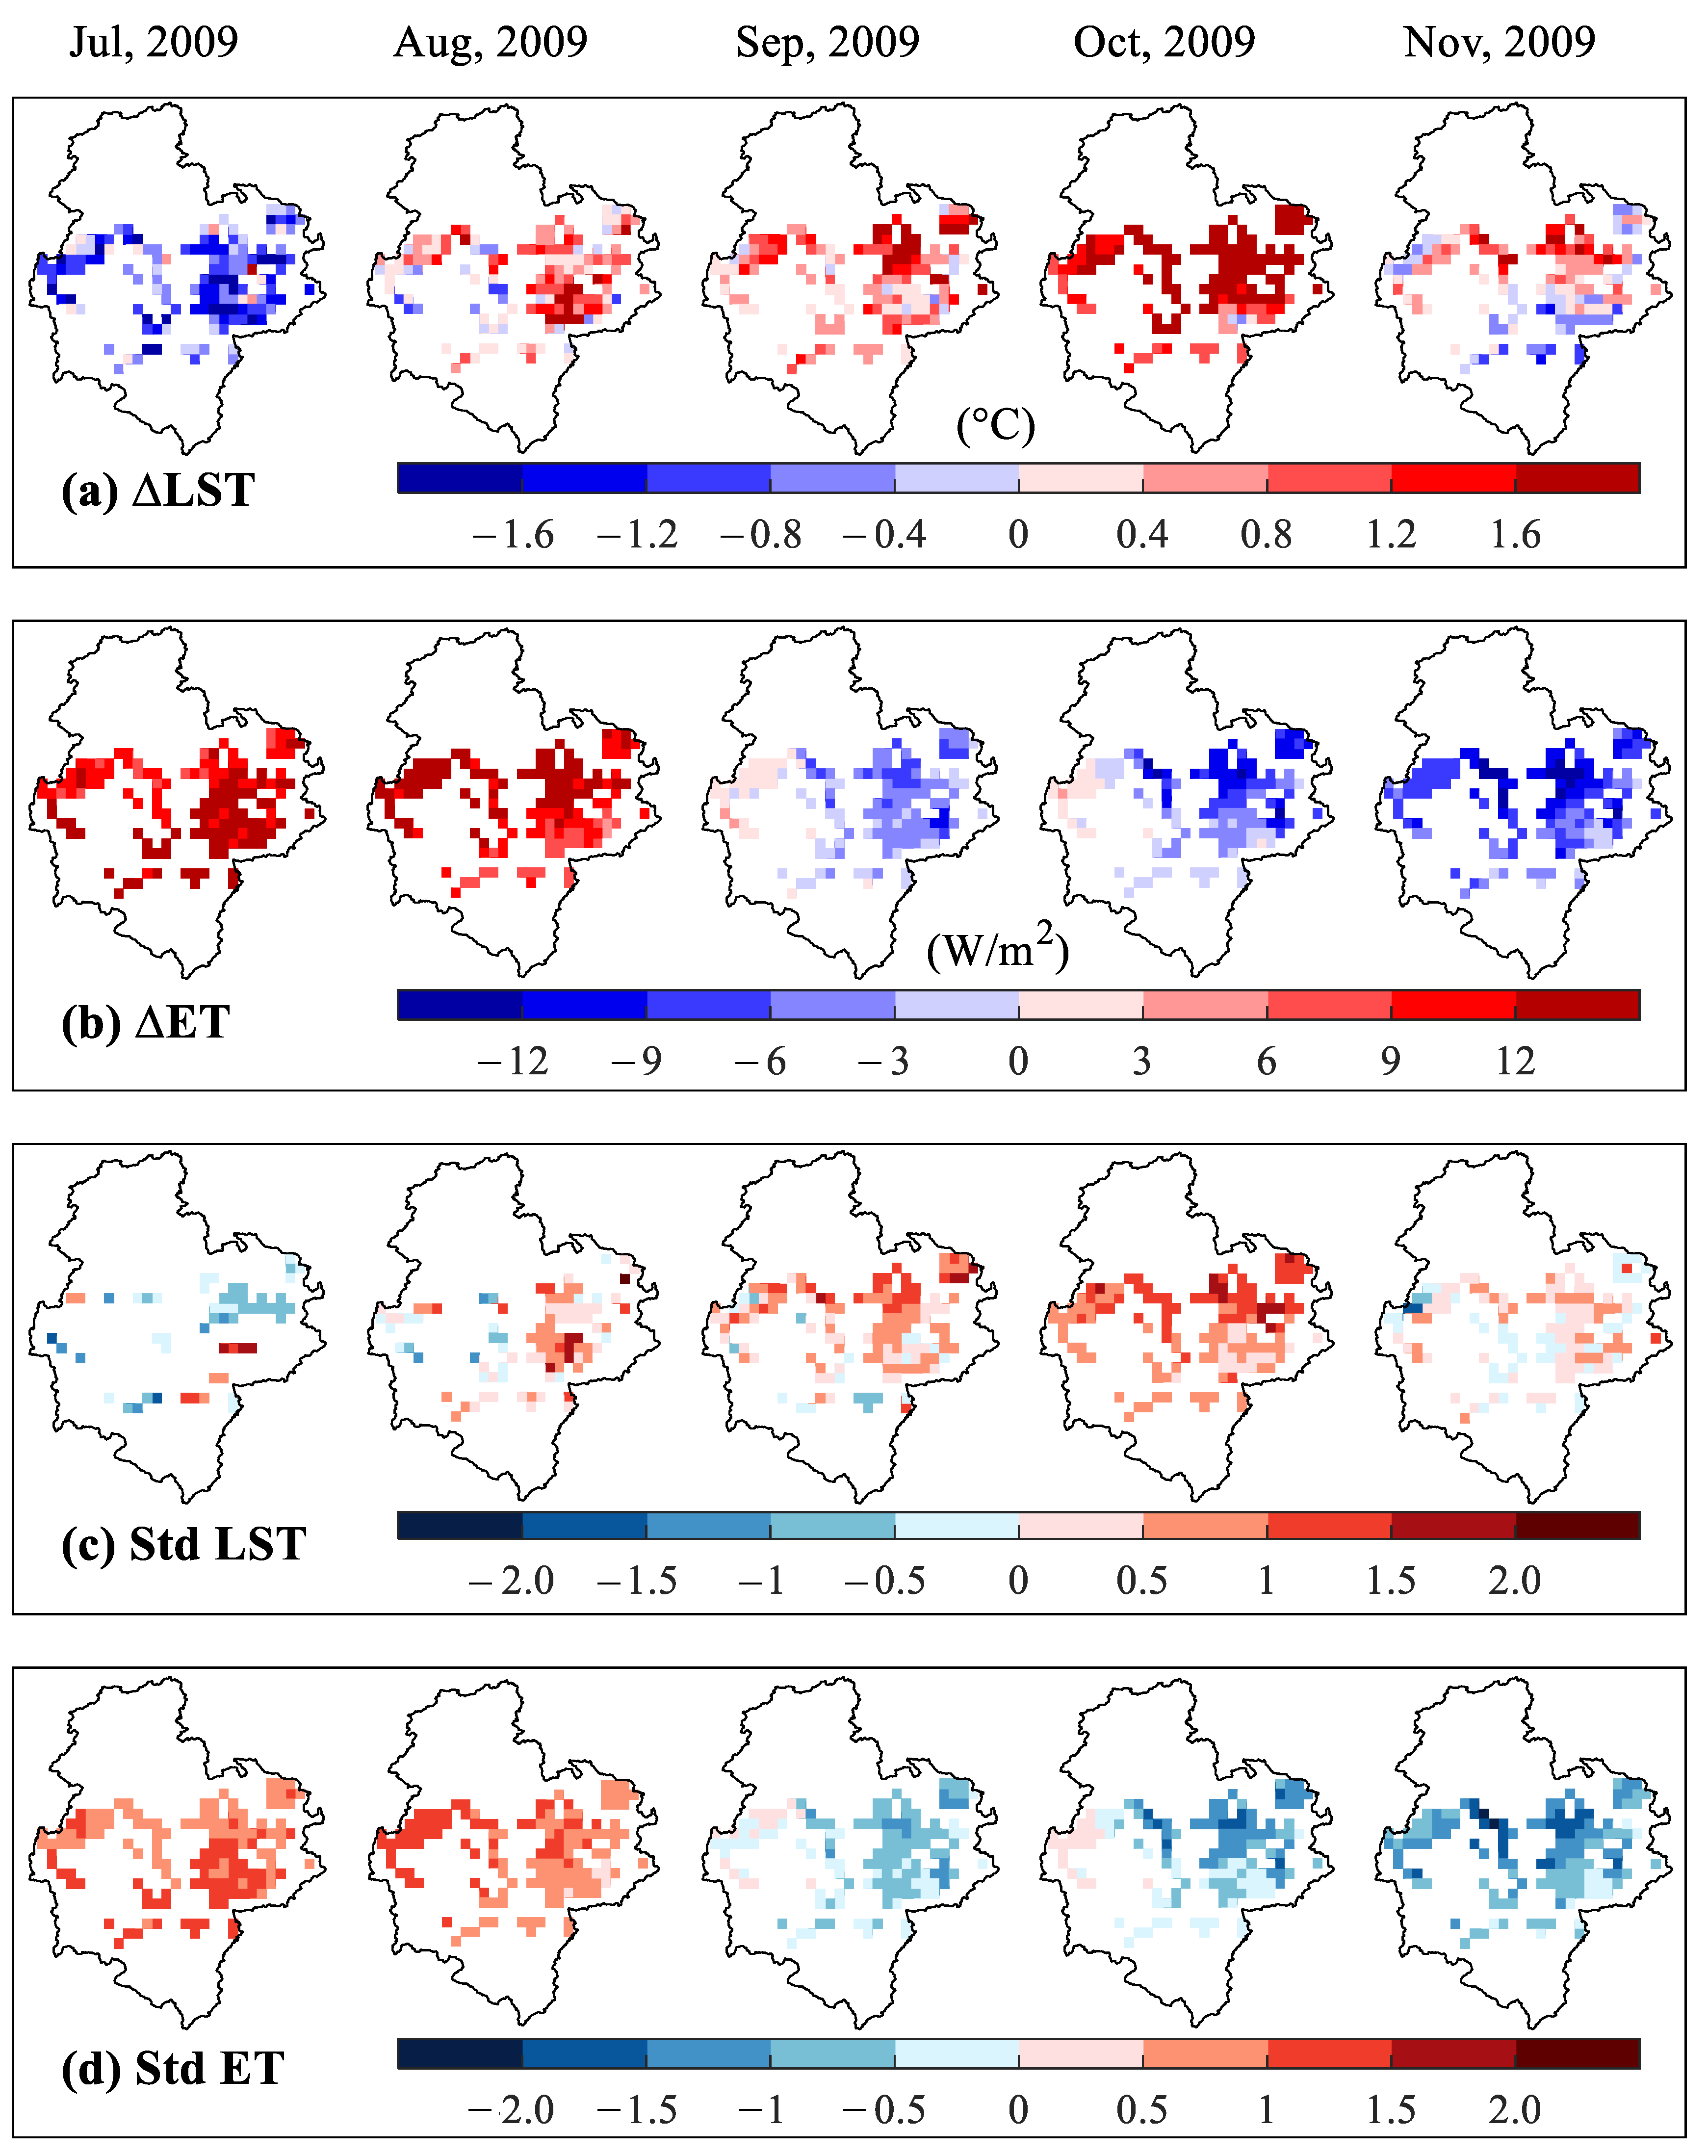
The spatial distributions of monthly LST and ET anomalies from July to November 2009 are also analyzed, and given in Figure 7. LST began to be higher than the multiyear mean in August and was continuous until November 2009 in almost the entire study area. During this period, the LST was much higher than the multiyear mean in most of the central and eastern parts in October. ET started to show slight negative anomalies in most parts in September 2009, and presented moderate-to-severe negative anomalies in most parts from October to November.

3.4. Responses of Sugarcane Greenness and Photosynthesis to the 2009 Drought

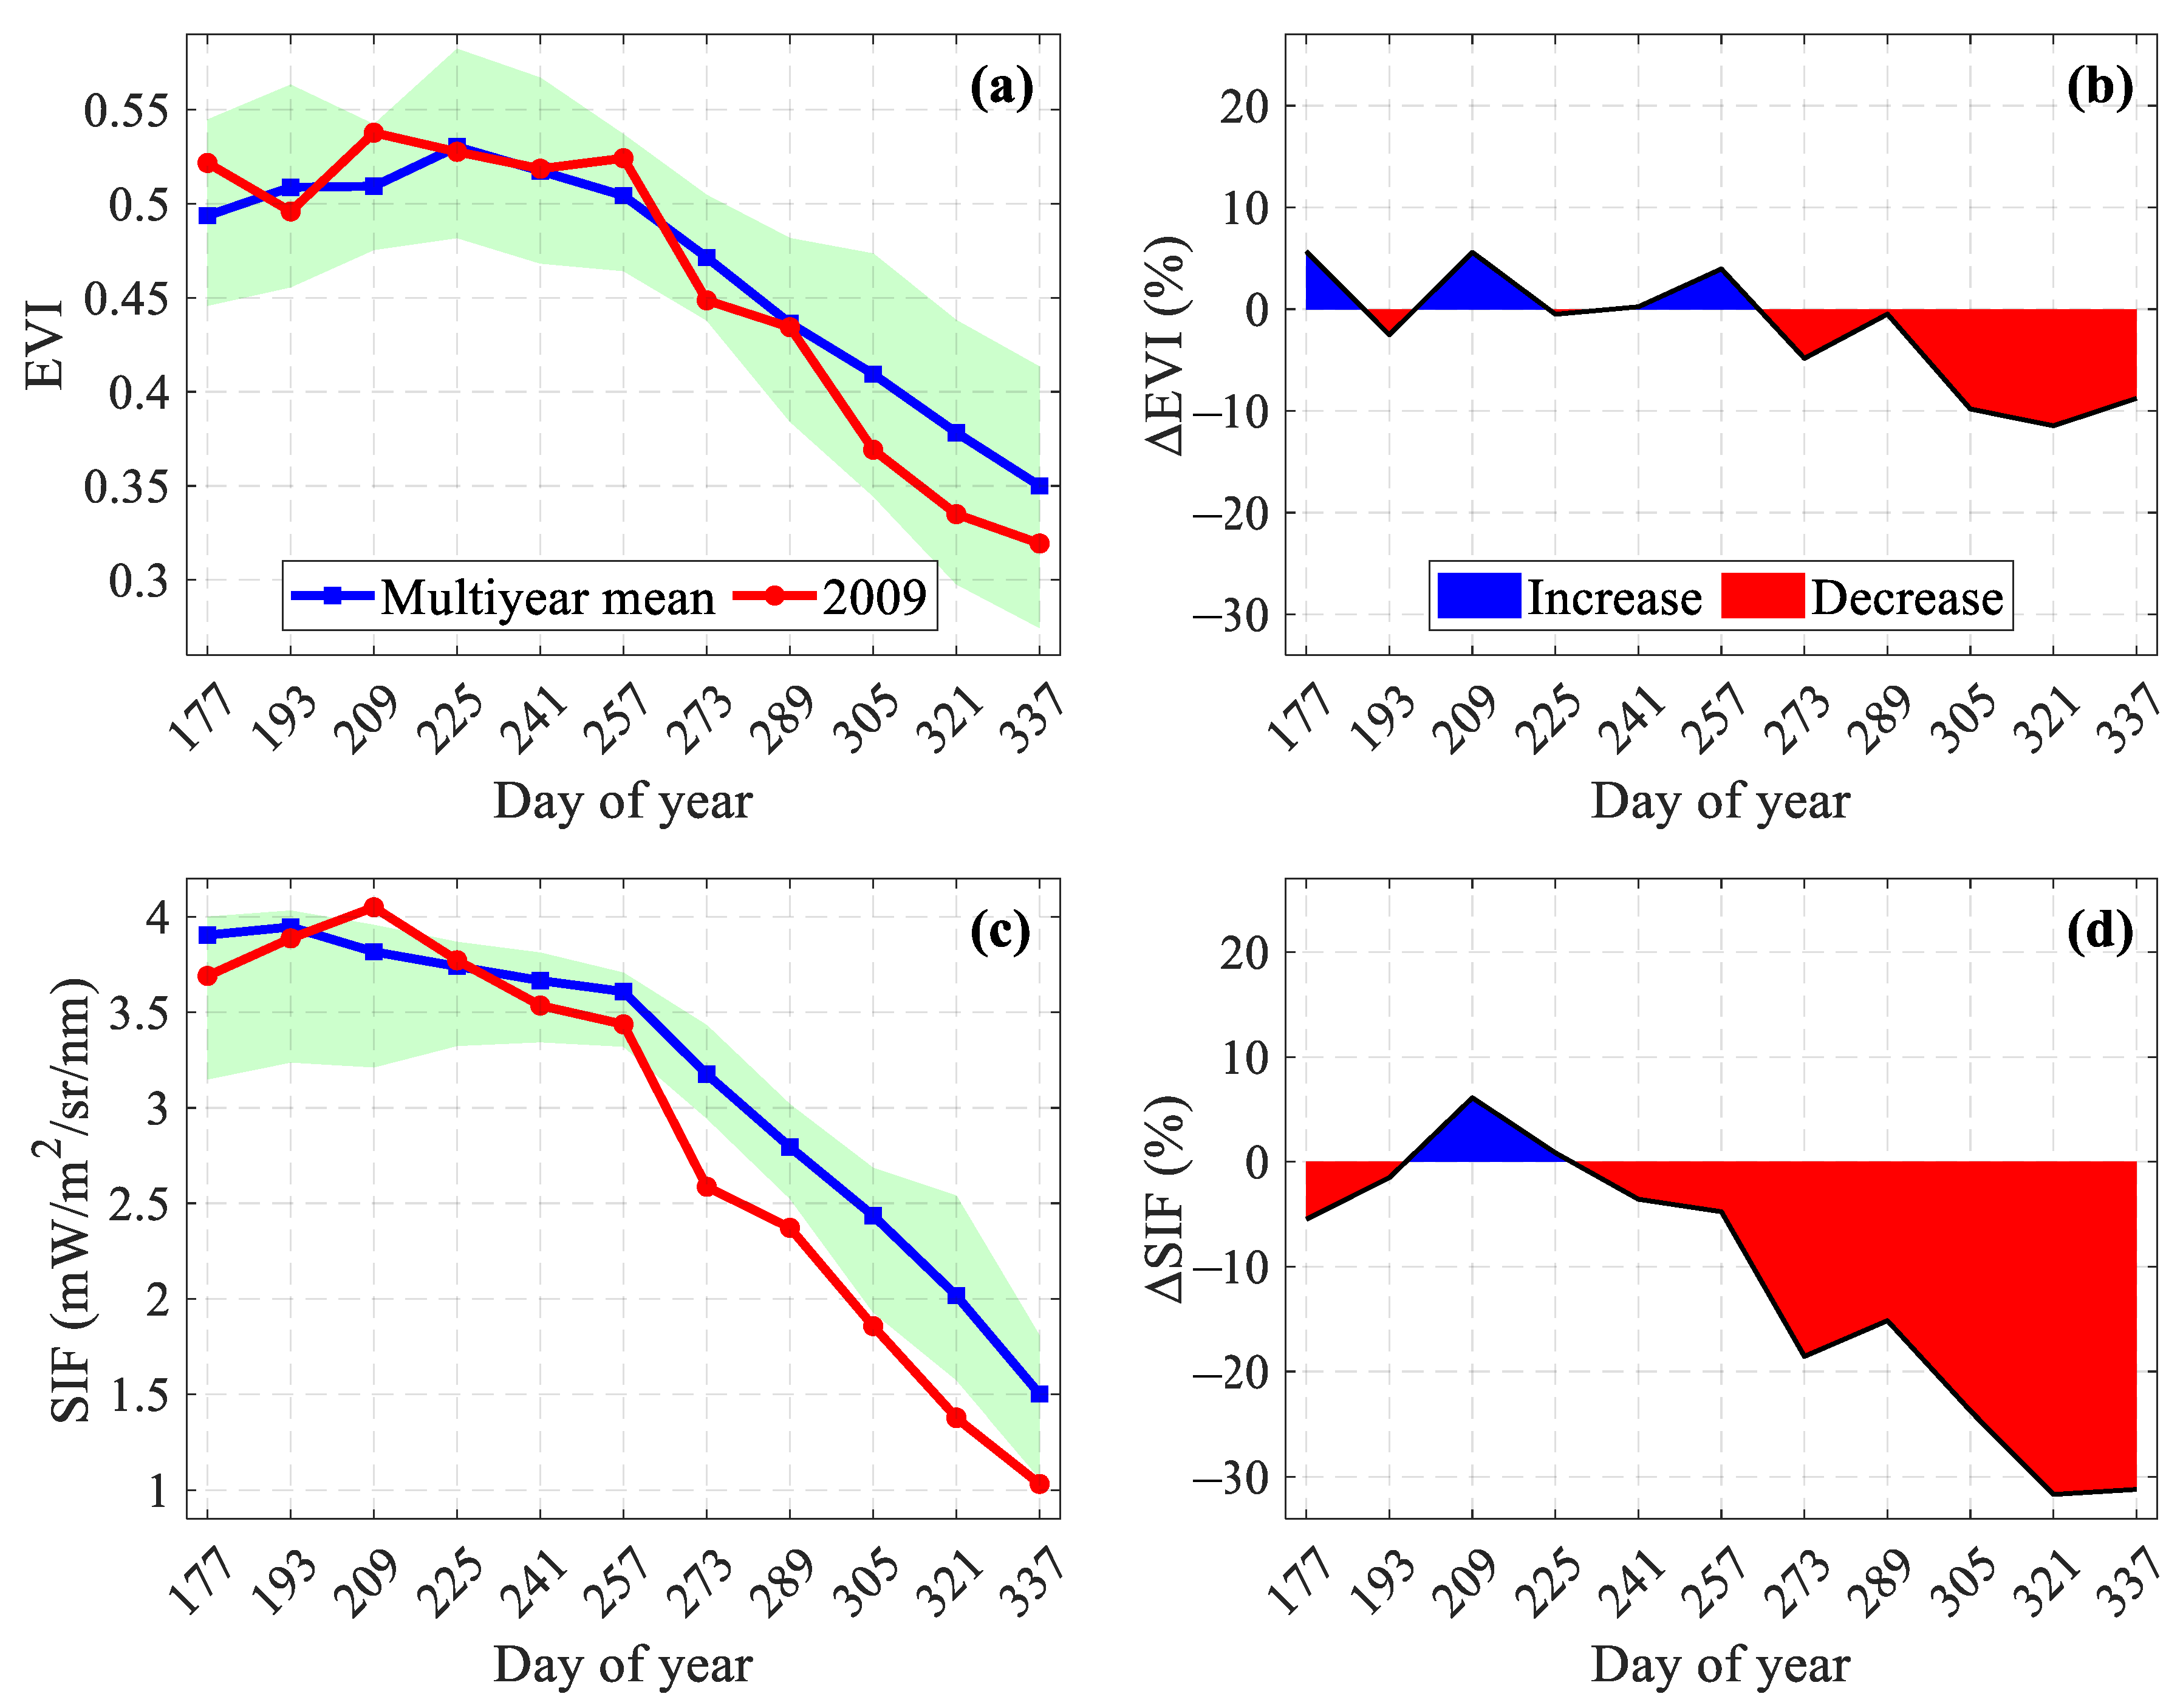
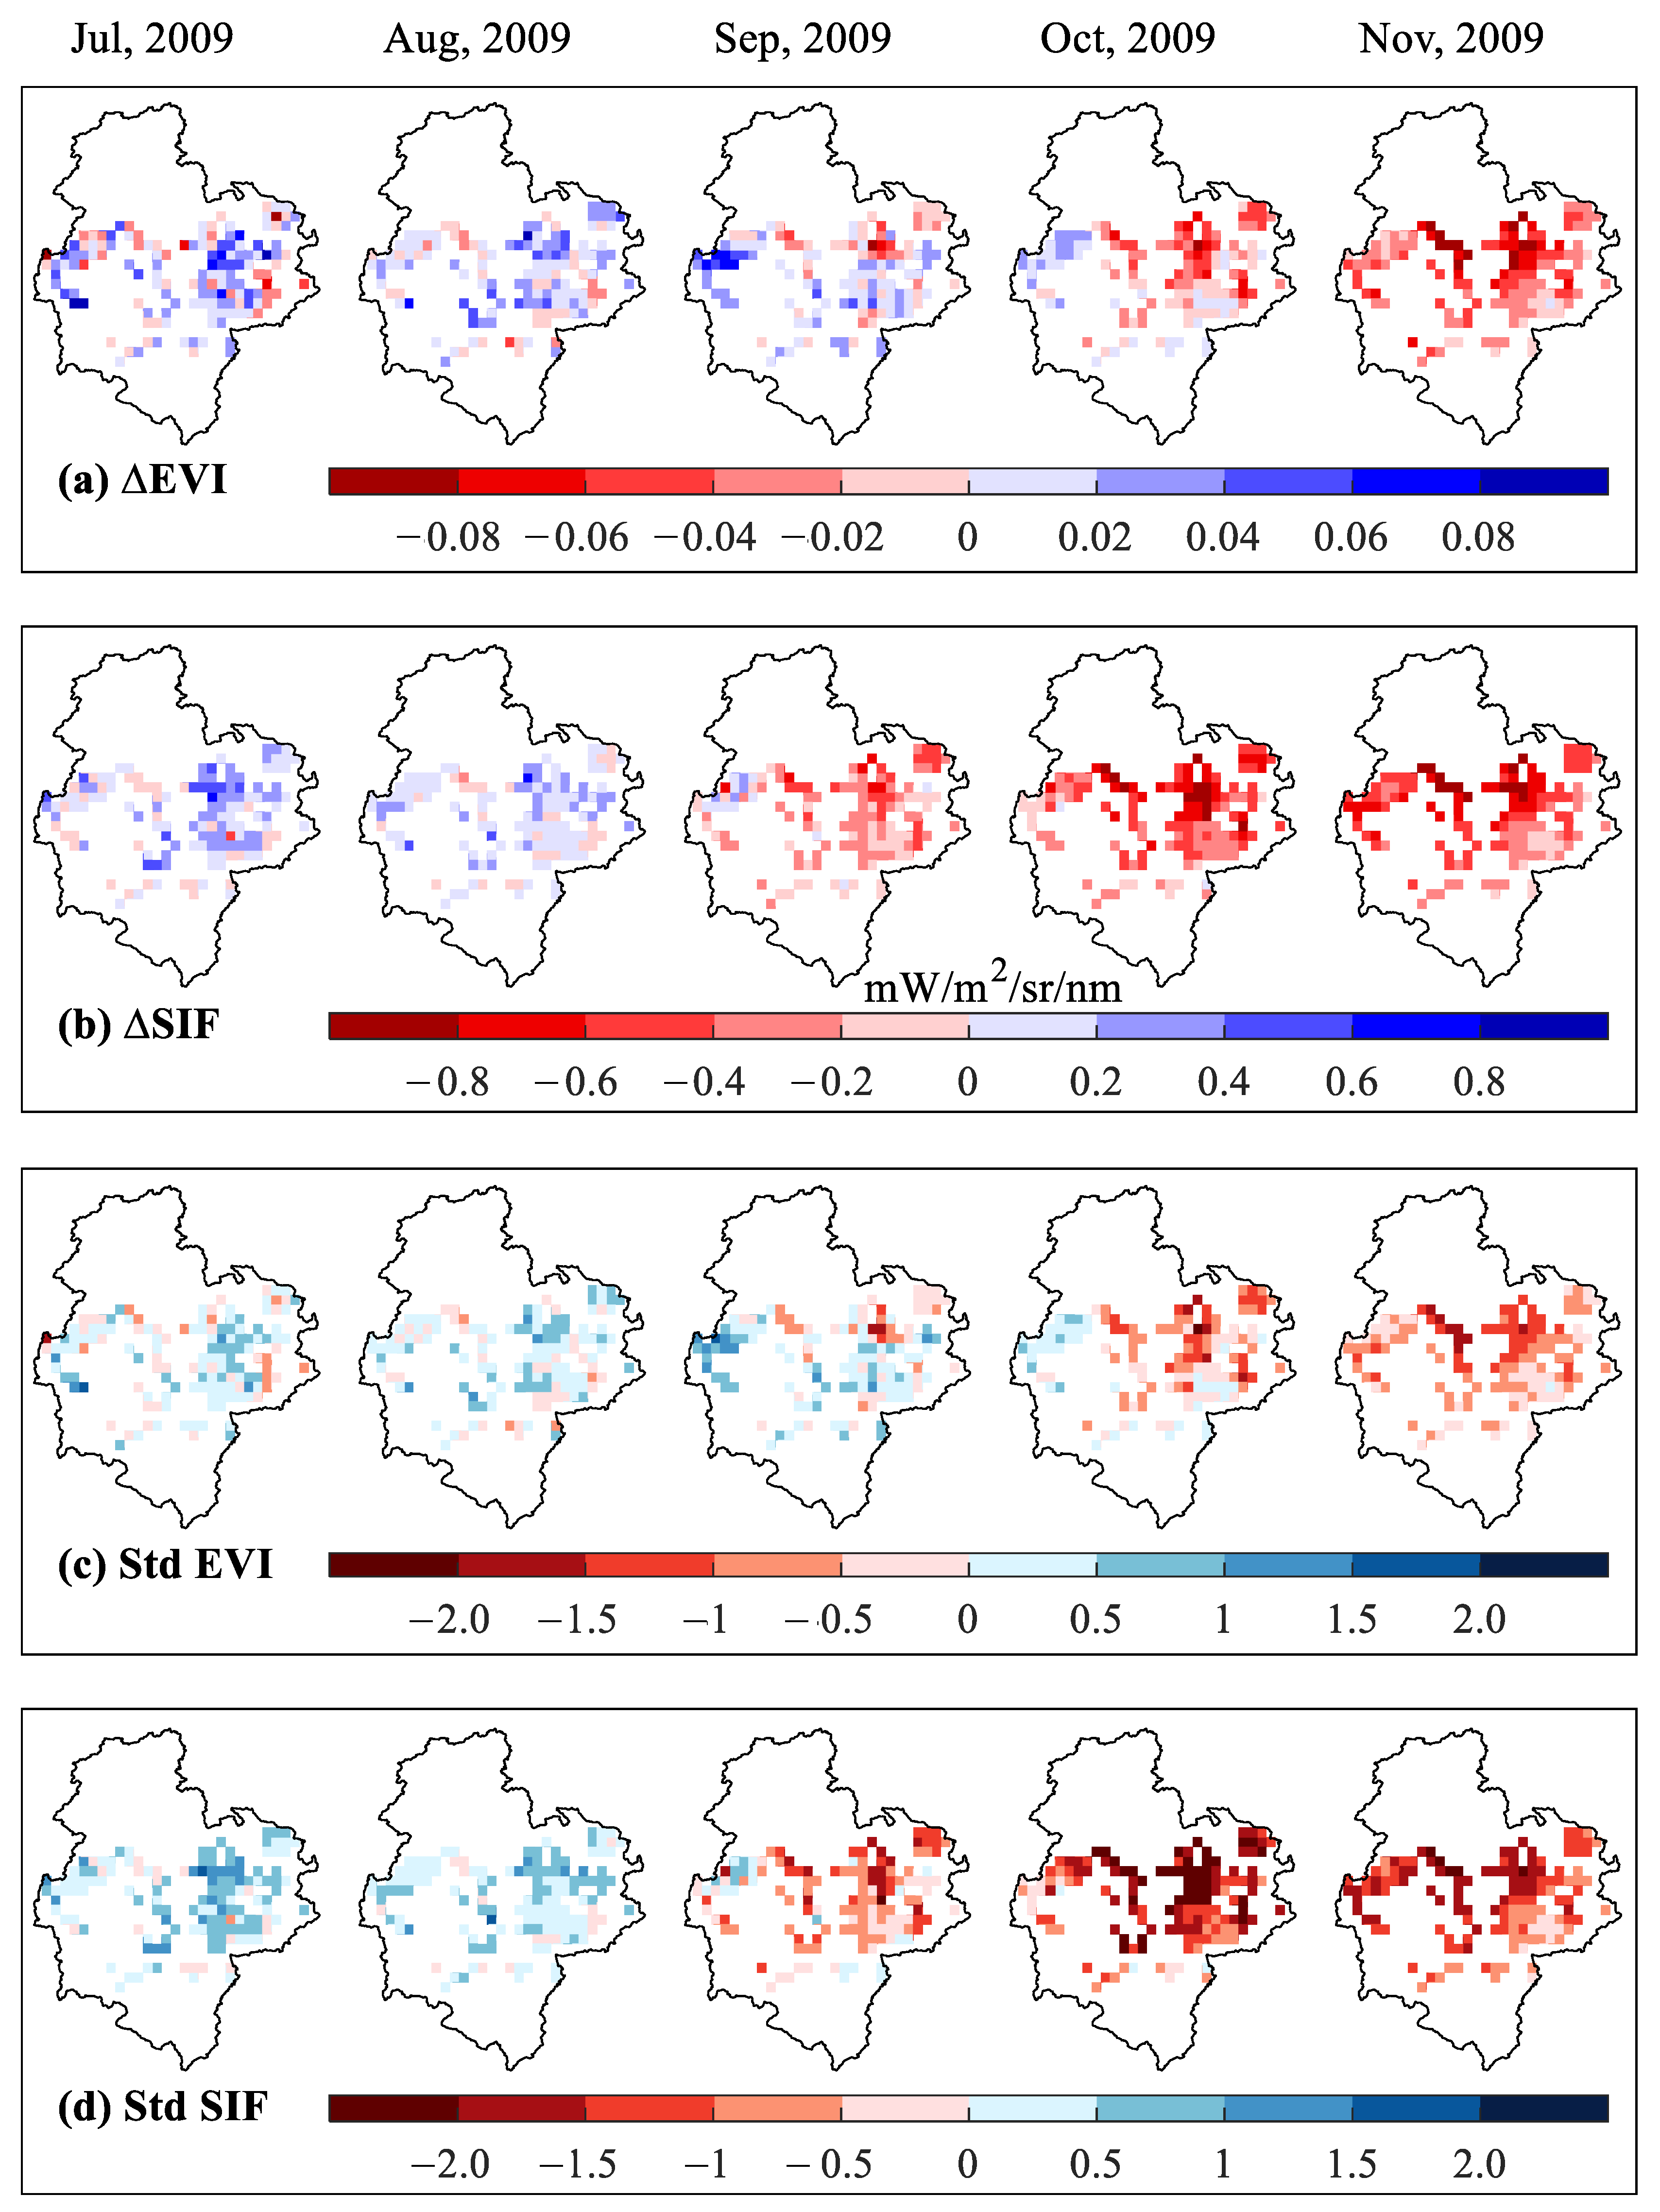
To investigate the different responses of sugarcane greenness and photosynthesis to the 2009 drought event, we compare seasonal variations in the 16-day mean and multiyear mean and change percent of the EVI and SIF from July to November 2009 over the entire study area (Figure 8). During the early stage of the 2009 drought (as shown in Figure 4a), SIF showed a quick negative response with a reduction of approximately 2.5% from the multiyear mean to the drought on DOY 241 (which corresponds with the second half of August). However, the EVI did not show a negative response during this period, and, thus, is not able to capture the early stage of drought stress. When the study area suffered from extreme drought stress in September 2009 (as shown in Figure 4a), the EVI just started to show a negative response to drought on DOY 273 (which corresponds with the second half of September), which was 32 days later than the SIF response. During the same period, SIF declined −19.7% from the multiyear mean, which is much larger than the decreased magnitude of the EVI (−4.8%). Under continuous drought stress, SIF and the EVI decreased significantly compared with the multiyear mean, but the decreased magnitude of SIF was always much larger than that of the EVI until November 2009. These results indicate that SIF can closely capture the temporal dynamics of drought on sugarcane, and is much more sensitive to drought stress than the EVI in terms of both the time and magnitude of response.
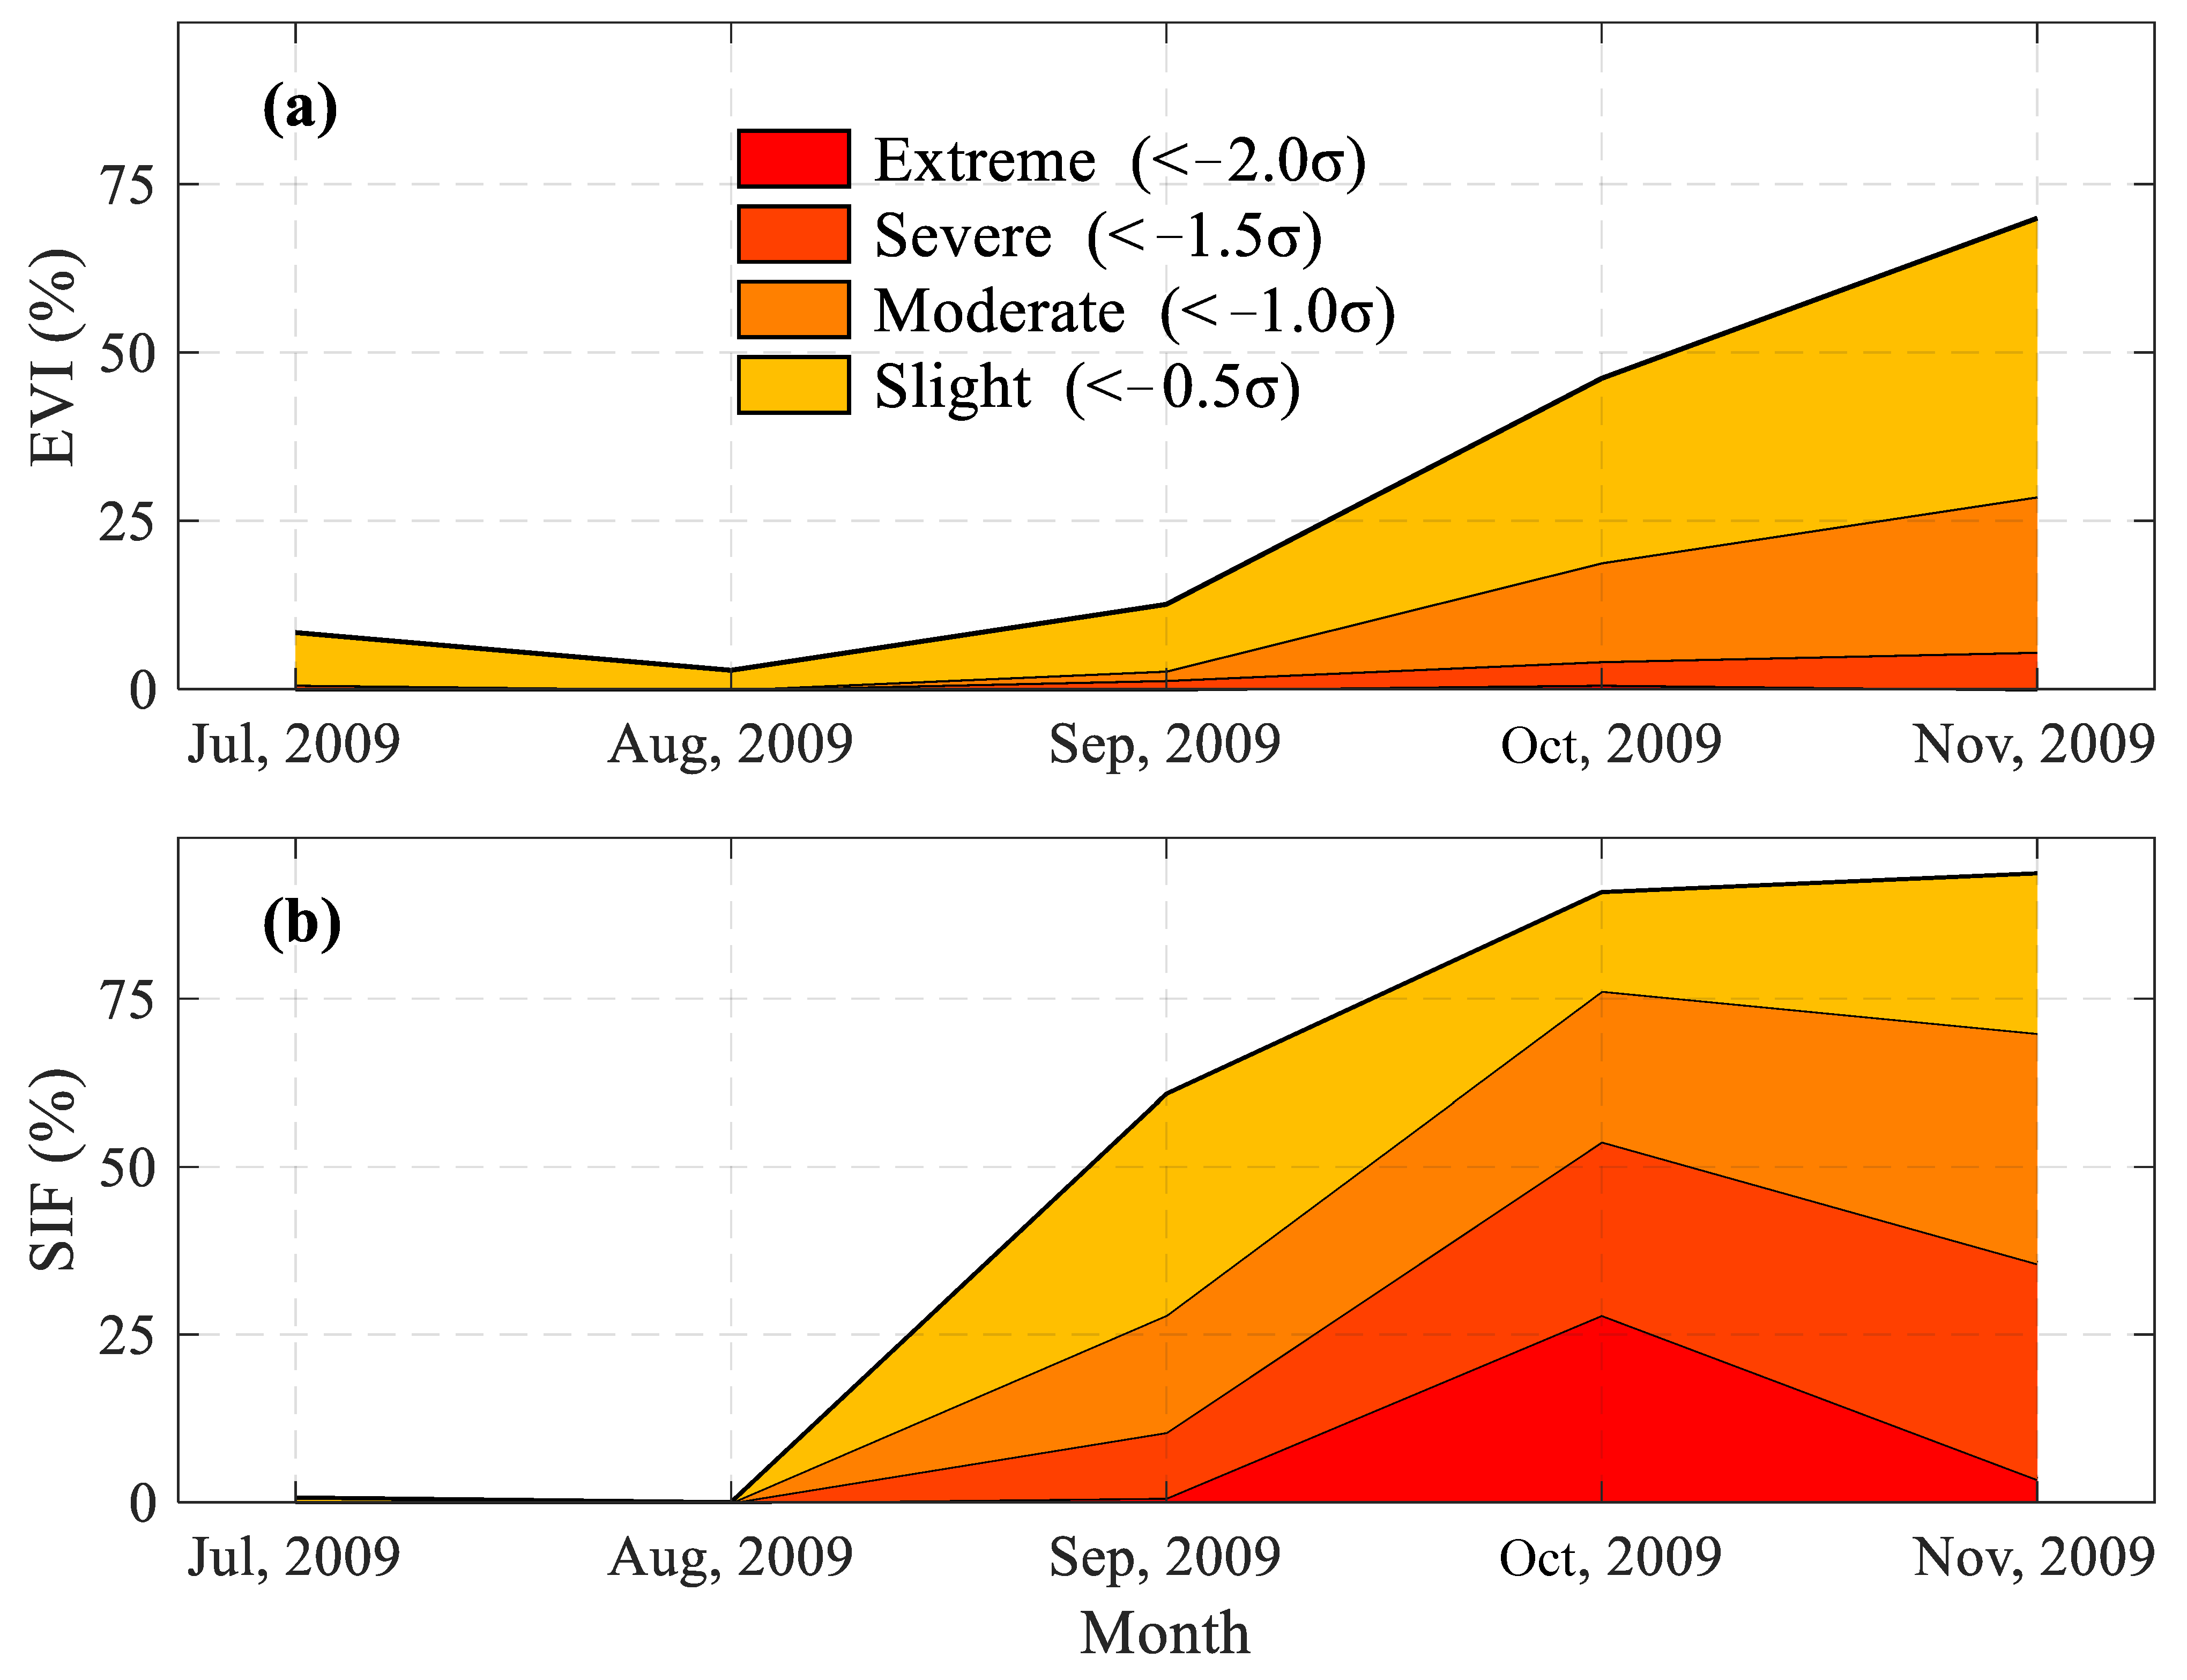
To deeply explore the spatial dynamics of the response of sugarcane greenness and photosynthesis to drought stress, we analyzed the spatial distributions of monthly EVI and SIF anomalies (Figure 9), and the monthly area percentage of drought-induced sugarcane losses indicated by the EVI and SIF (Figure 10) from July to November 2009. In July and August 2009, both the EVI and SIF did not show negative anomalies in a large area. In September, approximately 60.8% of the study area, mainly located in the central and eastern parts, suffered from slight losses indicated by SIF, 17.5% suffered from moderate losses and 9.8% suffered from severe losses. However, only approximately 12.5% of the area, located in the central parts, was affected by slight losses observed by the EVI in September. Then, SIF declined from the multiyear mean in almost the entire study area in October, and the area percentages for slight, moderate, severe, and extreme losses are 90.9%, 76.2%, 53.8%, and 27.9%, respectively. During the same period, approximately 46.1% of the area, mainly located in the central parts, suffered from slight losses indicated by the EVI, but the EVI is not able to capture the extreme losses. Compared with SIF, the EVI still underestimated sugarcane losses in terms of both area and severity in November. During this drought event, the EVI could only capture the sugarcane losses mainly in the central parts, which were the drought center from September to November 2009. In particular, the regions of extreme losses indicated by SIF were located in most parts of the study area during October and November, which coincides with the regions affected by extreme drought stress (as shown in Figure 5a). Overall, SIF can closely capture the spatial and temporal dynamics of drought stress on sugarcane during the 2009 drought.

3.5. Physiological Response of Sugarcane to the 2009 Drought

SIF is closely related to PAR, fPAR and fluorescence yield (as a physiological status), and can provide information about the physiological response to drought stress. We further interpreted SIF with PAR, fPAR, SIFpar, and SIFyield to analyze the possible physiological response of sugarcane to the 2009 drought. Figure 11 presents the seasonal variations in the 16-day mean and multiyear mean PAR and fPAR, SIFpar and SIFyield, and their percent change associated with the multiyear mean from July to November 2009. On DOY 225, SIFyield showed a reduction of 17.0% from the multiyear mean, but SIF did not show a negative response (as shown in Figure 8c) and fPAR remained unchanged. This result indicates that the response time of sugarcane SIFyield to drought stress is earlier than that of sugarcane SIF and fPAR. The magnitude of decreased SIFyield (increased PAR) became larger (smaller), but fPAR remained relatively constant on DOY 241, which ultimately led to an earlier decline in SIF (approximately 2.5%). Moreover, the temporal dynamics of SIFpar anomalies, which contain comprehensive information on fPAR and SIFyield, also only coincided with the temporal dynamics of SIFyield anomalies from DOY 225 to DOY 241. These results indicate that the fluorescence yield of sugarcane showed negative anomalies, but sugarcane fPAR did not show negative anomalies during the early stage of the 2009 drought. Then, both fPAR and SIFyield showed a slight decrease of approximately 3.4% and 1%, respectively, from the multiyear mean, but PAR remained unchanged, resulting in a decrease in SIF (approximately 3.0%) from the multiyear mean on DOY 257. After that, fPAR and SIFyield still presented a decline from the multiyear mean with a continuously increasing magnitude, but the magnitude of SIFyield was much larger than that of fPAR, which caused a reduction in SIF until DOY 337, even when PAR showed positive anomalies.
Spatial variations and the area percentage time series of standardized monthly PAR, fPAR, SIFpar, and SIFyield anomalies from the multiyear mean during July to November 2009 are given in Figure 12 and Figure 13, respectively. As expected, fPAR, SIFpar, and SIFyield did not show slight anomalies in a large area, but PAR showed significant positive anomalies in the entire area, with 63.6% of the area showing moderate anomalies in August 2009. In September, fPAR presented slight negative anomalies in 42.6% of the study area, mainly located in the central parts, and SIFyield showed slight negative anomalies in approximately 74.8% of the study area. The negative anomalies in fPAR and SIFyield ultimately lead to the reduction in SIF in the central and eastern parts (as shown in Figure 9d). In October and November 2009, slight negative anomalies of fPAR were observed in the central parts (42.6% and 67.1%, respectively), and the slight negative anomalies of SIFyield covered most parts (88.8% and 100%, respectively). The anomalies in fPAR and SIFyield together caused the decreasing trend of SIF in almost the entire study area (as shown in Figure 9d). Additionally, the spatial distribution of SIFpar anomalies agreed with the spatial distribution of SIFyield anomalies in August 2009 but was consistent with the spatial distribution of combined fPAR and SIFyield anomalies from September to November 2009. Therefore, our results suggest that drought only negatively affected the fluorescence yield of sugarcane during the early stage of the 2009 drought. Drought had a negative influence on the fPAR and fluorescence yield of sugarcane, but with a larger magnitude on physiological aspects (SIFyield) in both temporal and spatial dynamics, especially during the later stage of the 2009 drought.

4. Discussion

4.1. Application Potential of SIF for Drought Monitoring in Sugarcane

In this study, we find that the correlation coefficient of SIF and sugarcane yield is higher than that of the EVI and sugarcane yield, and SIF satellite observations can better capture the interannual variation in sugarcane GPP than the EVI, demonstrating that SIF is a good proxy for sugarcane production or GPP. These results are consistent with previous findings. For example, Chen, Mo [25] found that SIF-estimated GPP loss during drought was similar to crop yield loss, proving that SIF can be directly used to estimate yield loss induced by drought. SIF is a newly used satellite data source for drought monitoring and assessment of crops [1,48,77].
As indicated by the anomalies of SPEI, precipitation, air temperature, LST, and soil moisture, a severe drought event was detected over the study area during the 2009 sugarcane critical growth period. During the early stage of the 2009 drought, the SIF had a quick negative response on DOY 241, but the EVI did not show a negative response until DOY 273 (Figure 8), and ET did not show negative anomalies until DOY 257 (Figure 6). This may be because photosynthesis has been inhibited and fluorescence emission may decline immediately, but sugarcane canopy structure and chlorophyll content do not change during the early stage of water stress. Moreover, many previous studies proved that there is a lag time of 31 ± 16 days in the response of different vegetation types to water or temperature stress based on VI monitoring [22,25,27,78], which is consistent with our results. We also find that SIF can capture more pronounced responses of sugarcane to drought stress than the EVI. These results may be because chlorophyll fluorescence originates from the photosynthetic machinery, and satellite SIF products are less affected by clouds and the soil background [79]. Thus, SIF can capture the rapid change in sugarcane photosynthetic activities induced by drought stresses with more pronounced signals. Our results prove that satellite SIF has great potential to monitor drought stress on sugarcane in a timely manner at a large spatial scale.

4.2. Possible Mechanisms of Drought on Sugarcane

We also obtain a deeper understanding of the influencing mechanisms of drought on sugarcane by using the spatiotemporal evolutions of fPAR, SIFpar and SIFyield, and find that the responses of sugarcane SIF induced by drought can be attributed to these related factors to a certain extent. During the early stage of the 2009 drought, especially on DOY 241 (which corresponds with the second half of August), both SIFpar and SIFyield experienced anomalous losses compared with the multiyear mean, while fPAR remained relatively constant. We also found that the SIF, SIFpar and SIFyield of sugarcane decreased earlier than the fPAR and EVI. These results indicate that the LUE of sugarcane decreased significantly but the sugarcane remained green in most parts of the study area during the early stage of the 2009 drought. This finding is consistent with previous studies [27,51]. For example, Song, Guanter [27] found that PAR-normalized SIF decreased rapidly compared with VIs during the heat stress stage of winter wheat. In addition, sugarcane is a temperature-loving and light-loving crop, and the increased PAR and unchanged fPAR may have a positive impact on the EVI with a certain lag time on DOY 225 and DOY241; thus, the EVI showed a positive change percent on DOY 257 (Figure 8a,b). These results coincide with the results of previous studies [24,80] and may explain why the sugarcane EVI is not able to capture the early stage of drought stress.
During the later stage of the 2009 drought, fPAR decreased with the largest magnitude along with a slight decreasing trend of the EVI in the central parts in September 2009. The spatial distribution of decreased fPAR is highly consistent with that of the decreased EVI across the entire study region from October to November 2009. The response of fPAR to drought is consistent with greenness but with a certain lag time, and this finding also agrees with the results of previous studies [81,82]. In particular, the larger negative anomalies of SIF, SIFyield, and SIFpar than EVI and fPAR indicate that both the photosynthesis capacities and greenness are negatively influenced by drought stress but with a larger decreased magnitude in photosynthesis capacities. The decreased SIF can be mainly attributed to the reduction in both sugarcane photosynthesis capacities and greenness and finally caused a decrease in sugarcane yield. Therefore, the more pronounced responses of SIF are the results of both physiological and structural variations induced by drought stress.

4.3. Future Research

Satellite SIF data have advantages in drought detection and assessment, but the temporal and spatial resolutions of the continuous SIF data currently available are relatively coarse [43]. Thus, it is difficult to monitor and evaluate large-scale crops of a single species based on the original satellite SIF data directly. The distribution of sugarcane-planted regions is also not contiguous in a large area [63]. Following previous studies [83,84], we tried to use downscaled SIF to detect the response of sugarcane to drought stress in this work. In the next few years, multiple satellite remote sensing sensors can be used for SIF inversion, which will significantly improve the spatial resolution of SIF. For example, the first global mission specifically designed for SIF measurements of terrestrial vegetation, the fluorescence detector (FLEX), is scheduled to launch [85]. Mission concepts all rely on a single payload fluorescence imaging spectrometer with a spectral range from 500 to 780 nm [43,85]. The spectrometer of FLEX has a strip width of 150 km and a spatial resolution of 300 × 300 m [43,85]. In addition, the products of OCO-2, OCO-3, TROPOMI and FLEX will complement each other in spectral resolution, spatial coverage, data acquisition and repetition period [86]. The synergistic use of these products will provide unprecedented opportunities for the real-time monitoring of crop drought, vegetation productivity and the terrestrial carbon cycle.
Many previous studies have suggested that integrated drought indices, which consider multiple aspects of agricultural drought, such as vegetation conditions, soil moisture, LST, and evapotranspiration, outperform the single variable drought index in monitoring capability [87,88]. The integrated drought index based on downscaled satellite SIF and an automated sugarcane drought monitoring system should be developed to monitor sugarcane drought in the future. Furthermore, sugarcane growth status changes relatively rapidly and satellite SIF cannot cover sugarcane-planting areas in time, which makes the actual early response of sugarcane to drought stresses potentially undetectable by satellite SIF. There may be various ground objects, such as sugarcane and corn, in a pixel of the downscaled satellite SIF, which may cause certain errors in the response of sugarcane to drought detected by downscaled satellite SIF. Therefore, ground experiments are needed to detect more details about the response of sugarcane to drought stress in future research.
Many previous studies have used SIF to analyze the effects of different stresses on crops. For example, SIF was used to detect and quantify the effects of iron deficiency on rice seedlings [89], nutrient deficiency on soybean [90], phosphorus deficiency on cucumber [91], Cymbidium ringspot virus on tobacco plants [92], stripe rust on wheat [93], heat stress on winter wheat [27], and cold stress on faba beans [94]. These previous studies mainly quantified the effects of one environmental stress on a specific crop, and suggested that SIF has a great potential for crop stress detection. However, crops are likely to suffer from multiple environmental stresses simultaneously, and thus, further research, especially research based on SIF, is needed to determine which stress is the actual problem for crops.

5. Conclusions

In summary, the high correlations between SIF and sugarcane yield and GPP indicate that SIF can be used as a proxy for sugarcane yield and GPP. The study area experienced an extremely severe drought event, which is detected by the significant negative anomalies of drought indicators such as SPEI and precipitation, from August to November 2009. During this drought event, satellite-observed SIF and SIFyield present earlier and more pronounced responses to drought stresses than the EVI in time and space, indicating that sugarcane SIF is much more sensitive to drought stress than EVI. The spatial patterns of SIF anomalies can closely monitor the spatial evolution of drought stress in the study area. Thus, SIF can closely capture the temporal and spatial dynamics of drought stress on sugarcane. We also found that drought negatively affected the SIFyield of sugarcane during the early stage of drought (late August). During the later stage, especially after late September, drought had a negative influence on the fPAR and fluorescence yield of sugarcane but had a larger magnitude on the fluorescence yield. The more pronounced negative responses of sugarcane SIF can be attributed to both physiological and structural variations induced by drought stress, ultimately reducing sugarcane yield. The results of this study are critical for developing early warning models for sugarcane drought monitoring, and suggest that SIF can provide a new approach to analyze the impact of drought on sugarcane.

Author Contributions

Methodology, N.Y.; Validation, S.D.; Data curation, Y.W.; Writing—original draft, N.Y.; Visualization, H.Q.; Supervision, S.Z. All authors have read and agreed to the published version of the manuscript.

Funding

This work was supported by the National Natural Science Foundations of China (grant no. 42061071), Special Project for Technology Base and Talent of Guangxi (grant no. Guangxi Science AD20297027), Guangxi Natural Science Foundation Program (grant no. 2021GXNSFBA220061), and 2021 annual young teachers basic capacity improvement project of Universities in Guangxi (grant no. 2021KY0397). This work was also supported by Guangxi First-class Discipline Statistics Construction Project Fund.

Conflicts of Interest

The authors declare no conflict of interest.

References

  1. Liu, L.; Yang, X.; Zhou, H.; Liu, S.; Zhou, L.; Li, X.; Yang, J.; Han, X.; Wu, J. Evaluating the utility of solar-induced chlorophyll fluorescence for drought monitoring by comparison with NDVI derived from wheat canopy. Sci. Total Environ. 2018, 625, 1208–1217. [Google Scholar] [CrossRef] [PubMed]
  2. Dai, A. Increasing drought under global warming in observations and models. Nat. Clim. Chang. 2013, 3, 52–58. [Google Scholar] [CrossRef]
  3. Mishra, A.K.; Singh, V.P. A review of drought concepts. J. Hydrol. 2010, 391, 202–216. [Google Scholar] [CrossRef]
  4. Leng, G.; Tang, Q.; Rayburg, S. Climate change impacts on meteorological, agricultural and hydrological droughts in China. Glob. Planet. Chang. 2015, 126, 23–34. [Google Scholar] [CrossRef]
  5. Hao, Z.; Singh, V.P. Drought characterization from a multivariate perspective: A review. J. Hydrol. 2015, 527, 668–678. [Google Scholar] [CrossRef]
  6. Hu, T.; Renzullo, L.J.; van Dijk, A.I.; He, J.; Tian, S.; Xu, Z.; Liu, Q. Monitoring agricultural drought in Australia using MTSAT-2 land surface temperature retrievals. Remote Sens. Environ. 2020, 236, 111419. [Google Scholar]
  7. Wang, J.; Xiao, X.; Liu, L.; Wu, X.; Qin, Y.; Steiner, J.L.; Dong, J. Mapping sugarcane plantation dynamics in Guangxi, China, by time series Sentinel-1, Sentinel-2 and Landsat images. Remote Sens. Environ. 2020, 247, 111951. [Google Scholar] [CrossRef]
  8. Li, Y.-R.; Yang, L.-T. Sugarcane Agriculture and Sugar Industry in China. Sugar Tech. 2014, 17, 1–8. [Google Scholar] [CrossRef]
  9. AghaKouchak, A.; Farahmand, A.; Melton, F.S.; Teixeira, J.; Anderson, M.C.; Wardlow, B.D.; Hain, C.R. Remote sensing of drought: Progress, challenges and opportunities. Rev. Geophys. 2015, 53, 452–480. [Google Scholar] [CrossRef] [Green Version]
  10. Atzberger, C. Advances in Remote Sensing of Agriculture: Context Description, Existing Operational Monitoring Systems and Major Information Needs. Remote Sens. 2013, 5, 949–981. [Google Scholar] [CrossRef] [Green Version]
  11. Heumann, B.W. Satellite remote sensing of mangrove forests: Recent advances and future opportunities. Prog. Phys. Geogr. Earth Environ. 2011, 35, 87–108. [Google Scholar] [CrossRef]
  12. Karthikeyan, L.; Chawla, I.; Mishra, A.K. A review of remote sensing applications in agriculture for food security: Crop growth and yield, irrigation, and crop losses. J. Hydrol. 2020, 586, 124905. [Google Scholar] [CrossRef]
  13. Wang, W.; Wang, W.-J.; Li, J.-S.; Wu, H.; Xu, C.; Liu, T. The Impact of Sustained Drought on Vegetation Ecosystem in Southwest China Based on Remote Sensing. Procedia Environ. Sci. 2010, 2, 1679–1691. [Google Scholar] [CrossRef] [Green Version]
  14. Xu, L.; Samanta, A.; Costa, M.H.; Ganguly, S.; Nemani, R.R.; Myneni, R.B. Widespread decline in greenness of Amazonian vegetation due to the 2010 drought. Geophys. Res. Lett. 2011, 38, L07402. [Google Scholar] [CrossRef] [Green Version]
  15. Ji, L.; Peters, A.J. Assessing vegetation response to drought in the northern Great Plains using vegetation and drought indices. Remote Sens. Environ. 2003, 87, 85–98. [Google Scholar] [CrossRef]
  16. Hou, J.; Du, L.; Liu, K.; Hu, Y.; Zhu, Y. Characteristics of vegetation activity and its responses to climate change in desert/grassland biome transition zones in the last 30 years based on GIMMS3g. Theor. Appl. Clim. 2018, 136, 915–928. [Google Scholar] [CrossRef]
  17. Mänd, P.; Hallik, L.; Peñuelas, J.; Nilson, T.; Duce, P.; Emmett, B.A.; Beier, C.; Estiarte, M.; Garadnai, J.; Kalapos, T.; et al. Responses of the reflectance indices PRI and NDVI to experimental warming and drought in European shrublands along a north–south climatic gradient. Remote Sens. Environ. 2010, 114, 626–636. [Google Scholar] [CrossRef]
  18. Lloret, F.; Lobo, A.; Estevan, H.; Maisongrande, P.; Vayreda, J.; Terradas, J. Woody plant richness and NDVI re-sponse to drought events in Catalonian (northeastern Spain) forests. Ecology 2007, 88, 2270–2279. [Google Scholar] [CrossRef]
  19. Grace, J.; Nichol, C.; Disney, M.; Lewis, P.; Quaife, T.; Bowyer, P. Can we measure terrestrial photosynthesis from space directly, using spectral reflectance and fluorescence? Glob. Chang. Biol. 2007, 13, 1484–1497. [Google Scholar] [CrossRef]
  20. Rossini, M.; Nedbal, L.; Guanter, L.; Ač, A.; Alonso, L.; Burkart, A.; Cogliati, S.; Colombo, R.; Damm, A.; Drusch, M.; et al. Red and far red Sun-induced chlorophyll fluorescence as a measure of plant photosynthesis. Geophys. Res. Lett. 2015, 42, 1632–1639. [Google Scholar] [CrossRef] [Green Version]
  21. Damm, A.; Guanter, L.; Paul-Limoges, E.; van der Tol, C.; Hueni, A.; Buchmann, N.; Eugster, W.; Ammann, C.; Schaepman, M.E. Far-red sun-induced chlorophyll fluorescence shows ecosystem-specific relationships to gross primary produc-tion: An assessment based on observational and modeling approaches. Remote Sens. Environ. 2015, 166, 91–105. [Google Scholar] [CrossRef]
  22. Sun, Y.; Fu, R.; Dickinson, R.; Joiner, J.; Frankenberg, C.; Gu, L.; Xia, Y.; Fernando, N. Drought onset mechanisms revealed by satellite solar-induced chlorophyll fluorescence: Insights from two contrasting extreme events. J. Geophys. Res. Biogeosci. 2015, 120, 2427–2440. [Google Scholar] [CrossRef] [Green Version]
  23. DI, L.; Rundquist, D.C.; Han, L. Modelling relationships between NDVI and precipitation during vegetative growth cycles. Int. J. Remote Sens. 1994, 15, 2121–2136. [Google Scholar] [CrossRef]
  24. Lee, J.-E.; Berry, J.A.; van der Tol, C.; Yang, X.; Guanter, L.; Damm, A.; Baker, I.; Frankenberg, C. Simulations of chlorophyll fluorescence incorporated into the Community Land Model version 4. Glob. Chang. Biol. 2015, 21, 3469–3477. [Google Scholar] [CrossRef] [PubMed] [Green Version]
  25. Chen, X.J.; Mo, X.G.; Zhang, Y.C.; Sun, Z.G.; Liu, Y.; Hu, S.; Liu, S.X. Drought detection and assessment with so-lar-induced chlorophyll fluorescence in summer maize growth period over North China Plain. Ecol. Indic. 2019, 104, 347–356. [Google Scholar]
  26. Guanter, L.; Zhang, Y.; Jung, M.; Joiner, J.; Voigt, M.; Berry, J.A.; Frankenberg, C.; Huete, A.R.; Zarco-Tejada, P.; Lee, J.-E.; et al. Global and time-resolved monitoring of crop photosynthesis with chlorophyll fluorescence. Proc. Natl. Acad. Sci. USA 2014, 111, E1327–E1333. [Google Scholar] [CrossRef]
  27. Song, L.; Guanter, L.; Guan, K.; You, L.; Huete, A.; Ju, W.; Zhang, Y. Satellite sun-induced chlorophyll fluorescence detects early response of winter wheat to heat stress in the Indian Indo-Gangetic Plains. Glob. Chang. Biol. 2018, 24, 4023–4037. [Google Scholar] [CrossRef] [Green Version]
  28. Porcar-Castell, A.; Tyystjärvi, E.; Atherton, J.; van der Tol, C.; Flexas, J.; Pfündel, E.E.; Moreno, J.; Frankenberg, C.; Berry, J.A. Linking chlorophyll a fluorescence to photosynthesis for remote sensing applications: Mechanisms and challenges. J. Exp. Bot. 2014, 65, 4065–4095. [Google Scholar] [CrossRef]
  29. Guan, K.; Berry, J.A.; Zhang, Y.; Joiner, J.; Guanter, L.; Badgley, G.; Lobell, D.B. Improving the monitoring of crop productivity using spaceborne solar-induced fluorescence. Glob. Chang. Biol. 2015, 22, 716–726. [Google Scholar] [CrossRef]
  30. Genty, B.; Briantais, J.M.; Baker, N.R. The relationship between the quantum yield of photo-synthetic electron-transport and quenching of chlorophyll fluorescence. Biochim. Bio-Phys. Acta 1989, 990, 87–92. [Google Scholar] [CrossRef]
  31. Mathobo, R.; Marais, D.; Steyn, J.M. The effect of drought stress on yield, leaf gaseous exchange and chlorophyll fluorescence of dry beans (Phaseolus vulgaris L.). Agric. Water Manag. 2017, 180, 118–125. [Google Scholar] [CrossRef] [Green Version]
  32. Zarco-Tejada, P.; Catalina, A.; González, M.; Martín, P. Relationships between net photosynthesis and steady-state chlorophyll fluorescence retrieved from airborne hyperspectral imagery. Remote Sens. Environ. 2013, 136, 247–258. [Google Scholar] [CrossRef] [Green Version]
  33. Verma, M.; Schimel, D.; Evans, B.; Frankenberg, C.; Beringer, J.; Drewry, D.T.; Magney, T.; Marang, I.; Hutley, L.; Moore, C.; et al. Effect of environmental conditions on the relationship between solar-induced fluorescence and gross primary productivity at an OzFlux grassland site. J. Geophys. Res. Biogeosci. 2017, 122, 716–733. [Google Scholar] [CrossRef] [Green Version]
  34. Joiner, J.; Yoshida, Y.; Vasilkov, A.P.; Middleton, E.M.; Campbell, P.K.E.; Kuze, A.; Corp, L.A. Filling-in of near-infrared solar lines by terrestrial fluorescence and other geophysical effects: Simulations and space-based observations from SCIAMACHY and GOSAT. Atmos. Meas. Tech. 2012, 5, 809–829. [Google Scholar] [CrossRef] [Green Version]
  35. Joiner, J.; Yoshida, Y.; Guanter, L.; Middleton, E.M. New methods for the retrieval of chlorophyll red fluorescence from hyperspectral satellite instruments: Simulations and application to GOME-2 and SCIAMACHY. Atmos. Meas. Tech. 2016, 9, 3939–3967. [Google Scholar] [CrossRef] [Green Version]
  36. Joiner, J.; Guanter, L.; Lindstrot, R.; Voigt, M.; Vasilkov, A.P.; Middleton, E.M.; Huemmrich, K.F.; Yoshida, Y.; Frankenberg, C. Global monitoring of terrestrial chlorophyll fluorescence from moderate-spectral-resolution near-infrared sat-ellite measurements: Methodology, simulations, and application to GOME-2. Atmos. Meas. Tech. 2013, 6, 2803–2823. [Google Scholar]
  37. Köhler, P.; Guanter, L.; Joiner, J. A linear method for the retrieval of sun-induced chlorophyll fluorescence from GOME-2 and SCIAMACHY data. Atmos. Meas. Tech. 2015, 8, 2589–2608. [Google Scholar] [CrossRef] [Green Version]
  38. Frankenberg, C.; Fisher, J.B.; Worden, J.; Badgley, G.; Saatchi, S.S.; Lee, J.-E.; Toon, G.C.; Butz, A.; Jung, M.; Kuze, A.; et al. New global observations of the terrestrial carbon cycle from GOSAT: Patterns of plant fluorescence with gross primary productivity. Geophys. Res. Lett. 2011, 38. [Google Scholar] [CrossRef] [Green Version]
  39. Kohler, P.; Guanter, L.; Frankenberg, C. Simplified Physically Based Retrieval of Sun-Induced Chlorophyll Fluo-rescence From GOSAT Data. IEEE Geosci. Remote Sens. Lett. 2015, 12, 1446–1450. [Google Scholar]
  40. Guanter, L.; Frankenberg, C.; Dudhia, A.; Lewis, P.E.; Gómez-Dans, J.; Kuze, A.; Suto, H.; Grainger, R.G. Retrieval and global assessment of terrestrial chlorophyll fluorescence from GOSAT space measurements. Remote Sens. Environ. 2012, 121, 236–251. [Google Scholar] [CrossRef]
  41. Frankenberg, C.; O’Dell, C.; Berry, J.; Guanter, L.; Joiner, J.; Kohler, P.; Pollock, R.; Taylor, T.E. Prospects for chlo-rophyll fluorescence remote sensing from the Orbiting Carbon Observatory-2. Remote Sens. Environ. 2014, 147, 1–12. [Google Scholar] [CrossRef] [Green Version]
  42. Sun, Y.; Frankenberg, C.; Wood, J.D.; Schimel, D.S.; Jung, M.; Guanter, L.; Drewry, D.T.; Verma, M.; Porcar-Castell, A.; Griffis, T.J.; et al. OCO-2 advances photosynthesis observation from space via solar-induced chlorophyll fluorescence. Science 2017, 358, eaam5747. [Google Scholar] [CrossRef] [Green Version]
  43. Mohammed, G.H.; Colombo, R.; Middleton, E.M.; Rascher, U.; van der Tol, C.; Nedbal, L.; Goulas, Y.; Pérez-Priego, O.; Damm, A.; Meroni, M.; et al. Remote sensing of solar-induced chlorophyll fluorescence (SIF) in vegetation: 50 years of progress. Remote Sens. Environ. 2019, 231, 111177. [Google Scholar] [CrossRef] [PubMed]
  44. Guanter, L.; Aben, I.; Tol, P.; Krijger, J.M.; Hollstein, A.; Köhler, P.; Damm, A.; Joiner, J.; Frankenberg, C.; Landgraf, J. Potential of the TROPOspheric Monitoring Instrument (TROPOMI) onboard the Sentinel-5 Precursor for the monitoring of terrestrial chlorophyll fluorescence. Atmos. Meas. Tech. 2015, 8, 1337–1352. [Google Scholar] [CrossRef] [Green Version]
  45. Köehler, P.; Frankenberg, C.; Magney, T.S.; Guanter, L.; Joiner, J.; Landgraf, J. Global Retrievals of Solar-Induced Chlorophyll Fluorescence With TROPOMI: First Results and Intersensor Comparison to OCO-2. Geophys. Res. Lett. 2018, 45, 10456–10463. [Google Scholar] [CrossRef] [PubMed] [Green Version]
  46. Norton, A.J.; Rayner, P.J.; Koffi, E.N.; Scholze, M. Assimilating solar-induced chlorophyll fluorescence into the terrestrial biosphere model BETHY-SCOPE v1.0: Model description and information content. Geosci. Model Dev. 2018, 11, 1517–1536. [Google Scholar] [CrossRef] [Green Version]
  47. Zhang, Z.; Wang, S.; Qiu, B.; Song, L.; Zhang, Y. Retrieval of sun-induced chlorophyll fluorescence and advance-ments in carbon cycle application. J. Remote Sens. 2019, 23, 37–52. [Google Scholar]
  48. Lee, J.-E.; Frankenberg, C.; van der Tol, C.; Berry, J.A.; Guanter, L.; Boyce, C.K.; Fisher, J.B.; Morrow, E.; Worden, J.R.; Asefi, S.; et al. Forest productivity and water stress in Amazonia: Observations from GOSAT chlorophyll fluorescence. Proc. R. Soc. B Boil. Sci. 2013, 280, 20130171. [Google Scholar] [CrossRef]
  49. Perez-Priego, O.; Zarco-Tejada, P.; Miller, J.; Sepulcre-Canto, G.; Fereres, E. Detection of water stress in orchard trees with a high-resolution spectrometer through chlorophyll fluorescence in-filling of the O/sub 2/-A band. IEEE Trans. Geosci. Remote Sens. 2005, 43, 2860–2869. [Google Scholar] [CrossRef]
  50. Zarco-Tejada, P.J.; Berni, J.A.J.; Suarez, L.; Sepulcre-Canto, G.; Morales, F.; Miller, J.R. Imaging chlorophyll fluo-rescence with an airborne narrow-band multispectral camera for vegetation stress detection. Remote Sens. Environ. 2009, 113, 1262–1275. [Google Scholar] [CrossRef]
  51. Yoshida, Y.; Joiner, J.; Tucker, C.; Berry, J.; Lee, J.-E.; Walker, G.; Reichle, R.; Koster, R.; Lyapustin, A.; Wang, Y. The 2010 Russian drought impact on satellite measurements of solar-induced chlorophyll fluorescence: Insights from modeling and comparisons with parameters derived from satellite reflectances. Remote Sens. Environ. 2015, 166, 163–177. [Google Scholar] [CrossRef]
  52. Duveiller, G.; Cescatti, A. Spatially downscaling sun-induced chlorophyll fluorescence leads to an improved temporal correlation with gross primary productivity. Remote Sens. Environ. 2016, 182, 72–89. [Google Scholar] [CrossRef]
  53. Gentine, P.; Alemohammad, S.H. Reconstructed Solar-Induced Fluorescence: A Machine Learning Vegetation Product Based on MODIS Surface Reflectance to Reproduce GOME-2 Solar-Induced Fluorescence. Geophys. Res. Lett. 2018, 45, 3136–3146. [Google Scholar] [CrossRef]
  54. Zhang, Y.; Joiner, J.; Alemohammad, S.H.; Zhou, S.; Gentine, P. A global spatially contiguous solar-induced fluo-rescence (CSIF) dataset using neural networks. Biogeosciences 2018, 15, 5779–5800. [Google Scholar]
  55. Duveiller, G.; Filipponi, F.; Walther, S.; Köhler, P.; Frankenberg, C.; Guanter, L.; Cescatti, A. A spatially downscaled sun-induced fluorescence global product for enhanced monitoring of vegetation productivity. Earth Syst. Sci. Data 2020, 12, 1101–1116. [Google Scholar] [CrossRef]
  56. Ma, Y.; Liu, L.; Liu, X.; Chen, J. An improved downscaled sun-induced chlorophyll fluorescence (DSIF) product of GOME-2 dataset. Eur. J. Remote Sens. 2022, 55, 168–180. [Google Scholar] [CrossRef]
  57. Li, X.; Xiao, J. A Global, 0.05-Degree Product of Solar-Induced Chlorophyll Fluorescence Derived from OCO-2, MODIS, and Reanalysis Data. Remote Sens. 2019, 11, 517. [Google Scholar] [CrossRef] [Green Version]
  58. Gensheimer, J.; Turner, A.J.; Köhler, P.; Frankenberg, C.; Chen, J. A convolutional neural network for spatial downscaling of satellite-based solar-induced chlorophyll fluorescence (SIFnet). Biogeosciences 2022, 19, 1777–1793. [Google Scholar] [CrossRef]
  59. Zhang, Z.; Zhang, Y.; Zhang, Y. Generating high-resolution total canopy SIF emission from TROPOMI data: Algo-rithm and application. Remote Sens. Environ. 2023, 295, 113699. [Google Scholar]
  60. Geng, G.P.; Yang, R.; Liu, L.Z. Downscaled solar-induced chlorophyll fluorescence has great potential for moni-toring the response of vegetation to drought in the Yellow River Basin, China: Insights from an extreme event. Ecol. Indic. 2022, 138, 108801. [Google Scholar]
  61. Tang, X.; Xiao, J.; Ma, M.; Yang, H.; Li, X.; Ding, Z.; Yu, P.; Zhang, Y.; Wu, C.; Huang, J. Satellite evidence for China’s leading role in restoring vegetation productivity over global karst ecosystems. For. Ecol. Manag. 2022, 507, 120000. [Google Scholar] [CrossRef]
  62. Li, G.; Wu, C.; Chen, Y.; Huang, C.; Zhao, Y.; Wang, Y.; Ma, M.; Ding, Z.; Yu, P.; Tang, X. Increasing temperature regulates the advance of peak photosynthesis timing in the boreal ecosystem. Sci. Total Environ. 2023, 882, 163587. [Google Scholar] [CrossRef]
  63. Li, Y.-R.; Song, X.-P.; Wu, J.-M.; Li, C.-N.; Liang, Q.; Liu, X.-H.; Wang, W.-Z.; Tan, H.-W.; Yang, L.-T. Sugar Industry and Improved Sugarcane Farming Technologies in China. Sugar Tech 2016, 18, 603–611. [Google Scholar] [CrossRef]
  64. Li, Y.-R.; Yang, L.-T. Research and Development Priorities for Sugar Industry of China: Recent Research Highlights. Sugar Tech 2014, 17, 9–12. [Google Scholar] [CrossRef]
  65. Li, Y.R.; Yang, L.T.; Tan, H.W.; Wang, W.Z.; Yang, L.; Song, X.P. Exploitation and application of improved farm-ing-systems technologies in sugarcane productions in china. Int. Sugar J. 2017, 119, 550–555. [Google Scholar]
  66. Zhou, L.; Tian, Y.; Myneni, R.B.; Ciais, P.; Saatchi, S.; Liu, Y.Y.; Piao, S.; Chen, H.; Vermote, E.F.; Song, C.; et al. Widespread decline of Congo rainforest greenness in the past decade. Nature 2014, 509, 86–90. [Google Scholar] [CrossRef]
  67. Dong, J.; Xiao, X.; Wagle, P.; Zhang, G.; Zhou, Y.; Jin, C.; Torn, M.S.; Meyers, T.P.; Suyker, A.E.; Wang, J.; et al. Comparison of four EVI-based models for estimating gross primary production of maize and soybean croplands and tallgrass prairie under severe drought. Remote Sens. Environ. 2015, 162, 154–168. [Google Scholar] [CrossRef] [Green Version]
  68. Myneni, R.B.; Hoffman, S.; Knyazikhin, Y.; Privette, J.L.; Glassy, J.; Tian, Y.; Wang, Y.; Song, X.; Zhang, Y.; Smith, G.R.; et al. Global products of vegetation leaf area and fraction absorbed PAR from year one of MODIS data. Remote Sens. Environ. 2002, 83, 214–231. [Google Scholar] [CrossRef] [Green Version]
  69. Fang, S.; Mao, K.; Xia, X.; Wang, P.; Shi, J.; Bateni, S.M.; Xu, T.; Cao, M.; Heggy, E.; Qin, Z. Dataset of daily near-surface air temperature in China from 1979 to 2018. Earth Syst. Sci. Data 2022, 14, 1413–1432. [Google Scholar] [CrossRef]
  70. Vicente-Serrano, S.M.; Beguería, S.; López-Moreno, J.I. A Multiscalar Drought Index Sensitive to Global Warming: The Standardized Precipitation Evapotranspiration Index. J. Clim. 2010, 23, 1696–1718. [Google Scholar] [CrossRef] [Green Version]
  71. Guo, H.; Bao, A.; Liu, T.; Jiapaer, G.; Ndayisaba, F.; Jiang, L.; Kurban, A.; De Maeyer, P. Spatial and temporal characteristics of droughts in Central Asia during 1966–2015. Sci. Total Environ. 2018, 624, 1523–1538. [Google Scholar] [CrossRef] [PubMed]
  72. Gao, X.; Zhao, Q.; Zhao, X.; Wu, P.; Pan, W.; Gao, X.; Sun, M. Temporal and spatial evolution of the standardized precipitation evapotranspiration index (SPEI) in the Loess Plateau under climate change from 2001 to 2050. Sci. Total Environ. 2017, 595, 191–200. [Google Scholar] [CrossRef] [PubMed]
  73. Wang, Q.F.; Wu, J.J.; Lei, T.J.; He, B.; Wu, Z.T.; Liu, M.; Mo, X.Y.; Geng, G.P.; Li, X.H.; Zhou, H.K.; et al. Tem-poral-spatial characteristics of severe drought events and their impact on agriculture on a global scale. Quat. Int. 2014, 349, 10–21. [Google Scholar] [CrossRef]
  74. Wang, M.; Ding, Z.; Wu, C.; Song, L.; Ma, M.; Yu, P.; Lu, B.; Tang, X. Divergent responses of ecosystem water-use efficiency to extreme seasonal droughts in Southwest China. Sci. Total Environ. 2020, 760, 143427. [Google Scholar] [CrossRef]
  75. Liu, L.; Guan, L.; Liu, X. Directly estimating diurnal changes in GPP for C3 and C4 crops using far-red sun-induced chlorophyll fluorescence. Agric. For. Meteorol. 2017, 232, 1–9. [Google Scholar] [CrossRef]
  76. Chen, X.; Mo, X.; Hu, S.; Liu, S. Contributions of climate change and human activities to ET and GPP trends over North China Plain from 2000 to 2014. J. Geogr. Sci. 2017, 27, 661–680. [Google Scholar] [CrossRef]
  77. Tian, F.; Wu, J.; Liu, L.; Leng, S.; Yang, J.; Zhao, W.; Shen, Q. Exceptional Drought across Southeastern Australia Caused by Extreme Lack of Precipitation and Its Impacts on NDVI and SIF in 2018. Remote Sens. 2019, 12, 54. [Google Scholar] [CrossRef] [Green Version]
  78. Tan, Z.Q.; Tao, H.; Jiang, J.H.; Zhang, Q. Influences of Climate Extremes on NDVI (Normalized Difference Vegetation Index) in the Poyang Lake Basin, China. Wetlands 2015, 35, 1033–1042. [Google Scholar] [CrossRef]
  79. Baker, N.R. Chlorophyll fluorescence: A probe of photosynthesis in vivo. Annu. Rev. Plant Biol. 2008, 59, 89–113. [Google Scholar] [CrossRef] [Green Version]
  80. Zhang, Y.; Guanter, L.; Berry, J.A.; Joiner, J.; van der Tol, C.; Huete, A.; Gitelson, A.; Voigt, M.; Köhler, P. Estimation of vegetation photosynthetic capacity from space-based measurements of chlorophyll fluorescence for terrestrial biosphere models. Glob. Chang. Biol. 2014, 20, 3727–3742. [Google Scholar] [CrossRef] [Green Version]
  81. Li, X.; Xiao, J.; He, B. Higher absorbed solar radiation partly offset the negative effects of water stress on the photosynthesis of Amazon forests during the 2015 drought. Environ. Res. Lett. 2018, 13, 044005. [Google Scholar] [CrossRef]
  82. Yang, J.; Tian, H.; Pan, S.; Chen, G.; Zhang, B.; Dangal, S. Amazon drought and forest response: Largely reduced forest photosynthesis but slightly increased canopy greenness during the extreme drought of 2015/2016. Glob. Chang. Biol. 2018, 24, 1919–1934. [Google Scholar] [CrossRef] [PubMed]
  83. Shen, Q.; Lin, J.; Yang, J.; Zhao, W.; Wu, J. Exploring the Potential of Spatially Downscaled Solar-Induced Chlorophyll Fluorescence to Monitor Drought Effects on Gross Primary Production in Winter Wheat. IEEE J. Sel. Top. Appl. Earth Obs. Remote Sens. 2022, 15, 2012–2022. [Google Scholar] [CrossRef]
  84. Hu, S.; Mo, X.G. Detecting regional GPP variations with statistically downscaled solar-induced chlorophyll fluo-rescence (SIF) based on GOME-2 and MODIS data. Int. J. Remote Sens. 2020, 41, 9206–9228. [Google Scholar] [CrossRef]
  85. Drusch, M.; Moreno, J.; Del Bello, U.; Franco, R.; Goulas, Y.; Huth, A.; Kraft, S.; Middleton, E.M.; Miglietta, F.; Mo-hammed, G.; et al. The FLuorescence EXplorer Mission Concept-ESA’s Earth Explorer 8. IEEE Trans. Geosci. Remote Sens. 2017, 55, 1273–1284. [Google Scholar] [CrossRef]
  86. Sun, Y.; Frankenberg, C.; Jung, M.; Joiner, J.; Guanter, L.; Kohler, P.; Magney, T. Overview of Solar-Induced chlo-rophyll Fluorescence (SIF) from the Orbiting Carbon Observatory-2: Retrieval, cross-mission comparison, and global monitoring for GPP. Remote Sens. Environ. 2018, 209, 808–823. [Google Scholar] [CrossRef]
  87. Zhang, Q.; Yu, H.; Sun, P.; Singh, V.P.; Shi, P. Multisource data based agricultural drought monitoring and agri-cultural loss in China. Glob. Planet. Chang. 2019, 172, 298–306. [Google Scholar] [CrossRef]
  88. Guo, H.; Bao, A.; Liu, T.; Ndayisaba, F.; Jiang, L.; Zheng, G.; Chen, T.; De Maeyer, P. Determining variable weights for an Optimal Scaled Drought Condition Index (OSDCI): Evaluation in Central Asia. Remote Sens. Environ. 2019, 231, 111220. [Google Scholar] [CrossRef]
  89. Gao, D.; Ran, C.; Zhang, Y.; Wang, X.; Lu, S.; Geng, Y.; Guo, L.; Shao, X. Effect of different con-centrations of foliar iron fertilizer on chlorophyll fluorescence characteristics of iron-deficient rice seedlings under saline sodic conditions. Plant Physiol. Biochem. 2022, 185, 112–122. [Google Scholar] [CrossRef]
  90. Latifinia, E.; Eisvand, H.R. Soybean physiological properties and grain quality responses to nutrients, and predicting nutrient deficiency using chlorophyll fluorescence. J. Soil. Sci. Plant Nutr. 2022, 22, 1942–1954. [Google Scholar] [CrossRef]
  91. Sieczko, L.; Dąbrowski, P.; Kowalczyk, K.; Gajc-Wolska, J.; Borucki, W.; Janaszek-Mańkowska, M.; Kowalczyk, W.; Farci, D.; Kalaji, H.M. Early detection of phosphorus deficiency stress in cucumber at the cellular level using chlorophyll fluorescence signals. J. Water Land Dev. 2023, 176–186. [Google Scholar] [CrossRef]
  92. Senesi, G.S.; De Pascale, O.; Marangoni, B.S.; Caires, A.R.L.; Nicolodelli, G.; Pantaleo, V.; Leonetti, P. Chlorophyll Fluorescence Imaging (CFI) and Laser-Induced Breakdown Spectroscopy (LIBS) Applied to Investigate Tomato Plants Infected by the Root Knot Nematode (RKN) Meloidogyne incognita and Tobacco Plants Infected by Cymbidium Ringspot Virus. Photonics 2022, 9, 627. [Google Scholar] [CrossRef]
  93. Du, K.; Jing, X.; Zeng, Y.; Ye, Q.; Li, B.; Huang, J. An Improved Approach to Monitoring Wheat Stripe Rust with Sun-Induced Chlorophyll Fluorescence. Remote Sens. 2023, 15, 693. [Google Scholar] [CrossRef]
  94. Zhou, R.; Hyldgaard, B.; Yu, X.; Rosenqvist, E.; Ugarte, R.M.; Yu, S.; Wu, Z.; Ottosen, C.-O.; Zhao, T. Phenotyping of faba beans (Vicia faba L.) under cold and heat stresses using chlorophyll fluorescence. Euphytica 2018, 214, 1–13. [Google Scholar] [CrossRef]
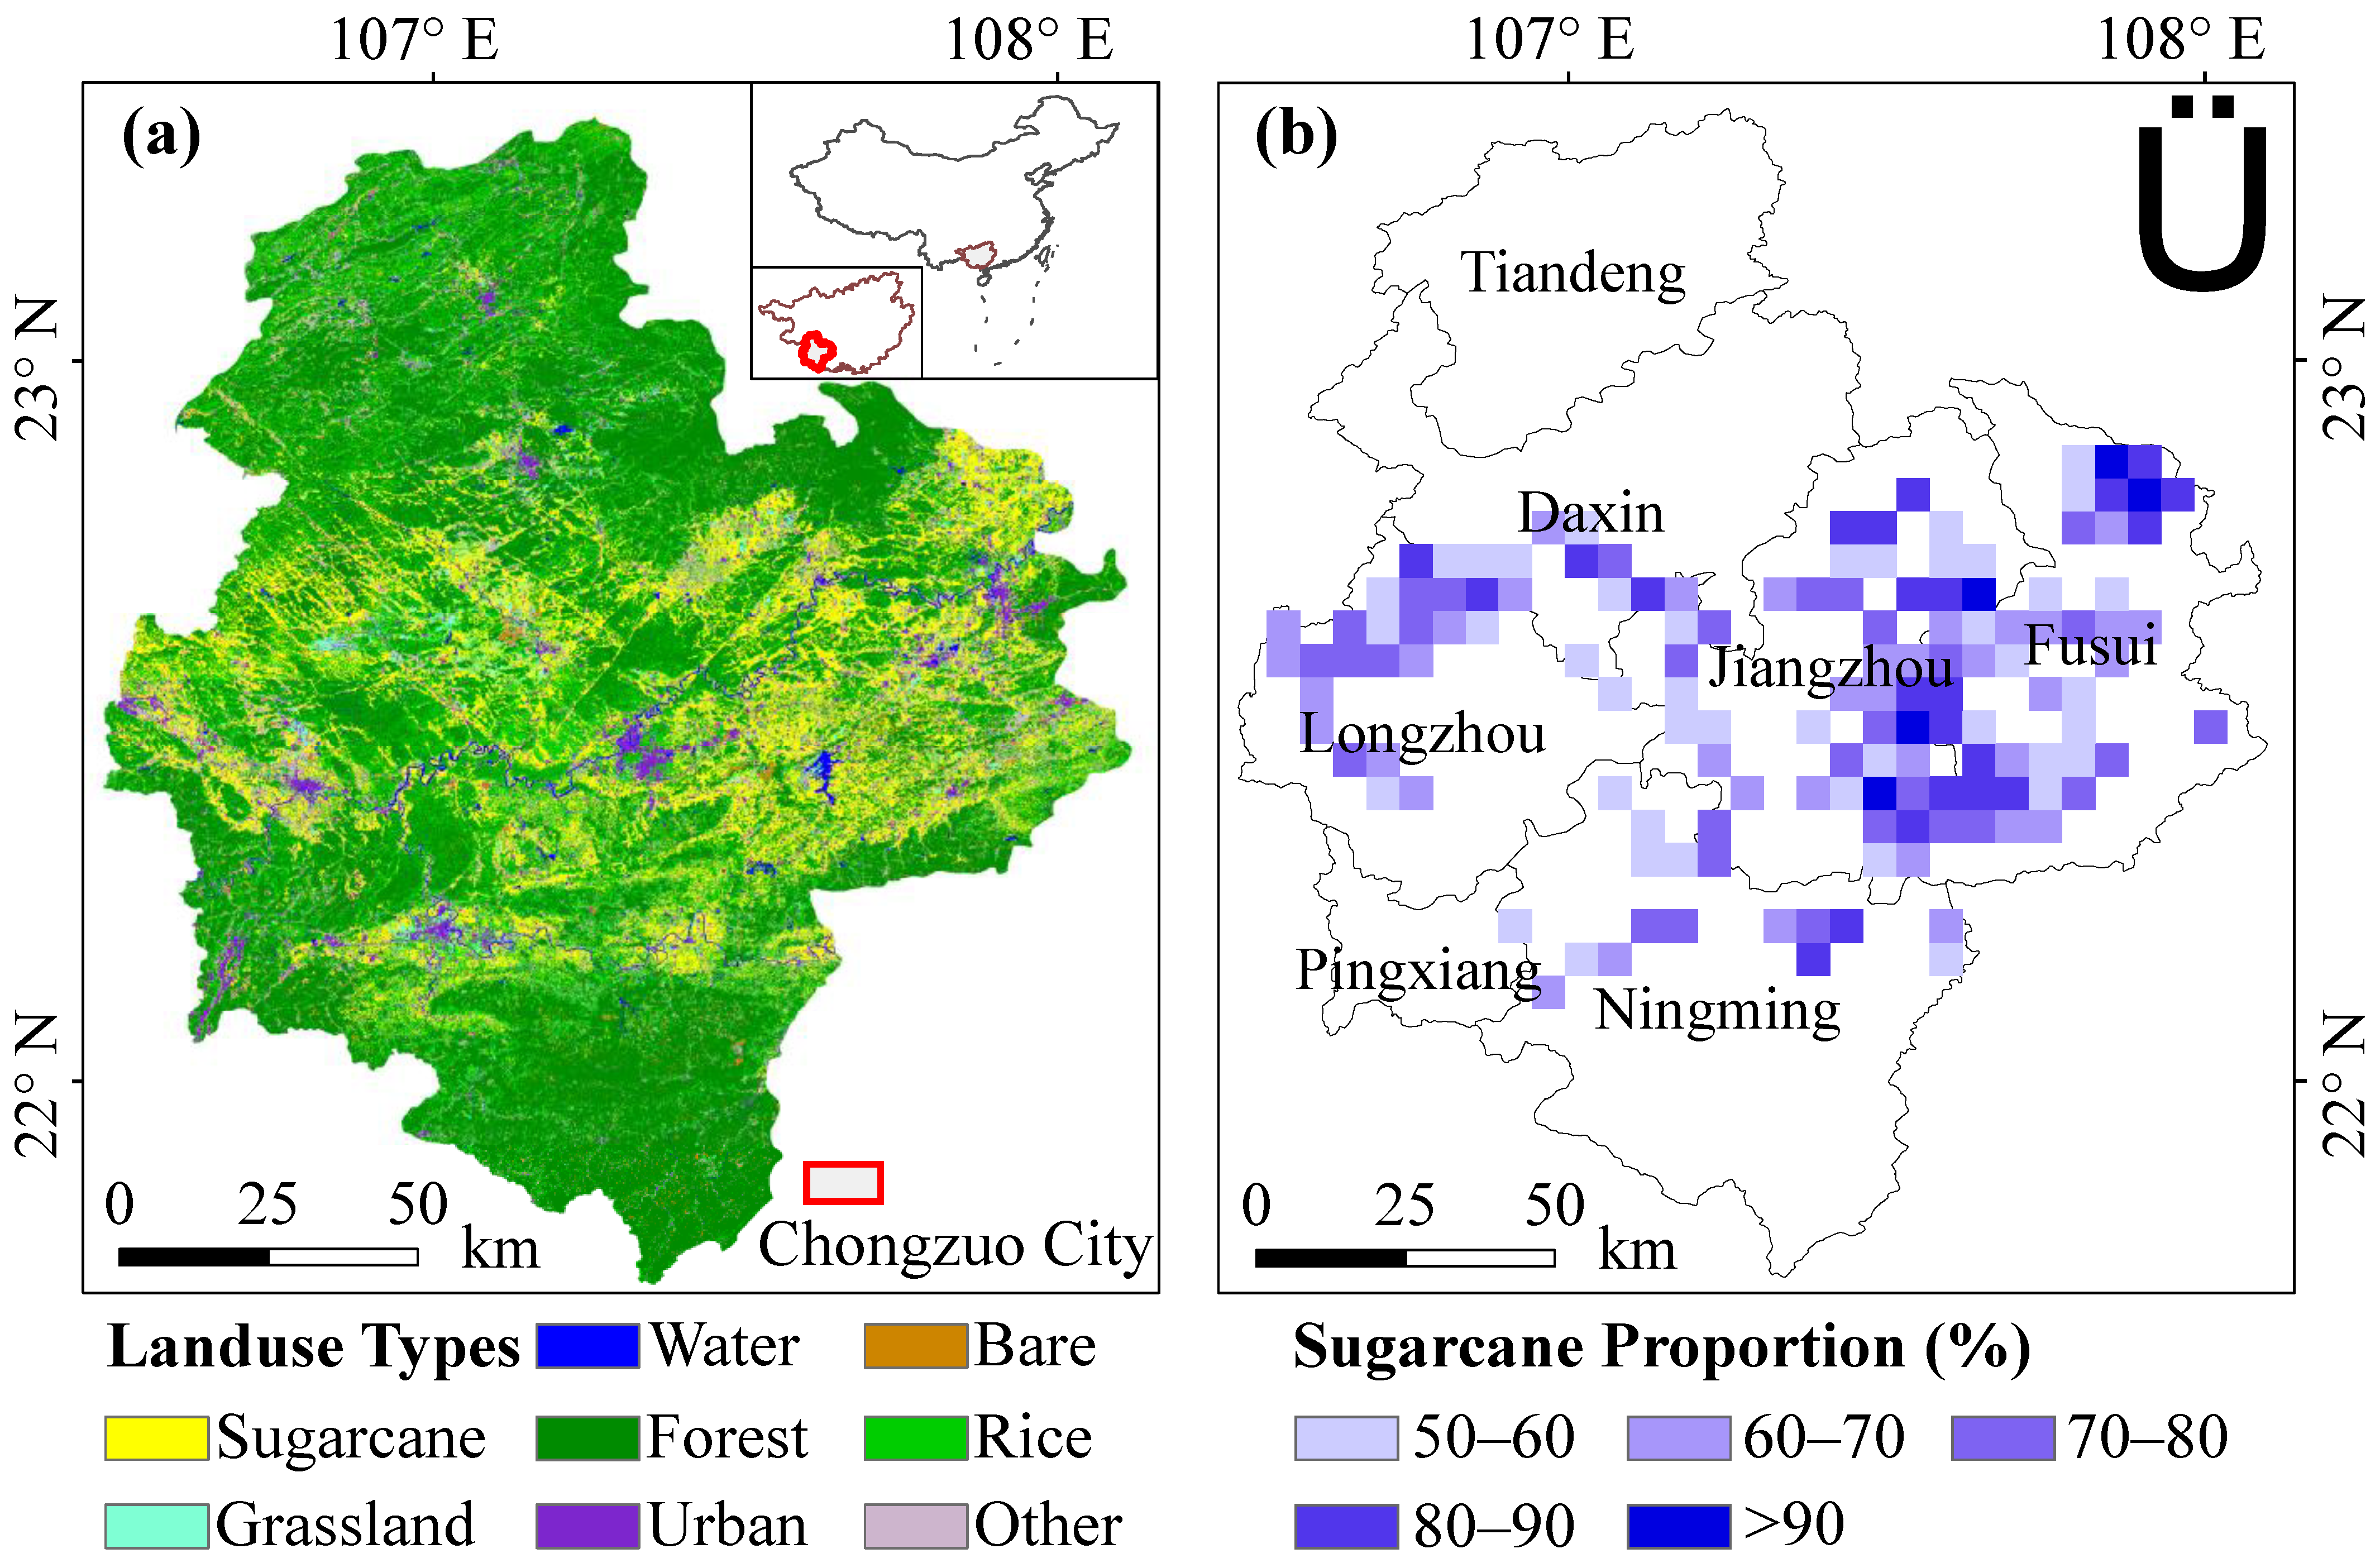
Figure 1. (a) Sketch map of the study area and (b) spatial distribution of the 0.05° grids with proportions of sugarcane-planting areas above 50% over the study area.
Remotesensing 15 03937 g001
Figure 2. The relationships between yield/GPP and mean EVI/SIF during the critical growth periods of sugarcane. (a) Interannual variations in yield, EVI, and SIF in the study area. (b,c) Scatter plots of GPP against mean EVI and SIF during the critical growth periods in the entire study area. R2 and p indicate the linear correlations.
Remotesensing 15 03937 g002
Figure 3. Scatter plots of GPP against mean EVI and SIF during the critical growth periods in (a1,a2) Longzhou, (b1,b2) Daxin, (c1,c2) Jiangzhou, (d1,d2) Fusui, and (e1,e2) Ningming Counties.
Remotesensing 15 03937 g003
Figure 4. Seasonal variations in the anomalies of SPEI (a), precipitation (b), and air temperature (c) in the entire study area. The blue curves represent the monthly multiyear mean of each variable, and the red curves indicate the seasonal cycles of each variable in 2009. The grey curves in (a) represent the SPEI values from 2001 to 2018 except for 2009. The light green shadings indicate the 10th–90th percentile ranges of each variable in all years.
Remotesensing 15 03937 g004
Figure 5. Spatial distributions of the SPEI (a) and the anomalies of precipitation (b) and air temperature (c) from July to November 2009.
Remotesensing 15 03937 g005
Figure 6. Seasonal variations in the 16-day mean and multiyear mean (a) LST and (b) LST change percent, (c) ET and (d) ET change percent from July to November 2009 over the entire study area.
Remotesensing 15 03937 g006
Figure 7. Spatial distributions of monthly LST and ET anomalies from July to November 2009. (a,b) are anomalies from the multiyear mean, and (c,d) are standardized anomalies from the multiyear mean.
Remotesensing 15 03937 g007
Figure 8. Seasonal variations in the 16-day mean and multiyear mean (a) EVI and (b) EVI change percent, (c) SIF and (d) SIF change percent from July to November 2009 over the entire study area.
Remotesensing 15 03937 g008
Figure 9. Spatial distributions of monthly EVI and SIF anomalies from July to November 2009. (a,b) are anomalies from the multiyear mean, and (c,d) are standardized anomalies from the multiyear mean.
Remotesensing 15 03937 g009
Figure 10. Monthly time series of the area percentage of drought-induced sugarcane losses indicated by EVI (a) and SIF (b) from July to November 2009. σ indicates the standard deviation of the monthly EVI and SIF during 2001–2020.
Remotesensing 15 03937 g010
Figure 11. Seasonal variations in the 16-day mean and multiyear mean (a) PAR and (b) PAR change percent, (c) fPAR and (d) fPAR change percent, (e) SIFpar and (f) SIFpar change percent, and (g) SIFyield and (h) SIFyield change percent from July 2009 to November 2009 over the entire study area.
Remotesensing 15 03937 g011
Figure 12. Spatial variations in the standardized monthly PAR (a), fPAR (b), SIFpar (c), and SIFyield (d) anomalies from the multiyear mean from July 2009 to November 2009.
Remotesensing 15 03937 g012
Figure 13. Monthly time series of the area percentage of standardized PAR (a), fPAR (b), SIFpar (c), and SIFyield (d) anomalies from the multiyear mean over the study area. σ indicates the standard deviation of the monthly variables during 2001–2020.
Remotesensing 15 03937 g013
Disclaimer/Publisher’s Note: The statements, opinions and data contained in all publications are solely those of the individual author(s) and contributor(s) and not of MDPI and/or the editor(s). MDPI and/or the editor(s) disclaim responsibility for any injury to people or property resulting from any ideas, methods, instructions or products referred to in the content.