Article

Snow Cover on the Tibetan Plateau and Topographic Controls

1
Tibet Institute of Plateau Atmospheric and Environmental Sciences, Tibet Meteorological Bureau, Lhasa 850000, China
2
Tibet Key Laboratory of Plateau Atmosphere and Environment Research, Science and Technology Department of Tibet Autonomous Region, Lhasa 850000, China
3
Key Laboratory of Land Surface Pattern and Simulation, Institute of Geographic Sciences and Natural Resources Research, Chinese Academy of Sciences, Beijing 100101, China
*
Author to whom correspondence should be addressed.
Remote Sens. 2023, 15(16), 4044; https://doi.org/10.3390/rs15164044
Submission received: 26 June 2023 / Revised: 1 August 2023 / Accepted: 9 August 2023 / Published: 16 August 2023

Abstract

:
Snow cover plays a critical role in global energy and water cycles. Snow cover on the Tibetan Plateau (TP) provides vital water sources in western China and Himalayan regions, in addition to its weather and climate significance. The massive high mountain topography of the TP is the main condition for the presence and persistence of snow cover on the plateau at the mid-low latitudes of the Northern Hemisphere (NH). However, how the mountain topography controls snow-cover distribution on the TP remains largely unclear, and the relationship is not well quantified. Here, the spatial distribution and the topographic controls of snow cover on the TP are examined based on snow cover frequency (SCF) derived from MODIS snow cover product (MOD10A2 v005) and digital elevation model (DEM) data. The results show that snow cover on the TP is spatially unevenly distributed, and that it is characterized by rich snow and high SCF on the interior and the surrounding high mountain ranges, with less snow and low SCF in inland basins and river valleys. Snow cover on the TP presents elevation dependence: the higher the altitude, the higher the SCF, the longer the snow cover duration, and the more stable the intra-annual variation. The annual mean SCF below 3000 m above sea level (m a.s.l) is less than 4%, and it reaches 77% above 6000 m a.s.l. The intra-annual snow cover variation below 4000 m a.s.l features a unimodal distribution, while above 4000 m a.s.l it presents a bimodal distribution. The mean minimum SCF below 6000 m a.s.l occurs in summer, while above 6000 m a.s.l it occurs in winter. Due to differences in solar radiation and moisture condition caused by the mountain slope and aspect, the mean SCF generally increases with mountain slopes, and it is the highest on the north-facing aspect and the lowest on the south-facing aspect.

1. Introduction

Snow cover is a major component of the cryosphere, and over 98% of global seasonal snow cover is in the Northern Hemisphere (NH) [1,2,3]. In winter, over 40% of land surface in the NH is covered by snow, becoming temporally and spatially the fastest changing surface feature on Earth [4,5,6,7]. As a massive elevated land mass on the Eurasia continent and the central region of the High Mountain Asia, the Tibetan Plateau (TP) is the highest and largest mountain region on the world, with an average elevation of over 4000 m covering over 2.5 million square kilometers along with surrounding high mountain regions, which are often called “the roof of the world” or “the third pole of the world” [8,9,10].
The TP has the largest snow cover extent in the mid-low latitudes of the NH, and it is an important component of snow cover in Eurasia. Snow cover on the TP can exist at higher altitude regions throughout seasons, and it becomes a unique feature on global snow maps [11,12,13]. Snow cover on the TP affects weather systems and regional climate change through changing surface radiation balance and the thermal condition between the atmosphere and the land surface [14], and snow cover anomalies on the TP have a strong link with Asian monsoon systems [15,16]. On the other hand, as the headwaters of major river systems in Asia, meltwater of snow and ice on the TP play a critical role in the water supply on the plateau and downstream, and over billion people depend on the water from these rivers [17,18,19,20].
For the large-scale snow-cover observations, satellite remote sensing increasingly plays an irreplaceable role due to its advantage, which include large spatial coverage, various spatial and temporal resolution, low cost, and higher levels of objectivity. Remote sensing, especially, has become the most effective means to monitor snow cover in the areas with broad extent, complex terrain, and difficult accessibility, such as the TP. Additionally, coupled with the digital elevation model (DEM), remote sensing makes it possible to reveal the spatial distribution of snow cover and the topographic controls on snow cover in the mountain regions.
Satellite remote sensing allows the detection of spatial-temporal snow cover on large areas in inaccessible and remote terrain, providing information on a critical component of the hydrological cycle [21]. There is a large spatial variation in snow cover across the Himalayan river basins due to the large climate and altitudinal differences, and an obvious relation exists with the elevation [13]. In the western Himalayas, the area covered with snow is more than 90% during winter and spring, while it is less than 20% of the total winter and spring period in most of the other areas in the eastern Himalayas and the Tibetan Plateau [13]. Snow cover distribution depends on the terrain height over the TP, and the duration of snow persistence varies in different elevation ranges and generally becomes longer with increases in the elevation of the terrain [22]. Some regional studies have been conducted using satellite snow cover data and DEM in order to reveal the impact of topography on the snow cover distribution on both the TP [23,24,25] and on western China [26,27,28,29].
Snow cover in the mountain region is not only closely related to climatic conditions but also varies with topography. The strong altitudinal dependence of snow cover in the mountain region is related to variations in radiation and energy balances [30,31]. Topography has a major effect on snow cover distribution in the Himalayan region [32,33]. Snow cover distribution in the western Himalayas is largely controlled by latitude and altitude [32]. Snow cover variability across the Hindu Kush Himalaya (HKH) region is strongly influenced by topography [32,34], and it generally shows altitudinal dependence [35]. The length of the snow-covered season on the TP appears to be decreasing at lower elevations because of the increase in air temperatures, but at higher elevations, the increase in precipitation appears to compensate for the increase in air temperature, and the snow-free period has consequently decreased [36].
The mountain topography of the TP is a main condition, and it controls snow cover on the surface, but quantitative analysis on this has thus far been lacking. Previous research has been limited to the northeast [24] and the east [25] of the TP. There is a lack of comprehensive research that could reveal the relationships between the overall terrain conditions of the plateau and the spatial distribution of snow cover for the entire TP. Therefore, based on the MOD10A2 snow-cover products and DEM data, the spatial distribution characteristics of snow cover on the TP is analyzed first in this study, followed by in-depth analysis on the impact of topographic conditions (elevation, slope, and aspect) on the spatial distribution of snow cover on the TP. This study is of great significance to understanding the spatial distribution of snow resources, the snowmelt hydrological effect, and responses to climate change, and it can help lead to a better strategy for water resource management in the mountain regions.

2. Materials and Methods
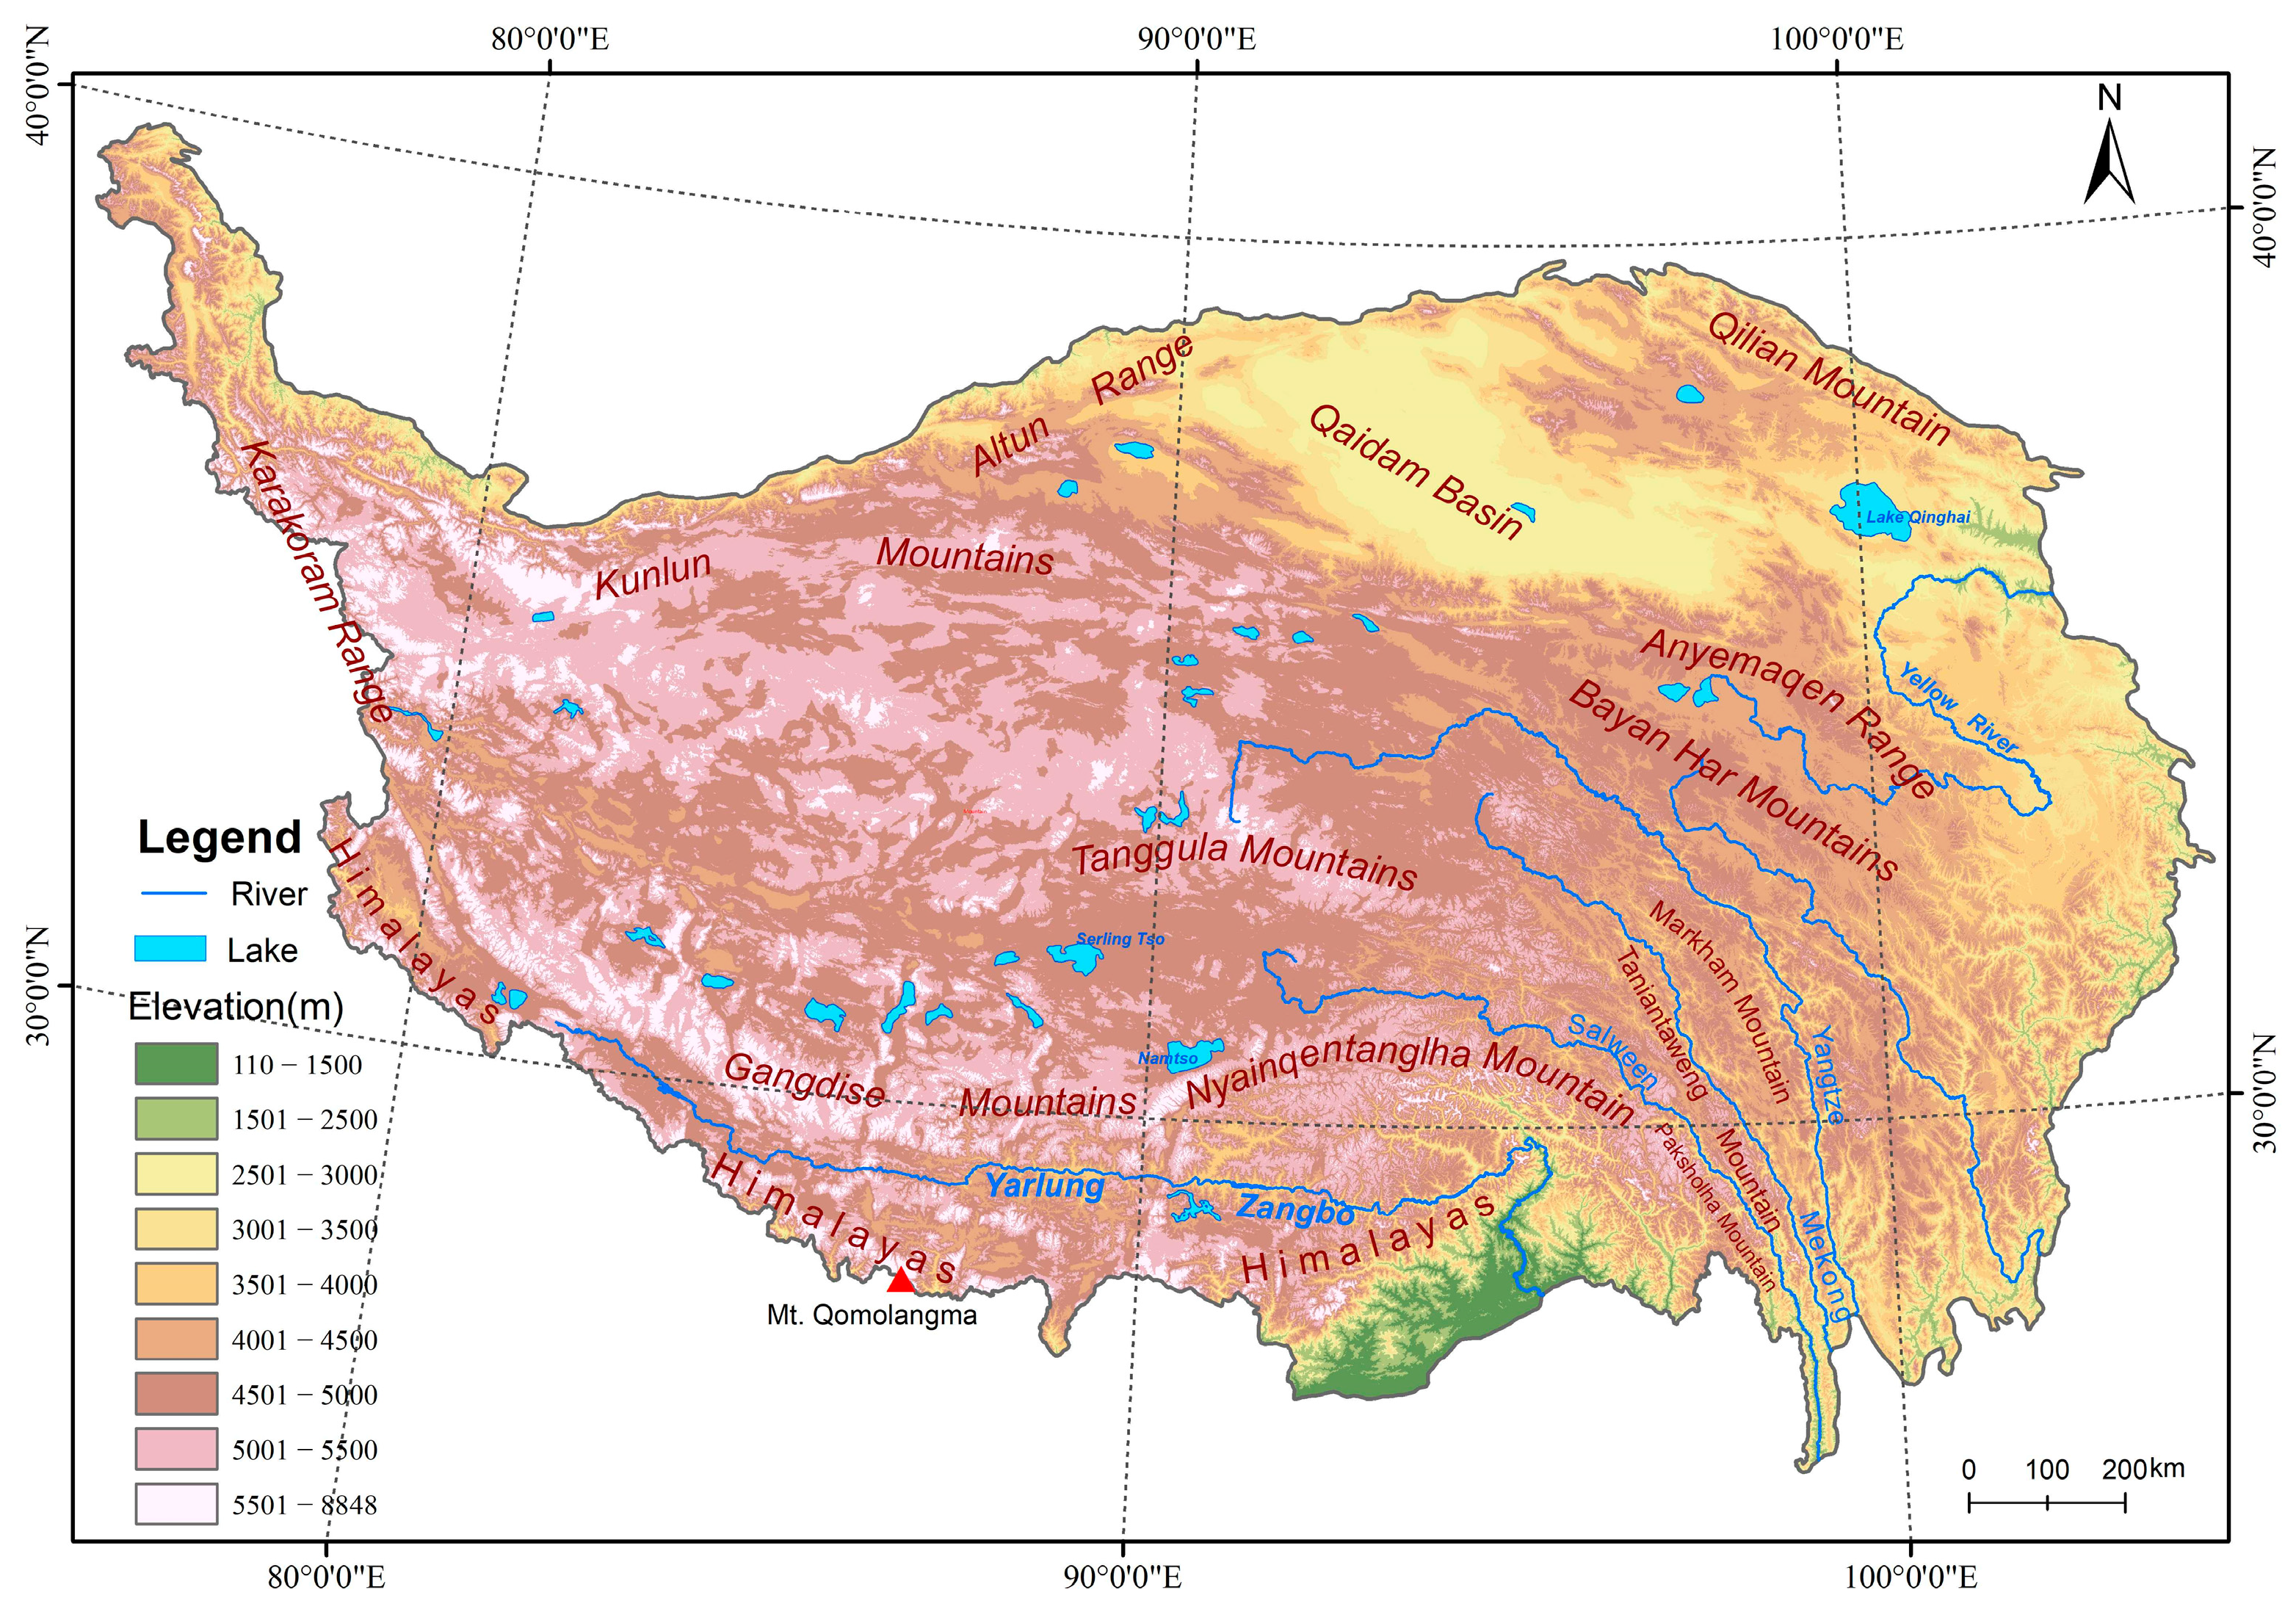
2.1. Study Area

The TP is a vast elevated plateau located in western China at the intersection of Central, South, and East Asia, and it is a major part of the global mountain regions, as shown in Figure 1. The extent for the global mountain areas in Figure 1 is derived from the reference layer of the Global Mountain Biodiversity Assessment (GMBA) [37].
The TP is surrounded by high mountains, and the interior of the plateau is relatively flat. Specifically, the TP is bounded by the Himalayas in the south, Karakorum Mountain in the northwest, the western Kunlun and Altun mountains in the north, the Qilian Mountains in the northeast, and the Hengduan parallel mountains in the southeast. The interior of the TP consists of plateaus, basins, valleys, lakes, and various small mountains, as well as six high mountain ranges (Gangdise, Nyainqentanglha, eastern Kunlun, Tanggula, Bayan Har, and Anyemaqen), as shown in Figure 2. The TP is the largest and highest mountain region in the world with an average elevation of 4379 m, based on 90 m SRTM (Shuttle Radar Topography Mission) DEM data.
The TP generally can be divided into three major landform units: the fold high mountain area in the west and south, the vast fault-block plateau and basin area in the interior, and the deep gorge and high mountain area in the east. The main part of the TP is composed of the Tibet Autonomous Region (TAR) and Qinghai Province, with an area of 257.2 × 10⁴ km2 that accounts for about 26.8% of the total land area of China [38,39].

2.2. Data

The snow cover data used in the study is MOD10A2 snow cover product v005 from 2000 to 2014, acquired from the National Snow and Ice Data Center (https://nsidc.org/data/, accessed on 7 April 2023). MOD10A2 is 8-day composite data of MODIS daily snow products (MOD10A1) through an 8-day maximum composite method to eliminate cloud obscuration, and it provides more consistent and cloud-free coverage than daily products [40,41]. The sinusoidal projection is used for the products, and the spatial resolution is 500 m.
The studies on the accuracy evaluation of MODIS snow-cover products have been carried out worldwide since the data have been available to the public. Under the clear sky conditions in the NH, the average annual error of MODIS snow-cover products is approximately 8% [41,42]. The accuracy of MODIS daily snow-cover products (MOD10A1) is 98.2% in the absence of cloud in Xinjiang area in China, and snow depth is one of main factors that affects the accuracy of MODIS snow-cover mapping [43]. In northwestern China, MOD10A2 products can effectively eliminate cloud contamination for snow-cover classification, and the average snow-cover detection accuracy is 87.5% [44]. Under clear sky conditions, MOD10A2 has very high accuracy, and snow-cover mapping accuracy reaches as high as 94% [45]. Pu et al. evaluated the accuracy of MODIS snow-cover data by comparing the data with in situ snow observations in the TP, and the results show that the overall accuracy of the MOD10A2 snow-cover data are about 90% on the TP area [12]. All of the above shows that MOD10A2 has a high accuracy for snow-cover detection, and can thus adequately capture the spatial variability in the snow cover of mountain regions in western China and in the TP area.

2.3. Methods

2.3.1. Snow-Cover Frequency

Snow-cover frequency (SCF) is defined here as the percentage of snow-cover frequency needed to examine both the snow-cover process and the occurrence frequency in a certain area for a certain time period at pixel levels in the TP, which is achieved by calculating the percentage of snow-covered pixels in total pixels of MOD10A2 time-series data. Its equation is as follows:
S C F = 1 M i = 1 M k = 1 D N i k D × 100 %  
where SCF is the snow-cover frequency as a percentage, indicating the percentage of time that a pixel is snow covered during the indicated seasons within the entire time series. N i k is the pixel value of cover types on the surface in the kth image of the MOD10A2 time-series data in the ith year. For the snow-cover pixel, the value is set to 1, while for the non-snow-cover pixel, the value is set to 0. M is the total number of years that the time-series data have been available. D is the total number of MOD10A2 images in a year or season. The four seasons are spring (March–April–May), summer (June–July–August), autumn (September–October–November) and winter (December–January and February of the following year).

2.3.2. Elevation, Slope and Aspect Data Processing

DEM data used in the study is SRTM DEM that were achieved in USGS (U. S. Geological Survey), and were downloaded from the National Tibetan Plateau Data Center (http://data.tpdc.ac.cn, accessed on 7 May 2021). The spatial resolution of SRTM DEM is 90 m, and it is resampled to a spatial resolution of 500 m, which is consistent with the MOD10A2 data. Based on the DEM data, the elevation, slope, and aspect data are generated and zoned according to specific terrain and topographic characteristics in the TP area. Among them, the elevation is divided into 7 zones with a 1 km interval of elevation––namely, below 1 km, 1–2 km, 2–3 km, 3–4 km, 4–5 km, 5–6 km, and above 6 km of elevation. The slope is divided into four zones––namely, below 5°, 5–10°, 10–20°, and above 20°. Likewise, the aspect is divided into the north-facing aspect (315–45°), east-facing aspect (45–135°), south-facing aspect (135–225°), and west-facing aspect (225–315°) at an interval of 90° in a clockwise direction with starting from 315°, corresponding to shady slope, semi-sunny slope, sunny slope and semi-shady slope for mountain terrains, respectively. No aspect region (i.e., flat terrain) is represented by “−1”.

3. Results

3.1. Spatial Distribution of Snow Cover

3.1.1. Annual Mean SCF

Figure 3 shows the spatial distribution of annual mean SCF on the TP from 2001 to 2014. Snow cover on the TP is unevenly distributed to a great extent, and is generally characterized by rich snow and more perennial snow cover, with high SCF on the surrounding and interior high mountains and less snow and low SCF on the inland plains, basins, and river valleys. Specifically, the Nyainqentanglha and its eastward extending mountain regions in southeastern Tibet and the Karakoram and western Kunlun Mountains in the northwestern TP are the two regions with the highest SCF, followed by the high mountain ranges, such as the eastern Kunlun Mountains in the north, the Himalayas in the south, the Qilian Mountains in the northeast, and the Tanggula, Anyemaqen, and Bayan Har Mountains in the interior and eastern TP. However, mean SCF is low in the vast interior of the plateau, except for high mountain ranges. Of the latter, the Qaidam basin and the southern Tibetan valley are two areas with the least snow cover occurrence and the lowest SCF, followed by the Qiangtang Plateau in northern Tibet, the Qinghai Lake basin, and the broad eastern region of the Anyemaqen Mountains.
Snow-cover distribution on the TP is not only related to atmospheric circulation over the plateau but, more importantly, it depends on the alpine climate and the local terrain. In particular, the low-temperature condition associated with high elevation is the main factor that snow cover sustains on the mid-low altitudes of the NH. In the TP, the high mountain and the low-altitude regions are in good agreement with more and less snow-cover distributions.
The spatial analysis shows that the annual mean SCF on the TP is 15.7%. Of this, the area with SCF < 10% accounts for around half of the total TP area (Table 1), and is mainly distributed in the Qaidam basin, the southern regions of Lake Qinghai, the middle and lower reaches of the Yarlung Zangbo River, and the Qiangtang Plateau in northern Tibet. The area with SCF > 60% accounts for only 3.1% of total plateau area, and it is mainly distributed in the Nyainqentanglha Mountains and its southeastern extension, comprising the Karakoram, Kunlun, Himalayan, Qilian, Tanggulan, Bayan Har, and Anyemaqen mountain ranges in the surroundings and the interior of the TP. The higher SCF corresponds well with huge mountain ranges. The more persistent snow cover on the Karakoram and the western Kunlun mountains in the northwestern TP is primarily due to westerly disturbance during the winter and the early spring, where are most heavily glaciated areas in the high mountain regions of Asia. In the southeastern TP, high SCF is attributed to more warm moist air that comes from southern Asia. In contrast, due to the huge shielding from the Himalayan and Karakoram mountains [11,23], most of the interior of the TP has relatively less snow cover, although the average elevation is beyond 4000 m.

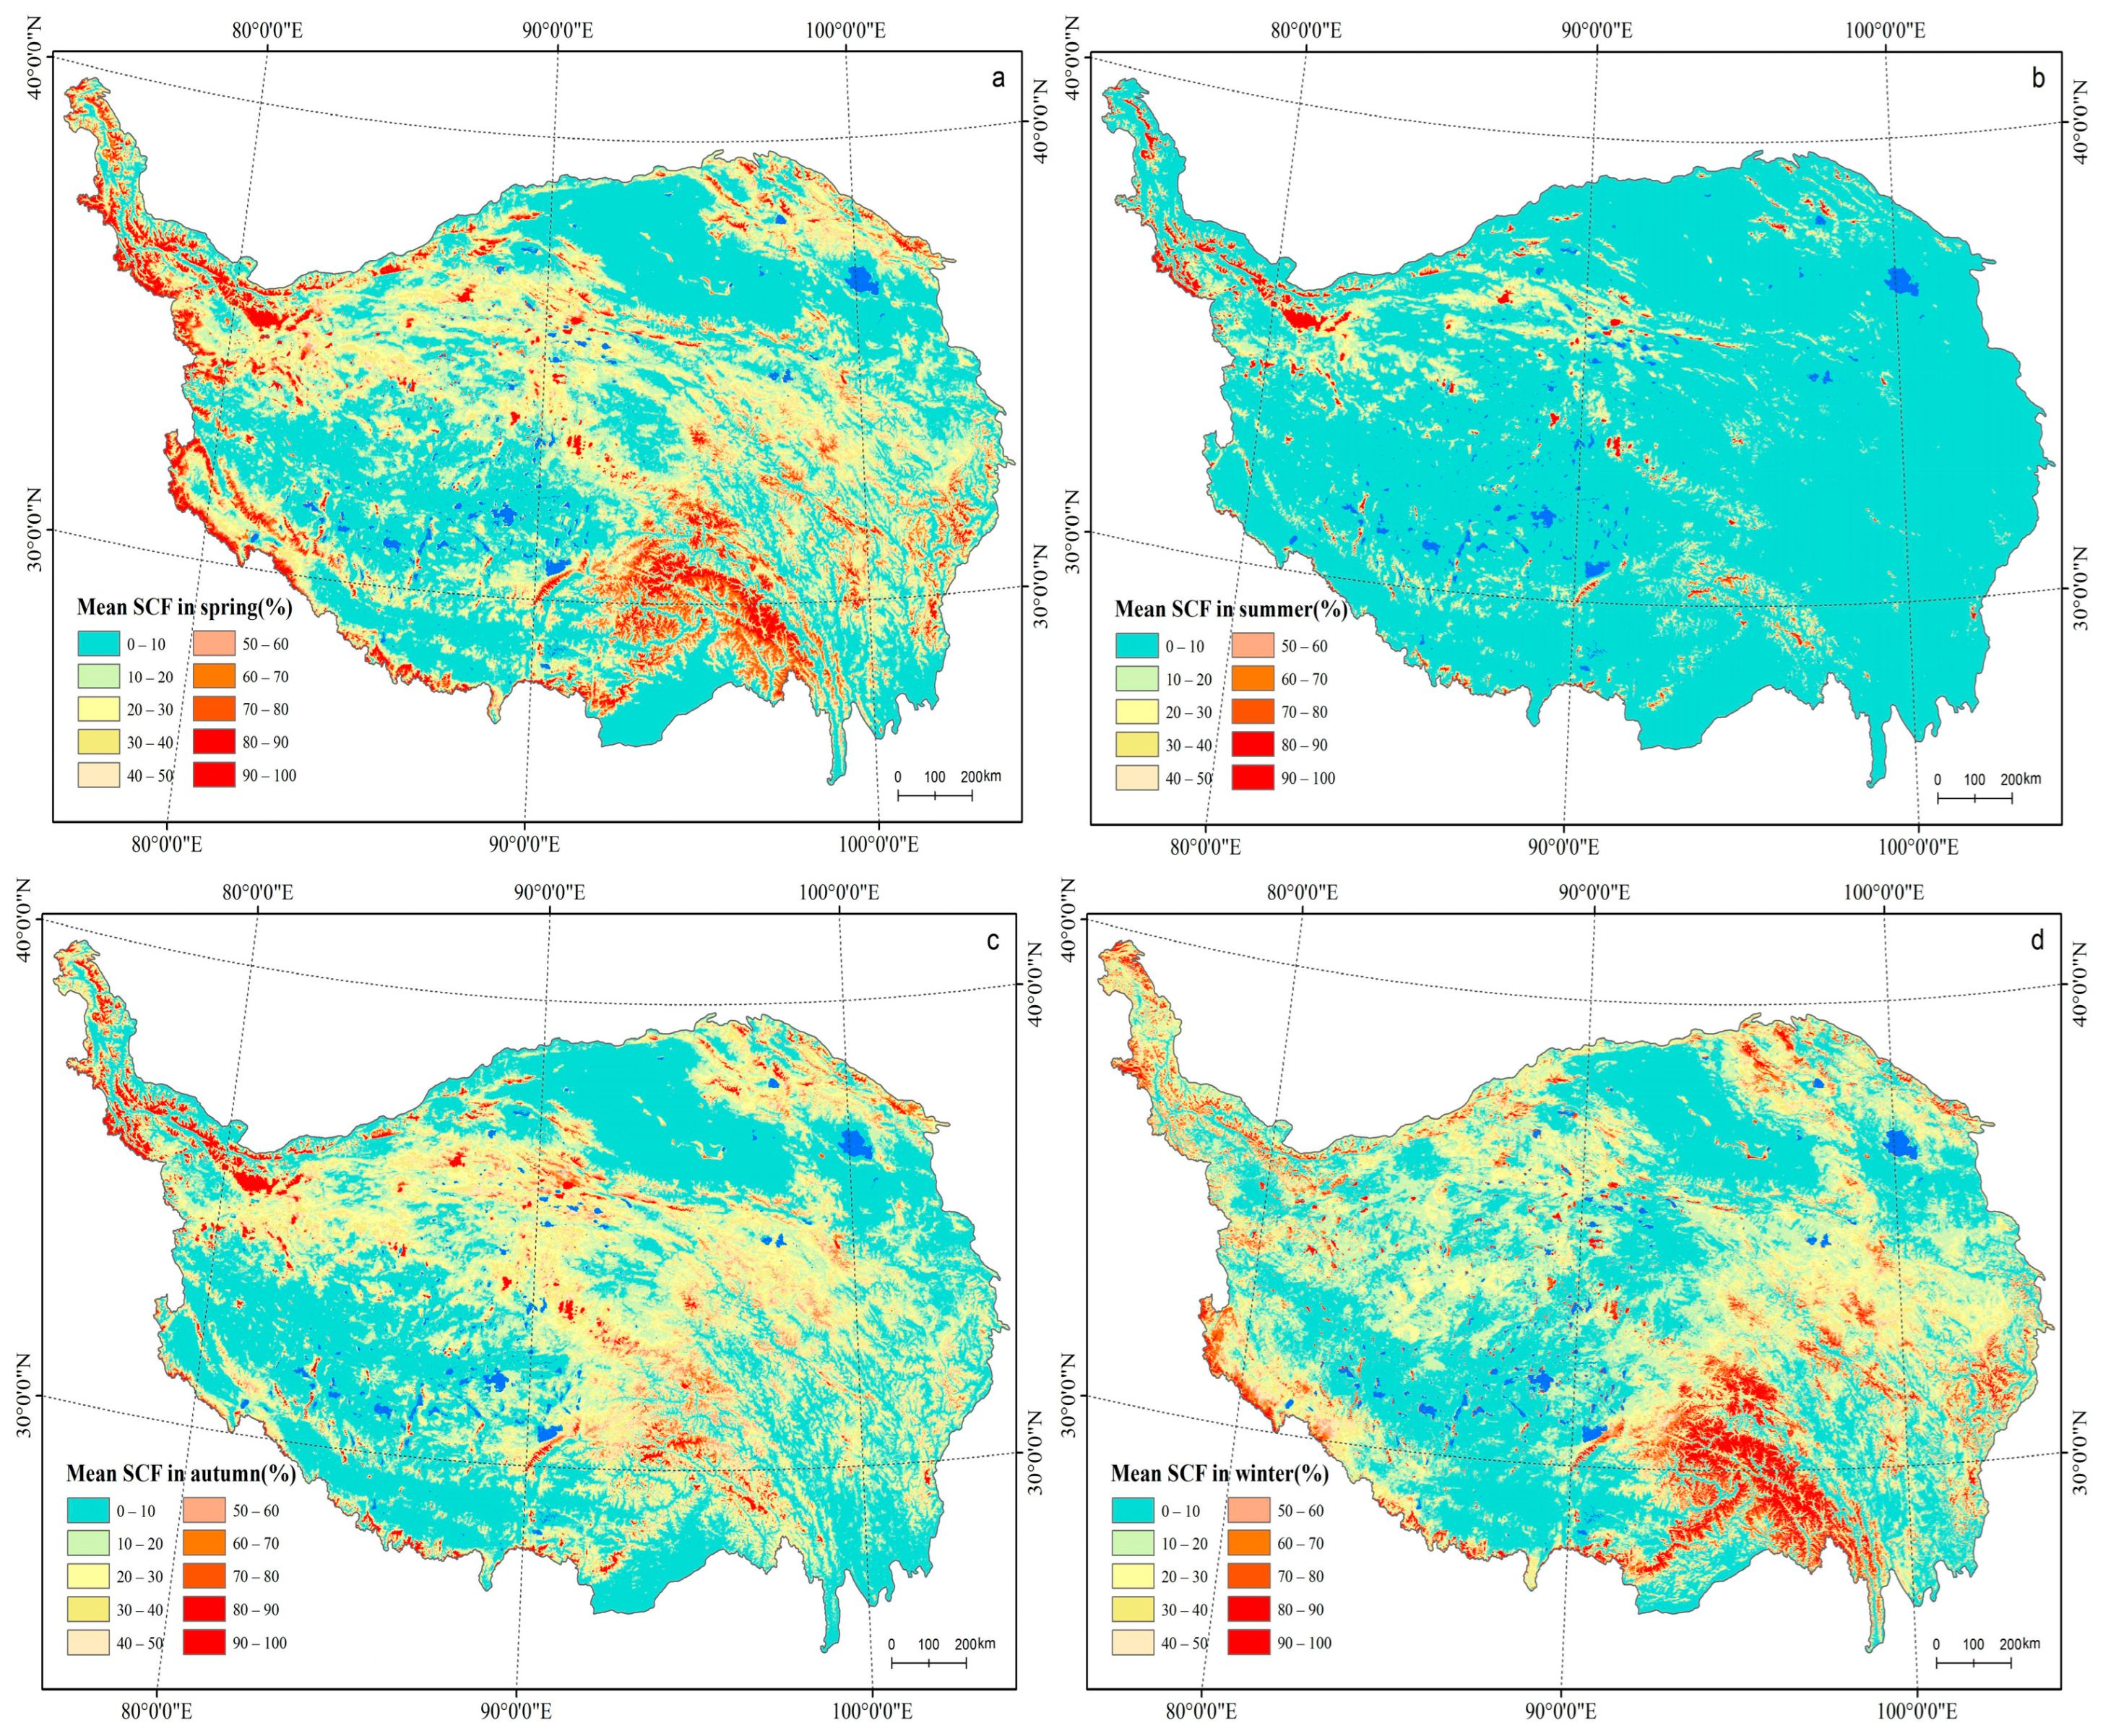
3.1.2. Mean SCF in Spring

The spatial distribution of mean SCF in spring is generally similar to annual mean SCF, which shows that SCF is high in the surrounding and interior high mountain ranges and low in the basin, the river valley, and the Qiangtang Plateau. The mean SCF in spring is 20.9%, which is the highest among the four seasons. As shown in Figure 4a and Table 1, the extent of high SCF areas in spring is obviously larger than the annual average. The area with the annual mean SCF > 50% accounts for 5.2% of total plateau area, while in spring it reaches 11.9%. Since spring is the transition season from winter type to summer type for the atmospheric circulation over the TP, with progressively enhancing warm moist flow from southern Asia, snowfall on the plateau increases considerably, bringing about more snow-cover occurrences on the TP.

3.1.3. Mean SCF in Summer

Summer is rainy season for the TP area, and the surface air temperature is above 0 °C. The snow-covered area on the plateau is very limited, and it only can be observed in the high mountain ridges and high altitudes where the temperature is below 0 °C, with a mean SCF of 5.4%. Karakoram Mountain in the northwest and Kunlun Mountain in the north both have higher snow-cover frequency relatively, as shown in Figure 4b.

3.1.4. Mean SCF in Autumn

Compared with summer, snow cover in autumn increases significantly and spatially, which shows that mean SCF is high in the surrounding and interior high mountain ranges, and very low in the basin, the valley, and the Qiangtang Plateau. In comparison with spring mean snow cover, a notable increase in mean SCF in autumn is found in higher latitudes on the Nyainqentanglha and Tanggula mountains and in the alpine area around the Anyemaqen and Bayan Har mountains in southern Qinghai, whereas the increase in SCF is not obvious in autumn at lower latitudes, such as the southwestern plateau and the Himalayas. Mean SCF in autumn is 17.5%, which is lower than mean SCF in spring, and this is primarily related to an unobvious increase in snow cover in the southern TP compared with spring, as shown in Figure 4c. Since autumn is the transition season from summer type to winter type for atmospheric circulation over the TP, with the decrease in temperature and cold air becoming more active from the north, the favorable conditions for snowfall and snow cover generate more snow-cover occurrences in autumn.

3.1.5. Mean SCF in Winter

As is the case with other seasons, winter snow cover on the TP shows high SCF in the surrounding and interior high mountain ranges and low SCF in the basins and river valleys. However, compared with spring and autumn, the major difference in winter is that the increase in SCF is obvious in alpine areas in the southeastern TP, especially in the alpine regions from the Nyainqentanglha to the Anyemaqen mountains and in the Himalayas, as shown in Figure 4d. The mean SCF in winter is 20.6%, which is almost the same as in spring. The area of mean SCF less than 10% accounts for 42.1% of the total TP area and this percentage is the lowest among four seasons due to more snow cover on the surface during the winter season. The main differences show that the increases in snow cover at low latitudes and the decline at higher latitudes are more obvious during the winter. In addition to the impact of high mountain topography, the spatial distribution of snow cover on the TP is also closely related to atmospheric circulation patterns over the plateau during the winter. The TP is primarily controlled by the westerlies in winter. Low-temperature conditions in the interior plateau and the high mountains are favorable for the persistence of snow cover on the surface, while the southeastern plateau is often disturbed by warm moist airflow from the south, which intersects with cold air from the north, forming weather systems that are conducive to snowfall.

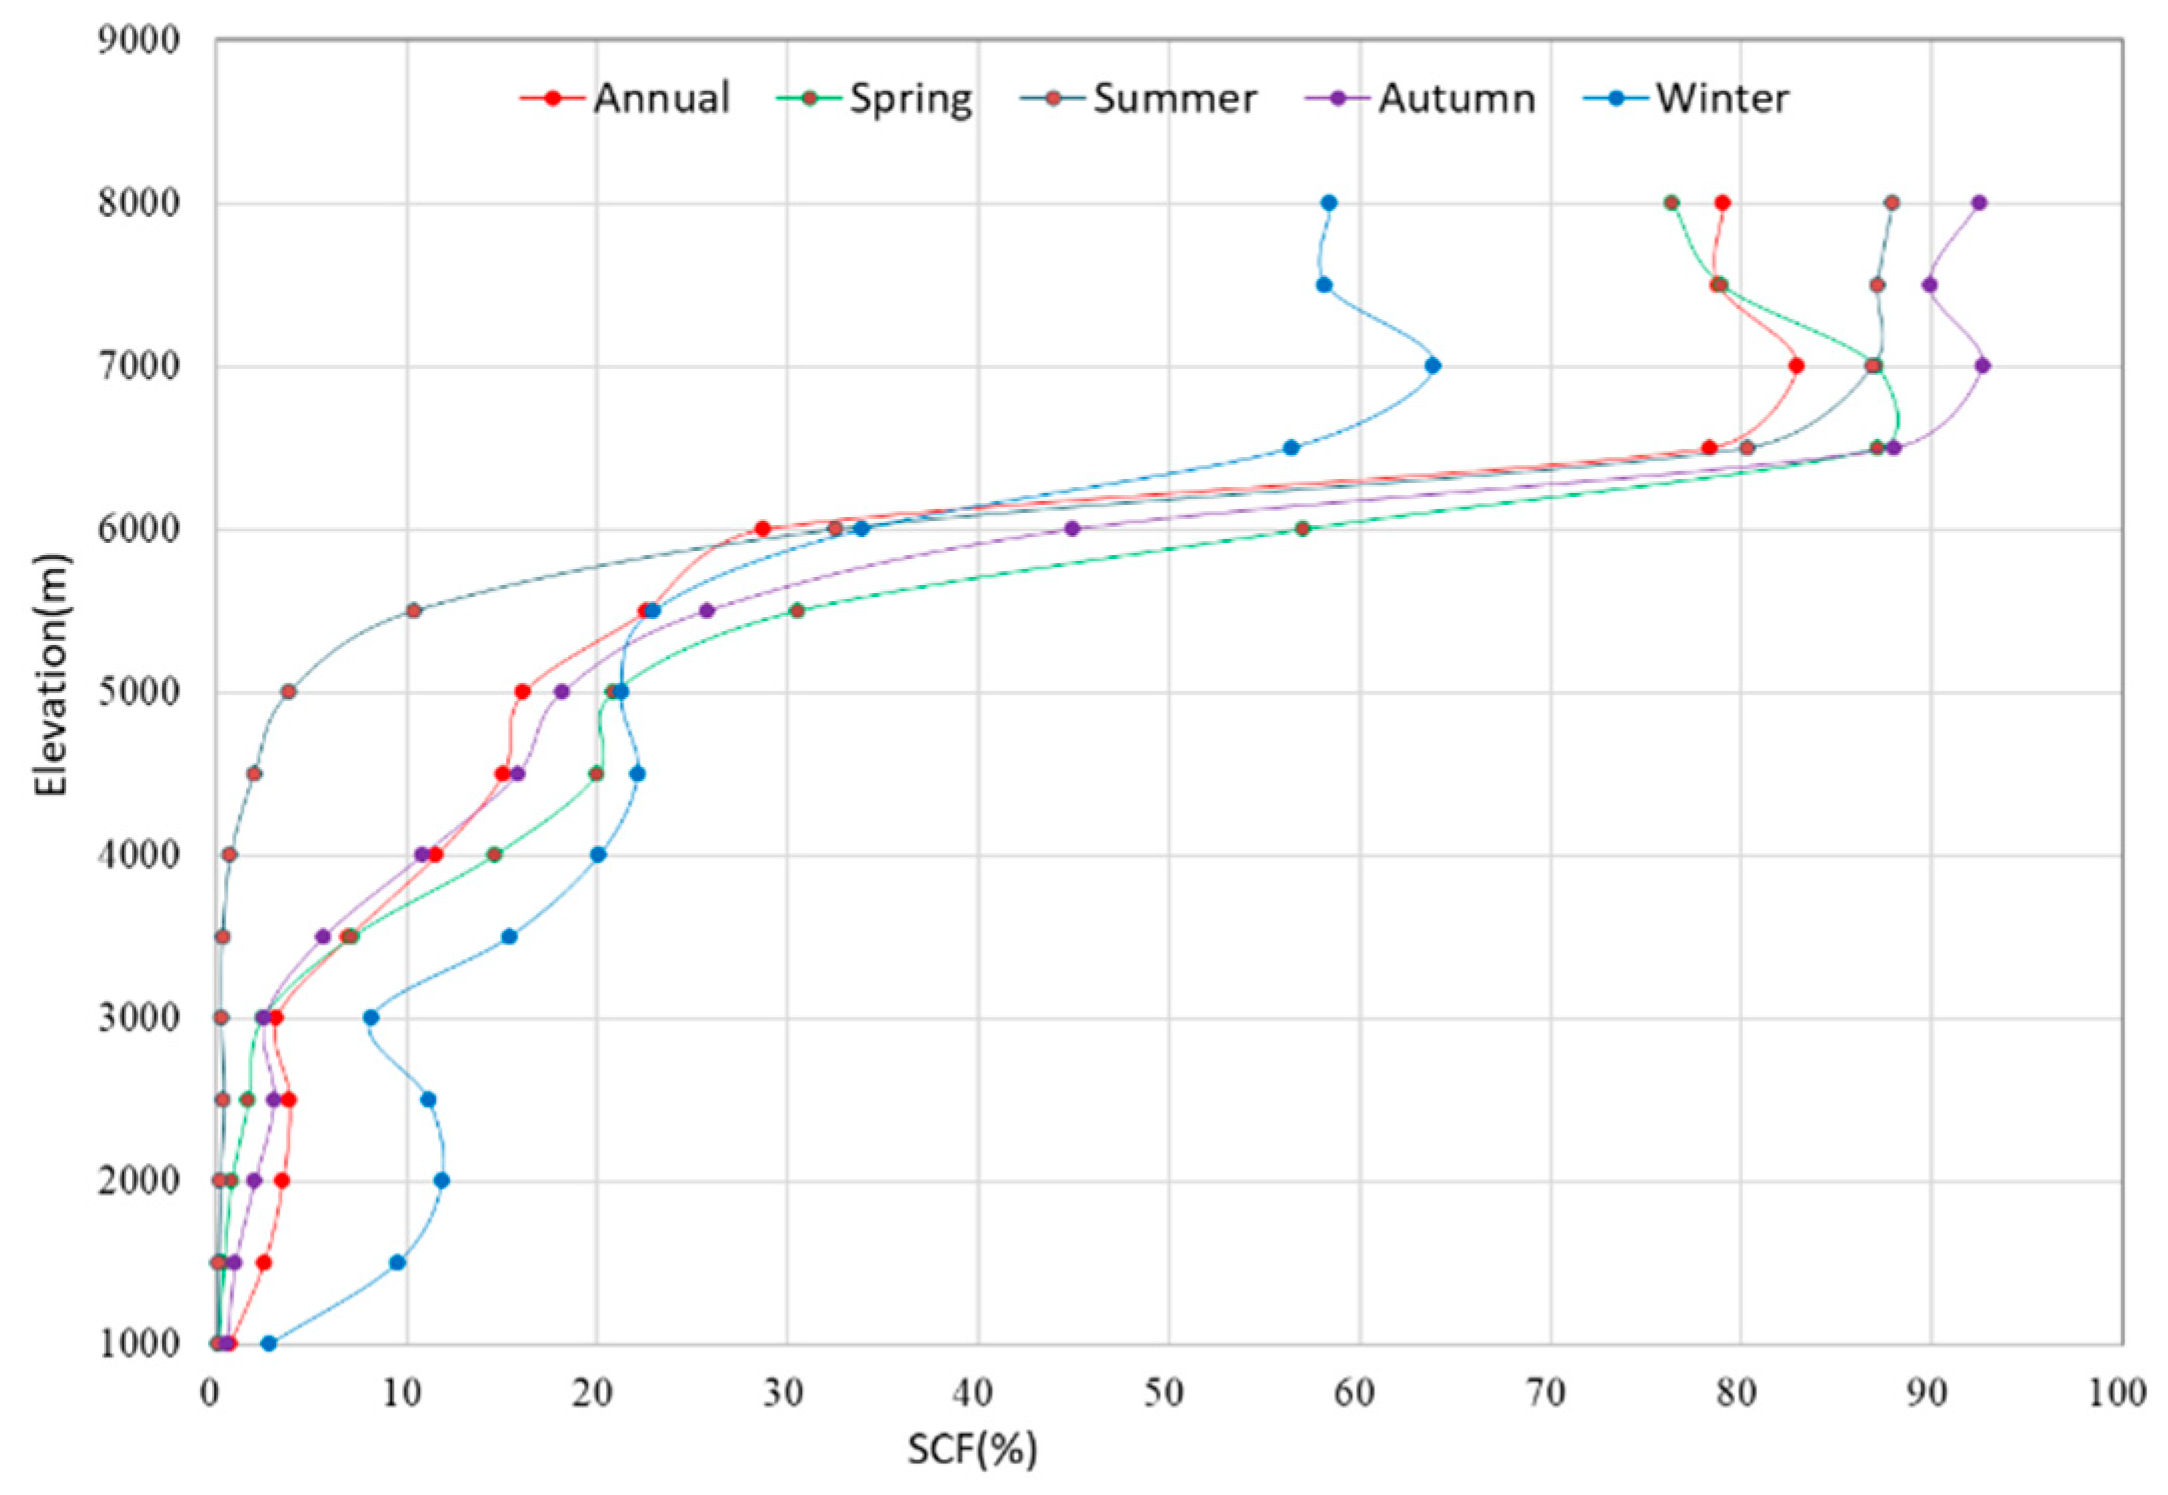
3.2. Snow Cover Distribution with Elevation

Elevation is the main topographic factor affecting the spatial distribution of snow cover on the TP. The spatial analysis shows that annual mean SCF below an altitude of 3 km TP is very low with less than 3.5%, while above 6 km altitude, it reaches 76.8% of the total area. There is a quick increase in mean snow cover between 5 and 6.5 km altitude. Snow-cover distribution is variable with elevation at different seasons. The hypsographic curve in Figure 5 shows that the spatial distribution of SCF with elevation in spring and autumn is similar, and, thus, the higher the altitude, the higher the SCF. The highest SCFs all appear in the area above 6 km altitude with a highest SCF of 86%, and the area below 3 km altitude is only a little covered by snow. The main seasonal difference in snow cover between 3 km and 6 km altitudes is that mean SCF in spring is slightly higher than that in autumn, and the highest difference is observed between 5 km and 6 km altitudes (up to 6%). The highest mean SCF in winter also occurs above 6 km altitude, but it is 32% lower than in spring and autumn. Compared with other seasons, in winter, the snow cover increases obviously at lower altitudes, especially in the area below 4 km altitude, which can be mainly attributed to the fact that low-temperature conditions are conducive to sustaining snow cover on the TP during winter. In summer, snow cover on the TP primarily appears at high altitudes above 6 km with SCF of 79.7% on average, while the area below 4 km elevation is only a little covered by snow.
In short, mean SCF on the TP increases with elevations in winter, except for in two elevation zones between 1–3 km. The area with an altitude of 1–2 km is mainly located in the south of the Himalayas. Warm and moist air coming from southern slope of the Himalayas and low temperature in winter often lead to more snow cover on the surface. However, a large area between 2 and 3 km elevation is the Qaidam basin in the north, and here there is less snow cover in winter, which results in differences in snow-cover distribution between the two elevation zones from 1 to 3 km.
The monthly mean snow cover on the TP with elevations is further calculated, and the result is shown in Figure 6. The coefficient of variation (CV) is given in Table 2. The CV is 1.3 in two zones below the altitude of 2 km, and with the increase in altitude, the CV steadily decreases, whilst in the elevation zone above 6 km altitude, the CV decreases to 0.2, which shows that the higher the altitude, the smaller the CV. This indicates that the higher the altitude, the longer the snow-cover duration on the surface, and the more stable the intra-annual snow-cover variation.
Monthly mean SCF in three elevation zones below 3 km are generally the same. Snow cover mainly occurs in three winter months, and SCF is the highest in January followed by December and February, while mean SCF in the summer months is the lowest with SCF < 1%. In three elevation zones, except for SCF in the 1–2 km zone being slightly higher than that of 2–3 km elevation zone in December and January, mean SCF shows that SCF increases with the elevation. Monthly snow-cover variation on the TP in snow season is characterized by the fact that the snow-cover extent starts to increase from September, with the higher the altitude, the more obvious the increase in the snow-covered areas. Mean SCF reaches a peak in January, and it then decreases rapidly until it reaches the lowest value in July. Mean SCF below 3 km altitude presents a typical unimodal distribution within the snow season, as shown in Figure 6a.
Mean SCF at an altitude of 3–4 km is considerably higher than that below 3 km altitude. In this elevation zone, snow cover starts to increase from September and reaches the highest in February, followed by a rapid decrease after March, and the lowest value is in July. Mean SCF variation in this elevation zone also shows a unimodal distribution within the snow season, as shown in Figure 6a. At an altitude of 4–5 km, the highest monthly mean SCF does not occur in winter months but rather in November with a SCF of 25.5%, followed by March with a SCF of 24.3%, and the next is February and January, respectively. The intra-annual variation presents a bimodal distribution, with two peaks in November and March, respectively, as shown in Figure 6b. Mean SCF at an altitude of 5–6 km is 25.4%, and monthly mean SCF increases remarkably at an altitude of 5–6 km, especially in the transition seasons (autumn and spring), whilst the monthly variation of SCF also shows a bimodal pattern.
The highest mean SCF on the plateau occurs in areas above an altitude of 6 km with 76.8%, and intra-annual variation in this zone also presents a typical bimodal distribution. At above 6 km altitude, the lowest mean SCF occurs in January with 48.0%, while two peaks are reached in May and October, with 90.8 and 90.6%, respectively. The spatial distribution of snow cover on the TP strongly depends on atmospheric circulation patterns, snowfall, and temperature conditions over the TP. Spring and autumn are transition seasons, causing more snowfall processes and snow cover in the high-altitude areas on the plateau. On the other hand, summer is the rainy season in the TP, but temperatures are low in alpine mountain regions above 6 km altitude and precipitation occurs in the form of snow at high-altitude regions, which provides favorable conditions for snow cover on the TP during summer. Low-temperature conditions due to high elevations with above 4000 m allow snowfall in any of the seasons, and snow cover can persist at higher-altitude regions during all seasons on the plateau [12]. Most of the continental glaciers in the TP are fed by snowfall during the summer season [46]. In winter, the TP is controlled by the westerly circulation, which is characterized by prevailing descending airflow and anticyclone, resulting in dry and continental climate with much less precipitation. Therefore, weather in the TP during the winter is almost fair and less snowfall events, except for plateau-scale disturbances and tropical cyclone from the Bay of Bengal that bring heavy snowfall in the TP. Snow sublimation under strong insolation and snow blowing due to strong winds further contributes to decreases in SCF during winter [22]. Sublimation contributes significantly to decreases in SCF during the winter, especially in the areas with thin snow cover. More than half of the snow mass is lost by sublimation in winter [11,47]. Therefore, the lowest mean SCF above 6 km elevation occurs in winter rather than in summer.

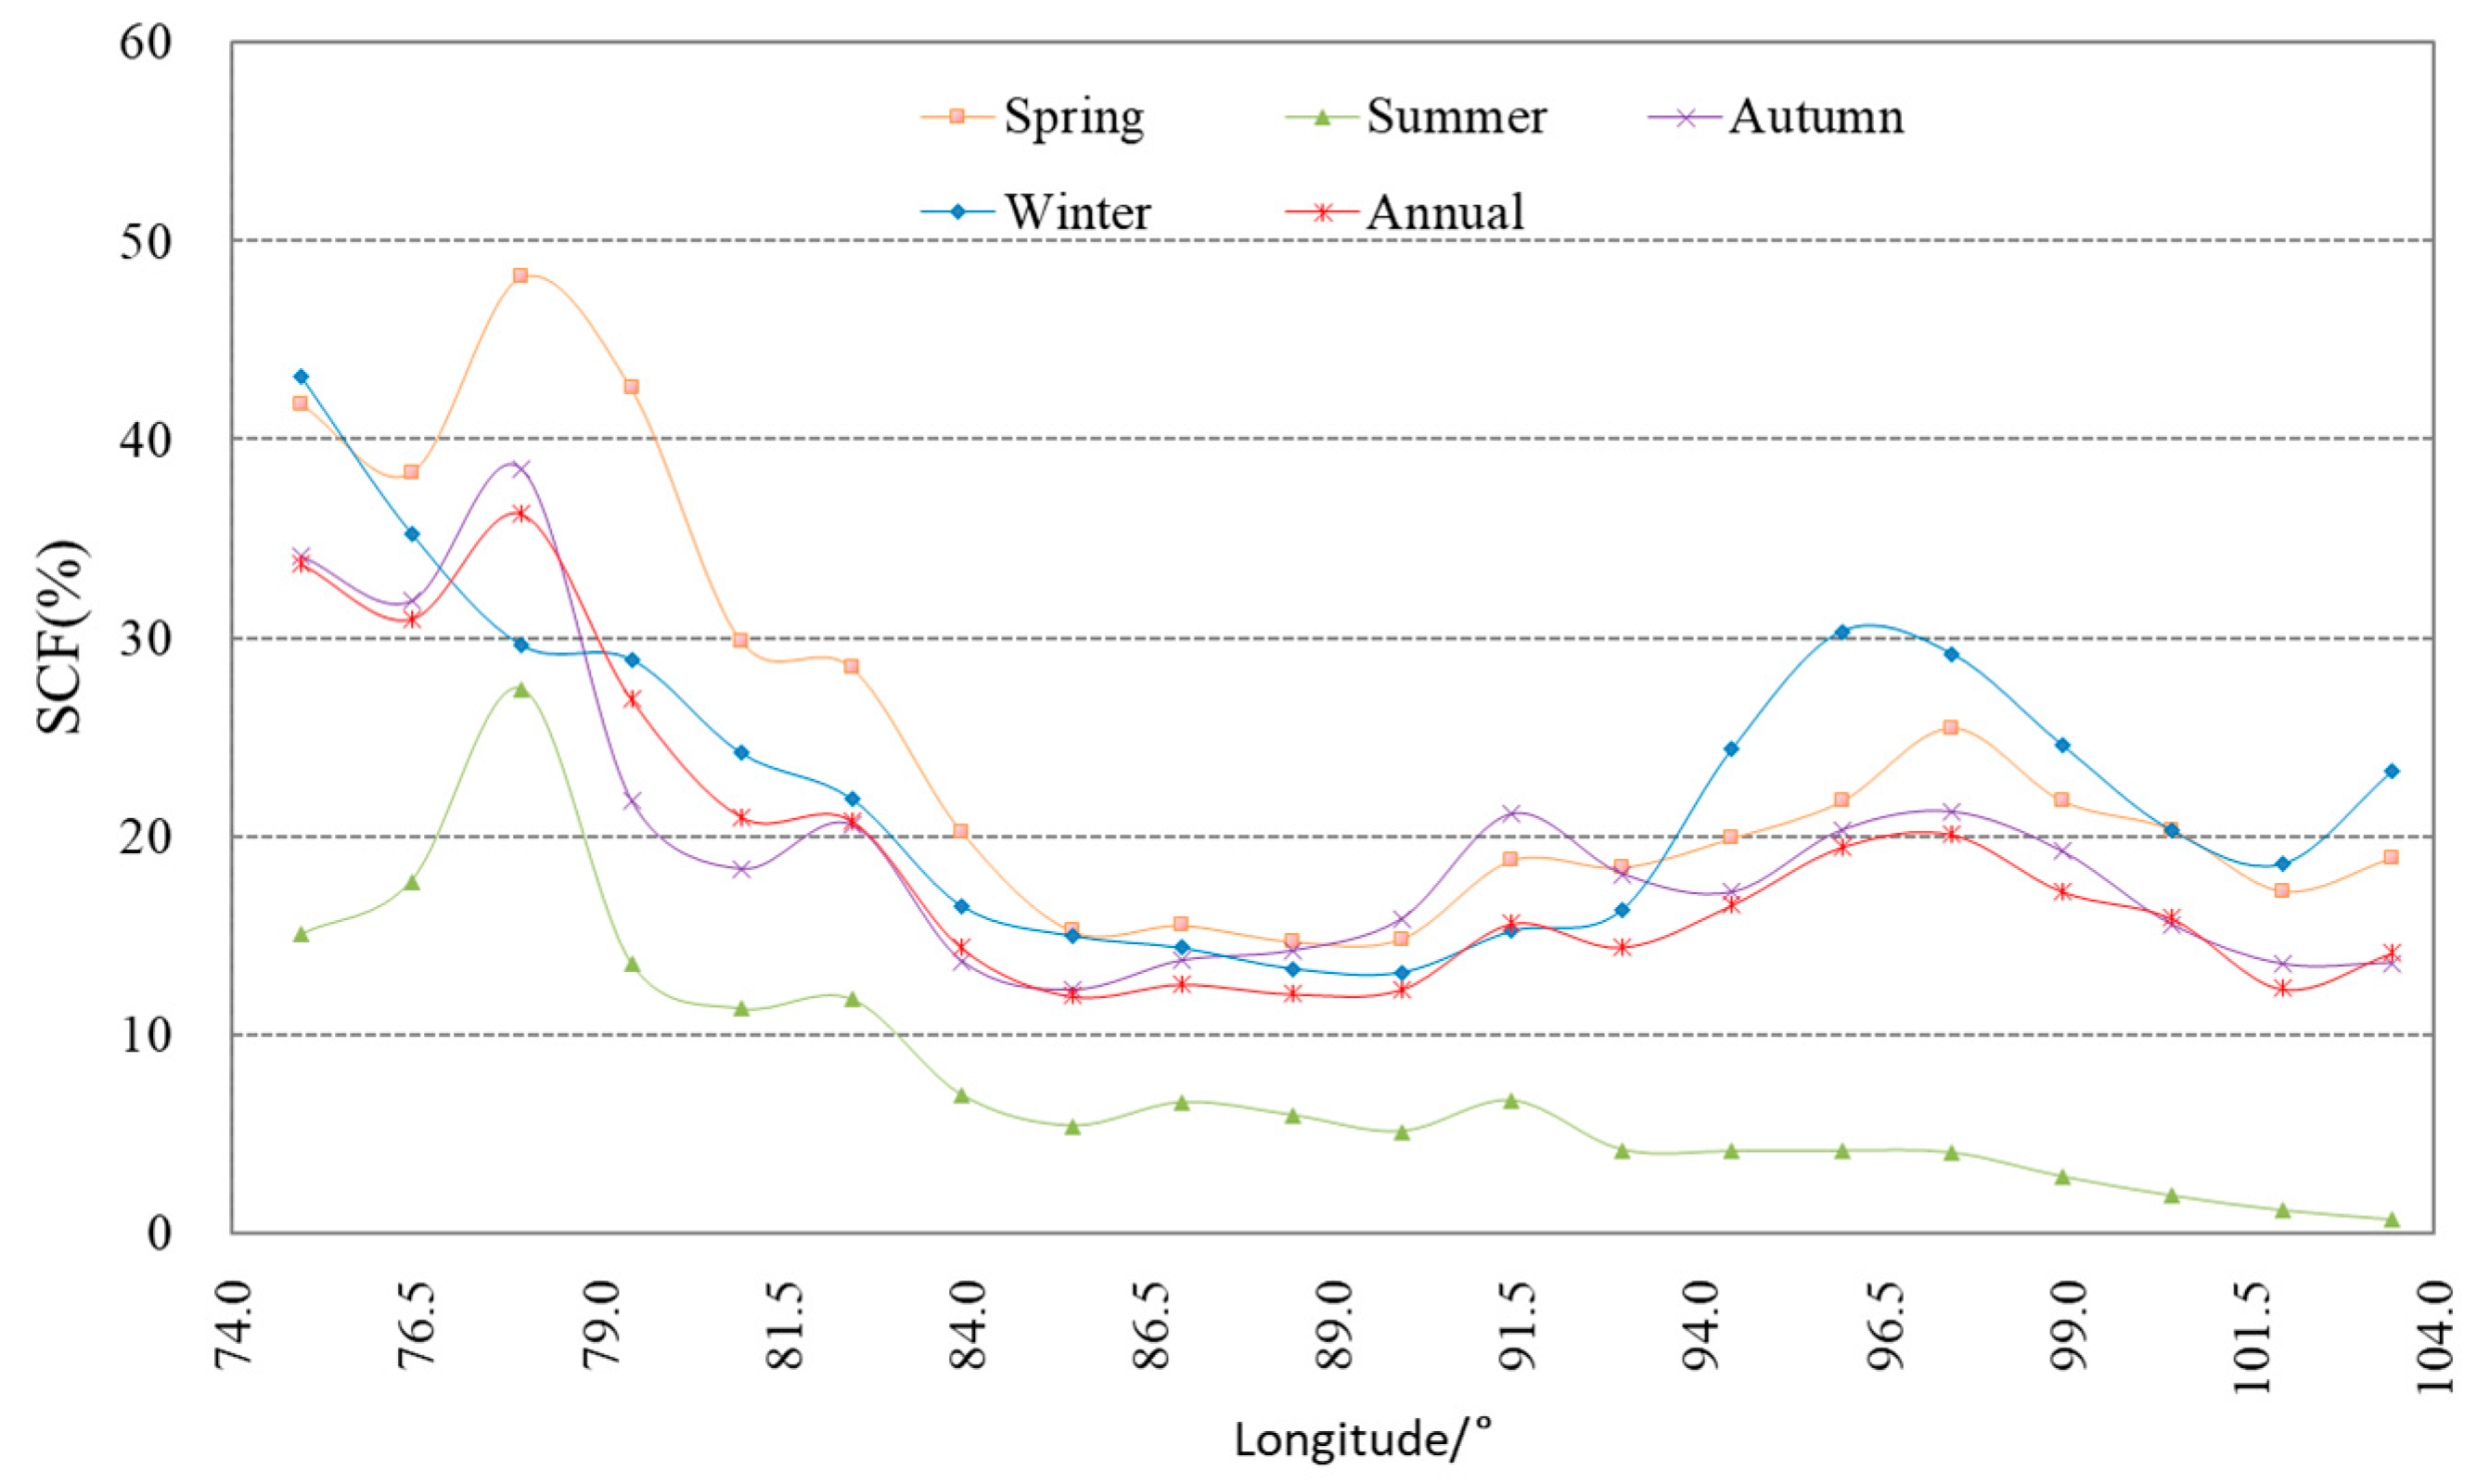
3.3. Snow Cover Distribution with Longitude and Latitude

The spatial distribution of snow cover on the TP is affected by geographical latitude and longitude as well through influencing the solar radiation and water budget on the ground. Generally, this shows that solar radiation received on the surface of the earth decreases with increases in latitude, which is in favor of snow-cover persistence on the land surface. The precipitation amount in the TP decreases from the southeast to the northwest, which means that the southeast is more conducive to snowfall and snow cover.
As displayed in Figure 7, the longitudinal distribution of snow cover on the TP is characterized by the higher snow cover frequency in the west and the low snow cover frequency in the central and eastern parts of the TP, with obvious seasonal differences between the east and the west. The higher SCF is more distinct in the west in spring, while it is more obvious in the east during the winter. In summer, over 10% of annual mean SCF in the northwest of the TP is caused by the perennial snow and ice in the Karakoram and western Kunlun mountains. In winter, the highest mean SCF occurs on the western margin of the TP with over 40%, which is mainly due to westerly disturbance during the winter season.
The latitudinal distribution of snow cover on the plateau generally shows that the increase in snow cover with latitude is more obvious in the north and the south, but this characteristic is not apparent in the central plateau. The increase in snow cover is more obvious in the south during spring and winter, whereas it is more evident in the north during winter (Figure 8). The areas with more than 10% of mean SCF in summer at high latitudes are mainly found in the western Kunlun and Karakoram Mountains, where glaciers and perennial snow cover are located. In the TP, the increase in snow cover with latitude is obvious around below 30.5° and above 38.5°, but it is not prominent between these two latitudes due to more heterogeneity of snow-cover distribution. In short, in comparison with topographic factors, such as elevation and regional climatic conditions, the dependence of SCF on latitude and longitude is very weak in the TP area.

3.4. Snow Cover Distribution with Aspect

In addition to elevation, aspect, which represents the orientation of slope face, is an important constituent of topography that affects the spatial distribution of snow cover on the mountain regions by altering local solar radiation and moisture conditions. Snow-cover distribution on the TP with aspects and on the flat terrain are shown in Figure 9 and Table 3, and they show a bimodal distribution in four aspects within the year. In January, mean SCF on the south-facing aspect is the lowest (16.7%), and it is the highest on the north-facing aspect with 23.9%. After January, snow cover on all aspects increases and the first peak in the year occurs in March, with the highest SCF on the north-facing aspect (25.9%) and the lowest on the south-facing aspect (19.3%). Snow cover shows decreases from March, and it reaches the lowest value in July. Snow cover starts to increase from August and shows rapid increase from September on the different aspects until November, when it reaches the second peak in the year, with little difference from the first peak in spring in terms of peak size.
In contrast, snow-cover distribution on the flat terrain without aspects is remarkably lower than that with aspects, as shown in in Figure 9, and its intra-annual variation presents a unimodal distribution that is larger in winter, lower in summer, and intermediate in spring and autumn of the transition seasons. Similarly, except for the least snow cover occurring on the flat land without slope orientation, the SCF on the north-facing slope is the highest, and it is the lowest on the south-facing slope. The spatially different snow cover distribution on the aspects in the mountain regions is closely related to the redistribution effect of slope orientation on the hydrothermal condition in the TP. As we know, south-facing aspects receive more solar radiation, which often enhance snowmelt, resulting in less accumulation on these aspects. However, snow cover on the north-facing areas receives less insolation and thus melts slower than on the south-facing areas [30,31]. On the other hand, strong insolation prevails throughout the year due to the low latitude. Sublimation under strong insolation contributes significantly to decreases in SCF on the plateau, especially for the areas with thin snow cover [11,12]. The north-facing aspect receives much less radiation and low sublimation, which is favorable for sustaining snow cover on the surface. All these characterize that the high terrain of the plateau affects spatial distribution and temporal variation of snow cover through the changing radiation balance and redistribution of hydrothermal conditions in the mountain regions.

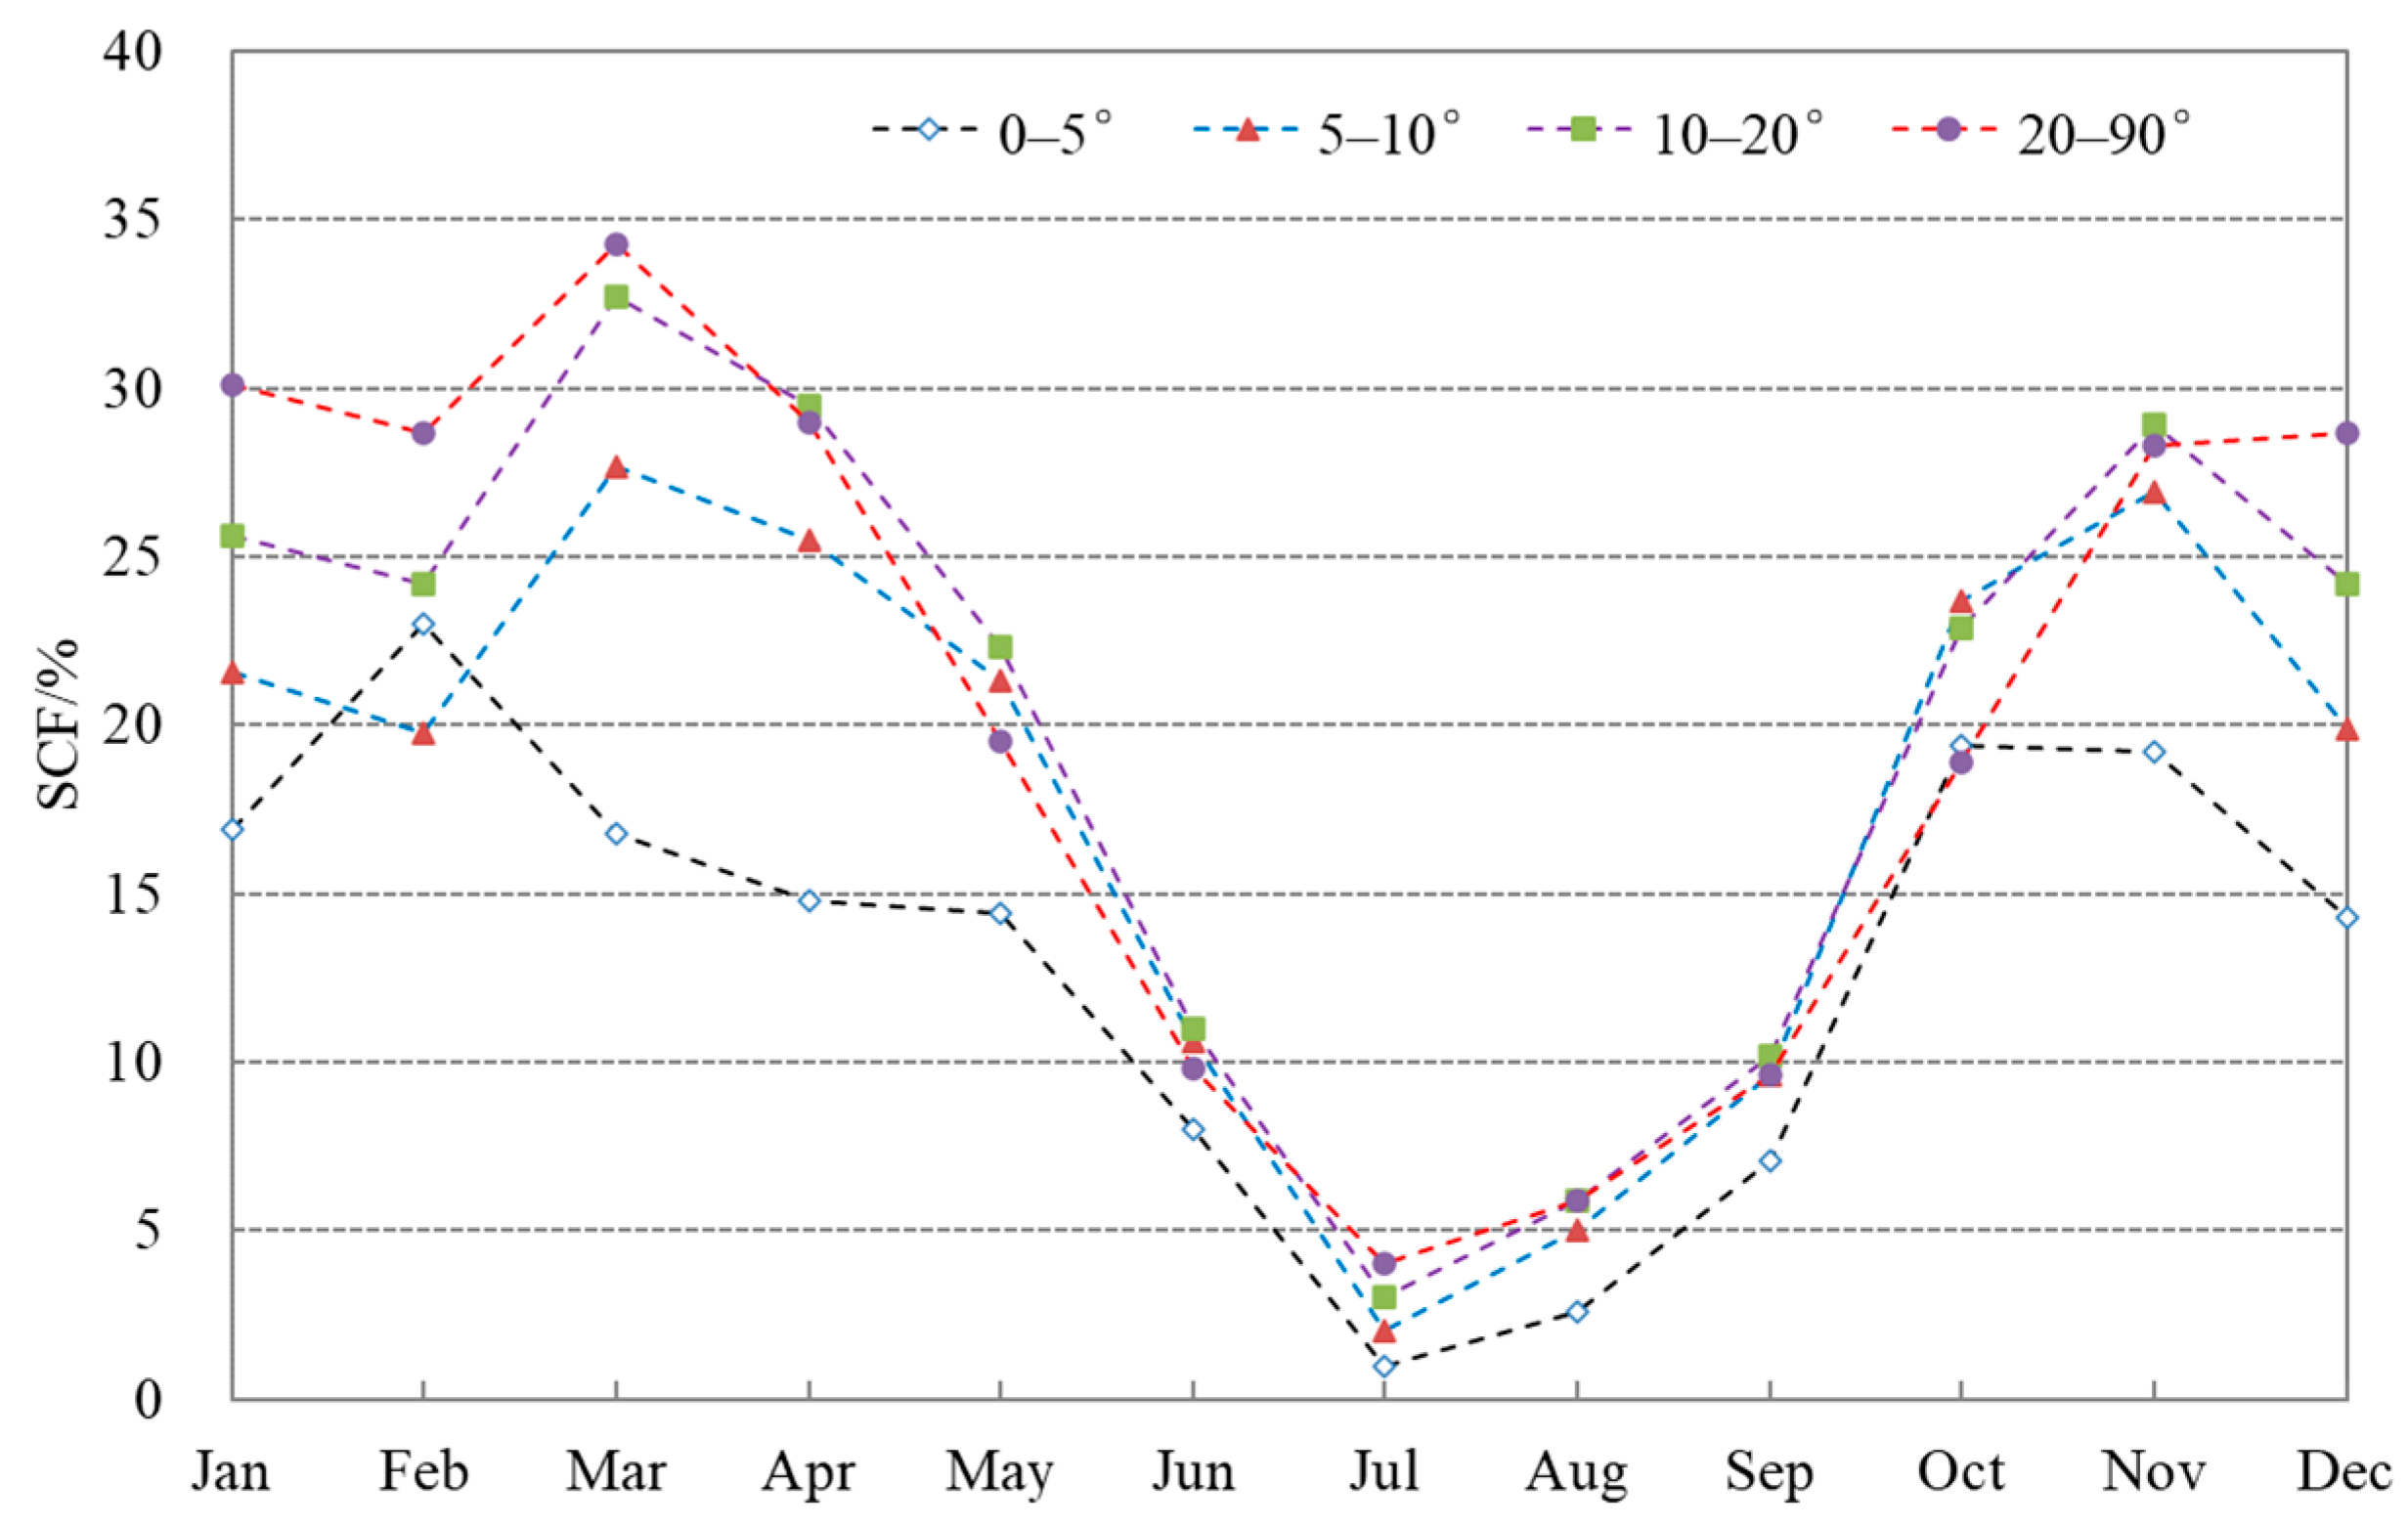
3.5. Snow-Cover Distribution with Slope

The monthly and seasonal snow cover distribution on the mountain slopes of the TP is shown in Table 4. It shows that the SCF on the slope below 5° is 16.9% in January, and that it reaches the first peak in February within the year with 23.0%. After that, SCF slowly decreases in the months of spring and reaches the lowest level in July, while its second peak appears in October with 19.4%. The intra-annual variation shows a typical bimodal distribution, as shown in Figure 10. Monthly variation of snow cover on three slope zones above 5° is similar to that slope below 5°, as described above, with all presenting bimodal distribution, but the timing of the peak occurrence is delayed by a month (in March and November, respectively). The mean SCF on the slope above 20° is 30.1% in January, and the peak is in March with 34.3%. Snow cover increases with the slope in the months of winter and spring, while it is not obvious in other months. Moreover, on the higher slopes, the decreasing rate of snow cover from the peak in March to the lowest level in July is faster than that on the lower slopes, whereas the differences in the increasing rate of snow cover from July to November are not noticeable on the different slopes.
In terms of annual average, the SCF on the slope below 5° is the least among the four slope zones, with an annual average of 12.7%, and it presents that the SCF increases with the terrain slope. Annual mean SCF on the 5–10° slope zone is 18.4%, while the highest mean SCF of 21% is found on the slope zone above 20°. In terms of the seasonal distribution of snow cover on the slope, the SCF on the slope below 5° is the lowest, and in spring, the snow cover on the 10–20° slope zone is the highest, with SCF of 28.1%. In autumn, the highest SCF appears on the slope zones between 5–20° with around 20%, and in summer, the highest SCF appears on the 10–20° slope zone. In winter, the highest SCF appears on the slope zone above 20° with SCF of 30.4%. In conclusion, in different slope zones, annual and seasonal mean SCF on the slope below 5° are the lowest, and this shows that the SCF is higher on higher slope during winter and spring, but that it is not prominent in other seasons.
Based on the analysis above, the spatial distribution of snow cover on the four aspects along the different slopes is further investigated. On the north-facing aspect, snow cover with a slope less than 5° is much smaller than that of the other slopes, and its intra-annual variation is relatively smooth compared with the other slopes. As given in Table 5, mean SCF in January is 17.2% for slopes below 5°, while it reaches 41.9% for slopes above 20°, and it is 25.4% and 33.4% for slopes below 5–10° and 10–20°, respectively. The monthly SCF on the slope below 20° shows a bimodal distribution, with two peaks in November and March, respectively, and the higher the slope, the more typical the bimodal patterns. However, on the slope above 20°, mean SCF presents a unimodal distribution that it is high in winter, low in summer, and intermediate in spring and autumn, as shown in Figure 11. On the north-facing aspect, there is a pattern that the higher the slope, the higher the snow cover frequencies in winter and spring, but this is not obvious in other seasons. In the snow season, there is no noticeable difference in snow cover on the different slopes between the rapid snow accumulation period from September to November and the rapid melting season from March to July in the TP.
On the east-facing aspect, mean SCF on the different slope zones is less than that of north-facing aspect. The mean snow cover on the slope below 5° is 16.3% in January and is 19.8% in October as the maximum, while snow cover on slope above 20° is 28.3% in January, and the maximum occurs in March with 32.4%. On this slope, snow cover on the slope above 20° increases rapidly from September to November, followed by a slow increase until March, and after reaching an annual peak in March, snow cover then rapidly decreases, which shows a unimodal distribution for intra-annual variations. On other slopes, intra-annual variation in snow cover presents a bimodal distribution and two peaks generally appear in November and March, and the greater the slope, the more obvious the bimodal distribution pattern. In the snow season, there is no distinct difference in snow-cover variation on different slopes during the snow accumulation period before the peak in autumn and the melting period after the peak in spring. The greater the slope, the more abundant the snow cover on the slope, and it is only found in the winter season.
On the south-facing aspect, mean SCF on the different slope zones is less than that of other aspects. Mean SCF on the slope below 5° is 15.9% in January and the maximum is 18.5% in October, while on the slope above 20°, it is 19.4% in January, and the maximum reaches 26.4% in March. Monthly mean SCF on the different slope zones on the south-facing aspect present a bimodal distribution, and two peaks on the slope below 5° appear in October and February, while on the slope zones above 5°, the two peaks occur in November and March, which means that intra-annual SCF peaks occur one month later on the higher slope zones (Table 5 and Figure 12). Moreover, the higher the slope, the higher the mean SCF that is only found in winter and early spring, whereas this pattern is not obvious on the different slope zones during the periods of snow accumulation and snow melting.
On the west-facing aspect, mean SCF on the different slope zones is higher than that of southward aspect, but it is lower than that of the northward aspect and slightly higher than that of the eastward aspect. The intra-annual variations in snow cover on the westward aspect are similar to that of the other slope directions, showing that SCF on the slope zone below 20° presents bimodal distribution, while on the slope zone above 20°, it presents unimodal distribution. On the westward aspect, monthly SCF on the slope zone below 5° is lower than that of the other slope zones, and two peaks occur in February and November with 19.2% and 20.6%, respectively, while the peaks on the other slope zones occur in March and November with 36.9% and 30.1% on the slope zone above 20°, respectively. On the westward aspect, the greater the slope, the more abundant the snow cover that is only observed in winter and early spring, but this pattern is not obvious on the different slope zones during the periods of snow accumulation and snow melting.
In a word, on the different aspect in the TP, mean SCF on the slope below 5° is the least, along with smoother intra-annual variations compared with other aspects. On the different slope zones, mean SCF on the northward aspect is the highest, while it is the lowest on the southward aspect, and it is intermediate on the westward and eastward aspects, with slightly higher mean SCF on the westward aspect than eastward aspect. Monthly mean SCF on the slope zones above 20° presents a unimodal distribution on the northward, eastward, and westward aspects, while on the southward aspect, it shows a bimodal distribution. On the different aspects, the higher the slope, the higher the SCF observed in winter and early spring, but this pattern is not obvious on the different slopes during the periods of snow accumulation and snow melting.

4. Discussion

Snow accumulation and loss is primarily controlled by atmospheric conditions, elevation, and slope of the terrain. Atmospheric processes of interest are precipitation, deposition, condensation, turbulent transfer of heat and moisture, radiative exchange, and air movement [32]. In the mountain regions, mountain ranges interrupt the wind and redistribute snow cover. Slope and aspect both influence incoming solar radiation and humidity, while latitude and elevation largely control air and ground temperature. The strong westerly winds blow the snow, and they tend to transfer the snow into the valleys and decrease the total SCF [22]. Sublimation contributes largely to decreases in SCF during the winter, especially for the areas with thin snow cover [22,47]. More than half of the snow mass is lost by sublimation in winter [47]. The distribution of the SCF over the mountainous areas varies with the terrain features, such as elevation, slope, and aspect in the local areas, and the elevation of the terrain has a decisive role in snow accumulation. The spatiotemporal changes of snow cover in the mountain regions have strong altitude dependence, which is related to variations in radiation and energy balances, and, potentially, to different accumulation regimes caused by windward/leeward effects [30,31].
Topography has a major effect on the weather and climate in the Himalayas, and elevation and aspect therefore play important roles in the snow-cover distribution [32,33]. Snow-cover changes in the HKH region are highly variable because of various types of controlling factors, including topographic effects, glacier dynamics, and various types of geomorphological parameters, generally showing altitudinal dependent [33]. Snow cover clearly shows a sharp jump in snow-cover percentage between 5000 and 6400 m in elevation [35], which is consistent with the hypsographic curve shown in Figure 5. The spatiotemporal snow cover variability across the HKH region is strongly influenced by topography because the topography has a strong effect on snow accumulation and melting [32,34].
The spatial distribution of snow cover on the TP is strongly controlled by the interactions between complex terrains and available moisture sources [12,20,22,23,48]. The most persistent snow occurs in the southern and western edges of the TP within large mountains [22]. The spatial distribution of snow cover on the TP corresponds well with the high mountains, including the Kunlun, Karakoram, Himalayan, Qilian, and Tanggulan mountain ranges [47,48,49,50,51,52,53,54,55], which is consistent with the findings in this study. Snow cover on the TP shows altitudinal dependence, and the length of the snow-covered season appears to be decreasing at lower elevations because of the increase in air temperatures. However, at higher elevations, the increase in precipitation appears to compensate for the increase in air temperature such that the snow-free period has decreased. Snow-cover distribution is generally precipitation-driven at high elevation sites but temperature-driven in the low altitudes [36]. However, compared with elevation, the role that latitude and longitude play in snow-cover distribution on the TP area is quite limited.
In addition, the south-facing aspects receive more solar radiation and have higher temperatures, neither of which are favorable factors for snow cover and accumulation on the surface, and causes the lowest mean SCF to be observed on the south-facing aspects. However, due to mountain shadowing effects, the north-facing areas receive less insolation and solar radiation, along with the lower temperature and sublimation associated with them, making snowmelt slower and increasing snow-cover duration. Therefore, the highest mean SCF is found in the north-facing aspects. The spatial distribution of snow cover on the TP generally shows that the higher SCF corresponds well with the high mountain ranges and strong elevation dependence.

5. Conclusions

The overall spatial distribution of snow cover on the TP and the impact of topographic factors (elevation, slope, and aspect) on snow-cover distribution are analyzed based on MODIS snow-cover products and DEM data using GIS spatial analysis techniques. The main results are as follows:
(1) Snow cover on the TP is spatially very uneven. It is characterized by rich snow and high SCF in the surrounding and interior high mountains, and by less snow and low SCF in the inland basins and river valleys. The Nyainqentanglha and its eastward extending mountain ranges in southeastern Tibet as well as the high mountain regions in the northwestern TP comprised of the Karakoram and western Kunlun mountain ranges and the western Himalayas are the two regions that have the highest SCF in the TP, whereas the Qaidam basin in the north and the southern Tibet valleys are the two areas with the least SCF. Annual mean SCF on the TP is 15.7%, with the same snow-cover rates in spring and winter (21%), followed by autumn (17.5%), and with the least in summer (5.4%).
(2) Snow cover on the TP shows strong elevation dependence, and the higher the altitude, the higher the SCF, and so the longer the snow cover duration, and the more stable the intra-annual variation. In the TP, the high-mountain and low-altitude regions are in good agreement with more and less SCF. In the areas below 3 km altitude, mean SCF is less than 4%, while it reaches 76.8% above 6 km altitude. In the areas below 4 km altitude, the intra-annual variation of snow cover shows a unimodal distribution, while in the areas above 4 km altitude, the intra-annual variation of snow cover presents a bimodal distribution. At altitudes below 6 km, the lowest SCF occurs in summer, whereas ir occurs in winter above 6 km.
(3) Mountain slope is another important topographic factor affecting the spatial distribution of snow cover in the TP, and it generally shows that snow cover increases with the slope increasing. Annual mean SCF on the slope zone below 5° is the lowest (12.7%), while on the slope above 20°, it reaches 21.0% as the highest value. The intra-annual variation of snow cover on different slope zones presents a bimodal distribution pattern.
(4) Mountain aspects influence the spatial distribution of snow cover on the plateau through changing hydrothermal conditions between the land and the atmosphere on the TP. Snow cover on the north-facing aspect is the highest due to receiving less solar radiation and low temperature, while it is the lowest on the south-facing aspect under strong insolation and higher temperature. Snow cover on the flat terrain without orientation of slope is less than that with aspects, and its intra-annual variation shows a unimodal distribution. Sublimation under strong insolation due to the low latitude and increased sublimation of snow associated with the high winds greatly contributes to decreases in snow cover on the TP, especially during the winter season. In comparison with topographic factors, the dependence of SCF on latitude and longitude is very weak in the TP area.
(5) The accuracy of remote sensing snow-cover products is crucial to capture a clear picture of the spatiotemporal snow-cover condition in the mountain regions. Previous studies have shown that the accuracy of MOD10A2 is over 90% under clear-sky conditions. In this study, MODIS product v005 is used, and the accuracy evaluation made previously is also based on the MODIS snow-cover product v005. Currently, new MODIS snow-cover products (v006 and v061) have been released for use globally. However, there is a lack of systematic accuracy evaluation for the latest MODIS products. Our preliminary accuracy assessment shows that new MODIS products (v006 and v061) tend to overestimate snow cover on the TP, and visually found that many water bodies, such as rivers in the TP, are misidentified as snow cover pixels, largely due to the NDSI > 0 that is used as the snow-cover mapping algorithm in the latest versions of MODIS products. Therefore, the accuracy evaluation of the latest versions of MODIS snow-cover products should be carried out carefully on the TP, and more consistent and longer time-series MODIS snow-cover products are expected to be developed for use in the future.

Author Contributions

D.C. processed the data and wrote the manuscript; L.L. and Z.W. reviewed and edited the manuscript. All authors have read and agreed to the published version of the manuscript.

Funding

This research work was financially supported by the Second Tibetan Plateau Scientific Expedition and Research (STEP) programme (2019QZKK0603; 2019QZKK010312), the Independent Research Project of Science and Technology Innovation Base of Tibet Autonomous Region (XZ2021JR0001G), the Key Science and Technology Project of Tibet Autonomous Region (XZ202201ZD0005G01), and the National Natural Science Foundation of China (41561017).

Acknowledgments

The authors would like to acknowledge the U.S. National Snow and Ice Data Center (NSIDC) for providing the MODIS snow cover product (MOD10A2).

Conflicts of Interest

The authors declare no conflict of interest.

References

  1. Barnett, T.P.; Adam, J.C.; Lettenmaier, D.P. Potential impacts of a warming climate on water availability in snow-dominated regions. Nature 2005, 438, 303–309. [Google Scholar] [CrossRef]
  2. Armstrong, R.L.; Brodzig, M.J. Recent Northern Hemisphere snow extent: A comparison of data derived from visible and microwave satellite sensors. Geophys. Res. Lett. 2001, 28, 3673–3676. [Google Scholar] [CrossRef]
  3. Allchin, M.I.; Déry, S.J. A spatio-temporal analysis of trends in Northern Hemisphere snow-dominated area and duration, 1971–2014. Ann. Glaciol. 2017, 58, 21–35. [Google Scholar] [CrossRef]
  4. Brown, R.D.; Robinson, D.A. Northern Hemisphere spring snow cover variability and change over 1922–2010 including an assessment of uncertainty. Cryosphere 2011, 5, 219–229. [Google Scholar] [CrossRef]
  5. Déry, S.J.; Brown, R.D. Recent Northern Hemisphere snow cover extent trends and implications for the snow-albedo feedback. Geophys. Res. Lett. 2007, 34, 60–64. [Google Scholar] [CrossRef]
  6. Choi, G.; Robinson, D.A.; Kang, S. Changing Northern Hemisphere snow seasons. J. Clim. 2010, 23, 5305–5310. [Google Scholar] [CrossRef]
  7. Savoie, M.H.; Armstrong, R.L.; Brodzik, M.J.; Wang, J.R. Atmospheric corrections for improved satellite passive microwave snow cover retrievals over the Tibet Plateau. Remote Sens. Environ. 2009, 113, 2661–2669. [Google Scholar] [CrossRef]
  8. Yao, T.D.; Thompson, L.; Yang, W.; Yu, W.S.; Gao, Y.; Guo, X.J.; Yang, X.X.; Duan, K.Q.; Zhao, H.B.; Xu, B.Q.; et al. Different glacier status with atmospheric circulations in Tibetan Plateau and surroundings. Nat. Clim. Change 2012, 2, 663–667. [Google Scholar] [CrossRef]
  9. Immerzeel, W.W.; Van Beek, L.P.H.; Bierkens, M.F.P. Climate change will affect the Asian water towers. Science 2010, 328, 1382–1385. [Google Scholar] [CrossRef]
  10. Li, X.; Long, D.; Scanlon, B.R.; Mann, M.E.; Li, X.; Tian, F.; Sun, Z.; Wang, G. Climate change threatens terrestrial water storage over the Tibetan Plateau. Nat. Clim. Change 2022, 12, 801–807. [Google Scholar] [CrossRef]
  11. Ueno, K.; Tanaka, K.; Tsutsui, H.; Li, M. Snow cover conditions in the Tibetan Plateau observed during the winter of 2003/2004. Arct. Antarct. Alp. Res. 2007, 39, 152–164. [Google Scholar] [CrossRef]
  12. Pu, Z.; Xu, L.; Salomonson, V.V. MODIS/Terra observed seasonal variations of snow cover over the Tibetan Plateau. Geophys. Res. Lett. 2007, 34, 137–161. [Google Scholar] [CrossRef]
  13. Immerzeel, W.; Droogers, P.; de Jong, S.; Bierkens, M. Large-scale monitoring of snow cover and runoff simulation in Himalayan river basins using remote sensing. Remote Sens. Environ. 2009, 113, 40–49. [Google Scholar] [CrossRef]
  14. Li, W.; Guo, W.; Qiu, B.; Xue, Y.; Hsu, P.-C.; Wei, J. Influence of Tibetan Plateau snow cover on East Asian atmospheric circulation at medium-range time scales. Nat. Commun. 2018, 9, 4243. [Google Scholar] [CrossRef]
  15. Liu, Y.; Bao, Q.; Duan, A.; Qian, Z.; Wu, G. Recent progress in the impact of the Tibetan Plateau on climate in China. Adv. Atmos. Sci. 2007, 24, 1060–1076. [Google Scholar] [CrossRef]
  16. Duan, A.; Wu, G.; Liu, Y.; Ma, Y.; Zhao, P. Weather and climate effects of the Tibetan Plateau. Adv. Atmos. Sci. 2012, 29, 978–992. [Google Scholar] [CrossRef]
  17. Yao, T.; Bolch, T.; Chen, D.; Gao, J.; Immerzeel, W.; Piao, S.; Su, F.; Thompson, L.; Wada, Y.; Wang, L.; et al. The imbalance of the Asian water tower. Nat. Rev. Earth Environ. 2022, 3, 618–632. [Google Scholar] [CrossRef]
  18. Nie, Y.; Pritchard, H.D.; Liu, Q.; Hennig, T.; Wang, W.; Wang, X.; Liu, S.; Nepal, S.; Samyn, D.; Hewitt, K.; et al. Glacial change and hydrological implications in the Himalaya and Karakoram. Nat. Rev. Earth Environ. 2021, 2, 91–106. [Google Scholar] [CrossRef]
  19. Immerzeel, W.W.; Lutz, A.F.; Andrade, M.; Bahl, A.; Biemans, H.; Bolch, T.; Hyde, S.; Brumby, S.; Davies, B.J.; Elmore, A.C.; et al. Importance and vulnerability of the world’s water towers. Nature 2020, 577, 364–369. [Google Scholar] [CrossRef]
  20. You, Q.; Wu, T.; Shen, L.; Pepin, N.; Zhang, L.; Jiang, Z.; Wu, Z.; Kang, S.; AghaKouchak, A. Review of snow cover variation over the Tibetan Plateau and its influence on the broad climate system. Earth Sci. Rev. 2020, 201, 103043. [Google Scholar] [CrossRef]
  21. Chu, D. Spatiotemporal variability of snow cover on Tibet, China using MODIS remote-sensing data. Int. J. Remote Sens. 2018, 39, 6784–6804. [Google Scholar] [CrossRef]
  22. Pu, Z.; Xu, L. MODIS/Terra observed snow cover over the Tibet Plateau: Distribution, variation and possible connection with the East Asian Summer Monsoon (EASM). Theor. Appl. Climatol. 2009, 97, 265–278. [Google Scholar] [CrossRef]
  23. Basang, D.; Barthel, K.; Olseth, J. Satellite and ground observations of snow cover in Tibet during 2001–2015. Remote Sens. 2017, 11, 1201. [Google Scholar] [CrossRef]
  24. Cai, D.; Guo, N.; Wang, X.; Zhang, X. The spatial and temporal variations of snow cover over the Qilian Mountains based on MODIS data. J. Glaciol. Geocryol. 2009, 31, 1028–1036. (In Chinese) [Google Scholar]
  25. Yang, C.J.; Zhao, Z.J.; Ni, J.; Ren, X.; Wang, Q. Temporal and spatial analysis of changes in snow cover in western Sichuan based on MODIS images. Sci. China Earth Sci. 2011, 41, 1743–1750. [Google Scholar] [CrossRef]
  26. Lou, M.Y.; Liu, Z.H.; Lou, S.M.; Dai, R. Temporal and spatial distribution of snow cover in Xinjiang from 2002 to 2011. J. Glaciol. Geocryol. 2013, 35, 1095–1102. (In Chinese) [Google Scholar]
  27. Lin, J.T.; Feng, X.Z.; Xiao, P.F.; Li, H. Spatial and temporal distribution of snow cover in mountainous area of Manasi River Basin based on MODIS. Remote Sen. Technol. Appl. 2011, 26, 469–475. (In Chinese) [Google Scholar]
  28. Dou, Y.; Chen, X.; Bao, A.M.; Li, L. Study of the temporal and spatial distribute of the snow cover in the Tianshan Mountains, China. J. Glaciol. Geocryol. 2010, 32, 28–34. (In Chinese) [Google Scholar]
  29. Lin, J.T.; Feng, X.Z.; Xiao, P.F.; Li, H. Spatial and temporal characteristics of satellite snow cover in a typical area of Tianshan Mountain. J. Glaciol. Geocryol. 2011, 33, 971–978. (In Chinese) [Google Scholar]
  30. Li, Y.; Chen, Y.; Li, Z. Climate and topographic controls on snow phenology dynamics in the Tienshan Mountains, Central Asia. Atmos. Res. 2020, 236, 104813. [Google Scholar] [CrossRef]
  31. Tong, J.; Déry, S.J.; Jackson, P.L. Topographic control of snow distribution in an alpine watershed of western Canada inferred from spatially-filtered MODIS snow products. Hydrol. Earth Syst. Sci. 2009, 13, 319–326. [Google Scholar] [CrossRef]
  32. Jain, S.; Goswami, A.; Saraf, A. Role of elevation and aspect in snow distribution in western Himalaya. Water Resour. Manag. 2009, 23, 71–83. [Google Scholar] [CrossRef]
  33. Shrestha, A.; Agrawal, N.; Alfthan, B.; Bajracharya, S.; Maréchal, J.; van Oort, B. (Eds.) The Himalayan Climate and Water Atlas; ICIMOD; GRID-Arendal; CICERO: Kathmandu, Nepal, 2015. [Google Scholar]
  34. Gurung, D.R.; Maharjan, S.B.; Shrestha, A.B.; Shrestha, M.S.; Bajracharya, S.R.; Murthy, M.S.R. Climate and topographic controls on snow cover dynamics in the Hindu Kush Himalaya. Int. J. Climatol. 2017, 37, 3873–3882. [Google Scholar] [CrossRef]
  35. Desinayak, N.; Prasad, A.K.; El-Askary, H.; Kafatos, M.; Asrar, G.R. Snow cover variability and trend over the Hindu Kush Himalayan region using MODIS and SRTM data. Ann. Geophys. 2022, 40, 67–82. [Google Scholar] [CrossRef]
  36. Gao, J.; Williams, M.W.; Fu, X.; Wang, G.; Gong, T. Spatiotemporal distribution of snow in eastern Tibet and the response to climate change. Remote Sens. Environ. 2012, 121, 1–9. [Google Scholar] [CrossRef]
  37. Gao, J.; Williams, M.W.; Fu, X.; Wang, G.; Gong, T. A global inventory of mountains for bio-geographical applications. Alpine Bot. 2017, 127, 1–15. [Google Scholar]
  38. Zhang, Y.L.; Li, B.Y.; Zheng, D. A discussion on the boundary and area of the Tibetan Plateau in China. Geogr. Res. 2002, 21, 1–8. (In Chinese) [Google Scholar]
  39. Sun, H.L.; Zheng, D. Formation, Evolution and Development of Qinghai-Xizang (Tibetan) Plateau; Guangdong Science and Technology Press: Guangzhou, China, 1998; pp. 231–296. (In Chinese) [Google Scholar]
  40. Hall, D.K.; Riggs, G.A.; Salomonson, V.V.; DiGirolamo, N.E.; Bayr, K.J. MODIS snow-cover products. Remote Sens. Environ. 2002, 83, 181–194. [Google Scholar] [CrossRef]
  41. Hall, D.K.; Riggs, G.A.; Foster, J.L.; Kumar, S.V. Development and evaluation of a cloud-gap-filled MODIS daily snow-cover product. Remote Sens. Environ. 2010, 114, 496–503. [Google Scholar] [CrossRef]
  42. Klein, A.G.; Barnett, A.C. Validation of daily MODIS snow cover maps of the Upper Rio Grande River basin for the 2000-2001 snow year. Remote Sens. Environ. 2003, 86, 162–176. [Google Scholar] [CrossRef]
  43. Liang, T.; Zhang, X.; Xie, H.; Wu, C.; Feng, Q.; Huang, X.; Chen, Q. Toward improved daily snow cover mapping with advanced combination of MODIS and AMSR-E measurements. Remote Sens. Environ. 2008, 112, 3750–3761. [Google Scholar] [CrossRef]
  44. Huang, X.; Liang, T.; Zhang, X.; Guo, Z. Validation of MODIS snow cover products using Landsat and ground measurements during the 2001–2005 snow seasons over northern Xinjiang, China. Int. J. Remote Sens. 2011, 32, 133–152. [Google Scholar] [CrossRef]
  45. Wang, X.; Xie, H.; Liang, T. Evaluation of MODIS snow cover and cloud mask and its application in Northern Xinjiang, China. Remote Sens. Environ. 2008, 112, 1497–1513. [Google Scholar] [CrossRef]
  46. Scientific Expedition Team to the Tibetan Plateau. Glaciers in Tibet; Science Press: Beijing, China, 1986. (In Chinese) [Google Scholar]
  47. Qin, D.; Liu, S.; Li, P. Snow cover distribution, variability, and response to climate change in western China. J. Clim. 2006, 19, 1820–1833. [Google Scholar]
  48. Shrestha, A.B.; Joshi, S.P. Snow cover and glacier change study in Nepalese Himalaya using remote sensing and geographic information system. J. Hydrol. Meteorol. 2009, 6, 26–36. [Google Scholar] [CrossRef]
  49. Lhakpa, D.; Fan, Y.; Cai, Y. Continuous Karakoram glacier anomaly and its response to climate change during 2000–2021. Remote Sens. 2022, 14, 6281. [Google Scholar] [CrossRef]
  50. Huang, X.; Deng, J.; Wang, W.; Feng, Q.; Liang, T. Impact of climate and elevation on snow cover using integrated remote sensing snow products in Tibetan Plateau. Remote Sens. Environ. 2017, 190, 274–288. [Google Scholar] [CrossRef]
  51. Bhattacharya, A.; Bolch, T.; Mukherjee, K.; King, O.; Menounos, B.; Kapitsa, V.; Neckel, N.; Yang, W.; Yao, T. High Mountain Asian glacier response to climate revealed by multi-temporal satellite observations since the 1960s. Nat. Commun. 2021, 12, 4133. [Google Scholar] [CrossRef]
  52. Chen, X.; Long, D.; Liang, S.; He, L.; Zeng, C.; Hao, X.; Hong, Y. Developing a composite daily snow cover extent record over the Tibetan Plateau from 1981 to 2016 using multisource data. Remote Sens. Environ. 2018, 215, 284–299. [Google Scholar] [CrossRef]
  53. Choudhury, A.; Yadav, A.C.; Bonafoni, S. A response of snow cover to the climate in the Northwest Himalaya (NWH) using satellite products. Remote Sens. 2021, 13, 655. [Google Scholar] [CrossRef]
  54. Tang, Z.; Deng, G.; Hu, G.; Zhang, H.; Pan, H.; Sang, G. Satellite observed spatiotemporal variability of snow cover and snow phenology over high mountain Asia from 2002 to 2021. J. Hydrol. 2022, 613, 128438. [Google Scholar] [CrossRef]
  55. Tang, B.; Shrestha, B.; Li, Z.; Liu, G.; Ouyang, H.; Gurung, D.R.; Giriraj, A.; Aung, K.S. Determination of snow cover from MODIS data for the Tibetan Plateau region. Int. J. Appl. Earth Obs. 2012, 21, 356–365. [Google Scholar] [CrossRef]
Figure 1. Tibetan Plateau in the global mountain region.
Remotesensing 15 04044 g001
Figure 2. Topography, mountains and main river systems in the TP.
Remotesensing 15 04044 g002
Figure 3. Annual mean SCF on the TP.
Remotesensing 15 04044 g003
Figure 4. Seasonal mean SCF on the TP in spring (a), summer (b), autumn (c), and winter (d).
Remotesensing 15 04044 g004
Figure 5. Annual and seasonal mean SCF with elevations on the TP.
Remotesensing 15 04044 g005
Figure 6. Monthly mean SCF with elevation zones on the TP: below 4 km altitude (a) and above 4 km altitude (b).
Remotesensing 15 04044 g006
Figure 7. Longitudinal distribution of annual and seasonal mean SCF on the TP.
Remotesensing 15 04044 g007
Figure 8. Latitudinal distribution of annual and seasonal mean SCF on the TP.
Remotesensing 15 04044 g008
Figure 9. Monthly mean SCF with aspects on the TP.
Remotesensing 15 04044 g009
Figure 10. Monthly mean SCF with slope zones on the TP.
Remotesensing 15 04044 g010
Figure 11. Monthly mean SCF on the slope zones in the north-facing aspect on the TP.
Remotesensing 15 04044 g011
Figure 12. Monthly mean SCF on the slope zones in the south-facing aspect on the TP.
Remotesensing 15 04044 g012
Table 1. Mean SCF on the Tibetan Plateau.
No.SCF Range
/%
SCF/%
AnnualSpringSummerAutumnWinter
10–1049.944.287.847.342.1
211–2024.520.76.620.825.3
321–3011.211.72.213.011.9
431–405.76.90.98.26.2
541–503.44.40.54.64.0
651–602.13.20.32.62.9
761–701.12.80.31.12.3
871–800.82.20.30.62.0
981–900.92.10.40.61.8
1091–1000.31.60.81.31.5
Mean15.720.95.417.520.6
Table 2. CV of monthly mean SCF with elevation zones on the TP.
No.Elevation Range/kmCV
1<11.3
21–21.3
32–30.9
43–40.8
54–50.6
65–60.4
7>60.2
Table 3. Seasonal mean SCF with aspects on the TP.
AspectAspect Range SCF/%
AnnualSpringSummerAutumnWinter
North-facing315–45°18.523.06.220.923.5
East-facing45–135°16.421.55.717.620.6
South-facing135–225°12.917.04.413.716.5
West-facing225–315°17.122.35.518.422.0
Flat terrain−18.613.01.34.016.2
Table 4. Seasonal mean SCF on the slope zones in the TP.
Slope Range/° SCF/%
AnnualSpringSummerAutumnWinter
0–512.715.34.015.116.2
5–1018.424.76.420.021.8
10–2020.628.17.220.626.0
20–9021.027.46.918.830.4
Table 5. Monthly mean SCF (%) on the slope zones in the four aspects on the TP.
AspectSlope/°Jan.Feb.Mar.Apr.May.Jun.Jul.Aug.Sep.Oct.Nov.Dec.
Northward0–5 17.217.7 17.4 16.0 16.2 9.2 2.0 2.9 8.2 22.2 21.1 15.0
5–1025.427.3 30.7 28.6 24.4 12.4 4.8 5.7 11.7 29.0 32.4 24.4
10–2033.434.5 37.6 33.6 25.7 13.1 6.5 7.1 12.9 29.2 36.8 32.5
20–9041.942.5 41.5 33.8 22.7 11.7 7.1 7.3 12.3 25.5 38.6 40.8
Eastward0–516.3 17.8 17.6 15.5 15.0 8.5 2.1 2.9 7.3 19.8 19.4 13.8
5–1021.6 25.3 28.8 25.9 21.1 10.5 4.6 5.3 9.4 23.1 27.1 20.0
10–2024.9 28.7 32.8 29.1 21.7 10.9 5.6 6.0 9.9 21.9 28.5 23.7
20–90 28.3 31.1 32.4 27.3 17.9 9.0 5.5 5.4 8.8 17.2 26.8 27.2
Southward 0–5 15.9 16.8 14.7 12.6 12.4 7.1 1.6 2.3 6.2 18.5 16.7 13.0
5–1016.8 20.3 22.4 20.5 17.5 8.9 3.3 4.0 7.5 18.2 20.2 14.6
10–2017.8 22.3 25.9 23.4 18.0 8.9 4.1 4.4 7.3 16.2 19.8 15.7
20–90 19.4 24.1 26.4 23.0 15.8 8.1 4.7 4.6 7.1 12.7 18.0 17.3
Westward0–5 18.4 19.2 17.8 15.3 14.7 7.7 1.9 2.6 7.1 19.9 20.6 15.6
5–1022.3 25.4 28.8 26.7 21.9 10.4 4.1 5.0 9.5 24.0 27.7 20.5
10–2025.8 29.4 34.1 31.4 23.5 11.2 5.3 5.9 10.4 23.8 29.7 24.3
20–90 31.4 34.8 36.9 32.0 21.5 10.6 5.9 6.2 10.2 20.5 30.1 29.9
Disclaimer/Publisher’s Note: The statements, opinions and data contained in all publications are solely those of the individual author(s) and contributor(s) and not of MDPI and/or the editor(s). MDPI and/or the editor(s) disclaim responsibility for any injury to people or property resulting from any ideas, methods, instructions or products referred to in the content.

