Article

Case Study on the Evolution and Precipitation Characteristics of Southwest Vortex in China: Insights from FY-4A and GPM Observations

1
College of Atmospheric Sounding, Chengdu University of Information Technology, Chengdu 610225, China
2
Key Laboratory of Atmosphere Sounding, China Meteorological Administration, Chengdu 610225, China
3
CMA Meteorological Observation Centre, China Meteorological Administration, Beijing 100081, China
*
Author to whom correspondence should be addressed.
Remote Sens. 2023, 15(16), 4114; https://doi.org/10.3390/rs15164114
Submission received: 9 July 2023 / Revised: 12 August 2023 / Accepted: 17 August 2023 / Published: 21 August 2023

Abstract

:
This research investigates Southwest Vortex (SWV) events in China’s Sichuan Basin using Fengyun-4A (FY-4A) and Global Precipitation Mission (GPM) observations. We selected representative cloud systems and precipitation cases, divided into developing, mature, and dissipating stages. Detailed analysis revealed critical characteristics of precipitation cloud systems at each stage. Our findings reveal that (1) during the SWV’s developing and mature stages, a high concentration of water particles and ice crystals stimulates precipitation. In contrast, the dissipating stage is marked by fewer mixed-phase and ice particles, reducing precipitation area and intensity. (2) Near-surface precipitation in all stages is predominantly liquid, with a bright band of around 5.5 km. At the same time, stratiform precipitation is dominant in each life stage. Stratiform precipitation remains dominant throughout the life stages of the SWV, with localized convective activity evident in the developing and mature stages. (3) Mature stage particles, characterized by a configuration of 1.0–1.2 mm Dm and 31–35 dBNW (dBNW = 10log10NW), contribute significantly to near-surface precipitation. The Cloud Top Height (CTH) serves as an indicator of convective intensity and assists in characterizing raindrop concentration. These findings considerably enhance routine observations, advance our understanding of SWV events, and propose a novel approach for conducting refined observational experiments.

1. Introduction

The Southwest Vortex (SWV) is a crucial precipitation weather system in China, second only to typhoons in terms of intensity, frequency, and the extent of heavy rain influence. Meteorologists have long been focused on understanding the formation, development, and flood disasters caused by this weather phenomenon. In recent years, in the context of global warming [1], extreme precipitation events triggered by the SWV have become more frequent, resulting in significant human and economic losses [2]. For example, from 7 to 11 July 2013, an extreme precipitation event in northern Sichuan registered a total precipitation of 415.9 mm, impacting 15 townships and 42,571 individuals [3]. A similar episode occurred on 11 August 2020, when incessant heavy rain in the western Sichuan Basin with overlapping storm zones culminated in a total precipitation of 423.2 mm in Lushan, causing direct economic losses of approximately 1.63 billion yuan and leading to six fatalities with an additional five people reported missing [4]. The SWV’s catastrophic influence on Sichuan is significant, profoundly affecting rainstorms and floods in China’s middle and lower Yangtze River regions during its eastward progression [5].
Significant progress has been made in SWV research, including its structural characteristics, evolution patterns, dynamic mechanisms, numerical simulations, early warning, and prediction. Qu et al. (2021) analyzed the three-dimensional circulation structure of the SWV using ERA-Interim reanalysis data [6]. Kang et al. (2011) studied the structural characteristics of four SWV events. They found that mature SWV systems exhibit positive vorticity with a cold core in the lower layer and a warm core in the upper layer [7]. Fu et al. (2015) investigated the evolution mechanism and energy transformation characteristics of the SWV throughout its lifecycle [8]. Cheng et al. (2016) explored the heavy rain resulting from the interaction between a deep SWV and a plateau vortex, proposing a new lateral coupling mechanism [9]. Zhou et al. (2022) discovered the dynamic structure of “low-level convergence and high-level divergence” in the lower layer of the SWV [4]. Zhai et al. (2014) observed the dynamic characteristics of “upper-level divergence and lower-level convergence” in the mature stage of the SWV [10]. Lu et al. (2015) conducted numerical simulations using the AREM model and demonstrated that the distribution of rainbands depends on the SWV’s moving path [11]. Cheng et al. (2019) employed high-altitude encrypted observation data to improve the simulation of precipitation and SWV movement paths [12]. Yang et al. (2011) proposed a forecast equation for SWV precipitation and emphasized different forecast focuses for various SWV types [13]. Chen et al. (2021) enhanced the assimilation of dynamic emissivity data to improve 24-h predictions of initial fields and precipitation distribution [14].
While these studies have yielded valuable insights, most rely on statistical analysis and numerical models [15]. The accuracy of forecast results under complex terrain and limited observation conditions remains challenging. Therefore, it is essential to employ additional observations to understand the SWV’s internal structure and microphysical characteristics comprehensively, which will facilitate the improvement of parameterization schemes in numerical weather forecasting, ultimately enhancing the accuracy of meteorological predictions.
China launched the second-generation geostationary orbit meteorological satellite Fengyun-4 (FY-4) in 2016, succeeding the spin-stable Fengyun-2 (FY-2). As the first satellite of China’s latest generation of geostationary orbit meteorological satellites, FY-4A is loaded with Advanced Geostationary Radiation Imager (AGRI) for precise and flexible two-dimensional pointing through a precise dual scanning mirror mechanism. The area scan takes only one minute, significantly improving the time efficiency, spatial resolution, and detection range of the satellite’s Earth observation. The AGRI has 14 imaging channels, which can obtain cloud detection products such as cloud phase state (CLP), cloud type (CLT), and cloud top height (CTH) [16]. Niu et al. (2022) have used an FY-4A cloud map, quantitative products, and conventional observation data to comprehensively analyze a rainstorm in the complex topographic area of eastern Sichuan [17]. Liu et al. (2021) used FY-4A data to conduct a hierarchical estimation study on precipitation cloud clusters and precipitation intensity in the Tibet Plateau [18]. The emergence of FY-4A allows the observation of complex terrain and large-scale and continuous precipitation systems, and it can quickly monitor the dynamic changes of cloud phase information, precipitation intensity, scope, and trend in the target area. In addition, FY-4A can carry out minute-level high repeat observation in a specific region to realize continuous monitoring of the life stages of the SWV precipitation event. However, the band of FY-4A is mainly concentrated in the visible light and infrared range, and it is not easy to penetrate the clouds and obtain the internal structural characteristics of the precipitation cloud system.
In contrast to previous methods, utilizing low-orbit satellites equipped with precipitation radar allows for acquiring fine internal structural characteristics of precipitation cloud systems. The Tropical Rainfall Measurement Mission (TRMM) pioneered spaceborne observation and provided three-dimensional precipitation cloud information, revolutionizing the analysis and study of vertical precipitation characteristics [19]. Its successor, the Global Precipitation Mission (GPM), further enhanced observation capabilities by incorporating the Microwave Imager GMI (GPM Imager) with 13 frequency bands (10–183 GHz). These frequency bands capture the radiant temperature signal emitted by water particles and ice particles in the precipitation cloud, providing insights into the distribution of liquid and mixed-phase ice-water particles. The dual-frequency precipitation radar (DPR), operating at 35.5 and 13.6 GHz, improved precipitation observation, particularly for trace and solid precipitation, and expanded the observation range to the polar circles [20]. GPM offers global rain and snow data products within 3 h based on microwave and 30 min based on microwave infrared, surpassing TRMM’s spatial coverage, temporal resolution, and spatial resolution. This advancement enhances the ability to capture the spatial heterogeneity of heavy precipitation and facilitates a better understanding of the precipitation structure and spatial characteristics of the SWV. Numerous scholars have leveraged GPM data to study SWV precipitation, yielding significant results. For example, Wang et al. (2022) utilized GPM-DPR observation data to qualitatively and quantitatively investigate the evolution characteristics of SWV during the flood season from 2019 to 2021, providing insights into the horizontal and vertical distribution characteristics and spectral properties of precipitation particles [21]. Mao et al. (2022) analyzed SWV events that influenced precipitation in central and eastern China during the warm season from 2010 to 2020 using data from GPM-DPR and FY-2F. They observed significant differences in the characteristics of warm-season moving-out-type SWV precipitation cloud systems, primarily featuring cumulonimbus clouds and dense cirrus clouds with high spreading heights and low cloud-top brightness temperature (TBB) [22].
The above analysis demonstrates the potential of leveraging the performance advantages of FY-4A satellites to monitor specific weather systems. Furthermore, it offers valuable technical support for studying the structural characteristics of different life stages of SWV precipitation events and enhancing early warning and forecast services. On the other hand, GPM provides global coverage of rain and snow every 1.5 h. However, its scanning width is limited, preventing continuous observation of a specific target area. Despite this limitation, GPM’s high spatial resolution enables the acquisition of three-dimensional structural characteristics of precipitation clouds, facilitates quantifying the microphysical properties of precipitation particles, and sheds light on the underlying physical mechanisms involved.
This study aims to analyze the SWV event in the Sichuan Basin region of China, characterized by complex terrain, by utilizing the observational advantages of FY-4A and GPM. Based on the SWV yearbook data, we have selected typical cloud systems and precipitation cases that can be simultaneously scanned and captured by GPM and FY-4A. These cases are divided into three life stages: Developing, mature, and dissipating. Through detailed analysis and study, we investigate the characteristics of precipitation cloud systems, including particle phase state, cloud properties, and three-dimensional structural characteristics, such as vertical structure and droplet parameters, at different life stages. We aim to uncover precipitation’s structural characteristics and evolution rules within the SWV. The findings from this research will significantly contribute to supplementing routine observations in the region, advancing the theoretical understanding of the SWV, and proposing a new approach for conducting regional multi-source refined observation experiments.
The study is organized as follows: Section 2 introduces the area, data, and methods used in this study. Section 3 presents the analysis of the characteristics and evolution rules of SWV precipitation. Section 4 is a discussion of this study. Finally, Section 5 summarizes the conclusions.

2. Study Area, Data, and Methods
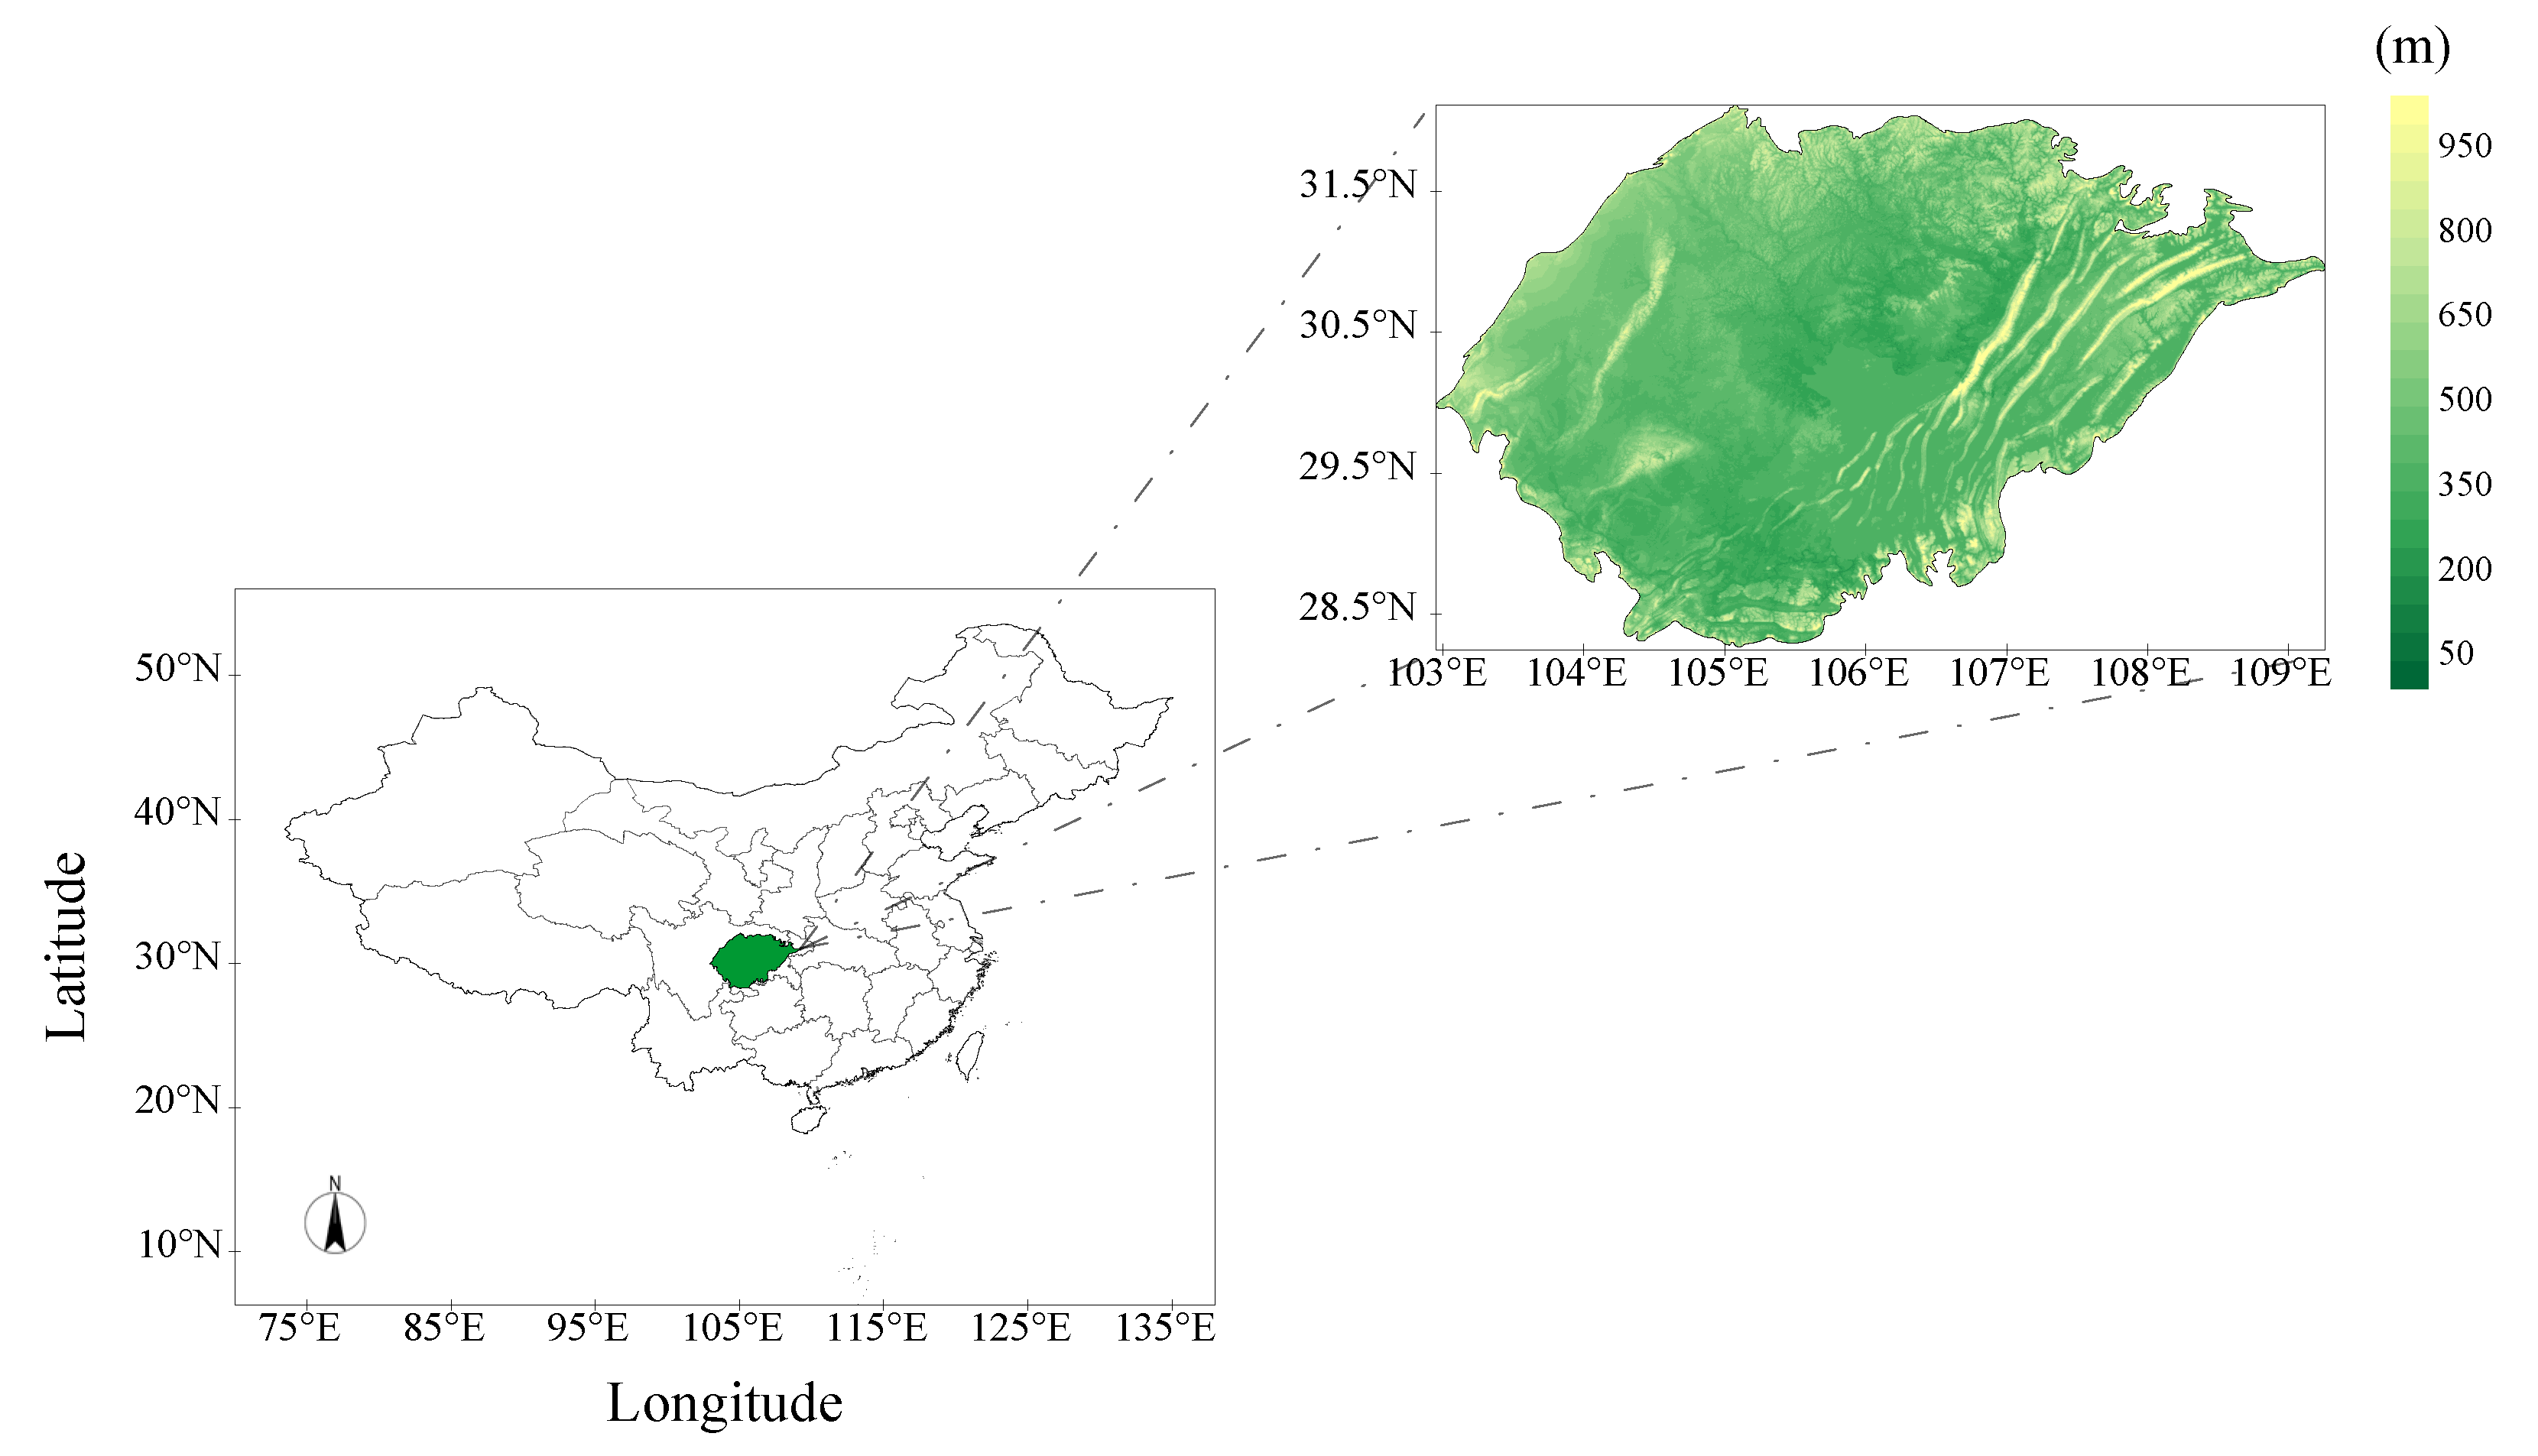
2.1. Study Area

The study area of this research is focused on the primary source area of the SWV, specifically the Sichuan Basin in China, which is located between 28°–32°N and 103°–110°E (Figure 1). The Sichuan Basin is recognized as one of the four major basins in China and is surrounded by mountains and plateaus that range from 1000 to 3000 m above sea level. It shares borders with the Qinghai-Tibet Plateau to the west, the Yunnan-Guizhou Plateau to the south, the Daba Mountains and Qinling Highland to the north, and the Wushan Mountain to the east. The topography in this region is characterized by complexity and diversity, with varying elevations ranging from very high to low. The complex topographic conditions of the Sichuan Basin contribute to its unique climatic characteristics, which result in frequent rainstorms during the warm season. Unique climatic phenomena include convective night rain, known as the “sky leakage” phenomenon in Ya’an [23], and frequent, continuous rain and heavy precipitation events.
Additionally, the mountainous areas on the basin’s edge, such as Leshan and Ya’an, experience abundant precipitation, making them prominent high-frequency precipitation regions in China [24]. Furthermore, the Sichuan Basin’s climate is significantly shaped by the East Asian monsoon, the South Asian monsoon, and the atmospheric circulation system over the Qinghai-Tibet Plateau. This unique combination of factors establishes the Sichuan Basin as a prominent source region for high-impact weather systems.

2.2. Data

2.2.1. Satellite Data

The FY-4A satellite’s substellar point is above 104.7°E, and the AGRI on the FY-4A satellite comprises 14 channels spanning the 0.45–13.8 mm range. The spatial resolution of AGRI is 0.5–1.0 km for visible light and 2.0–4.0 km for infrared. The imaging time for the full disk is 15 min, with a calibration accuracy of 0.5–1.0 K and a sensitivity of 0.2 K [25]. AGRI enables continuous observation of various product information, including equivalent blackbody temperature (TBB), precipitation estimation (QPE), CLP, CLT, and CTH. The data obtained from AGRI have a temporal resolution of 15 min and a spatial resolution of 4 km. The study will utilize product data from the AGRI to examine the life stages and cloud phase characteristics of SWV within the coordinates 26°–34.5°E and 97.5°–110.5°N.
GPM is equipped with two core instruments. The GMI on the GPM core observation platform comprises various channels, each serving a distinct purpose in precipitation observation. The channel with low frequency primarily observes liquid precipitation due to the strong microwave radiation absorption effect of precipitation in this frequency band. Consequently, the TBB increases with rain intensity. On the other hand, the medium-frequency channel is sensitive to scattered precipitation signals, making it suitable for observing mixed precipitation consisting of both liquid and solid phases.
Meanwhile, the high-frequency channel is designed to detect scattered signals produced by small ice particles, making it ideal for observing solid precipitation. This channel effectively identifies the presence and content of ice crystals. If no ice crystals are at the top of the precipitation cloud, the TBB remains relatively stable with slight variation based on rain intensity. However, as the cloud layer thickens, the TBB experiences a rapid decrease [26]. This study utilizes version 1C.GPM-GMI vertical channel data from GMI, wherein the primary product provides the common calibrated TBB (S1_Tc) for the low-frequency 18.7 GHz and medium-frequency 89 GHz channels, while the secondary product provides the common calibrated TBB (S2_Tc) for the high-frequency 183 GHz channel. The data have a temporal resolution of 1.5 h and a spatial resolution of 13 km. The study also uses the 2A.DPR_FS product of the 07 version 2-stage dual-frequency joint inversion on DPR. This data provide detailed track-by-track precipitation information, including near-surface precipitation rate (preciRateNearSurface), particle phase (phase), zero-layer height (heightZeroDeg), and raindrop spectral parameter distribution (paramDSD). The data have a temporal resolution of 1.5 h and a spatial resolution of 5 km. The analysis uses GPM_2AKu band attenuation corrected reflectivity (zFactorFinal) instead of Ka-band or DPR radar measurements. The Ku-band radar has a broader band and exhibits significantly less attenuation than other radar measurements [27]. Refer to Table 1 for specific instrument parameters.

2.2.2. SWV Data

In line with the criteria established in the 2012 Southwest Vortex Yearbook [28], these standards are employed as the benchmark for identifying Southwest Vortex (SWV) cases. Precipitation data from the flood season from June to September 2020 (UTC, the same below) were selected for analysis. Fourteen precipitation events associated with the SWV were identified during this period. The specific occurrence times of the SWV and its associated impact systems are presented in Table 2 below.
Among them, three events occurred on 29 June 2020, 30 August 2020, and 16 August 2020, where observations from FY-4A and GPM were available simultaneously. Each of these cases captured an entire life cycle of the SWV. These events exhibited evident precipitation processes, with significant periodic variations (Figure 2), characterized by prolonged durations and extensive impact rain. These characteristics provide favorable conditions for investigating the typical features of the SWV. In this study, these three representative cases will be selected for analyzing the precipitation characteristics of the SWV, such as its spatial extent, development, life cycle, and the relationship between the intensity of the SWV and its precipitation variations. These analyses are vital for forecasting SWV precipitation [29], as they carry indicative critical implications.

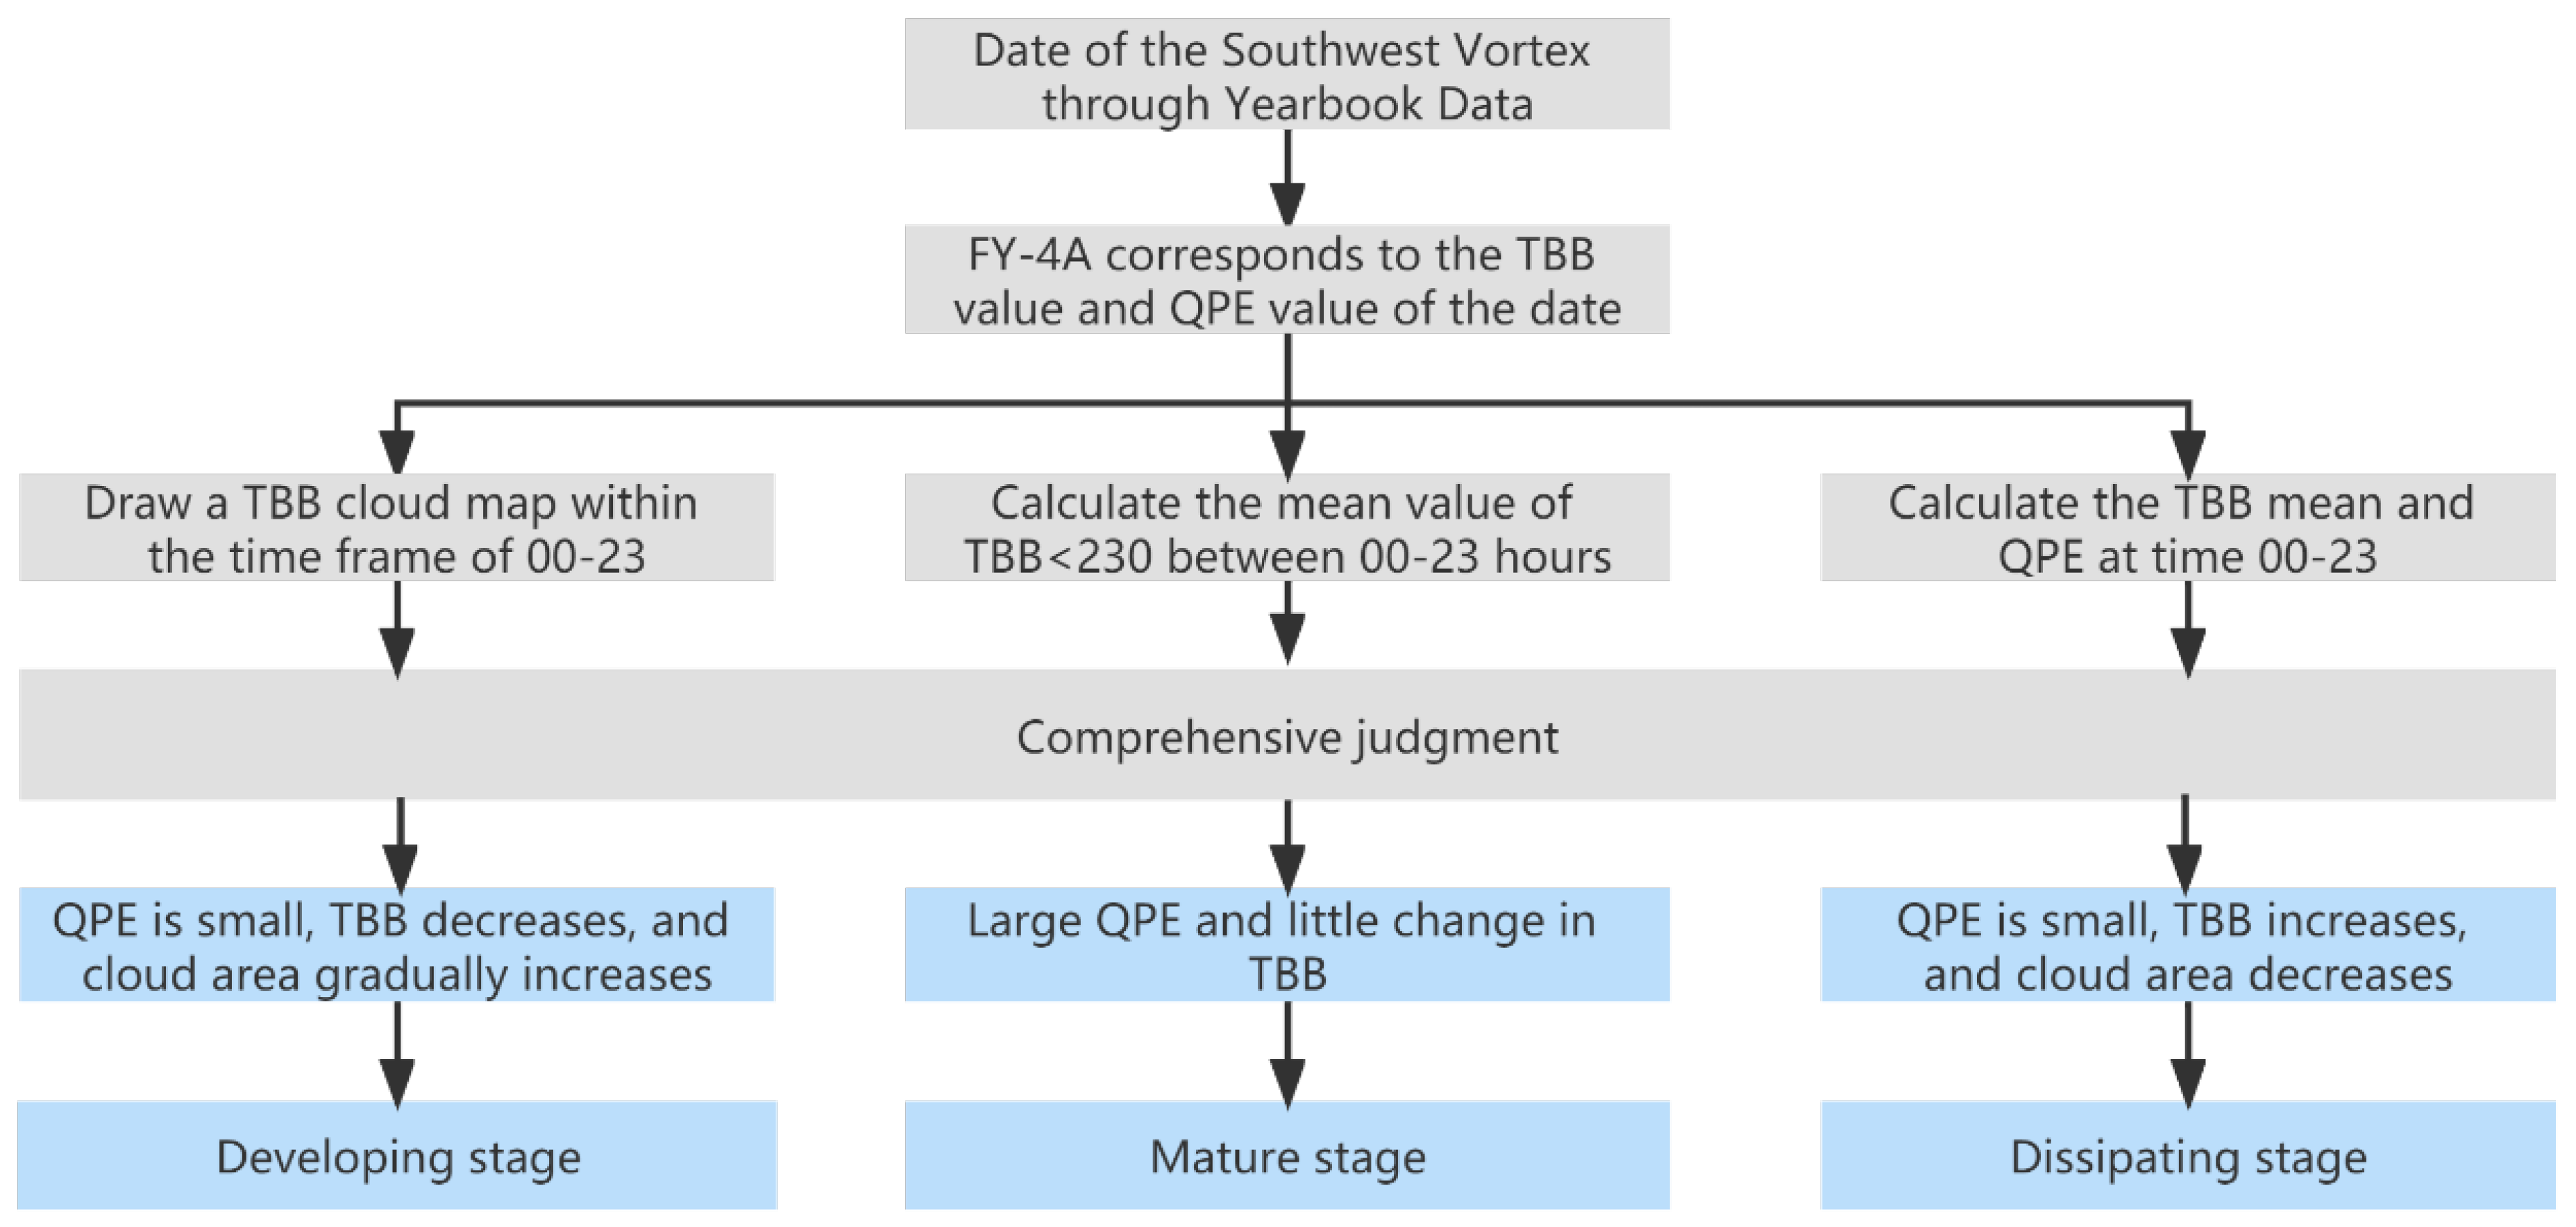
2.3. Classification Method for the Life Stages of the SWV

Since different stages of precipitation systems have varying kinematic effects, it is crucial to utilize the existing FY-4A observation data to identify the life stages of each SWV precipitation system. Following the studies conducted by Byers and Braham (1949) and Houze (1982), the life cycle of mesoscale convective systems (MCS) can be categorized into three stages: Developing, mature, and dissipating [30]. Previous methods employed different criteria to determine the life stages of cloud systems and track them using continuous geostationary satellite and ground-based radar data. These criteria primarily relied on the MCS’s size, duration, and depth thresholds. However, Futyan and Del Genio (2007) regarded the precise selection of thresholds as somewhat arbitrary and suggested employing the evolution of the MCS radius and the minimum TBB as indicators for defining the life stage [31]. Feng et al. (2012) provided a concise summary of the method proposed by Futyan and Del Genio (2007) for defining the life stage [32]. Based on the evolution of the MCS equivalent radius and infrared temperature, it can be divided into three stages: Developing, mature, and dissipating. A system that exhibits vertical growth is classified as “developing” until it reaches the minimum TBB. The subsequent stage is considered the “mature” stage, during which the system achieves the minimum TBB and continues to grow until it reaches its maximum extent. The “dissipating” stage occurs after mature when the system decreases in size [33]. Building upon the abovementioned research and considering the discontinuity of GPM-GMI TBB within the instantaneous field of view, this paper employs the geosynchronous satellite observation data (AGRI) to determine the life stage of the SWV precipitation system. The specific method is illustrated in Figure 3.
In this study, the precipitation stage using the TBB data obtained from FY-4A to determine. The continuous hourly TBB images of the SWV precipitation event (specifically, 30 August 2020) captured by FY-4A were tracked, as exemplified in Figure 4.
To enhance the objectivity of classifying the life stages of the SWV, Liu et al. (2023) discovered that most cloud-top TBB values fell within the range of 190–230 K when analyzing the TBB characteristics of short-term heavy precipitation along the Chengdu-Chongqing railway [34]. Furthermore, Di et al. (2018) demonstrated that cloud top TBB decreases rapidly during strong convection, typically dropping below 230 K within 3–4 h when short-term heavy precipitation occurs [35]. Additionally, Zhang et al. (2009), while investigating the relationship between cloud-top TBB and precipitation in Yiwu City, observed that when the cloud-top TBB exceeds 234 K, the corresponding surface precipitation consists primarily of light rain, with a negligible average probability of moderate rain, heavy rain, and torrential rain [36]. Building upon the above research, we utilized all the observed TBB values below 230 K from the FY-4A satellite data. The average TBB value was calculated for each hour, with the lowest average TBB occurring between 12:00 and 15:00, as depicted in Figure 5. Simultaneously, QPE data and average TBB data were obtained for each hour from FY-4A, as illustrated in Figure 6. Through analysis, we discovered a negative correlation between TBB and precipitation, aligning with the qualitative analysis results of Meng et al. (2002) based on satellite cloud images. Specifically, the lower the TBB, the higher the cloud top and the more intense the convective activity [37]. Based on the information mentioned above, we determined the life stage division of the SWV on 30 August 2020 by manually comparing changes in the cloud area, mean value, and precipitation in the FY-4A observation data. Specifically, between 06:00 and 11:00, the precipitation was low, the cloud TBB gradually decreased, and the cloud area gradually increased. We defined this stage as the developing stage. Between 12:00 and 15:00, the precipitation reached its maximum while the system attained the minimum TBB, and the TBB of the precipitation cloud remained relatively stable. We labeled this stage as the mature stage. From 16:00 to 22:00, the TBB of the system’s clouds gradually increased, but the system’s development scale diminished. This stage was designated as the dissipating stage.
Through the analysis above and comparison, we could objectively delineate the different life stages of the SWV. This method incorporates TBB changes, precipitation, and cloud area to describe the SWV’s evolution accurately.
The life stages on 29 June 2020 and 16 August 2020 are divided according to the above method. The specific life stage division is shown in Table 3. In the following paragraphs, the different life stages of the three individual cases will be studied and analyzed.

2.4. Data Analysis Methods

Locate FY-4A’s cloud retrieval in the SWV coordinate system. For the SWV life stage with a specific time step, the cloud search results of all FY-4A pixels in the region are analyzed, and the cloud occurrence frequency (COF) of each type of cloud is calculated, as shown in Equation (1).
C l o u d   O c c u r r e n c e   F r e q u e n c y = N c l o u d / N a l l    
N c l o u d and N a l l are the number and total cloud pixels retrieved by FY-4A, respectively.
MEAN is obtained by dividing the cumulative value of the product detected by the satellite by the number of products in a specific area, as shown in Equation (2). It reflects the number of measures of the product data centralization trend. MEAN information has a specific guiding significance for studying the parameter content of the microphysical process.
x = i = 1 n x i n , n > 0
where x represents the average value of the product, n represents the total number of data, and x i represents the i-th data value.
In order to effectively reveal the reflectivity and DSD structure characteristics of the SWV precipitation system, we will use Contoured Frequency by Altitude Diagrams (CFAD) to reflect the microphysical characteristics of the precipitation system. CFAD is to normalize the number of samples at all altitude levels. The specific method is that the frequency of a particular altitude layer and a specific reflectivity value account for the maximum frequency of the reflectivity on all height layers, as shown in Equation (3). This method presents the probability distribution of reflectivity of evolutions in different life stages through two-dimensional graphs.
p = F n ,   d B Z F m a x m ,   d B Z , m , n > 0
where p represents the proportion of reflectivity value after normalization, F represents the frequency of occurrence of reflectivity value, n represents the height layer of n km, m represents any height layer, and dBZ represents reflectivity.

3. Analysis of Results

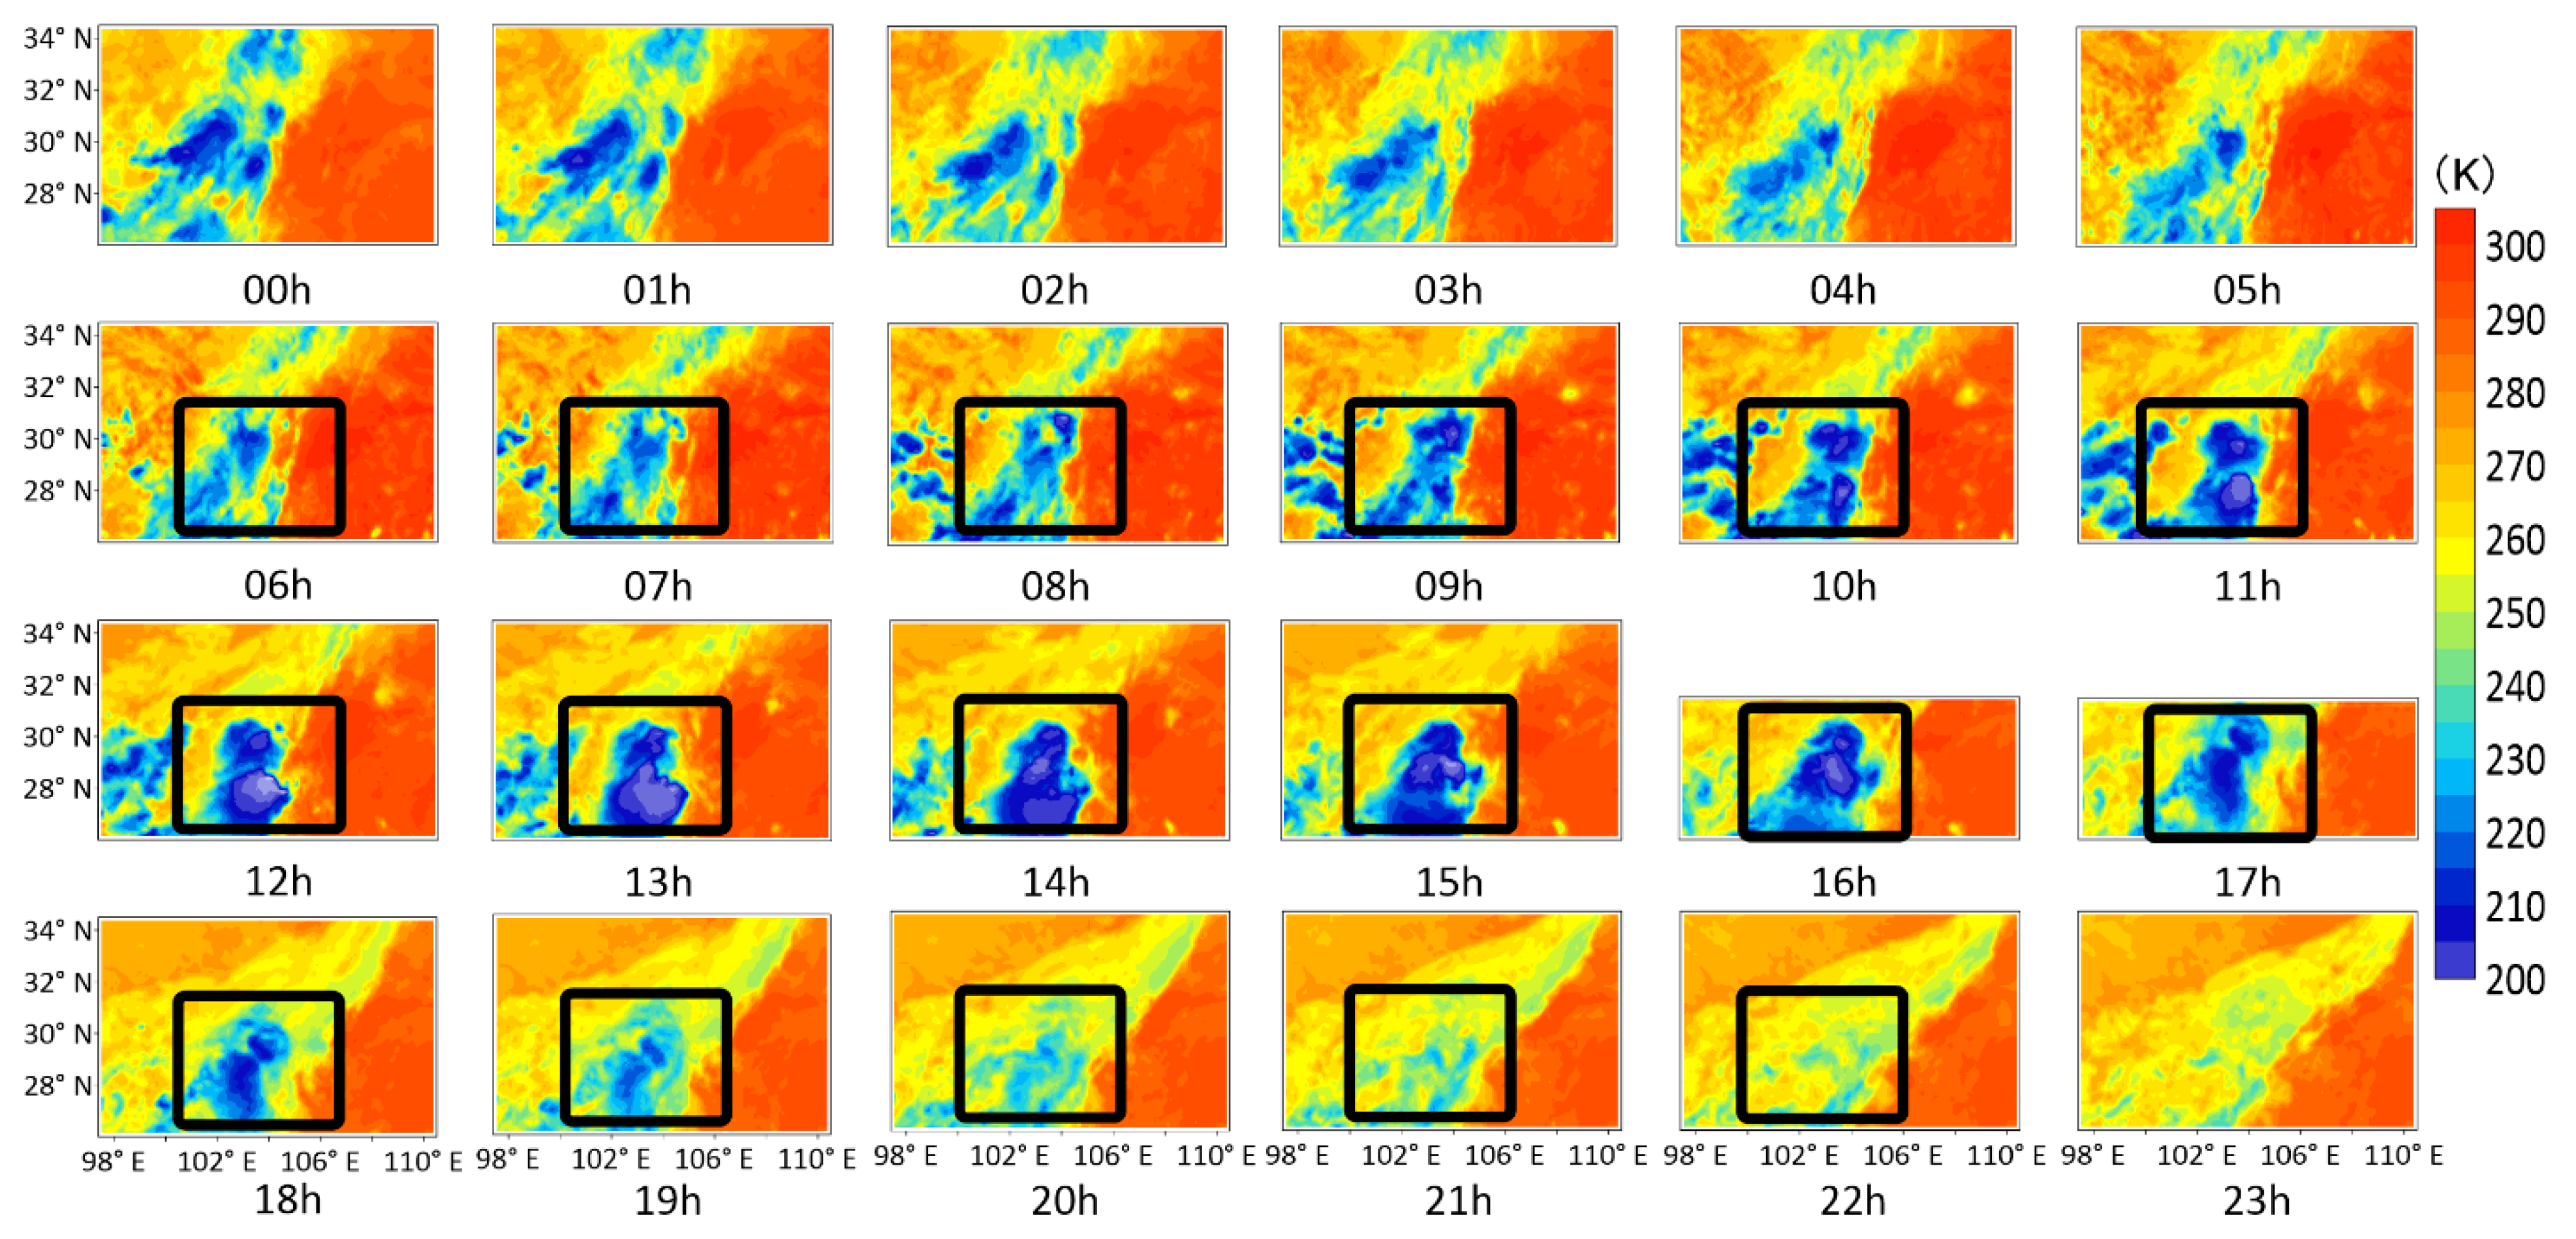
3.1. Characteristics of SWV Precipitation Cloud System

This section will use the data above to study three typical SWV cases. FY-4A and GMI identify precipitation CLP and particle phase states in different life stages. The relationship between CLT and CTH in the whole life cycle of the SWV was analyzed through the cloud retrieval data of FY-4A, and the structure and development of the cloud body were described by CTH, which further revealed the cloud physical process and evolution law of the SWV.

3.1.1. Phase Characteristics of Cloud Particles

The spatial and temporal distribution of particle phase states within clouds holds significant importance for investigating the microscopic characteristics and evolutionary patterns of the SWV. Consequently, this study utilizes various frequency bands detected by the GMI, which capture the radiant TBB signals emitted by mixed-phase ice-water particles within precipitation clouds. Figure 7 illustrates the TBB distributions at low, medium, and high frequencies during different life stages of typical SWV precipitation cases. The areas enclosed within the black square circles correspond to regions of intense precipitation with near-surface precipitation rates detected by the DPR, as depicted in the first column.
As seen from the results of the SWV precipitation region in Figure 7b–d, in the developing stage of Case 1, the TBB of the 18.7 GHz channel is primarily red. The TBB value is relatively high, mainly around 270 K. Typically, the 18.7 GHz channels are infrequently utilized for detecting precipitation particles on terrestrial surfaces, as the emission signals from these particles in the cloud are often overshadowed by the signals from the land surface, making it challenging to discern the cloud’s outline [38]. However, the precipitation cloud system becomes apparent in the TBB distribution maps of the 89 and 183 GHz channels (as shown in Figure 7c,d). Combined with the near-surface precipitation rate map (Figure 7a), it is ascertainable that the precipitation cloud system induces areas with TBB exceeding 270 K in the 18.7 GHz channel. Hence, it can be inferred that a high concentration of water particles is present in the precipitation area. The 89 GHz channel detection results show that the blue part of the heavy precipitation center of the SWV system and its surrounding areas gradually increase, the TBB decreases significantly, and the TBB value is lower than 180 K, which indicates that there is a large amount of mixed-phase ice-water particles at this time, which is mainly distributed in the blue and white areas in the figure. The 183 GHz channel detection results show that the blue part of the heavy precipitation center of the SWV system and its surrounding areas gradually increase, and the band can effectively identify the existence and content of ice crystals. If there is no ice crystal in the precipitation cloud top, the TBB hardly changes with the rain intensity. It decreases rapidly with the thickening of the cloud layer [39]. As seen in Figure 7d, the TBB of the corresponding region is lower than 170 K, and the area is gradually increasing, indicating that there are relatively deep and thick clouds in the system at this time. According to the TBB distribution, it can be found that there are water particles and ice crystal particles in this region and the surrounding cloud system during the developing stage.
Figure 7f–h shows the TBB distribution of 18.7, 89, and 183 GHz channels in Case 2 at the mature stage. According to the results shown by the black square circle in the figure, the TBB of the 18.7 GHz channel shows a large area of red and yellow, and the TBB value is high. The TBB value is concentrated around 280 K, combined with Figure 7e, g, h, indicating the presence of liquid water particles in areas. The 89 GHz channel detection results show that the yellow part of the heavy precipitation center and its surrounding areas gradually increase, the TBB decreases significantly, and the TBB value is lower than 220 K, which indicates that there is a large amount of mixed-phase ice-water particles at this time, mainly distributed in the yellow area of the figure. As can be seen from the 183 GHz channel TBB distribution diagram, the blue and white area gradually increases, and the TBB value is lower than 170 K. This indicates that there are large and relatively deep and thick clouds in the system now. According to the TBB distribution, many water and ice crystal particles exist in this region and the surrounding cloud system in the mature stage. Their phase characteristics are similar to those in the developing stage. However, compared with the cloud water content, there are more ice particles in the mature stage, indicating that the development of convective activities has been quite vigorous.
Figure 7j–l displays the TBB distribution at low, medium, and high frequencies during the dissipating stage of the third case. In the precipitation region indicated by the black square circle, the TBB at the 18.7 GHz channel appears in shades of blue and yellow, with values below 265 K, indicating a higher concentration of water particles within the precipitation region. The TBB distribution at the 89 GHz channel reveals the presence of mixed-phase ice-water particles, with a TBB of approximately 250 K. At the 183 GHz channel, the TBB distribution shows an increase in the red region, corresponding to higher TBB values around 240 K, suggesting the detection of a small number of ice particles in this region. Based on the TBB distribution, it can be inferred that during the dissipating stage, a small amount of mixed-phase ice-water and ice particles are present in this region and the surrounding cloud system. This combination results in a smaller precipitation area and reduced intensity, indicating that the cloud particles are dissipating.
GMI cannot provide long-term continuous observations of cloud particle phase states in the same region. However, FY-4A offers continuous observation time, compensating for GMI’s limitations and enabling long-term cloud retrieval in the SWV region. Consequently, the CLP product data from FY-4A were utilized to analyze individual cases’ Cloud Occurrence Frequency (COF) during different life stages. Table 4 shows the percentage of cloud phase pixels of clear, water, super cooled, mixed, and ice types detected by FY-4A in the whole region in different life stages. The primary phase states of clouds in different life stages can be seen more directly through the proportion. During the precipitation process of the SWV, the water type accounts for a relatively small proportion during the mature stage. The super cooled type is distributed across all life stages, while the mixed type is present in small quantities. The ice-type cloud comprises the largest proportion, reaching up to 48%. This finding aligns with the GMI detection results mentioned earlier. It is also consistent with the snowflake shape distribution region illustrated in Figure 8. Therefore, it can be inferred that ice clouds predominantly exist during the precipitation process of the SWV, which implies that ice clouds contribute significantly to precipitation generation, which aligns with the conclusion drawn by Heymsfield et al. (2020) on a global scale, stating that ice clouds generate the highest proportion of precipitation, while warm water clouds contribute the least [40].
The combined detection results of GMI and FY-4A show that the precipitation clouds in the developing stage are mainly water and ice clouds, in which water particles and ice crystal particles exist. The mature stage consists mainly of ice clouds, with many water and ice crystal particles. However, the precipitation clouds in the dissipating stage are mainly mixed clouds and ice clouds, which contain a few mixed-phase ice-water and ice crystal particles, and the particles belong to the dissipating stage, which is not conducive to generating intense precipitation.

3.1.2. Cloud Properties and Characteristics

CTH is closely associated with CLP and CLT, providing valuable insights into cloud development and evolution. In Figure 8, the color scale represents the spatial distribution of CTH in the three life stages of individual cases within the SWV coordinate system. Additionally, six icons indicate the positions of CLT distribution in this region, the area in the black square corresponds to the area of heavy precipitation near the surface precipitation rate detected by DPR in Figure 7. From Figure 8, areas exhibiting high CTH values correspond to heavy precipitation regions and extensive ice cloud coverage, which suggests that the height of the cloud top and the extent of ice cloud coverage directly impacts the scope and intensity of surface precipitation. This finding is consistent with the conclusion of Fu et al. (2022) in their analysis of precipitation structure characteristics in Chongqing’s supercell cloud clusters, indicating a tendency for higher precipitation cloud tops to coincide with greater precipitation intensity on the ground [38].
Observing three representative cases reveals that as the life stage of the SWV evolutions, the precipitation cloud system reaches the highest in the mature stage, and the ice cloud area is the largest. In addition to many ice clouds, there are a few super cooled clouds and overlapping clouds around the heavy precipitation area. Generally, cloud height corresponds to the phase state of the cloud [41]. Water clouds form at lower altitudes, while ice and cirrus clouds form at higher altitudes. Mixed clouds are typically found at intermediate heights between the two. Therefore, by examining the spatial distribution of SWV CTH and CLT illustrated in Figure 8, it can be observed that water clouds, super cooled clouds, mixed clouds, cirrus clouds, overlap clouds, and ice clouds appear successively from low to high altitudes. This observation aligns somewhat with the cloud cover distribution proposed by Bjerknes (1921) for frontal cyclones. For instance, in the case of a warm front, the phenomenon described by Bjerknes proposes that warm air ascends along the front, giving rise to distinct cloud layers with varying characteristics (CLT). The inclination or slant of the front contributes to the enhanced development of clouds at higher elevations [42].
The spatial distribution of CTH can provide insights into the structure and evolution of cloud systems. At the same time, the Probability Density (PD) of CTH allows for a more objective assessment of height distribution. Figure 9 illustrates the PD distribution of CTH at different life stages, revealing significant differences. However, the PD for all three cases was highest during the dissipating stage, followed by the mature stage. The upper-level cloud systems exhibit the most vigorous development during the mature stage, and higher cloud tops indicate stronger convective intensity. On average, CTH increases with near-surface precipitation [43]. In the three individual cases, the maximum PD for CTH was below 10 km, which aligns with the findings of Wang et al. (2011) that clouds in East Asia, situated within the subtropical monsoon region, are primarily located in the middle and lower troposphere, with fewer clouds above 10 km [44]. Throughout the entire life stage of the SWV precipitation event, the PD distribution of CTH exhibits a consistent trend across different stages. It consistently displays a bimodal vertical distribution structure, characterized by a primary peak at lower altitudes and a secondary peak at higher altitudes. This distinct bimodal pattern is closely linked to the intensity of specific weather systems [45].

3.2. Three-Dimensional Structure Characteristics of Precipitation in SWV

Among the existing methods of precipitation observation, rain gauges are limited to recording near-surface precipitation at specific locations. In contrast, the GPM-DPR operates in low-Earth orbit with high detection accuracy. It can penetrate clouds and precipitation, providing three-dimensional information on the Drop Size Distribution (DSD) [46], which includes horizontal distribution and vertical profiles, allowing for examining microphysical characteristics in different life stages. By combining the observations from the FY-4A and the GPM-DPR, this study establishes a connection between the microphysics of various cloud particles and the growth patterns of precipitation droplets. These findings offer a scientific basis for satellite-based observation of precipitation microphysics during different life stages.

3.2.1. Vertical Structure Characteristics

Detailed profile analysis was conducted using GPM data to understand the vertical structure characteristics of precipitation throughout the entire life stage of the SWV precipitation event. After profiling the AB, CD, and EF lines (Figure 7), we analyze the vertical characteristics of different life stages, as shown in Figure 10.
The first row of Figure 10 depicts the vertical profiles of Ku-band echo reflectivity across the three life stages. During the developing stage of Case 1, the echo reaches a maximum height of approximately 16 km, with its peak intensity at around 36 dBZ. Figure 10e presents the vertical profile along the CD line during Case 2’s mature stage. The primary height of these echoes is around 14 km, presenting three distinct peaks. The most pronounced echo records at about 36 dBZ. At this stage, the PD of CTH is maximized between 6 and 10 km (as seen in Figure 9b), denoting a concentration of large-area strong echoes, which suggests significant heavy precipitation, as raindrops in this mature stage consistently coalesce and grow throughout their descent, culminating in substantial precipitation [27]. Figure 10i illustrates the reflectivity profile along the EF line during Case 3’s dissipating stage. The peak height of the Ku-band echo is roughly 10 km, with the most intense echo at about 34 dBZ. In conjunction with Figure 9c, the area with weak echoes is expansive, implying subdued convective particle activity during the dissipating stage [21].
The dominant precipitation elements in each life stage are characterized by solid-phase precipitation above 5.5 km in the vertical direction. Referring to Figure 7, these solid particles are primarily ice crystals, while below 5.5 km, liquid precipitation is predominant. The vertical profile exhibits a distinct bright band, a characteristic feature of layered precipitation. Near-surface precipitation mainly consists of liquid precipitation, with the melt layer occurring at approximately 5.5 km (Figure 11). This finding aligns with Wang et al.’s (2022) conclusion regarding the height of the melt layer in SWV stratus clouds [21]. Generally, due to the changes in volume and surface features of droplets during melting, droplet reflectivity is strongest at some time within the melting process, corresponding to the single bright band in the reflectivity profile [47]. Strong echoes at 27.4°N in the developing stage (as shown in Figure 10a) and 28°N, 28.4°N, and 28.6°N in the mature stage (as shown in Figure 10e) cross the bright band, indicating heightened convective activity at these locations [48]. While the predominant feature of each SWV life stage is stratiform precipitation, there are also distinct localized convective characteristics.
DPR also provides information about the particle spectra of raindrops, including mass-weighted diameter (Dm) and normalized DSD intercepts (NW) parameters. NW is defined as the raindrop number concentration when the rain content and raindrop size are fixed. The relationship between dBNW and NW is dBNW =10log10NW. For simplification, dBNW is collectively referred to as particle number concentration [49]. Figure 10c,d illustrates the profile of DSD parameters, where Figure 10c represents the dBNW, and Figure 10d represents the Dm. The overall concentration value is relatively low in the developing stage, ranging from 28 to 36. In the mature stage’s concentration distribution (Figure 10g), the red area is more prominent than other life stages, corresponding to the large blue area in Figure 7h, which indicates a higher number of particles and significant concentration. Particularly at 28.6°N, where there is notable convective activity, the vigorous updrafts propel water particles above the bright band. At elevations surpassing the bright band, these particles tend to diminish in size owing to the colder temperatures, reducing reflectivity. Concurrently, the cooler conditions and atmospheric dynamics foster the formation of numerous small ice crystals or supercooled water droplets at such altitudes, thereby increasing particle concentration. Temperature declines and associated atmospheric processes, including ice crystal nucleation and growth, predominantly influence this observed behavior. Additionally, as these ice crystals descend, their diameters progressively enlarge [50]. The dissipating stage generally exhibits lower particle concentrations, mainly within the range of 1.1 mm.
In Section 3.1.1, the developing and mature stages contain many water particles and ice crystal particles, with a higher presence in the mature stage and fewer mixed ice particles and ice particles in the dissipating stage. Table 5 shows the mean values of particle concentrations and diameters in the lower layer (0–2 km), the middle layer (2–6 km), and the upper layer (6–20 km) of the three individual cases at different life stages, and the variation rules of droplet parameters in the life stages of the SWV in different altitude layers can be shown in this table. A more detailed conclusion can be drawn by combining the findings from Table 5. The developing stage mainly comprises many small, dense water particles in the lower and middle layers. The upper layer is composed of small and sparse ice crystal particles. The mature stage consists of smaller and sparser ice particles in the upper layer, which are carried by strong updrafts.
In contrast, the lower and middle layers comprise larger and denser water particles. These particles continually collide and grow during falling, leading to heavy precipitation [21]. In the dissipating stage, smaller and sparser water particles dominate, which are not conducive to generating heavy precipitation. This conclusion aligns with Fu et al.’s (2022) finding that precipitation echo intensity is primarily determined by the size and spectrum of precipitation particles [38].

3.2.2. Reflectivity CFAD Distribution

To further reveal the characteristics of precipitation particles described in a spatial profile, the CFAD of reflectivity factor with height, the median profile of reflectivity factor, and the height of the bright band (solid red line in Figure 11) were studied in this study (Figure 11). As can be seen from the CFAD figure, as the height increases, the reflectivity factor decreases, and the intensity range decreases. The strong updraft brings a large amount of water vapor from the lower layer to the upper layer, resulting in many ice particles and super cooled water droplets and rapidly producing large particles with high concentration. When these larger and faster-falling ice particles descend, the echo forms an apparent vertical core, most evident in the mature stage (Figure 11b). Precipitation CFAD in the three life stages also exhibits a typical layered feature, and this verifies the conclusion in Section 3.2.1 that each life stage is stratiform precipitation, with four distinct turning points (labeled 0–3) corresponding to the boundaries of different microphysical processes [27]. In stratiform precipitation, vertical air movement is generally small compared to the fall rate of precipitation droplets [30]. The droplet undergoes various microphysical processes on its way down and eventually falls to the ground. The top 0–1 region corresponds to the growth of ice droplets and is the slowest microphysical growth pattern. The microphysical process in this region is also known as the Bergeron-Findeisen process, by which ice crystals form water droplets and grow slowly by “grabbing” water vapor from the crystal [51]. Between layers 1 and 2, the ice droplets grow through condensation and aggregation. The ice droplets directly collect cloud water that freezes upon contact, significantly accelerating the growth rate of precipitation droplets [52]. Zones 2–3 are the regions where the precipitation droplet melting process occurs. This region has a clear, bright band, the most prominent feature of stratiform precipitation [27]. Below the bright band, the maximum frequency of radar reflectivity in the mature stage is almost unchanged, indicating that the growth rate of cloud particle swarm slows down and the particle swarm size and concentration change little at this altitude layer. The maximum radar reflectivity gradually decreases in the developing and dissipating stages, indicating that the cloud particle swarm concentration decreases rapidly and the precipitation intensity weakens.
The solid black line represents the median profile of the reflectivity factor. It can be seen that the echo top height of the cloud in the developing stage (Figure 11a) and the mature stage (Figure 11b) is similar, reaching about 18 km. In contrast, the echo top of the cloud in the dissipating stage (right) is the lowest, only 12 km, indicating that the cloud droplet particles in the developing and mature stages are more active than those in the dissipating stage [21]. The median profile of the reflectivity factor monotonically increases with the decrease of height at 6–10 km in all three stages, indicating a rapid growth of precipitation particles at this altitude layer [53]. The median profile of the reflectivity factor remains almost unchanged below 5 km in the developing and mature stages. However, the median profile of the reflectivity factor still increases slightly at 2 km, which may be because the collision and coalescence of raindrops slightly override the surface evaporation process when falling to the surface at the lower layers. It should be noted here that since signal attenuation and ground clutter may affect precipitation below 1 km, the condition below 1 km will not be discussed [54].
Figure 11. Ku-band reflectivity CFAD distribution of precipitation elements in three life stages, labels 0–3 represent turning points in the numbers, a solid black line represents the median profile of the reflectivity, and the solid red line represents the bright band. (a) Developing stage of Case 1; (b) mature stage of Case 2; (c) dissipating stage in Case 3.
Remotesensing 15 04114 g011

3.2.3. Droplet Parameter Distribution

The above research conclusions found that the droplet parameter values differ in different life stages. However, only the relative droplet size and concentration are known, but the specific range values cannot be determined. Therefore, according to GPM, the precipitation droplet spectrum information was provided to calculate the occurrence frequency of the Dm of precipitation particles in the precipitation system at each dBNW, which can reflect each life stage’s droplet parameter distribution characteristics more accurately. Figure 12 shows the CFAD of near-surface DSD, where the value of each bin represents the frequency of occurrence relative to the absolute maximum frequency:100% corresponds to 185 observed values in the developing stage of an individual case (Figure 12a). During the developing stage of Case 1, the Dm range (0.7–1.8 mm) was relatively smaller, while the dBNW range (27–35) was more extensive. dBNW (20–45) was more prominent, and Dm (0.8–2.6 mm) was more prominent during the mature stage of Case 2. In Case 3, there were only 90 observed values in the dissipating stage, and the Dm near the surface was small, but the dBNW was mainly between 25 and 35, which was challenging to produce a significant precipitation rate. This result is consistent with the conclusion in Section 3.2.1, which again confirms that in the mature stage, the precipitation near the surface is mainly composed of large and dense particles, leading to the most significant precipitation. In the developing stage, the precipitation particles are mainly composed of small and dense particles, which leads to a low precipitation rate. In the dissipating stage, the particles are mainly composed of small and sparse particles, which is challenging to produce a significant precipitation rate.
There were significant differences in DSD for each life stage. The distribution range of DSD in the mature stage is the largest, corresponding to the larger and more precipitation particles generated by the collision-polymerization process on the surface, and the more significant surface precipitation, which is similar to the conclusion of Wang et al. (2022) in their analysis of microphysical characteristics of snowfall clouds that the value is positively correlated with the surface precipitation [55]. Zagrodnik et al. (2018) found that effective Dm and dBNW configuration on the Olympic Mountain would moderately increase precipitation, and a large number of small particles (large dBNW) were prone to collide and coalesce to form intense precipitation, which was consistent with the results shown in Figure 11 [56]. Based on the analysis of the near-surface precipitation rate data in Figure 7, it is concluded that the configuration of Dm 1.0–1.2 mm and dBNW 31–35 generates the most near-surface precipitation.
The observed CTH from FY-4A is further analyzed to explore its potential as an indicator of DSD. By ranking and averaging the CTH, the relationship between CTH and near-surface DSD in each life stage is separately calculated (Figure 13). Each point represents the mean value of a 10% sample size of CTH, the bar chart corresponds to the maximum and minimum values of the DSD in this 10% sample, and the red line represents the average value. Figure 13 shows a weak negative correlation between the mean CTH value and dBNW, with the mean dBNW value mainly ranging from 25 to 35. There is also a weak positive correlation between CTH and the mean Dm value, with the mean Dm value mainly ranging from 1.0 to 1.4 mm. The near-surface DSD in the mature stage exhibits the widest range at each height. One possible explanation for this phenomenon is that intense convection can transport larger particles or more hydrometeors more effectively to higher altitudes, simultaneously inducing more latent heat release and accelerating updraft [30]. As a result, there is a high concentration of particles and larger particles at higher CTH levels in the mature stage. This finding aligns with Liu et al.’s (2007) study on the global distribution of deep tropical convection, which revealed that greater differences in CTH corresponded to lifting larger particles through strong upwelling [56]. Consequently, the particles that fall to the surface appear larger. These results suggest that CTH, as an indicator of convective intensity, actually characterizes the concentration and size of raindrops [57].

4. Discussion

It is important to note that the results of this study could be more comprehensive. Firstly, due to data limitations, the study is based on only three individual cases, necessitating further investigation to understand SWV’s characteristics comprehensively. In the future, additional data should be collected to increase the sample size and provide better insights into the changes in precipitation characteristics of the SWV across different seasons and specific regions. Expanding the sample size will make it possible to more accurately capture the changing patterns and trends of the SWV, thus improving our understanding of its precipitation characteristics. Secondly, this study focuses more on qualitative analysis. The accuracy of satellite detection data needs to be further verified. Although FY-4A and GPM satellite data were utilized in this study, there are still uncertainties associated with the inversion algorithm and accuracy of satellite data. Therefore, additional inversion validation and comparative analysis with ground observation data are required to ensure the reliability of research results. By comparing the satellite data with ground observation data, the applicability and accuracy of satellite data in studying SWV can be evaluated, thereby providing a more reliable basis for future research.
In summary, this study extensively examines the precipitation structure characteristics of the SWV using multi-satellite detection data. The results establish the relationship between cloud physical processes, precipitation intensity, and SWV particle characteristics while highlighting uncertainties and avenues for future research. However, to reach a more comprehensive and reliable conclusion, it is necessary to enrich the sample size further and verify the accuracy of satellite data which will aid in better understanding and predicting the evolution of the SWV weather system and enhance the value and accuracy of meteorological satellite data, thereby providing more precise information for areas such as weather forecasting and disaster warning.

5. Conclusions

This study investigates the evolution of precipitation structure characteristics in three SWV cases by combining observations from FY-4A and GPM. The main conclusions are as follows:
  • SWV Life Stage Characteristics: Each SWV stage exhibits unique traits. The developing and mature stages show strong radar echoes and high Cloud Top Heights (CTH). In this stage, large and effectively radiused ice particles with similar number density encourage collision and rapid growth into larger particles, accelerating precipitation. The mature stage presents the most ice particles and vigorous convective activity. The dissipating stage, in contrast, shows fewer mixed and ice particles, resulting in less intense and smaller precipitation areas. The study further illuminates the Cloud Type (CLT) sequence across the SWV life cycle.
  • Precipitation Structure and Vertical Profiles: Each life stage’s precipitation structure and vertical profiles reveal that near-surface precipitation primarily consists of liquid precipitation, with the melt layer around 5.5 km. Stratiform precipitation is prevalent in all SWV stages, and there is prominent local convective activity during the developing and mature stages. Reflectivity peaks during the mature stage indicate a slow growth rate and minimal cloud particle cluster changes. Below the bright band, the developing and dissipating stages show a gradual decrease in maximum reflectivity, indicating a decline in cloud particle concentration and precipitation intensity. However, the median profile of the reflectivity slightly increases at lower altitudes during the developing and mature stages, implying a dominance of raindrop collision and coalescence over evaporation.
  • Relationship Between Particle Characteristics and Precipitation Intensity: This study explores the interplay between particle characteristics and precipitation intensity across different stages. The mature stage, marked by large and densely packed particles, exhibits the most pronounced near-surface precipitation. Conversely, with its smaller yet densely packed particles, the developing stage yields a more modest precipitation rate. The dissipating stage, featuring smaller and less dense particles, rarely produces substantial precipitation. Furthermore, the research indicates that as cloud height increases, so does precipitation intensity, which suggests that CTH can effectively indicate convective intensity and represent raindrop distribution.

Author Contributions

Conceptualization, H.W., J.X. and Z.L. (Zhi Li); methodology, H.W., J.X., Z.B. and R.Y.; software, H.W. and Z.L. (Zhihao Liu); formal analysis, H.W, J.X. and Z.B.; writing—original draft preparation, J.X.; writing—review and editing, H.W., J.X. and Z.L. (Zhi Li); visualization, H.W., J.X. and R.Y. All authors have read and agreed to the published version of the manuscript.

Funding

This work was sponsored by the Key R&D Program of the Yunnan Provincial Department of Science and Technology (202203AC100006-01), the Project of the Sichuan Department of Science and Technology (2023NSFSC0244), the Key Laboratory of Atmospheric Sounding Program of China Meteorological Administration (2022KLAS01Z), the Key Grant Project of Science and Technology Innovation Capacity Improvement Program of CUIT (KYQN202217), the Second Comprehensive Scientific Investigation of Tibetan Plateau-Extreme Weather and Climate Events and Disaster Risk by the Ministry of Science and Technology (2019QZKK0104), the Key Laboratory of atmospheric Souning and the Atmospheric Sounding Engineering Technology Research Center of the China Meteorological Administration (2021Z09), the Opening Foundation of Key Laboratory of AtmosphereSounding, the China Meteorological Administration and the CMA Research Centre on MeteorologicaObservation Engineering Technology (U2021Z01) and the project of the Key Laboratory of Radar Meteorology, China Meteorological Administration (2023LRM-A01).

Data Availability Statement

Publicly available datasets were analyzed in this study. This data can be found here: (1) This study utilizes version 1C.GPM-GMI data from GMI, available at https://disc.gsfc.nasa.gov/datasets/GPM_1CGPMGMI_07/summary, assessed on 11 October 2021. (2) The satellite data used in this study were product 2A.DPR_FS of the GPM version 07 dual-frequency joint inversion at https://disc.gsfc.nasa.gov/datasets/GPM_2ADPR_07/summary, assessed on 11 October 2021. (3) Cloud properties products provided by FY-4A at http://satellite.nsmc.org.cn/PortalSite/Data/Satellite.aspx, assessed on 5 January 2022.

Acknowledgments

We would like to thank NASA and NSMC for providing the data used in this study. Additionally, we extend our appreciation to the reviewers for their valuable feedback and insightful suggestions, which significantly contributed to enhancing the quality of this manuscript.

Conflicts of Interest

The authors declare no conflict of interest.

References

  1. Yan, Y.; Wang, H.; Li, G.; Xia, J.; Ge, F.; Zeng, Q.; Ren, X.; Tan, L. Projection of Future Extreme Precipitation in China Based on the CMIP6 from a Machine Learning Perspective. Remote Sens. 2022, 14, 4033. [Google Scholar] [CrossRef]
  2. Wang, H.; Yan, Y.; Long, K.; Chen, Q.; Fan, X.; Zhang; Tan, L. Relationships Between Rapid Urbanization and Extreme Summer Precipitation Over the Sichuan–Chongqing Area of China. Front. Earth Sci. 2022, 10, 909547. [Google Scholar] [CrossRef]
  3. Yue, J.; Li, G.P. Diagnostic Analysis of the Impact of Atmospheric River in a Persistent Heavy Rainfall in Sichuan Basin. J. Chengdu Univ. Inf. Technol. 2015, 30, 72–80. [Google Scholar] [CrossRef]
  4. Zhou, C.H.; Xiao, D.X.; Yu, S.H. Evolution characteristics of mesoscale system during “8.11” extremely heavy rainstorm in Sichuan Basin in 2020. J. Trop. Meteorol. 2022, 38, 812–824. [Google Scholar] [CrossRef]
  5. Yu, S.W.; Zhang, L.F.; Wang, Y. Characteristics of stratospheric gravity waves in an eastward moving Southwest Vortex process. J. Trop. Meteorol. 2022. [Google Scholar]
  6. Qu, D.; Li, Y.Q. Characteristics of the Three-Dimensional Circulation and Dynamic Structure of Jiulong Vortex of Southwest China Vortex. Plateau Meteorol. 2021, 40, 1497–1512. [Google Scholar] [CrossRef]
  7. Kang, L.; Hao, L.P.; Niu, J.L. Feature Analysis on Southwest Vortex of Triggering Rainstorm. Plateau Meteorol. 2011, 30, 1435–1443. [Google Scholar]
  8. Fu, S.; Li, W.; Sun, J. Researchers from Nanjing University Report New Studies and Findings in the Area of Atmospheric Science (Universal evolution mechanisms and energy conversion characteristics of long-lived mesoscale vortices over the Sichuan Basin). Sci. Lett. 2015, 16, 127–134. [Google Scholar] [CrossRef]
  9. Cheng, X.L.; Li, Y.Q.; Xu, X.D. An analysis of an extreme rainstorm caused by the interaction of the Tibetan Plateau vortex and the Southwest China vortex from an intensive observation. Meteorol. Atmos. Phys. 2016, 128, 373–399. [Google Scholar] [CrossRef]
  10. Zhai, D.H.; Liu, D.; Li, Q.; Wang, Z. Feature Analysis of Southwest Vortex Causing Heavy Rain in Western and Middle Chongqing. Plateau Meteorol. 2014, 33, 140–147. [Google Scholar] [CrossRef]
  11. Lu, P.; Li, P. The lmpact of Southwest Vortex Intensive Sounding Data on AREM Model Initial Values and Its Moving Path. Plateau Mt. Meteorol. Res. 2015, 35, 1–6. [Google Scholar]
  12. Cheng, X.L.; Li, Y.Q.; Xu, X.D.; Heng, Z.W. Research and Numerical Simulation of a Torrential Rain Caused by the Southwest China Vortex during Flood Period. Plateau Meteorol. 2019, 38, 359–367. [Google Scholar] [CrossRef]
  13. Yang, B.X.; Zhuo, W.; Zhang, X.J.; Fan, J. Analysis of the Effect of Southwest Vortex on Rain in Xichang Launch Site. Plateau Mt. Meteorol. Res. 2011, 31, 30–34. [Google Scholar] [CrossRef]
  14. Chen, K.Y.; Fan, J.; Xian, Z.P. Assimilation of MWHS-2/FY-3C 183 GHz Channels Using a Dynamic Emissivity Retrieval and Its Impacts on Precipitation Forecasts: A Southwest Vortex Case. Adv. Meteorol. 2021, 2021, 6427620. [Google Scholar] [CrossRef]
  15. Wang, H.; Li, Z.; Zhang, T.; Che, Q.Q.; Guo, X.; Zeng, Q.Y.; Xiang, J. Downscaling of GPM satellite precipitation products based on machine learning method in complex terrain and Limited observation area. Adv. Space Res. 2023, 72, 2226–2244. [Google Scholar] [CrossRef]
  16. Shi, Y.L.; Luo, Z.X.; Chen, X.G.; Zhang, Q.; Liu, Y.; Liu, C. Effects of joint assimilation of FY-4A AGRI and ground-based microwave radiometer on heavy rainfall prediction. Front. Environ. Sci. 2023, 11, 1083517. [Google Scholar] [CrossRef]
  17. Niu, N.; Jiang, X.F.; Zhang, X.; Li, X. Application of FY-4 satellite products in the analysis of a rainstorm weather process. Satell. Appl. 2022, 42–48. [Google Scholar] [CrossRef]
  18. Liu, H. Deep Learning Based Recognition of Precipitation Cloud Clusters and Estimation of Precipitation Intensity Level in FY-4A Satellite Data; Nanjing University of Information Science and Technology: Nanjing, China, 2021. [Google Scholar] [CrossRef]
  19. Sun, W.J.; Chen, R.S.; Wang, L.; Wang, Y.S.; Han, C.T.; Huai, B.J. How do GPM and TRMM precipitation products perform in alpine regions? A case study in northwestern China’s Qilian Mountains. Acta Geogr. Sin. 2022, 32, 913–931. [Google Scholar] [CrossRef]
  20. Wang, H.; Wang, L.; He, J.; Ge, F.; Chen, Q.; Tang, S.; Yao, S. Can the GPM IMERG Hourly Products Replicate the Variation in Precipitation During the Wet Season over the Sichuan Basin, China? Earth Space Sci. 2020, 7, e2020EA001090. [Google Scholar] [CrossRef]
  21. Wang, H.; Tan, L.Y.; Zhang, F.G.; Zheng, J.F.; Liu, Y.X.; Zeng, Q.Y.; Yan, Y.L.; Ren, X.Y.; Xiang, J. Three-Dimensional Structure Analysis and Droplet Spectrum Characteristics of Southwest Vortex Precipitation System Based on GPM-DPR. Remote Sens. 2022, 14, 4063. [Google Scholar] [CrossRef]
  22. Mao, C.Y.; Ma, Y.Y.; Sun, H.Y. lmpact of moving-out Southwest Vortex with different paths on precipitation in central-eastern China. J. Arid Meteorol. 2022, 40, 386–395. [Google Scholar]
  23. He, G.B.; Xiao, Y.H.; Tu, N.N.; Zhang, L.H.; Chen, G. Prediction and Error Analysis of a Heavy Rain Process with GRAPESMESO Model. Plateau Mt. Meteorol. Res. 2012, 32, 8–17. [Google Scholar] [CrossRef]
  24. Pu, X.M.; Bai, A.J.; Mao, X.L. Analysis of rainstorm Process and Cloud System Characteristics Caused by Interaction between Plateau Vortex and Southwest Vortex. Adv. Meteorol. Sci. Technol. 2021, 11, 89–101. [Google Scholar]
  25. Wang, X.; Min, M.; Wang, F.; Guo, J.P.; Li, B.; Tang, S.H. Intercomparisons of Cloud Mask Products Among Fengyun-4A, Himawari-8, and MODIS. IEEE Trans. Geosci. Remote Sens. 2019, 57, 8827–8839. [Google Scholar] [CrossRef]
  26. Lu, M.; Wei, M. GPM Data Application in Analysis of Vertical Structure of Typhoon ‘Rainbow’ Precipitation. Remote Sens. Technol. Appli. 2017, 32, 904–912. [Google Scholar] [CrossRef]
  27. Chen, Y.L.; Li, W.; Chen, S.M.; Zhang, A.Q.; Fu, Y.F. Linkage between the vertical evolution of clouds and droplet growth modes as seen from FY-4A AGRI and GPM DPR. Geophys. Res. Lett. 2020, 47, e2020GL088312. [Google Scholar] [CrossRef]
  28. Li, Y.Q.; Yu, S.H.; Peng, J. 2012 Southwest Vortex Yearbook; Science Press: Beijing, China, 2013. [Google Scholar]
  29. Wang, H.; Wei, M.; Li, G.; Zhou, S.H.; Zeng, Q.F. Analysis of precipitable water vapor from GPS measurements in Chengdu region: Distribution and evolution characteristics in autumn. Adv. Space Res. 2013, 52, 656–667. [Google Scholar] [CrossRef]
  30. Houze, R.A. Structures of atmospheric precipitation systems: A global survey. Radio Sci. 1981, 16, 671–689. [Google Scholar] [CrossRef]
  31. Futyan, J.M.; Genio, A.A.D. Deep Convective System Evolution over Africa and the Tropical Atlantic. Climate 2007, 20, 5041–5060. [Google Scholar] [CrossRef]
  32. Feng, Z.; Dong, X.; Xie, B.; Mcfarlane, S.A.; Kennedy, A.; Lin, B.; Minnis, P. Life Cycle of Midlatitude Deep Convective Systems in a Lagrangian Framework. J. Geophys. Res. Atmos. 2012, 117, D23201. [Google Scholar] [CrossRef]
  33. Sun, Y.T.; Dong, X.Q.; Cui, W.J.; Zhou, Z.M.; Cui, C.G. Vertical Structures of Typical Meiyu Precipitation Events Retrieved from GPM-DPR. J. Geophys. Res. Atmos. 2019, 125, e2019JD031466. [Google Scholar] [CrossRef]
  34. Liu, X.; Chen, Y.; Guo, J.; Song, W.; Dan, J. BrightnessTemperature Characteristics of Short-Duration Heavy Rainfall in the Chengdu–Chongqing Railway Region in China. Atmosphere 2023, 14, 896. [Google Scholar] [CrossRef]
  35. Di, X.H.; Wang, X.Y.; Xiao, W.; Zhao, Q.Y. Cloud Features Classification of Short-Time Heavy Rainfall in Complex Topography of Plateau Slope. Meteorol. Mon. 2018, 44, 1445–1453. [Google Scholar] [CrossRef]
  36. Zhang, T. Study on the Relationship between Cloud Top Brightness Temperature and Rainfall in Yiwu City. Zhejiang Norm. Univ. 2009. [Google Scholar] [CrossRef]
  37. Meng, Z.Y.; Xu, X.D.; Chen, L.S. Four dimensional assimilation scheme of satellite brightness temperature data and its simulation test for “7.20” extremely heavy rainstorm in Wuhan. Chin. J. Atmos. Sci. 2002, 26, 663–676. [Google Scholar] [CrossRef]
  38. Fu, Y.F.; Luo, J.; Luo, S.; Chen, G.C.; Wang, M.X.; Sun, L.; Sun, N.; Yang, L. Rainstorm structure of a supercell cloud occurred in Chongqing in May 2018 measured by GPM DPR and GMI. Torrential Rain Disasters 2022, 41, 1–14. [Google Scholar] [CrossRef]
  39. Zhang, P.C.; Wang, Z.H. Basis of Atmospheric Micro-Wave Remote Sensing; China Meteorological Press: Beijing, China, 1995. [Google Scholar]
  40. Heymsfield, A.J.; Schmitt, C.; Chen, C.C.J.; Bansemer, A.; Liu, C.T. Contributions of the Liquid and Ice Phases to Global Surface Precipitation: Observations and Global Climate Modeling. J. Atmos. Sci. 2020, 77, 2629–2648. [Google Scholar] [CrossRef]
  41. Riedi, J.; Marchant, B.; Platnick, S.; Baum, B.A.; Thieuleux, F.; Oudard, C.; Parol, F.; Nicolas, J.M.; Dubuisson, P. Cloud thermodynamic phase inferred from merged POLDER and MODIS data. Atmos. Chem. Phys. 2010, 10, 11851–11865. [Google Scholar] [CrossRef]
  42. Bjerknes, J. On the Structure of Moving Cyclones. Am. Meteorol. Soc. 1919, 47, 95–99. [Google Scholar] [CrossRef]
  43. Xiang, S.Y.; Li, Y.Q.; Li, D.; Yang, S. An analysis of heavy precipitation caused by a retracing plateau vortex based on TRMM data. Meteorol. Atmos. Phys. 2013, 122, 33–45. [Google Scholar] [CrossRef]
  44. Wang, H.; Luo, Y.L.; Zhang, R.H. Analyzing Seasonal Variation of Clouds over the Asian Monsoon Regions and the Tibetan Plateau Region using CloudSat/CALIPSO Data. Chin. J. Atmos. Sci. 2011, 35, 1117–1131. [Google Scholar] [CrossRef]
  45. Castro, E.; Ishida, T.; Takahashi, Y.; Kubota, H.; Marciano, J.S. Determination of Cloud-top Height through Three-dimensional Cloud Reconstruction using DIWATA-1 Data. Sci. Rep. 2020, 10, 7570. [Google Scholar] [CrossRef] [PubMed]
  46. Iguchi, T.; Seto, S.; Meneghini, R.; Yoshida, N.; Awaka, J.; Kubota, T.; Kozu, T.; Chandra, V.; Le, M.; Liao, L. An overview of the precipitation retrieval algorithm for the dual-frequency precipitation radar (DPR) on the global precipitation measurement (GPM) mission’s core satellite. Proc. SPIE Int. Soc. Opt. Eng. 2012, 8528. [Google Scholar] [CrossRef]
  47. Zhang, A.; Fu, Y. Life cycle effects on the vertical structure of precipitation in East China measured by Himawari- 8 and GPM DPR. Mon. Weather Rev. 2018, 146, 2183–2199. [Google Scholar] [CrossRef]
  48. Wang, H.; Chandrasekar, V.; He, J.; Shi, Z.; Wang, L. Characteristic Analysis of the Downburst in Greely, Colorado on 30 July 2017 Using WPEA Method and X-Band Radar Observations. Atmosphere 2018, 9, 348. [Google Scholar] [CrossRef]
  49. Shen, C.; Li, G. The Vertical Structure of Orographic Precipitation during Warm Season in the Sichuan Basin and Its Surrounding Areas by Using GPM Dual-frequency Spaceborne Precipitation Rada. Plateau Meteorological. 2022, 41, 1532–1543. [Google Scholar] [CrossRef]
  50. Pang, Z.H.; Wang, D.H.; Jiang, X.L. Thermal and dynamic characteristics of convective precipitation process in summer over Qinghai-Tibet Plateau based on variational objective analysis method. Atmos. Sci. 2019, 43, 511–524. [Google Scholar] [CrossRef]
  51. Korolev, A. Limitations of the Wegener Bergeron Findeisen Mechanism in the Evolution of Mixed-Phase Clouds. J. Atmos. Sci. 2007, 64, 3372–3375. [Google Scholar] [CrossRef]
  52. Hobbs, R.P.V. The Mesoscale and Microscale Structure and Organization of Clouds and Precipitation in Midlatitude Cyclones. XII: A Diagnostic Modeling Study of Precipitation Development in Narrow Cold-Frontal Rainbands. American. Meteorological. Society. 1984, 41, 2949–2972. [Google Scholar] [CrossRef]
  53. Watters, D.; Battaglia, A.; Mroz, K.; Frédéric, T. Validation of the GPM Version-5 Surface Rainfall Products over Great Britain and Ireland. J. Hydrometeorol. 2018, 19, 1617–1636. [Google Scholar] [CrossRef]
  54. Johnson, R.H.; Rickenbach, T.M.; Rutledge, S.A. Trimodal Characteristics of Tropical Convection. J. Clim. 1999, 12, 2397–2418. [Google Scholar] [CrossRef]
  55. Wang, Z.M.; Shi, L.J.; Wang, H. Analysis of macro structure and microphysical characteristics of snow clouds innorthern Xinjiang based on GPM/DPR data. Meteorol. Mon. 2022, 48, 1140–1152. [Google Scholar] [CrossRef]
  56. Liu, C.T.; Zipser, E.J.; Nesbitt, S.W. Global Distribution of Tropical Deep Convection: Different Perspectives from TRMM Infrared and Radar Data. J. Clim. 2007, 20, 489–503. [Google Scholar] [CrossRef]
  57. Zhang, A.; Chen, Y.L.; Pan, X.; Hu, Y.Y.; Chen, S.M.; Li, W.B. Precipitation Microphysics of Tropical Cyclones over Northeast China in 2020. Remote Sens. 2022, 14, 2188. [Google Scholar] [CrossRef]
Figure 1. Schematic diagram of the topography of the Sichuan Basin.
Remotesensing 15 04114 g001
Figure 2. TBB cloud distribution map detected by FY-4A on 30 August 2020, (a) representing the stages of developing (06:00), (b) represents mature (12:00), and (c) represents dissipating (22:00). The black box is the area where SWV is captured.
Remotesensing 15 04114 g002
Figure 3. Life stage division method of SWV.
Remotesensing 15 04114 g003
Figure 4. The TBB cloud maps were detected by FY-4A during 00–23 h on 30 August 2020. The black box is the region of the entire life cycle of the SWV. The SWV life cycle time is 06:00–22:00.
Remotesensing 15 04114 g004
Figure 5. The mean value of TBB < 230 is from 00:00 to 23:00.
Remotesensing 15 04114 g005
Figure 6. The bar chart shows the precipitation from 00:00 to 23:00. The broken line chart shows the mean value of the TBB from 00:00 to 23:00.
Remotesensing 15 04114 g006
Figure 7. DPR detected near-surface precipitation rates (a,e,i) in Case 1 developing stage (16:00), Case 2 mature stage (12:00), and Case 3 dissipating stage (18:00), and GMI detected 18.7 GHz, 89 GHz, and 183 GHz channels TBB distributions (bd,fh,jl) corresponding to the life stage. The black box corresponds to the strong precipitation area detected by the first column of DPR with near-surface precipitation rate.
Remotesensing 15 04114 g007
Figure 8. Spatial distribution of CTH and CLT, (ac) Case 1 developing (16:00), mature (21:00), dissipating stage (04:00 + 1day); (df) Case 2 developing (06:00), mature (12:00), dissipating stage (22:00); (gi) Case 3 Developing (08:00), mature (13:00), dissipating stage (18:00). The black box corresponds to the strong precipitation area detected by the first column of DPR in Figure 7.
Remotesensing 15 04114 g008
Figure 9. The proportion of CTH in each life stage of three individual cases. (a) Represents Case 1; (b) represents Case 2; (c) represents Case 3.
Remotesensing 15 04114 g009
Figure 10. Profile of Case 1 developing stage (ad), Case 2 mature stage (eh), Case 3 dissipating stage (il). The first row displays the Ku-band reflectivity factor echo, the second row illustrates the phase state, the third row designates the concentration (dBNW), and the fourth row indicates the particle diameter.
Remotesensing 15 04114 g010
Figure 12. CFAD distribution map of near-surface DSD: (a) Developing stage of Case 1; (b) mature stage of Case 2; (c) dissipating stage in Case 3.
Remotesensing 15 04114 g012
Figure 13. Relationship between CTH and DSD: (a,d) Developing stages of Case 1; (b,e) nature stage of Case 2; (c,f) dissipating stage in Case 3. The bar chart corresponds to the maximum and minimum values of the DSD in this 10% sample, and the red line represents the average value of the DSD.
Remotesensing 15 04114 g013
Table 1. Instrument parameters table.
InstrumentSpatial Resolution/kmTemporal Resolution/minScanning Width/kmStart DateMain Purpose
AGRI415full disk12 March 2018obtain cloud images and quickly scan minute-level areas
DPR590120–24514 March 2014obtain more cloud and precipitation particle information
GMI13908854 March 2014measure the amount, size, intensity, and type of precipitation
Table 2. Occurrence time and influence system of Southwest Vortex (SWV).
YearMonthDayInfluence System (700 hPa)Influence System (850 hPa)
2020626Shear, SWVLow vortex
2020629SWVLow vortex
202079SWVInverted trough, Rapid
2020714SWVLow vortex
2020715SWVLow vortex
2020716SWVLow vortex
2020725ShearShear, Low vortex
2020729Southwest jetLow vortex
2020810Southwest jetLow vortex
2020811SWVLow vortex
2020816SWVSoutheast airflow, Cyclonic bending
2020830SWVLow vortex
202095SWVLow vortex
202099Shear lineLow vortex
Table 3. Time division of different life stages in three individual cases.
CaseDate (UTC)Developing StageMature StageDissipating Stage
Case 129 June 202012:00–19:0020:00–22:0023:00–04:00 (+1 day)
Case 230 August 202006:00–11:0012:00–15:0016:00–22:00
Case 316 August 202008:00–10:0011:00–13:0014:00–18:00
Table 4. Cloud phase COF at various life stages.
Life StageCaseClearWater TypeSuper cooled TypeMixed TypeIce Type
DevelopingCase10.270.130.120.110.37
Case20.080.410.180.080.25
Case30.010.30.160.090.45
MatureCase10.270.10.180.090.36
Case20.340.120.220.060.26
Case30.090.150.170.110.48
DissipatingCase10.150.230.280.070.28
Case20.370.120.250.150.12
Case30.150.110.120.160.47
Table 5. Average value of DSD at different levels in each life stage.
Heigh/kmLife StagedBNWDm/mm
0–2Developing33.591.33
Mature35.941.38
Dissipating28.571.31
2–6Developing32.531.32
Mature34.121.42
Dissipating33.481.18
6–20Developing30.331.28
Mature31.141.28
Dissipating32.611.03
Disclaimer/Publisher’s Note: The statements, opinions and data contained in all publications are solely those of the individual author(s) and contributor(s) and not of MDPI and/or the editor(s). MDPI and/or the editor(s) disclaim responsibility for any injury to people or property resulting from any ideas, methods, instructions or products referred to in the content.

