Abstract
Drone object detection faces numerous challenges such as dense clusters with overlapping, scale diversity, and long-tail distributions. Utilizing tiling inference through uniform sliding window is an effective way of enlarging tiny objects and meanwhile efficient for real-world applications. However, merely partitioning input images may result in heavy truncation and an unexpected performance drop in large objects. Therefore, in this work, we strive to develop an improved tiling detection framework with both competitive performance and high efficiency. First, we formulate the tiling inference and training pipeline with a mixed data strategy. To avoid truncation and handle objects at all scales, we simultaneously perform global detection on the original image and local detection on corresponding sub-patches, employing appropriate patch settings. Correspondingly, the training data includes both original images and the patches generated by random online anchor-cropping, which can ensure the effectiveness of patches and enrich the image scenarios. Furthermore, a scale filtering mechanism is applied to assign objects at diverse scales to global and local detection tasks to keep the scale invariance of a detector and obtain optimal fused predictions. As most of the additional operations are performed in parallel, the tiling inference remains highly efficient. Additionally, we devise two augmentations customized for tiling detection to effectively increase valid annotations, which can generate more challenging drone scenarios and simulate the practical cluster with overlapping, especially for rare categories. Comprehensive experiments on both public drone benchmarks and our customized real-world images demonstrate that, in comparison to other drone detection frameworks, the proposed tiling framework can significantly improve the performance of general detectors in drone scenarios with lower additional computational costs.
1. Introduction
As one fundamental component, as well as a bottleneck of the Unmanned Aerial Vehicle (UAV) system, object detection technology has been widely deployed in real-world remote sensing applications ranging from nature protection, geological disasters monitoring to surveillance [1,2,3]. With the rapid development of convolutional neuron networks, generic object detectors (GOD) [4,5,6] have made tremendous progress in natural scene images such as the COCO [7] and PASCAL VOC [8] datasets. However, detecting objects at diverse scales in UAV-captured images with high efficiency (e.g., Visdrone [9], MOHR [10], and UAVDT [11]) is still a challenging task that desires satisfactory performance.
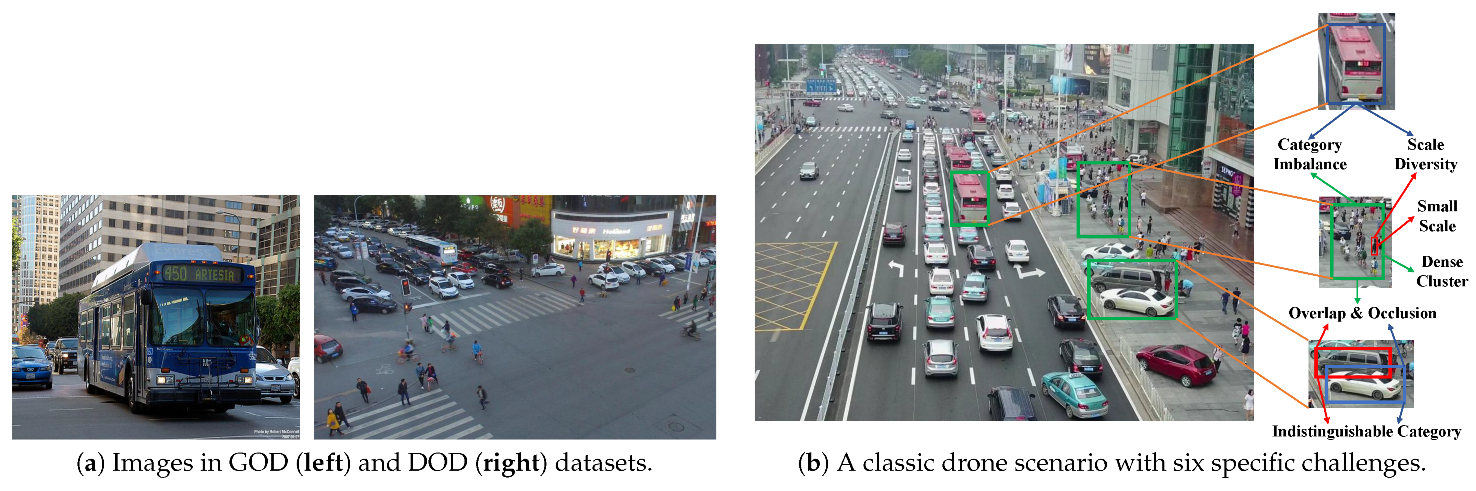
As illustrated in Figure 1, we summarize six major and specific challenges in drone object detection (DOD): (1) small scale, (2) dense cluster, (3) overlap and occlusion, (4) scale diversity, (5) category imbalance, (6) indistinguishable category. Specifically, the insufficient and weak appearance representation of tiny objects significantly degrades the detector’s performance, which is the primary challenge in both tiny object detection (TOD) and DOD task. Furthermore, tiny objects in drone images always cluster together, forming dense clusters where objects are unevenly distributed and become overlapped/occluded by each other. However, as UAVs typically fly at low or medium altitudes and capture images from an angle of depression, there exists remarkable scale diversity between close and distant objects. Additionally, certain categories naturally possess significant scale diversity, e.g., the pedestrian class versus the truck/bus class. Therefore, a DOD detector should handle the objects at all scales at the same time. Concerning classification, for one thing, as drone images are always captured in specific scenarios like urban areas, some classes appear more frequently and occupy the majority of annotations, leading to significantly imbalanced class distributions, i.e., the long-tail problem. For another, certain classes are hard to distinguish, such as motor vs. bicycle, especially when dealing with tiny objects.

Figure 1.
Classic scenarios and challenges in DOD task. The general image is sampled from the MS COCO [7] dataset, and the drone images are from VisDrone-DET [9].
Facing the challenge of detecting tiny objects, the most straightforward approach is to increase the input resolution. However, in general images, both the relative and absolute scales of tiny objects are small, limiting the effects of enlarging. Fortunately, with the development of payloads on drones, recent drone-captured images usually have much higher resolutions. For instance, nearly half of the images in VisDrone [9] are in 1080P resolution, and the highest resolution in the more recent drone dataset MOHR [10] even surpasses 8K. Thus, although the relative scales of tiny objects in recent drone images are still small, the number of occupied pixels may be sufficient. To the best of our knowledge, DOD methods dedicated to enlarging tiny objects can be mainly divided into the following four types:
- Global Scaling: directly scaling the whole image.
- Super Resolution [12,13,14]: introducing super-resolution (SR) modules such as GAN to increase the resolution of the images or feature maps.
- Tiling [15,16,17,18]: partitioning the original image into patches by uniform slicing window.
- Cluster Region [19,20,21,22]: first coarsely estimating and cropping the density maps or cluster regions (CRs) by a pre-trained network, and then inferring the fine-grained location of objects on CRs.
Global scaling is straightforward and effective but leads to a quadratic increase in computational expense, especially during the training phase. SR methods not only have huge input resolution but also introduce additional computation-expensive modules. Tiling can be viewed as an indirect and local scaling manner, where the additional operations in fore-processing and post-processing mainly include image partitioning, coordinate converting, and prediction fusing. Although tiling can effectively enlarge tiny objects, the object truncation caused by partitioning will result in inaccurate, partial, and redundant predictions (an object may be split into several parts, and each of the parts will be predicted as an individual object). Furthermore, large objects, whose sizes are close to or even over the patch size, will suffer an anchor-mismatch and heavy truncation in local detection, even though they are easy for global detection. Consequently, recently more efforts are spent on CR-based methods because they can actively acquire more effective patches.
However, compared to tiling methods, the two-stage architecture and extra operations of CR methods are more inefficient and complex. More importantly, the overall performance of the detection framework is limited by the CR extractor, since the inaccurate CR estimation will also pose truncation and missed detection. On the contrary, tiling methods exhibit neat and end-to-end architecture, making them more friendly to deployment and practical applications. Besides, we believe that, with appropriate patch settings, a prediction fusion strategy, and a matched training pipeline, it is possible for tiling methods to overcome the scale diversity and truncation problem. Consequently, in this work, we present an improved tiling detection framework with both high efficiency and outstanding performance.
First, we review and formulate the tiling inference pipeline. A mixed data strategy is adopted to deal with scale diversity. Specifically, apart from the local detection on patches, we also conduct the global detection on the corresponding original image to maintain the performance of large objects. Patches and the complete image are assembled into a mini-batch tensor for parallel inference. Regarding patch settings, for one thing, patches are set to have overlaps with each other to address the truncation of tiny objects. For another, the side lengths of patches have a fixed relative ratio with the image size instead of absolute lengths, so that the local and global detection can employ the same model rather than two independent models. As the majority of additional operations are performed in parallel, the tiling pipeline still maintains high efficiency.
Correspondingly, to keep the consistency of the model during the inference and training phases, we also take the mixed training strategy that the training data consists of both the patches and original images. However, if merely utilizing pre-cropped patches with the same patch settings as inference, some patches may contain very few objects or even only the background, hindering the learning of the model. Thus, we produce the training patches by random online anchor-cropping to ensure that a patch includes at least one valid annotation and meanwhile enrich the scenarios.
Due to the inherent discrepancy in relative scale distributions between patches and original images, the anchors for local and global detection inevitably have a misalignment. To keep the scale invariance, SNIP [23] proposes a multi-scale training framework, where each level of the image pyramid corresponds to a specified range of object scales. Besides, the simple fusion manner in inference will introduce numerous redundant predictions. Similarly, we design a scale filtering mechanism for both training assignment and prediction fusion to properly assign the objects at diverse scales to local and global detection tasks.
In addition, although anchor-cropping is adopted to produce valid training patches, the patches still contain fewer examples than the original image. Furthermore, truncation checking and scale filtering will further reduce annotations. Thus, we devise two augmentations customized for tiling detection, aiming at increasing the number of valid objects and generating more challenging drone scenarios, including:
- Mosaic Plus: in addition to the combination manner, we introduce more diverse stitching manners in Mosaic augmentation to fully disrupt the semantic features of input images and accelerate the training process.
- Crystallization Copy-paste: in addition to the normal random copy-paste, we propose a crystallization copy-paste to simulate the realistic dense clusters with overlapping and raise the appearance probability of rare categories to relieve category imbalance.
In summary, our contributions are listed as follows:
- We propose an improved tiling detection framework with a mixed data strategy and scale filtering mechanism to avoid truncation and handle objects in all scales, and generate effective training patches by online anchor-cropping.
- We devise two augmentations customized for tiling detection to produce more challenging drone scenarios, simulate dense clusters and alleviate the long-tail problem.
- We conduct comprehensive experiments on both public DOD benchmarks and real-world drone images to validate the outstanding performance and efficiency of the proposed tiling framework. On VisDrone and UAVDT, it surpasses the best cluster-region-based method ZR-DET [24] by 1.3 and 7.8 in terms of average precision and meantime achieves over 4 times faster inference speed on GPU. Furthermore, when being deployed on our edge computation equipment, the proposed tiling framework still performs well on practical drone scenarios with a real-time speed of 27 fps.
2. Related Work
2.1. General Object Detection
As one of the most popular topics in computer vision, general object detection has drawn a great deal of attention. In the early phase, detection algorithms split the input image into slices by even sliding window and utilized hand-craft features to estimate objects. With the rapid development of convolutional neural network (CNN), comprehensive extensions are continuously proposed in both the inference and training pipeline, including vision transformer [25,26,27], pyramidal neck [28,29,30], box decoding [5,31,32], label assignment [33,34,35], data augmentation [36,37,38], saliency detection [39,40,41], and so on. To date, generic object detectors can be mainly grouped into two streams: (1) Two-stage detectors, as proposed in RCNN [42], where the detection work is divided into two phases: first estimating numerous proposals and then utilizing head for more detailed regression and classification. Following this architecture, the RCNN family (e.g., Faster RCNN [4] and Cascade RCNN [43]) has been developed to produce more proper proposal regions and accomplish more accurate refinement. (2) One-stage detectors, such as RetinaNet [34] and FCOS [5], which are simplified to a single end-to-end network.
As representative one-stage detectors, the YOLO series [6,44,45,46,47] achieve solid and state-of-the-art performances as well as an excellent trade-off between accuracy and efficiency. Accordingly, they are widely utilized in real-world applications like DOD. Recently, YOLO has been released up to the eighth generation, i.e., YOLOv8 [6], which comprehensively outperforms all the previous generations. However, compared to YOLOv5 [45], YOLOv8 is more tightly encapsulated for ease of usage and calling, which sacrifices flexibility and makes it more difficult to modify the codes of the detection framework. Therefore, to quickly implement, update and validate our detection framework, we choose YOLOv5 as the baseline detector and correspondingly modify the inference and training scripts.
2.2. Tiny Object Detection and Drone Object Detection
Although modern generic detectors have made promising progress, detecting tiny objects is still the most significant challenge in both TOD and DOD tasks. Intuitively, the most straightforward trick is to expand the input size or feature resolution. Some methods introduce multi-scale representation pyramids, such as BiFPN [30] and Recursive-FPN [48], to aggregate and reinforce the features for detecting tiny objects. [20] further designs a Global Density Model which fuses the multi-level features from FPN to generate the global density map. [49,50,51,52] modify the loss function and label assignment to adapt the bounding boxes of rotated objects. Additionally, over-sampling augmentations, such as copy-paste [53,54], are also indispensable for TOD.
As modern drone-captured datasets such as MOHR [10] have provided images with ultra-high resolution (over 4K even 8K), efforts are also devoted to enriching the information of tiny objects by super-resolution. Naturally, one straightforward approach is leveraging GANs to produce super-resolution images or feature maps [13,55,56]. Additionally, HRDNet [57] proposes a High-Resolution Detection Network, which contains a Multi-Depth Image Pyramid Network to maintain multiple position information and a Multi-Scale Feature Pyramid Network to align and fuse multi-scale feature groups and reduce information imbalance. GLSAN [12] applies a super-resolution model to increase the resolution of cluster regions in CR methods. FENet [14] designs a high-resolution block and embeds it into FPN to make full use of different granularity and resolution features.
In aerial images, tiny objects are usually in large quantities and tend to form clusters where objects are unevenly distributed and have overlaps with each other. Therefore, compared to uniform partitioning [15,16,17,18], cluster region methods draw more attention from the community. Ref. [19] devises a ClusDet network including three sequential sub-networks: first a cluster proposal network estimates the cluster regions; then the ScaleNet carries out partition and padding; at last, the detector performs detection on both the chips and original image. Refs. [12,58] further design unsupervised clustering algorithms to obtain CRs, while [58,59] calculate the difficulty scores of CRs to filter easy patches. Aiming at simplifying the CR detection framework, refs. [60,61] propose obtaining CRs by predicting the density map of the input image. Ref. [62] applies reinforcement learning to learn an AdaZoom network that can find and zoom in cluster regions with adaptive magnification. Ref. [22] labels the CR as a new class and makes the baseline detector to learns to simultaneously predict objects and CRs so that it is able to avoid introducing additional modules like CR-predictor and improve efficiency. UFPMP-DET [21] directly crops the coarse object boxes instead of clusters and packs them into a mosaic image, and proposes a Multi-Proxy Detection Network to relieve classification confusion.
Despite achieving favorable results, SR and CR methods have complex and inefficient architectures and cannot perform end-to-end training and inference. Thus, we strive to yield an improved tiling detection framework with high speed and competitive performance. Additionally, we devise two augmentation operations customized for patch training.
3. Tiling Detection Framework
Generally speaking, tiling inference refers to the process of partitioning an input image into sub-patches by uniform sliding window and then respectively performing detection on the patches. However, direct partitioning will face the following main issues:
- How to properly set the scale and number of patches.
- When an object lies on the boundaries of two or more adjacent chips, it gets truncated into several parts, leading to partial, inaccurate, and redundant predictions.
- In addition to the increased risk of truncation, medium and large objects that are easily detected globally may not match anchors well, leading to a drop in performance, especially when their sizes are close to or even larger than the patch size.
- Extra operations are introduced into the fore-processing and post-processing, aggravating the computational burden.
To address the above issues, we develop an improved tiling detection framework that utilizes a mixed data strategy in both inference and training to avoid truncation and handle objects at all scales. Besides, we apply random online anchor-cropping to generate valid training patches. Furthermore, we propose a scale filtering mechanism to assign objects at diverse scales to the global and local tasks, which can obtain optimal fused predictions and keep the scale invariance.
3.1. Efficient Tiling Inference Pipeline
As shown in Figure 2a, to avoid the truncation of tiny objects, when setting the tiling patch size and number, we make adjacent sub-patches have overlaps with each other. Concurrently, to keep the performance of larger objects, we introduce global detection on the original input image. Furthermore, as the spatial sizes of the images in datasets are unfixed and we hope to simultaneously perform local and global detection employing just a single model instead of two independent models, the aspect ratio of the patches should be the same as the original image. Therefore, we choose to make patches have a fixed relative scale ratio with the original image (equal for both width and height), instead of setting fixed and absolute side lengths.
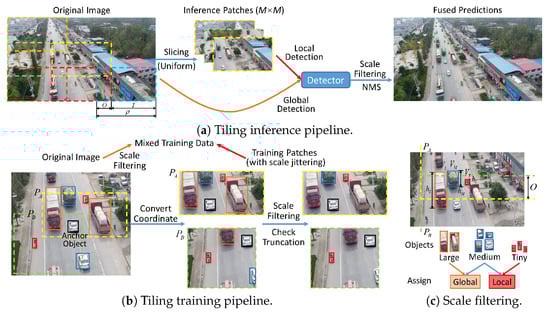
Figure 2.
Proposed tiling detection framework with the mixed data strategy, scale filtering and anchor-cropping.
Specifically, assuming the spatial size of the image is and the patch scale ratio is , the side lengths of its patches are and . Under the same model input size, the relative scale of the objects on the patches will increase by , essentially equivalent to enlarging the input image by . Let M denote the sampling number along an axis, the total patch number is and the input batch size equals . Consequently, the overlap between two consecutive chips is
That is to say, for any object whose maximum relative scale is below O, wherever it lies on the image, there must exist at least one sub-patch where this object can be fully contained without any truncation. Accordingly, the interval between chips is
which hints again that must take values from and the sampling number M should be greater than 1.
For the sake of efficiency, after resizing and padding, all the individual chips and the original images will be assembled into a mini-batch tensor for parallel inference. After scaling and adding the position bias, the predicted boxes on patches will be converted into the absolute coordinates, so that it is able to directly concatenate all the predictions and conduct the NMS operation together. As the patches possess a definite relative position relationship with the original image, the above operations can also be performed in parallel. Incidentally, in real-world UAV applications, when input images are sampled from a video stream and have a fixed size, the time of image partitioning can be ignored since the slicing indices remain constant. Actually, the majority of time consumption is attributed to the parallel inference of multiple patches.
In summary, the tiling framework adopts a mixed inference strategy. While the local detection is performed on patches that have overlaps with each other to avoid the truncation of tiny objects, the global detection on original images maintains the performance of larger objects. Moreover, the tiling inference is also highly efficient as most of the additional operations are performed in parallel.
3.2. Mixed Data Training with Anchor-Cropping
Previous typical tiling methods partition the training images in advance, adopting the same tiling settings as the inference phase, i.e., the training patches are fixed during training. Inevitably, part of patches may contain very few valid objects even merely background areas, dragging the training progress. As shown in Figure 2b, to keep the model’s consistency between the inference and training phase, we also take the mixed training strategy in the training pipeline, namely, the training images include both patches and original images. Moreover, we propose to randomly cropping the valid training patches online as an augmentation measure.
Specifically, first, since a valid training image must contain at least one complete object, a ‘cropping anchor’ will be chosen randomly from all the objects in the original image. Then, around the anchor object, randomly select the position of the patch, while making sure that the anchor must be completely included in this patch without any truncation. The basic relative width and height of the cropped patches are the same as the inference setting, and scale jittering is applied for augmentation. Eventually, the truncation situation of the rest of the annotations will be checked. If the area occupied by an object on the patch is less than 60% of its overall area, it is regarded as an invalid object and removed. Otherwise, the valid boxes will be converted into the relative coordinates on the patch and their side lengths will be scaled by the patch scaling ratio . For instance, in Figure 2b, around the anchor object (white car in black box), two training patches with scale jittering (yellow: , green: ) are randomly generated. In patch , since the truck (top) and car (right bottom) objects are heavily truncated, they are removed from the annotation list. During an epoch, 75% of the original images will be randomly selected and cropped, while 25% remain complete for global training.
3.3. Object Assignment by Scale Filtering
Referring to [23], it is crucial for proposals to match the range of input resolution. After tiling, as the relative scale of objects to patches magnifies by , the minimum relative scale of an object to the patch will accordingly become times larger than its minimum relative scale to the original image. Besides, the maximum relative object scale to the patch may exceed 1 for large objects larger than the patch. Thus, the discrepancy in the relative scale distributions between the patch and the original image will cause the misalignment between the best-matched anchors for local and global detection. Obviously, on the patch, the performance of tiny objects is improved owing to higher input resolution, while on the original image, medium and large objects already own well performance without the risk of truncation and anchor-mismatch. To address the anchor misalignment, we take a “divide and rule” strategy in both training and prediction fusion.
First, we set two relative scale thresholds and whose value lies in to classify objects as tiny, medium, or large. The value of depends on the maximum relative object scale in the whole dataset. is set below the patch overlap O since objects larger than the patch are bound to suffer truncation. As shown in Figure 2c, there are three vehicle objects at different scales near the overlap region between patch (yellow) and (green): the truck object (in the orange box) with a relative height of to the original image, the van object (blue) with a relative height of , and the tricycle object (red) with a relative height of . For , as its maximum relative scale to the patch exceeds the large-scale threshold , it is viewed as a large object which cannot match proper anchors. For , as is far smaller than O, it is regarded as a tiny object and there must exist at least one patch that can completely include it. For , as its relative scale does not satisfy the above two scale conditions, it is viewed as a medium object.
For patch inference and training, during inference, the confidence score of over-scaled predictions will be set to 0; during training, the over-scaled will be removed from the annotation list. Similarly, for global detection, if the maximum relative scale of an object/prediction to the original image lies below the tiny scale threshold , it will be regarded as a tiny object and only assigned to patches in both training and inference. For medium objects whose maximum relative scale ranges between and , they will participate in both global and local tasks.
4. Augmentations Customized for Tiling
As shown in Figure 2b, although anchor-cropping is adopted to generate valid training patches, the patches naturally contain fewer valid objects than the original images. Furthermore, the truncation checking and scale filtering operations will further reduce the example number, which delays the model learning process. To address this, we devise two augmentations customized for the tiling detection and drone scenarios, which can generate more challenging training scenarios, simulate the practical dense clusters with overlaps, and effectively increase the valid objects, especially for rare categories.
4.1. Mosaic Plus Augmentation
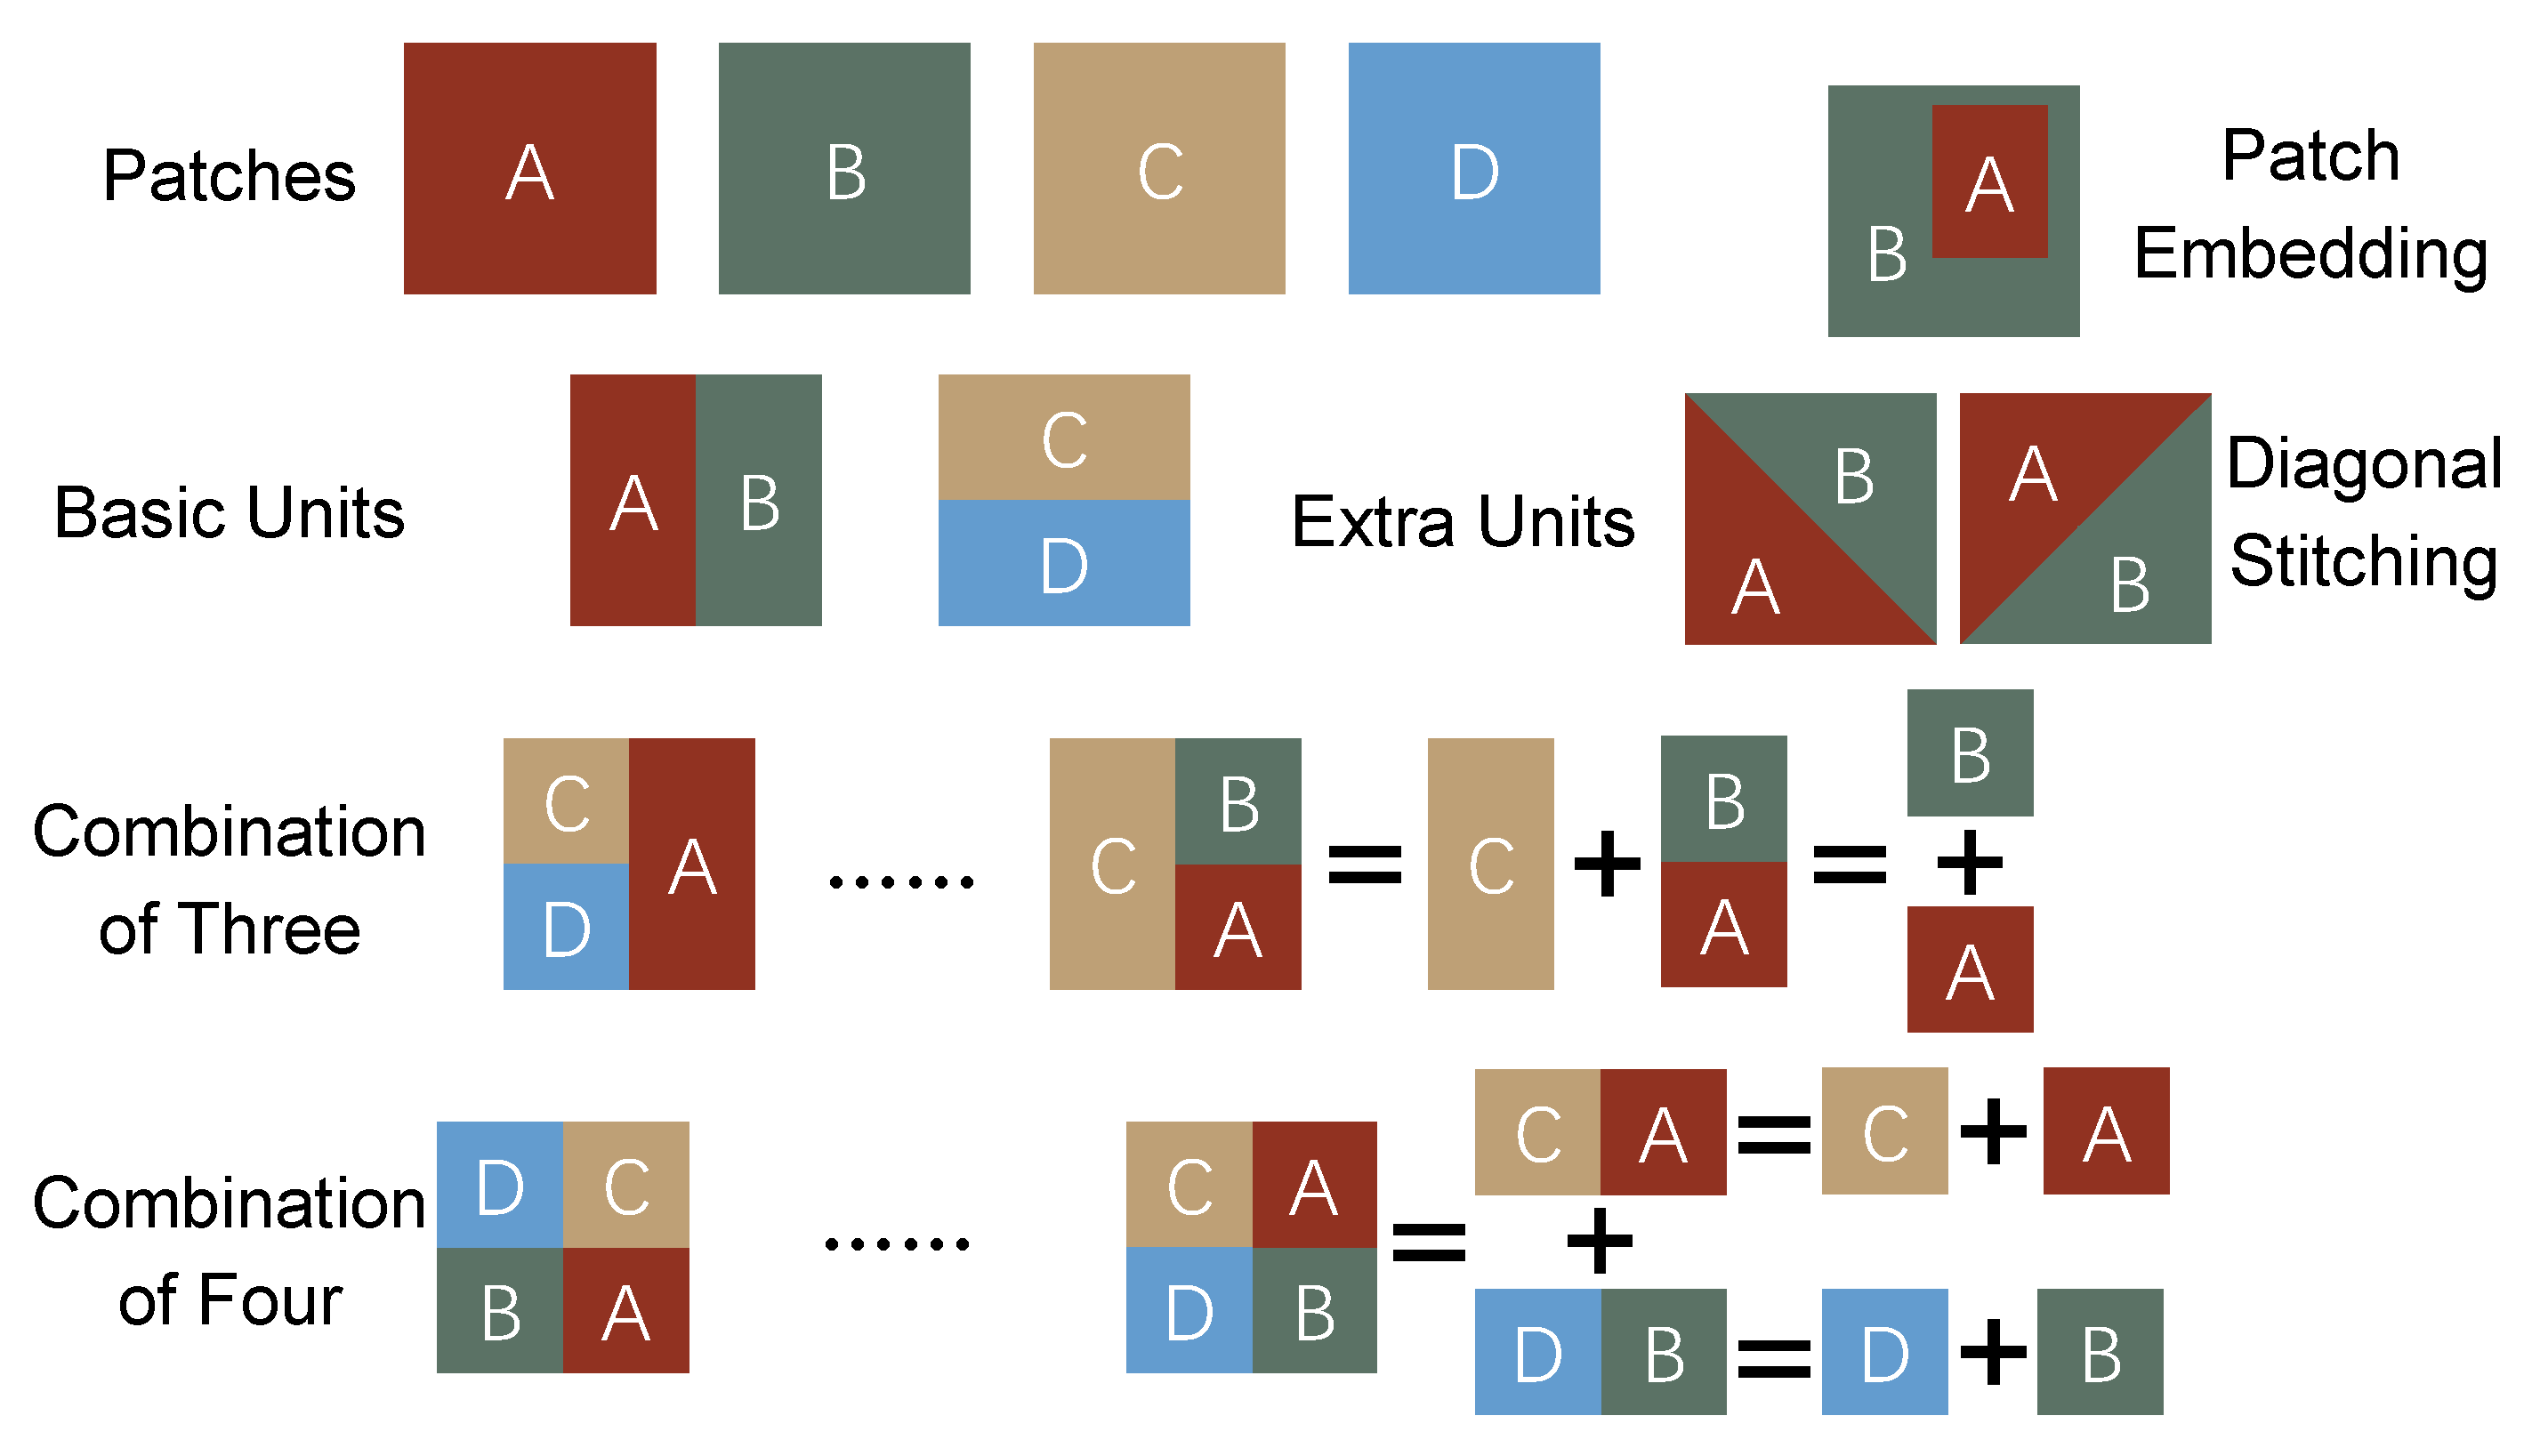
Traditional Mosaic operation [37] denotes combining four images into a new one in a manner, whose essence is to disrupt the semantic features of input images, which can introduce richer spatial context, avert overfitting by exposing the detector to a wider range of scenes and object configurations, and enhance the generalization ability across diverse real-world scenarios. However, as recent aerial images always have huge resolutions, direct stitching will further reduce the relative object scale. Fortunately, in patch training, by controlling the side lengths of sub-patches, it is able to stitch images more freely and flexibly while maintaining the scale ratio. Specifically, as illustrated in Figure 3, we add several stitching manners in the Mosaic augmentation to disrupt the semantic features more fully, increase the number of valid objects, and strengthen the background complexity.

Figure 3.
Basic units and combination manners in proposed Mosaic Plus augmentation.
First, we define the fundamental combination units in the proposed Mosaic augmentation: stitching two patches along the vertical or horizontal direction. For instance, two patches of or can generate a standard patch of . Then, we can further obtain the combination of three patches. For instance, first, two patches of fuse vertically, and this unit is then stitched horizontally with a patch of . Likewise, the normal Mosaic can be decomposed into a combination of four patches of after three fundamental stitches.
In addition to the above grid combination manners, we add two irregular manners:
- Patch Embedding: First, a normal patch of and a smaller patch of are cropped, where is a scale factor sampled from a uniform distribution . The smaller patch is then randomly placed on . Finally, similar to the anchor-cropping operation, the truncation situations of the objects on are checked to remove invalid annotations.
- Diagonal Stitching: First, two standard patches are cropped and padded to square matrices of the same size. Then, along the principal diagonal or counter diagonal, an upper triangular matrix and a lower triangular matrix are generated as patch masks. By applying these masks and combining the masked patches, we obtain a combination of the two triangular patches.
In summary, our proposed Mosaic Plus augmentation offers a more diverse set of image combination manners in addition to the default manner, which can disrupt the semantic information more fully, introduce richer spatial context, and generate more challenging scenarios. Furthermore, as each patch generated by random anchor-cropping contains as last one valid object, the minimum number of valid objects in the combination image is equal to the number of sub-patches. In other words, our proposed Mosaic augmentation can effectively multiply the number of valid objects, thereby accelerating the training process. Additionally, as reading high-resolution images are the main bottleneck in the training pipeline, the additional irregular combination manners that need fewer images can also increase training efficiency.
4.2. Crystallization Copy-Paste Augmentation
Copy-paste is an object-aware augmentation that can produce novel and challenging scenarios. Ref. [53] finds that simply choosing objects from other images and pasting them at arbitrary locations can significantly improve performance. However, to the best of our knowledge, modern drone images are typically captured in very few specific scenarios, especially in urban areas. For instance, in VisDrone [9] and UAVDT [11], the majority of objects (such as vehicles and people) lie in the road area rather than buildings or plants. Thus, the context between the object and background is also crucial for a detector. To simulate the realistic dense clusters with overlapping in drone images, in addition to the normal random copy-paste, we propose a crystallization copy-paste augmentation, where the pasted objects have the same category and similar background as the original objects.
Specifically, first, an object is randomly selected from the patch/original image as the crystallization nucleus, which can also be regarded as the kernel or seed. Then, congeneric objects are randomly selected from other images or the original image and placed around this nucleus, and the pasted objects are allowed to have slight overlaps with each other. Besides, a few objects of other categories are also pasted to fully simulate real-world clusters. So far, a crystallizing process is finished. By repeating this crystallizing process several times, a synthetic dense clusters are formed.
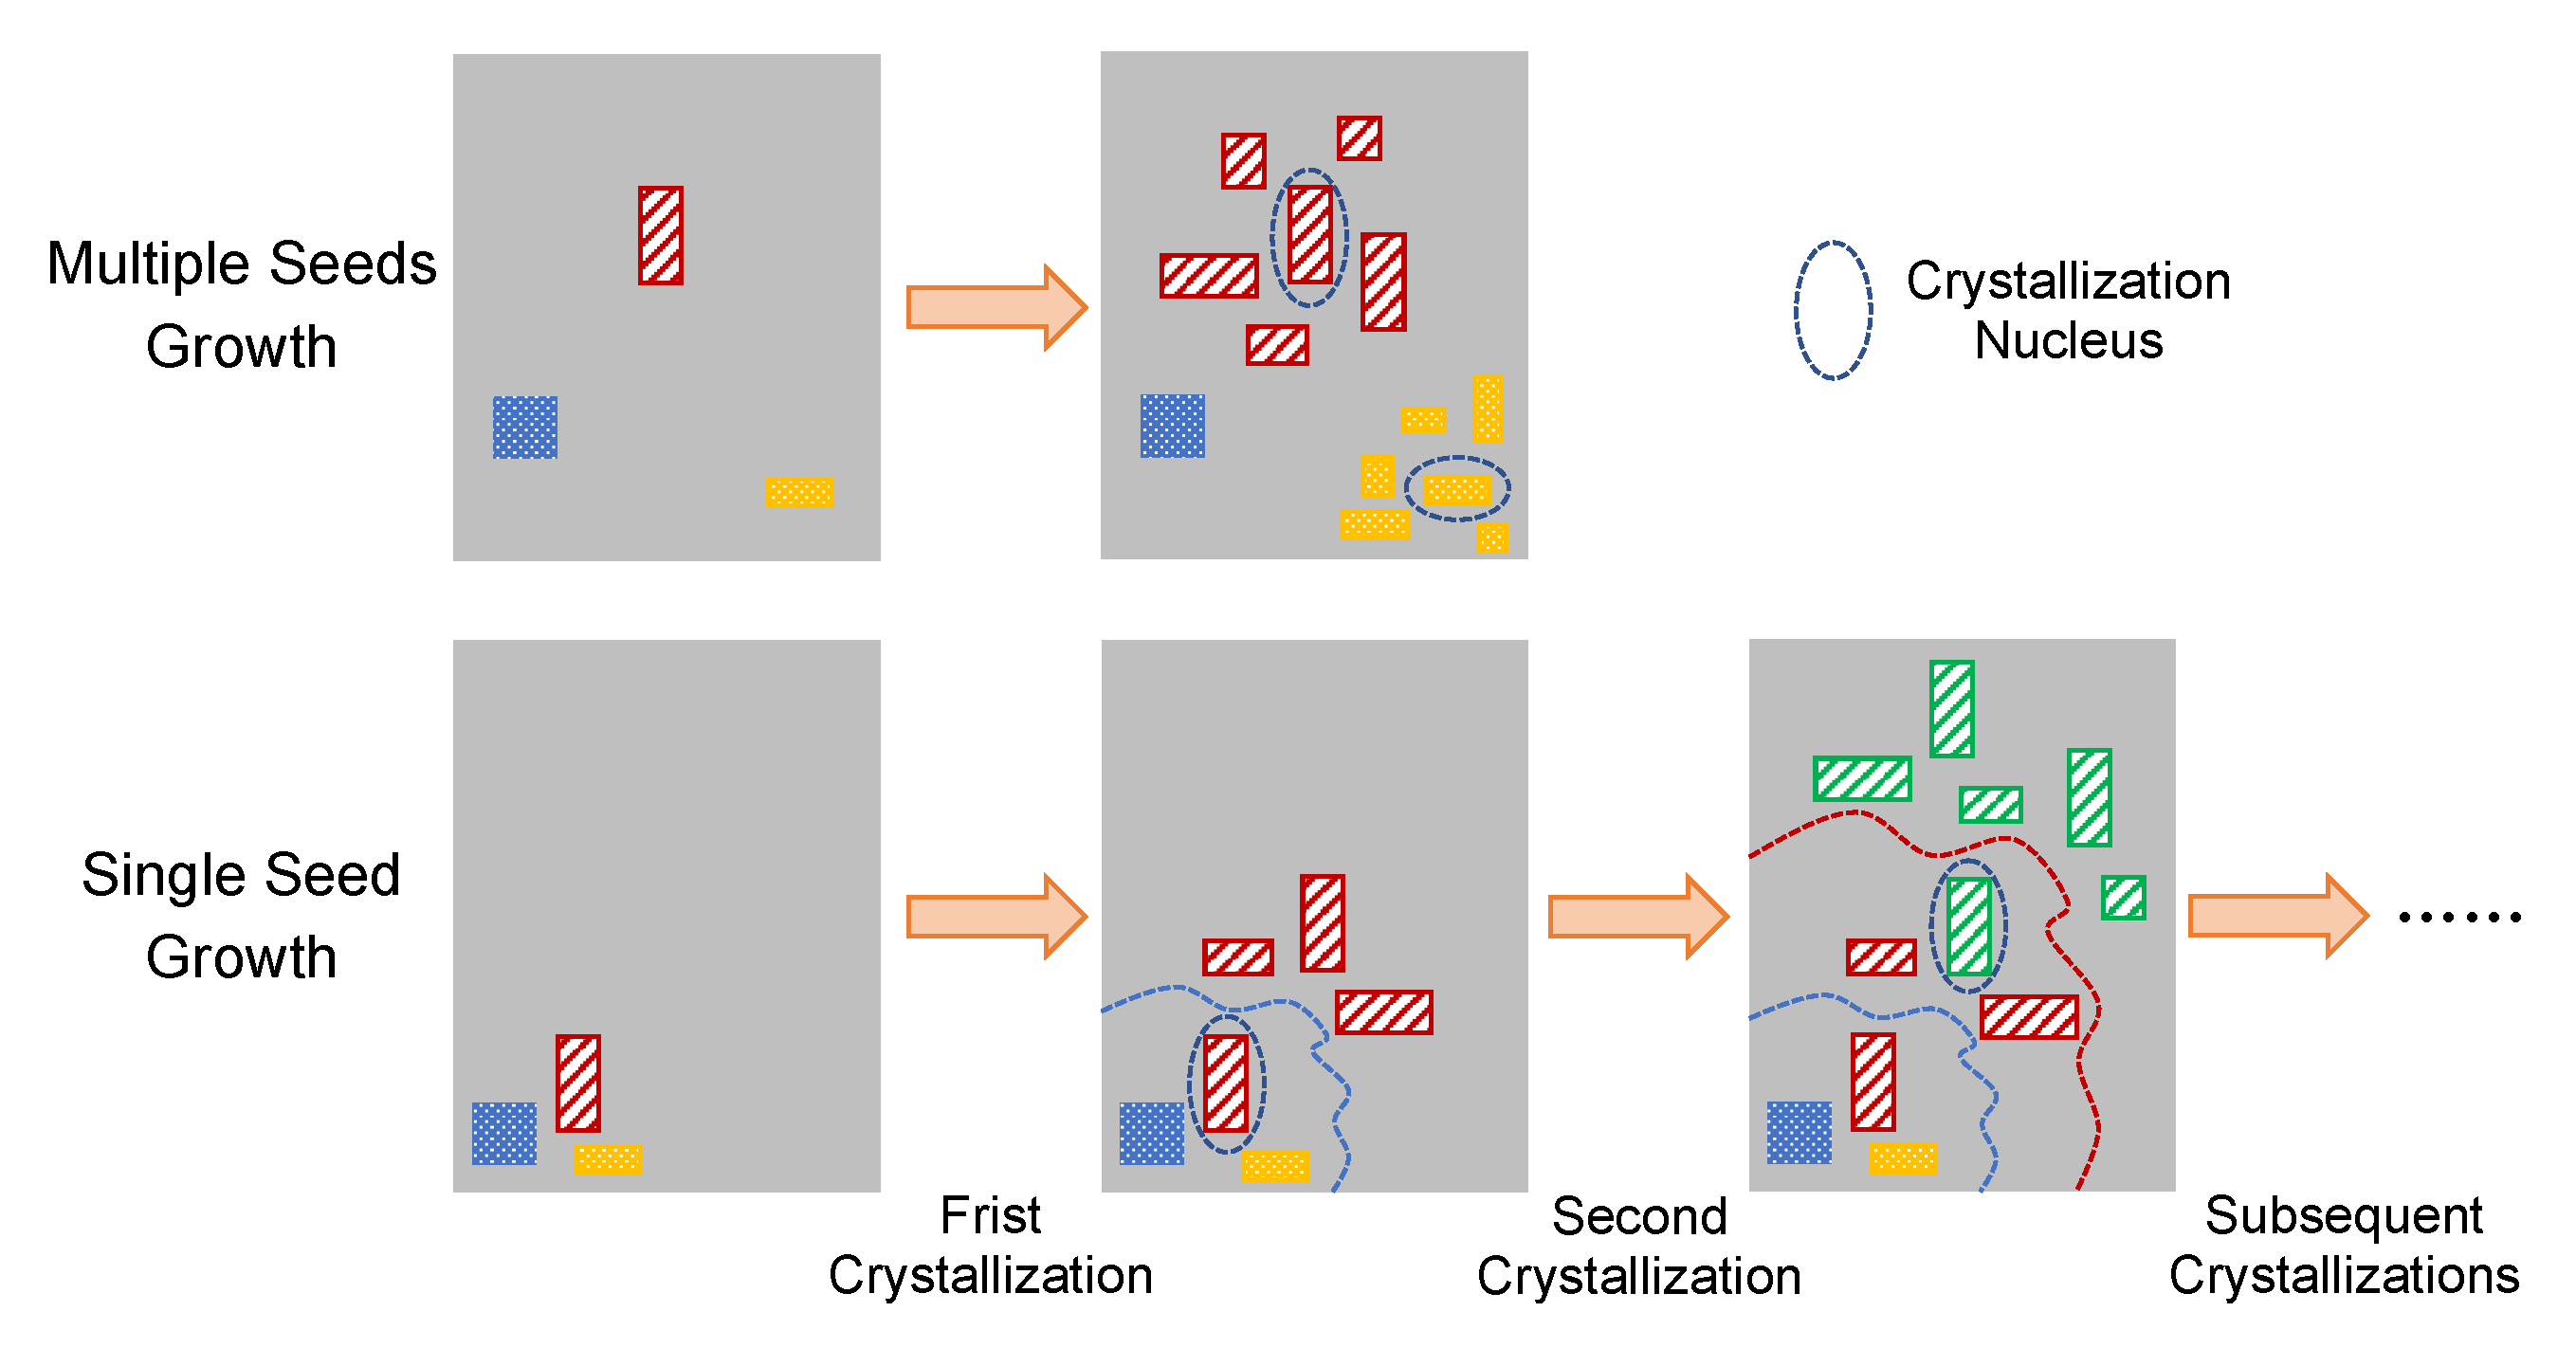
As shown in Figure 4, we define two crystal growth manners: (1) several original objects are chosen as kernels simultaneously and multiple independent clusters grow. (2) one original object is first picked as the kernel; after the initial crystallization, a new kernel is chosen from the last clusters; the crystallizing process will be repeated until obtaining a large cluster.
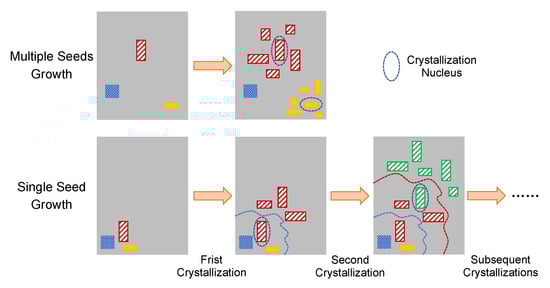
Figure 4.
Two crystal growth manners of the proposed Crystallization Copy-paste augmentation.
Besides, when selecting pasted objects, we raise the appearance probability of rare categories to balance the category number ratio. This can be deemed as a re-sampling operation which partially relieves the long-tail problem in the DOD task.
5. Experiments
5.1. Datasets and Metrics
We perform the component-wise as well as comparison experiments of our proposed tiling framework on two popular public drone benchmarks: VisDrone-DET [9] and UAVDT [11]. VisDrone-DET is a large-scale dataset consisting of 10,209 high-resolution images ranging from to (6471 for training, 548 for validation, and 3190 for testing). UAVDT contains 23,258 images for training and 15,069 images for testing. The majority of the images in these two datasets are captured in urban road scenarios, and the object categories are limited to pedestrian and vehicle.
Following the COCO [7] evaluation protocol, we adopt the Average Precision , , and to rank the precision of a detector. Specifically, is calculated by averaging over all categories, and denotes computed at a single IoU threshold of t. Furthermore, we utilize , , and to respectively measure the performances on tiny, medium, and large objects.
5.2. Implementation Details
We implement the proposed tiling detection framework based on Python and the PyTorch deep learning API. Note that both tiling methods, super-resolution methods, and cluster region methods belong to the detection framework. In other words, theoretically, any general detection network can be employed as the baseline detector. While most of the drone detection methods adopt the Faster RCNN [4] or RetinaNet [34] detector with the ResNet-50 or ResNet-101 backbone, e.g., FRCNN-R50, FRCNN-R101, and RetinaNet-R50, we choose YOLOv5 [45] due to its high flexibility and favorable balance between performance and efficiency, as discussed in Section 2.1. Accordingly, the whole framework is named as ‘slicing window YOLO’, e.g., YOLOv5s and SW-YOLOv5s. We test three versions of the YOLOv5 detector based on the CSP-DarkNet53 [37] backbones with different depths and widths: SW-YOLOv5s (0.33/0.50), SW-YOLOv5m (0.67/0.75) and SW-YOLOv5l (1.0/1.0). As shown in Table 1, in terms of parameter count and flops, ResNet-50 and CSP-DarkNet53-l can be regarded as the same-level backbones, while CSP-DarkNet53-s and CSP-DarkNet53-m are much lighter.

Table 1.
Model size comparison of the frequently used backbones in the object detection field. Params and FLOPs denote the number of parameters and floating-point operations respectively.
All models are trained on 2 RTX 2080TI GPU (Nvidia Corporation, Santa Clara, CA, USA) for a total of 300 epochs using an SGD optimizer with a momentum of 0.937 and weight decay of 0.0005. During the first 3 epochs, the learning rate increases from 0.0005 to 0.005 for linear warm-up. Afterward, it decays from 0.005 to 0.00005 following the One-Cycle learning rate decay strategy. We adopt the default input resolution of for YOLOv5 in both inference and training for all the datasets.
Regarding the hyper parameters in patch settings and the proposed scale filtering mechanism, we first empirically adopt a patch setting of , namely, the relative scale ratio , the sample number , and the patch overlap . Then, we determine the scale thresholds according to the scale distribution of the VisDrone dataset: During training, we set to 0.65, which is close to the maximum relative object scale in VisDrone, and . During inference, we take a looser of 0.8 and a stricter of 0.08 close to the value of O, to ensure that tiny objects are merely assigned to local detection.
5.3. Comparisons with the State-of-the-Art
We comprehensively compare our tiling detection framework SW-YOLOv5 (s/m/l) with the following detection methods:
- Classic or advanced general object detectors: FRCNN-R50 [4], RetinaNet-R50 [34], TPH-YOLOv5++ [63], YOLOv8 [6] and our baseline detector YOLOv5 [45] (s/m/l);
- Previous tiling detection methods: AMRNet [16] and ASAHI [18];
- Super-resolution methods: HRDNet [57], FENet [14] and GLSAN [12];
- Cluster region methods: ClusDet [19], DMNet [60], CDMNet [61], AdaZoom [62], ZR-DET [24], UFPMP-DET [21], CZ-DET [22] and CEASC [64].
As shown in Table 2, FRCNN-R50 [4] and YOLOv5-l [45] have similar computational complexities, but the performance of YOLOv5-l is inferior to FRCNN-R50, let alone YOLOv5-s and YOLOv5-m. Thus, consider FRCNN-R50 and YOLOv5-l as the baseline detectors of the same level. Accordingly, to ensure the fairness of comparison, for methods that provide the results with different backbones/baseline detectors in their papers, we only report the results of the FRCNN-R50 version. In addition to detection metrics, we also provide the baseline detector and input resolution of each method. Additionally, for general detectors, we report the number of parameters and floating-point operations.
Table 2.
Performance comparison with state-of-the-art detection methods in // (%) on the validation set of VisDrone2019.
5.3.1. Results on VisDrone
As illustrated in Table 2, on the validation set of VisDrone [9], all of the SW-YOLOv5 detectors achieve state-of-the-art (SOTA) performances in terms of both , , and with the smallest input size. SW-YOLOv5l realizes an of 39.1, ranking first place among all tiling, SR and CR methods. Specifically, it surpasses the best tiling method ASAHI [18], SR method FENet [14], and CR method ZR-DET [24] by large margins of 3.7, 4.6, and 1.3 respectively. Moreover, while our tiling detection framework improves the performances of the baseline YOLOv5-s/m/l detectors by 99.4%, 91.4% and 88.0% respectively, the FRCNN-R50 [4] detector in ZR-DET [24] only reaches a relative gain of 76.7%, even without considering the benefits of increasing input size. In brief, our tiling framework remarkably outperforms all the recent and advanced tiling, SR, and CR methods in terms of both absolute performances and relative performance improvements.
To further analyze the effects of our tiling framework on different objects, in Table 3, we report the detailed performance improvements on different categories in VisDrone. Obviously, all the baseline YOLOv5 detectors have extreme performance imbalance, with large gaps between the AP scores of different categories. For instance, while their scores on the car class are over 50, their scores on bicycle are even below 5, i.e., the performance gap exceeds 10 times. Fortunately, our tiling framework can effectively narrow these performance gaps and alleviate the imbalance. Intuitively, the improvements on tiny object categories are more significant compared to larger object categories, e.g., the pedestrian class versus the car class, which highlights the effectiveness of our tiling framework. Furthermore, the improvements are also more remarkable in rare categories than common categories, such as bicycle and tricycle versus pedestrian, which can be attributed to the proposed copy-paste augmentation since it can relieve the long-tail problem to some extent.
Table 3.
Performance improvements on different categories in terms of on the val set of VisDrone.
5.3.2. Results on UAVDT
We also evaluate the tiling detectors on the UAVDT-DET [11] dataset to further validate the excellent performance of our proposed tiling detection framework. As summarized in Table 4, our tiling detectors still significantly surpass all comparison methods. Compared to the best CR method UFPMP-DET, the , , and of the SW-YOLOv5l are respectively improved by 20.3%, 22.5%, and 18.6%.
Table 4.
Performance comparison on UAVDT.
5.4. Ablation Study
5.4.1. Component-Wise Experiments
To validate the effectiveness of each part in the proposed tiling detection framework, we conduct the following component-wise experiment on the test-dev set of VisDrone. As shown in Table 5, first, we set three baseline experimental detectors: (1): standard YOLOv5s detector with an input size of ; (2): global scaling, which enlarges the input size by , i.e., 2.5; (3): basic tiling framework without any extensions, where the training patches are cropped in advance using the same patch settings as the inference phase. Experimental detector (3) is the baseline tiling framework without any improvements and also contains tiling inference, and (1) is the baseline detector of (3). In addition, we set detector (2) to compare and analyze the effects of global scaling and local scaling (tiling). Our proposed detection framework includes three mechanisms: Anchor-Cropping (AC), utilized only during training; Mixed Data (MD) and Scale Filtering (SF), which participate in both inference and training. Furthermore, the augmentation operations include the normal Mosaic, additional combination manners (Mosaic Plus), arbitrary copy-paste, and the proposed crystallization copy-paste. The above extensions incrementally constitute the complete tiling framework, labeled as the experimental detectors (4)–(10) respectively.
Table 5.
Ablation Study using the / (%) metrics on the test-dev set of VisDrone.
Note that as tiny objects occupy more than 80% of the annotations in VisDrone, they have the most remarkable impact on the overall performance. Comparing the results of the experimental detector (1) with (2) and (3), we observe that both global scaling and tiling can greatly improve the performance of the objects at all scales. We infer that the receptive field of the model is too large for tiny objects. As a consequence, the local scaling manner on patches is more effective than directly enlarging the whole image.
The results of the experimental detector (4) indicate that producing training patches by random online anchor-cropping delivers an increase of 0.38. However, comparing (4) with (5), when directly adding the mixed data strategy in the inference and training pipeline, although large objects obtain a notable improvement of 7.61 in , the overall performance drops instead, due to the poor predictions of medium and tiny objects on the original image. After adding the scale filtering, objects at diverse scales are properly assigned to the local and global detection tasks, leading to a significant performance improvement of 0.45 in (6). Furthermore, according to the results of (7)–(10), all augmentation operations steadily enhance the performance of the detection framework (by a total of 0.65 on ). Interestingly, the copy-paste augmentations slightly weaken the performance of large objects, and we conjecture the reason is that most of the pasted objects are small.
5.4.2. Efficiency Analysis
In order to analyze the effects of the proposed modifications on computation expense, we design an efficiency test in Table 6. The average detection time cost per image (in ms) is used to evaluate the speed. Note that since the proposed anchor-cropping and additional augmentations do not influence the inference process, we only focus on the impact of the mixed data strategy and scale filtering mechanism on speed, and the ‘Tiling + MD + SF’ equals SW-YOLOv5s. All speed tests are conducted on a single RTX 2080TI GPU with a batch size of 1. Additionally, to highlight the excellent efficiency of our tiling framework, we also report the detection time of five representative CR methods reported in their papers: ClusDet [19], DMNet [60], UFPMP-DET [21], ZR-DET [24] and CZ-DET [22] as well as their common baseline detector: FasterRCNN-ResNet50 [4].
Table 6.
Average time cost per image (in ms) and score of different detection methods on the val set of VisDrone. From the fourth column to the sixth column: inference time, processing time and total time (on a single RTX 2080Ti GPU, batch size = 1).
Table 6 reports the average time and corresponding on the val set of VisDrone. The original YOLOv5s detector can reach over 100 fps in resolution. Both global and local scaling can improve the performance by nearly 100%, but the time consumption multiplies. After the original image is added to the input tensor (Tiling + MD), the number of predictions accordingly increases, aggravating the computational redundancy in the NMS process. As a result, the inference and processing time both increase. However, scale filtering (Tiling + MD + SF) can partially clear redundant predictions, including some inaccurate boxes of the tiny objects in global detection and truncated large objects in local detection, saving some processing time.
Furthermore, the speed of the comparison CR methods is much far from the real-time requirement. Even the fasted CZ-DET (on an A100 GPU) runs nearly six times slower than the proposed SW-YOLOv5s (on 2080Ti), while its is lower by 1.3. On the contrary, our slowest SW-YOLOv5l achieves a speed of 20 fps while maintaining an of 39.1, outperforming all the state-of-the-art methods in terms of both precision and speed.
5.4.3. Effect of Patch Settings
In practical applications, the patch settings, specifically the patch scale factor and the patch number M, should take into account both flight altitude, camera focus, and the categories of interested objects. For instance, when a dataset merely contains tiny objects, just performing local detection is sufficient, and the patch scale can be as small as possible while ensuring that the patch overlap O can cover all the objects. Thus, to study the impact of patch settings, we carry out an experiment on the test-dev set of VisDrone. All experimental detectors are based on YOLOv5s and trained without the Mosaic and copy-paste augmentations.
As shown in Table 7, with the increase of scale magnification and sample number, the performance of the tiling framework accordingly improves, especially for tiny objects, while the computation burden also explosively grows up. Besides, comparing the between experimental detectors (3)/(2) and (4)/(5), we find that decreasing patch overlap will increase the truncation risk of medium objects, leading to a drop in performance. In summary, for VisDrone or other VisDrone-style drone datasets, it is necessary to perform global detection on original images, and the setting of offers the best balance between accuracy and efficiency.
Table 7.
Performance of different patch settings on the test-dev set of VisDrone in / (%). O denotes the overlap between two adjacent patches, and and represent the time (ms) of inference and processing respectively.
5.5. Real-World Tests
To validate the performance and efficiency of our proposed tiling detection framework in real-world UAV applications, we deploy SW-YOLOv5s on the Lynxi KA200 (https://www.lynxi.com/lingqiKA200/18.html, accessed on 1 November 2022) brain-like chip and test it on a compact DOD dataset consisting of 79 images with the resolution of 3840×2160. These images were captured by a Zenmuse H20T zoom camera mounted on our DJI-M300-RTK (https://www.dji.com/matrice-300, accessed on 1 November 2022) UAV, flying at altitudes between 50 and 120 meters (the maximum allowed altitude) over suburban roads and highways. For convenience, we adopt the same class setting as the VisDrone-DET [9] dataset but we no longer distinguish between the ‘pedestrian’ and ‘people’ categories. During onboard inference, we still adopt the patch setting but reduce the input size to . Additionally, we also report the performances of three representative general detectors: RetinaNet-R50 [34], FRCNN-R50 [4], and YOLOv8s [6], on our customized dataset, executed on a single RTX 2080Ti GPU using their corresponding default input size.
As shown in Table 8, although the tiling operation delivers huge computational costs, SW-YOLOv5 still reaches the real-time requirement with a speed of 27 fps and improves the of its baseline YOLOv5s by over 100%. Besides, it also outperforms RetinaNet-R50, FRCNN-R50, and YOLOv8s by 11.8, 15.0, and 6.8 respectively in terms of .
Table 8.
Performance comparison among RetinaNet-R50, FRCNN-R50, YOLOv8s, YOLOv5s, and SW-YOLOv5s on our customized wild drone dataset. YOLOv5s and SW-YOLOv5s () are deployed on the KA200 chip using an input size of . RetinaNet-R50, FRCNN-R50, and YOLOv8s still run on an RTX 2080Ti GPU. Inference time is reported in ms and batch size = 1.
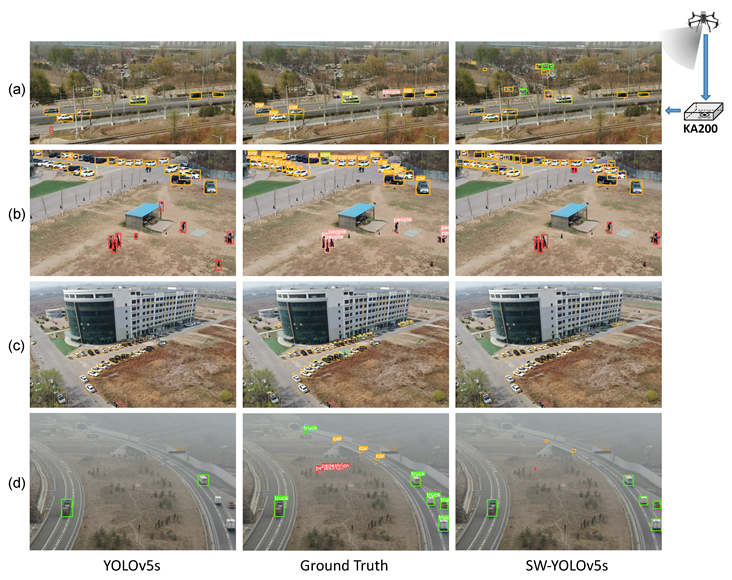
Moreover, we present several qualitative results of the baseline YOLOv5s detector and SW-YOLOv5s in Figure 5. Most notably, our proposed tiling detection framework remarkably enhances the detection capability of the baseline detector for tiny objects. Specifically, SW-YOLOv5s detect not only annotated objects but unannotated objects in distant areas of the images. For instance, in Figure 5a, SW-YOLOv5s accurately predicts the unlabeled vehicles in the courtyard and on the small road. Furthermore, in Figure 5d, SW-YOLOv5s also successfully captures distant cars and pedestrians standing in the middle wilderness, which are easy to be overlooked by cluster region methods. Besides, local scaling also helps the baseline detector distinguish ambiguous objects, such as the traffic cones in Figure 5b. Additionally, as shown in Figure 5b,c, our tiling framework can effectively detect objects in dense clusters with a low rate of missed detections, which can be attributed to the proposed crystallization copy-paste augmentation. Nevertheless, there inevitably exist some predictions of misclassification as well as redundant or partial bounding boxes which are caused by image partitioning and neglected in scale filtering.

Figure 5.
Qualitative comparisons between the baseline YOLOv5s detector (left) and the tiling detection framework SW-YOLOv5s (right) on real-world UAV-captured images. The middle column displays the ground truth bounding box. From top to bottom, four sub-images labeled as (a–d) are selected from our customized drone dataset. For better view, we merely display the main part of a whole image.
6. Conclusions
In this work, we are devoted to developing an improved tiling detection framework with both competitive performance and high efficiency for drone object detection. Specifically, the training and inference pipeline both adopt a mixed data strategy to avoid heavy truncation and handle objects at all scales. Furthermore, to obtain optimal fused predictions and keep scale invariance, a scale filtering mechanism is applied to assign objects at diverse scales to global and local tasks. Besides, the training patches are generated by online random anchor-cropping to ensure the effectiveness of the patches and enhance the diversity of detection scenarios. In addition, we devise two augmentations customized for drone scenarios and tiling detection, which can simulate the practical dense clusters with overlaps and effectively increase valid annotations, especially for rare categories. Comprehensive experiments on both public DOD benchmarks and real-world drone images prove that compared to SR, CR, and previous tiling methods, our proposed tiling detection framework can significantly improve the performance of general detectors in drone scenarios and meanwhile introduce lower additional computation costs.
Author Contributions
Conceptualization, X.Y. and Y.S.; methodology, X.Y.; software, X.Y. and J.H.; validation, J.Y. and Y.L.; formal analysis, J.Y. and Y.H.; investigation, J.Y. and J.H.; resources, Y.L. and Y.B.; data curation, X.Y. and Y.H.; writing—original draft preparation, X.Y., Y.B., Y.Z. and Y.S.; writing—review and editing, X.Y. and Y.S.; visualization, X.Y. and J.Y.; supervision, Y.Z. and Y.S.; project administration, Y.Z. and Y.S.; funding acquisition, Y.S. All authors have read and agreed to the published version of the manuscript.
Funding
This research was funded by National Natural Science Foundation of China General Program (grant number 82272130) and National Natural Science Foundation of China Key Program (grant number U22A20103).
Data Availability Statement
The current research was conducted on publicly available datasets and the code is available at https://github.com/bit-bcilab/SW-YOLOv5/ (accessed on 1 November 2022).
Acknowledgments
The authors would like to thank all the colleagues who generously provided their image dataset with the ground truth. The authors would also like to thank the anonymous reviewers for their very competent comments and helpful suggestions.
Conflicts of Interest
The authors declare no conflict of interest.
References
- Kellenberger, B.; Marcos, D.; Lobry, S.; Tuia, D. Half a Percent of Labels is Enough: Efficient Animal Detection in UAV Imagery Using Deep CNNs and Active Learning. IEEE Trans. Geosci. Remote Sens. 2019, 57, 9524–9533. [Google Scholar] [CrossRef]
- Yu, D.; Ji, S.; Li, X.; Yuan, Z.; Shen, C. Earthquake Crack Detection From Aerial Images Using a Deformable Convolutional Neural Network. IEEE Trans. Geosci. Remote Sens. 2022, 60, 1–12. [Google Scholar] [CrossRef]
- Yao, H.; Qin, R.; Chen, X. Unmanned Aerial Vehicle for Remote Sensing Applications—A Review. Remote Sens. 2019, 11, 1443. [Google Scholar] [CrossRef]
- Ren, S.; He, K.; Girshick, R.; Sun, J. Faster R-CNN: Towards real-time object detection with region proposal networks. IEEE Trans. Pattern Anal. Mach. Intell. 2016, 39, 1137–1149. [Google Scholar] [CrossRef] [PubMed]
- Tian, Z.; Shen, C.; Chen, H.; He, T. Fcos: Fully convolutional one-stage object detection. In Proceedings of the IEEE/CVF International Conference on Computer Vision, Seoul, Republic of Korea, 27 October 2019–2 November 2019; pp. 9627–9636. [Google Scholar]
- Glenn, J. Ultralytics YOLOv8. 2023. Available online: https://github.com/ultralytics/ultralytics (accessed on 10 January 2023).
- Lin, T.Y.; Maire, M.; Belongie, S.; Hays, J.; Perona, P.; Ramanan, D.; Dollár, P.; Zitnick, C.L. Microsoft Coco: Common Objects in Context. In Proceedings of the Computer Vision–ECCV 2014: 13th European Conference, Zurich, Switzerland, 6–12 September 2014; Part V 13. Springer: Cham, Switzerland, 2014; pp. 740–755. [Google Scholar]
- Everingham, M.; Van Gool, L.; Williams, C.K.; Winn, J.; Zisserman, A. The pascal visual object classes (voc) challenge. Int. J. Comput. Vis. 2010, 88, 303–338. [Google Scholar] [CrossRef]
- Du, D.; Zhu, P.; Wen, L.; Bian, X.; Lin, H.; Hu, Q.; Peng, T.; Zheng, J.; Wang, X.; Zhang, Y.; et al. VisDrone-DET2019: The vision meets drone object detection in image challenge results. In Proceedings of the IEEE/CVF International Conference on Computer Vision Workshops, Seoul, Republic of Korea, 27–28 October 2019. [Google Scholar]
- Zhang, H.; Sun, M.; Li, Q.; Liu, L.; Liu, M.; Ji, Y. An empirical study of multi-scale object detection in high resolution UAV images. Neurocomputing 2021, 421, 173–182. [Google Scholar] [CrossRef]
- Du, D.; Qi, Y.; Yu, H.; Yang, Y.; Duan, K.; Li, G.; Zhang, W.; Huang, Q.; Tian, Q. The unmanned aerial vehicle benchmark: Object detection and tracking. In Proceedings of the European Conference on Computer Vision (ECCV), Munich, Germany, 8–14 September 2018; pp. 370–386. [Google Scholar]
- Deng, S.; Li, S.; Xie, K.; Song, W.; Liao, X.; Hao, A.; Qin, H. A global-local self-adaptive network for drone-view object detection. IEEE Trans. Image Process. 2020, 30, 1556–1569. [Google Scholar] [CrossRef] [PubMed]
- Bosquet, B.; Cores, D.; Seidenari, L.; Brea, V.M.; Mucientes, M.; Del Bimbo, A. A Full Data Augmentation Pipeline for Small Object Detection based on Generative Adversarial Networks. Pattern Recognit. 2023, 133, 108998. [Google Scholar] [CrossRef]
- Zhang, H.; Li, M.; Miao, D.; Pedrycz, W.; Wang, Z.; Jiang, M. Construction of a Feature Enhancement Network for Small Object Detection. Pattern Recognit. 2023, 143, 109801. [Google Scholar] [CrossRef]
- Ozge Unel, F.; Ozkalayci, B.O.; Cigla, C. The power of tiling for small object detection. In Proceedings of the IEEE/CVF Conference on Computer Vision and Pattern Recognition Workshops, Long Beach, CA, USA, 16–17 June 2019. [Google Scholar]
- Wei, Z.; Duan, C.; Song, X.; Tian, Y.; Wang, H. AMRNet: Chips augmentation in aerial images object detection. arXiv 2020, arXiv:2009.07168. [Google Scholar]
- Akyon, F.C.; Altinuc, S.O.; Temizel, A. Slicing Aided Hyper Inference and Fine-tuning for Small Object Detection. arXiv 2022, arXiv:2202.06934. [Google Scholar]
- Zhang, H.; Hao, C.; Song, W.; Jiang, B.; Li, B. Adaptive Slicing-Aided Hyper Inference for Small Object Detection in High-Resolution Remote Sensing Images. Remote Sens. 2023, 15, 1249. [Google Scholar] [CrossRef]
- Yang, F.; Fan, H.; Chu, P.; Blasch, E.; Ling, H. Clustered object detection in aerial images. In Proceedings of the IEEE/CVF International Conference on Computer Vision, Seoul, Republic of Korea, 27 October–2 November 2019; pp. 8311–8320. [Google Scholar]
- Zhang, R.; Shao, Z.; Huang, X.; Wang, J.; Li, D. Object detection in UAV images via global density fused convolutional network. Remote Sens. 2020, 12, 3140. [Google Scholar] [CrossRef]
- Huang, Y.; Chen, J.; Huang, D. UFPMP-Det: Toward accurate and efficient object detection on drone imagery. In Proceedings of the AAAI Conference on Artificial Intelligence, Online, 20–27 March 2022; Volume 36, pp. 1026–1033. [Google Scholar]
- Meethal, A.; Granger, E.; Pedersoli, M. Cascaded Zoom-in Detector for High Resolution Aerial Images. In Proceedings of the IEEE/CVF Conference on Computer Vision and Pattern Recognition, Vancouver, BC, Canada, 18–22 June 2023; pp. 2045–2054. [Google Scholar]
- Singh, B.; Davis, L.S. An analysis of scale invariance in object detection snip. In Proceedings of the IEEE Conference on Computer Vision and Pattern Recognition, Salt Lake City, UT, USA, 18–22 June 2018; pp. 3578–3587. [Google Scholar]
- Ge, Z.; Qi, L.; Wang, Y.; Sun, Y. Zoom-and-reasoning: Joint foreground zoom and visual-semantic reasoning detection network for aerial images. IEEE Signal Process. Lett. 2022, 29, 2572–2576. [Google Scholar] [CrossRef]
- Carion, N.; Massa, F.; Synnaeve, G.; Usunier, N.; Kirillov, A.; Zagoruyko, S. End-to-end object detection with transformers. In Proceedings of the European Conference on Computer Vision, Glasgow, UK, 23–28 August 2020; pp. 213–229. [Google Scholar]
- Zhu, X.; Su, W.; Lu, L.; Li, B.; Wang, X.; Dai, J. Deformable detr: Deformable transformers for end-to-end object detection. arXiv 2020, arXiv:2010.04159. [Google Scholar]
- Liu, Z.; Lin, Y.; Cao, Y.; Hu, H.; Wei, Y.; Zhang, Z.; Lin, S.; Guo, B. Swin transformer: Hierarchical vision transformer using shifted windows. In Proceedings of the IEEE/CVF International Conference on Computer Vision, Montreal, Canada, 11–17 October 2021; pp. 10012–10022. [Google Scholar]
- Lin, T.Y.; Dollár, P.; Girshick, R.; He, K.; Hariharan, B.; Belongie, S. Feature pyramid networks for object detection. In Proceedings of the IEEE Conference on Computer Vision and Pattern Recognition, Honolulu, HI, USA, 21–26 July 2017; pp. 2117–2125. [Google Scholar]
- Liu, S.; Qi, L.; Qin, H.; Shi, J.; Jia, J. Path aggregation network for instance segmentation. In Proceedings of the IEEE Conference on Computer Vision and Pattern Recognition, Salt Lake City, UT, USA, 18–22 June 2018; pp. 8759–8768. [Google Scholar]
- Tan, M.; Pang, R.; Le, Q.V. Efficientdet: Scalable and efficient object detection. In Proceedings of the IEEE/CVF Conference on Computer Vision and Pattern Recognition, Seattle, WA, USA, 13–19 June 2020; pp. 10781–10790. [Google Scholar]
- Law, H.; Deng, J. Cornernet: Detecting objects as paired keypoints. In Proceedings of the European Conference on Computer Vision (ECCV), Munich, Germany, 8–14 September 2018; pp. 734–750. [Google Scholar]
- Yang, Z.; Liu, S.; Hu, H.; Wang, L.; Lin, S. Reppoints: Point set representation for object detection. In Proceedings of the IEEE/CVF International Conference on Computer Vision, Seoul, Republic of Korea, 27 October–2 November 2019; pp. 9657–9666. [Google Scholar]
- Zhang, S.; Chi, C.; Yao, Y.; Lei, Z.; Li, S.Z. Bridging the gap between anchor-based and anchor-free detection via adaptive training sample selection. In Proceedings of the IEEE/CVF Conference on Computer Vision and Pattern Recognition, Seattle, WA, USA, 13–19 June 2020; pp. 9759–9768. [Google Scholar]
- Lin, T.Y.; Goyal, P.; Girshick, R.; He, K.; Dollár, P. Focal loss for dense object detection. In Proceedings of the IEEE International Conference on Computer Vision, Venice, Italy, 22–29 October 2017; pp. 2980–2988. [Google Scholar]
- Ge, Z.; Liu, S.; Li, Z.; Yoshie, O.; Sun, J. Ota: Optimal transport assignment for object detection. In Proceedings of the IEEE/CVF Conference on Computer Vision and Pattern Recognition, Nashville, TN, USA, 20–25 June 2021; pp. 303–312. [Google Scholar]
- Dwibedi, D.; Misra, I.; Hebert, M. Cut, paste and learn: Surprisingly easy synthesis for instance detection. In Proceedings of the IEEE International Conference on Computer Vision, Venice, Italy, 22–29 October 2017; pp. 1301–1310. [Google Scholar]
- Bochkovskiy, A.; Wang, C.Y.; Liao, H.Y.M. Yolov4: Optimal speed and accuracy of object detection. arXiv 2020, arXiv:2004.10934. [Google Scholar]
- Zhang, H.; Cisse, M.; Dauphin, Y.N.; Lopez-Paz, D. mixup: Beyond empirical risk minimization. arXiv 2017, arXiv:1710.09412. [Google Scholar]
- Nawaz, M.; Khan, S.; Cao, J.; Qureshi, R.; Yan, H. Saliency detection by using blended membership maps of fast fuzzy-C-mean clustering. In Proceedings of the Eleventh International Conference on Machine Vision (ICMV 2018), Munich, Germany, 1–3 November 2018; Volume 11041, pp. 565–572. [Google Scholar]
- Nawaz, M.; Yan, H. Saliency Detection Using Deep Features and Affinity-Based Robust Background Subtraction. IEEE Trans. Multimed. 2021, 23, 2902–2916. [Google Scholar] [CrossRef]
- Nawaz, M.; Qureshi, R.; Teevno, M.A.; Shahid, A.R. Object detection and segmentation by composition of fast fuzzy C-mean clustering based maps. J. Ambient. Intell. Humaniz. Comput. 2023, 14, 7173–7188. [Google Scholar] [CrossRef]
- Girshick, R.; Donahue, J.; Darrell, T.; Malik, J. Rich feature hierarchies for accurate object detection and semantic segmentation. In Proceedings of the IEEE Conference on Computer Vision and Pattern Recognition, Columbus, OH, USA, 23–28 June 2014; pp. 580–587. [Google Scholar]
- Cai, Z.; Vasconcelos, N. Cascade r-cnn: Delving into high quality object detection. In Proceedings of the IEEE Conference on Computer Vision and Pattern Recognition, Salt Lake City, UT, USA, 18–22 June 2018; pp. 6154–6162. [Google Scholar]
- Redmon, J.; Farhadi, A. Yolov3: An incremental improvement. arXiv 2018, arXiv:1804.02767. [Google Scholar]
- Bochkovskiy, A.; Wang, C.Y.; Liao, H.Y.; Müller, M.; Sikora, T. YOLOv5: A State-of-the-Art Object Detection System. arXiv 2021, arXiv:2104.10403. [Google Scholar]
- Luo, X.; Wu, Y.; Wang, F. Target Detection Method of UAV Aerial Imagery Based on Improved YOLOv5. Remote Sens. 2022, 14, 5063. [Google Scholar] [CrossRef]
- Bao, W.; Du, X.; Wang, N.; Yuan, M.; Yang, X. A Defect Detection Method Based on BC-YOLO for Transmission Line Components in UAV Remote Sensing Images. Remote Sens. 2022, 14, 5176. [Google Scholar] [CrossRef]
- Qiao, S.; Chen, L.C.; Yuille, A. Detectors: Detecting objects with recursive feature pyramid and switchable atrous convolution. In Proceedings of the IEEE/CVF Conference on Computer Vision and Pattern Recognition, Nashville, TN, USA, 20–25 June 2021; pp. 10213–10224. [Google Scholar]
- Yang, X.; Yang, X.; Yang, J.; Ming, Q.; Wang, W.; Tian, Q.; Yan, J. Learning high-precision bounding box for rotated object detection via kullback-leibler divergence. Adv. Neural Inf. Process. Syst. 2021, 34, 18381–18394. [Google Scholar]
- Yang, X.; Hou, L.; Zhou, Y.; Wang, W.; Yan, J. Dense label encoding for boundary discontinuity free rotation detection. In Proceedings of the IEEE/CVF Conference on Computer Vision and Pattern Recognition, Nashville, TN, USA, 20–25 June 2021; pp. 15819–15829. [Google Scholar]
- Liu, F.; Chen, R.; Zhang, J.; Xing, K.; Liu, H.; Qin, J. R2YOLOX: A Lightweight Refined Anchor-free Rotated Detector for Object Detection in Aerial Images. IEEE Trans. Geosci. Remote Sens. 2022, 60, 1–15. [Google Scholar] [CrossRef]
- Wang, H.; Huang, Z.; Chen, Z.; Song, Y.; Li, W. Multi-Grained Angle Representation for Remote Sensing Object Detection. IEEE Trans. Geosci. Remote Sens. 2022, 60, 1–13. [Google Scholar]
- Ghiasi, G.; Cui, Y.; Srinivas, A.; Qian, R.; Lin, T.Y.; Cubuk, E.D.; Le, Q.V.; Zoph, B. Simple copy-paste is a strong data augmentation method for instance segmentation. In Proceedings of the IEEE/CVF Conference on Computer Vision and Pattern Recognition, Nashville, TN, USA, 20–25 June 2021; pp. 2918–2928. [Google Scholar]
- Kisantal, M.; Wojna, Z.; Murawski, J.; Naruniec, J.; Cho, K. Augmentation for small object detection. arXiv 2019, arXiv:1902.07296. [Google Scholar]
- Bai, Y.; Zhang, Y.; Ding, M.; Ghanem, B. Finding tiny faces in the wild with generative adversarial network. In Proceedings of the IEEE Conference on Computer Vision and Pattern Recognition, Salt Lake City, UT, USA, 18–23 June 2018; pp. 21–30. [Google Scholar]
- Bai, Y.; Zhang, Y.; Ding, M.; Ghanem, B. Sod-mtgan: Small object detection via multi-task generative adversarial network. In Proceedings of the European Conference on Computer Vision (ECCV), Munich, Germany, 8–14 September 2018; pp. 206–221. [Google Scholar]
- Liu, Z.; Gao, G.; Sun, L.; Fang, Z. HRDNet: High-resolution detection network for small objects. In Proceedings of the 2021 IEEE International Conference on Multimedia and Expo (ICME), Shenzhen, China, 5–6 July 2021; pp. 1–6. [Google Scholar]
- Wang, Y.; Yang, Y.; Zhao, X. Object detection using clustering algorithm adaptive searching regions in aerial images. In Proceedings of the European Conference on Computer Vision, Glasgow, UK, 23–28 August 2020; pp. 651–664. [Google Scholar]
- Zhang, J.; Huang, J.; Chen, X.; Zhang, D. How to fully exploit the abilities of aerial image detectors. In Proceedings of the IEEE/CVF International Conference on Computer Vision Workshops, Seoul, Republic of Korea, 27–28 October 2019; Volume 11041, p. 1104123. [Google Scholar]
- Li, C.; Yang, T.; Zhu, S.; Chen, C.; Guan, S. Density map guided object detection in aerial images. In Proceedings of the IEEE/CVF Conference on Computer Vision and Pattern Recognition Workshops, Seattle, WA, USA, 13–19 June 2020; pp. 190–191. [Google Scholar]
- Duan, C.; Wei, Z.; Zhang, C.; Qu, S.; Wang, H. Coarse-grained Density Map Guided Object Detection in Aerial Images. In Proceedings of the IEEE/CVF International Conference on Computer Vision, Paris, France, 2–3 October 2021; pp. 2789–2798. [Google Scholar]
- Xu, J.; Li, Y.; Wang, S. AdaZoom: Towards scale-aware large scene object detection. IEEE Trans. Multimed. 2022. [Google Scholar] [CrossRef]
- Zhao, Q.; Liu, B.; Lyu, S.; Wang, C.; Zhang, H. TPH-YOLOv5++: Boosting Object Detection on Drone-Captured Scenarios with Cross-Layer Asymmetric Transformer. Remote Sens. 2023, 15, 1687. [Google Scholar] [CrossRef]
- Du, B.; Huang, Y.; Chen, J.; Huang, D. Adaptive Sparse Convolutional Networks with Global Context Enhancement for Faster Object Detection on Drone Images. In Proceedings of the IEEE/CVF Conference on Computer Vision and Pattern Recognition, Vancouver, BC, Canada, 18–22 June 2023; pp. 13435–13444. [Google Scholar]

Disclaimer/Publisher’s Note: The statements, opinions and data contained in all publications are solely those of the individual author(s) and contributor(s) and not of MDPI and/or the editor(s). MDPI and/or the editor(s) disclaim responsibility for any injury to people or property resulting from any ideas, methods, instructions or products referred to in the content. |
© 2023 by the authors. Licensee MDPI, Basel, Switzerland. This article is an open access article distributed under the terms and conditions of the Creative Commons Attribution (CC BY) license (https://creativecommons.org/licenses/by/4.0/).