Article

The Uncertainty Analysis of the Entrance Pupil Irradiance for a Moon-Based Earth Radiation Observation Instrument

1
Key Laboratory of Thermo-Fluid Science and Engineering, Ministry of Education, School of Energy and Power Engineering, Xi’an Jiaotong University, Xi’an 710049, China
2
Royal Observation of Belgium, Avenue Circulaire 3, 1180 Brussels, Belgium
*
Author to whom correspondence should be addressed.
Remote Sens. 2023, 15(17), 4132; https://doi.org/10.3390/rs15174132
Submission received: 4 June 2023 / Revised: 15 August 2023 / Accepted: 21 August 2023 / Published: 23 August 2023
(This article belongs to the Special Issue Earth Radiation Budget and Earth Energy Imbalance)

Abstract

:
Moon-Based Earth Radiation Observation (MERO) is expected to improve and enrich the current Earth radiation budget (ERB). For the design of MERO’s instrument and the interpretation of Moon-based data, evaluating the uncertainty of the instrument’s Entrance Pupil Irradiance (EPI) is an important part. In this work, by analyzing the effect of the Angular Distribution Models (ADMs), Earth’s Top of Atmosphere (TOA) flux, and the Earth–Moon distance on the EPI, the uncertainty of EPI is finally studied with the help of the theory of errors. Results show that the ADMs have a stronger influence on the Short-Wave (SW) EPI than those from the Long-Wave (LW). For the change of TOA flux, the SW EPI could keep the attribute of varying hourly time scales, but the LW EPI will lose its hourly-scale variability. The variation in EPI caused by the hourly change of the Moon–Earth distance does not exceed 0.13 mW∙m−2 (1σ). The maximum hourly combined uncertainty reveals that the SW and LW combined uncertainties are about 5.18 and 1.08 mW∙m−2 (1σ), respectively. The linear trend extraction of the EPI demonstrates that the Moon-based data can effectively capture the overall linear change trend of Earth’s SW and LW outgoing radiation, and the uncertainty does not change the linear trend of data. The variation of SW and LW EPIs in the long term are 0.16 mW∙m−2 (SW) and 0.23 mW∙m−2 (LW) per decade, respectively. Based on the constraint of the uncertainty, a simplified dynamic response model is built for the cavity radiometer, a kind of MERO instrument, and the results illuminate that the Cassegrain optical system and electrical substitution principle can realize the detection of Earth’s outing radiation with the sensitivity design goal 1 mW∙m−2.

1. Introduction

The extreme weather events caused by global warming, the typical feature of climate change, have threatened the survival and development of human beings [1,2]. The Earth Radiation Budget (ERB), a relationship between incoming solar radiation and outgoing radiation at the height of Earth’s Top of Atmosphere (TOA), is the key part of monitoring and understanding Earth’s climate and how it is changing with time. The outgoing Earth’s radiation includes reflected Short-Wave (SW: 0.2–5 μm) Radiation (OSR) and Long-Wave (LW: 5–200 μm) infrared Radiation (OLR) [3,4,5,6]. At present, the OLR and OSR are obtained with dedicated ERB satellite instruments, such as Earth Radiation Budget Experiment (ERBE) [6,7,8], the Clouds and the Earth’s Radiant Energy System (CERES) [9], the Geostationary Earth Radiation Budget (GERB) [10,11], and the Deep Space Climate Observatory (DSCOVR) [12]. Until now, satellite-based data products have enhanced our understanding of the ERB and many important climatic features, such as the role of clouds and aerosols in the ERB [6,13]. However, unfortunately, satellite-based observations are still facing many challenges and limitations. Usually, the design life of a satellite is 5 to 10 years, but the time span demand of the ERB research for high-quality data is decades or even hundreds of years, so the limited longevity will limit the continuity of available data. The satellite altitude of hundreds of kilometers also limits the temporal sampling of Earth observation and the instantaneous field of view. In addition, the calibration between different satellite observation equipment, data fusion, and the generation of high-frequency global-scale data still face the challenge of improving accuracy [14,15,16,17,18].
The Moon, a special potential platform, is different from artificial satellites. The huge surface space on the nearside is a great position for setting the Moon-based Earth Radiation Observation (MERO) instrument to measure the ERB [17,18,19] and it also provides many options for a great variety of instruments to obtain all kinds of long-term, time-series, high-frequency observations data [17]. Most importantly, the establishment of manned scientific research stations on the moon in the future will provide unprecedented opportunities for calibration of different equipment, collaborative earth observation, and long-term maintenance of instruments, compared with satellites in orbit that cannot be repaired and tested. The average radius is 6371 km, and it is approximately 1/60th of the Earth–Moon distance (average ≈ 3.8 × 10⁵ km), which allows MERO instruments to observe 49 percent of Earth with a field of view of 2.2 degrees [19]. The nearly planetary hemispherical scale for the MERO instruments can provide continuous measurements for the Earth’s full-disk broadband irradiance and it will reduce the data inconsistency from the viewing geometry difference. For the time scale of several decades, the latitudes of the Moon’s nadir point vary from 28°43′N to 28°43′S. Therefore, the MERO instruments can capture the OLR and OSR with continuously changing angles [20]. Compared with satellite-based platforms such as ERBE, CERES, and GERB, the multi-angle and large-scale Moon-based observation data can effectively capture the high-frequency (minute-level) coupling effect of heat flow between different regions of the Earth (equator to polar regions) [21,22,23]. Until now, several studies have been carried out for the Earth observations from the Moon-based platform, and the work mainly focuses on the geometric simulation [16,17,20,22,23], the sampling scheme, and the potential applications [21,24,25,26]. Although the special working environment also brings some new challenges to the MERO instrument, such as the up to 300 K temperature difference between day and nighttime [27] and the high-energy particles from outer space [28,29], fortunately, similar situations and challenges also appear for satellite observation, lunar landers, and rovers. In addition, many advancing instrument technologies have been invented and applied to overcome these challenges [28,29,30].
The MERO instrument’s entrance pupil irradiance (EPI) is the energy that reaches the entrance pupil plane, and then it arrives at the detection element. Afterwards, the unfiltered irradiance is converted to a digital signal and is processed and saved by the electrical system [30]. The EPI is the input energy source of the dedicated radiometer, so ascertaining the variation characteristics and uncertainty of irradiance is highly important for the selection of materials and the structural design to obtain the highest SNR under a certain manufacturing cost. In addition, the corresponding Moon-based data processing method is also closely related to the various uncertainties of EPI. Currently, however, little research has focused on the uncertainty of the EPI and the follow-on parameterization for a MERO instrument. In this work, the uncertainty of the EPI for the Moon-based Earth radiation observation instrument is analyzed. The manuscript is structured as follows. Section 2 describes the observation geometry and the analytical method of uncertainty. Section 3 shows the results and findings. Some discussions about the uncertainty and further expansion are presented in Section 4. Section 5 summarizes and concludes.

2. Materials and Methods

2.1. Observation Geometry

Due to the orbit characteristics of the Moon being different from the low-orbit and Geostationary-orbit satellites, it is necessary to build a new observation geometric model for the Moon-Based Earth Radiation Observation (MERO) instrument [16,19]. As shown in Figure 1, the MERO instrument-viewed region of the Earth is nearly a hemisphere (region A plus region C). Because the sunlight hits the Earth’s Top of Earth’s Atmosphere (TOA) almost parallel, at the Earth’s TOA, the instantaneous MERO instrument-viewed regions include a part of the bright surface (region A) and a part of the dark surface (region C). The bright surface emits not only the Outgoing Long-Wave (LW) Radiation (5–200 μm) (OLR) but also the Outgoing reflected Short-Wave (SW) Radiation (0.2–5 μm) (OSR). However, the dark surface only has the OLR (region C). Since the nearside of the Moon can always observe the Earth and the Earth’s rotation cycle is 24 h, the MERO instrument located on the nearside covers the whole Earth in one day [20,21]. In addition, due to the change of the Moon’s orbit plane and the Earth’s rotation, the near-half area of the Earth’s TOA observed by the MERO instrument varies with time and the Sun-lit part on the Earth’s TOA also is a temporal variable. Therefore, the change in the geometrical relationship will enrich the angle sampling capability of the MERO instrument [20,31] and it will also bring large uncertainties to the radiation transfer.

2.2. Radiation Transfer Function

The Entrance Pupil Irradiance (EPI), Φ, measured by the MERO instrument, at a lunar location (latitude θMoon and longitude λMoon), is a triple-integral function of the Earth’s outgoing radiation from all positions within the MERO instrument-viewed region [18,20,32], as shown in Equations (1) and (2). Although the method of achieving the conversion between radiance and irradiance has evolved over time, the general method, radiation transfer function, remains the same [18,32,33]. Therefore, the instrument’s SW and LW EPI, ΦSW and ΦLW, can be derived from Equations (1) and (2). To derive the MERO instrument’s SW and LW EPI, the temporal-spatial distribution of the MERO instrument-viewed area and the sunlit portion at the Earth’s TOA should be first derived. Following that, the numerical integration method was utilized by discretizing the MERO instrument-viewed region and the sunlit portion into various elements and grids, as shown in Figure 2. The rationale behind the numerical integration method is to summarize the individual contributions of every discrete grid node or region in the MERO instrument-viewed area [18]. Therefore, the discrete summation Equations (3) and (4) can be derived from the integral Equations (1) and (2). Based on the CERES’s satellite data product sets, the individual contribution of the discrete grid on Earth’s TOA to EPI can be derived from the TOA radiative flux and the ERBE angular distribution models ADMs [18,33,34]. For the convenience of calculation, the discrete grid resolution is set to be equal to that of the CERES synthetic datasets and the spatial resolution of Earth’s TOA is 1° latitude × 1° longitude. As the upwelling radiance cannot instantaneously measure from any direction, the accurate irradiance in Equations (1)–(4) cannot be derived. Since the angular distribution of outgoing LW and SW radiation can vary with the scene in the MERO instrument-viewed regions, such as land and ocean, the conversion of the directional radiance to the integrated quantity of irradiance is non-trivial. Therefore, a model for this conversion is needed, and such models are referred to as the angular distribution model (ADM) which provides the anisotropic factors [18]. In essence, the ADMs are a set of anisotropic factors in discretized form of the anisotropic function RLW and RSW, as shown in Equations (3) and (4). In the following content, the ADMs and anisotropic factors (RLW and RSW) represent the same meaning. Each ADMs are sorted into discrete angular bins and parameters from large radiance measurements for defining an ADM scene type [35,36].
Φ S W = A Ω L S W ( θ 0 , θ , ϕ ) d A d Ω
Φ L W = A Ω L L W ( γ , θ , t ) d A d Ω
Φ S W = N R S W ( θ 0 , i , θ i , ϕ i ) M ( θ 0 ) π D i 2 d A i cos θ i cos β
Φ L W = N R L W ( γ i , θ i , t i ) M ( γ , t ) π D i 2 d A i cos θ i cos β i
where LSW and LLW are the short-wave and long-wave radiances. θ0, θ, and ϕ are the solar zenith angle, viewing zenith angle, and relative azimuth angle (see Figure 2). γ and t are the colatitude and the time. Di is the distance between the lunar site of the MERO instrument and the discrete grid node i at the Earth’s TOA. βi is the viewing zenith angle responding to the instrument’s entrance pupil plane as shown in Figure 2. N is the number of discrete grid nodes. M(θ0) and M(γ, t) are the SW and LW equivalent Lambertian flux.
Usually, the ADMs are used to achieve the conversion of the radiance to the radiative flux, or irradiance [18,32,33]; such usage is inverse to the utilization in our work. In this work, the target is to investigate the uncertainty of the simulated irradiance, so the ERBE TOA ADMs are utilized to simplify the complexity of the calculation, the more detailed information sees Refs. [18,21]. To solve Equations (1)–(4), the Earth’s TOA flux data M at node i is the required parameter and it is acquired from the CERES SYN1deg products. The CERES SYN1deg-1Hour Ed4A products, including the TOA radiative fluxes and cloud properties, are the highest temporal resolution for the TOA flux dataset currently available by incorporating hourly GEO imager data (https://asdc.larc.nasa.gov/data/CERES/ (accessed on 6 September 2021)) [37,38]. The data have now been widely used to help us better understand ERB [13] and Hourly all-sky TOA flux data are used in this work. In addition, the simulated EPIs time series are used as the substitute reference value of the truth in the following analysis [18]. Unless otherwise specified, irradiance in this work refers to the MERO instrument’s EPI.

2.3. The Analysis of Uncertainty

Based on the Equations (1)–(4) and the theory of errors [39], the partial derivative of the discrete equations concerning the TOA flux, the ADMs, and the Earth–Moon distance is expressed as the following Equations (5)–(7):
Φ S W / L W R S W / L W = A M π D 2 d A E a r t h = N M i cos θ i π D i 2 d A i
Φ S W / L W M S W / L W = A R π D 2 d A E a r t h = N R S W / L W , i π D i 2 d A i
Φ S W / L W D S W / L W = A 2 M R π D 3 d A E a r t h = N 2 M i R i cos θ i π D i 3 d A i
The uncertainty of simulated irradiance was determined using the theory of errors. Based on the theory of errors, the combined uncertainty (1σ) of EPI, ΦSW/LW, for the MERO instrument is given by the following Equation (8):
U S W / L W ( Φ ) = ( Φ M ) 2 ( Δ M ) 2 + ( Φ R ) 2 ( Δ R ) 2 + ( Φ D ) 2 ( Δ D ) 2
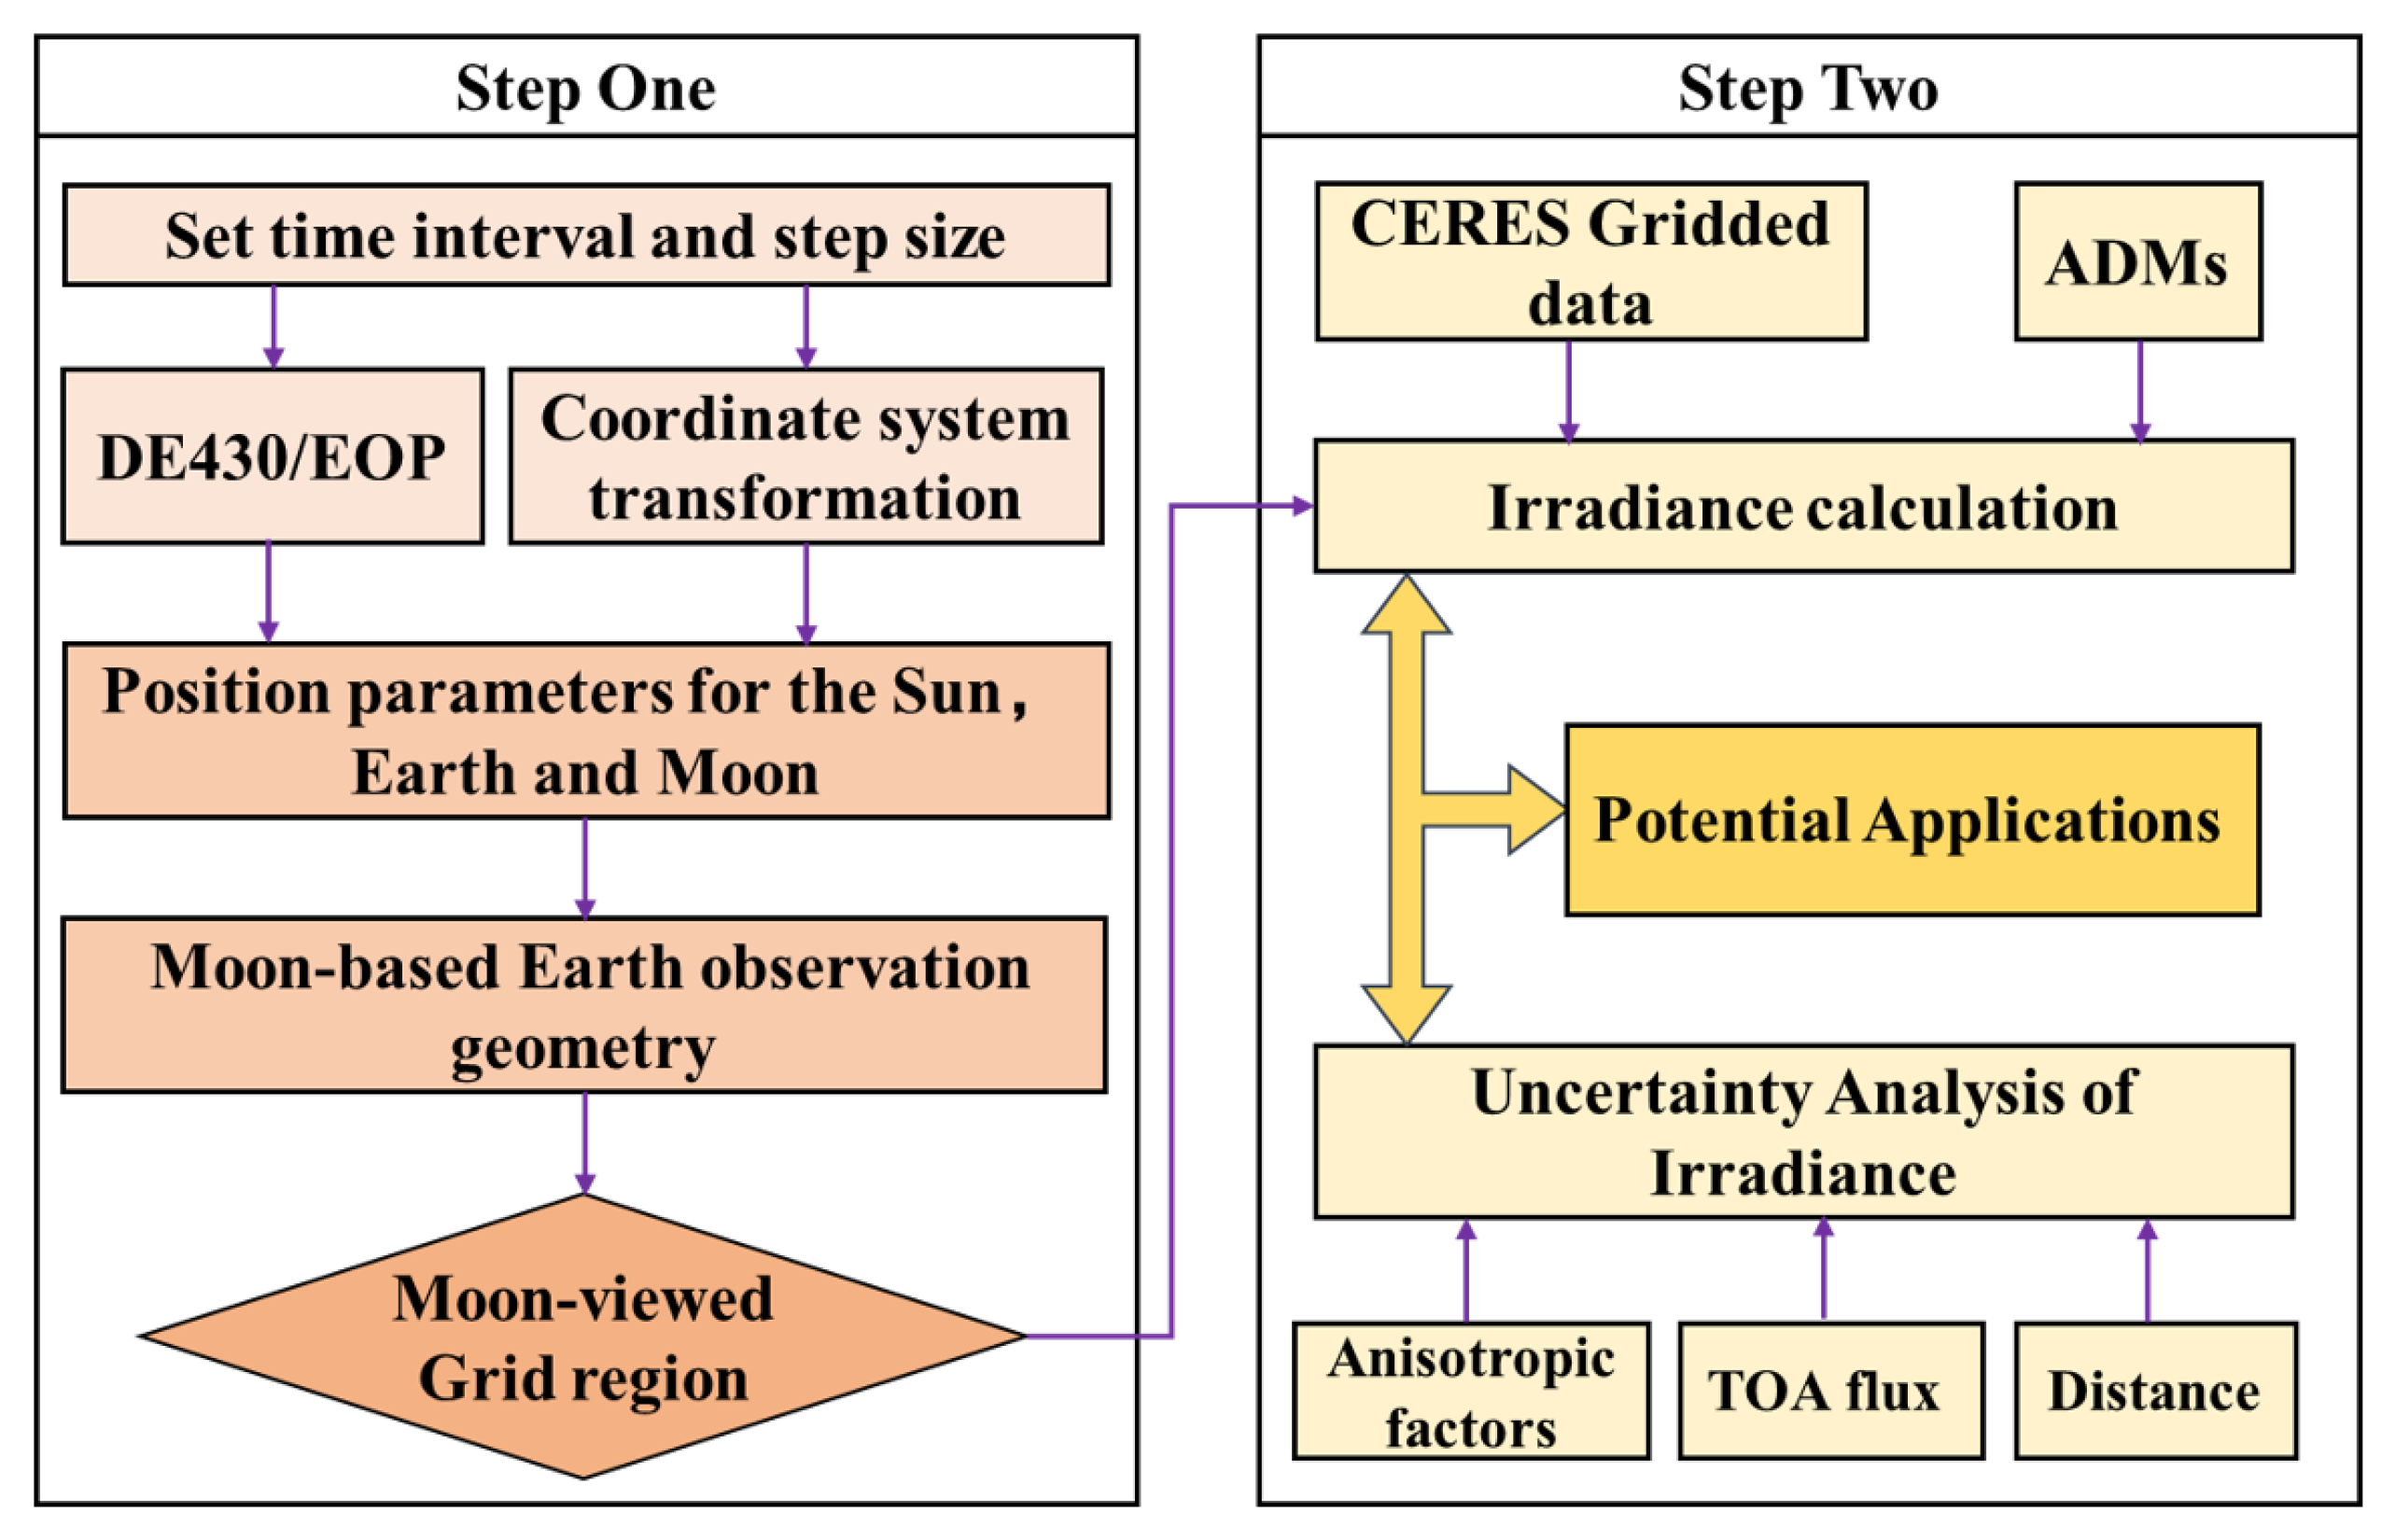
The goal of this work is to evaluate the uncertainty of the instrument’s EPI caused by the ADMs, the TOA Flux, and the Earth–Moon distance. Therefore, the key part is to obtain the original simulated irradiance and the partial derivative of irradiance for each factor, which requires two main steps: (1) the calculation of the MERO instrument-viewed SW/LW region, step one in Figure 3, and (2) the uncertainty analysis of the simulated irradiance, step two in Figure 3. Step one is to obtain the observation geometry and angle parameters according to the options of the time range, time step, and lunar surface position (0°E0°N) by building a unified coordinate system referring to the Planetary and Lunar Ephemerides DE430 [18,40,41]. The more detailed coordinate transformation can be found in Refs. [20,21,22]. Step two is to solve the radiation transfer function to obtain the instrument’s EPI. In addition, finally, evaluating the uncertainty and potential applications of irradiance based on the theory of errors was conducted.

3. Results

3.1. The Origin Simulated EPI Time Series

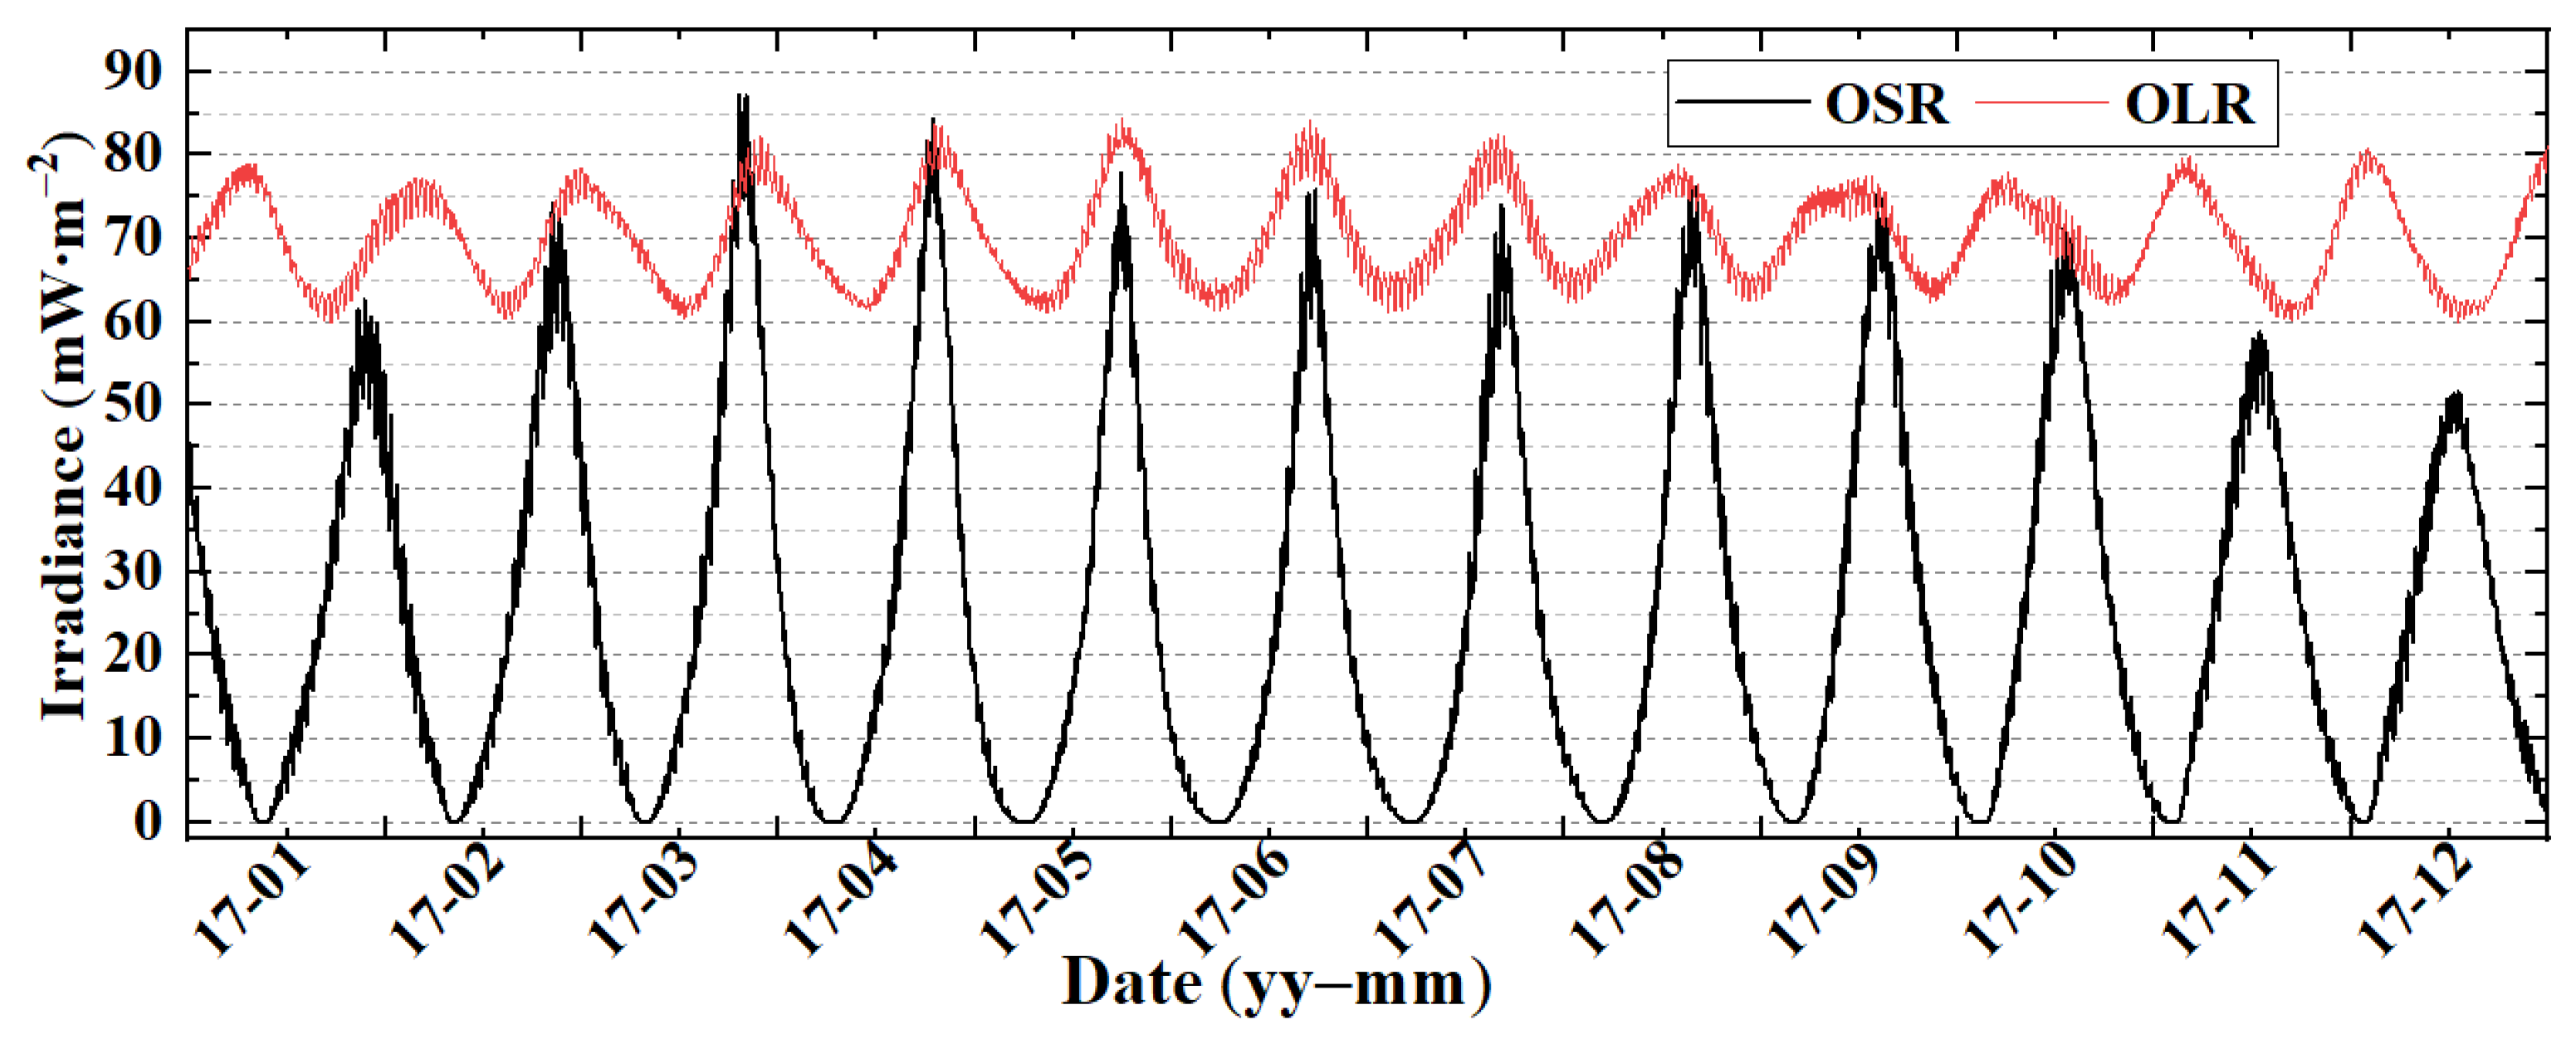
To analyse the uncertainty of the simulated Entrance Pupil Irradiance (EPI) for the Moon-based Earth radiation observation (MERO) instrument, it is necessary to reveal the variation of the irradiance time series from a holistic perspective. Figure 4 presents the simulated instrument’s shortwave (SW) EPI, obtained from the Earth’s Outgoing Short-wave Radiation (OSR), and Long-Wave (LW) EPI, acquired from the Earth’s Outgoing Long-wave Radiation (OLR) time series for the year 2017. The results indicate SW EPI ranges from 0.00 to 94.55 mW∙m−2 with a clear cyclical pattern, while for the LW EPI, the value ranges from 58.05 to 86.92 mW∙m−2. The irradiance time series in Figure 4 serves to demonstrate very well how the EPI varies on hourly, daily, and monthly time scales. In addition, the change of time scales also reveals that the instrument’s EPI times series is mainly controlled by the ADMs, TOA flux, and the Earth–Moon distance. In more detail, the lowest OSR generally coincides with the Sun being over the Pacific Ocean, and the maximum OSR will arrive when a large land area comes into view. The LW and SW EPI have similar changes for longer periods, such as 5 years, 10 years, and 20 years. The alternating presence of ocean and land in the MERO instrument-viewed area will directly cause the variation of ADMs and TOA Flux, which will change the instrument’s EPI. The hourly change of the distance between the Moon and the Earth also will affect the time characteristics of irradiance, which is one of the sources of uncertainty. Figure 4 also indicates that the same periodical variation of OLR and OSR will appear over the next 18.6-year lunar standstill cycle.

3.2. The Effects of ADMs

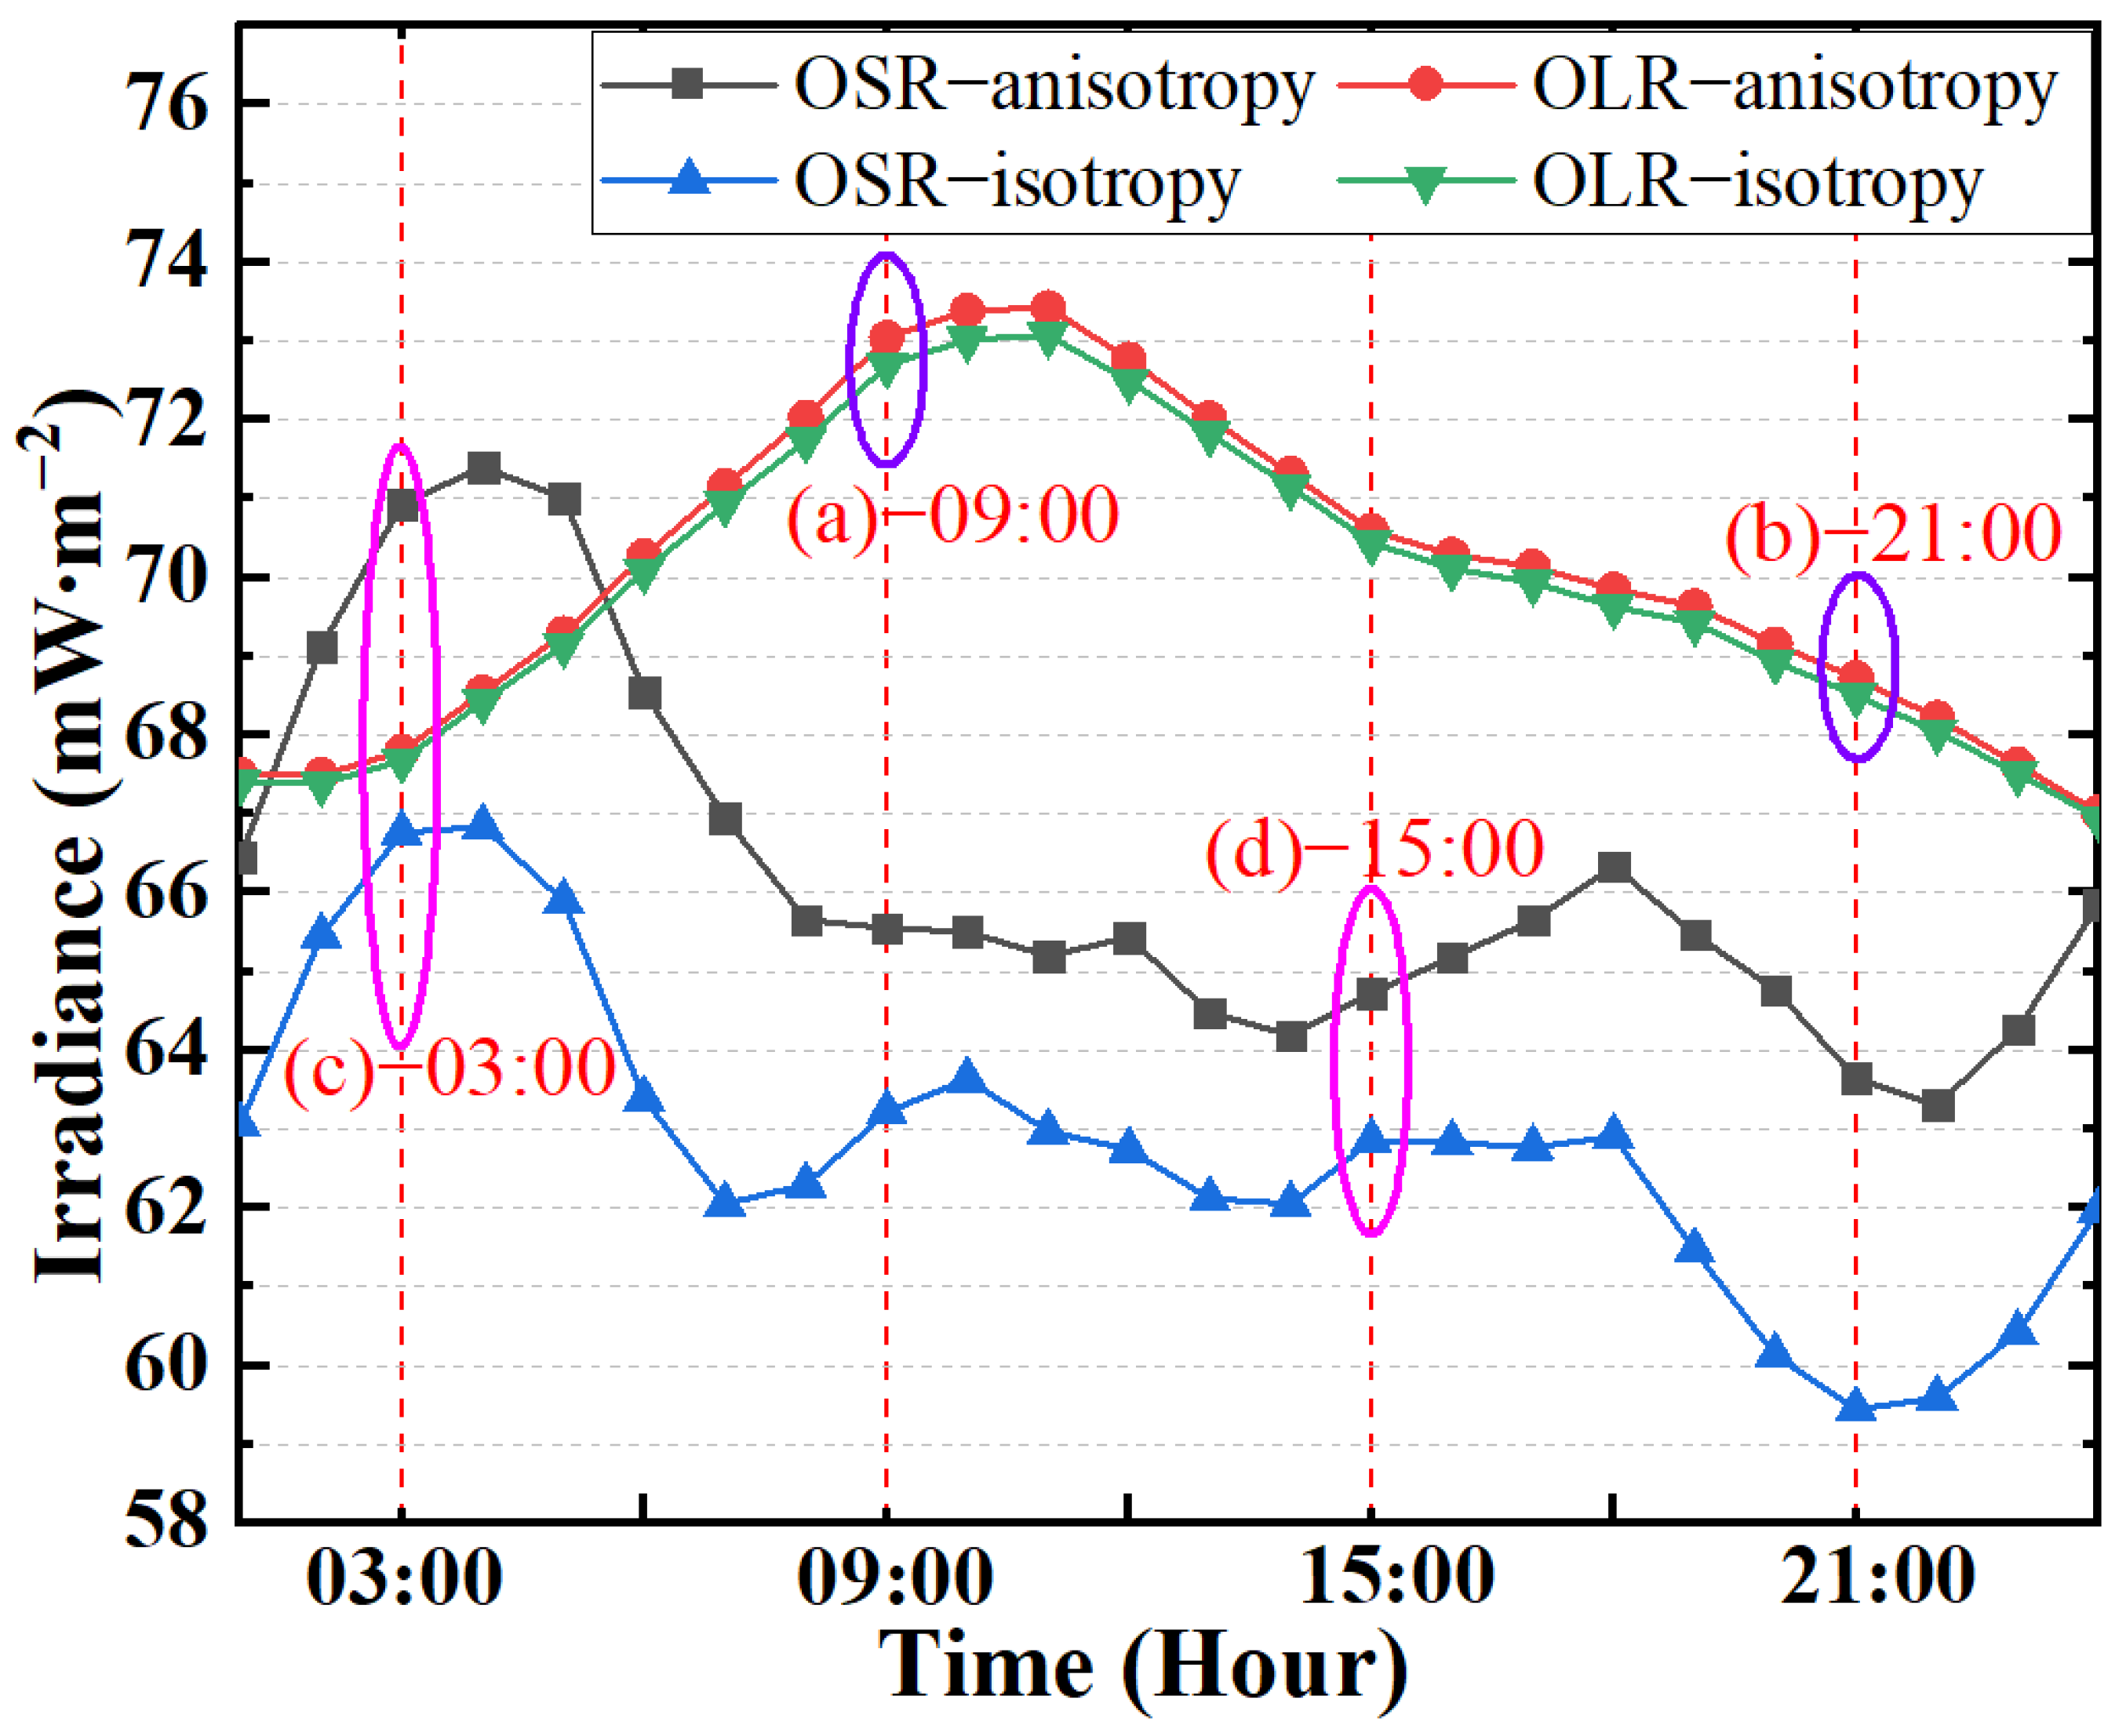
The ADMs reveal the angle characteristic of Earth’s TOA radiance. Due to the angular distribution of the radiance being scene-type dependent, analyzing the effects of ADMs on the EPI is of great importance for understanding the essential influence of ADMs. Figure 5 shows the simulated irradiance hourly time series of OLR and OSR on October 18 in 2017 under two conditions (anisotropy and isotropy). The results indicate that the ADMs have a stronger influence on the irradiance of OSR than the OLR, and the influence exists as an obvious time characteristic for OSR. For the OLR in an Earth’s rotation period, it is apparent that the trend of the anisotropic and isotropic irradiance is similar and the two have an approximately proportional relationship. For the OSR, the anisotropic and isotropic irradiance have poor synchronization and a greater range of variation.
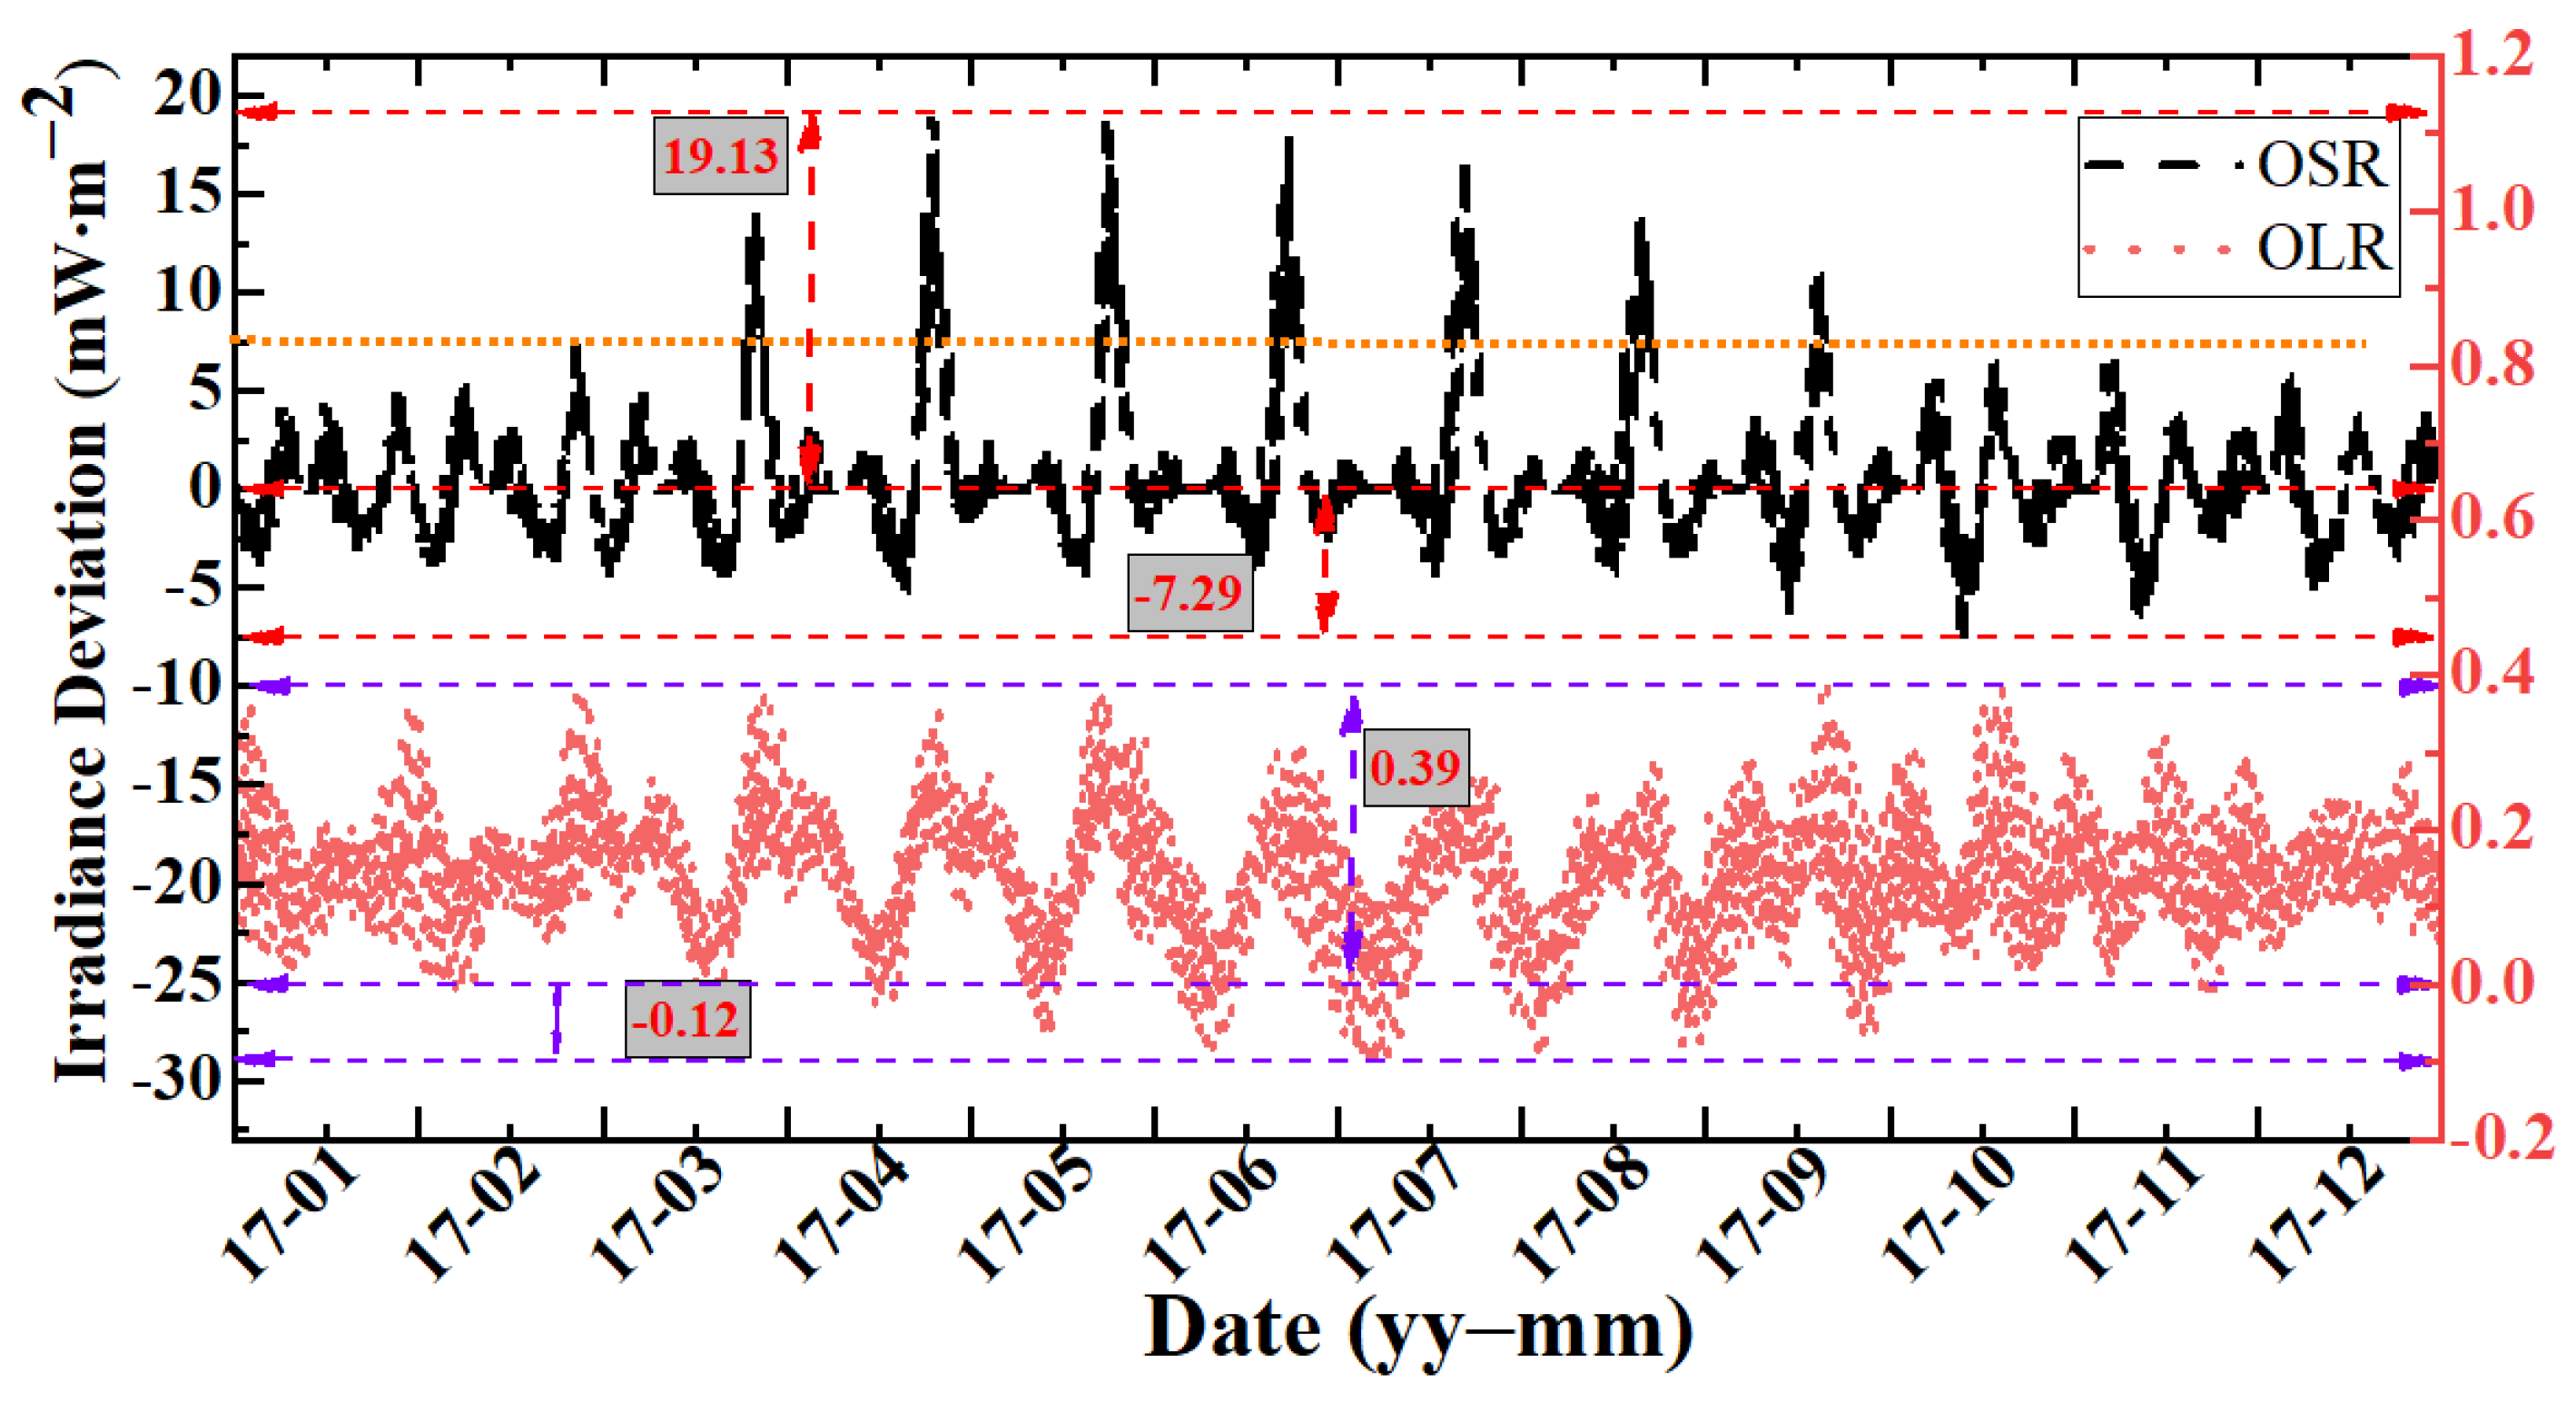
To further clarify the effect of ADMs on the EPI, Figure 6 presents the deviation of hourly irradiance time series under two conditions (anisotropy and isotropy). The deviation is gained by subtracting the irradiance of disregarding ADMs from the time series of considering ADMs. The results show that, for OSR, the deviation of SW EPI in 2017 ranges from −7.29 to 19.13 mW∙m−2, while for the OLR, the maximum and minimum values are around 0.39 mW∙m−2 and −0.12 mW∙m−2, respectively. It is worth noting that considering ADMs only affects the amplitude of irradiance and has a slight effect on its period and phase (Figure 4 and Figure 6). In addition, there is generally an increase in OSR with a peak at around the summer of the Northern Hemisphere, as shown by the orange dashed line in Figure 6. This is likely because the Northern Hemisphere has a larger land fraction than the Southern Hemisphere in the field of view in summer.
Quantitative analysis of the influence of ADMs on irradiance requires information on the distribution of anisotropic factors. Table 1 shows the statistical results for the ERBE’s SW and LW anisotropic factors. The results show that the range of LW anisotropic factor is 0.83~1.07 and 88.56% of the values are in the range of 0.90 to 1.05. The changes in the scene type and clouds in the field of view did not cause a significant change in OLR anisotropic factors. For the OSR, the variation range of the anisotropic factor is 0.41~12.74, and 86.88% of the values are in the range of 0.50 to 1.50. Due to the SW anisotropic factor being closely dependent on the positional relationship of the Sun–Earth–Moon system, it changes more dramatically than LW anisotropic factors.
Figure 7 shows the ratio of irradiance under two conditions (anisotropy and isotropy) and the ratio can be defined as the hemispherical anisotropic factor which represents the sum of the regional anisotropic factor weighted by a geometric factor at various time points [18]. Taking the whole Earth as a one-pixel radiative source, the ADM is still applicable, and the change of regional anisotropic factor will reflect by hemispherical anisotropic factor. Therefore, here, the ratio represents the average impact of ADMs on irradiance, and this way has been widely used [12,18]. The results show that the ratios of LW and SW are 0.998~1.005 and 0.815~6.260, respectively. The average values of the ratios are 1.002 (LW) and 1.23 (SW), respectively. The magnitudes of the LW anisotropic factor are in the order of about 0.001, while for the SW, the order of about 0.01. It is worth noting that the time of the peak value of the SW ratio in Figure 7b corresponds to the time (see Figure 4) that the OSR is less than 1 mW∙m−2 and that the sunlit portion in the MERO instrument-viewed area is smaller compared with other time. For most time ranges (OSR > 1 mW∙m−2), the SW anisotropic factor ranges from 0.82 to 2. In the following expressions, the change of the hemispherical anisotropic factor is recorded as ∆R, as ∆R represents the total change in the SW and LW ADMs.
Equation (5) presents the partial derivative expression of the function = f ( R ) and it can be used to analyze the effect of ADMs on the irradiance. Figure 8 shows the changes in the LW/SW simulated hourly irradiance with the variation of anisotropic factors, ∆R, in September and October 2017. The results reveal that the variation in the anisotropic factor will not change the attribute of EPI varying on hourly, daily, and monthly time scales. For the OLR, when the longwave hemispherical anisotropic factor (∆R-LW) changes from 0.001 to 0.01, the variation of LW EPI is less than 1 mW∙m−2, but if the ∆R-LW is up to 0.05, the variation will have a larger change of more than 3 mW∙m−2. Compared to the OLR, the OSR has a larger and more dramatic variation. When the shortwave hemispherical anisotropic factor (∆R-SW) changes from 0.05 to 0.2, the variation of SW irradiance will exceed 10 mW∙m−2, but if the ∆R-SW is less than 0.05, the variation will be less than 3.4 mW∙m−2 and the average is 1.28 mW∙m−2. Existing research shows that the radiation resolution of the Moon-based radiometer should be better than 1 mW·m−2 in the future actual design [17]. Therefore, investigating the uncertainty of the irradiance caused by the ADMs is very important for interpreting Moon-based data, building data processing models, and designing the accuracy of the instrument. In summary, to clarify the influence of other factors on irradiance, we set the ∆R-LW and ∆R-SW at 0.005 and 0.05 for the computing of combined uncertainty in Section 3.5.

3.3. The Effects of TOA Flux

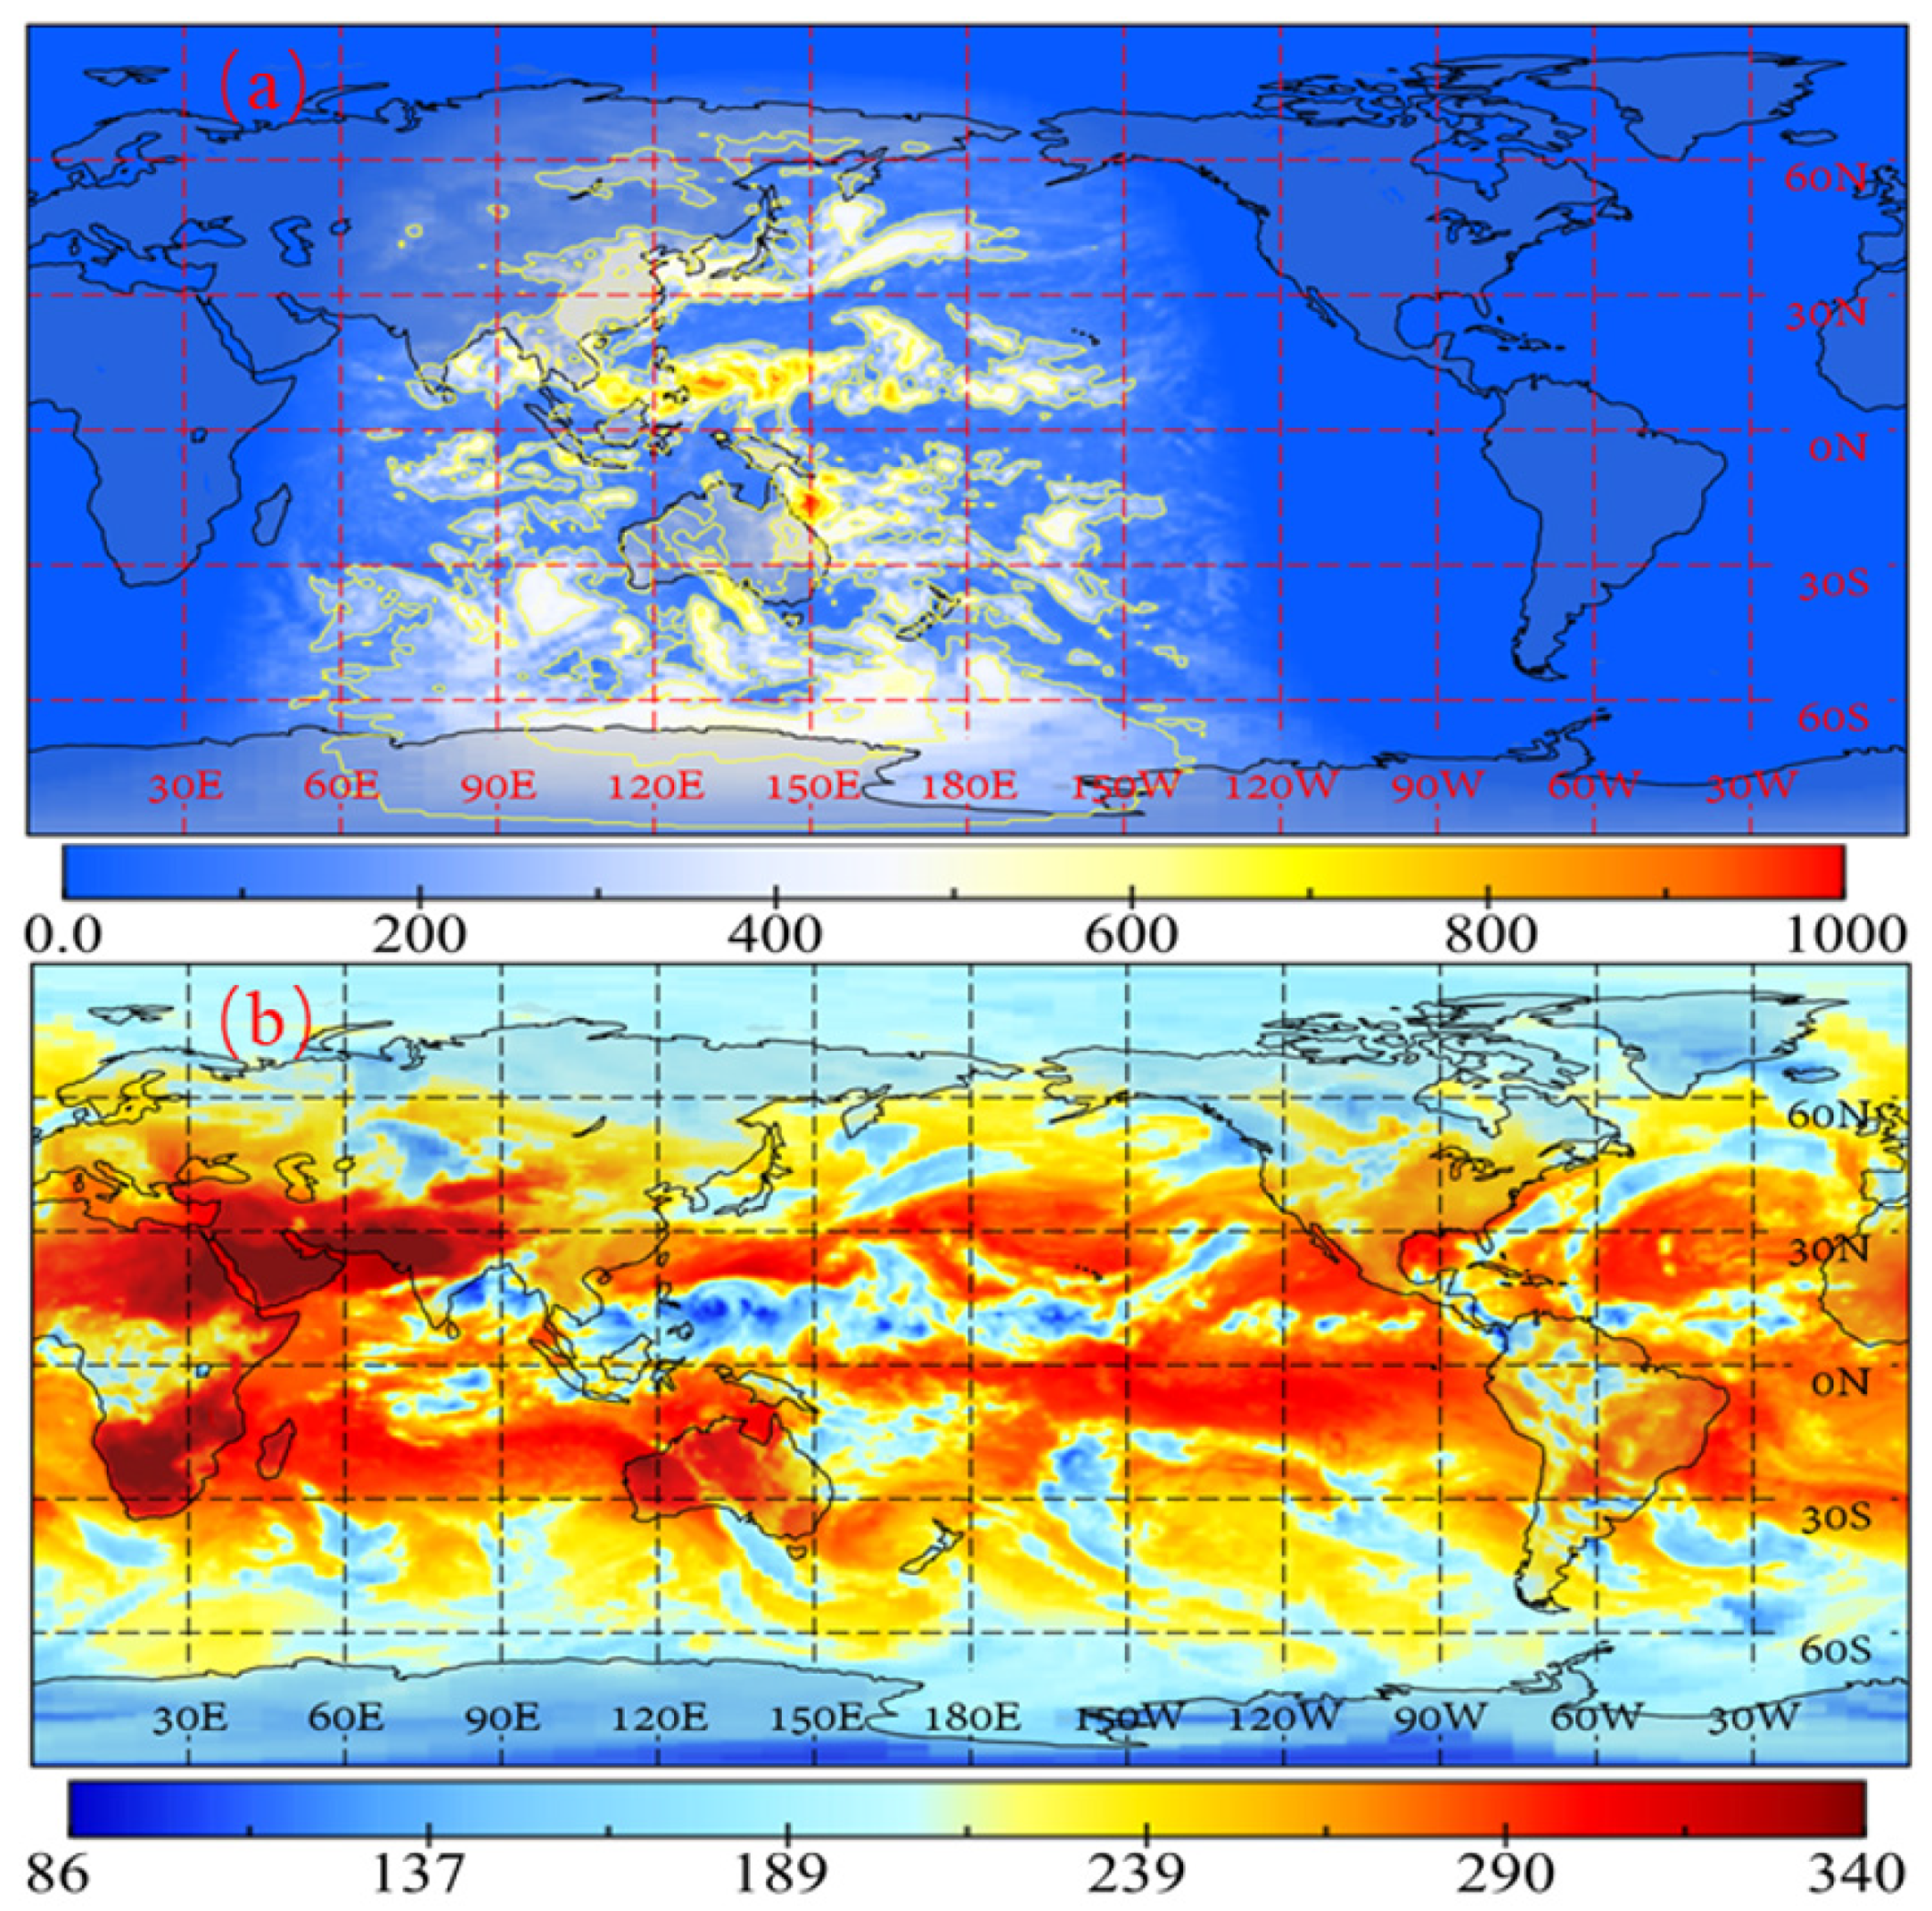
In this work, the CERES Synoptic (SYN) 1-degree (SYN1deg) products were used to provide the hourly TOA radiative fluxes. Figure 9 shows the distribution of outgoing shortwave ((a) 03:00 in Figure 5) and longwave ((b) 09:00 in Figure 5) radiation on October 18 in 2017. Due to the SW radiative flux in the MERO instrument-viewed area being dependent on the geometric relationship, the variation range is greater than the OLR. The daily peak of irradiance of OSR occurs at around 2:00 to 3:00 and the highest values generally coincide with the MERO and the sun being over the large land and ocean masses of Asia. For the OLR, the peak of irradiance of OLR occurs at around 9:00 to 12:00 and the highest values generally coincide with the MERO being over the large land masses of Asia. The EPI can continuously record the change of the Earth’s OLR and OSR, and the variation of the instrument’s EPI is sensitive to the Earth’s TOA flux change. Understanding the uncertainty of irradiance caused by the TOA flux variation would facilitate designing the MERO instrument and determining the ERB. The simulated EPI is obtained by using the CERES data sets, so the uncertainties of SYN1deg Ed4A TOA observed flux will be passed to the instrument’s EPI. The combined daily regional all-sky CERES SW and LW diurnal uncertainty is 8 W∙m−2 and 2.81 W∙m−2, respectively (instrument calibration: 1 (SW) and 1.81 (LW)W∙m−2 (1σ), conversion error: 1 (SW) and 0.75 (LW)W∙m−2 (1σ), and diurnal correction uncertainty: 3.5 (SW) and 0.6 (LW) W∙m−2) [42,43]. Further uncertainty details in CERES data are outlined in their data product manuscripts [42,43]. Therefore, in the following analysis, the upper limit of variation of SW and LW TOA observed flux is set to 8 and 3 W∙m−2.
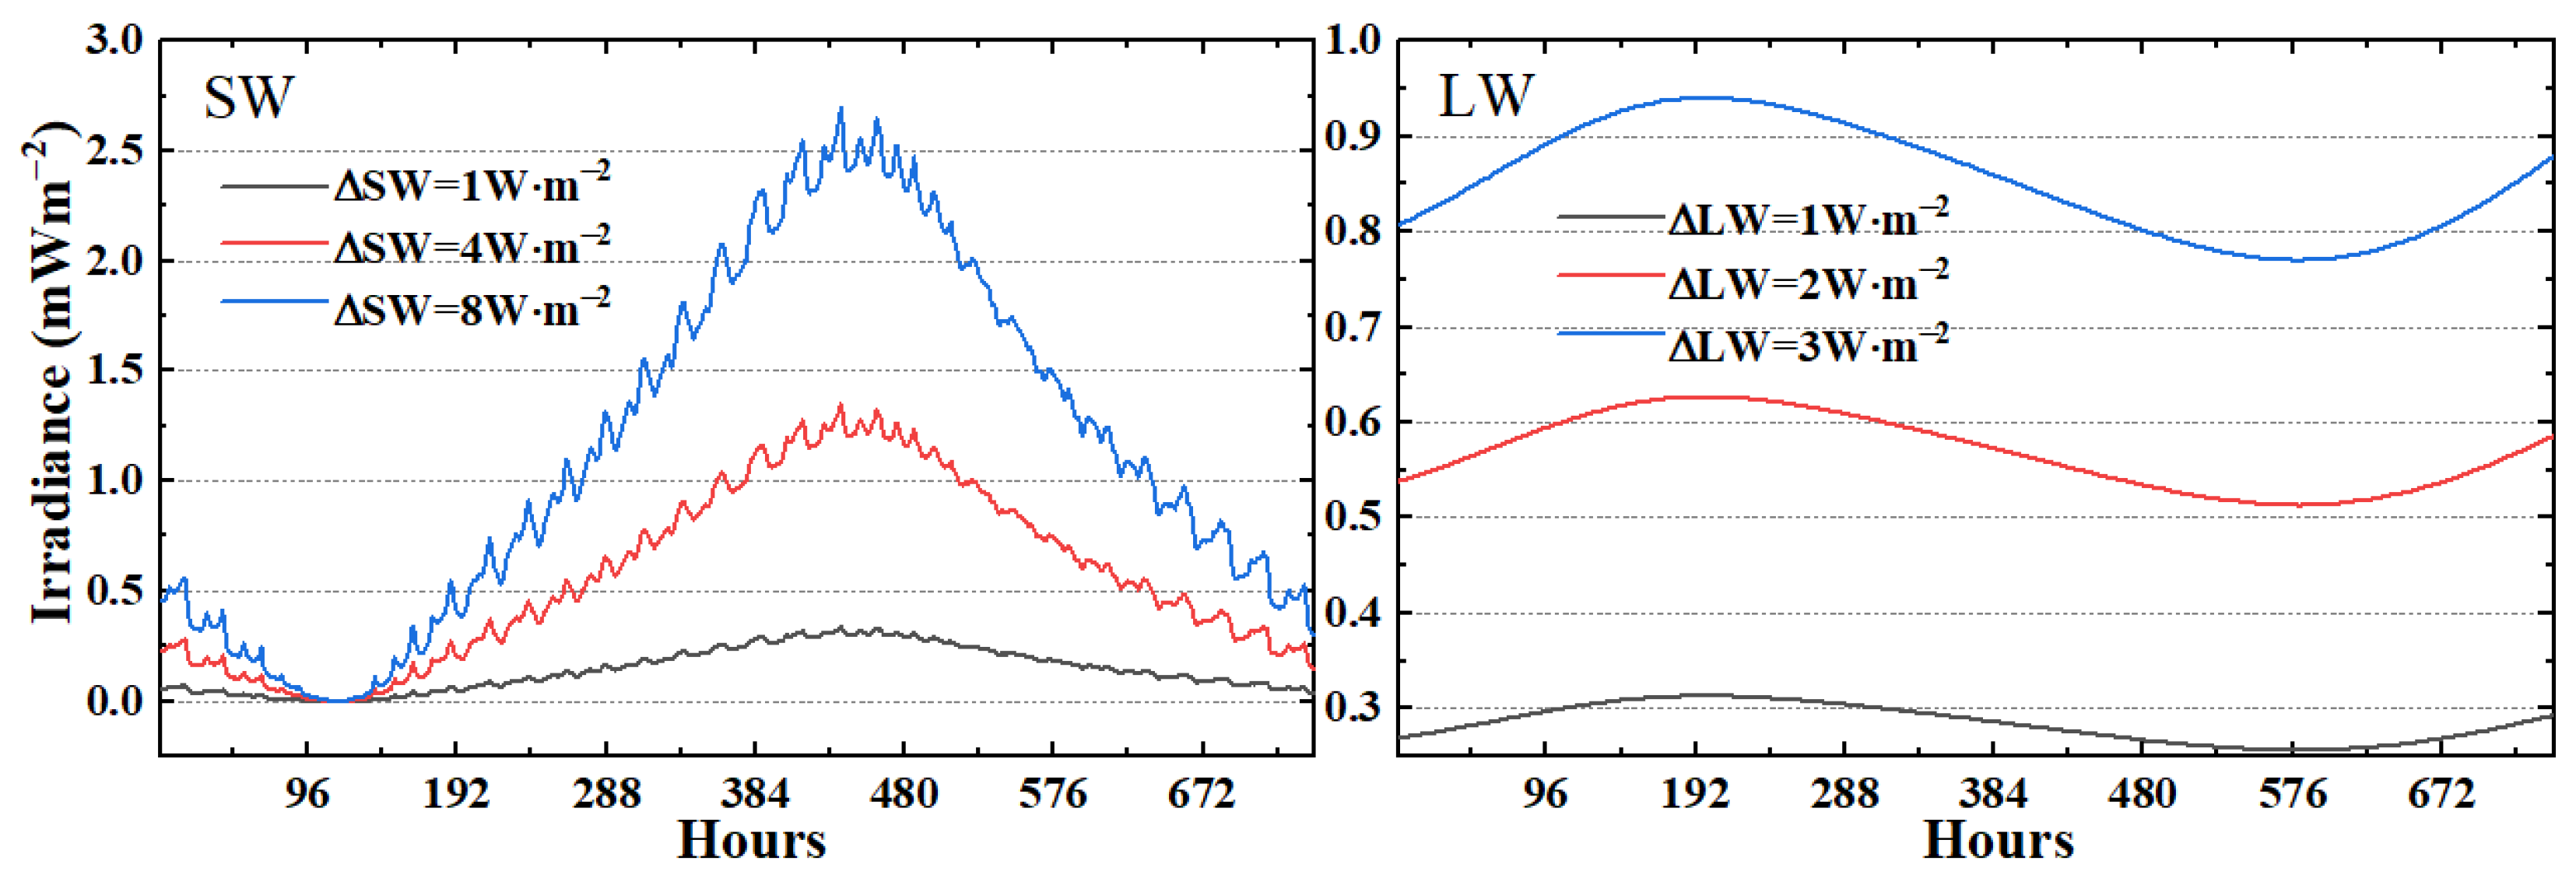
To analyse the uncertainty of irradiance caused by the Earth’s TOA flux, Figure 10 shows the changes in the LW/SW simulated hourly irradiance with the variation of the TOA flux in October 2017. ∆SW and ∆LW represent the change of the TOA observed flux in Equation (6) under considering the uncertainties of CERES data. The results reveal that the TOA flux change, ∆SW, will keep the irradiance attribute varying on hourly time scales, but the ∆LW will lose its hourly-scale variability. When the ∆SW change from 1 W∙m−2 to 8 W∙m−2, the variation peak of SW irradiance will range from 0.33 mW∙m−2 to 2.70 mW∙m−2. For the change of LW TOA flux, the variation peak of LW EPI will range from 0.32 mW∙m−2 to 0.94 mW∙m−2 when ∆LW changes from 1 W∙m−2 to 3 W∙m−2. If the SW and LW TOA flux both change for 1 W∙m−2, the variation of irradiance will be less than 0.33 mW∙m−2.

3.4. The Effect of the Earth–Moon Distance

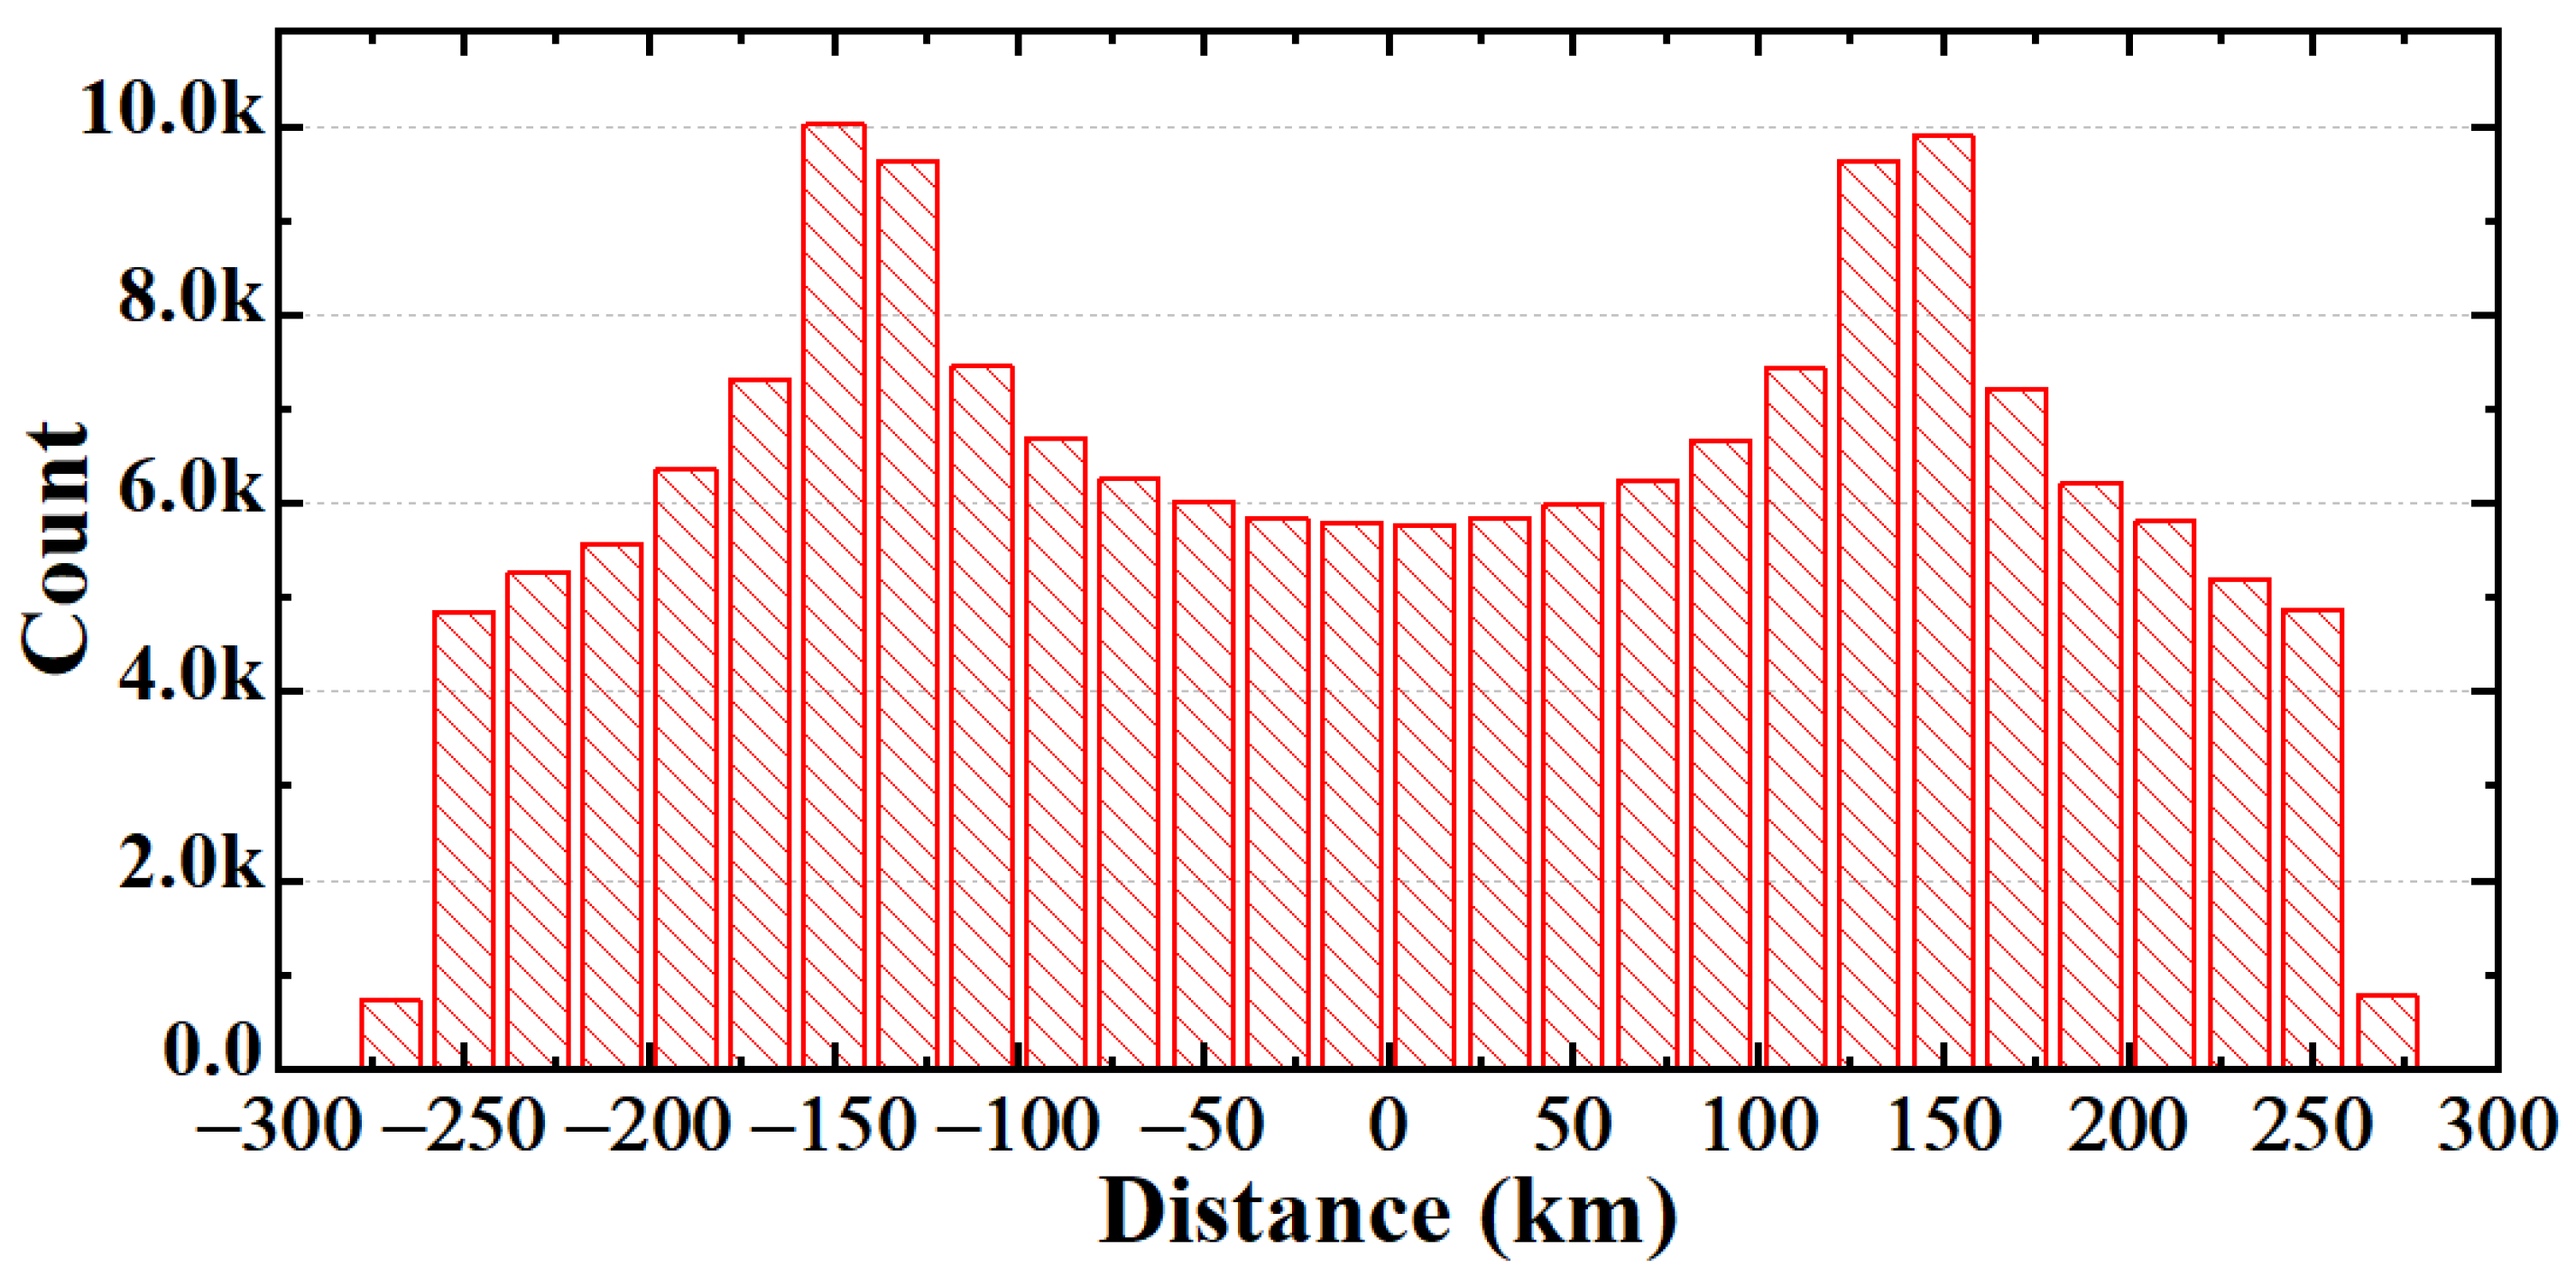
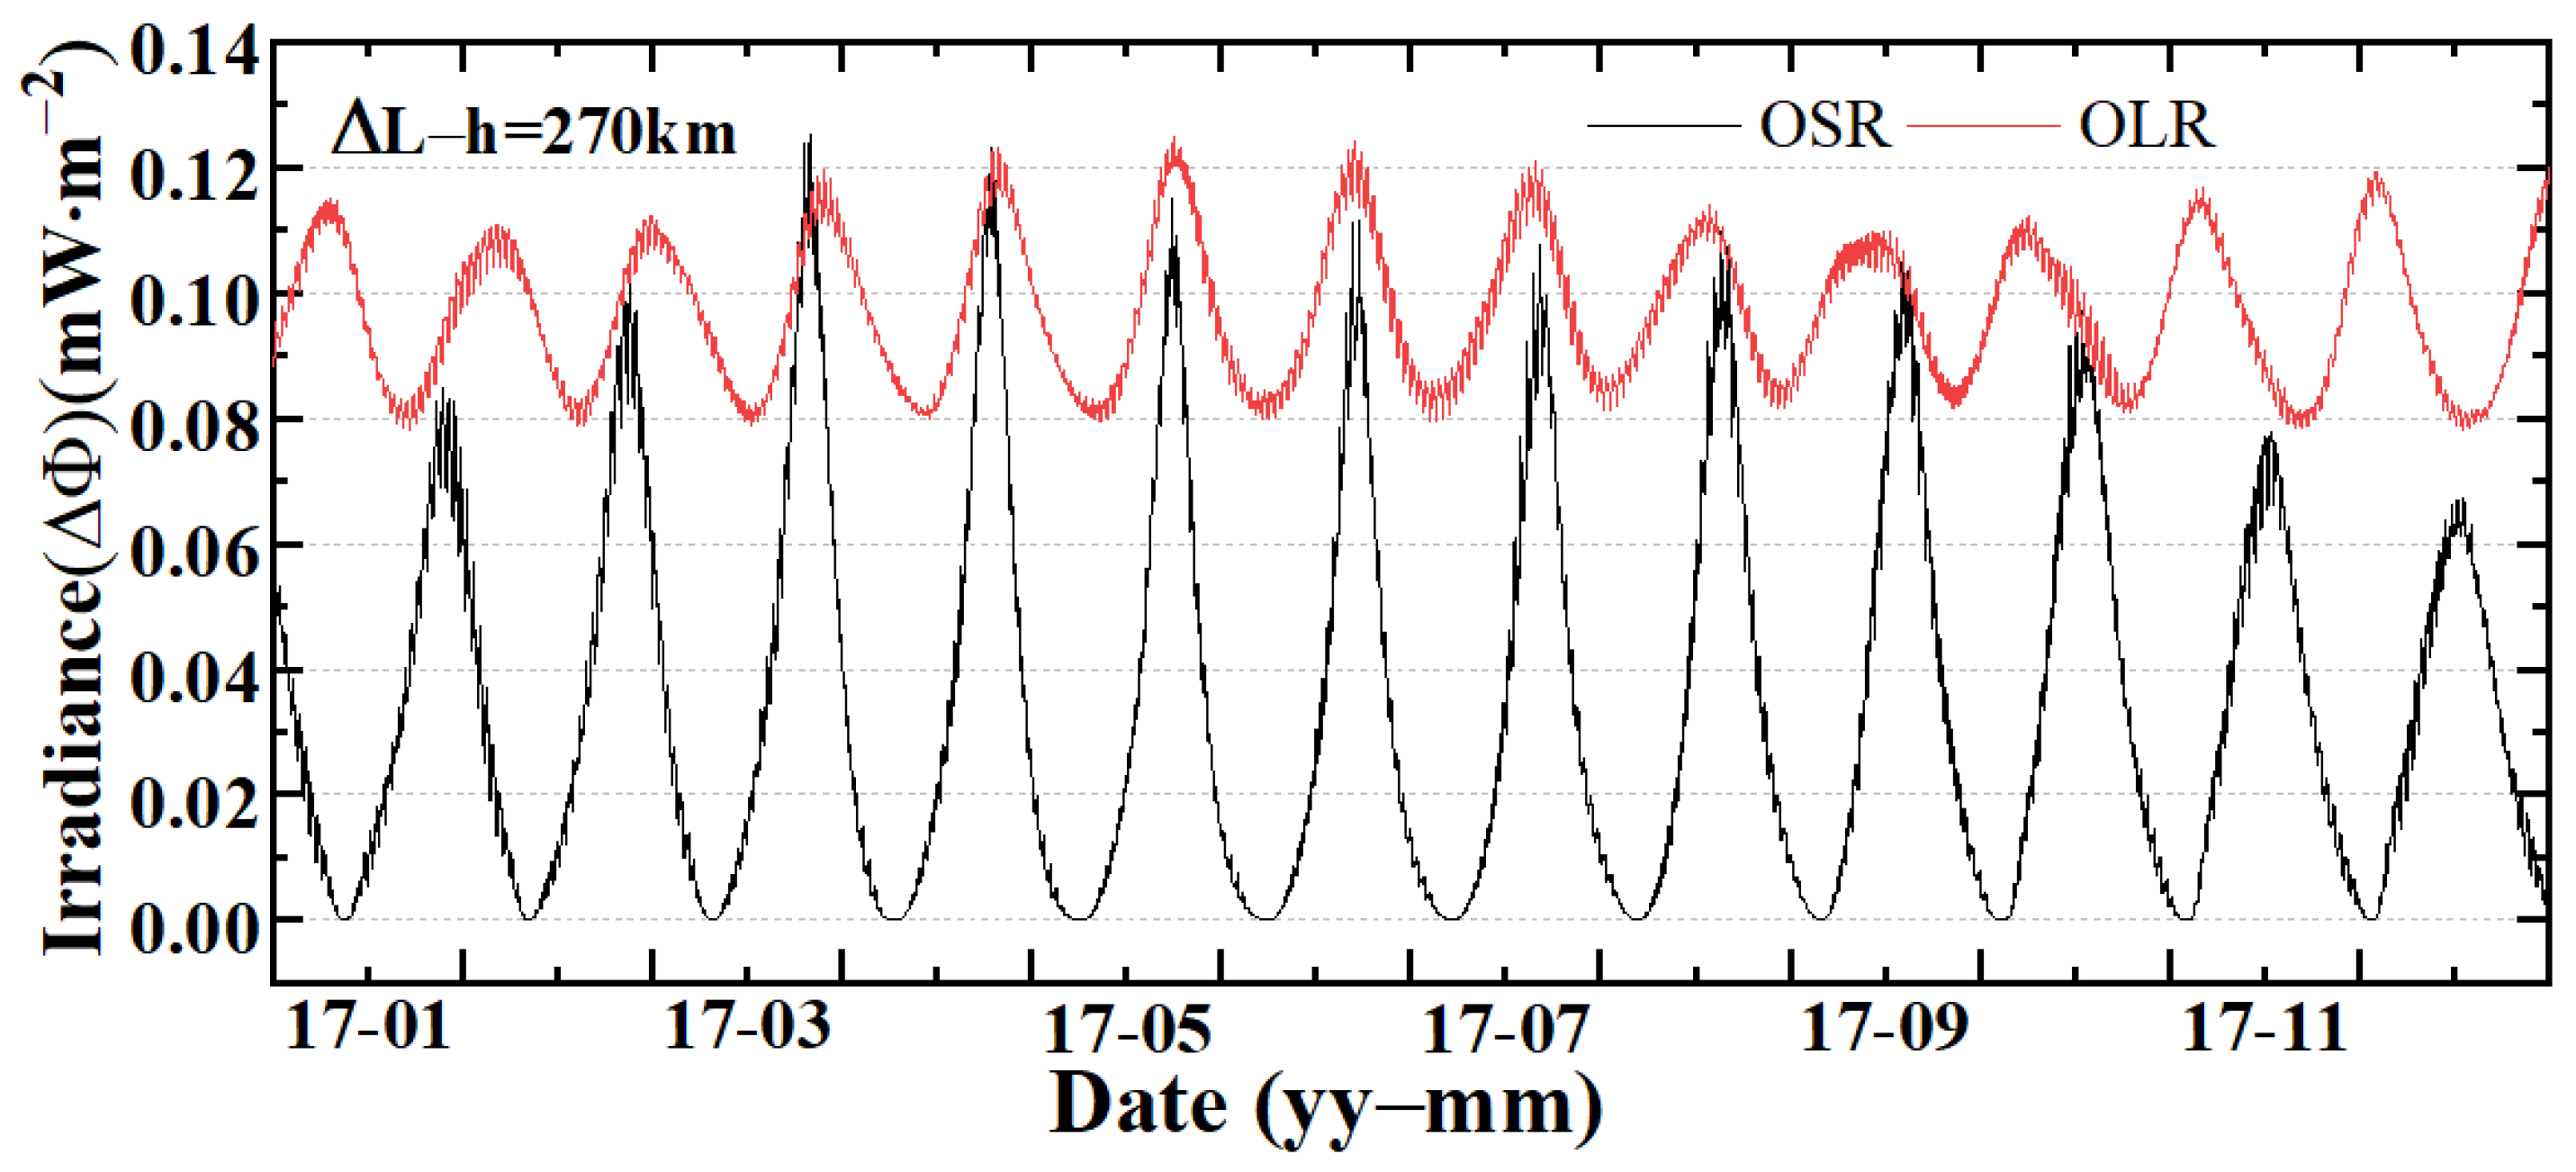
Being different from satellite platforms, such as LEO or GEO, the MERO instrument can gain the measurements of OLR and OSR from an extremely long observation distance. The elliptical Moon’s orbit (eccentricity ≈ 0.0549) leads to changes in the Earth–Moon distance. The perigee and apogee of this orbit are about 362,600 and 405,400 km, and the maximum distance difference is around 42,800 km, which is approximately six times the radius of the Earth. The effects from the distance result in a significant difference in the size of the Earth in MERO instruments viewed at different orbital positions (the change of viewing area can reach 10%). To reveal the temporal characteristic of the distance, the statistical histogram for hourly changes in the Earth–Moon distance (∆L-h) from 2000 to 2020 was obtained, as shown in Figure 11. The results show that the ∆L-h have symmetrical distribution, and the variation range is 0~270 km. In addition, the MERO instrument’s EPI is inversely proportional to the square of the distance, so the change in distance will have a non-negligible effect on the irradiance. To confirm the uncertainty caused by the distance, the maximum hourly changes of the distance (∆L-h = 270 km) are used in the subsequent analysis. To characterize the uncertainty in the MERO instrument’s EPI resulting from the shift of the Earth–Moon orbit, Figure 12 presents the LW/SW simulated hourly irradiance variation in 2017 (∆L-h = 270 km). Since the change in distance is calculated in the hourly time scales, the whole trend of irradiance is consistent with the results in Figure 4. However, compared to the Earth–Moon distance, the ∆L-h is a relatively small value, so the variation of simulated irradiance caused by the distance does not exceed 0.13 mW∙m−2. In addition, the variation ranges for the SW and LW EPI are 0.078~0.125 mW∙m−2 and 0.000~0.126 mW∙m−2, respectively.

3.5. The Combined Uncertainty

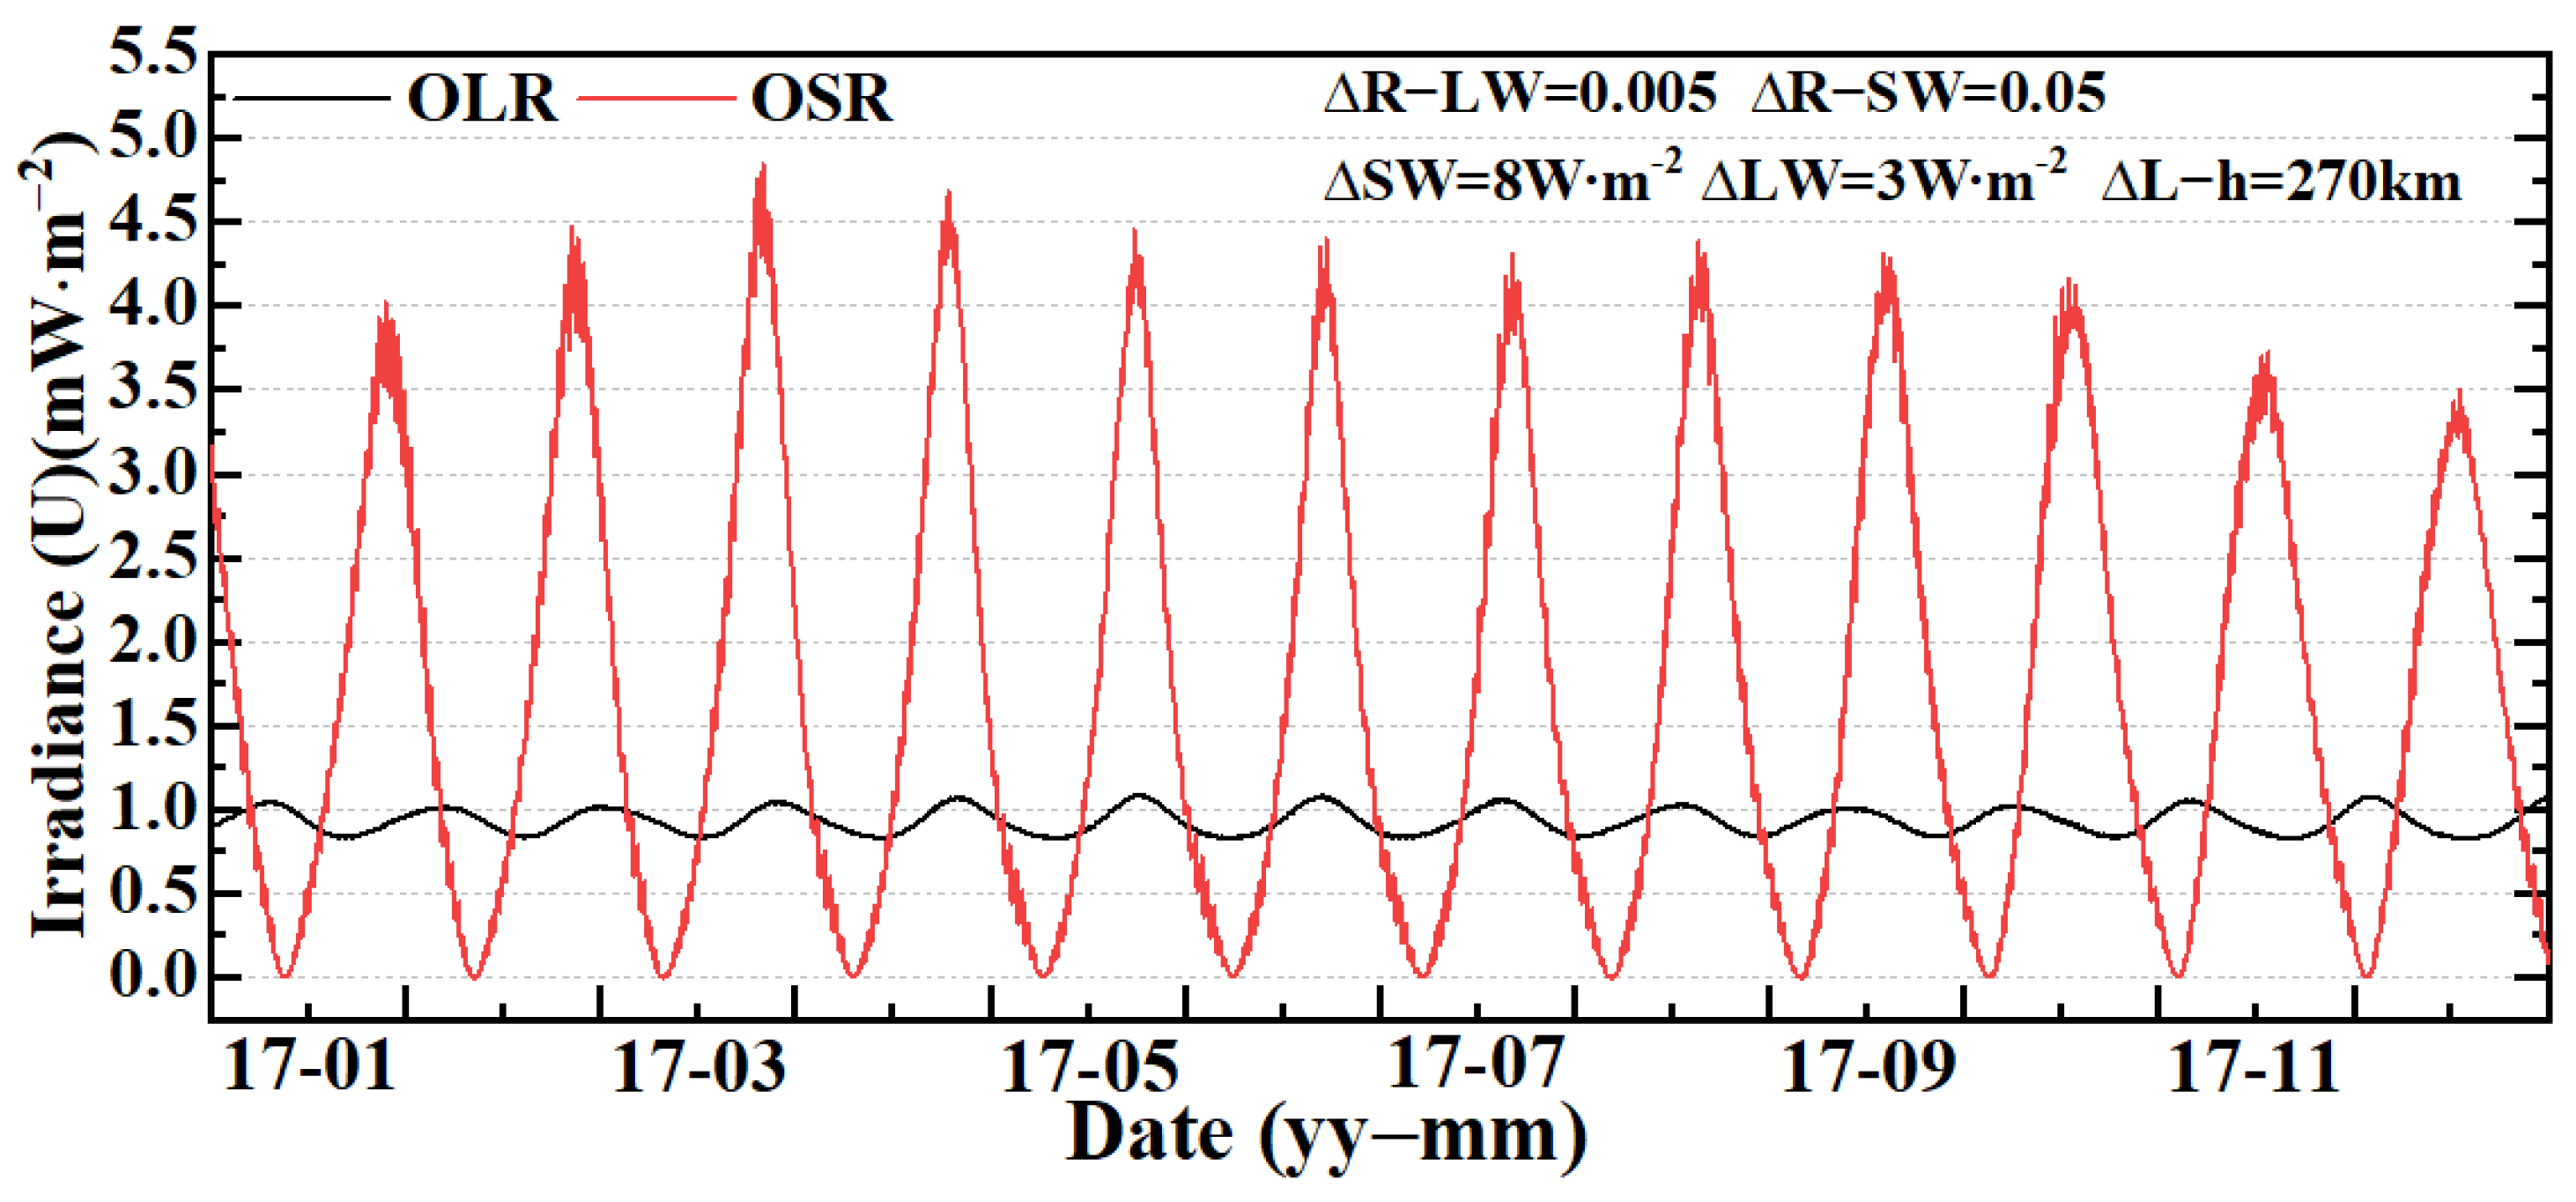
In Section 3.2, Section 3.3 and Section 3.4, the individual influence caused by the ADMs, TOA flux, and Moon–Earth distance is analyzed, respectively. Because the simulated original irradiance includes the influence of the above three factors at the same time, the combined uncertainty (U) of irradiance needs to be further studied. To evaluate the maximum combined uncertainty, ∆R-LW, ∆R-SW, ∆SW, ∆LW, and ∆L-h were set to 0.005, 0.05, 8 W∙m−2, 3 W∙m−2, and 270 km. Based on the theory of errors, the combined uncertainty of EPI, ΦSW/LW, can be computed by Equation (8). Figure 13 shows the SW maximum combined uncertainty USW varies more dramatically than ULW and the trend is consistent with the original simulated irradiance in Figure 4, which means the combined uncertainty will not change the periodic characteristics of irradiance. The SW maximum combined uncertainty USW ranges from 0 to 4.84 mW∙m−2 (1σ), while for the LW ULW, the maximum value was about 1.08 mW∙m−2 and the minimum value was about 0.82 mW∙m−2 (1σ). From the perspective of the maximum value, the peak value of OSR can reach more than four times that of OLR. From the perspective of the minimum value, the OLR has a relatively stable uncertainty compared to the OSR, for which the minimum is zero.
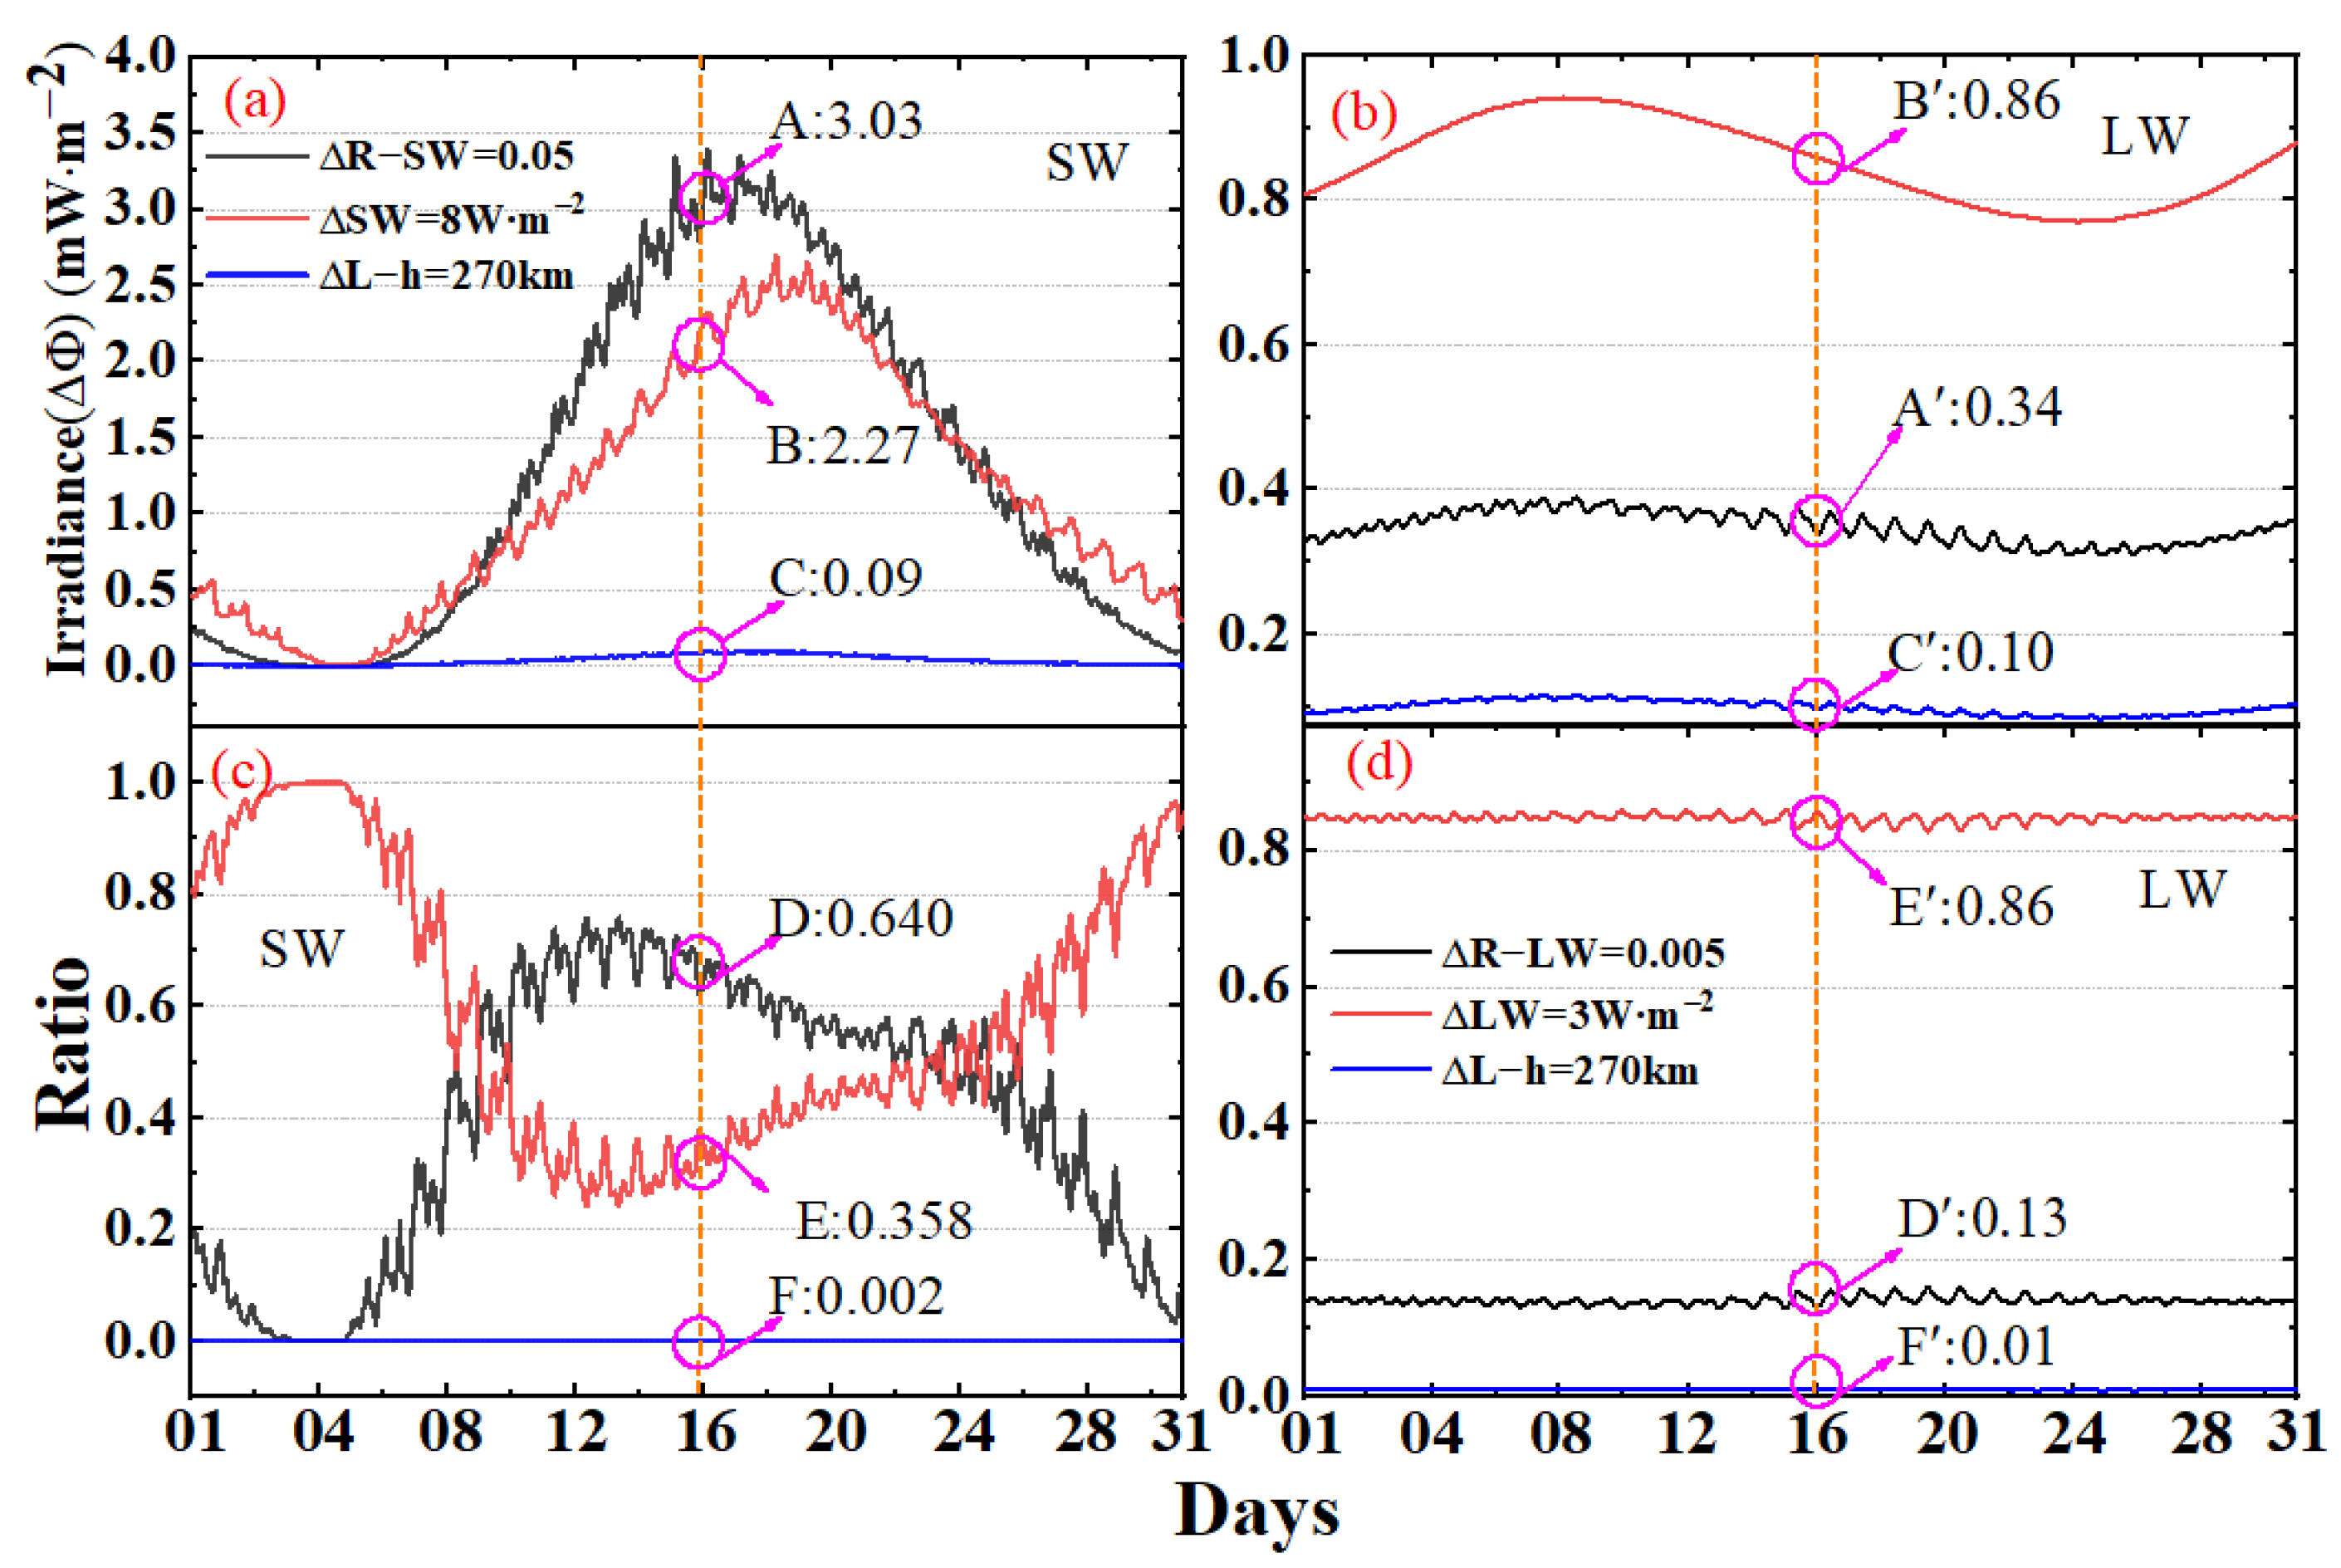
As a combined uncertainty, the amount and proportion of each component is also an important part of analysing the individual contribution (Equation (8)). Figure 14 presents the magnitude and ratio of each component in the combined uncertainty for the LW/SW-simulated hourly irradiance in October 2017. The A/A’, B/B’, C/C’, D/D’, E/E’, and F/F’ in Figure 14 are the value of each quantity, respectively, at 0:00 on October 16. The results show that, for the SW, the change of global TOA fluxes, ∆SW, and anisotropic factor, ∆R-SW, have a similar response trend (see Figure 14a), but a poor synchronization exists. The ratio of the two components shows an inversely correlated variation (Figure 14c) and the sum of the two factors is approximately equal to one (0.640(A) + 0.358(B) = 0.998), which also indicates that the effect of the hourly change of Earth–Moon distance (F:0.002) on combined uncertainty is negligible compared other two factors. However, different to SW, the contribution of the change of ∆LW (3 W∙m−2) to the ULW can reach more than two times that of the improvement in ∆R-LW (0.005) and 8.9 times that of the change of ∆L-h (270 km) (Figure 14b,d). Similar to the SW, the influence of the Earth–Moon distance on the LW combined uncertainty, ULW, is less than 1%. For longer periods, such as 20 years, the SW and LW combined uncertainty have similar trends.
Since an 18.6-year lunar standstill cycle for the angle between Earth–Moon orbital plane exists, it is necessary to analyze the various characteristics of SW/LW combined uncertainty on this scale. Table 2 shows the statistical results of the combined uncertainty of the simulated LW/SW hourly irradiance, USW/LW, from 2000 to 2020, and the calculated condition is the same as Figure 13 and Figure 14. Results reveal that the USW ranges from 0.00 to 5.18 mW∙m−2, while for the ULW, the maximum and minimum values are about 1.09 and 0.82 mW∙m−2, respectively. In addition, the maximum ratio ranges for the SW and LW uncertainty are 0.0~1.0 (40.35%) and 0.8~0.9 (42.48%) in an equally spaced division. The relative uncertainty can be computed by dividing the original simulated irradiance by combined uncertainty. The relative uncertainty range for LW is 1.24~1.43%. However, for SW, it is mainly 1.87~20% and the large relative uncertainty range is caused by the large range of variation for the SW irradiance (See Figure 4), and in certain periods, the small value is used as the denominator.
The above content presents the maximum combined uncertainty that appears in the MERO instrument’s EPI time series. Since the increase in uncertainty will reduce the accuracy and reliability of the irradiance, decreasing the uncertainty of the Moon-based data is the key to improving the quality of the data. The statistical histogram for the combined uncertainty, USW/LW, in the simulated LW/SW hourly irradiance from 2000 to 2020 is shown in Figure 15. Results show that when the ∆R-LW, ∆R-SW, ∆LW, ∆SW, and ∆L-h drop from 0.005, 0.05, 3 W∙m−2, 8 W∙m−2, and 270 km to 0.001, 0.01, 1 W∙m−2, 1 W∙m−2, and 130 km, the combined uncertainty have significant decline compared to Figure 13 and Figure 14 and Table 2. The variation ranges of SW and LW combined uncertainties are 0~0.91 mW∙m−2 (1σ) and 0.26~0.35 mW∙m−2 (1σ), respectively. In addition, the change of ratio and magnitude for each component in the SW/LW combined uncertainty have similar characteristics to Figure 14.

4. Discussion

4.1. The Uncertainty Analysis

The Moon-based Earth Radiation Observation (MERO) instrument’s entrance pupil irradiance (EPI) is the radiation that finally arrives at the inner surface of the radiometer, in other words, the received irradiance for the detection element will be derived from the EPI, as shown in Section 4.3. The uncertainty analysis of the EPI will help with the design of a MERO instrument with the highest signal-to-noise ratio, and it will also facilitate interpreting Moon-based data and building a data processing algorithm for the Moon-based observation data. By analyzing the effect of the ADMs, the TOA flux, and the Moon–Earth distance on the irradiance, the uncertainty with the help of the theory of errors is finally studied. As shown in Figure 4, the variation of the instrument’s EPI times series is controlled by the ADMs, TOA flux, and the Earth–Moon distance. The ADMs have a stronger influence on the irradiance of OSR than the OLR, and it only affects the amplitude of irradiance and does not change period and phase. For the OLR, when the ∆R-LW changes from 0.001 to 0.01, the variation of LW irradiance is less than 1 mW∙m−2, but if the ∆R-LW is more than 0.05, the variation will be more than 3 mW∙m−2. When the ∆R-SW ranges from 0.05 to 0.20, the variation of SW irradiance will exceed 10 mW∙m−2, but if the ∆R-LW is 0.05, the variation will be less than 3.4 mW∙m−2 and the average is 1.28 mW∙m−2. Due to the irradiance acquired from the CERES data sets, the all-sky CERES SW and LW flux uncertainty will have an important effect on irradiance. Therefore, the Earth’s top-of-atmosphere (TOA) flux is a key part of analysing the uncertainty of the simulated irradiance. The results reveal that the change of ∆SW could keep the irradiance attribute varying on hourly time scales, but it will lose its hourly-scale variability for the variation of ∆LW. When the change of ∆SW is 8 W∙m−2, the maximum variation of SW irradiance will be 2.70 mW∙m−2. For LW TOA flux, the maximum variation of LW irradiance will be 0.94 mW∙m−2 when the change of ∆LW is 3 W∙m−2. Selecting the maximum hourly change of the Moon–Earth distance, ∆L-h = 270 km as the change step, the variation of EPI caused by the distance will not exceed 0.13 mW∙m−2. In addition, the variation ranges for the OSR and OLR are 0.078~0.125 mW∙m−2 and 0.000~0.126 mW∙m−2, respectively. Because the EPI includes the influence of the above three factors at the same time, combined uncertainty (1σ) needs to be further studied. To evaluate the maximum hourly combined uncertainty, ∆R-LW, ∆R-SW, ∆SW, ∆LW, and ∆L-h were set to 0.005, 0.05, 8 W∙m−2, 3 W∙m−2, and 270 km, respectively. The results show that the influence of OSR on EPI is more dramatic than OLR, and the changing trend is consistent with the original simulated irradiance, which means the uncertainty does not change the periodic characteristics of irradiance. The SW maximum combined uncertainty, USW, and LW maximum combined uncertainty, ULW, are about 5.18 and 1.08 mW∙m−2 (1σ), respectively, from March 2000 to December 2020. In addition, the effect of the hourly Earth–Moon distance (≤270 km) change on combined uncertainty is negligible compared other two factors. When the ∆R-LW, ∆R-SW, ∆LW, ∆SW, and ∆L-h drop from 0.005, 0.05, 3 W∙m−2, 8 W∙m−2, and 270 km to 0.001, 0.01, 1 W∙m−2, 1 W∙m−2, and 130 km, respectively, the maximum combined uncertainty had significant decline and the values of USW and ULW are 0.91 and 0.35 mW∙m−2 (1σ), respectively.

4.2. The Potential Applications of Moon-Based Data

The Earth’s radiation budget at the height of the Earth’s TOA represents the most fundamental metric defining the status of global climate change. The negative and positive budget balances have been considered the most essential of all climate variables [44]. The MERO instrument can provide long-term data for ERB observations. However, the existing research does not provide direct evidence for the advantage of MERO. Figure 16 shows the schematic of the global monthly Earth TOA flux and extracted linear trend for the OSR and OLR data derived from the CERES EBAF dataset from 2000 to 2020. Results show that over the past 20 years, both the SW and LW fluxes were periodic oscillations, and the ranges are 236.12~244.82 W∙m−2 (LW) and 91.20~109.07 W∙m−2 (SW), respectively. Time series analysis reveals that both of them do not oscillate with a constant value but change around a linear trend, as shown by the orange line in Figure 16. For the LW flux, the OLR shows a linear increase, and the fitted equation is approximately y = 239.95 + 0.0024x, where y is OLR and x is the number of months since March 2000. For the OSR, there is a linear decrease, and the fitted equation is approximately y = 99.59 − 0.0049x. In addition, for a period of 20 years, the OLR and OSR have a variation of 0.61 W∙m−2 and 1.23 W∙m−2, respectively, and the difference is 0.62 W∙m−2. The satellite observations (2001–2020) have revealed a significant positive globally-averaged OSR and OLR of 0.38 ± 0.24 W∙m−2 decade−1, and the difference of 0.62 W∙m−2 in this work is consistent with the scope [6].
Although the Moon’s orbit is different from the satellite-based platform, the periodic oscillations characteristics of Earth TOA flux can still be obtained from the instrument’s EPI measurements on the Moon-based platform. Figure 17 shows the schematic of the extracted linear trend under two conditions (the original irradiance without considering uncertainty and the irradiance including the uncertainty) for the Moon-based OLR/OSR simulated hourly EPI time series from 2000 to 2020. Firstly, the results show, similar to the global mean Earth TOA flux in Figure 16, the Moon-based irradiance data can still effectively extract the overall linear trend of the Earth’s OLR and OSR, and the fitted equations are approximately y = 69.669 + 0.00185x (OLR) and y = 24.971 − 0.000127x (OSR), respectively. In addition, the OLR and OSR, without considering the uncertainty, have a variation of 0.461 mW∙m−2 and 0.315 mW∙m−2 over the past 20 years, respectively. Usually, the exiting of uncertainty will influence the hourly simulated irradiance, so it may change the overall trend of irradiance. Results in Figure 17 point out that when the uncertainty is added to the original simulated irradiance, the fitted equations for OLR and OSR are approximately y = 70.600 + 0.00185x and y = 26.673 − 0.000133x, respectively, and the OLR and OSR have the variation with 0.23 mW∙m−2 and 0.16 mW∙m−2 per decade, respectively. Comparing the extracted linear trend under two conditions (the original irradiance and the irradiance including the uncertainty), the effect of uncertainty on the entrance pupil irradiance only changes the intercept of fitted curves without changing the slope. In addition, it is worth noting that the SW EPI is only the energy collected in the direction of the Moon, and it is not averaged on the entire Earth’s surface.
Table 3 presents the correlation of CERES OLR/OSR data and Moon-based OLR/OSR data. Results illuminate the correlation coefficients are close to one, which reveals a strong correlation between the CERES OLR/OSR data and Moon-based OLR/OSR data. Although the irradiance is calculated from the CERES data, the orbital characteristics of the Moon have a gigantic influence on the EPI. Time series analysis reveals that the measurements of MEOR’s instrument can effectively obtain the long-term change trend of the Earth’s outward radiative flux. The influence of uncertainty is not very large for long-term trend variation, but the increase in uncertainty will make it impossible to accurately acquire the change of Earth TOA fluxes on small time-spatial scales.

4.3. The Dynamic Performance of a Simplified Moon-Based Radiometer

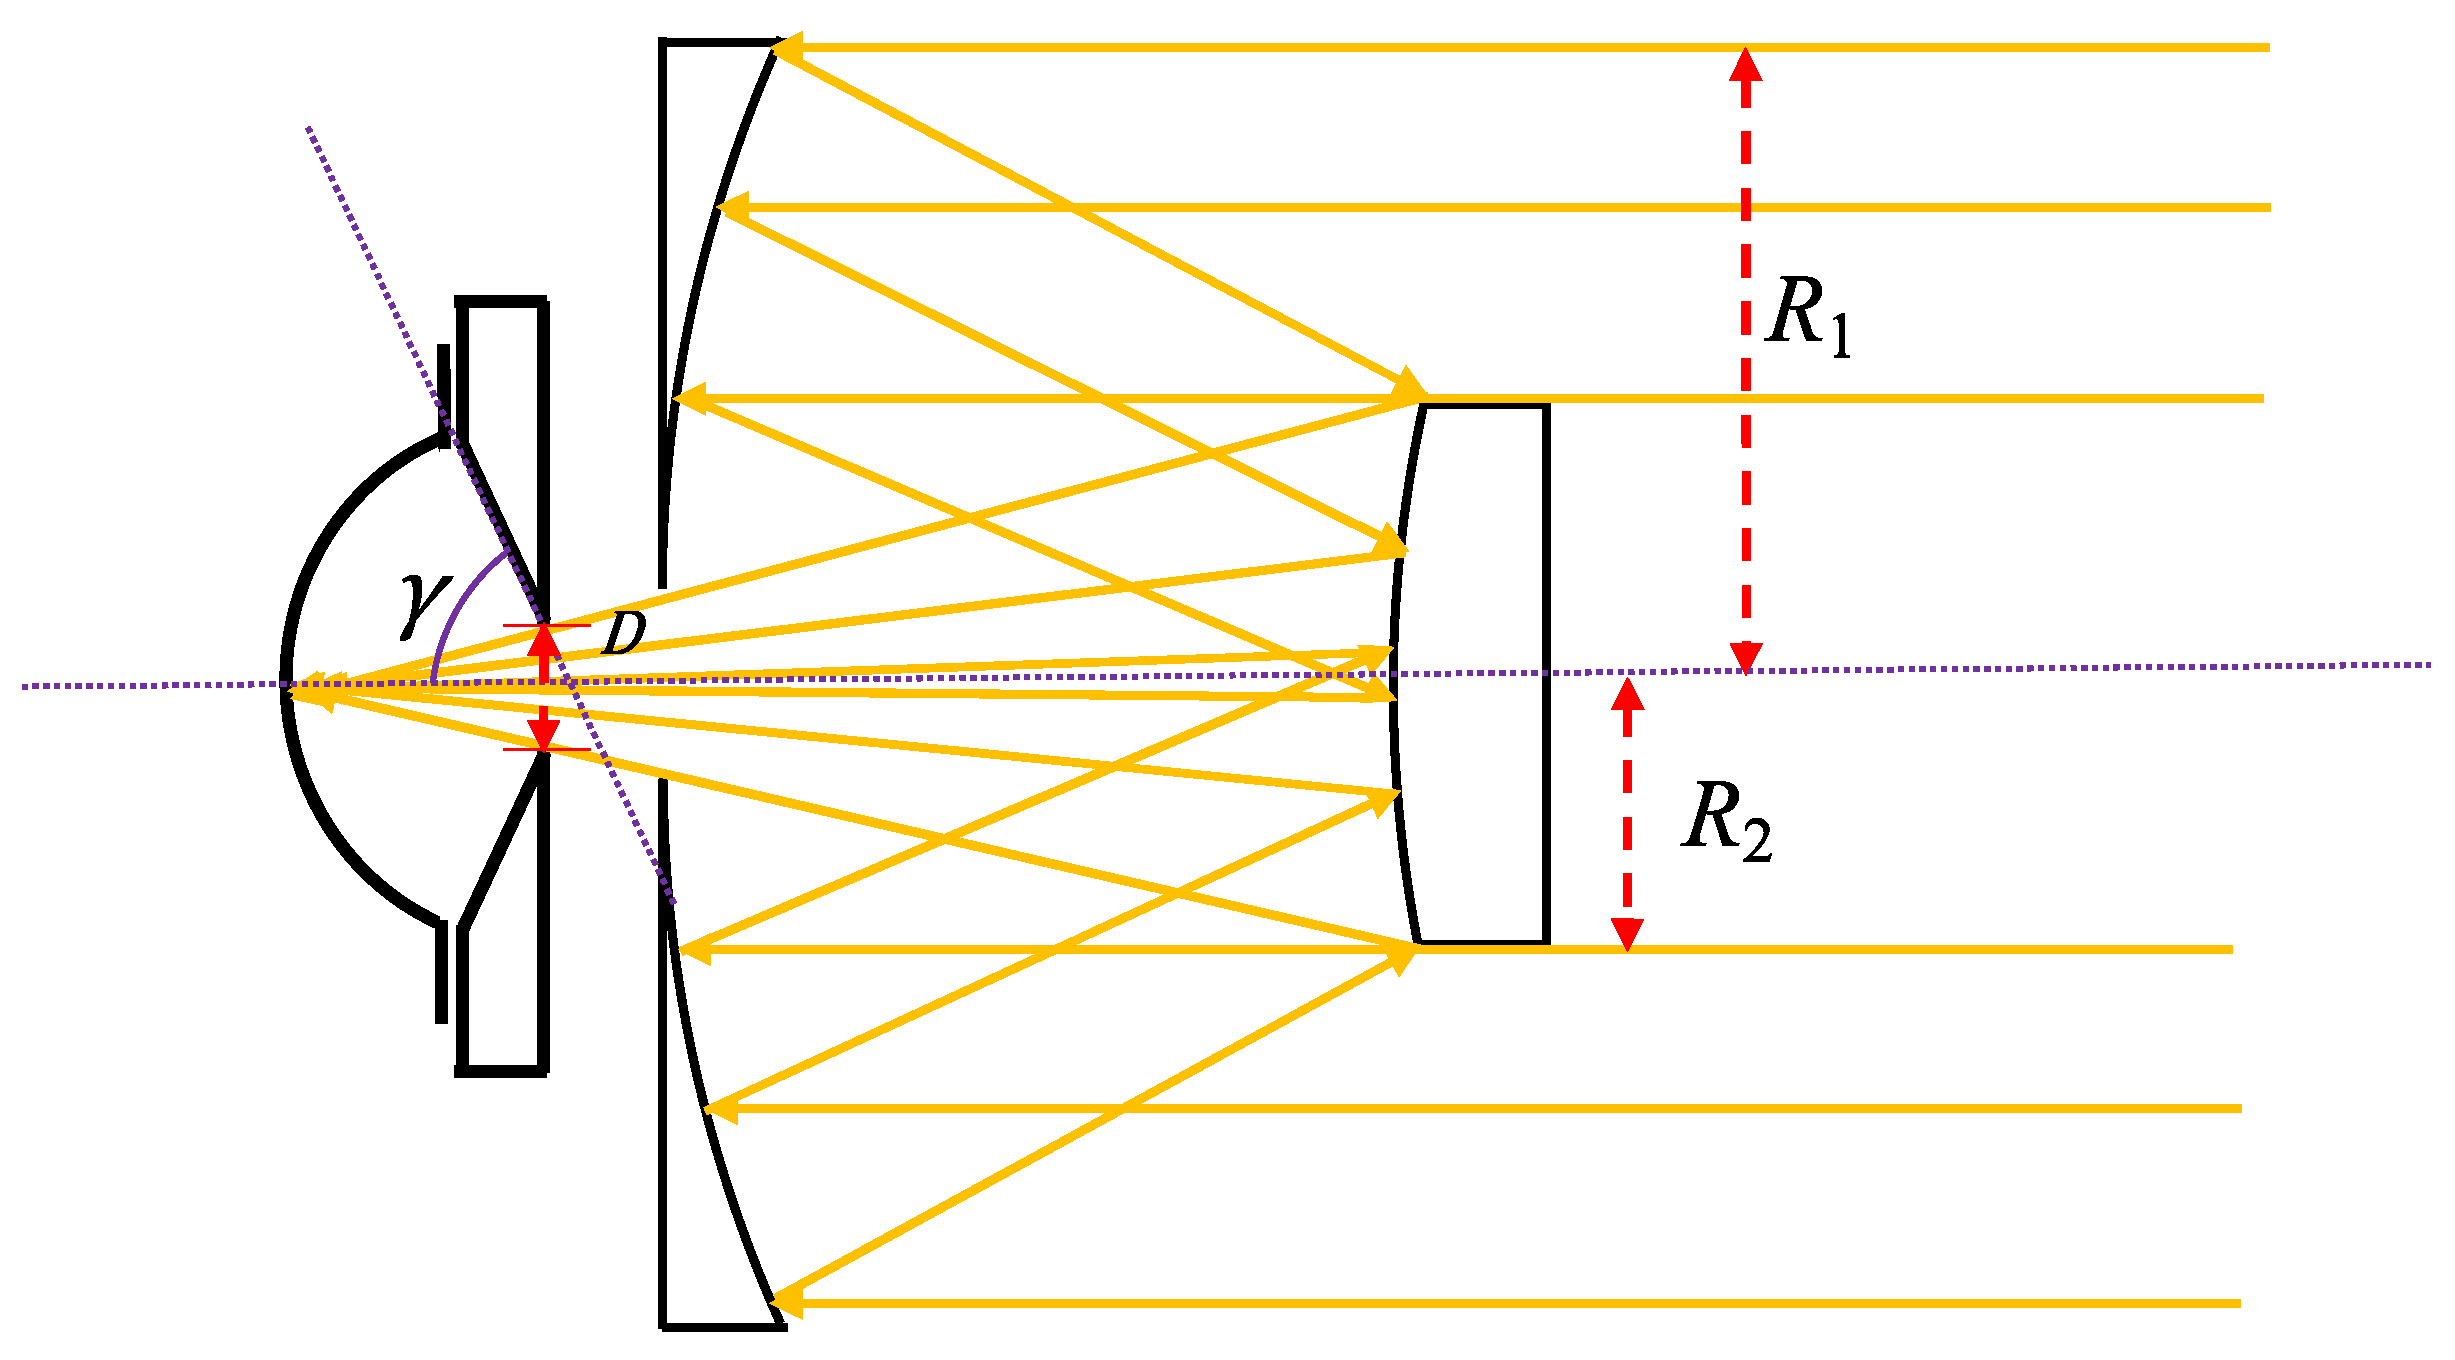
Usually, two types of instruments are used to measure the Earth’s outgoing radiation, that is, the non-scanning Wide Field-of-View (WFOV) and scanning Narrow Field-of-View (NWOF) radiometer [4,5,13]. The large Earth–Moon distance makes it impossible to detect the Earth’s outgoing radiation by the scanning method. Therefore, the dedicated non-scanning WFOV radiometer, such as the Moon-based Active Cavity Radiometer (MACR), is suitable for the MERO by considering the Earth as a one-pixel radiative source [18]. Although the MACR can carry out radiation observations on the lunar surface, the incident radiation signal is weak due to the large distance. The uncertainty of the instrument’s EPI is an important constraint for the design of radiometer performance and the uncertainty will reduce as the increase of absolute accuracy of the radiometer. However, until now, there has been no relevant published report on the design and performance analysis of a MACR. Therefore, based on the uncertainty analysis of the instrument’s EPI, a simplified dynamic response model was built to verify the detectability of the Earth’s outgoing radiation by the MACR. Figure 18 shows the simplified dynamic response model diagram. To detect the weak Earth’s radiation signal, it is not suitable if the aperture of the optical system is too small, so the telescope could adopt the Cassegrain system. The R1 and the R2 are the primary mirror radius and secondary mirror radius, respectively. The D is the diameter of the precision aperture, and the value is set as 5 mm. Referring to [45,46], the obstruction ratio of the Cassegrain system is set as 0.5 and the cavity part adopts a spherical shape with a 25 mm radius [45]. The angle γ is 120 degrees and the variation in the R1 will change the irradiance arrived on the inner surface of the cavity. Because the MACR does not have high requirements for the resolution, the Cassegrain system can satisfy the aggregation and amplification demands of energy. By comprehensively considering the MERO instrument’s EPI (Figure 4 and Refs. [18,21]), temporal sampling interval, and the size of the telescope, the radius of the primary mirror R1 is selected as 8 cm, as shown in Figure 18.
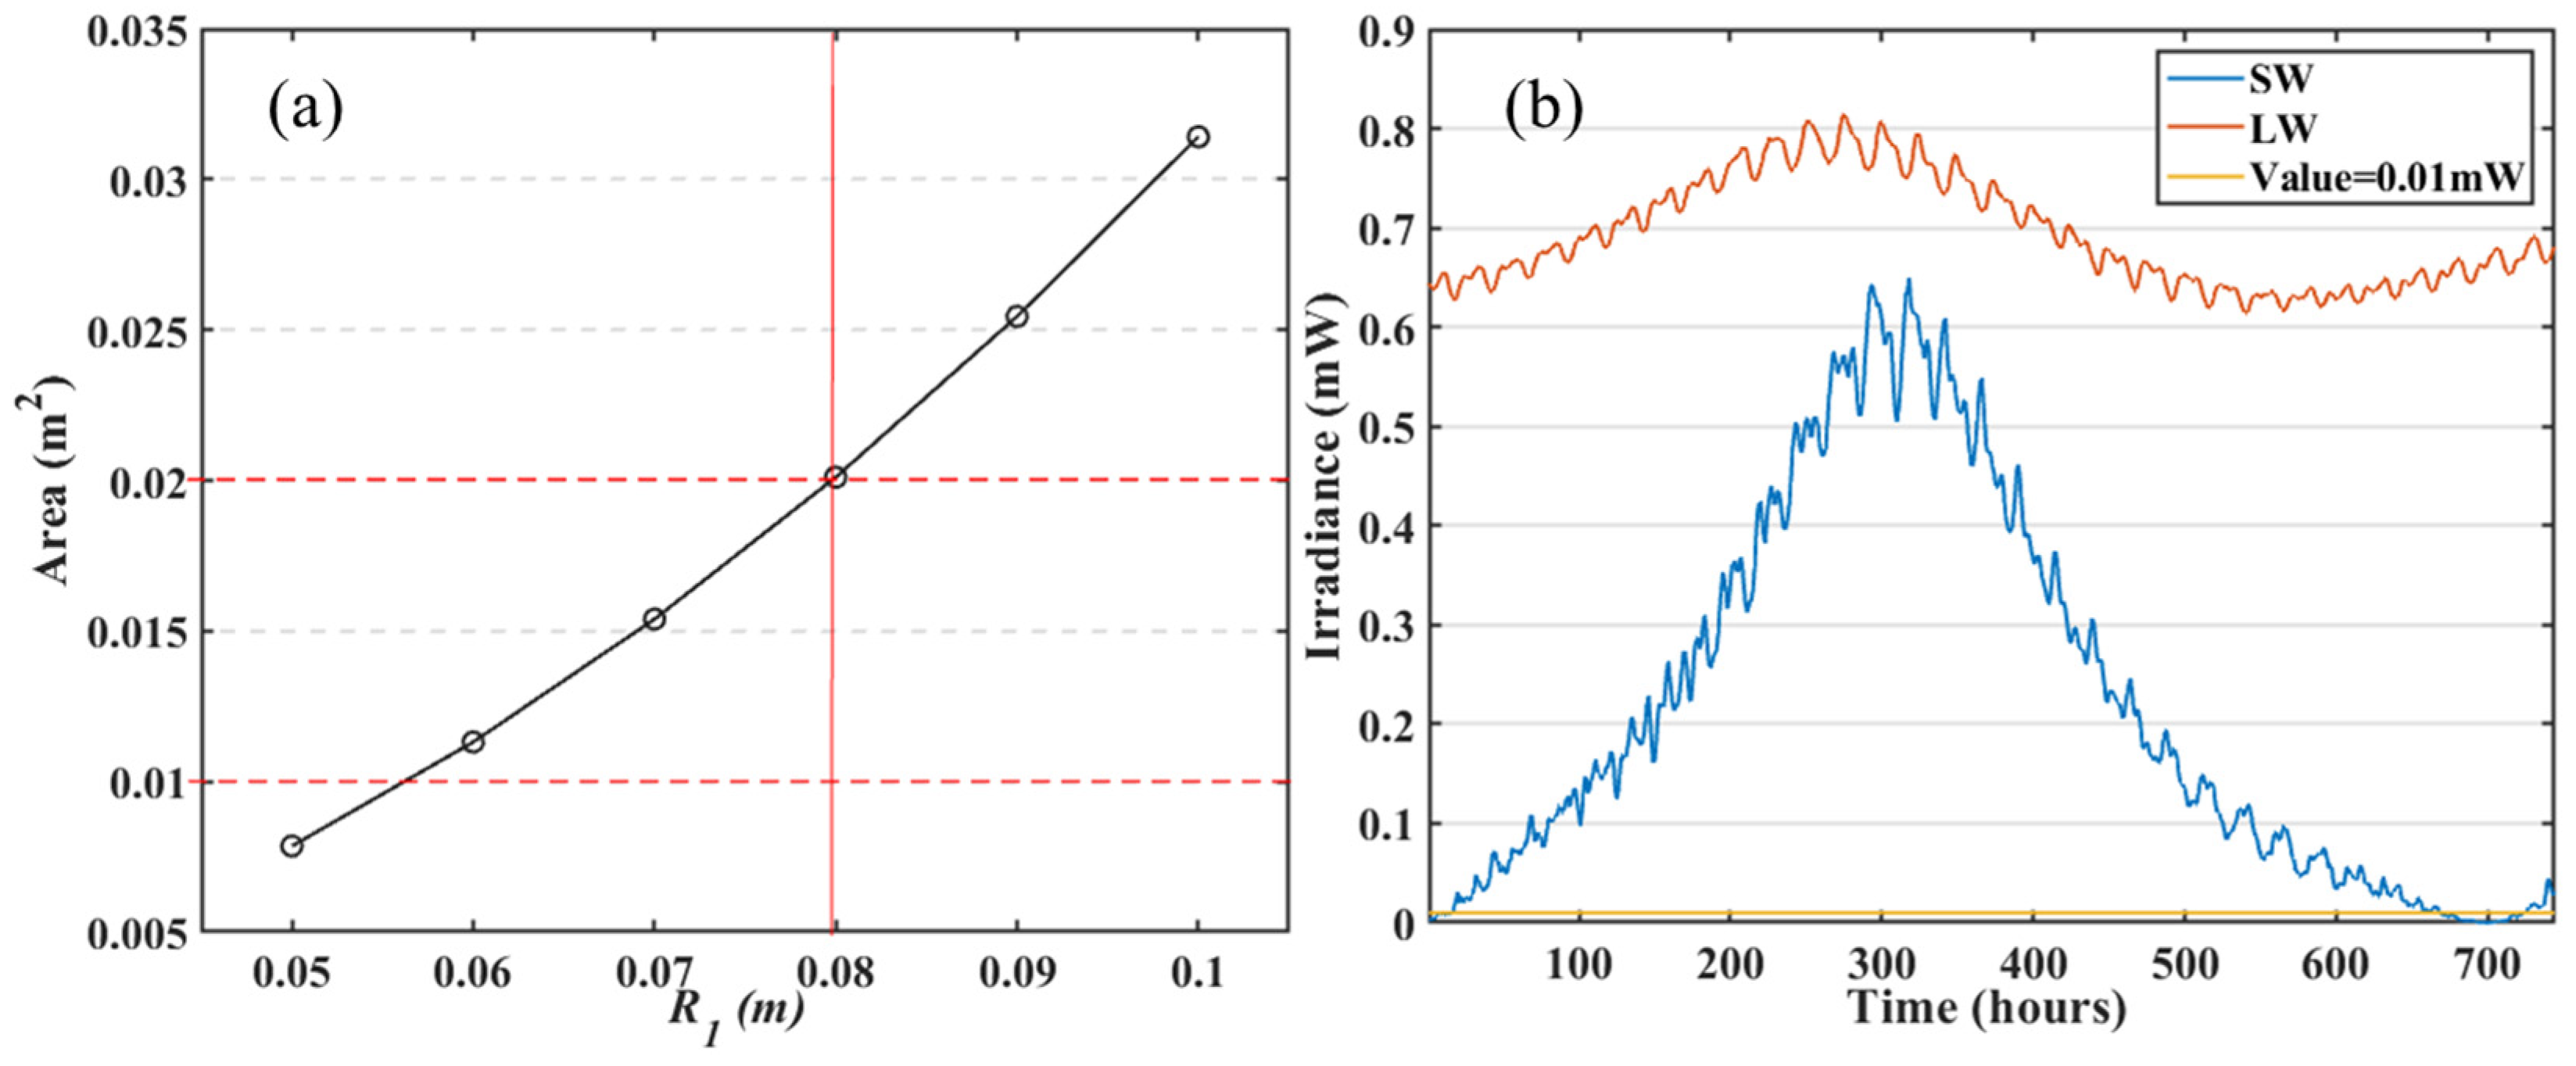
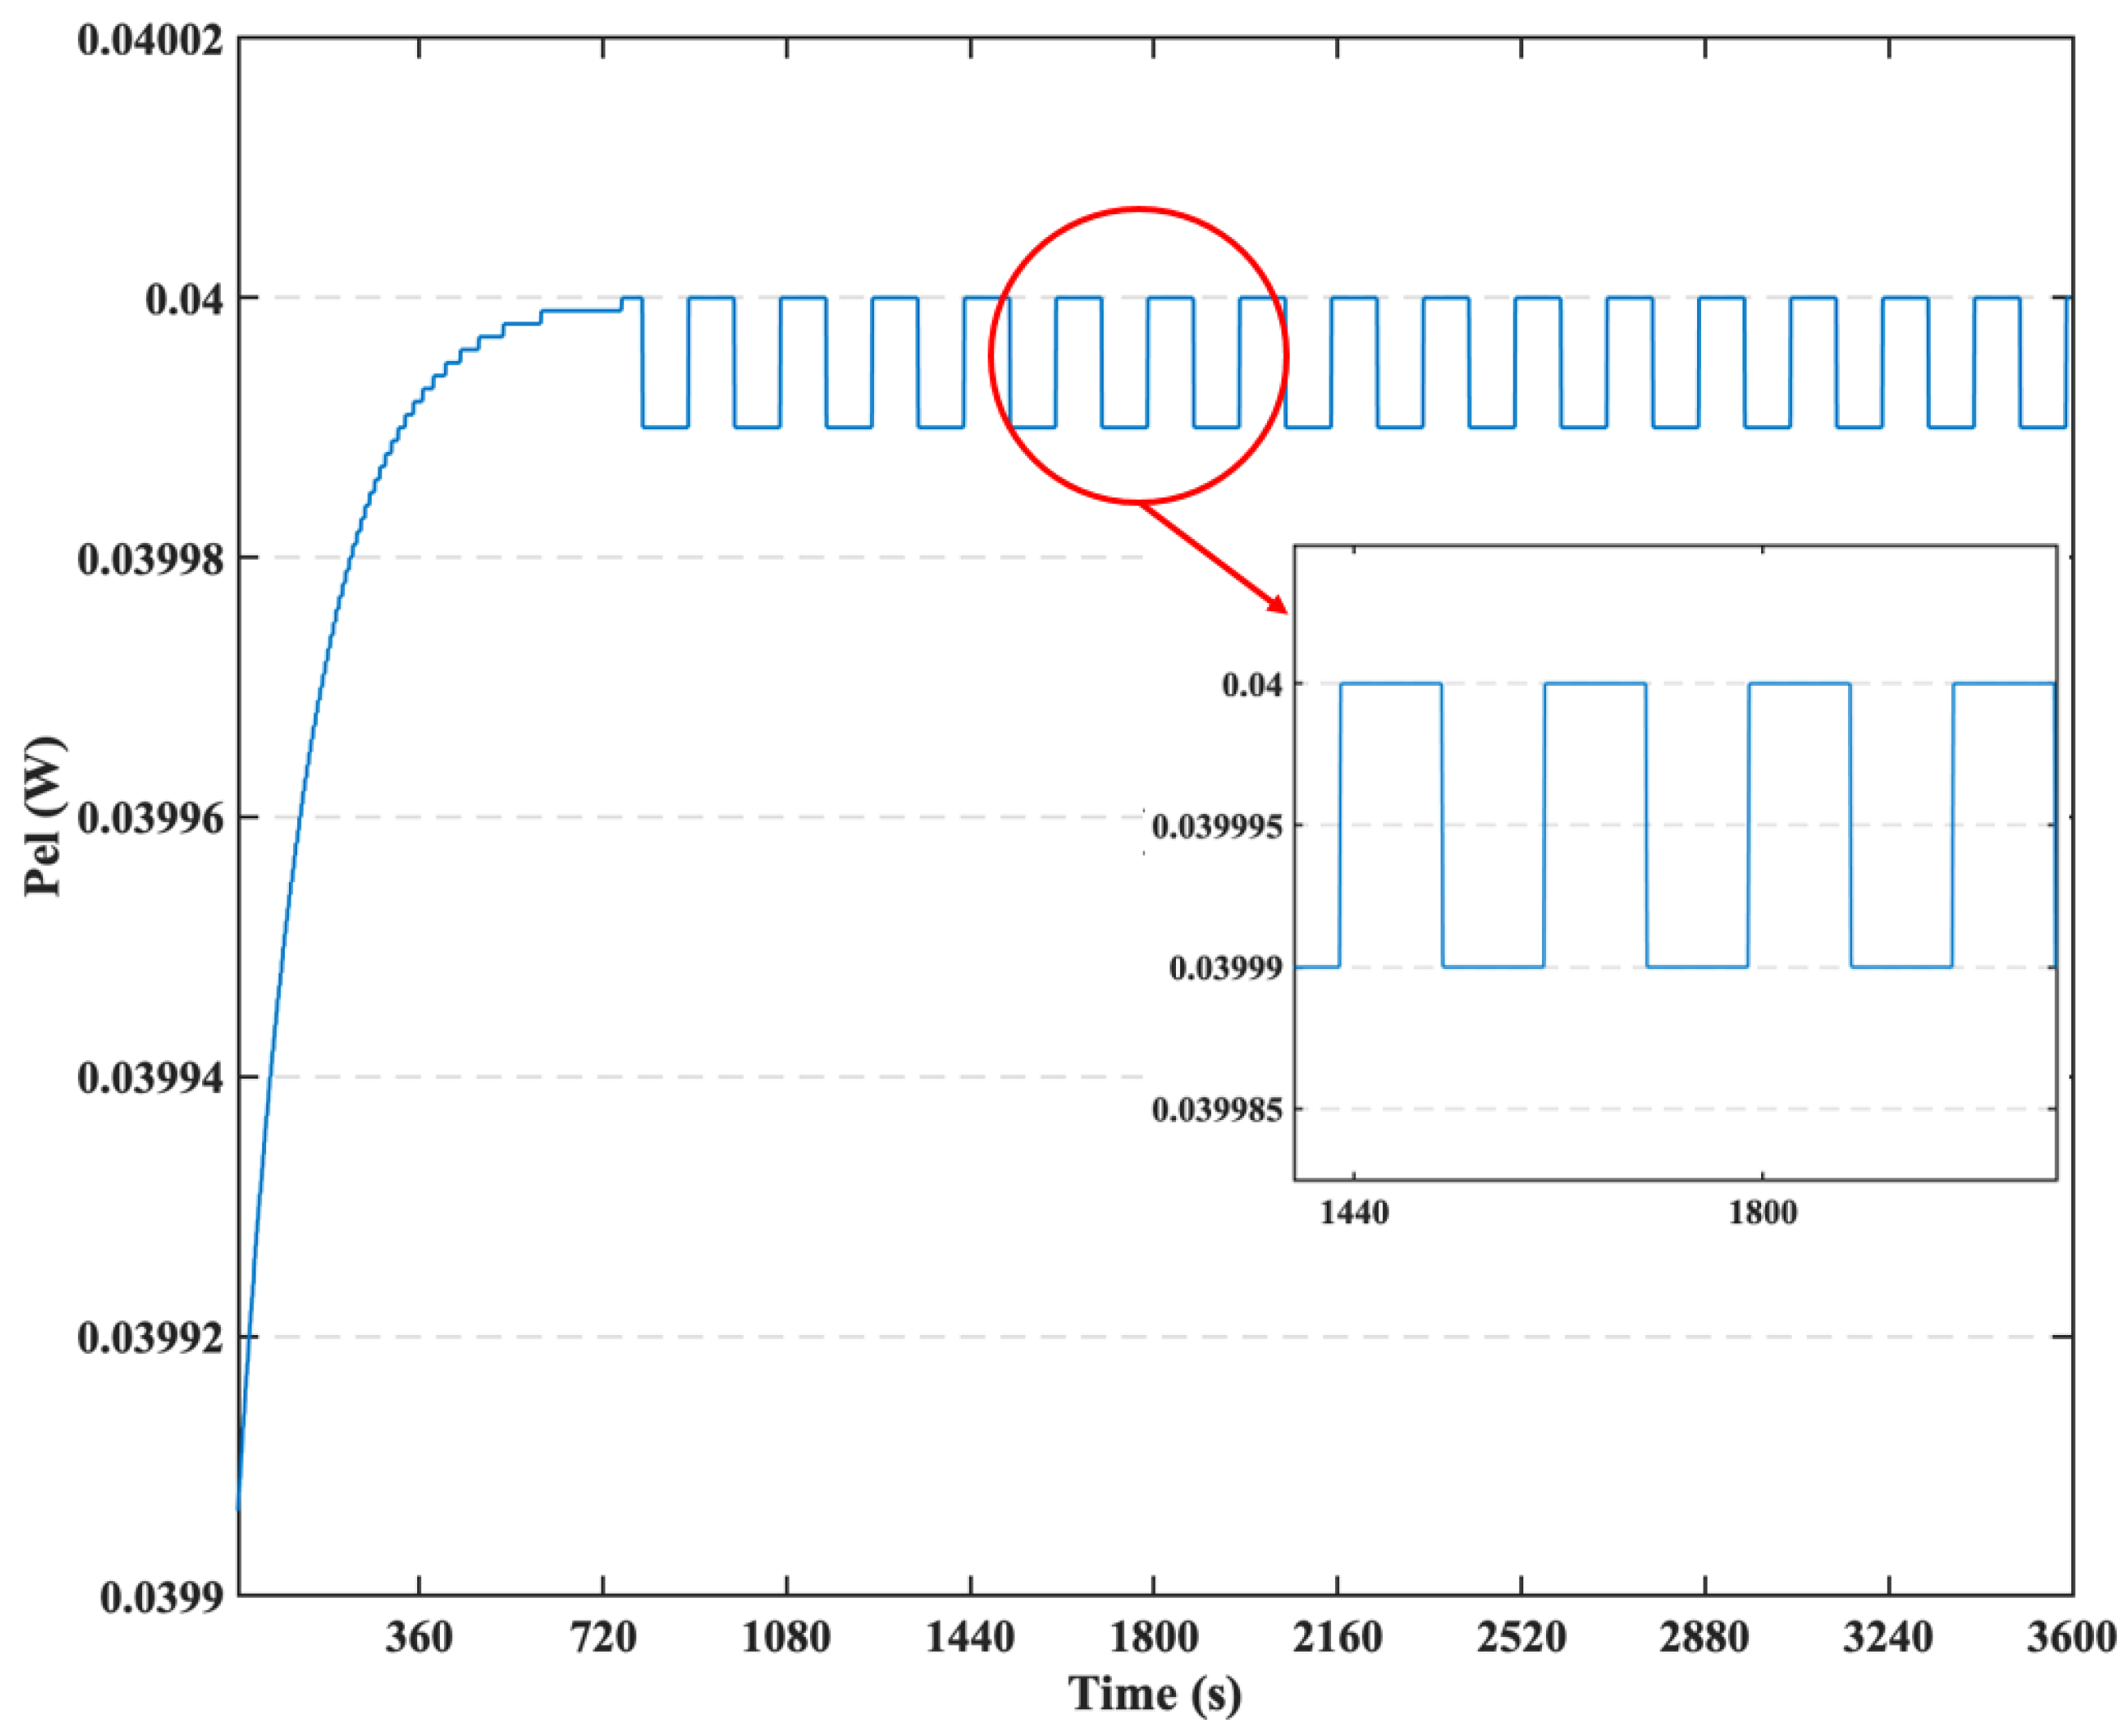
Figure 19a shows the curve of the effective receiving area for Earth’s outing radiation with the primary mirror radius R1, and the effective receiving area is 0.0101 m2 when the R1 is equal to 0.08 m (8 cm). Figure 19b presents the SW and LW irradiance received by the radiometer’s cavity in December 2020. Supposing the sensitivity design goal for the radiometer is 1 mW∙m−2 in a future actual design, the beam optical power (Pop) equals 0.01 mW arriving at the inner surface of the radiometer’s cavity through the precision aperture of 5 mm diameter. The previous uncertainty analysis of the EPI demonstrates that the sensitivity design goal of 1 mW∙m−2 could reduce the uncertainty of OSR very well but has limited improvement on the uncertainty of OLR. It is apparent that the irradiance arrived at the cavity is always larger than the sensitivity for the OLR, while for the OSR, the energy is greater than the sensitivity goal the most of time, as shown in Figure 19b. Usually, for the MACR, to implement the electrical substitution principle, a dedicated servo system is designed and equipped with it. In this work, the parameter setting for the servo system refers to [34]. The servo gain Kp was set as 1000 and the temperature difference of 1.2 K was set between the housing environment temperature and the set-point on the radiometer’s cavity. Firstly, the dynamic simulation starts from a closed shutter and the system reaches a thermal equilibrium after 800 s. Following that, the shutter begins alternately opening and closing in a 90 s cycle. Corresponding to the sensitivity design goal 1 mW∙m−2, the incident Pop of 0.01 mW was applied. Figure 20 shows the variation curve of the electric heating power (Pel) of the system with time. Results in Figure 20 reveal that the radiometer’s cavity approximately reached a thermal equilibrium after the time of 800 s. The electrical power, Pel, varies correctly between the 0.04000 mW (status: closed) and the 0.03999 mW (status: open). For the total heating power, optical power plus electrical power, it is stable continuously. During the closed shutter phase, which lasts 90 s, the electrical power is maximum and no optical power enters the MACR. In the next 90 s, an open shutter period, the decrease of Pel will be compensated by the incident non-zero optical power, Pop. The dynamic performance of a simplified radiometer, MACR, illuminates that the Cassegrain optical system and electrical substitution principle can realize the detection of Earth’s outing radiation with the sensitivity design goal 1 mW∙m−2. But it should be noted that since a cavity radiometer is usually a heat detector, its thermal noise will be a key influencing factor that cannot be ignored. Fortunately, due to the actual irradiance arriving at the cavity surface being more than an order of magnitude higher than the radiometric resolution (Figure 19b), it will help to better overcome thermal noise.
The simplified dynamic response simulation verifies the detectability of the Earth’s outgoing radiation by the MACR. Here, we present a simplified verification model so the radiometer’s design details, such as the structure, material, demodulation algorithms, etc., which influence the quality of the MACR’s data, will be considered in the following prototype design. The overcome of thermal noise and the improvement of signal-to-noise ratio can be achieved by high-precision temperature control and error traceability. At present, satellite-based technology has verified that mK-level temperature control (±0.005) can be achieved through multi-level temperature control [47].
Due to the cloud properties, such as the cloud mask, cloud size, and cloud area fraction, etc., and the aerosol having a strong influence on the outgoing radiation, the Imaging Spectroradiometer (such as EPIC in DSCOVR [12]) needs to work with the radiometer simultaneously for providing accurate scene-type, cloud, and aerosol information, which is a crucial need for choosing ADMs. Since the OSR and OLR are wide-band radiation, thermal detectors were selected to realize radiation detection, which means that the achievement and maintenance of SI traceability and accurate radiometric calibration of the equipment is a vital issue. For a Moon-based Earth radiation observation instrument, the SI traceability can be achieved by observing the cold and stable deep space background, using a specially designed stable calibration source (such as a Ga blackbody radiation source [48]) and the mutual correction method of the established detector network. In addition, many countries in the world have proposed plans and projects to establish scientific platforms, such as manned lunar bases or Automated unmanned research stations, on the Moon, such as the “Chang’E Project” and the Deep Space Gateway [49,50,51,52,53]. Therefore, key technologies related to the MACR will be verified and implemented in subsequent lunar exploration projects. Based on the results of this work, we will further carry out the analysis of the key parameters of the Moon-based non-scanning wide field-of-view radiometer, the construction of the data processing algorithm, and the reduction scheme of the data uncertainty.

5. Conclusions

Moon-based Earth observation (MERO), one of the scientific goals of the International Lunar Research Station (ILRS) project, can provide longer-term, well-calibrated, and continuous Earth’s outgoing radiation measurements on a planetary hemispherical scale. The MERO could be utilized to measure the Outgoing solar reflected Short-Wave (SW) Radiation (OSR) and Outgoing Long-Wave (LW) Radiation (OLR) from the Earth’s Top of Atmosphere (TOA) by considering the Earth as a single pixel radiative source. The MERO instrument’s Entrance Pupil Irradiance (EPI) is the radiation that finally arrives at the inner surface of the detection element, such as the radiometer’s cavity. In this work, by analyzing the influence of the Angular Distribution Models (ADMs), TOA flux, and Moon–Earth distance on the irradiance, the uncertainty of EPI was finally studied with the help of the theory of errors. In addition, the discussion of potential applications of Moon-based data and dynamic performance simulation for a simplified Moon-based cavity radiometer were presented.
The variation of the instrument’s EPI is mainly controlled by the ADMs, TOA flux, and the Earth–Moon distance. The ADMs have a stronger influence on the irradiance of OSR than the OLR. The ADMs strongly affect the amplitude of irradiance and do not change the period and phase. For the OLR, when the LW hemispherical anisotropic factor (∆R-LW) changes from 0.001 to 0.01, the variation of LW irradiance is less than 1 mW∙m−2, but if the ∆R-LW is more than 0.05, the variation will be more than 3 mW∙m−2. When the SW hemispherical anisotropic factor (∆R-SW) changes from 0.05 to 0.2, the variation of SW irradiance will exceed 10 mW∙m−2, but if the ∆R-SW is 0.05, the variation will be less than 3.4 mW∙m−2 and the average is 1.28 mW∙m−2. For the influence of TOA flux, the results reveal that the shortwave flux (∆SW) change could keep the irradiance attribute varying on hourly time scales, but it will lose its hourly-scale variability for the variation in longwave flux (∆LW). When the change of ∆SW is 8 W∙m−2, the variation in irradiance will be up to 2.70 mW∙m−2. The change of irradiance will be up to 0.94 mW∙m−2 when the change of ∆LW is 3 W∙m−2. Selecting the maximum hourly change of the Moon–Earth distance, ∆L-h, 270 km, the variation of irradiance caused by the distance does not exceed 0.13 mW∙m−2. In addition, the variation ranges for the OSR and OLR are 0.078~0.125 mW∙m−2 and 0.000~0.126 mW∙m−2, respectively.
The combined uncertainty (U) (1σ) reveals the overall response characteristics of irradiance to each influencing factor, so to ascertain the maximum hourly combined uncertainty, ∆R-LW, ∆R-SW, ∆SW, ∆LW, and ∆L-h are set to 0.005, 0.05, 8 W∙m−2, 3 W∙m−2, and 270 km, respectively. Results show the influence of OSR on EPI is more dramatic than OLR and the uncertainty does not change the periodic characteristics of irradiance. For the SW combined uncertainty (USW) and LW combined uncertainty (ULW), the maximum values are about 5.18 and 1.08 mW∙m−2 (1σ), respectively, from March 2000 to December 2020. The effect of the hourly Earth–Moon distance (≤270 km) change on combined uncertainty is smaller compared to the other two factors. The variation of simulated irradiance caused by the distance does not exceed 0.13 mW∙m−2. When the ∆R-LW, ∆R-SW, ∆LW, ∆SW, and ∆L-h drop from 0.005, 0.05, 3 W∙m−2, 8 W∙m−2 and 270 km to 0.001, 0.01, 1 W∙m−2, 1 W∙m−2, and 130 km, the combined uncertainty have significant decline and the maximum value of USW and ULW are 0.91 and 0.35 mW∙m−2 (1σ), respectively. The uncertainty analysis of the instrument’s EPI will help with the design of the instrument with the highest signal-to-noise ratio and the interpretation of the instrument’s data.
The Moon-based data will be a powerful complement for analyzing and predicting future global climate change. By the extracting linear trend of the Moon-based OLR/OSR simulated hourly EPI time series, results reveal that the Moon-based observation data can effectively acquire the overall linear trend of OLR and OSR and have the variation with 0.23 mW∙m−2 (LW) and 0.16 mW∙m−2 (SW) per decade, respectively, which will be useful for the determination of the Earth energy imbalance. In addition, the effect of uncertainty on the EPI only changes the intercept of fitted curves without changing the slope. Based on the constraint of the uncertainty of the instrument’s EPI, a simplified dynamic response model was built for the cavity radiometer, a kind of MERO instrument, and the results verify the detectability of the Earth’s outgoing radiation by the MERO instrument. The dynamic response also illuminates that the Cassegrain optical system and electrical substitution principle can realize the detection of Earth’s outing radiation with the sensitivity design goal 1 mW∙m−2.

Author Contributions

Conceptualization, S.B. and S.D.; methodology, Y.Z.; software, Y.Z.; validation, Y.Z.; formal analysis, Y.Z.; investigation, Y.Z.; resources, Y.Z.; data curation, Y.Z.; writing—original draft preparation, Y.Z.; writing—review and editing, Y.Z., S.B. and S.D.; supervision, S.B. and S.D.; project administration, S.B.; funding acquisition, S.B. All authors have read and agreed to the published version of the manuscript.

Funding

This research was funded by the Natural Science Basic Research Program of Shaanxi (No. 2023-JC-YB-389), the National Natural Science Foundation of China (Grant No. 41590855, 51776171) and the Key R&D Program of Shaanxi Province (No. 2022NY-233, S2023-YF-LLRH-QCYK-0067).

Institutional Review Board Statement

Not applicable.

Informed Consent Statement

All participants in the work were informed and consented to the publication of the paper.

Data Availability Statement

The Jet Propulsion Lab (JPL) Planetary and Lunar Ephemerides data used in this study were downloaded from the ephemeris system at https://ssd.jpl.nasa.gov/?planet_eph_export (accessed on 3 May 2020). The datasets of CER_SYN1deg-1Hour_Terra-Aqua-MODIS_Edition4A and CER_SYN1deg-1Hour_Terra-MODIS_Edition4A were downloaded from the online CERES data ordering system at https://asdc.larc.nasa.gov/project/CERES (accessed on 6 September 2021).

Conflicts of Interest

The authors declare no conflict of interest.

Abbreviations

MEROMoon-Based Earth Radiation Observation
ERBEarth Radiation Budget
EPIEntrance Pupil Irradiance
ADMsAngular Distribution Models
TOATop of Earth’s Atmosphere
SWShortwave
LWLongwave
OSROutgoing Shortwave Radiation
OLROutgoing Longwave Radiation
ERBEEarth Radiation Budget Experiment
CERESClouds and the Earth’s Radiant Energy System
GERBGeostationary Earth Radiation Budget
WFOVWide Field-of-View
NFOVNarrow Field-of-View
DSCOVRDeep Space Climate Observatory
LEOLow-Earth Orbit
GEOGeostationary Earth Orbit
MACRMoon-based Active Cavity Radiometer

References

  1. Loeb, N.G.; Thorsen, T.J.; Norris, J.R.; Wang, H.; Su, W. Changes in Earth’s Energy Budget during and after the “Pause” in Global Warming: An Observational Perspective. Climate 2018, 6, 62. [Google Scholar] [CrossRef]
  2. Sillmann, J.; Kharin, V.V.; Zwiers, F.; Zhang, X.; Bronaugh, D. Climate extremes indices in the cmip5 multimodel ensemble: Part 2. future climate projections. J. Geophys. Res. Atmos. 2013, 118, 2473–2493. [Google Scholar] [CrossRef]
  3. Ackerman, S.A.; Platnick, S.; Bhartia, P.K.; Duncan, B.; L’Ecuyer, T.; Heidinger, A.; Skofronick-Jackson, G.; Loeb, N.; Schmit, T.; Smith, N. Satellites See the World’s Atmosphere. Meteorol. Monogr. 2019, 59, 4.1–4.53. [Google Scholar]
  4. Dewitte, S.; Clerbaux, N. Measurement of the Earth Radiation Budget at the Top of the Atmosphere—A Review. Remote Sens. 2017, 9, 1143. [Google Scholar] [CrossRef]
  5. Barkstrom, B.R.; Smith, G.L. The Earth Radiation Budget Experiment: Science and implementation. Rev. Geophys. 1986, 24, 379–390. [Google Scholar] [CrossRef]
  6. Dewitte, S. Editorial for Special Issue “Earth Radiation Budget”. Remote Sens. 2020, 12, 3379. [Google Scholar] [CrossRef]
  7. Jacobowitz, H.; Soule, H.V.; Kyle, H.L.; House, F.B. The Earth Radiation Budget (ERB) Experiment: An overview. J. Geophys. Res. Atmos. 1984, 89, 5021–5038. [Google Scholar] [CrossRef]
  8. Smith, G.L.; Green, R.N.; Raschke, E.; Avis, L.M.; Suttles, J.T.; Wielicki, B.A.; Davies, R. Inversion methods for satellite studies of the Earth’s Radiation Budget: Development of algorithms for the ERBE Mission. Rev. Geophys. 1986, 24, 407–421. [Google Scholar] [CrossRef]
  9. Smith, G.; Priestley, K.; Loeb, N.; Wielicki, B.; Charlock, T.; Minnis, P.; Doelling, D.; Rutan, D. Clouds and Earth Radiant Energy System (CERES), a review: Past, present and future. Adv. Space Res. 2011, 48, 254–263. [Google Scholar] [CrossRef]
  10. Clerbaux, N.; Dewitte, S.; Bertrand, C.; Caprion, D.; De Paepe, B.; Gonzalez, L.; Ipe, A.; Russell, J.E.; Brindley, H. Unfiltering of the Geostationary Earth Radiation Budget (GERB) Data. Part I: Shortwave Radiation. J. Atmos. Ocean. Technol. 2008, 25, 1087–1105. [Google Scholar] [CrossRef]
  11. Clerbaux, N.; Dewitte, S.; Bertrand, C.; Caprion, D.; De Paepe, B.; Gonzalez, L.; Ipe, A.; Russell, J.E. Unfiltering of the Geostationary Earth Radiation Budget (GERB) Data. Part II: Longwave Radiation. J. Atmos. Ocean. Technol. 2008, 25, 1106–1117. [Google Scholar] [CrossRef]
  12. Su, W.; Minnis, P.; Liang, L.; Duda, D.P.; Khlopenkov, K.; Thieman, M.M.; Yu, Y.; Smith, A.; Lorentz, S.; Feldman, D.; et al. Determining the daytime Earth radiative flux from National Institute of Standards and Technology Advanced Radiometer (NISTAR) measurements. Atmos. Meas. Tech. 2020, 13, 429–443. [Google Scholar] [CrossRef]
  13. Earth Venture Continuity Radiation Budget Science Working Group. Measurement and Instrument Requirement Recommendations for an Earth Venture Continuity Earth Radiation Budget Instrument. 2018. Available online: https://smd-prod.s3.amazonaws.com/science-pink/s3fs-public/atoms/files/ERB_SWG_Rept_Draft_07242018_TAGGED.pdf (accessed on 3 November 2022).
  14. Guo, H.; Liu, G.; Ding, Y. Moon-based Earth observation: Scientific concept and potential applications. Int. J. Digit. Earth 2017, 11, 546–557. [Google Scholar] [CrossRef]
  15. Dewitte, S.; Clerbaux, N.; Cornelis, J. Decadal Changes of the Reflected Solar Radiation and the Earth Energy Imbalance. Remote Sens. 2019, 11, 663. [Google Scholar] [CrossRef]
  16. Ye, H.; Guo, H.; Liu, G.; Ping, J.; Zhang, L.; Zhang, Y. Estimating the Earth’s Outgoing Longwave Radiation Measured from a Moon-Based Platform. Remote Sens. 2021, 13, 2201. [Google Scholar] [CrossRef]
  17. Zhang, Y.; Bi, S.; Wu, J. The influence of lunar surface position on irradiance of moon-based earth radiation observation. Front. Earth Sci. 2022, 16, 757–773. [Google Scholar] [CrossRef]
  18. Zhang, Y.; Dewitte, S.; Bi, S. A Model for Estimating the Earth’s Outgoing Radiative Flux from A Moon-Based Radiometer. Remote Sens. 2023, 15, 3773. [Google Scholar] [CrossRef]
  19. Zhang, G.; Bi, S.; Zhang, Y.; Wu, J.; Meng, X. Systematic scheme and key parameters of moon-based imaging spectrometer. In Infrared, Millimeter-Wave, and Terahertz Technologies V; SPIE: Beijing, China, 2018; Volume 10826, pp. 116–125. [Google Scholar]
  20. Ye, H.; Guo, H.; Liu, G.; Ren, Y. Observation duration analysis for Earth surface features from a Moon-based platform. Adv. Space Res. 2018, 62, 274–287. [Google Scholar] [CrossRef]
  21. Zhang, Y.; Bi, S.; Wu, J. Effect of Temporal Sampling Interval on the Irradiance for Moon-Based Wide Field-of-View Radiometer. Sensors 2022, 22, 1581. [Google Scholar] [CrossRef] [PubMed]
  22. Huang, J.; Guo, H.; Liu, G.; Shen, G.; Ye, H.; Deng, Y.; Dong, R. Spatio-Temporal Characteristics for Moon-Based Earth Observations. Remote Sens. 2020, 12, 2848. [Google Scholar] [CrossRef]
  23. Huang, J.; Guo, H.; Liu, G.; Wang, H.; Deng, Y.; Dong, R. Observational angular analysis of Moon-based Earth observations. Int. J. Remote Sens. 2022, 43, 2315–2333. [Google Scholar] [CrossRef]
  24. Duan, W.; Liu, J.; Yan, Q.; Ruan, H.; Jin, S. The Effect of Spatial Resolution and Temporal Sampling Schemes on the Measurement Error for a Moon-Based Earth Radiation Observatory. Remote Sens. 2021, 13, 4432. [Google Scholar] [CrossRef]
  25. Chen, G.; Guo, H.; Jiang, H.; Han, C.; Ding, Y.; Wu, K. Analysis of Comprehensive Multi-Factors on Station Selection for Moon-Based Earth Observation. Remote Sens. 2022, 14, 5404. [Google Scholar] [CrossRef]
  26. Yuan, L.; Liao, J. A Physical-Based Algorithm for Retrieving Land Surface Temperature From Moon-Based Earth Observation. IEEE J. Sel. Top. Appl. Earth Obs. Remote Sens. 2020, 13, 1856–1866. [Google Scholar] [CrossRef]
  27. Song, Y.; Wang, X.; Bi, S.; Wu, J.; Huang, S. Effects of solar radiation, terrestrial radiation and lunar interior heat flow on surface temperature at the nearside of the Moon: Based on numerical calculation and data analysis. Adv. Space Res. 2017, 60, 938–947. [Google Scholar] [CrossRef]
  28. Lohmeyer, W.; Cahoy, K. Space weather radiation effects on geostationary satellite solid-state power amplifiers. Space Weather. 2013, 11, 476–488. [Google Scholar] [CrossRef]
  29. Durante, M.; Cucinotta, F.A. Physical basis of radiation protection in space travel. Rev. Mod. Phys. 2011, 83, 1245–1281. [Google Scholar] [CrossRef]
  30. Yan, Y.; Wang, H.-N.; He, H.; He, F.; Chen, B.; Feng, J.-Q.; Ping, J.-S.; Shen, C.; Xu, R.-L.; Zhang, X.-X. Analysis of observational data from Extreme Ultra-Violet Camera onboard Chang’E-3 mission. Astrophys. Space Sci. 2016, 361, 1–7. [Google Scholar] [CrossRef]
  31. Huang, S.; Zhu, P.; Ye, X.; Li, Q.; Shu, L.; Liu, Y.; Fang, W. The Idea of Moon-based Earth Radiation Budget Experiment (MERBE). In Proceedings of the 43rd COSPAR Scientific Assembly, Online, 28 January–4 February 2021; Volume 43, p. 369. [Google Scholar]
  32. Gristey, J.J.; Su, W.; Loeb, N.G.; Haar, T.H.V.; Tornow, F.; Schmidt, K.S.; Hakuba, M.Z.; Pilewskie, P.; Russell, J.E. Shortwave Radiance to Irradiance Conversion for Earth Radiation Budget Satellite Observations: A Review. Remote Sens. 2021, 13, 2640. [Google Scholar] [CrossRef]
  33. Su, W.; Corbett, J.; Eitzen, Z.; Liang, L. Next-generation angular distribution models for top-of-atmosphere radiative flux calculation from CERES instruments: Methodology. Atmos. Meas. Tech. 2015, 8, 611–632. [Google Scholar] [CrossRef]
  34. Loeb, N.G.; Manalo-Smith, N.; Kato, S.; Miller, W.F.; Gupta, S.K.; Minnis, P.; Wielicki, B.A. Angular distribution models for top-of-atmosphere radiative flux estimation from the Clouds and the Earth’s Radiant Energy System instrument on the Tropical Rainfall Measuring Mission satellite. Part I: Methodology. J. Appl. Meteorol. 2003, 42, 240–265. [Google Scholar] [CrossRef]
  35. Suttles, J.T.; Green, R.N.; Minnis, P.; Smith, G.; Staylor, W.; Wielicki, B.; Walker, I.J.; Young, D.F.; Taylor, V.R.; Stowe, L. Angular Radiation Models for Earth-Atmosphere System; Shortwave Radiation; National Aeronautics and Space Administration: Washington, DC, USA, 1988; Volume 1.
  36. Suttles, J.T.; Green, R.N.; Smith, G.L.; Wielicki, B.A.; Walker, I.J.; Taylor, V.R.; Stowe, L.L. Angular Radiation Models for Earth Atmosphere System; Longwave Radiation; National Aeronautics and Space Administration: Washington, DC, USA, 1989; Volume 2. [Google Scholar]
  37. Loeb, N.G.; Doelling, D.R.; Wang, H.; Su, W.; Nguyen, C.; Corbett, J.G.; Liang, L.; Mitrescu, C.; Rose, F.G.; Kato, S. Clouds and the Earth’s Radiant Energy System (CERES) Energy Balanced and Filled (EBAF) Top-of-Atmosphere (TOA) Edition-4.0 Data Product. J. Clim. 2018, 31, 895–918. [Google Scholar] [CrossRef]
  38. NASA/LARC/SD/ASDC. CERES and GEO-Enhanced TOA, Within-Atmosphere and Surface Fluxes, Clouds and Aerosols 1-Hourly Terra-Aqua Edition4A [Data set]. NASA Langley Atmospheric Science Data Center DAAC. 2017. Available online: https://asdc.larc.nasa.gov/project/CERES/CER_SYN1deg-1Hour_Terra-Aqua-MODIS_Edition4A (accessed on 6 September 2021).
  39. Jeffreys, H. On the theory of errors and least squares. Proc. R. Soc. London. Ser. A Contain. Pap. A Math. Phys. Character 1932, 138, 48–55. [Google Scholar]
  40. Park, R.S.; Folkner, W.M.; Williams, J.G.; Boggs, D.H. The JPL planetary and lunar ephemerides DE440 and DE441. Astron. J. 2021, 161, 105. [Google Scholar] [CrossRef]
  41. Petit, G.; Luzum, B. IERS- IERS Conventions (2010). International Earth Rotation and Reference Systems Service (IERS) Technical Note. 2016. Available online: https://www.iers.org/IERS/EN/Publications/TechnicalNotes/tn36.html (accessed on 27 January 2020).
  42. Doelling, D.R.; Loeb, N.G.; Keyes, D.F.; Nordeen, M.L.; Morstad, D.; Nguyen, C.; Wielicki, B.A.; Young, D.F.; Sun, M. Geostationary Enhanced Temporal Interpolation for CERES Flux Products. J. Atmos. Ocean. Technol. 2013, 30, 1072–1090. [Google Scholar] [CrossRef]
  43. Doelling, D.R.; Sun, M.; Nguyen, L.T.; Nordeen, M.L.; Haney, C.O.; Keyes, D.F.; Mlynczak, P.E. Advances in Geostationary-Derived Longwave Fluxes for the CERES Synoptic (SYN1deg) Product. J. Atmos. Ocean. Technol. 2016, 33, 503–521. [Google Scholar] [CrossRef]
  44. World Meteorological Organization (WMO). Essential Climate Variables. Available online: https://public.wmo.int/en/programmes/global-climate-observing-system/essentialclimate-variables (accessed on 6 September 2022).
  45. Schifano, L.; Smeesters, L.; Geernaert, T.; Berghmans, F.; Dewitte, S. Design and Analysis of a Next-Generation Wide Field-of-View Earth Radiation Budget Radiometer. Remote Sens. 2020, 12, 425. [Google Scholar] [CrossRef]
  46. Zhang, H.; Ye, X.; Zhu, P.; Fang, W.; Wang, Y. Observation System Design and Analysis for a New Staring Earth Radiation Budget Radiometer Based on the Lagrange L1 Point of the Earth–Moon System. Remote Sens. 2022, 14, 1596. [Google Scholar] [CrossRef]
  47. Liu, H.; Zhang, X.; Feng, J.; Zhu, C.; Cai, Z.; Xu, Y. Application of precision thermal control techniques in Taiji-1 satellite. Chin. J. Space Sci. 2021, 41, 337–341. [Google Scholar] [CrossRef]
  48. Swartz, W.H.; Lorentz, S.R.; Papadakis, S.J.; Huang, P.M.; Smith, A.W.; Deglau, D.M.; Yu, Y.; Reilly, S.M.; Reilly, N.M.; Anderson, D.E. RAVAN: CubeSat Demonstration for Multi-Point Earth Radiation Budget Measurements. Remote Sens. 2019, 11, 796. [Google Scholar] [CrossRef]
  49. Li, C.; Wang, C.; Wei, Y.; Lin, Y. China’s present and future lunar exploration program. Science 2019, 365, 238–239. [Google Scholar] [CrossRef] [PubMed]
  50. Gerstenmaier, W. Progress in Defining the Deep Space Gateway and Transport Plan. In Proceedings of the NASA Advisory Council Human Exploration and Operations Committee Meeting, Washington, DC, USA, 28–29 March 2017. [Google Scholar]
  51. Zeng, H.; Li, Z.; Xu, R.; Peng, K.; Wang, P. Further Advances for staging orbits of manned lunar exploration mission. Acta Astronaut. 2023, 204, 281–293. [Google Scholar] [CrossRef]
  52. Saha, D.; Bazmohammadi, N.; Raya-Armenta, J.M.; Bintoudi, A.D.; Lashab, A.; Vasquez, J.C.; Guerrero, J.M. Space Microgrids for Future Manned Lunar Bases: A Review. IEEE Open Access J. Power Energy 2021, 8, 570–583. [Google Scholar] [CrossRef]
  53. Pei, Z.; Liu, J.; Wang, Q.; Kang, Y.; Zou, Y.; Zhang, H.; Zhang, Y.; He, H.; Wang, Q.; Yang, R.; et al. Overview of lunar exploration and International Lunar Research Station. Chin. Sci. Bull. 2020, 65, 2577–2586. [Google Scholar] [CrossRef]
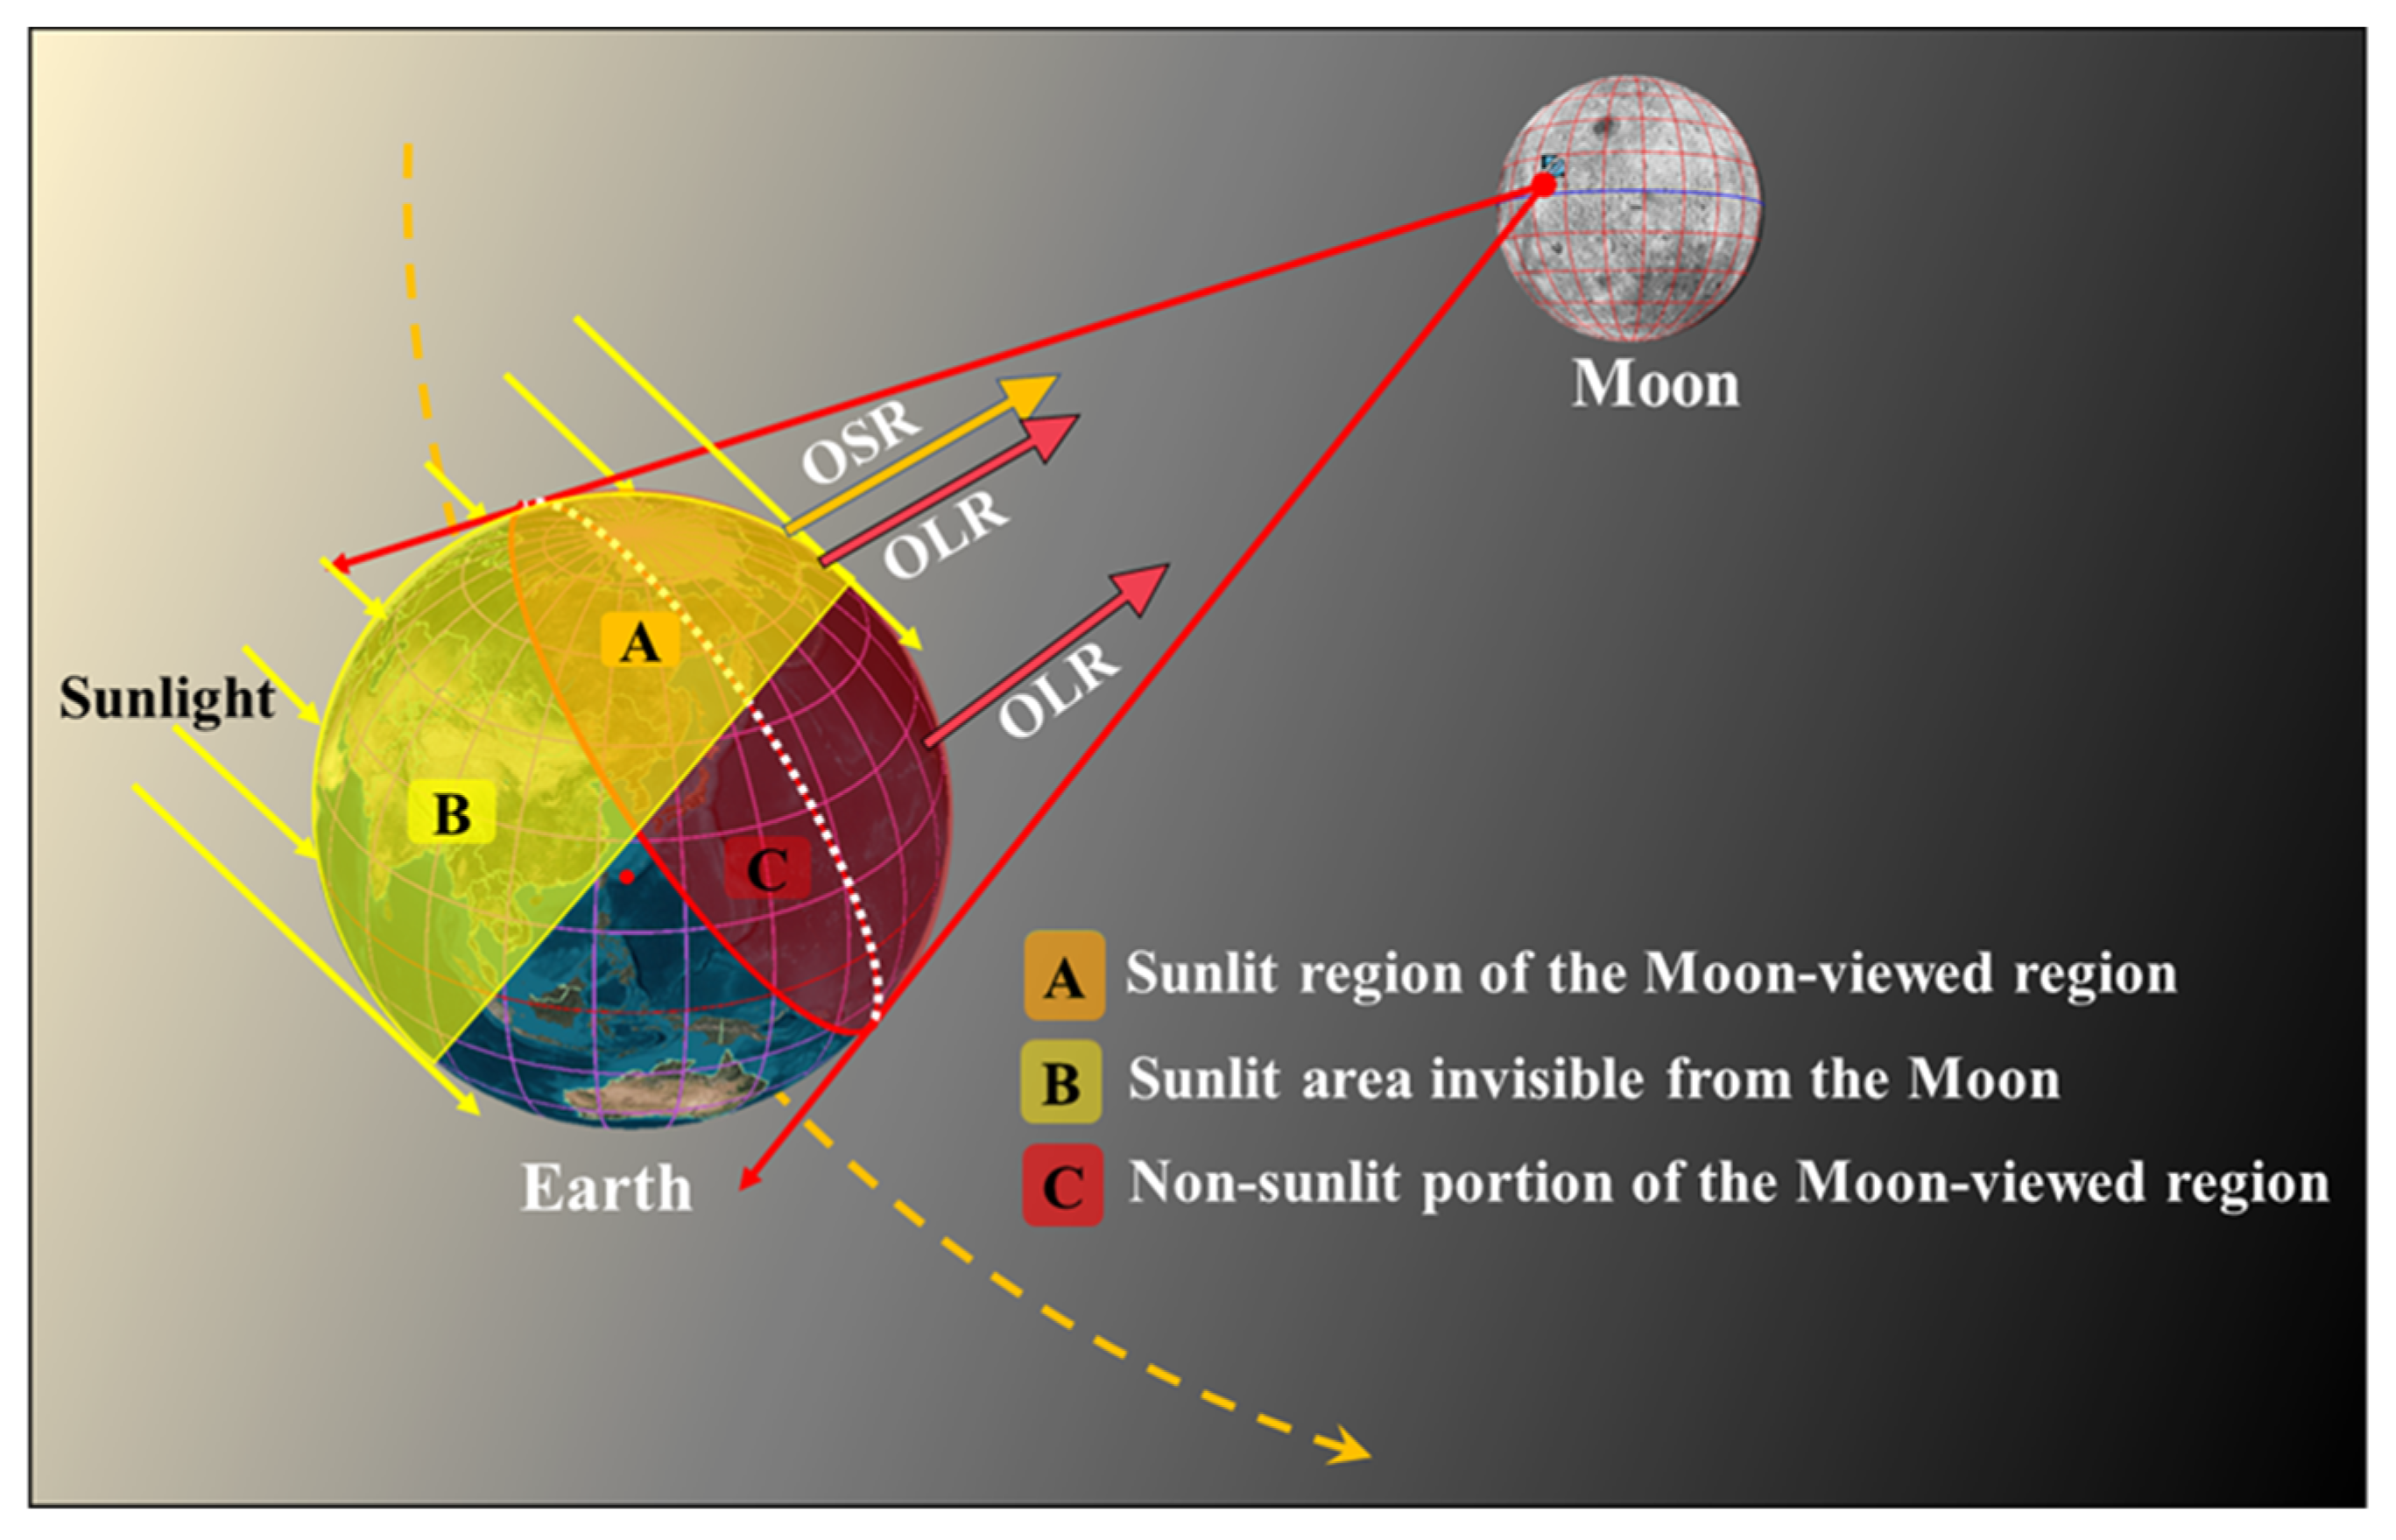
Figure 1. Geometrical relationship among the Earth, the Sun, and the Moon-based Earth radiation observation instrument.
Remotesensing 15 04132 g001
Figure 2. The sketch illustrates the calculation of irradiance and the angular coordinate system for angular distribution models of ERBE. The (a,b) are the angular coordinate system for the ERBE ADMs, respectively.
Remotesensing 15 04132 g002
Figure 3. Flowchart for the calculation of irradiance and the uncertainty analysis.
Remotesensing 15 04132 g003
Figure 4. The simulated instrument’s EPI times series in 2017.
Remotesensing 15 04132 g004
Figure 5. The simulated hourly EPI time series on 18 October in 2017 under two conditions (anisotropy and isotropy). (ad) are four moments used in the following part.
Remotesensing 15 04132 g005
Figure 6. The hourly irradiance deviation time series in 2017 under two conditions of anisotropy and isotropy.
Remotesensing 15 04132 g006
Figure 7. The radio of irradiance for the anisotropic and isotropic factors in the year 2017. (a): The ratio of LW; (b): the ratio of SW.
Remotesensing 15 04132 g007
Figure 8. Changes in the LW/SW simulated hourly irradiance with the variation of anisotropic factors, ∆R, in September and October 2017. The (a,b) are the change of LW and SW irradiance, respectively.
Remotesensing 15 04132 g008
Figure 9. The distribution of outgoing shortwave and longwave radiation. ((a) SW: 03:00 on October 18 in 2017; (b) LW: 09:00 on October 18 in 2017).
Remotesensing 15 04132 g009
Figure 10. Changes in the LW/SW simulated hourly irradiance with the variation of TOA flux in October 2017.
Remotesensing 15 04132 g010
Figure 11. The statistical histogram for hourly changes of the distance (∆L-h) between the moon and Earth from March 2000 to December 2020.
Remotesensing 15 04132 g011
Figure 12. Changes in the LW/SW simulated hourly irradiance with the variation of the Moon–Earth distance in 2017 (∆L = 270 km represents the maximum hourly change of Moon–Earth distance).
Remotesensing 15 04132 g012
Figure 13. The LW and SW maximum combined uncertainty (1σ) in the simulated hourly irradiance with the variation of the anisotropic factors, TOA flux, and the Moon–Earth distance in 2017 (∆L-h = 270 km represents the maximum hourly Moon–Earth distance; ∆R-LW = 0.005 and ∆R-LW = 0.05 are the changes of anisotropic factors).
Remotesensing 15 04132 g013
Figure 14. The magnitude and ratio of each component for the uncertainty in the LW/SW-simulated hourly irradiance in October 2017 ((a,b) the magnitude of each component; (c,d) the ratio of each component in the combined uncertainty).
Remotesensing 15 04132 g014
Figure 15. The statistical histogram for the combined uncertainty in the LW/SW simulated hourly irradiance from March 2000 to December 2020 when the ∆R-LW, ∆R-SW, ∆LW, ∆SW, and ∆L-h are 0.001, 0.01, 1 W∙m−2, 1 W∙m−2, and 130 km.
Remotesensing 15 04132 g015
Figure 16. Schematic of the extracted linear trend and the global monthly Earth TOA flux for the OSR/OLR data from the set of the Clouds and the Earth’s Radiant Energy System (CERES) Energy Balanced and Filled (EBAF) top-of-atmosphere (TOA), Edition 4.0 (Ed4.0), from 2000 to 2020, https://asdc.larc.nasa.gov/data/CERES/ (accessed on 6 September 2021).
Remotesensing 15 04132 g016
Figure 17. Schematic of the extracted linear trend under two conditions for the Moon-based OLR/OSR simulated hourly EPI time series for the year 2000~2020. The SW-Ori and LW-Ori are the original irradiances without considering uncertainty. The SW-Ori + UN and LW-Ori + UN are the irradiances, including the combined uncertainty.
Remotesensing 15 04132 g017
Figure 18. The simplified model diagram for the Cassegrain system.
Remotesensing 15 04132 g018
Figure 19. (a) shows the curve of the area with the radius for a primary mirror; (b) the received OLR and OSR for the cavity in December 2020 and the position for the irradiance value 0.01 mW.
Remotesensing 15 04132 g019
Figure 20. The variation curve of the electric heating power (Pel) of the system with time.
Remotesensing 15 04132 g020
Table 1. The statistical results of ERBE’s anisotropic factors. The Min, Max, and N represent the minimum, maximum, and number of samples of anisotropic factor.
BandRangeRatio (%)MinMaxN
SW (0.2–5 μm)0~0.51.69 0.4112.746720
0.5~1.054.3586.88
1.0~1.532.53
1.5~2.06.34
>2.05.09
LW (5–200 μm)0.85~0.907.77 0.831.079072
0.90~0.9516.4788.56%
0.95~1.0018.55
1.00~1.0553.54
1.05~1.103.6
Table 2. The statistical results of the combined uncertainty (1σ) in the LW/SW-simulated hourly irradiance from 2000 to 2020.
BandRange (mW∙m−2)Ratio (%)
SW (0.2–5 μm)0.0~1.040.35
1.0~2.020.19
2.0~3.017.22
3.0~4.017.66
4.0~5.24.58
LW (5–100 μm)0.80~0.9042.48
0.90~1.0033.52
1.00~1.1024.00
Table 3. The correlation of CERES OLR/OSR data and Moon-based OLR/OSR data.
CERES OLRCERES OSR
Moon-Based OLR1−1
Moon-Based OSR−11
Disclaimer/Publisher’s Note: The statements, opinions and data contained in all publications are solely those of the individual author(s) and contributor(s) and not of MDPI and/or the editor(s). MDPI and/or the editor(s) disclaim responsibility for any injury to people or property resulting from any ideas, methods, instructions or products referred to in the content.