Article

Differences in Global Precipitation Regimes between Land and Ocean Areas Based on the GPM IMERG Product

State Key Laboratory of Earth Surface Processes and Resource Ecology, Faculty of Geographical Science, Beijing Normal University, Beijing 100875, China
*
Author to whom correspondence should be addressed.
Remote Sens. 2023, 15(17), 4179; https://doi.org/10.3390/rs15174179
Submission received: 14 July 2023 / Revised: 9 August 2023 / Accepted: 14 August 2023 / Published: 25 August 2023
(This article belongs to the Section Atmospheric Remote Sensing)

Abstract

:
Climate change research has received increasing attention from both researchers and the public, and the analysis of precipitation is one of the most important topics in this field. As a supplement to gauge observations, satellite-derived precipitation data present advantages, as they have high spatiotemporal resolution and good continuity. The Global Precipitation Measurement (GPM) mission is the newest generation of precipitation measurement products designed to conduct quasi-global satellite observations. This study used the latest Integrated Multi-satellitE Retrievals for GPM data collected between 2001 and 2020 to analyze changes in precipitation amount, frequency, and intensity on global land and ocean surfaces. The results showed that precipitation intensity over the ocean was generally higher than on land, and the two were more similar at the hourly scale than at the daily scale, as shown by the JS divergence statistics: 0.0323 and 0.0461, respectively. This may be due to the thermodynamic differences between land and the ocean, which can accumulate over a longer time scale. The average number of annual precipitation hours and days increased by 50 h and 5 days during 2011–2020 compared with the previous decade. The absence of obvious changes in annual precipitation amounts led to a decrease in annual precipitation intensity and the weakening of extreme precipitation on land. The analysis of precipitation regimes in nine mainland regions of the globe showed a significant increasing trend for both hourly and daily precipitation in North Asia, while insignificant changes or even decreasing trends were detected in the other regions. The results of this study elucidated the variations in precipitation between land and ocean areas and can contribute to the understanding of global precipitation.

1. Introduction

Variations in precipitation within the context of global warming have attracted increasing attention from both researchers and the public, as this parameter can affect water resource availability, crop growth, agricultural/industrial production, and human livelihoods [1,2,3,4]. Globally, under a warming climate, precipitation will increase with an increase in evapotranspiration and water vapor amounts [5,6,7]. At regional scales, precipitation is constrained by atmospheric circulation, topography, and local emissions, which show different variation patterns [8,9,10,11]. The Sixth Assessment Report of the Intergovernmental Panel on Climate Change states that, since the mid-20th century, the frequency and intensity of heavy precipitation events at a global scale over land areas have increased because of continued global warming [12]. The percentage increase in the frequency of extreme precipitation events is highly confidently projected to be larger than that of low-intensity events [12]. However, given the lack of long-term observation data with a high spatiotemporal resolution, the analysis and prediction of global precipitation face significant challenges [13,14,15].
Given their different physical characteristics, land and ocean areas exhibit significant differences in energy absorption, storage, and release, which, in turn, affect atmospheric circulation and precipitation distribution [6,16,17]. Because of the high heat capacity and thermal inertia of the ocean, as well as evaporation, its temperature varies relatively slowly; conversely, land has a low heat capacity and thermal inertia, and its temperature varies relatively quickly. Therefore, under the same amount of surface solar radiation, the rate of temperature variation differs between ocean and land areas [18], leading to different atmospheric circulation patterns, which, in turn, alter the transport of water vapor. Within the context of global climate change, the differential response of land and ocean areas to heating has an impact on precipitation distribution and the occurrence of extreme precipitation events [8,19,20]. Therefore, understanding differences in precipitation on the ocean and land, as well as their trends, is of great significance for predicting future climate change and addressing the challenges it poses [21,22,23].
In recent years, extensive research has been conducted on precipitation changes using ground data obtained on land [24,25]. Observations from Chinese meteorological stations have shown that the duration of precipitation in most parts of China decreased in recent decades, leading to a more even temporal distribution of precipitation and a decrease in seasonality indices in annual mean precipitation [26,27,28]. A time series of annual maximum daily precipitation obtained from nearly two-thirds of the high-quality land-based observation gauges available worldwide showed increasing trends [29,30]. Recently, simulations have revealed that precipitation is predicted to decline predominantly over subtropical oceans, whereas over subtropical land regions, no decline is expected, or it will be even reversed by the land–sea warming contrast [31].
Nevertheless, because of the spatially uneven distribution of precipitation data derived from ground gauges and the susceptibility of gauge observations to external environmental influences, it is difficult to collect continuous spatiotemporal global precipitation data [14,32]. Therefore, there are still significant challenges in monitoring global precipitation. The most widely used method for studying extreme precipitation is the Extreme Climate Index proposed by the World Meteorological Organization, which is based on long-term and evenly distributed daily precipitation observations [33,34]. However, the lack of high-quality data to support research on extreme precipitation at the hourly scale has resulted in relatively few studies being conducted on this topic [35,36,37]. With the development of satellite remote sensing technology, satellite-based products for the monitoring of precipitation have gradually become an important source of data because of their real-time availability, high spatiotemporal resolution, and other advantageous characteristics [25,38,39,40,41,42].
The Global Precipitation Measurement (GPM) mission is the newest generation of global satellite-based products released since the Tropical Rainfall Measuring Mission (TRMM). Compared with previous products of this kind, the GPM mission has higher accuracy, wider coverage, and higher spatiotemporal resolution [43,44]. It can provide global microwave-based rain and snow data within 3 h and Integrated Multi-satellitE Retrievals for GPM (IMERG) algorithm-based 30 min data, which can be used for research and applications in hydrology, meteorology, agriculture, and disaster prevention [45,46,47].
Numerous studies have shown that IMERG is significantly more accurate in detecting extreme precipitation compared with previous TRMM products, especially during monsoon season [39,46,48]. By comparing IMERG and other satellite products with gauge observations, it was shown that IMERG had the best performance [39,49]. Another evaluation based on hourly observations from automatic weather stations in China revealed that IMERG generally overestimated precipitation frequency but underestimated precipitation intensity and detected a positive correlation between the duration of events and their average intensity [50,51]. Other researchers found that there were large discrepancies in extreme and light precipitation in IMERG, and it usually underestimates precipitation, especially in mountainous areas and complex terrains [52,53,54]. Therefore, using IMERG in hydrological simulations results in a high variance in their performance, and calibration is very often necessary [53,54]. Previous studies have also examined the climatology, radial intensity distribution, and regional variation of the intensity of precipitation systems using IMERG data covering the 2001–2020 period and found that precipitation intensity decreased and increased over most tropical and subtropical regions, respectively [21,22,55].
The present study aimed to analyze and describe variations in extreme precipitation in the 60°N–60°S region on a global scale from 2001 to 2020 based on hourly precipitation data obtained from the IMERG product. The spatial distribution patterns of extreme precipitation were revealed, with a focus on the quantification of the differences between land and ocean areas at hourly and daily time scales. The obtained results can enhance our understanding of the climatology of and variations in extreme precipitation, potentially contributing to addressing the challenges posed by global climate change.

2. Materials and Methods

2.1. Data

The Global Precipitation Measurement (GPM) mission, developed by the National Aeronautics and Space Administration of the United States, is a collection of satellite-based remote sensing products to measure precipitation built upon the previously released TRMM [44,45]. Their purpose is to provide a new generation of quasi-global satellite remote sensing data with higher accuracy and resolution. For the first time, the GPM mission uses a dual-frequency radar observation system that, combined with active radar observation technology, provides physical information on precipitation particles in clouds from different angles, improving their ability to detect light precipitation and snow.
The GPM products are classified into four levels based on their data inversion algorithms. The Integrated Multi-satellitE Retrievals for GPM (IMERG) product is the third-level GPM product and has a temporal resolution of 30 min and a spatial resolution of 0.1° × 0.1°. IMERG is divided into three types based on calibration accuracy: “early-run”, “late-run”, and “final-run” (referred to as IMERG-E, IMERG-L, and IMERG-F, respectively). Between them, IMERG-E and IMERG-L are quasi-real-time products, as they are released 4 and 12 h after activation, respectively. In contrast, IMERG-F is a non-real-time post-processing product that is corrected for bias using monthly observation data from ground rainfall gauges, and it is usually released 2 months after activation. In this study, the IMERG-F V6 product was selected for analysis (available for download at https://pmm.nasa.gov/data-access/downloads/gpm (accessed on on 13 January 2022)): the spatial range was 60°S–60°N, and the time range was from 2001 to 2020.

2.2. Methods

Since the GPM IMERG product is available with a time resolution of 30 min, the precipitation volume was summed up to obtain the commonly used 1 h resolution. To be consistent with the minimum scale commonly used in rain gauge observations, a threshold of 0.1 mm/h was set to distinguish between precipitation and non-precipitation. Grids with values lower than this threshold obtained over the period of 1 h were considered non-precipitation. Then, the hourly precipitation volume was further summed up every 24 h to obtain daily precipitation.
Precipitation frequency and intensity are important indicators of precipitation changes. In this study, the precipitation frequency of a grid was defined as the number of hours or days with precipitation values higher than the threshold value within a given period (month or year). Precipitation intensity was calculated as the total amount of precipitation within a given period (month or year) divided by the precipitation frequency during that period.
The maximum value and percentile threshold methods were used to calculate precipitation indices and obtain the maximum and 99th percentile values of hourly maximum precipitation, total precipitation, and precipitation frequency at different temporal and spatial scales. Specifically, to ensure that hourly and daily extreme precipitation values were based on the same sample size, the maximum value sampling method was used to determine the maximum hourly precipitation on each precipitation day. Then, based on the maximum hourly or daily precipitation values obtained, the 99th percentile was calculated as extreme precipitation for hourly or daily values.
The extreme precipitation data obtained from 2001 to 2020 were analyzed using a simple linear regression model, as shown in the following formula:
  P = a y + b + ε
where P represents the value of the extreme precipitation index, y represents the observation years (2001–2020), a is the trend value, b is the constant value, and ε is the random regression error. The significance of the trend was calculated using a t-test and expressed using p-values.
To quantitatively analyze the differences in extreme precipitation between land and ocean areas, the Jensen–Shannon (JS) divergence was used to measure the distance between two probability distributions. This is a symmetric measurement used to quantify the similarity between two probability distributions based on the Kullback–Leibler divergence. Generally, the JS divergence is symmetrical, and its values range from 0 to 1, with lower values indicating greater similarity between distributions [56,57]. To distinguish differences in precipitation between the land regions of the globe, terrestrial areas were divided into nine regions based on land–ocean mask data and the land-partitioning method reported by Zhang and Wang [22]. Specifically, the nine land regions are North Asia (30°–59°N, 50°–150°E), South Asia (10°–30°N, 60°–150°E), Australia (40°–10°S, 110°–155°E), the Maritime Continent (10°S–10°N, 90°–165°E), North America (25°–59°N, 125°–50°W), Central America (0°–25°N, 110°–40°W), South America (49°S–0°, 90°–30°W), Europe (40°–59°N, 15°W–50°E), and Africa (35°S–35°N, 20°W–40°E). All the analyses were completed using MATLAB R2022a v9.12.0.

3. Results

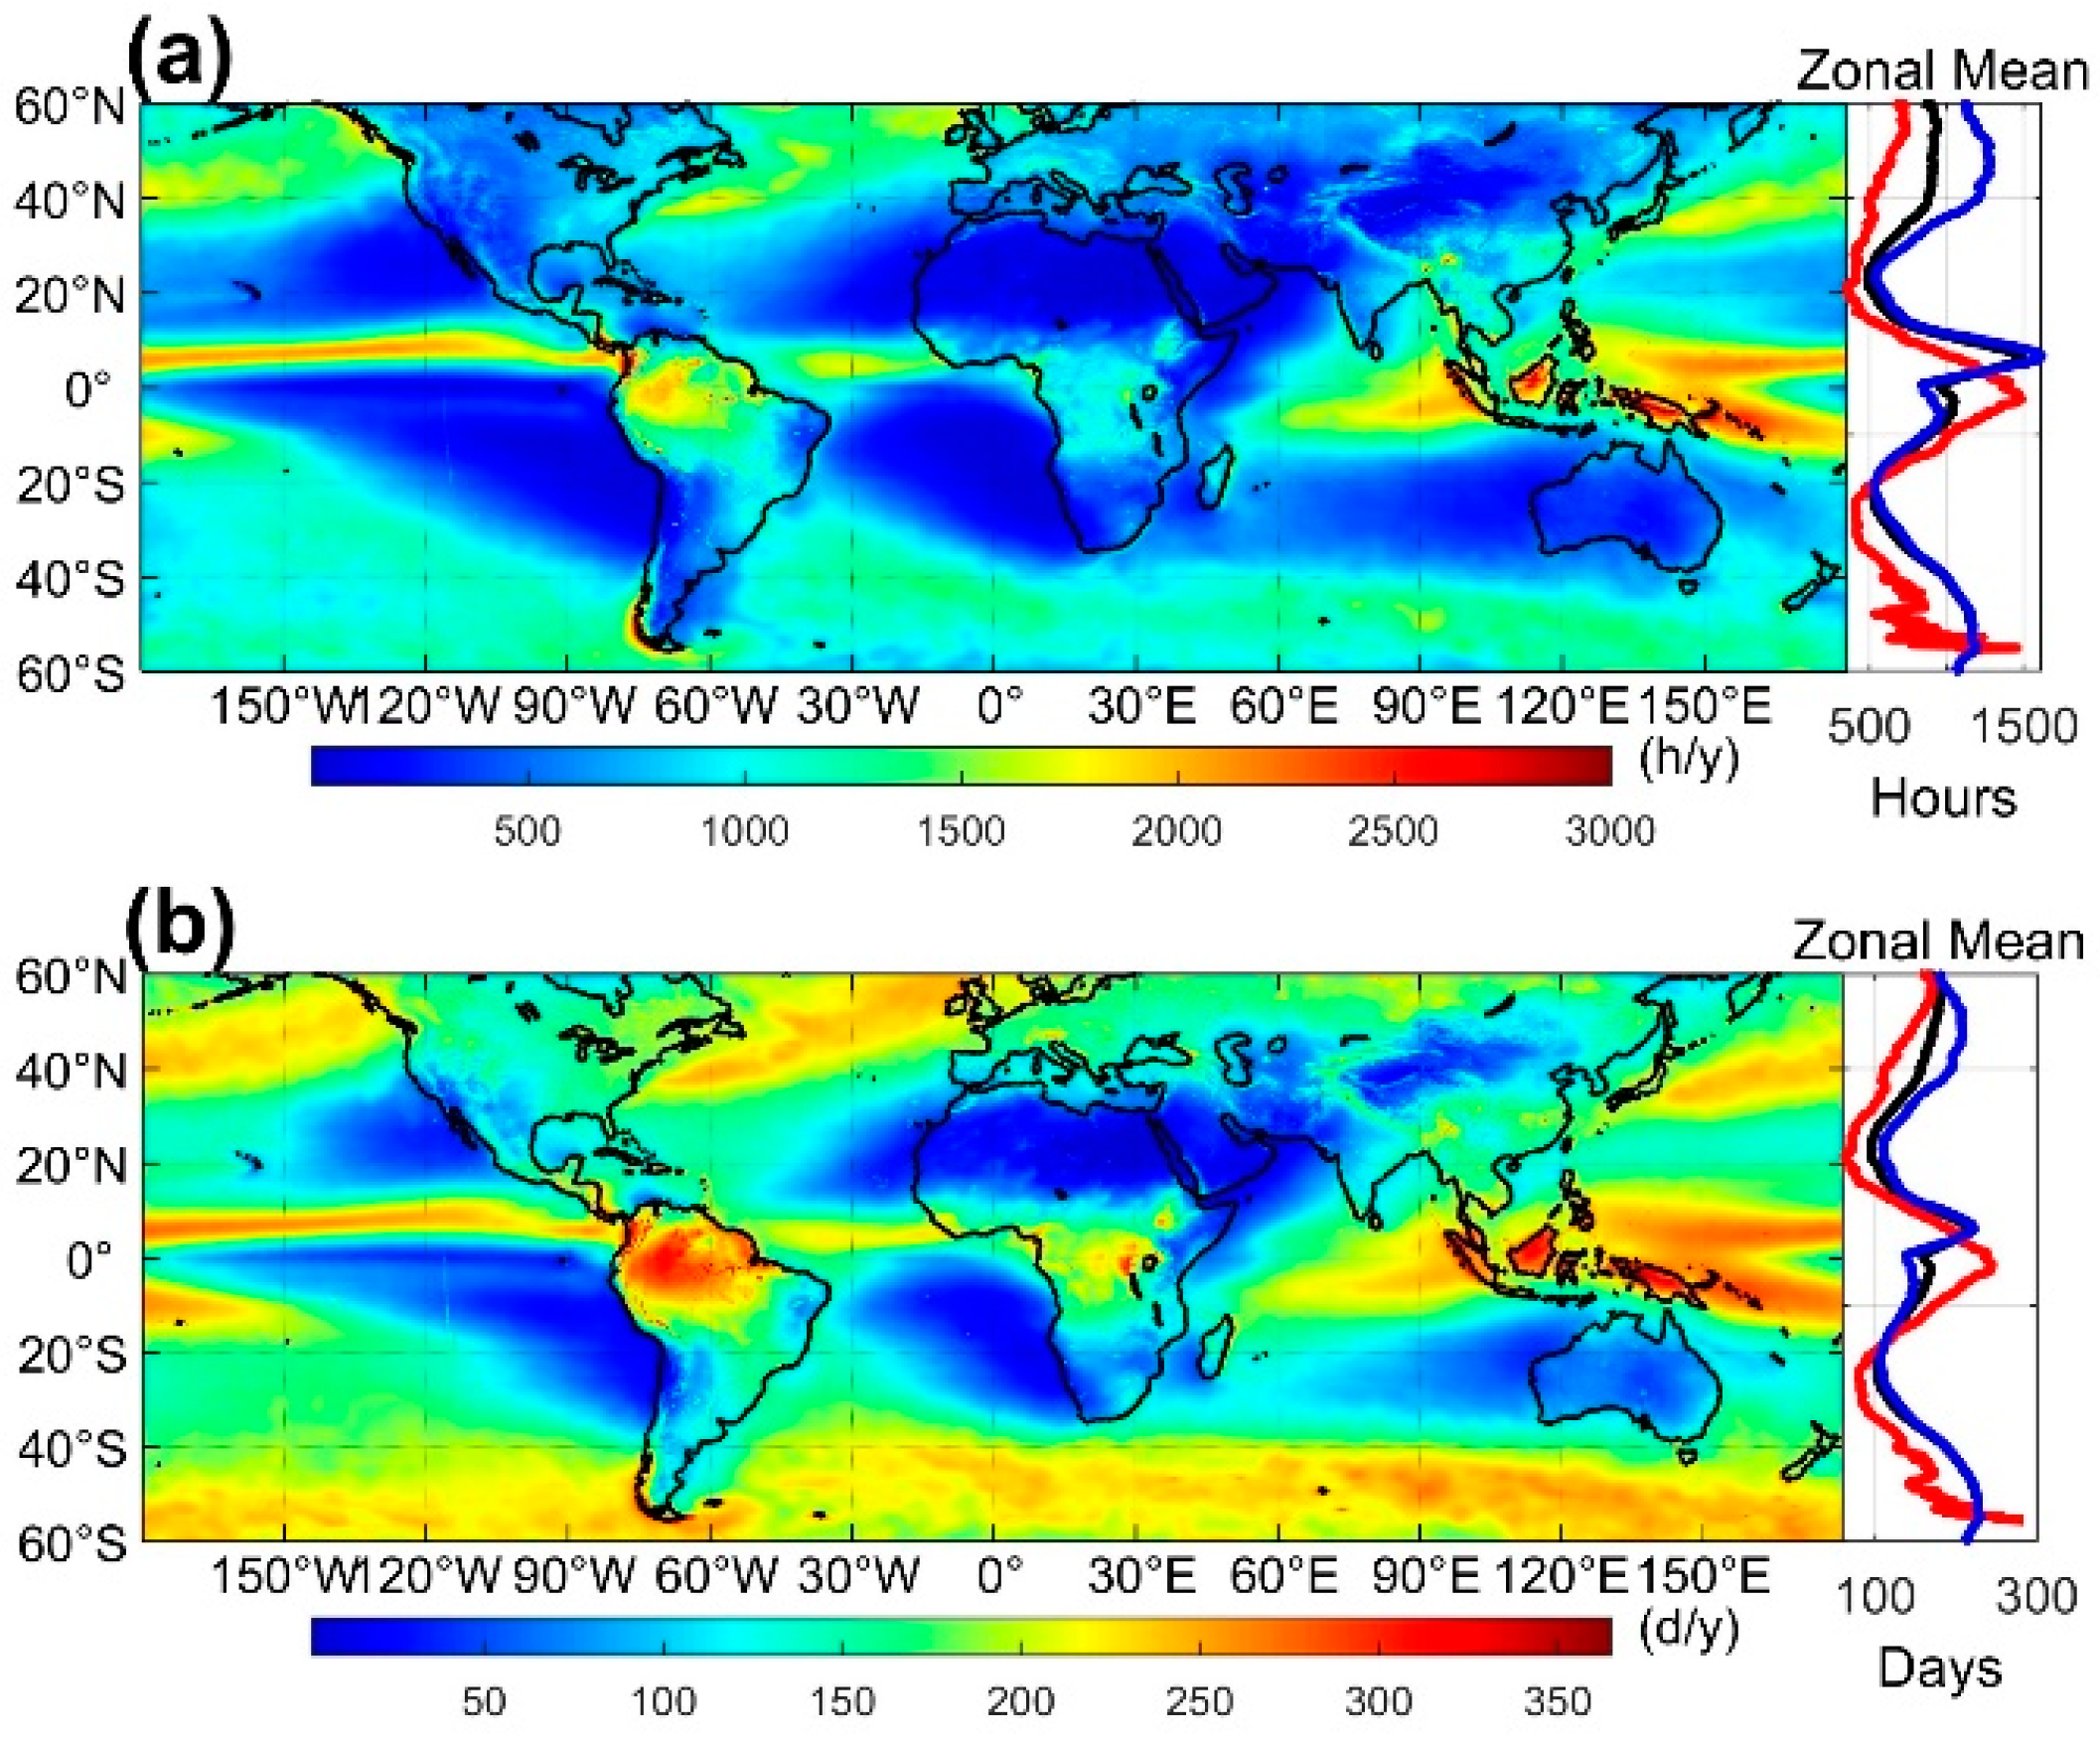
3.1. Global Distribution of Precipitation Based on the GPM IMERG Product

Figure 1 shows the global spatial distribution of mean and extreme precipitation intensities at hourly and daily scales, as well as the latitudinal averages of the aforementioned metrics. At the hourly scale, the highest mean precipitation intensities were mainly detected in the Indian–Pacific warm pool region and the inter-tropical convergence zone, especially in the oceanic regions near the Bay of Bengal, where values exceeded 5 mm/h. These regions are typically influenced by monsoons and tropical cyclones, which bring abundant precipitation. In contrast, the extreme hourly precipitation intensities in the subtropical regions of northern Africa, the southern Pacific Ocean, and the Atlantic Ocean were particularly low, with most of them below 1 mm/h (Figure 1a).
The spatial distribution of extreme hourly precipitation intensity was similar to that of the mean climatological precipitation, but the differences between oceanic and terrestrial areas were more pronounced. High values of extreme hourly precipitation intensity were more often detected in oceanic regions, especially in the inter-tropical convergence zones, where they reached 40 mm/h and exceeded 80 mm/h in some areas (Figure 1c). In most terrestrial areas, the extreme hourly precipitation intensity was lower than 20 mm/h, except for some regions, such as central and northern South America, central Africa, and Bangladesh, where it reached approximately 30 mm/h. The spatial distributions of precipitation at the daily and hourly time scales were similar. The highest mean daily precipitation and extreme daily precipitation intensities were above 25 mm/d and 250 mm/d, respectively, and were higher in oceanic regions than in terrestrial regions (Figure 1b–d).
The latitudinal averages of the corresponding precipitation statistics showed that most of the precipitation occurring at the same latitude was oceanic, especially in the Southern Hemisphere. The peaks of latitudinal mean precipitation intensity occurred at different latitudes for oceanic and terrestrial regions. At the hourly scale, the mean precipitation intensity exhibited significant differences between ocean and land areas, with a peak value of over 3 mm/h near 10°N in oceanic regions, which was about 2 mm/h higher than the value detected on land in the Northern Hemisphere. The variation in mean hourly precipitation intensity with latitude was relatively gradual in land areas, and a peak value was detected between 20°N and 20°S at about 2.5 mm/h (Figure 1a). Extreme hourly precipitation was predominantly oceanic, with a peak value of over 35 mm/h near 10°N, while terrestrial precipitation exhibited a peak value between 20°N and 20°S, with a maximum value of above 20 mm/h (Figure 1c). The latitudinal averages of daily precipitation were similar to those at the hourly scale, with oceanic precipitation still dominating. The maximum mean daily precipitation and extreme daily precipitation on the ocean were both above 10 mm/d and 100 mm/d, respectively (Figure 1b), while they were only about 9 mm/d and 50 mm/d on the land areas, respectively (Figure 1d).
The spatial distribution of mean annual precipitation hours and days reflected atmospheric circulation patterns (Figure 2). Two areas in the subtropical high-pressure belt presented low values, while high values were observed in the equatorial and sub-polar low-pressure belts. The highest number of annual precipitation hours was detected near Southeast Asia and the Malaysian archipelago, where values of 3000 h/year were reached on average in some areas over the 2001–2020 period (Figure 2a). High numbers of annual precipitation days were also observed in the northern part of South America and the central part of Africa, where values of more than 350 days/year were reached in some areas (Figure 2b).
In terms of latitudinal averages, the annual number of precipitation hours and days exhibited similar patterns, with the lowest value being detected near 20°N/S and the highest near the equator and 60°N/S. This is because the total amount of precipitation is mostly determined by the frequency rather than the intensity [58], and therefore, the geographic patterns of the frequency at different thresholds match each other and the total amount quite well, which is consistent with existing studies [59]. The highest average number of annual precipitation hours and days for the ocean area in the Northern Hemisphere was observed near 10°N, with values exceeding 1500 h/year and 200 days/year, respectively, while in the Southern Hemisphere, it was recorded near 5°S and 60°S, with values exceeding 1400 h/year and 250 days/year, respectively.

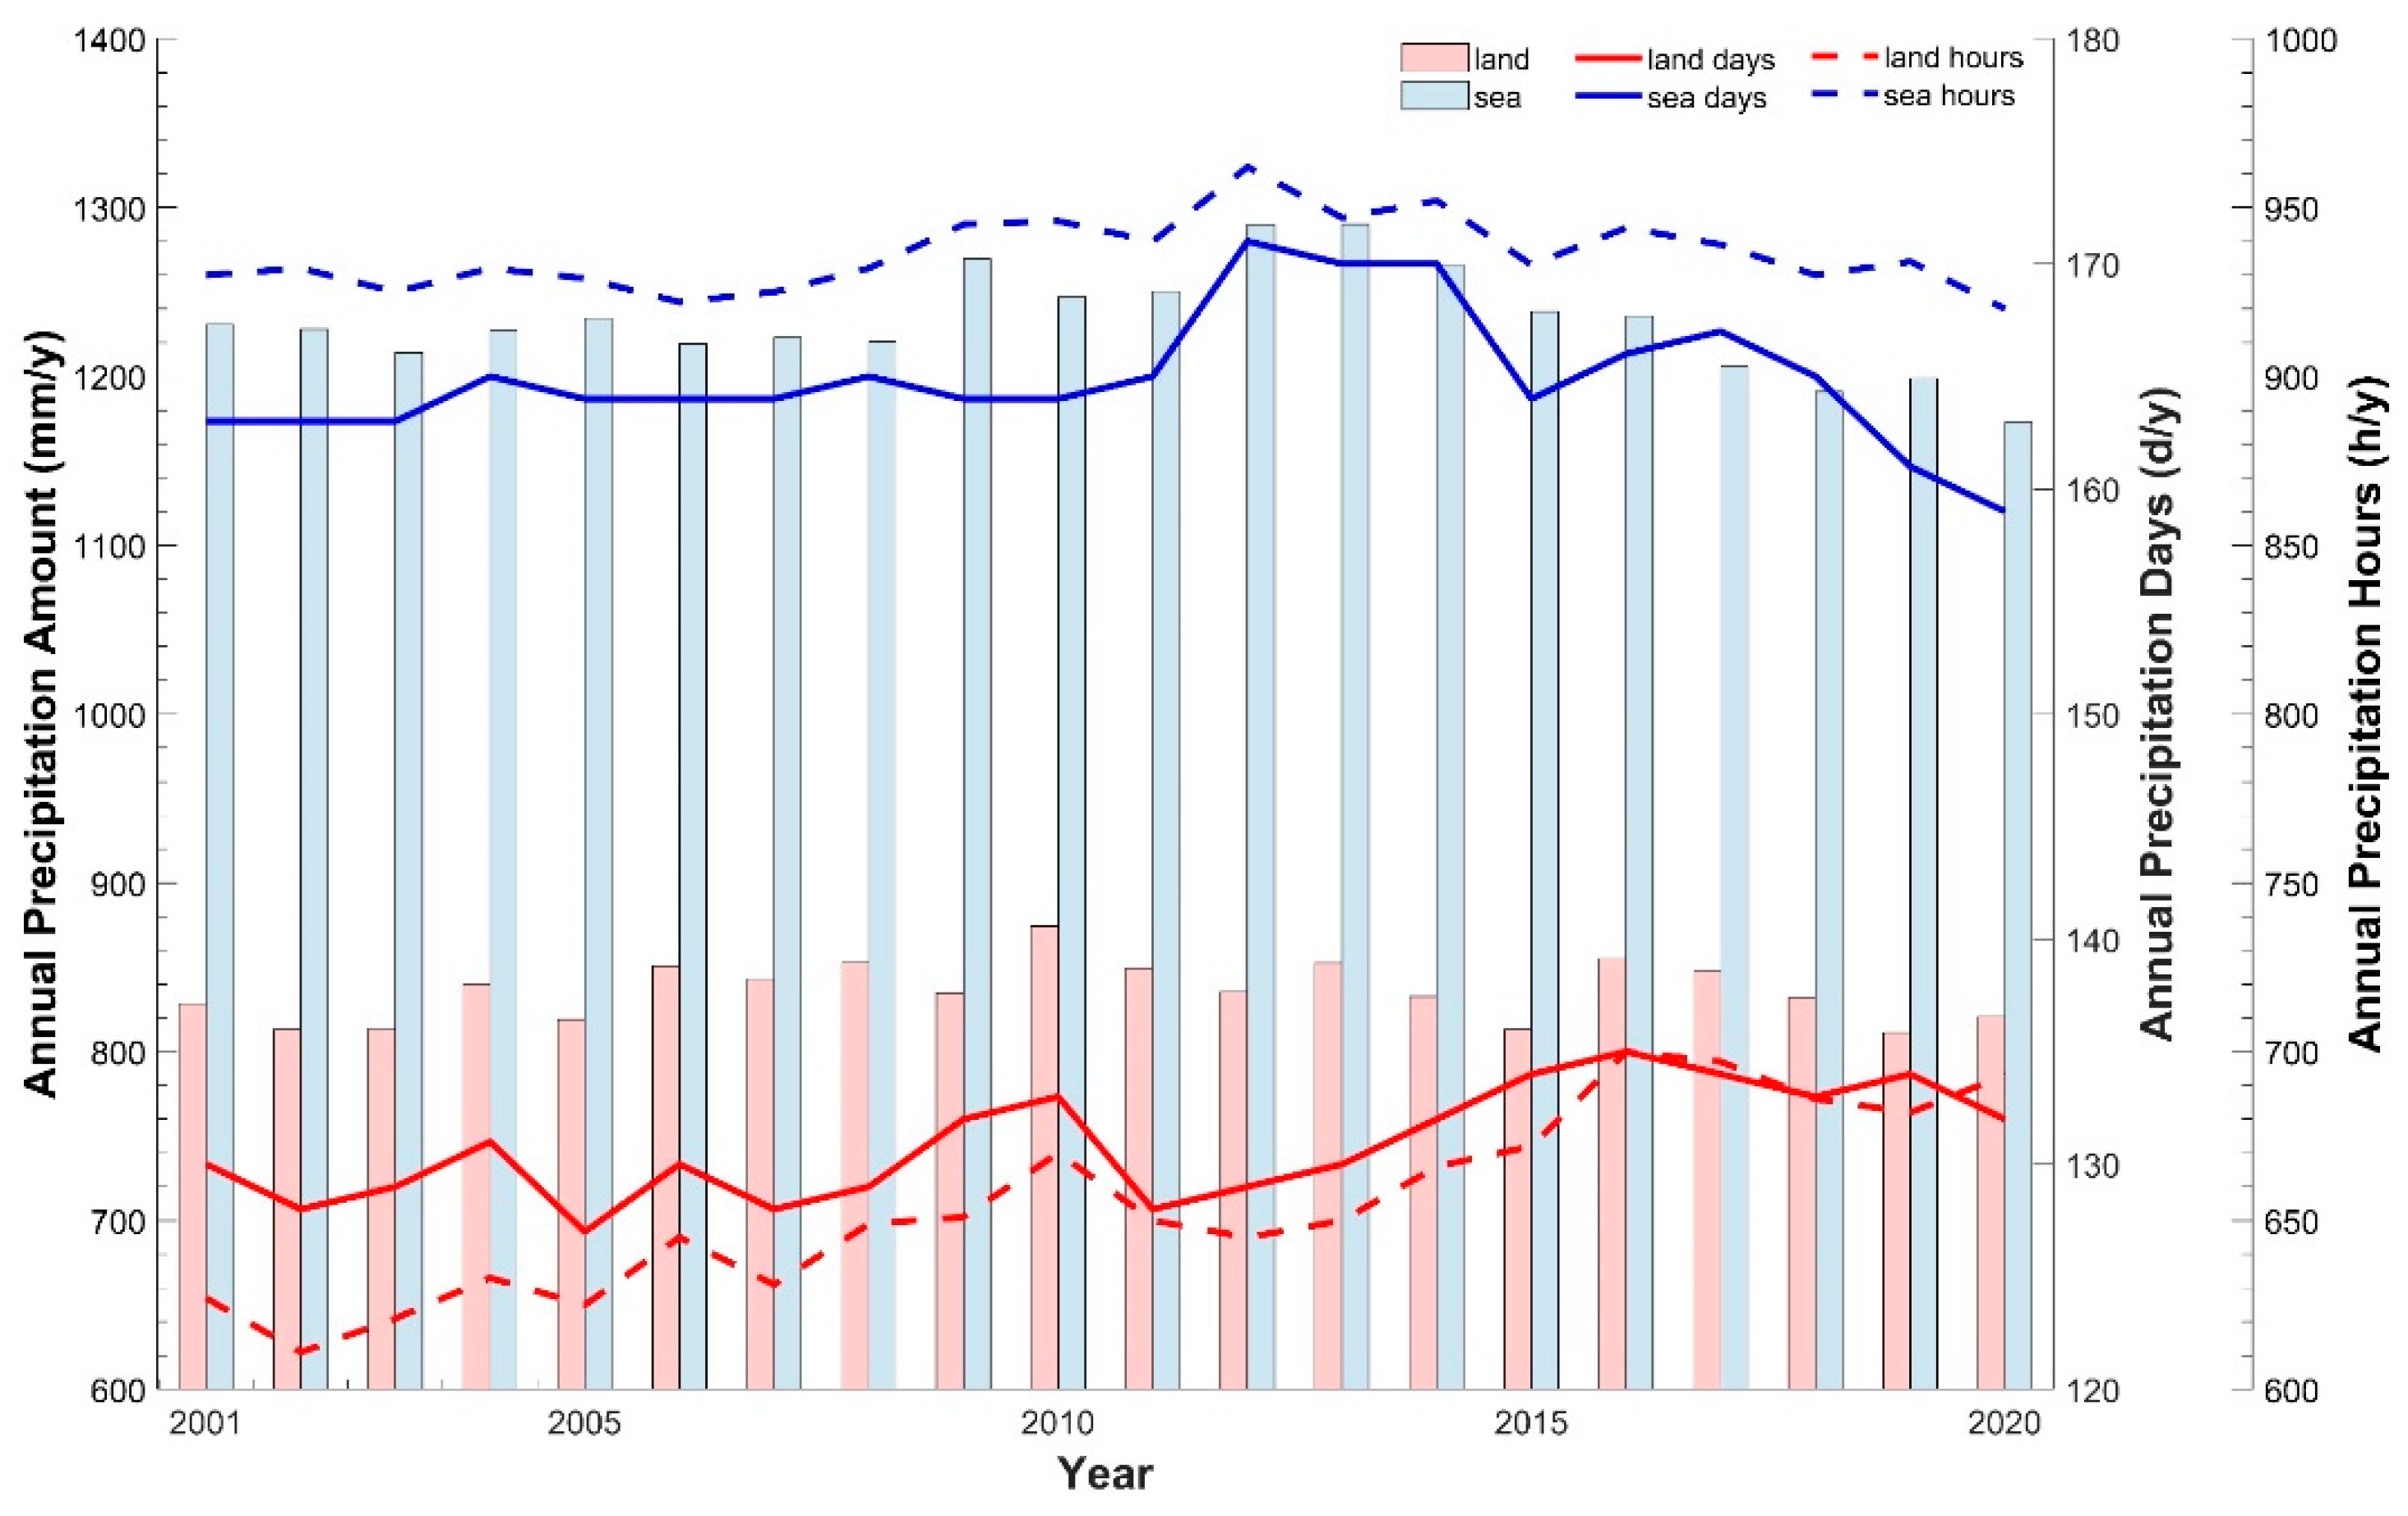
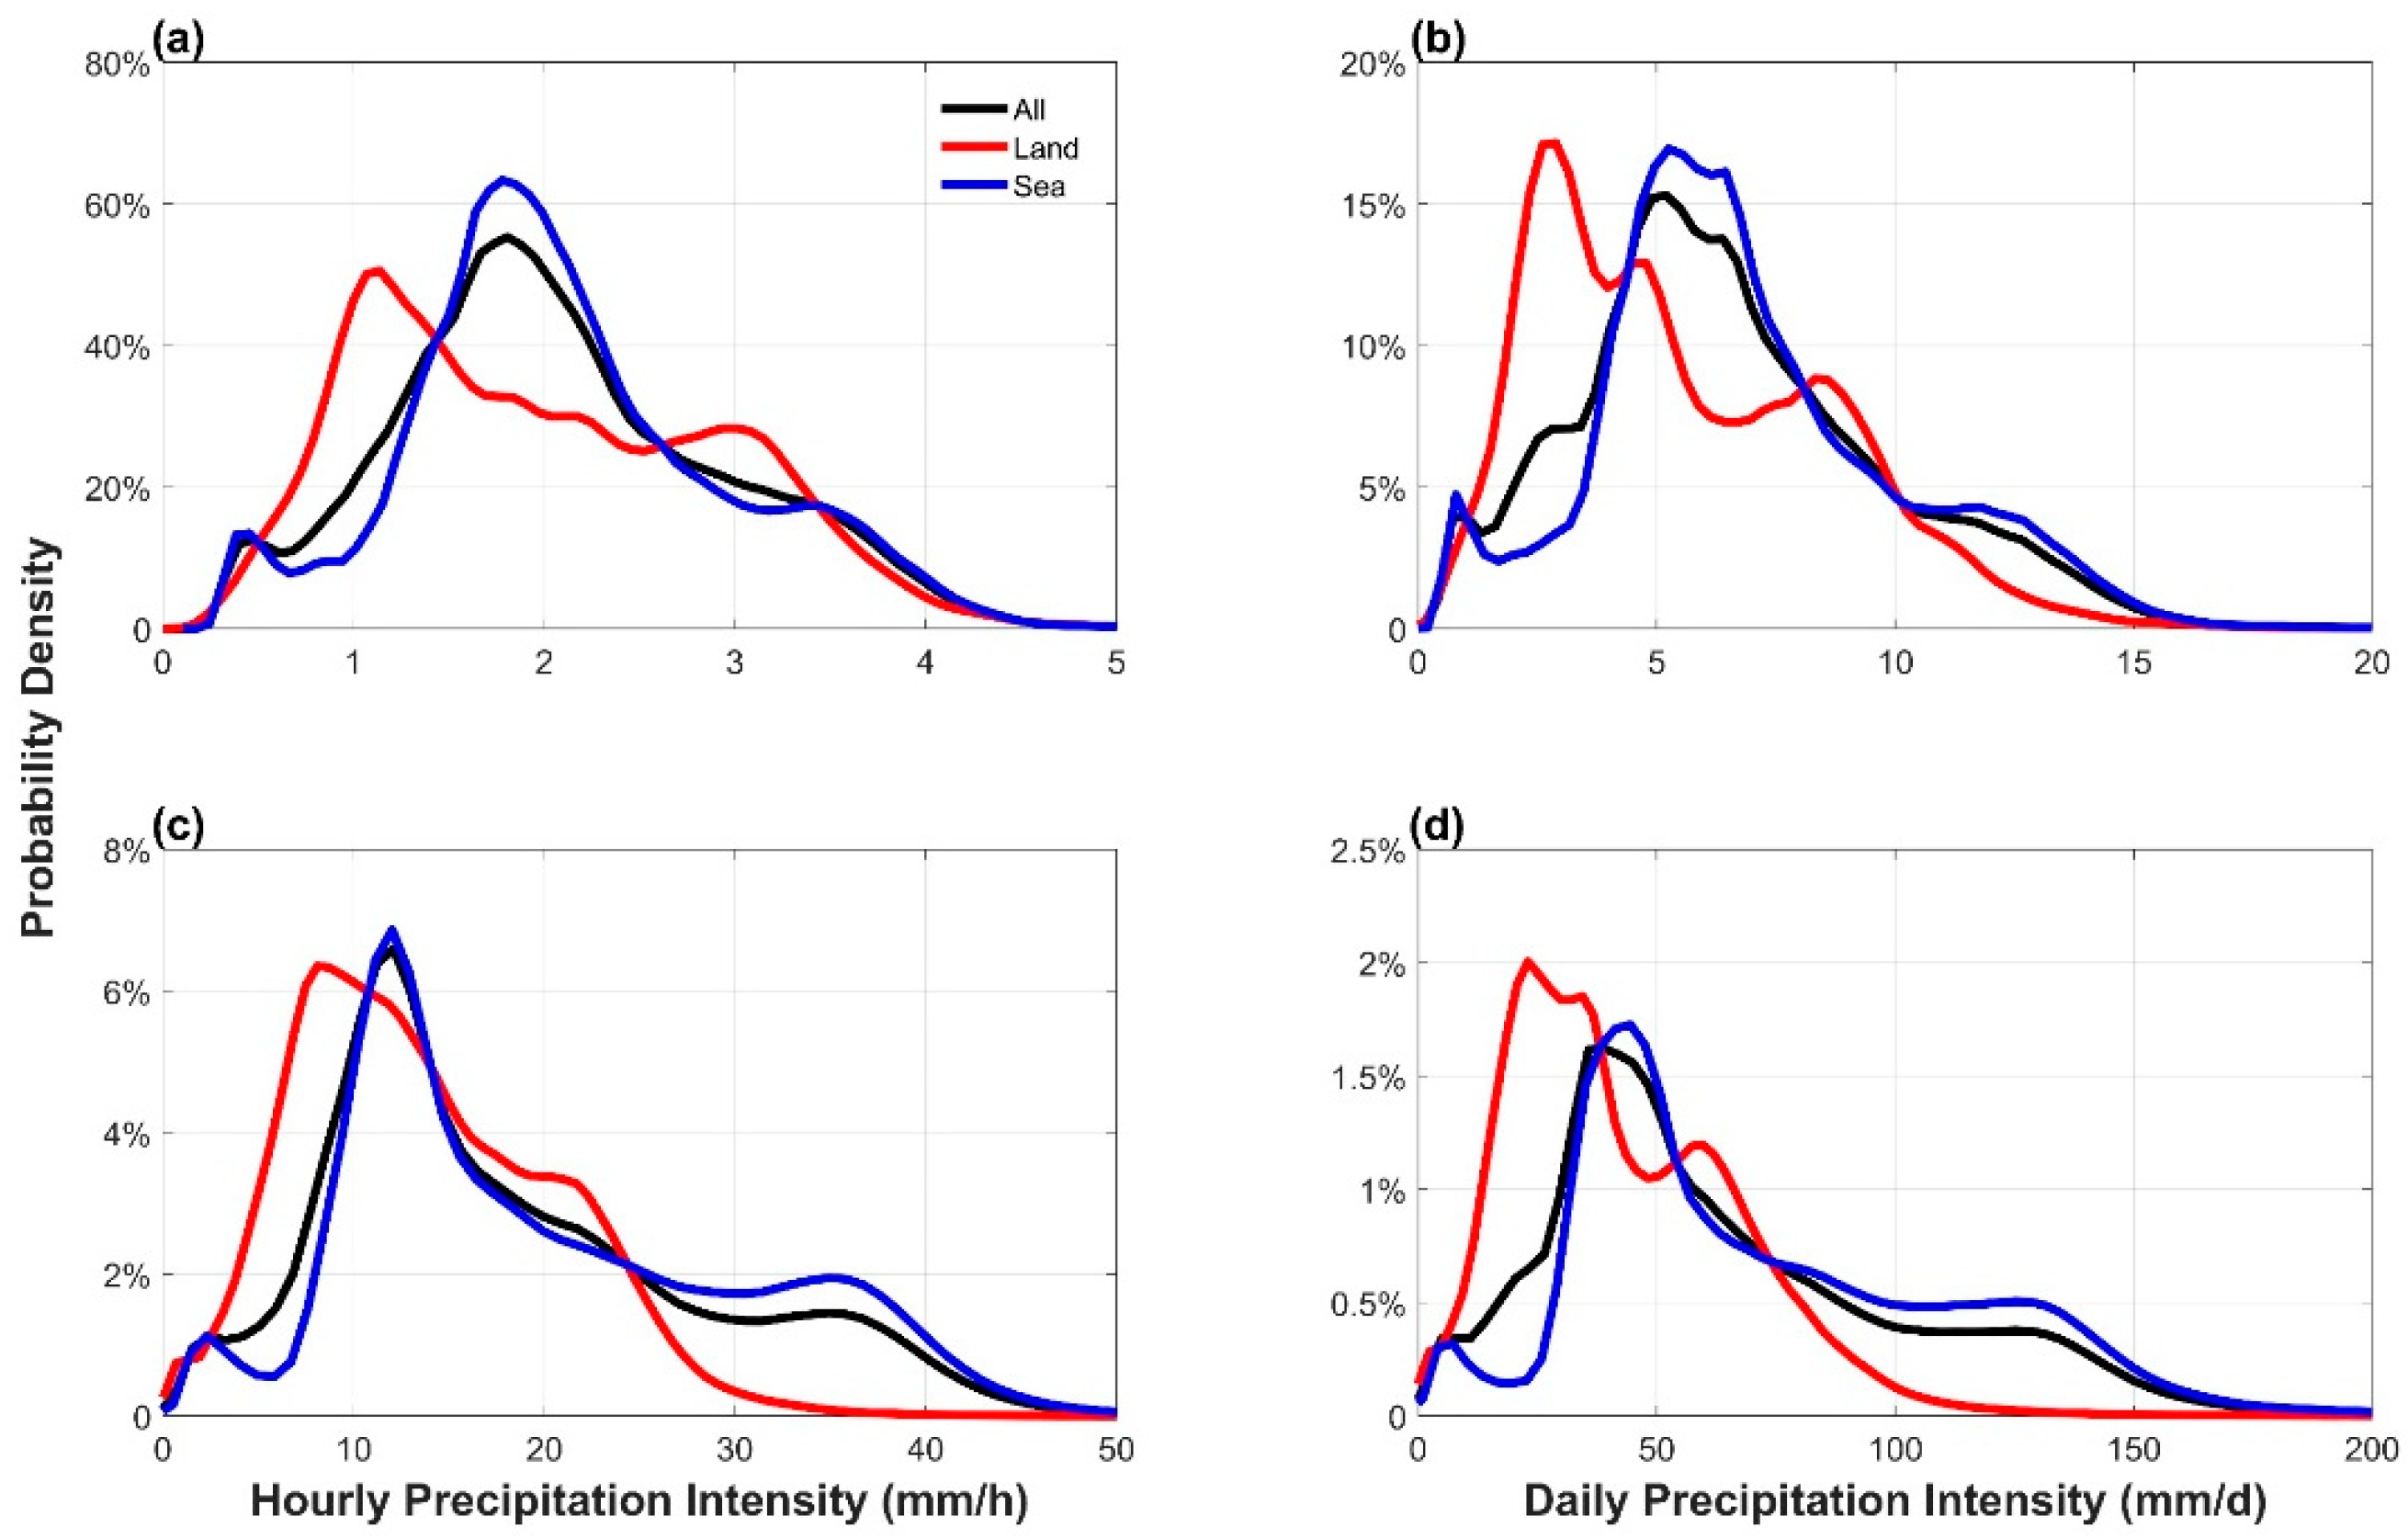
3.2. Discrepancy in Precipitation Regimes between Land and Ocean Areas

Precipitation regimes on land and the ocean were compared and are shown in Figure 3. In terms of annual precipitation amounts, oceanic precipitation (exceeding 1100 mm/year) was much higher than terrestrial precipitation (less than 900 mm/year). The peak in the oceanic annual precipitation amount was observed at approximately 1280 mm/year between 2012 and 2013, and it declined significantly thereafter, while terrestrial precipitation exhibited great interannual variability but no clear trend. The total amount of precipitation between 60°N and 60°S did not change significantly with global warming. This may be due to the study period, which was too short to capture the signal on precipitation changes with temperature.
A consistent variation in the annual number of oceanic precipitation hours and days with precipitation amounts was detected. Similar to the total precipitation amount, these numbers reached peak values of 950 h/year and 170 days/year, respectively, in 2012. This also illustrated that the total amount of precipitation is largely determined by the frequency. In contrast, the number of terrestrial precipitation hours and days exhibited a clear increasing trend, with average values during the decade of 2011–2020 increasing by 50 h and 5 days compared with the previous one. However, the minimal change detected in the annual amount of terrestrial precipitation suggests that precipitation on land has become more evenly distributed, and precipitation intensity decreased during the 2001–2020 period.
To detect changes in precipitation intensity, the mean and extreme precipitation intensities on land and ocean areas from 2001 to 2020 were divided by the corresponding multi-year mean, and the relative values are shown in Figure 4. The mean hourly precipitation intensity fluctuated around 100% and was relatively stable before 2016, but showed a decreasing trend from 2017 to 2020 (Figure 4a). On land, this parameter showed a decreasing trend with great interannual variability. The extreme hourly precipitation intensity on land showed an increasing trend at first and then decreased, with the relative value varying from ~102% in 2013 to ~97% in 2020. In contrast, from 2001 to 2016, it increased in the ocean areas, reaching a peak of ~104% in 2016, and then began to decline, reaching ~97% in 2020 for the relative value (Figure 4c). At a daily scale, both mean and extreme daily precipitation values showed an increasing trend initially, reaching a peak around 2010, and then decreased (Figure 4b,d). This was consistent with the results in Figure 3. Although the total precipitation showed no significant change, both the mean precipitation intensity and extreme precipitation intensity had a downward trend over land because of an increase in precipitation hours and precipitation days. Overall, global precipitation was dominated by oceanic precipitation, which is more stable and fluctuates less than terrestrial precipitation.
The probability density functions of the mean and extreme precipitation intensities were calculated over multiple years to quantify the differences between land and ocean areas. Figure 5 shows similar probability distributions for global and oceanic precipitation at both hourly and daily time scales but with different probabilities. The distribution of terrestrial precipitation differed from that of global or oceanic precipitation, showing low peak values and a narrow distribution range. At the hourly scale, the global and oceanic precipitation intensities reached their peaks at ~1.8 mm/h (with a probability of over 60%), while the terrestrial peak was reached at ~1.1 mm/h (with a probability of about 50%) (Figure 5a). As for the extreme hourly precipitation intensity, the global and oceanic peaks were observed at ~11 mm/h (with a probability of over 6%), while the terrestrial peak was detected at ~8.0 mm/h (with a probability of over 6%) (Figure 5c).
The probability distributions of the daily and hourly precipitation intensities were similar, with considerably high values. For oceanic mean daily precipitation, the probability density accounted for about 5% of intensity values lower than 4 mm/d; the probability sharply increased to a peak of ~5–6 mm/d (with a probability of about 16%) and then decreased, with very few values exceeding 15 mm/d (Figure 5b). For terrestrial mean daily precipitation, the probability density sharply increased and reached a peak at ~3 mm/d (also with a probability of about 16%) and then gradually decreased, with very few values exceeding 15 mm/d (Figure 5b). For the extreme daily precipitation intensity, the oceanic peak was between 40 and 50 mm/d (with a probability above 1.5%), and the terrestrial peak was at ~20 mm/d (with a probability above 2%) (Figure 5d).
Both hourly and daily extreme precipitation intensities were higher over oceans than over land, with peaks at higher values (Figure 5). The hourly and daily precipitation peaks over land were lower than those over oceans. The probability density function of global precipitation was more similar to that of oceanic precipitation, and therefore, it was inferred that global precipitation was predominantly oceanic. To quantify the differences between oceanic and terrestrial precipitation, the JS divergences between the probability density functions of the two precipitation types were calculated and are reported in Table 1. At the hourly scale, the JS divergence of extreme precipitation (0.0149) was smaller than that of the mean precipitation (0.0323), indicating a decrease in the difference between the probability distributions of oceanic and terrestrial hourly precipitation as the precipitation percentile became large. In contrast, at the daily scale, the JS divergence of extreme precipitation (0.0474) was larger than that of the mean precipitation (0.0461), indicating the opposite variation.

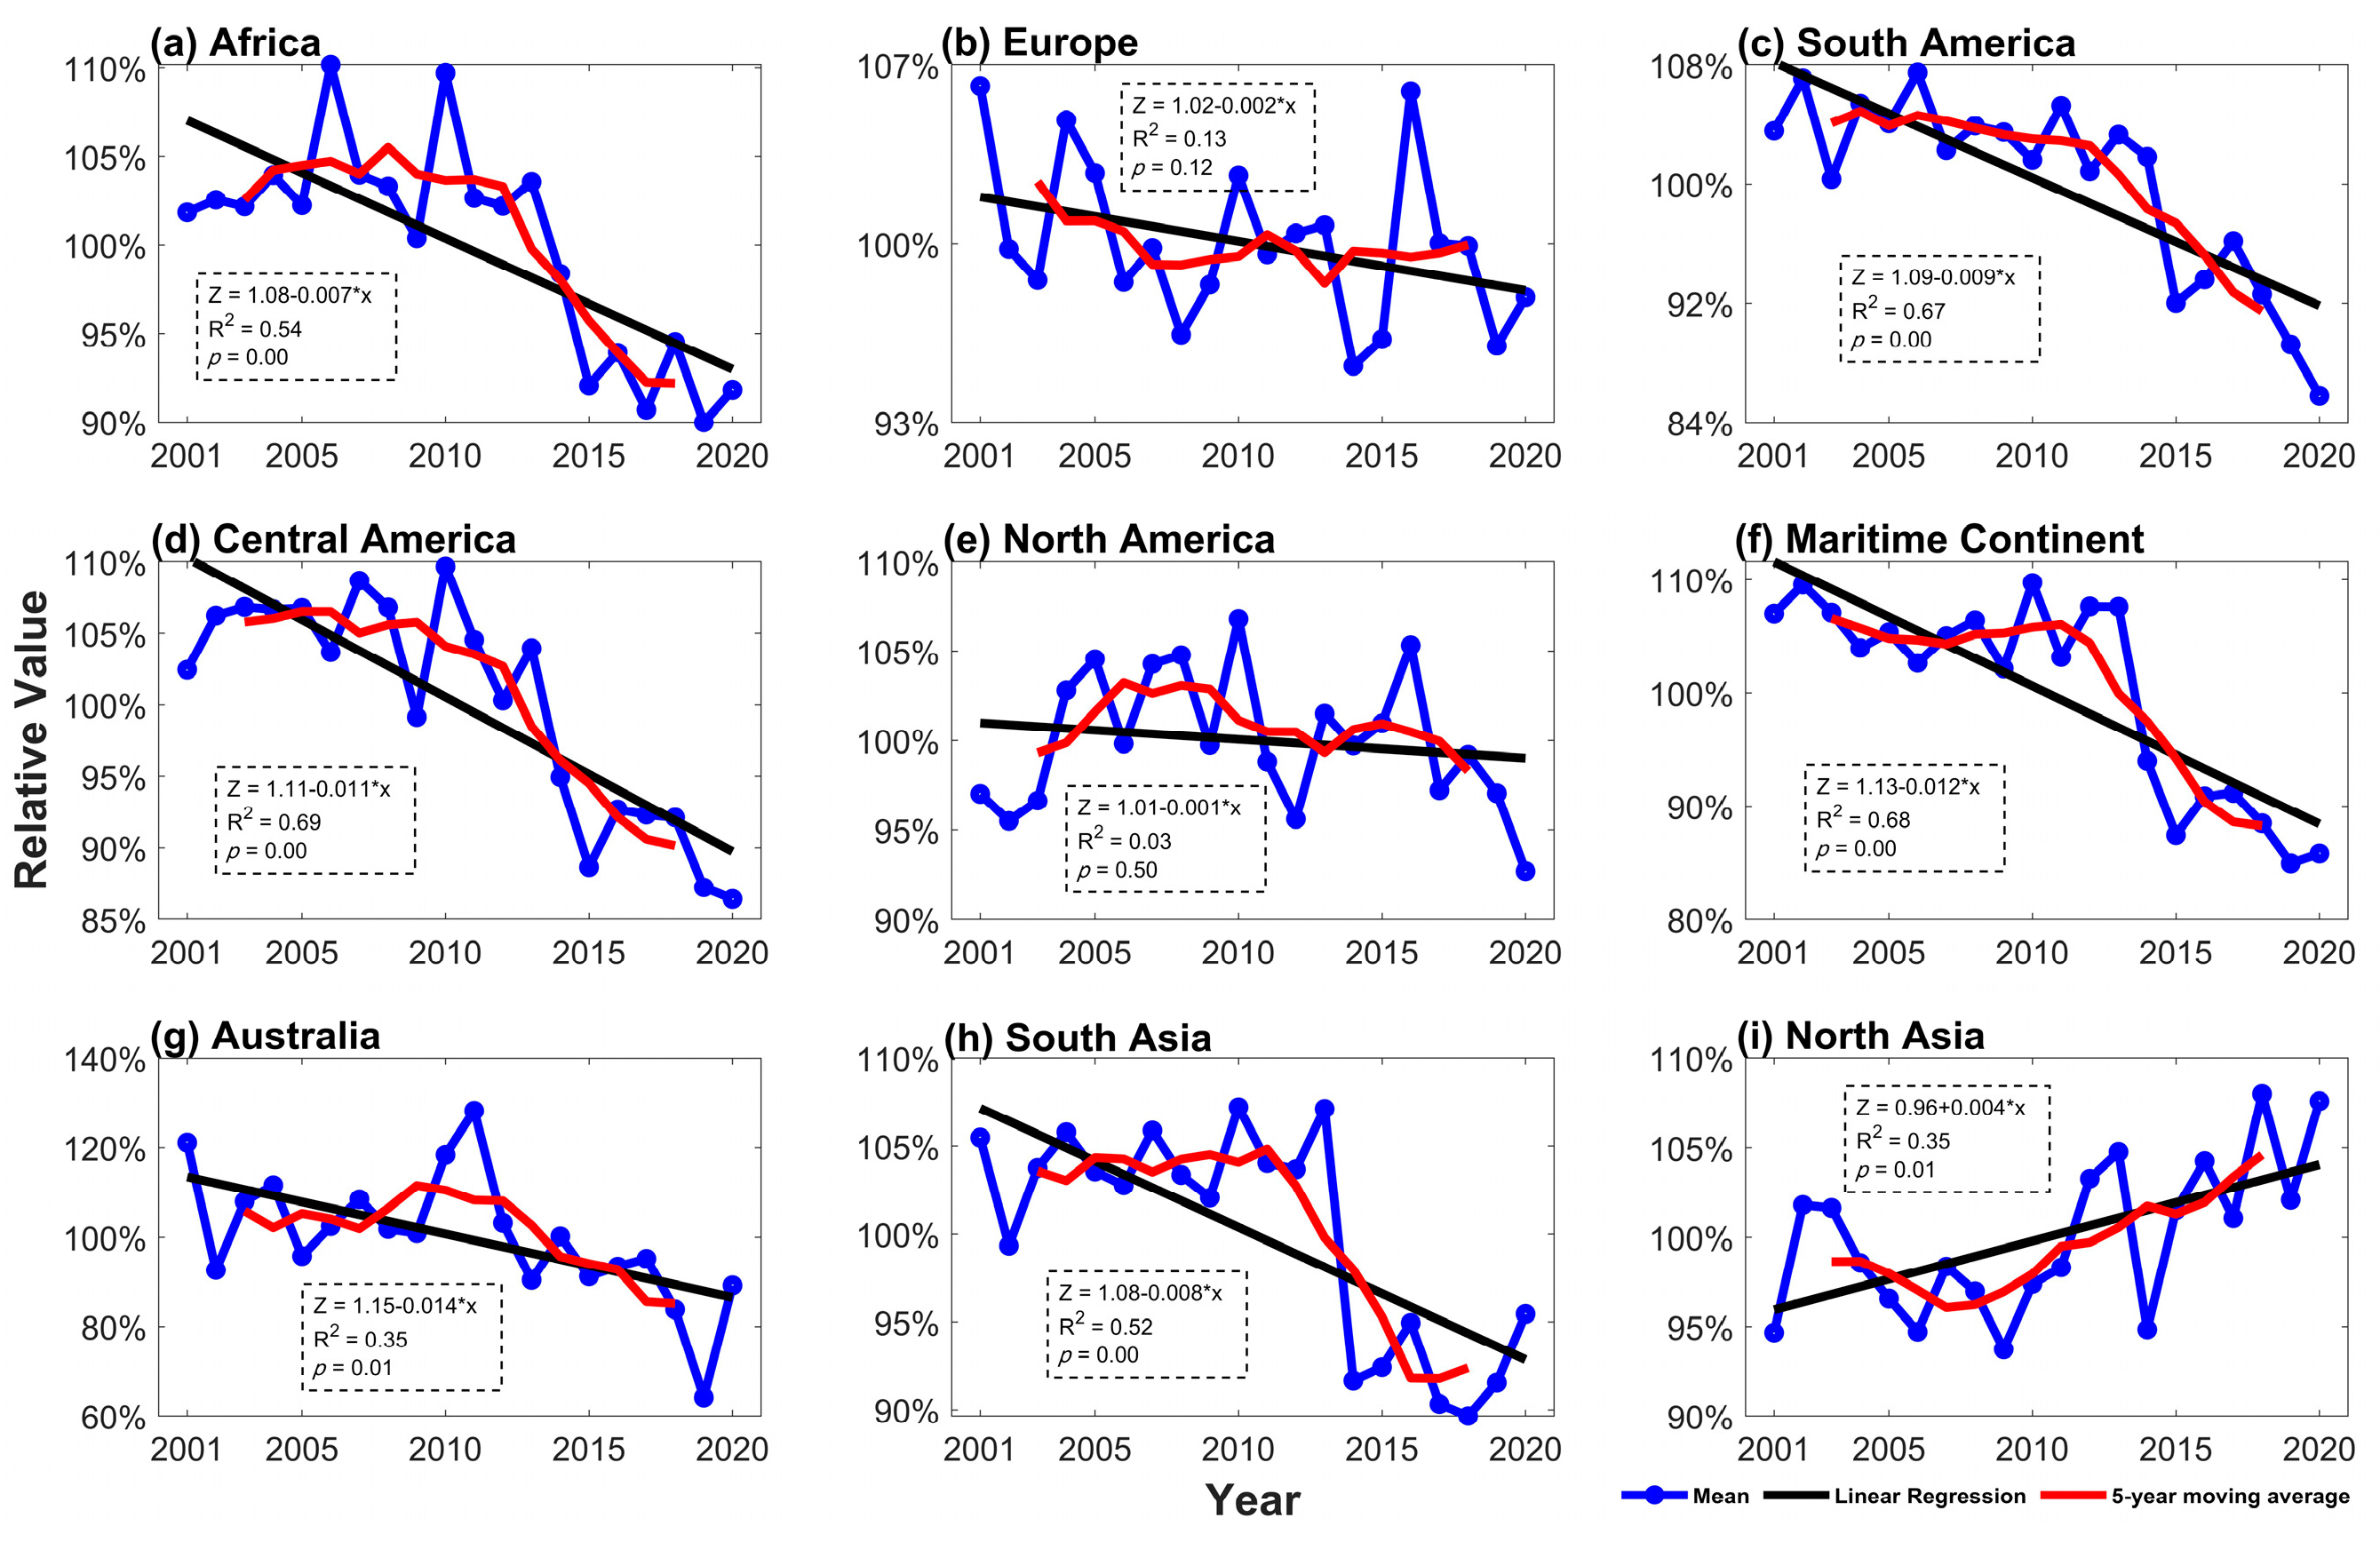
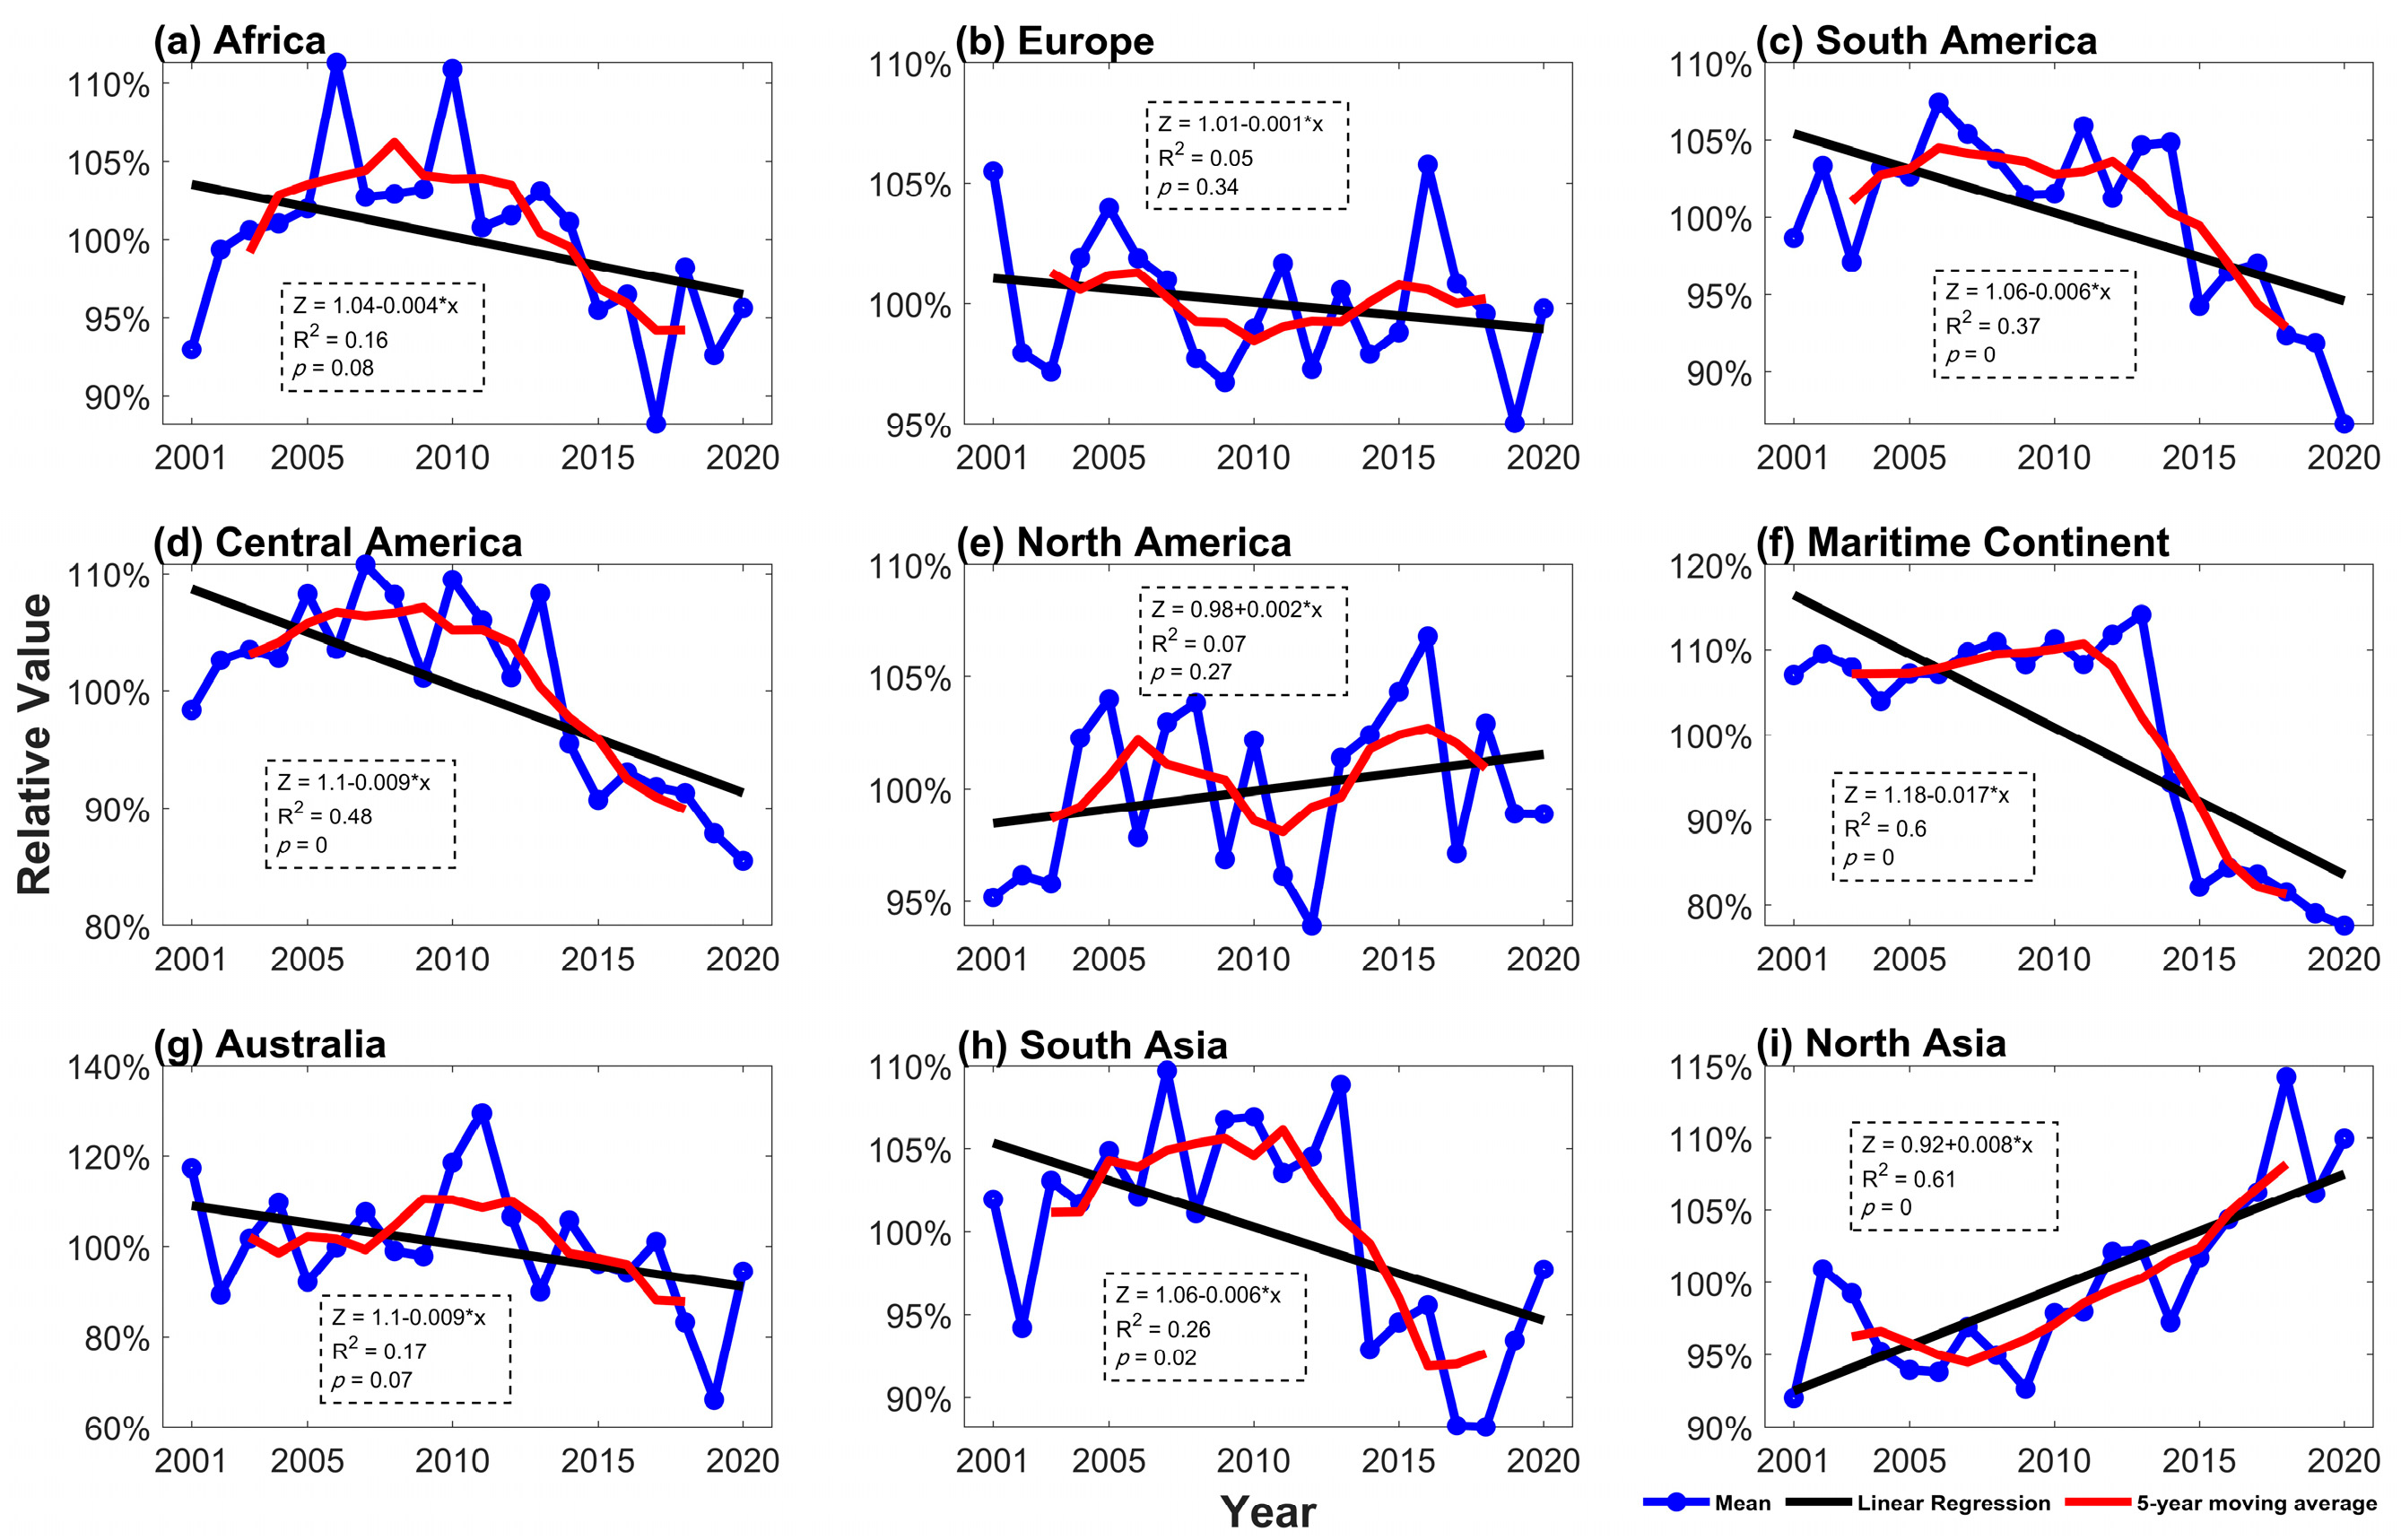
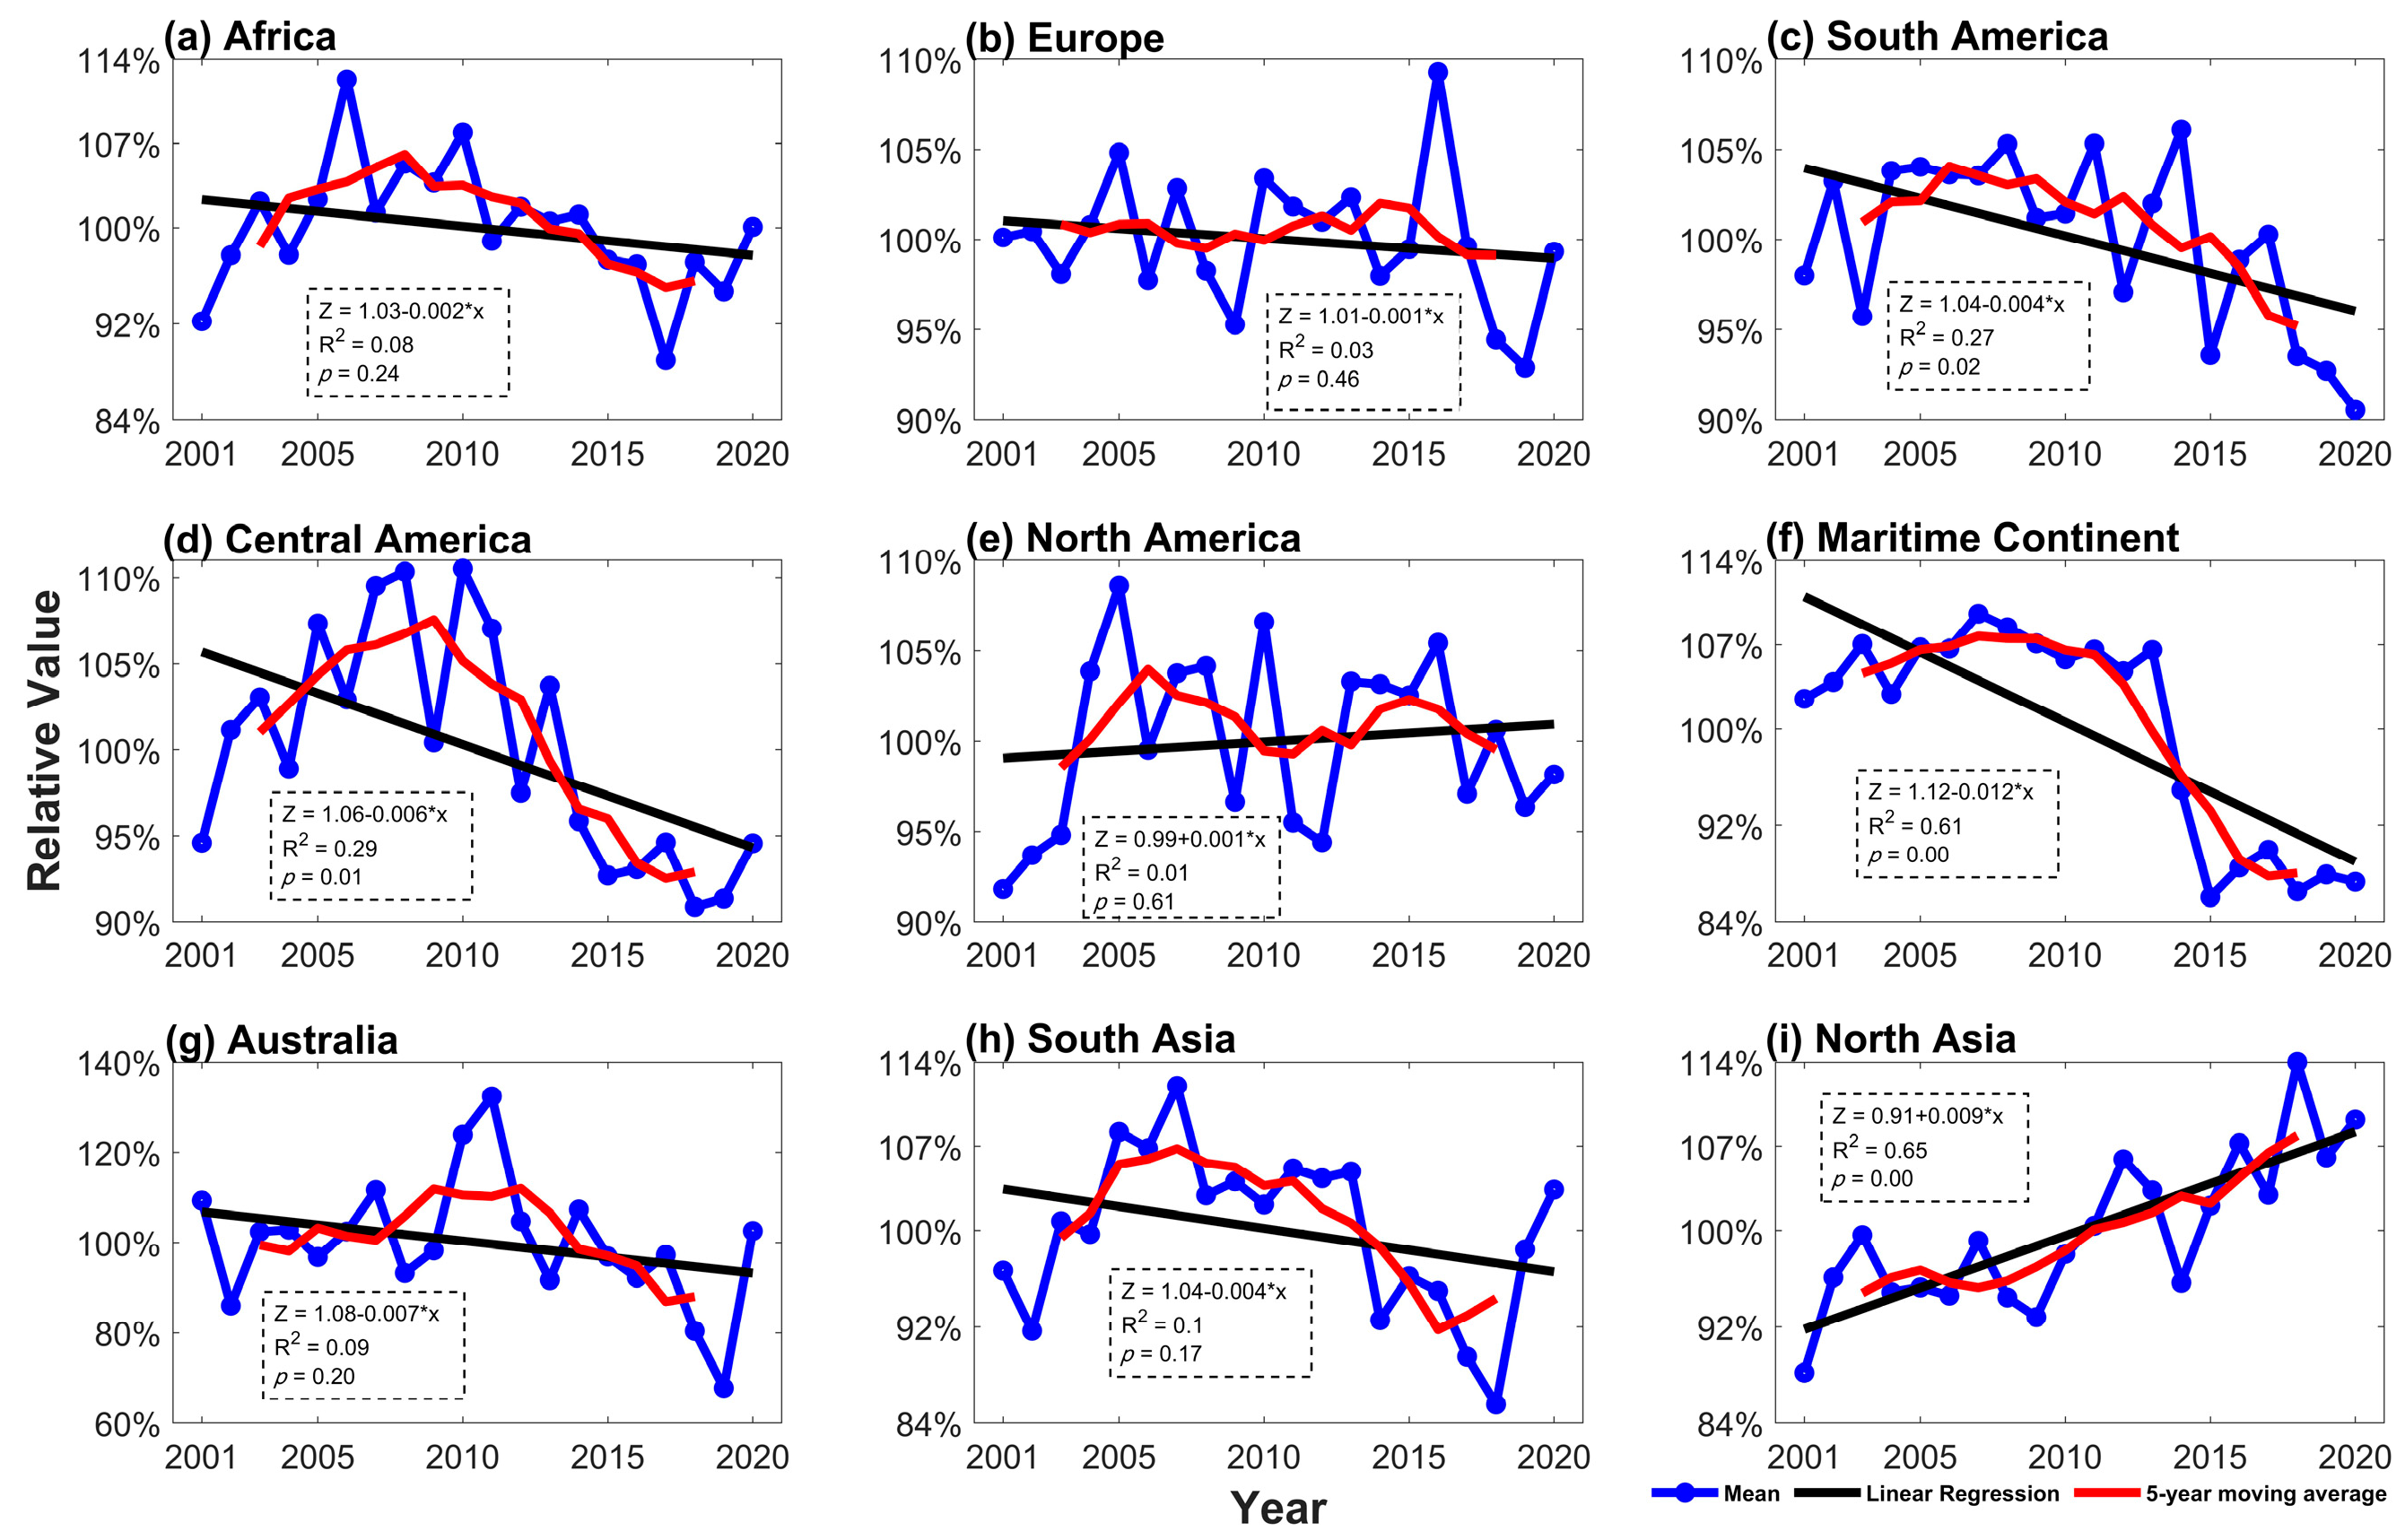
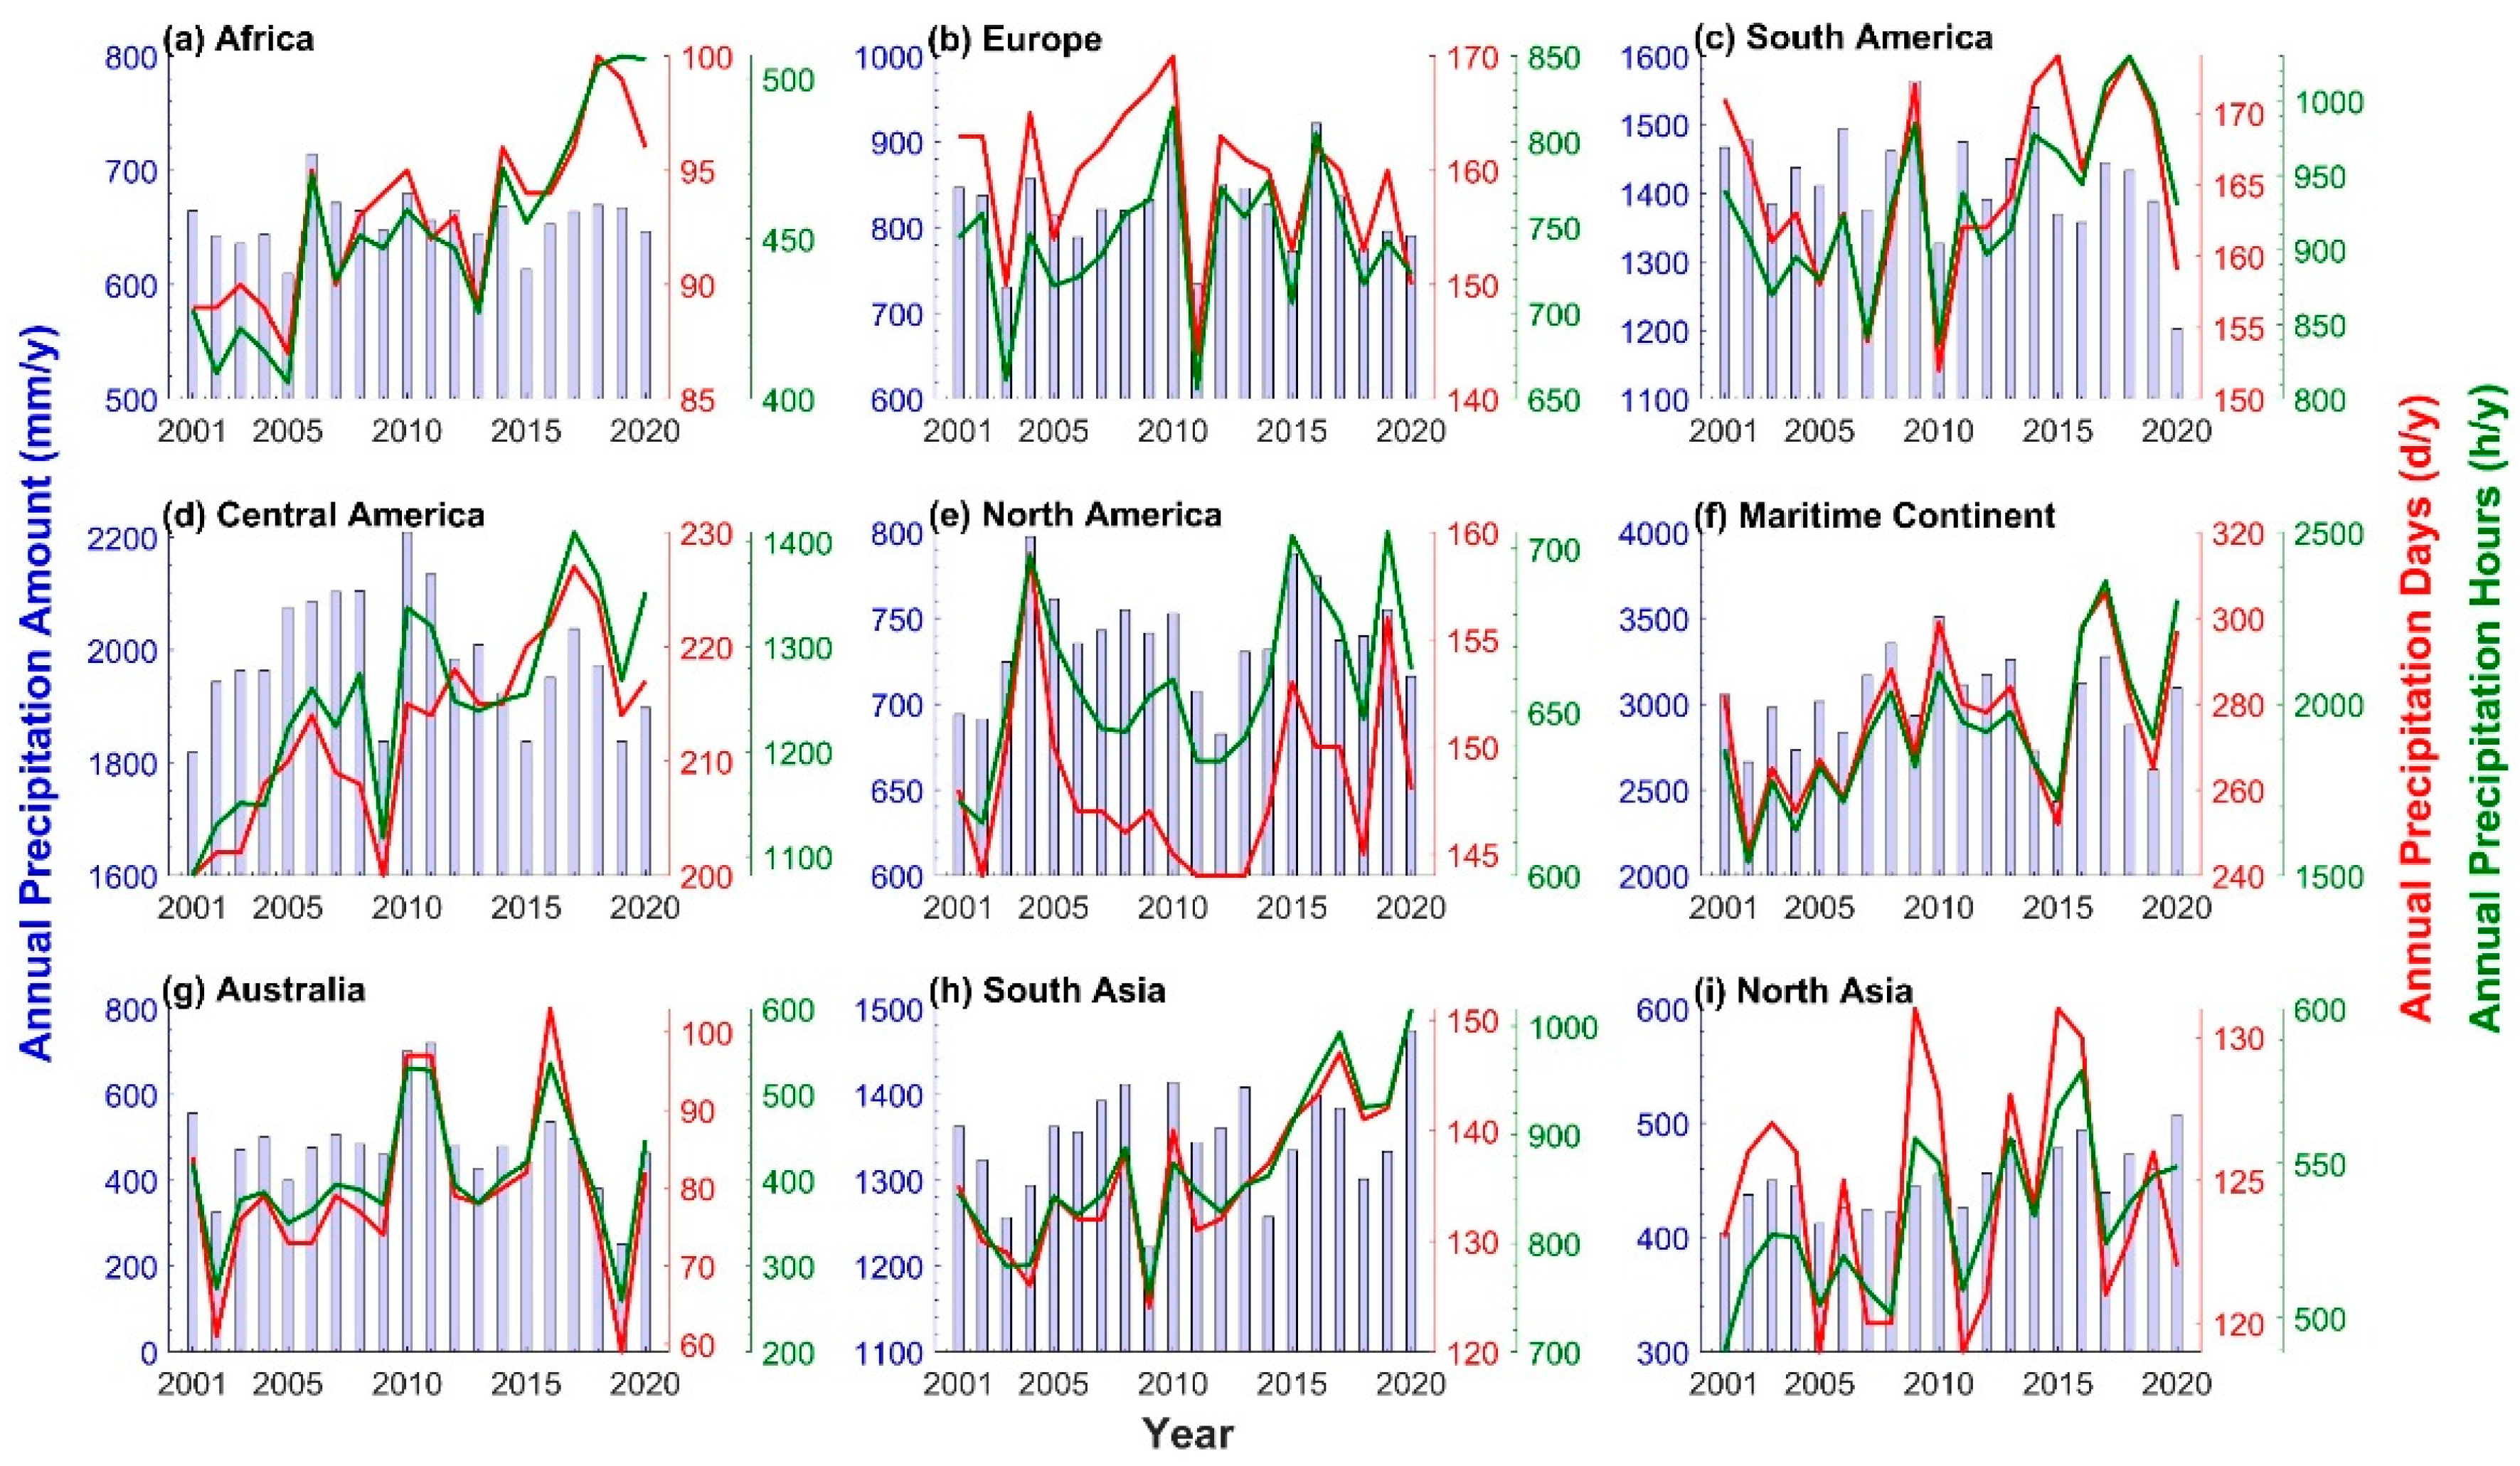
3.3. Variation in Extreme Precipitation in Nine Mainland Regions of the Globe

The time series of the relative mean hourly precipitation intensity (divided by the 20-year mean), shown in Figure 6, illustrate the variation in precipitation intensity in nine mainland regions of the globe. The 5-year moving averages and linear regression results are also included in this figure. The values for Africa, South America, Central America, the Maritime Continent, Australia, and South Asia showed a significant decreasing trend (p < 0.05), and significant declines in mean hourly precipitation were specifically detected after 2013, dropping from over 100% in 2013 to around 90% in 2015. Additionally, the values for Europe (p = 0.12) and North America (p = 0.50) showed insignificant decreasing trends, while only those for North Asia exhibited a significant increasing trend (p = 0.01).
Figure 7 shows the relative changes (divided by the 20-year average) in regional mean daily precipitation intensity, as well as the linear regression results and 5-year moving averages. Compared with the mean hourly precipitation intensity, the mean daily intensity showed a significant increasing trend in North Asia (p = 0.00), Europe (p = 0.54), and North America (p = 0.64), and a decreasing trend (p < 0.05) in Australia (p = 0.06) and the other five land regions. As observed for the mean hourly precipitation intensity, the mean daily precipitation intensity declined significantly in South America after 2013.
Figure 8 displays the relative changes (divided by the 20-year average) in regional extreme hourly precipitation intensity, as well as linear regression results and 5-year moving averages. While the values for North Asia (p = 0.00) and North America (p = 0.27) showed an increasing trend, those for the other seven regions exhibited decreasing trends, which were significant at the 0.05 level for South America, Central America, the Maritime Continent, and South Asia. In the latter two regions in particular, the declines were significant after 2013, with values dropping from more than 110% and 105% in 2013 to below 90% and 95% in 2015, respectively.
Figure 9 displays the relative changes (divided by the 20-year average) in regional extreme daily precipitation intensity, as well as the linear regression results and 5-year moving averages. As observed for the variation in extreme hourly precipitation intensity, the daily intensities in North Asia (p = 0.00) and North America (p = 0.61) showed an increasing trend, while those in the other seven regions exhibited a decreasing trend, with p-values < 0.05 in South America, Central America, and the Maritime Continent. In the latter region, the decline was significant after 2013, with relative values dropping from more than 105% in 2013 to around 85% in 2015.
The relationships between the annual precipitation amount and the annual number of precipitation hours and days for the nine land regions are shown in Figure 10. All regions showed similar values for these parameters but different precipitation characteristics, which affected the variations in precipitation. In Africa, Central America, and South Asia (Figure 10a,c,h), the annual precipitation amount did not show a significant increasing trend (in Central America, it even showed a decreasing trend), but this was observed for the annual number of precipitation hours and days. Specifically, in the three areas, values increased by 100 h and 6 days, 300 h and 20 days, and 200 h and 10 days, respectively, in the decade of 2011–2020 compared with the previous one, possibly resulting in a more even distribution of precipitation and a decrease in hourly and daily precipitation intensity. In North Asia, the annual precipitation amount showed an increasing trend, but no clear trend was detected for the annual number of precipitation hours and days. These findings suggest a potential increase in the probability of extreme precipitation and its concentration over a few precipitation days or hours.

4. Discussion

The global total precipitation was mainly modulated by El Niño–Southern Oscillation through the number of wet hours, while hourly precipitation intensity received limited impact [60]. The results obtained from the GPM IMERG product revealed no significant variations in global annual precipitation (oceanic + terrestrial). However, a significant increasing trend in the annual number of precipitation hours and days was observed on land, which led to a more even distribution of precipitation and a decrease in its intensity. This may be related to the improved ability of the GPM product to detect light rain compared with the TRMM product [61]. This newer technology can capture small-sized and solid precipitation particles more accurately, which is especially important for the analysis of high-latitude and plateau areas. The dynamic analysis of precipitation over land illustrated that there were significant increases in total precipitation, the number of wet days, and heavy events globally but only for the last four decades [62].
The probability density function for precipitation intensity showed that extreme precipitation was higher over the ocean than on land, and the function’s peak was reached at higher precipitation values. The JS divergence was calculated to quantify the differences in precipitation between land and ocean. The divergence of extreme precipitation at the hourly scale (the JS divergence is 0.0149) was smaller than that of the mean precipitation intensity (the JS divergence is 0.0323), while the opposite was observed at the daily scale (the JS divergences are 0.0461 and 0.0474 for mean and extreme daily precipitation, respectively). This suggests that, as precipitation becomes more extreme, the difference in the probability distribution between land and the ocean for hourly precipitation decreases, while for daily precipitation, it increases. This may be due to the stronger convective activity on land, which produces only a small difference in extreme precipitation between land and ocean areas at the hourly scale but a larger difference at larger time scales (such as the daily scale).
Among the mainland regions examined, North Asia showed a significant increasing trend in both hourly and daily precipitation (with p-values < 0.05), as well as an increasing trend in annual precipitation. However, no clear trend was observed in the number of precipitation days and hours, indicating that extreme precipitation events may occur in this region. This is consistent with the positive trends of extreme precipitation from most high-quality daily precipitation records in Eurasia [9], which may be closely connected to Asian monsoon activity [63]. In Africa, Central America, and South Asia, the annual precipitation amount did not show significant increasing trends (in Central America, it even showed a decreasing trend), but this was observed for the number of annual precipitation hours and days, which led to a more even distribution of precipitation and a decrease in the probability of extreme precipitation. The results based on the TRMM data showed that the variations in extreme precipitation in East Africa are different [64]. However, our results were obtained based on a regional average. Since the selected area is too large, it is easy to cover up the regional heterogeneity of extreme precipitation changes and obtain an offset result.
Previous studies based on the statistical analysis of observed data, climate modeling, and physical reasoning have indicated that some types of extreme events, most notably heat waves and precipitation extremes, will greatly increase in a warming climate [6,9]. This study analyzed the change trend in total precipitation and precipitation frequency, as well as possible changes in extreme precipitation. The results show that the probability of extreme precipitation does not increase uniformly across the globe in the context of global warming. This may be related to the study period, regional geographic factors, and the climate system. Further studies are needed to explore whether precipitation intensity increases generally or whether heavy precipitation is more concentrated in a few hours. The relationship between large-scale circulation, thermal differences, and extreme precipitation needs to be explored in future research to reveal the variation and physical mechanism of extreme precipitation.
In addition, although the GPM IMERG product has excellent performance in precipitation measurement, it also has some shortcomings. For instance, IMERG still has difficulties in estimating precipitation over complex terrains and mountainous regions, and its performance is also affected by seasonal variation [52,53,54]. Therefore, in order to obtain a precipitation product of high quality, more precipitation data, including re-analyses and gauge-based grid data, should be combined for research.

5. Conclusions

The results of this study showed that terrestrial and oceanic precipitation intensities were more similar at the hourly scale than at the daily scale, with JS divergence statistics of 0.0323 and 0.0461, respectively. The annual precipitation intensity generally decreased on land, as the annual number of precipitation hours and days increased by 50 h and 5 days during 2011–2020 compared with the previous decade, while no clear trends for the annual precipitation amount. In North Asia, both hourly and daily precipitation exhibited a significant increasing trend, while in the other land regions examined, these parameters did not vary significantly and even showed decreasing trends. The results can provide a useful reference for the evaluation of global precipitation and can deepen our understanding of different precipitation regimes between land and ocean areas.

Author Contributions

Conceptualization, G.W.; methodology, P.L. and H.H.; software, P.L. and H.H.; formal analysis, P.L. and H.H.; investigation, G.W.; data curation, G.W.; writing—original draft preparation, P.L. and G.W.; writing—review and editing, P.L. and G.W.; funding acquisition, G.W. All authors have read and agreed to the published version of the manuscript.

Funding

This study was funded by the National Key Research and Development Program of China (2022YFF0801302) and the National Natural Science Foundation of China (41930970 and 42077421).

Data Availability Statement

The GPM IMERG product data from 2001 to 2020 were downloaded at https://pmm.nasa.gov/data-access/downloads/gpm, accessed on 13 January 2022.

Acknowledgments

The authors highly appreciate the editor and the anonymous reviewers for their very helpful and insightful comments, which lead to a significant improvement in the quality of this manuscript.

Conflicts of Interest

The authors declare no conflict of interest.

References

  1. Ficklin, D.L.; Null, S.E.; Abatzoglou, J.T.; Novick, K.A.; Myers, D.T. Hydrological Intensification Will Increase the Complexity of Water Resource Management. Earth’s Future 2022, 10, e2021EF002487. [Google Scholar] [CrossRef]
  2. Tang, Y.; Tang, Q.; Wang, Z.; Chiew, F.H.S.; Zhang, X.; Xiao, H. Different Precipitation Elasticity of Runoff for Precipitation Increase and Decrease at Watershed Scale. J. Geophys. Res. Atmos. 2019, 124, 11932–11943. [Google Scholar] [CrossRef]
  3. Fishman, R. More uneven distributions overturn benefits of higher precipitation for crop yields. Environ. Res. Lett. 2016, 11, 024004. [Google Scholar] [CrossRef]
  4. Song, X.-P.; Hansen, M.C.; Stehman, S.V.; Potapov, P.V.; Tyukavina, A.; Vermote, E.F.; Townshend, J.R. Global land change from 1982 to 2016. Nature 2018, 560, 639–643. [Google Scholar] [CrossRef]
  5. Sherwood, S.C.; Roca, R.; Weckwerth, T.M.; Andronova, N.G. Tropospheric water vapor, convenction and climate. Rev. Geophys. 2010, 48, RG2001. [Google Scholar] [CrossRef]
  6. Zhang, W.; Zhou, T. Significant Increases in Extreme Precipitation and the Associations with Global Warming over the Global Land Monsoon Regions. J. Clim. 2019, 32, 8465–8488. [Google Scholar] [CrossRef]
  7. Neelin, J.D.; Sahany, S.; Stechmann, S.N.; Bernstein, D.N. Global warming precipitation accumulation increases above the current-climate cutoff scale. Proc. Natl. Acad. Sci. USA 2017, 114, 1258–1263. [Google Scholar] [CrossRef]
  8. Song, F.; Lu, J.; Leung, L.R.; Liu, F. Contrasting Phase Changes of Precipitation Annual Cycle Between Land and Ocean Under Global Warming. Geophys. Res. Lett. 2020, 47, e2020GL090327. [Google Scholar] [CrossRef]
  9. Papalexiou, S.M.; Montanari, A. Global and Regional Increase of Precipitation Extremes Under Global Warming. Water Resour. Res. 2019, 55, 4901–4914. [Google Scholar] [CrossRef]
  10. Martinez-Villalobos, C.; Neelin, J.D. Shifts in Precipitation Accumulation Extremes During the Warm Season Over the United States. Geophys. Res. Lett. 2018, 45, 8586–8595. [Google Scholar] [CrossRef]
  11. Fan, L.; Lu, C.; Yang, B.; Chen, Z. Long-term trends of precipitation in the North China Plain. J. Geogr. Sci. 2012, 22, 989–1001. [Google Scholar] [CrossRef]
  12. Arias, P.; Bellouin, N.; Coppola, E.; Jones, R.; Krinner, G.; Marotzke, J.; Zickfeld, K. Faculty Opinions recommendation of IPCC, 2021: Summary for Policymakers. In Climate Change 2021: The Physical Science Basis; Contribution of Working Group I to the Sixth Assessment Report of the Intergovernmental Panel on Climate Change; IPCC: Cambridge, UK; New York, NY, USA, 2021; pp. 287–422. [Google Scholar] [CrossRef]
  13. Herold, N.; Alexander, L.V.; Donat, M.G.; Contractor, S.; Becker, A. How much does it rain over land? Geophys. Res. Lett. 2016, 43, 341–348. [Google Scholar] [CrossRef]
  14. Kidd, C.; Becker, A.; Huffman, G.J.; Muller, C.L.; Joe, P.; Skofronick-Jackson, G.; Kirschbaum, D.B. So, How Much of the Earth’s Surface Is Covered by Rain Gauges? Bull. Am. Meteorol. Soc. 2017, 98, 69–78. [Google Scholar] [CrossRef] [PubMed]
  15. Kidd, C.; Levizzani, V. Status of satellite precipitation retrievals. Hydrol. Earth Syst. Sci. 2011, 15, 1109–1116. [Google Scholar] [CrossRef]
  16. Harrison, L.; Funk, C.; Peterson, P. Identifying changing precipitation extremes in Sub-Saharan Africa with gauge and satellite products. Environ. Res. Lett. 2019, 14, 085007. [Google Scholar] [CrossRef]
  17. Trenberth, K.E.; Stepaniak, D.P. Seamless Poleward Atmospheric Energy Transports and Implications for the Hadley Circulation. J. Clim. 2003, 16, 3706–3722. [Google Scholar] [CrossRef]
  18. Santer, B.D.; Po-Chedley, S.; Feldl, N.; Fyfe, J.C.; Fu, Q.; Solomon, S.; England, M.; Rodgers, K.B.; Stuecker, M.F.; Mears, C.; et al. Robust Anthropogenic Signal Identified in the Seasonal Cycle of Tropospheric Temperature. J. Clim. 2022, 35, 6075–6100. [Google Scholar] [CrossRef]
  19. Ali, H.; Peleg, N.; Fowler, H.J. Global Scaling of Rainfall With Dewpoint Temperature Reveals Considerable Ocean-Land Difference. Geophys. Res. Lett. 2021, 48, e2021GL093798. [Google Scholar] [CrossRef]
  20. Pendergrass, A.G.; Knutti, R. The Uneven Nature of Daily Precipitation and Its Change. Geophys. Res. Lett. 2018, 45, 11980–11988. [Google Scholar] [CrossRef]
  21. Zhang, Y.; Li, R.; Wang, K. Climatology and changes in internal intensity distributions of global precipitation systems over 2001–2020 based on IMERG. J. Hydrol. 2023, 620, 129386. [Google Scholar] [CrossRef]
  22. Zhang, Y.; Wang, K. Global precipitation system scale increased from 2001 to 2020. J. Hydrol. 2022, 616, 128768. [Google Scholar] [CrossRef]
  23. McErlich, C.; McDonald, A.; Schuddeboom, A.; Vishwanathan, G.; Renwick, J.; Rana, S. Positive correlation between wet-day frequency and intensity linked to universal precipitation drivers. Nat. Geosci. 2023, 16, 410–415. [Google Scholar] [CrossRef]
  24. Madakumbura, G.D.; Thackeray, C.W.; Norris, J.; Goldenson, N.; Hall, A. Anthropogenic influence on extreme precipitation over global land areas seen in multiple observational datasets. Nat. Commun. 2021, 12, 3944. [Google Scholar] [CrossRef] [PubMed]
  25. Huffman, G.J.; Adler, R.F.; Morrissey, M.M.; Bolvin, D.T.; Curtis, S.; Joyce, R.; McGavock, B.; Susskind, J. Global Precipitation at One-Degree Daily Resolution from Multisatellite Observations. J. Hydrometeorol. 2001, 2, 36–50. [Google Scholar] [CrossRef]
  26. Zhang, A.; Zhao, X. Changes of precipitation pattern in China: 1961–2010. Theor. Appl. Clim. 2022, 148, 1005–1019. [Google Scholar] [CrossRef]
  27. Mao, Y.; Wu, G.; Xu, G.; Wang, K. Reduction in Precipitation Seasonality in China from 1960 to 2018. J. Clim. 2022, 35, 227–248. [Google Scholar]
  28. Wu, G.; Li, Y.; Qin, S.; Mao, Y.; Wang, K. Precipitation unevenness in gauge observations and eight reanalyses from 1979 to 2018 over China. J. Clim. 2021, 35.1, 227–248. [Google Scholar] [CrossRef]
  29. Westra, S.; Alexander, L.V.; Zwiers, F.W. Global Increasing Trends in Annual Maximum Daily Precipitation. J. Clim. 2013, 26, 3904–3918. [Google Scholar] [CrossRef]
  30. Sun, Q.; Zhang, X.; Zwiers, F.; Westra, S.; Alexander, L.V. A Global, Continental, and Regional Analysis of Changes in Extreme Precipitation. J. Clim. 2021, 34, 243–258. [Google Scholar] [CrossRef]
  31. He, J.; Soden, B.J. A re-examination of the projected subtropical precipitation decline. Nat. Clim. Change 2017, 1, 53–57. [Google Scholar] [CrossRef]
  32. Lin, M.; Huybers, P. If Rain Falls in India and No One Reports It, Are Historical Trends in Monsoon Extremes Biased? Geophys. Res. Lett. 2019, 46, 1681–1689. [Google Scholar] [CrossRef]
  33. Rai, P.; Choudhary, A.; Dimri, A.P. Future precipitation extremes over India from the CORDEX-South Asia experiments. Theor. Appl. Clim. 2019, 137, 2961–2975. [Google Scholar] [CrossRef]
  34. Marelle, L.; Myhre, G.; Hodnebrog, Ø.; Sillmann, J.; Samset, B.H. The Changing Seasonality of Extreme Daily Precipitation. Geophys. Res. Lett. 2018, 45, 11352–11360. [Google Scholar] [CrossRef]
  35. Cattoën, C.; Robertson, D.E.; Bennett, J.C.; Wang, Q.J.; Carey-Smith, T.K. Calibrating Hourly Precipitation Forecasts with Daily Observations. J. Hydrometeorol. 2020, 21, 1655–1673. [Google Scholar] [CrossRef]
  36. Barbero, R.; Fowler, H.J.; Blenkinsop, S.; Westra, S.; Moron, V.; Lewis, E.; Chan, S.; Lenderink, G.; Kendon, E.; Guerreiro, S.; et al. A synthesis of hourly and daily precipitation extremes in different climatic regions. Weather Clim. Extrem. 2019, 26, 100219. [Google Scholar] [CrossRef]
  37. Barbero, R.; Fowler, H.J.; Lenderink, G.; Blenkinsop, S. Is the intensification of precipitation extremes with global warming better detected at hourly than daily resolutions? Geophys. Res. Lett. 2017, 44, 974–983. [Google Scholar] [CrossRef]
  38. Chen, S.; Hong, Y.; Cao, Q.; Kirstetter, P.E.; Gourley, J.J.; Qi, Y.; Wang, J. Performance evaluation of radar and satellite rainfalls for Typhoon Morakot over Taiwan: Are remote-sensing products ready for gauge denial scenario of extreme events? J. Hydrol. 2013, 506, 4–13. [Google Scholar] [CrossRef]
  39. Prakash, S.; Mitra, A.K.; Pai, D.S.; AghaKouchak, A. From TRMM to GPM: How well can heavy rainfall be detected from space? Adv. Water Resour. 2016, 88, 1–7. [Google Scholar] [CrossRef]
  40. Wang, Y.; Miao, C.; Zhao, X.; Zhang, Q.; Su, J. Evaluation of the GPM IMERG product at the hourly timescale over China. Atmos. Res. 2023, 285, 106656. [Google Scholar] [CrossRef]
  41. Li, R.; Qi, D.; Zhang, Y.; Wang, K. A new pixel-to-object method for evaluating the capability of the GPM IMERG product to quantify precipitation systems. J. Hydrol. 2022, 613, 128476. [Google Scholar] [CrossRef]
  42. Ding, M.; Yong, B.; Yang, Z. Extreme precipitation monitoring capability of the multi-satellite jointly retrieval precipitation products of Global Precipitation Measurement (GPM) mission. J. Remote Sens. 2022, 26, 657–671. [Google Scholar] [CrossRef]
  43. Skofronick-Jackson, G.; Petersen, W.A.; Berg, W.; Kidd, C.; Stocker, E.F.; Kirschbaum, D.B.; Kakar, R.; Braun, S.A.; Huffman, G.J.; Iguchi, T.; et al. The Global Precipitation Measurement (GPM) Mission for Science and Society. Bull. Am. Meteorol. Soc. 2017, 98, 1679–1695. [Google Scholar] [CrossRef] [PubMed]
  44. Kachi, M.; Oki, R.; Shimizu, S.; Kojima, M. Global Precipitation Measurement (GPM) Mission and Its Latest Progress: A Review. Remote Sens. Technol. Appl. 2015, 30, 607–615. [Google Scholar]
  45. Nijssen, B.; Lettenmaier, D.P. Effect of precipitation sampling error on simulated hydrological fluxes and states: Anticipating the Global Precipitation Measurement satellites. J. Geophys. Res. Atmos. 2004, 109, 265–274. [Google Scholar] [CrossRef]
  46. Tang, G.; Zeng, Z.; Long, D.; Guo, X.; Yong, B.; Zhang, W.; Hong, Y. Statistical and Hydrological Comparisons between TRMM and GPM Level-3 Products over a Midlatitude Basin: Is Day-1 IMERG a Good Successor for TMPA 3B42V7? J. Hydrometeorol. 2016, 17, 121–137. [Google Scholar] [CrossRef]
  47. Zhou, C.; Gao, W.; Hu, J.; Du, L.; Du, L. Capability of IMERG V6 Early, Late, and Final Precipitation Products for Monitoring Extreme Precipitation Events. Remote Sens. 2021, 13, 689. [Google Scholar] [CrossRef]
  48. Xu, F.; Guo, B.; Ye, B.; Ye, Q.; Chen, H.; Ju, X.; Guo, J.; Wang, Z. Systematical Evaluation of GPM IMERG and TRMM 3B42V7 Precipitation Products in the Huang-Huai-Hai Plain, China. Remote Sens. 2019, 11, 697. [Google Scholar] [CrossRef]
  49. Tang, G.; Clark, M.P.; Papalexiou, S.M.; Ma, Z.; Hong, Y. Have satellite precipitation products improved over last two decades? A com-prehensive comparison of GPM IMERG with nine satellite and reanalysis datasets. Remote Sens. Environ. 2020, 240, 111697. [Google Scholar] [CrossRef]
  50. Li, R.; Wang, K.; Qi, D. Event-Based Evaluation of the GPM Multisatellite Merged Precipitation Product From 2014 to 2018 Over China: Methods and Results. J. Geophys. Res. Atmos. 2021, 126, e2020JD033692. [Google Scholar] [CrossRef]
  51. Li, R.; Wang, K.; Qi, D. Validating the Integrated Multisatellite Retrievals for Global Precipitation Measurement in Terms of Diurnal Variability with Hourly Gauge Observations Collected at 50,000 Stations in China. J. Geophys. Res. Atmos. 2018, 123, 10423–10442. [Google Scholar] [CrossRef]
  52. Ramadhan, R.; Marzuki, M.; Yusnaini, H.; Ningsih, A.P.; Hashiguchi, H.; Shimomai, T.; Vonnisa, M.; Ulfah, S.; Suryanto, W.; Sholihun, S. Ground Validation of GPM IMERG-F Precipitation Products with the Point Rain Gauge Records on the Extreme Rainfall Over a Mountainous Area of Sumatra Island. J. Penelit. Pendidik. IPA 2022, 8, 163–170. [Google Scholar] [CrossRef]
  53. Pradhan, R.K.; Markonis, Y.; Godoy, M.R.V.; Villalba-Pradas, A.; Andreadis, K.M.; Nikolopoulos, E.I.; Papalexiou, S.M.; Rahim, A.; Tapiador, F.J.; Hanel, M. Review of GPM IMERG performance: A global perspective. Remote Sens. Environ. 2022, 268, 112754. [Google Scholar] [CrossRef]
  54. Gentilucci, M.; Barbieri, M.; Pambianchi, G. Reliability of the IMERG product through reference rain gauges in Central Italy. Atmos. Res. 2022, 278, 106340. [Google Scholar] [CrossRef]
  55. Zhang, Y.; Wang, K. Global precipitation system size. Environ. Res. Lett. 2021, 16, 054005. [Google Scholar] [CrossRef]
  56. Endres, D.; Schindelin, J. A new metric for probability distributions. IEEE Trans. Inf. Theory 2003, 49, 1858–1860. [Google Scholar] [CrossRef]
  57. Feng, X.; Thompson, S.E.; Woods, R.; Porporato, A. Quantifying Asynchronicity of Precipitation and Potential Evapotranspiration in Mediterranean Climates. Geophys. Res. Lett. 2019, 46, 14692–14701. [Google Scholar] [CrossRef]
  58. Dai, A. Global Precipitation and Thunderstorm Frequencies. Part II: Diurnal Variations. J. Clim. 2001, 14, 1112–1128. [Google Scholar] [CrossRef]
  59. Trenberth, K.E.; Zhang, Y. How often does it really rain. Bull. Am. Meteorol. Soc. 2018, 99, 289–298. [Google Scholar] [CrossRef]
  60. Li, X.-F.; Blenkinsop, S.; Barbero, R.; Yu, J.; Lewis, E.; Lenderink, G.; Guerreiro, S.; Chan, S.; Li, Y.; Ali, H.; et al. Global distribution of the intensity and frequency of hourly precipitation and their responses to ENSO. Clim. Dyn. 2020, 54, 4823–4839. [Google Scholar] [CrossRef]
  61. Li, Y.; Guo, B.; Wang, K.; Wu, G.; Shi, C. Performance of TRMM Product in Quantifying Frequency and Intensity of Precipitation during Daytime and Nighttime across China. Remote Sens. 2020, 12, 740. [Google Scholar] [CrossRef]
  62. Markonis, Y.; Papalexiou, S.M.; Martinkova, M.; Hanel, M. Assessment of Water Cycle Intensification Over Land using a Multisource Global Gridded Precipitation DataSet. J. Geophys. Res. Atmos. 2019, 124, 11175–11187. [Google Scholar] [CrossRef]
  63. Cui, D.; Wang, C.; Santisirisomboon, J. Characteristics of extreme precipitation over eastern Asia and its possible con-nections with Asian summer monsoon activity. Int. J. Climatol. 2019, 39, 711–723. [Google Scholar] [CrossRef]
  64. Mtewele, Z.F.; Xu, X.; Jia, G. Heterogeneous Trends of Precipitation Extremes in Recent Two Decades over East Africa. J. Meteorol. Res. 2021, 35, 1057–1073. [Google Scholar] [CrossRef]
Figure 1. Spatial distribution of the multi-year mean and extreme precipitation intensities at hourly and daily scales in every 0.1° × 0.1° grid from 2001 to 2020: (a) mean hourly precipitation intensity, (b) mean daily precipitation intensity, (c) extreme hourly precipitation intensity, and (d) extreme daily precipitation intensity. The curves on the right show the latitudinal average, with the black, blue, and red lines representing global, oceanic, and terrestrial averages, respectively.
Remotesensing 15 04179 g001
Figure 2. Spatial distribution of precipitation frequency in every 0.1° × 0.1° grid from 2001 to 2020: (a) annual precipitation hours; (b) annual precipitation days. The curves on the right show the latitudinal average, with the black, blue, and red lines representing global, oceanic, and terrestrial averages, respectively.
Remotesensing 15 04179 g002
Figure 3. Variations in the annual precipitation amount and frequency on land and the ocean from 2001 to 2020. The red and blue bars represent the annual precipitation amounts on land and the ocean, respectively. Similarly, the red and blue lines represent land and the ocean, respectively. The solid and dashed lines represent annual precipitation days and hours, respectively.
Remotesensing 15 04179 g003
Figure 4. Time series of the relative values of mean and extreme precipitation intensity on land and the ocean from 2001 to 2020: (a) mean hourly precipitation intensity, (b) mean daily precipitation intensity, (c) extreme hourly precipitation intensity, and (d) extreme daily precipitation intensity. The relative values were calculated by dividing the annual precipitation intensity by the multi-year mean during the 2001–2020 period. The black, blue, and red lines represent the global, oceanic, and terrestrial averages, respectively.
Remotesensing 15 04179 g004
Figure 5. Probability density functions of mean and extreme precipitation intensities from 2001 to 2020: (a) mean hourly precipitation intensity, (b) mean daily precipitation intensity, (c) extreme hourly precipitation intensity, and (d) extreme daily precipitation intensity. The black, blue, and red lines represent the global, oceanic, and terrestrial averages, respectively.
Remotesensing 15 04179 g005
Figure 6. Time series of relative mean hourly precipitation intensity from 2001 to 2020 in nine mainland regions of the globe: (a) Africa, (b) Europe, (c) South America, (d) Central America, (e) North America, (f) Maritime Continent, (g) Australia, (h) South Asia, and (i) North Asia. In each graph, the blue line represents the annual mean hourly precipitation intensity, the red line represents the 5-year moving average, and the black line represents the linear regression result. The regression equation, R-square, and p-value are included in the dashed boxes. The symbol * means multiplication sign.
Remotesensing 15 04179 g006
Figure 7. Time series of relative mean daily precipitation intensity from 2001 to 2020 in nine mainland regions of the globe: (a) Africa, (b) Europe, (c) South America, (d) Central America, (e) North America, (f) Maritime Continent, (g) Australia, (h) South Asia, and (i) North Asia. In each graph, the blue line represents the annual mean hourly precipitation intensity, the red line represents the 5-year moving average, and the black line represents the linear regression result. The regression equation, R-square, and p-value are included in the dashed boxes. The symbol * means multiplication sign.
Remotesensing 15 04179 g007
Figure 8. Time series of the relative extreme hourly precipitation intensity from 2001 to 2020 in nine mainland regions of the globe: (a) Africa, (b) Europe, (c) South America, (d) Central America, (e) North America, (f) Maritime Continent, (g) Australia, (h) South Asia, and (i) North Asia. In each graph, the blue line represents the annual mean hourly precipitation intensity, the red line represents the 5-year moving average, and the black line represents the linear regression result. The regression equation, R-square, and p-value are included in the dashed boxes. The symbol * means multiplication sign.
Remotesensing 15 04179 g008
Figure 9. Time series of relative extreme daily precipitation intensity from 2001 to 2020 in nine mainland regions of the globe: (a) Africa, (b) Europe, (c) South America, (d) Central America, (e) North America, (f) Maritime Continent, (g) Australia, (h) South Asia, and (i) North Asia. In each graph, the blue line represents the annual mean hourly precipitation intensity, the red line represents the 5-year moving average, and the black line represents the linear regression result. The regression equation, R-square, and p-value are included in the dashed boxes. The symbol * means multiplication sign.
Remotesensing 15 04179 g009
Figure 10. Variations in annual precipitation amount and frequency from 2001 to 2020 in nine mainland regions of the globe: (a) Africa, (b) Europe, (c) South America, (d) Central America, (e) North America, (f) Maritime Continent, (g) Australia, (h) South Asia, and (i) North Asia. The blue bars represent the annual precipitation amount. The red and green lines represent the annual number of precipitation days and hours, respectively.
Remotesensing 15 04179 g010
Table 1. Jensen–Shannon divergence statistics for the probability density functions of the mean hourly and daily precipitation intensities and extreme hourly and daily precipitation intensities between land and the ocean. The symbol “*” indicates statistically significant values at the 0.05 level.
HourlyDaily
Mean value0.0323 *0.0461
Extreme value0.0149 *0.0474
Disclaimer/Publisher’s Note: The statements, opinions and data contained in all publications are solely those of the individual author(s) and contributor(s) and not of MDPI and/or the editor(s). MDPI and/or the editor(s) disclaim responsibility for any injury to people or property resulting from any ideas, methods, instructions or products referred to in the content.

