Article

Spatio-Temporal Variation of Critical Relative Humidity Based on Multiple Datasets

Key Laboratory for Semi-Arid Climate Change of the Ministry of Education, College of Atmospheric Sciences, Lanzhou University, Lanzhou 730000, China
*
Author to whom correspondence should be addressed.
Remote Sens. 2023, 15(17), 4187; https://doi.org/10.3390/rs15174187
Submission received: 14 July 2023 / Revised: 19 August 2023 / Accepted: 22 August 2023 / Published: 25 August 2023
(This article belongs to the Special Issue Remote Sensing of Aerosol, Cloud and Their Interactions)

Abstract

:
Clouds remain an important source of uncertainty in climate simulations, in large part because subgrid processes are not well represented. Critical relative humidity (RHc) is an important metric for subgrid-scale variability in humidity in cloud parameterization. Based on CloudSat and CALIPSO satellite data, we explored the spatial and temporal distribution characteristics of RHc, assessed the ability of ERA-5 and MERRA-2 reanalysis and CMIP-6 climate models to characterise humidity subgrid variability and further explored the influence of meteorological factors and aerosols. The statistical results showed that there was significant variation in the spatial distribution of RHc, with large variations in both latitude and altitude, as well as more pronounced monthly variations, and that there were differences in monthly variations between regions. Both the reanalysis data and the climate models were able to reproduce similar spatial and temporal distribution patterns but differed significantly in their specific values. The temporal correlations with satellite observations were also relatively poor. In addition, aerosols and meteorological conditions affected the distribution of RHc by influencing the cloud fraction at a certain relative humidity level, indicating that their influence needs to be considered in future parameterization schemes.

Graphical Abstract

1. Introduction

Clouds are of great importance to the Earth’s climate and have a significant impact on radiation balance, atmospheric circulation and the water cycle [1,2]. Therefore, the simulation of clouds in a model is very important and involves many physical processes. It is generally recognised that despite considerable progress in recent decades (e.g., [3,4,5,6]), the representation of clouds remains an important source of uncertainty in climate simulations due to a limited understanding of key physical processes and inadequate model parameterization [7,8,9]. The cloud fraction is the first-order variable that affects downwelling radiation at the surface [10], and much of the bias in model-simulated radiation is due to deviations in the cloud fraction. The difficulty of simulating the cloud fraction is mainly because the scale of cloud formation is generally smaller than the grid in the model, and the fluctuations in the subgrid need to be taken into account. Fractional cloud cover can occur only if there are horizontal subgrid-scale variations in humidity; otherwise, the whole grid is either clear or cloudy [11]. One of the approaches that can be used to account for subgrid humidity variations and to parameterize fractional cloud cover is the relative humidity (RH) scheme, which attempts to relate grid-averaged relative humidity to cloud fraction.
For example, Sundqvist et al. [12] proposed a scheme in which there was fractional cloud cover when the grid-box mean relative humidity was above a “critical relative humidity” (RHc), and the cloud fraction increased monotonically from zero according to a given function. This is equivalent to assuming that the total-water specific humidity in the grid box has a uniform probability density function (PDF) and that the width of the uniform PDF is related to the saturation specific humidity [3]. The RHc serves as a humidity threshold and can be specifically characterised as the mean relative humidity within a grid at which the humidity fluctuations are sufficiently large to cause saturation and the cloud formation in a portion of the grid box, despite the grid being subsaturated in the mean sense. Thus, RHc is also a simple measure of the subgrid-scale variability, and higher (lower) values of RHc indicate smaller (larger) subgrid-scale humidity variability. Based on the cloud scheme proposed by Sundqvist et al. [12], Quaas [13] proposed an equation for RHc, which showed that RHc can be calculated from the grid-averaged relative humidity and cloud fraction. Although some models now use other cloud parameterization schemes (e.g., prognostic schemes), each term in the prognostic scheme must be parameterized, which is difficult to verify with observational data and involves a large degree of uncertainty [14]. Therefore, due to its simplicity and computational efficiency advantages, the RH scheme is still used in many models (e.g., [15,16,17]). Studying how to improve the RH scheme is important for improving cloud parameterization in models.
Several studies have evaluated RH schemes and found that they do not adequately represent the cloud vertical structure and are biased in terms of cloud fraction and seasonal variations in cloud fraction. These schemes generally overestimate the upper clouds in the tropics and underestimate the amount of lower and middle level clouds near 60°S and 60°N [18,19]. This is mainly because the common models do not deal well with the variability of RHc. The proper selection of RHc can effectively improve the simulation of cloud fraction and cloud feedback [20], as well as the forecasting of the large-scale Indian monsoon and the simulation of South Asian monsoon precipitation [21,22]. For instance, Quass [13] found a 30% increase in cloud feedback compared to the standard version by applying the spatially variable RHc in the cloud parameterization. However, in the current model, RHc is usually set to a fixed value or varies monotonically with height (e.g., [23]). To summarise the above, it is desirable to discuss and analyse the spatial and temporal distribution characteristics of RHc to provide a reference for more accurate RHc parameterization. In addition, reanalysis data and climate models are already widely used in scientific research. However, they all still have large deviations in cloud fraction compared to observations [24,25,26]. The main reason is that they cannot properly represent the subgrid variation in humidity. It is therefore essential to explore whether reanalysis data and climate models can reproduce the spatial and temporal distributions of RHc. Several studies have noted that the change in RHc is related to meteorological conditions, aerosols, and other factors within the grid box [27,28]. Until now, however, the topic has received far less attention. By using multiple datasets, this study investigated the spatial and temporal distribution characteristics of the RHc in order to understand the variation in RHc. To assess the ability of the reanalysis data and the climate models to characterize humidity subgrid variability, we also analysed the deviations between the reanalysis data and climate models and observations. In addition, the effects of meteorological conditions and aerosols on the RHc were briefly discussed to provide a reference for more accurate RHc parameterization. This study will provide useful information for the improvement of RH schemes, leading to further improvements in cloud simulation.
This paper is organised as follows. In Section 2, the data and methods used in this study and the formulas for calculating the RHc are briefly described. In Section 3.1, the characteristics of the spatial and temporal distributions of the RHc derived from different datasets are shown. In Section 3.2, the correlation between other datasets and satellite observations are provided. In Section 3.3, the effects of meteorological factors as well as aerosols are further discussed. Finally, the discussion and conclusions are provided in Section 4 and Section 5, respectively.

2. Materials and Methods

In the current study, we collected 8 years (2007–2014) of data from CloudSat and CALIPSO, CALIPSO–GOCCP, reanalysis datasets and outputs of CMIP6 models to analyse the spatial and temporal distribution characteristics of RHc. Furthermore, the effects of meteorological conditions and aerosols were explored.

2.1. CloudSat and CALIPSO Satellite Data

CloudSat and CALIPSO satellites are both members of the A-train satellite cluster; the CloudSat satellite carries a cloud profiling radar (CPR), and the CALIPSO satellite carries a Cloud–Aerosol Lidar with Orthogonal Polarization (CALIOP) [29,30]. The CPR can penetrate optically thick clouds that can attenuate lidar signals, while lidar can detect optically thin clouds that are not detected by cloud radar. Thus, in this study, we used the 2B-GEOPROF-LIDAR dataset, which combines the advantages of CPR and CALIPO to accurately describe information on the vertical structure of clouds in the atmosphere on a global scale [31,32]. Here, the Cloud Fraction, cloud LayerBase and LayerTop parameters in this product were used to construct the 2-dimensional cloud field.
In this dataset, each profile consists of 125 height layers, and a threshold of 99% was used for the Cloud Fraction parameter to identify a cloudy bin [33,34]. In the following analysis, a horizontal resolution of 2.5° × 2.5° and a vertical resolution of 25 hPa were used as the standard grid size, and the cloud fraction was defined as the ratio of the cloudy profiles to the total number of profiles at each layer for a given grid in a month. Using one month of data to calculate the cloud fraction ensured that there were enough statistical samples in each standard grid to obtain a more accurate cloud fraction.

2.2. CALIPSO–GOCCP

The CALIPSO–GOCCP cloud product is generated from CALIPSO Level-1 data, and its main climatological goal is to improve the assessment of clouds in climate models [35,36] through the joint use of the CALIPSO simulator [37]. A detailed description of the processing of CALIPSO–GOCCP data has been provided by Chepfer et al. [38]. The instantaneous profile of the lidar-attenuated scattering ratio (SR) with a vertical resolution of 480 m was first extracted from each profile of the CALIPSO level-1 product, and notably, the SR here was the ratio of the total attenuated backscattered signal (ATB) to the calculated molecular attenuated backscattered signal (ATB, molecular only). Each atmospheric layer was labelled as cloudy (SR > 5), clear (0.01 < SR < 1.2), fully attenuated (SR < 0.01) or an uncertain pixel (1.2 < SR < 5). The cloud fraction at each vertical level was calculated by dividing the number of cloudy profiles by the total number of transient SR profiles (not fully attenuated). GOCCP has been validated against ground-based [39] and in situ observations [40] and has been widely used to study cloud vertical structure and for model evaluation (e.g., [41,42,43]). Monthly averaged 3D_CloudFraction data from the GOCCP v2.9 cloud product [40] with a horizontal resolution of 2° × 2° and a vertical resolution of 480 m were used in this study. To match the cloud fraction from GOCCP with the relative humidity from ERA-5, we standardised the horizontal resolution of the data to 2.5° × 2.5°, and in the vertical projection, the cloud fraction in the layer with the mean height closest to the ERA-5 layer was chosen.

2.3. Reanalysis Datasets

ERA-5 is the fifth-generation atmospheric reanalysis of the European Centre for Medium-Range Weather Forecasts [44]. In this study, the hourly cloud fraction and relative humidity parameters at 37 pressure layers from ERA-5 were used to calculate the RHc. Here, ERA-5 had a horizontal resolution of 0.25° × 0.25°. In addition, the monthly average vertical velocity was used later in the study. In addition, the relative humidity information from ERA-5 was used to match the 2B-GEOPROF-LIDAR profile data to obtain the relative humidity of each bin in the 2B-GEOPROF-LIDAR profile.
In addition to ERA-5 data, the cloud fraction, relative humidity and aerosol mass mixing ratio information from the Modern-Era Retrospective Analysis for Research and Applications Version 2 (MERRA-2) were used in this research. The MERRA-2 reanalysis data provided atmospheric reanalysis and aerosol data at a 0.625° × 0.5° horizontal resolution based on version 5.12.4 of the Goddard Earth Observing System (GEOS-5) data [45]. Specifically, the monthly cloud fraction and relative humidity from the “tavgM_3d_cld_Np” product and the three-hourly aerosol data from the “inst3_3d_aer_Nv” product were used here. The “tavgM_3d_cld_Np” product provides data at 42 pressure layers. The “inst3_3d_aer_Nv” product provides air density and mass mixing ratios of different types of aerosols (e.g., black carbon, organic carbon, sulphate, sulphur dioxide, dust and sea salt) in 72 mode layers, mainly for obtaining mass concentration profiles for different aerosol types.

2.4. CMIP6 Models

We also used the cloud fraction outputs from four CMIP6 models (AMIP experiment, monthly time frequency and r1i1p1 ensemble). Considering the difference in the definitions of clouds between the models and the observations, each model used the lidar simulator [37] to simulate the clouds observed by CALIPSO.
In this study, all data were uniformly linearly interpolated onto a 2.5° × 2.5° grid for consistency with the data processing process of the CloudSat and CALIPSO product. Table 1 lists the details of the dataset used to calculate the RHc, including the spatial resolution and related variables.

2.5. Methods

A simple uniform distribution of total-water specific humidity (qt) with a width related to saturation specific humidity (qs) was assumed. Furthermore, it was assumed that the width of the uniform distribution can be expressed as 2qs∙(1s − RHc). The cloud fraction (CF) can be obtained from the following formula:
CF = { 1 1 RH 1 RHc   0 ,     RH RHc ,   RH > RHc
where RHc represents the critical relative humidity and RH is the grid-averaged relative humidity value. Then, RHc can be derived from Equation (1), as used in Quaas [13]:
RHc = 1 1 RH ( 1 CF ) 2
Notably, the derived RHc must be between 0 and 1 and less than the value of RH.
Based on the above, we used five combinations of data to calculate RHc. They included CF from CloudSat and CALIPSO and RH from ERA-5; CF from GOCCP and RH from ERA-5; CF and RH from ERA-5; CF and RH from MERRA-2; and CF from CMIP-6 models and RH from ERA-5. In later sections, the results of these five data combinations are considered the RHc derived from CloudSat and CALIPSO, GOCCP, ERA-5, MERRA-2 and climate models.

3. Results

3.1. Spatial Distribution Characteristics of RHc Derived from Different Datasets

The RHc was derived from different datasets by using Equation (2). Figure 1 shows the spatial distribution of the climatological RHc at selected levels (200, 500, 700, 850 and 925 hPa) using CloudSat and CALIPSO datasets and the differences between other datasets and CloudSat and CALIPSO (that is, CC). A positive (negative) value indicates that the RHc derived from a given dataset is larger (smaller) than that from CloudSat and CALIPSO. For climate models, the results shown are the multimodel ensemble mean (MEM). As in previous studies, significant spatial variations in RHc were found in almost all datasets [13,20]. For CloudSat and CALIPSO, there were higher values in the lower troposphere and lower values in the intermediate pressure layers. Over a pressure layer (e.g., 925 hPa), the RHc had significant regional differences, with maximum values reaching 0.9 and minimum values of approximately 0.2. The values of RHc were higher in the tropics, particularly in the Western Pacific Warm Pool, the Western Equator of South America, the Western Equator of Africa and Indonesia. Lower values were located in the subtropics, especially in typical stratocumulus regions (e.g., west coast of South Africa, west coast of Peru, west coast of California, and western Australia) and arid regions (e.g., deserts). Generally, the RHc values over land tended to be higher than those over the sea, which was consistent with results from previous studies (e.g., [46]). Note that the same RHc values do not indicate similar cloud fractions and relative humidity. For example, the same RHc can be obtained when the relative humidity is 90% and the cloud fraction is 0.5 or when the relative humidity is 70% and the cloud fraction is 0.134, according to Equation (2).
Although the patterns of RHc distribution derived from the other datasets were broadly similar to the CloudSat and CALIPSO results, there were still significant deviations in the magnitude of RHc. This difference can be mainly attributed to the differences in the cloud fraction. In general, other datasets extensively underestimated RHc at 200 hPa and overestimated RHc at other pressure levels. In contrast to other data, the GOCCP product slightly overestimated the RHc in the Western Pacific Warm Pool at the 200 hPa level and underestimated the RHc in the subtropical stratocumulus and cumulus regions at almost all pressure levels. It has been reported that the low vertical resolution of the GOCCP product may mix clear and cloudy layers within 480 m and classify them as cloudy [40], which may cause a bias in the cloud fraction. Due to the influence of surface clutter, CloudSat is unable to detect marine boundary layer clouds [47]. Moreover, marine boundary layer clouds near the west coasts of Africa and America have shallow geometric thicknesses and typically account for less than 50% of the volume of a CPR bin [48]. Therefore, CloudSat and CALIPSO may underestimate the cloud fraction in these areas. For reanalysis, the RHc values derived from ERA-5 and MERRA-2 were both higher in the lower and middle layers and lower at 200 hPa relative to CloudSat and CALIPSO. In particular, MERRA-2 significantly overestimated the RHc at the 850 hPa and 925 hPa levels, with a deviation of up to 0.3. We found that the apparent deviation of MERRA-2 was not very relevant to its relative humidity, and even when using the relative humidity from ERA-5, the results still deviated significantly. The comparison results of cloud fraction and relative humidity between ERA-5 and MERRA-2 are shown in Figure S1. Positive (negative) values indicate that MERRA-2 provides a larger (smaller) value than ERA-5. As can be seen, there is a relatively large difference between the cloud fraction. MERRA-2 exhibited a smaller cloud fraction in the low and middle layers and a larger cloud fraction in the upper layer. The possible cause of deviations in RHc could be the deviations in the cloud fraction of the reanalysis data. Previous studies have found that some reanalysis datasets have significant biases in cloud fraction in the Asian monsoon region [49] and Tibetan Plateau region [50], and both ERA-5 and MERRA-2 overestimate the high cloud fraction and underestimate the mid and low cloud fraction, especially in the Southern Hemisphere [51,52,53]. The estimation of cloud fraction and condensate in MERRA-2 involves integrating a portion of the probability density function (PDF) for the total-water specific humidity that surpasses the threshold for cloud formation. The humidity threshold is obtained from the relative humidity of the cloudy grid where cloud fractions are less than 10% from the Atmospheric Infrared Sounder (AIRS), and the specification bias or deficient parameterization of the critical relative humidity is possibly the source of the deviations [54,55]. Cloud properties in ERA-5 are represented by a prognostic cloud scheme that considers physical processes as sources (e.g., convection, condensation) or sinks (e.g., evaporation) of clouds [56]. The defects in the ERA-5 cloud parameterization process, particularly in accurately representing ice and snow values within mixed-phase clouds around the melting layers, as well as in capturing small-scale and mesoscale structures, can result in a biased cloud fraction [57]. Similar to the reanalysis, the MEM overestimated RHc at lower levels and underestimated RHc at higher levels (200 hPa). However, there was an underestimation of RHc over land and coastal areas at 925 hPa. Compared to CloudSat and CALIPSO, the climate models underestimated the cloud fraction in the lower atmosphere layers [25]. Previous studies have noted that the biases in the cloud diurnal variation and cloud response of CMIP6 climate models should largely be attributed to deficiencies in cloud parameterization schemes, such as cumulus convection and boundary layer physics [58,59].
The spatial distributions of the RHc derived from CloudSat and CALIPSO over the specified temperature layer (e.g., 20, 10, 0, –10, –20 and –30 °C) are also shown in Figure S2. There was still a large spatial variation in RHc even in the same temperature layer. The mode of distribution over the temperature layer was similar to that over the pressure layer. According to the equation for qs, qs should be the same for the same temperature. However, we can see that even in areas with similar water vapour contents, the RHc still varied considerably in the same temperature layer. This means that there are other possible factors (e.g., meteorological factors and aerosols) that can regulate the formation of clouds, thereby influencing the distribution of RHc, as we will discuss in later sections. We also analysed statistical features of RHc for different cloud phases. Figure S3 shows statistical results of RHc for pure-water clouds and pure-ice clouds. As can be seen from Figure S3, the RHc of water clouds is significantly larger than that of ice clouds. Again, for water clouds, there are significant spatial differences in the RHc. The values of RHc were larger in the tropics. Smaller values were located in the subtropics and arid regions (e.g., deserts). For ice clouds, the RHc is generally small and there is little variation in RHc within the same latitudinal band.
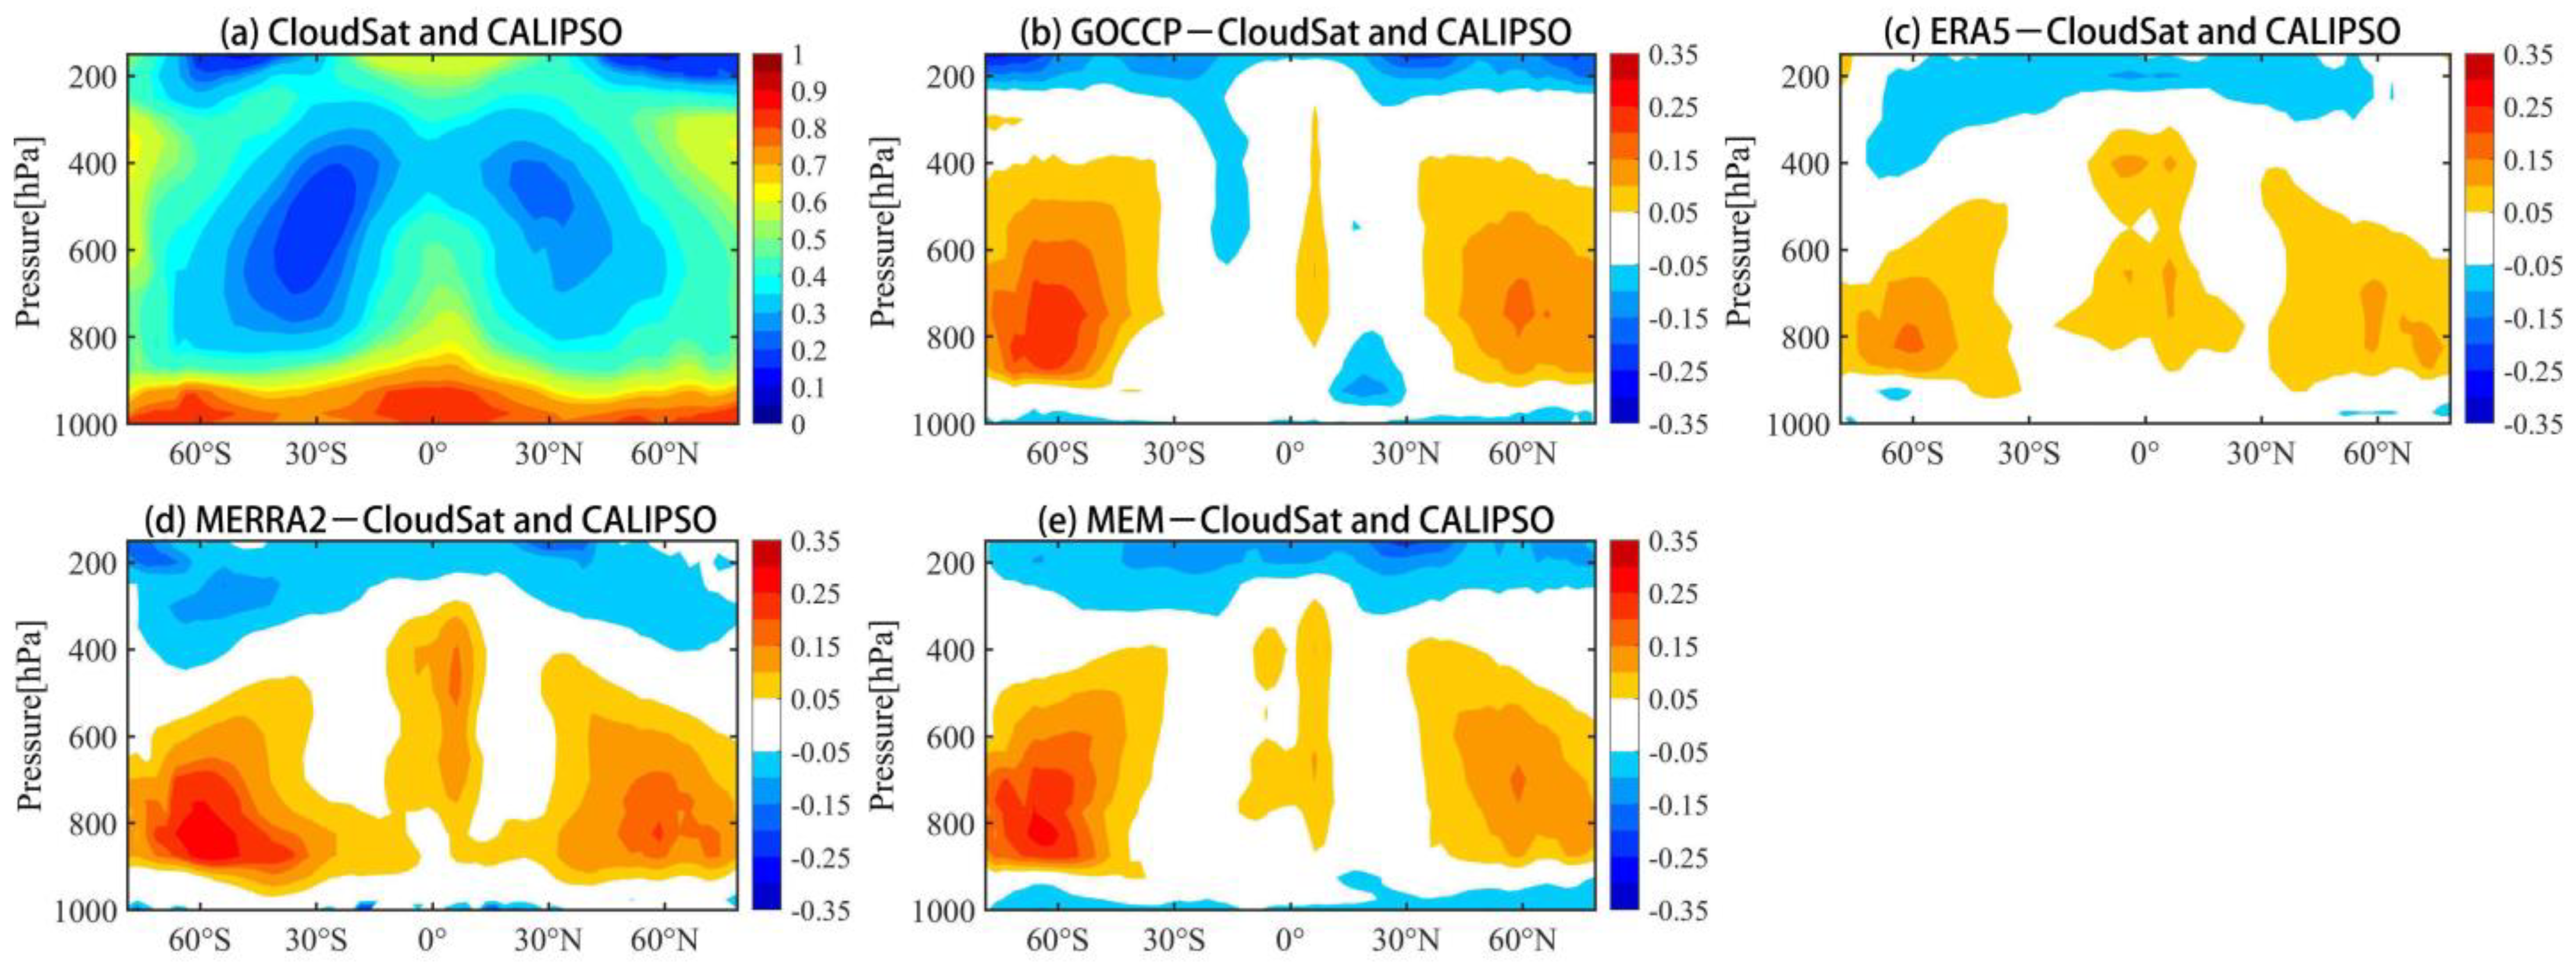
Here, to further explore the distribution characteristics of RHc, the zonally averaged latitude–pressure distributions of RHc derived from CloudSat and CALIPSO and the differences between other datasets and CloudSat and CALIPSO are shown in Figure 2. A positive (negative) value indicates that the RHc derived from a given dataset is larger (smaller) than that from CloudSat and CALIPSO. Figure 2a indicates that the CloudSat and CALIPSO dataset exhibited an approximately symmetrical structure of RHc profiles between the Northern and Southern Hemispheres. In the vertical direction, RHc generally descended from the surface to the middle layer and then rose in the upper layers, which was consistent with the features shown in Figure 1. In terms of the variation in RHc with latitude, RHc decreased from the polar regions to middle latitudes and then slowly increased in the tropics. The RHc was lower at middle altitudes (800–400 hPa) in both hemispheres (20–50°S and 20–50°N), especially in the Southern Hemisphere (SH), with a minimum value of approximately 0.2. Below 850 hPa, the RHc was higher at all latitudes, essentially greater than 0.7. The distribution of RHc is closely related to the distribution of cloud fraction and relative humidity. Over the middle atmospheric layer of the subtropical region (e.g., approximately 30°), the low RHc was caused by a low cloud fraction and low relative humidity. The subsidence branch of the Hadley circulation leads to relatively dry and warm air in this region, which is not conducive to cloud development in the free troposphere [35,60]. Large-scale downdrafts can also cause inversions at the top of the boundary layer and prevent convection from developing [61]. There was a clear difference between middle latitudes and the tropics at approximately 200 hPa, with higher values in the tropics and lower values in the mid to high latitudes. Water vapour in the boundary layer is transported to the intertropical convergence zone and is then transported upwards by convection, resulting in high relative humidity near the top of the tropical troposphere [62]. Thus, it is clear that RHc showed considerable variation with latitude and altitude; thus, using a fixed RHc in the models is inappropriate.
Figure 2b–e show that all other datasets significantly overestimated RHc values from 850 to 300 hPa compared to CloudSat and CALIPSO, especially at approximately 60°S, where the bias reached 0.25. Meanwhile, they all displayed negative bias in the upper troposphere, meaning that these datasets mostly overestimated the cloud fraction there. Among these datasets, ERA-5 exhibited more consistent results with those from CloudSat and CALIPSO (especially over high latitudes), although there were still considerable deviations (Figure 2c). The MERRA2, CMIP6 models and GOCCP showed large deviations at high latitudes, especially in the Southern Hemisphere, where the bias even reached a maximum of 0.3 (Figure 2b–e). This means that these datasets all significantly underestimated the cloud fraction at a given humidity condition. The bias in GOCCP may be due to the inability of lidar to penetrate optically thick clouds, leading to an underestimation of low-level clouds by GOCCP products [50,63,64]. Reanalysis also failed to reproduce the vertical cloud structure in the tropics extending from the surface to 200 hPa and significantly underestimated the low- and mid-level clouds [24]. The cloud fraction of the reanalysis product and climate models was subject to uncertainty due to various parameterization schemes [65]. For example, Wright et al. [66] found that reanalysis typically overestimated high clouds, which may be related to convective parameterization schemes. Different treatments of entrainment and detrainment in convective schemes can influence the distributions of high clouds in the reanalysis. The shallow convection and boundary layer parameterization schemes can also contribute to cloud fraction differences between reanalysis and observations [51].
Figure S4 shows the meridionally-averaged longitude–pressure distribution of RHc derived from CloudSat and CALIPSO and the differences between other datasets and CloudSat and CALIPSO. In contrast to the zonal mean, the meridional means of RHc did not show much variation with longitude and only varied with height. The RHc was lower at mid-altitude in the region west of 120°W and near 20°W. Overall, RHc was slightly lower in the Western Hemisphere than in the Eastern Hemisphere. The differences between the other data and CloudSat and CALIPSO (Figure S4b–e) showed that, as in Figure 2, the other data slightly overestimated the RHc in the lower and middle troposphere and underestimated the RHc in the upper troposphere. The global mean profiles for RHc derived from different datasets are further shown in Figure S5. In calculating the global average, we used the weighted average method [67]. In general, RHc did not vary monotonically with height. This was generally consistent with the results of previous studies [13,24]. Within the boundary layer, there was a slight increase in RHc with height. Compared to CloudSat and CALIPSO, all other datasets qualitatively captured the vertical profile, but they all showed greater values from 900 and 400 hPa and lower values above 300 hPa.

3.2. Temporal Distribution Characteristics of RHc Derived from Different Datasets

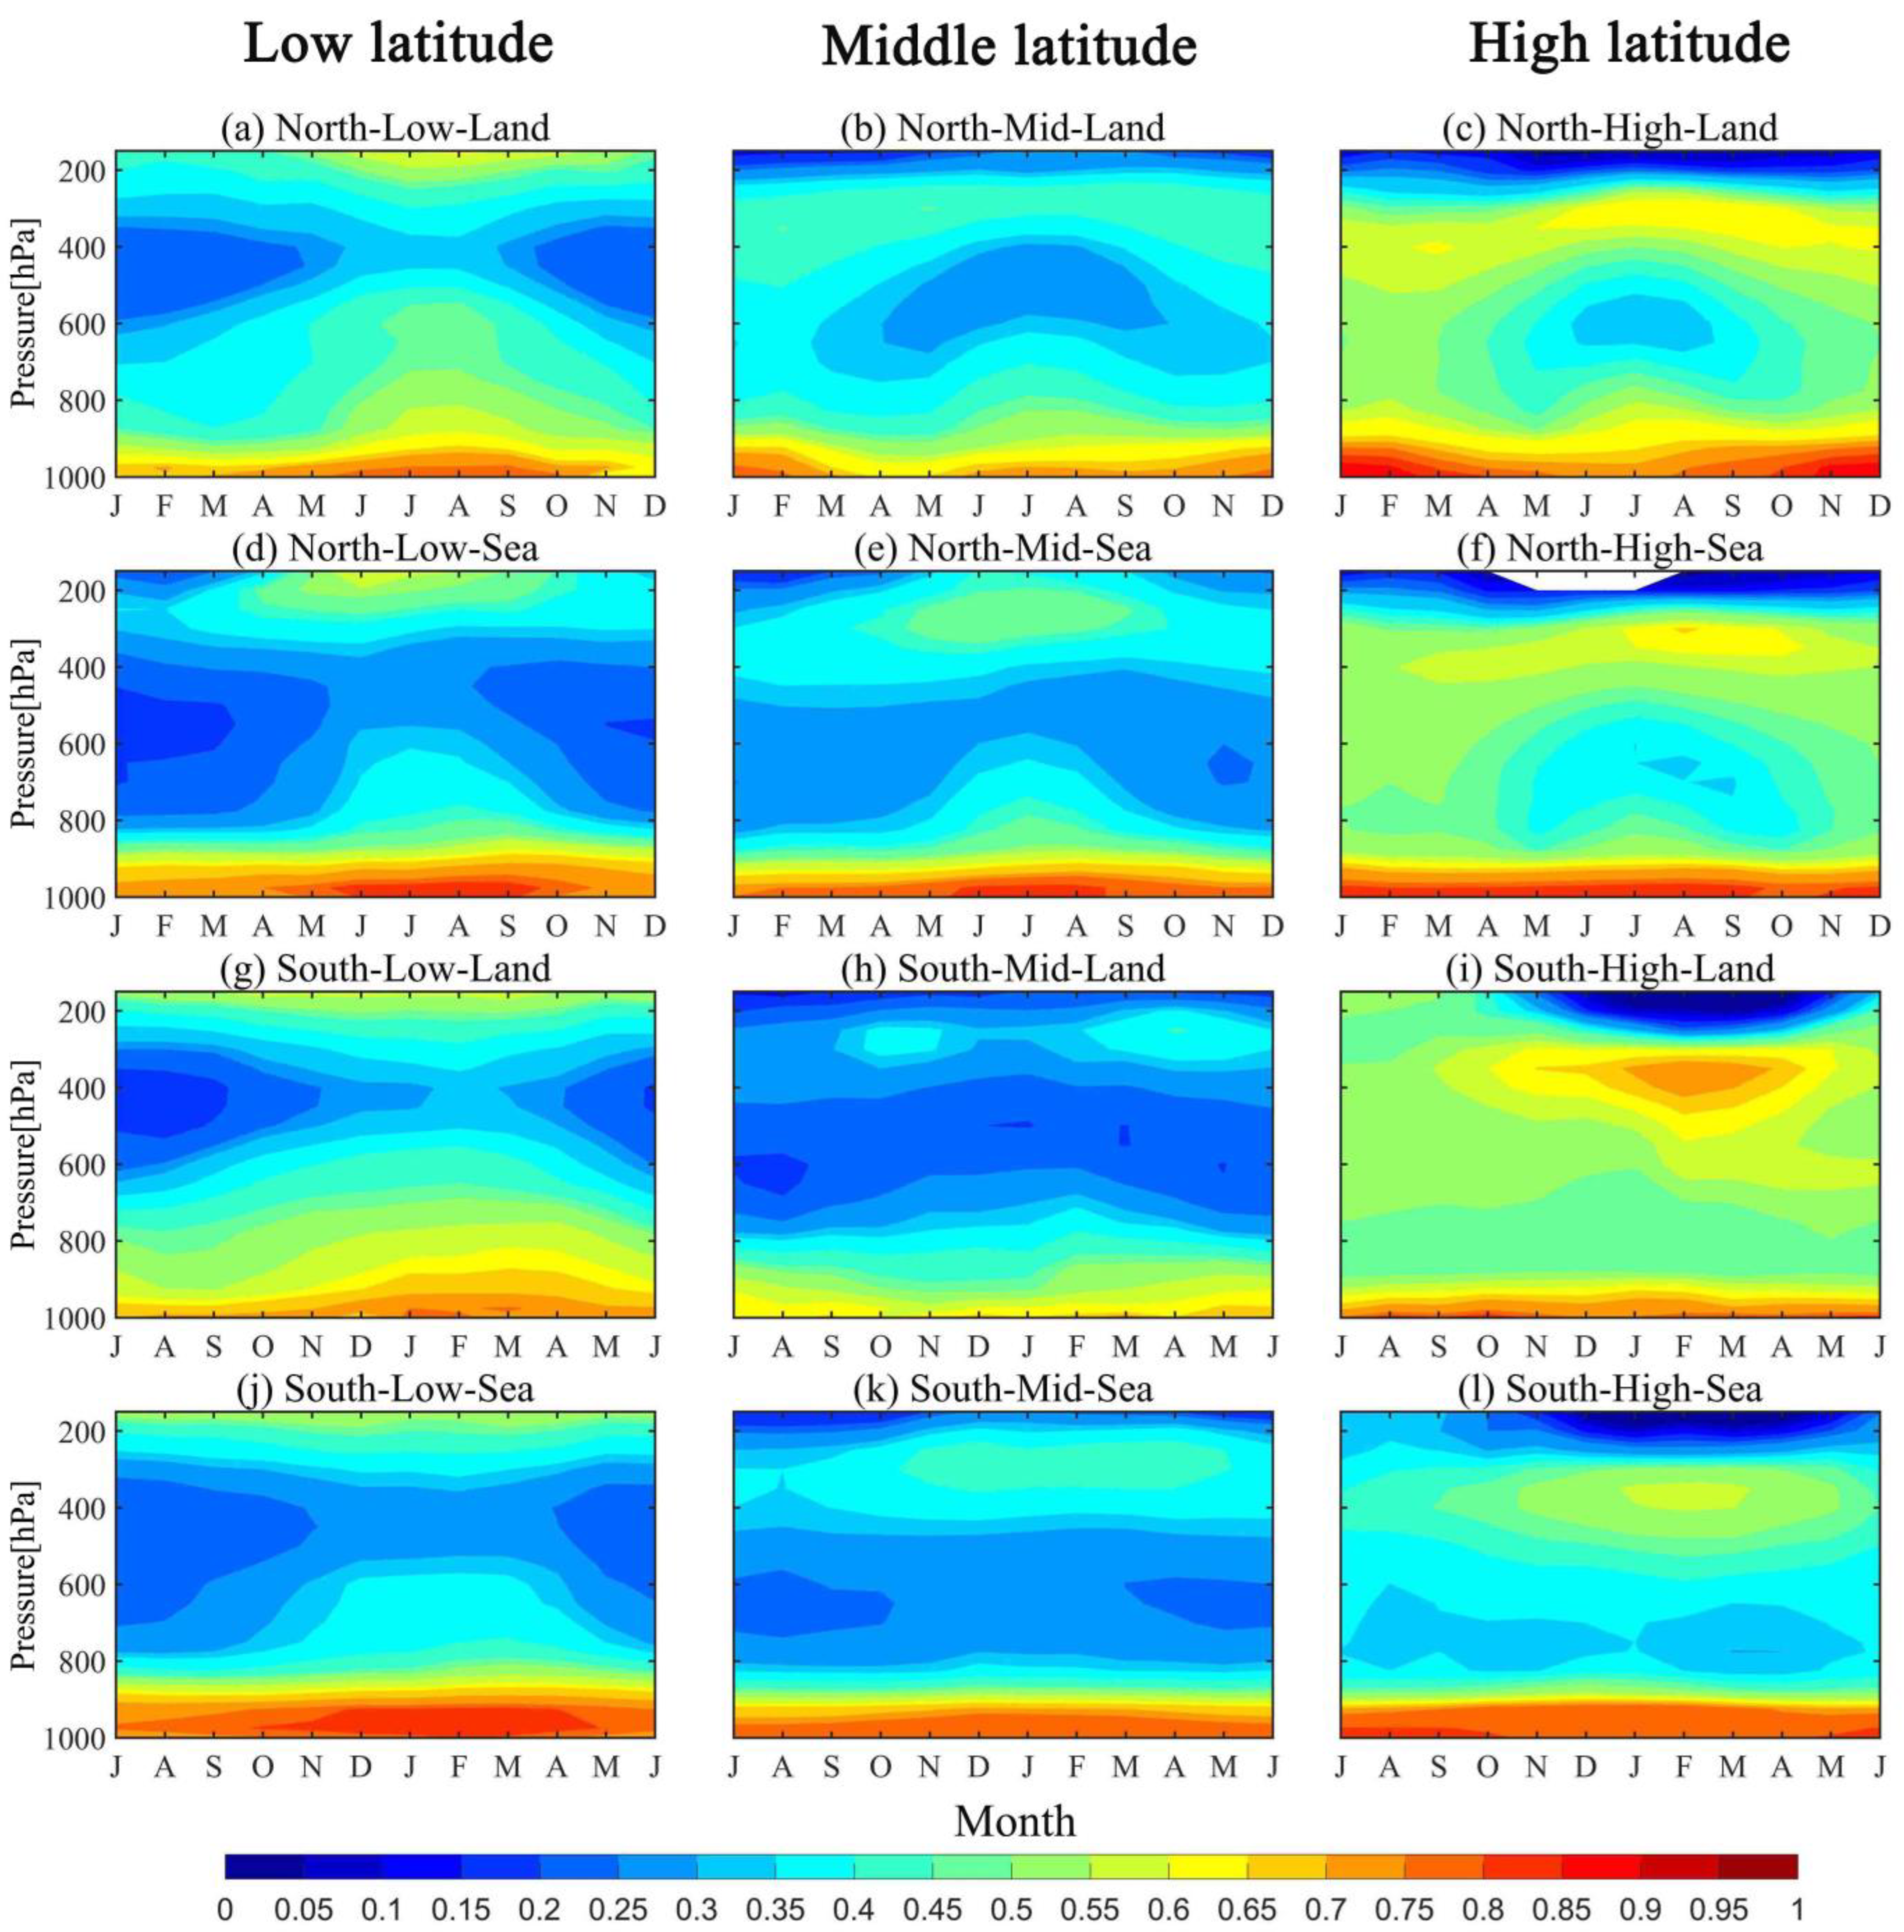
According to the results of the front section (Figure 1 and Figure 2), there were significant differences in RHc between different latitudes, as well as between oceanic and land areas. Here, we further discuss the monthly variation in RHc separately over marine and terrestrial regions at different latitudes. The results are shown in Figure 3.
In Figure 3, we divided the global region into 12 subregions. The first to third columns are for low (0–30°N/S), mid (30–60°N/S) and high latitudes (60–90°N/S), respectively. The first and third rows represent the land area, and the second and fourth rows represent the marine area. Note that for seasonal consistency, we set the months in the SH to be from July to June of the next year.
For low latitudes, the monthly variation in the RHc profile was basically the same between the SH and NH. For the ocean and land, the RHc profile had a similar pattern even if RHc showed a low value at a wider vertical extent over the ocean. Overall, lower RHc values tended to occur in local spring and winter, particularly in the mid-troposphere. In addition, we found that there was no low value at approximately 200 hPa at low latitudes, which was different from the distribution of RHc at middle and high latitudes. For middle latitudes, there were significant differences in the monthly variation between ocean and land or between the two hemispheres. In the NH, the RHc was lower in the middle of the troposphere from April to October over land areas. However, over the ocean in the NH, the lower RHc had a wider vertical distribution at 800–400 hPa throughout the year, and its value was essentially less than 0.3. In the SH, the monthly pressure distribution of RHc basically followed the pattern of RHc over the ocean at middle latitudes in the NH. Thus, obvious differences in the RHc monthly profile at middle latitudes between the two hemispheres mainly occurred over the land region. Compared with low and middle latitudes, there was no distinctly lower RHc at high latitudes, except at approximately 200 hPa. Notably, at high latitudes, a larger RHc existed at approximately 400 hPa, which was not found at middle and low latitudes. This phenomenon was most pronounced over the land in the SH, where the larger RHc lasted from October to May of the next year. In addition, there is a great north–south difference in land area over middle and high latitudes, such that a lower RHc in the upper troposphere persisted throughout the year in the NH but mainly during the local summer and autumn in the SH. This difference is determined by a combination of differences in cloud fraction and relative humidity. Figure S6 is the monthly variations in cloud fraction over mid- and high-latitude land areas in the SH and NH. Figure S7 is the same as Figure S6, but for relative humidity. As shown in Figures S6 and S7, above 400 hPa, the distribution of cloud fraction in the northern and southern hemispheres is relatively consistent, and the north-south difference in relative humidity is more pronounced. Between 800 hPa and 400 hPa, there are some north-south differences in both cloud fraction and relative humidity, with more pronounced differences in relative humidity. Below 800 hPa, the north-south variation in relative humidity is the main reason for the difference in RHc. Relative humidity is more evenly distributed in the SH than in the NH. A lower RHc meant a greater subgrid variation in humidity, which could produce a larger cloud fraction for a given relative humidity. In summary, Figure 3 clearly indicates that there were significant monthly variations in the profile of RHc and that there are differences in the monthly variations in different regions. These differences can be linked to the relationship between relative humidity and cloud fraction, which can further be related to the thermodynamic and microphysical conditions during cloud formation. We will discuss this further in Section 3.3.
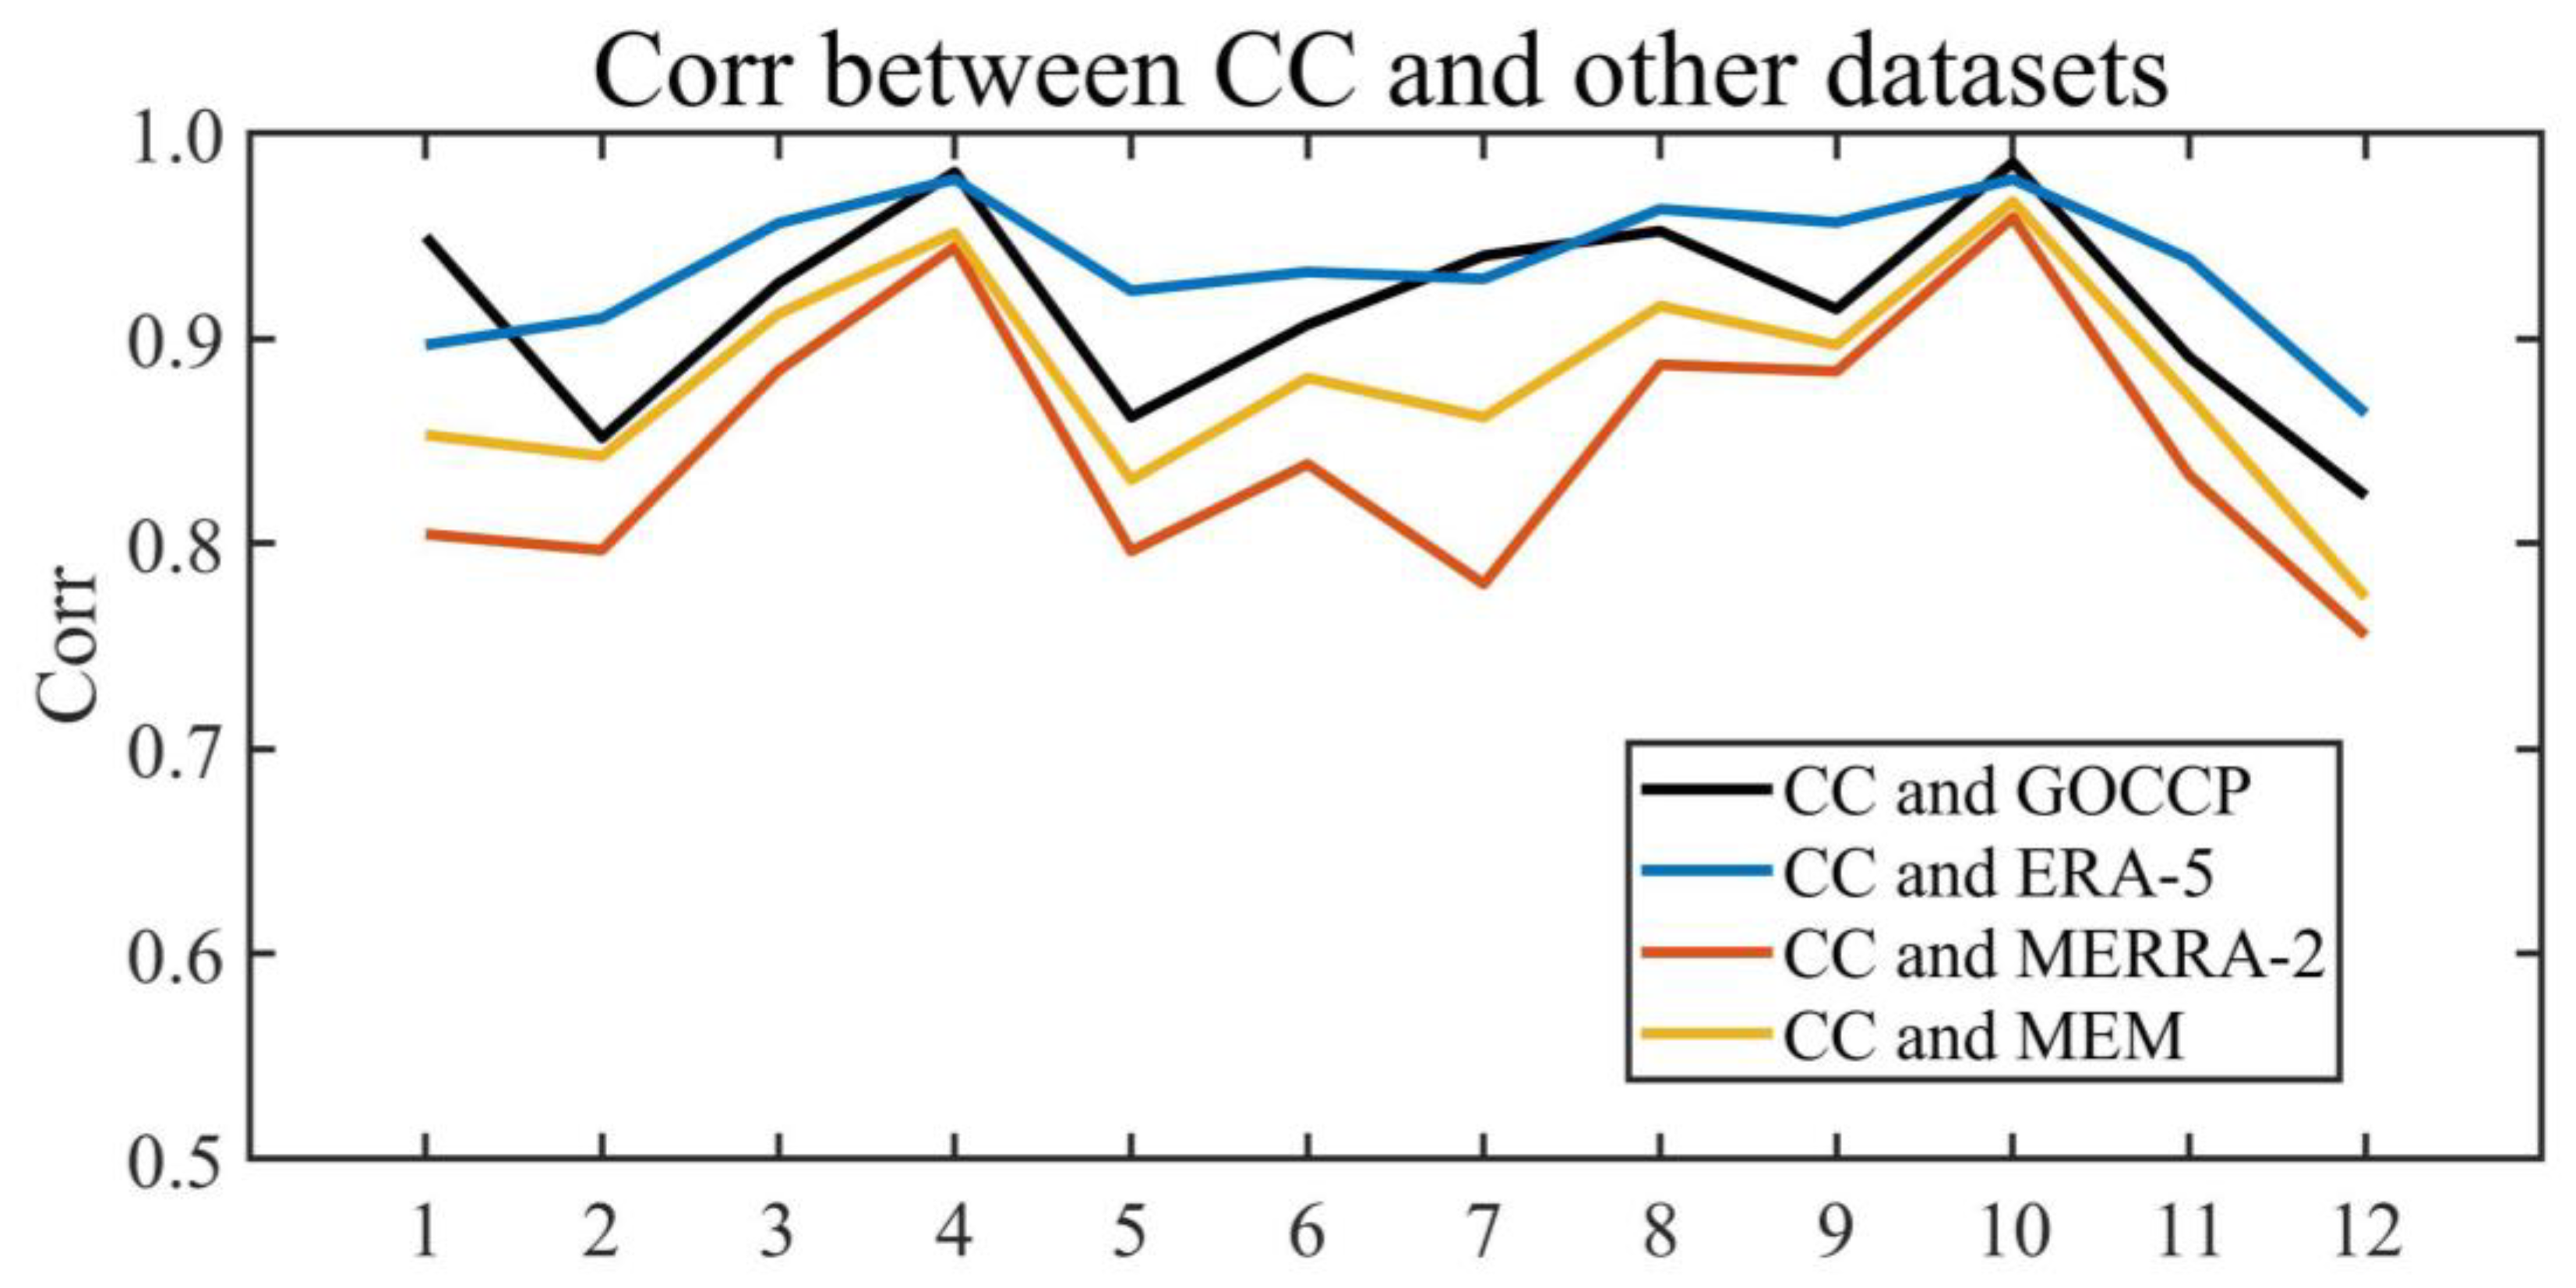
To determine whether other datasets can reasonably show the regional monthly variation in the RHc profile, the spatial correlation coefficients of monthly variation in each subregion between different datasets and CloudSat and CALIPSO are shown in Figure 4. Horizontal coordinates 1 to 12 represent each of the 12 different areas in Figure 3a–l. As shown in Figure 4, the spatial correlation coefficients of the other data with CloudSat and CALIPSO (that is, CC) were basically above 0.8. ERA-5 showed the closest results to those of CloudSat and CALIPSO, and the correlation coefficients were even greater than 0.9. The GOCCP also correlated well with CloudSat and CALIPSO observations; for example, the correlation coefficient reached 0.98 in low-latitude oceanic regions of the SH. MERRA-2 and MEM showed almost synchronous variations in correlation with CloudSat and CALIPSO, but MEM was slightly more relevant. In summary, all datasets were essentially able to reflect the seasonal variations in RHc in different regions of the globe.
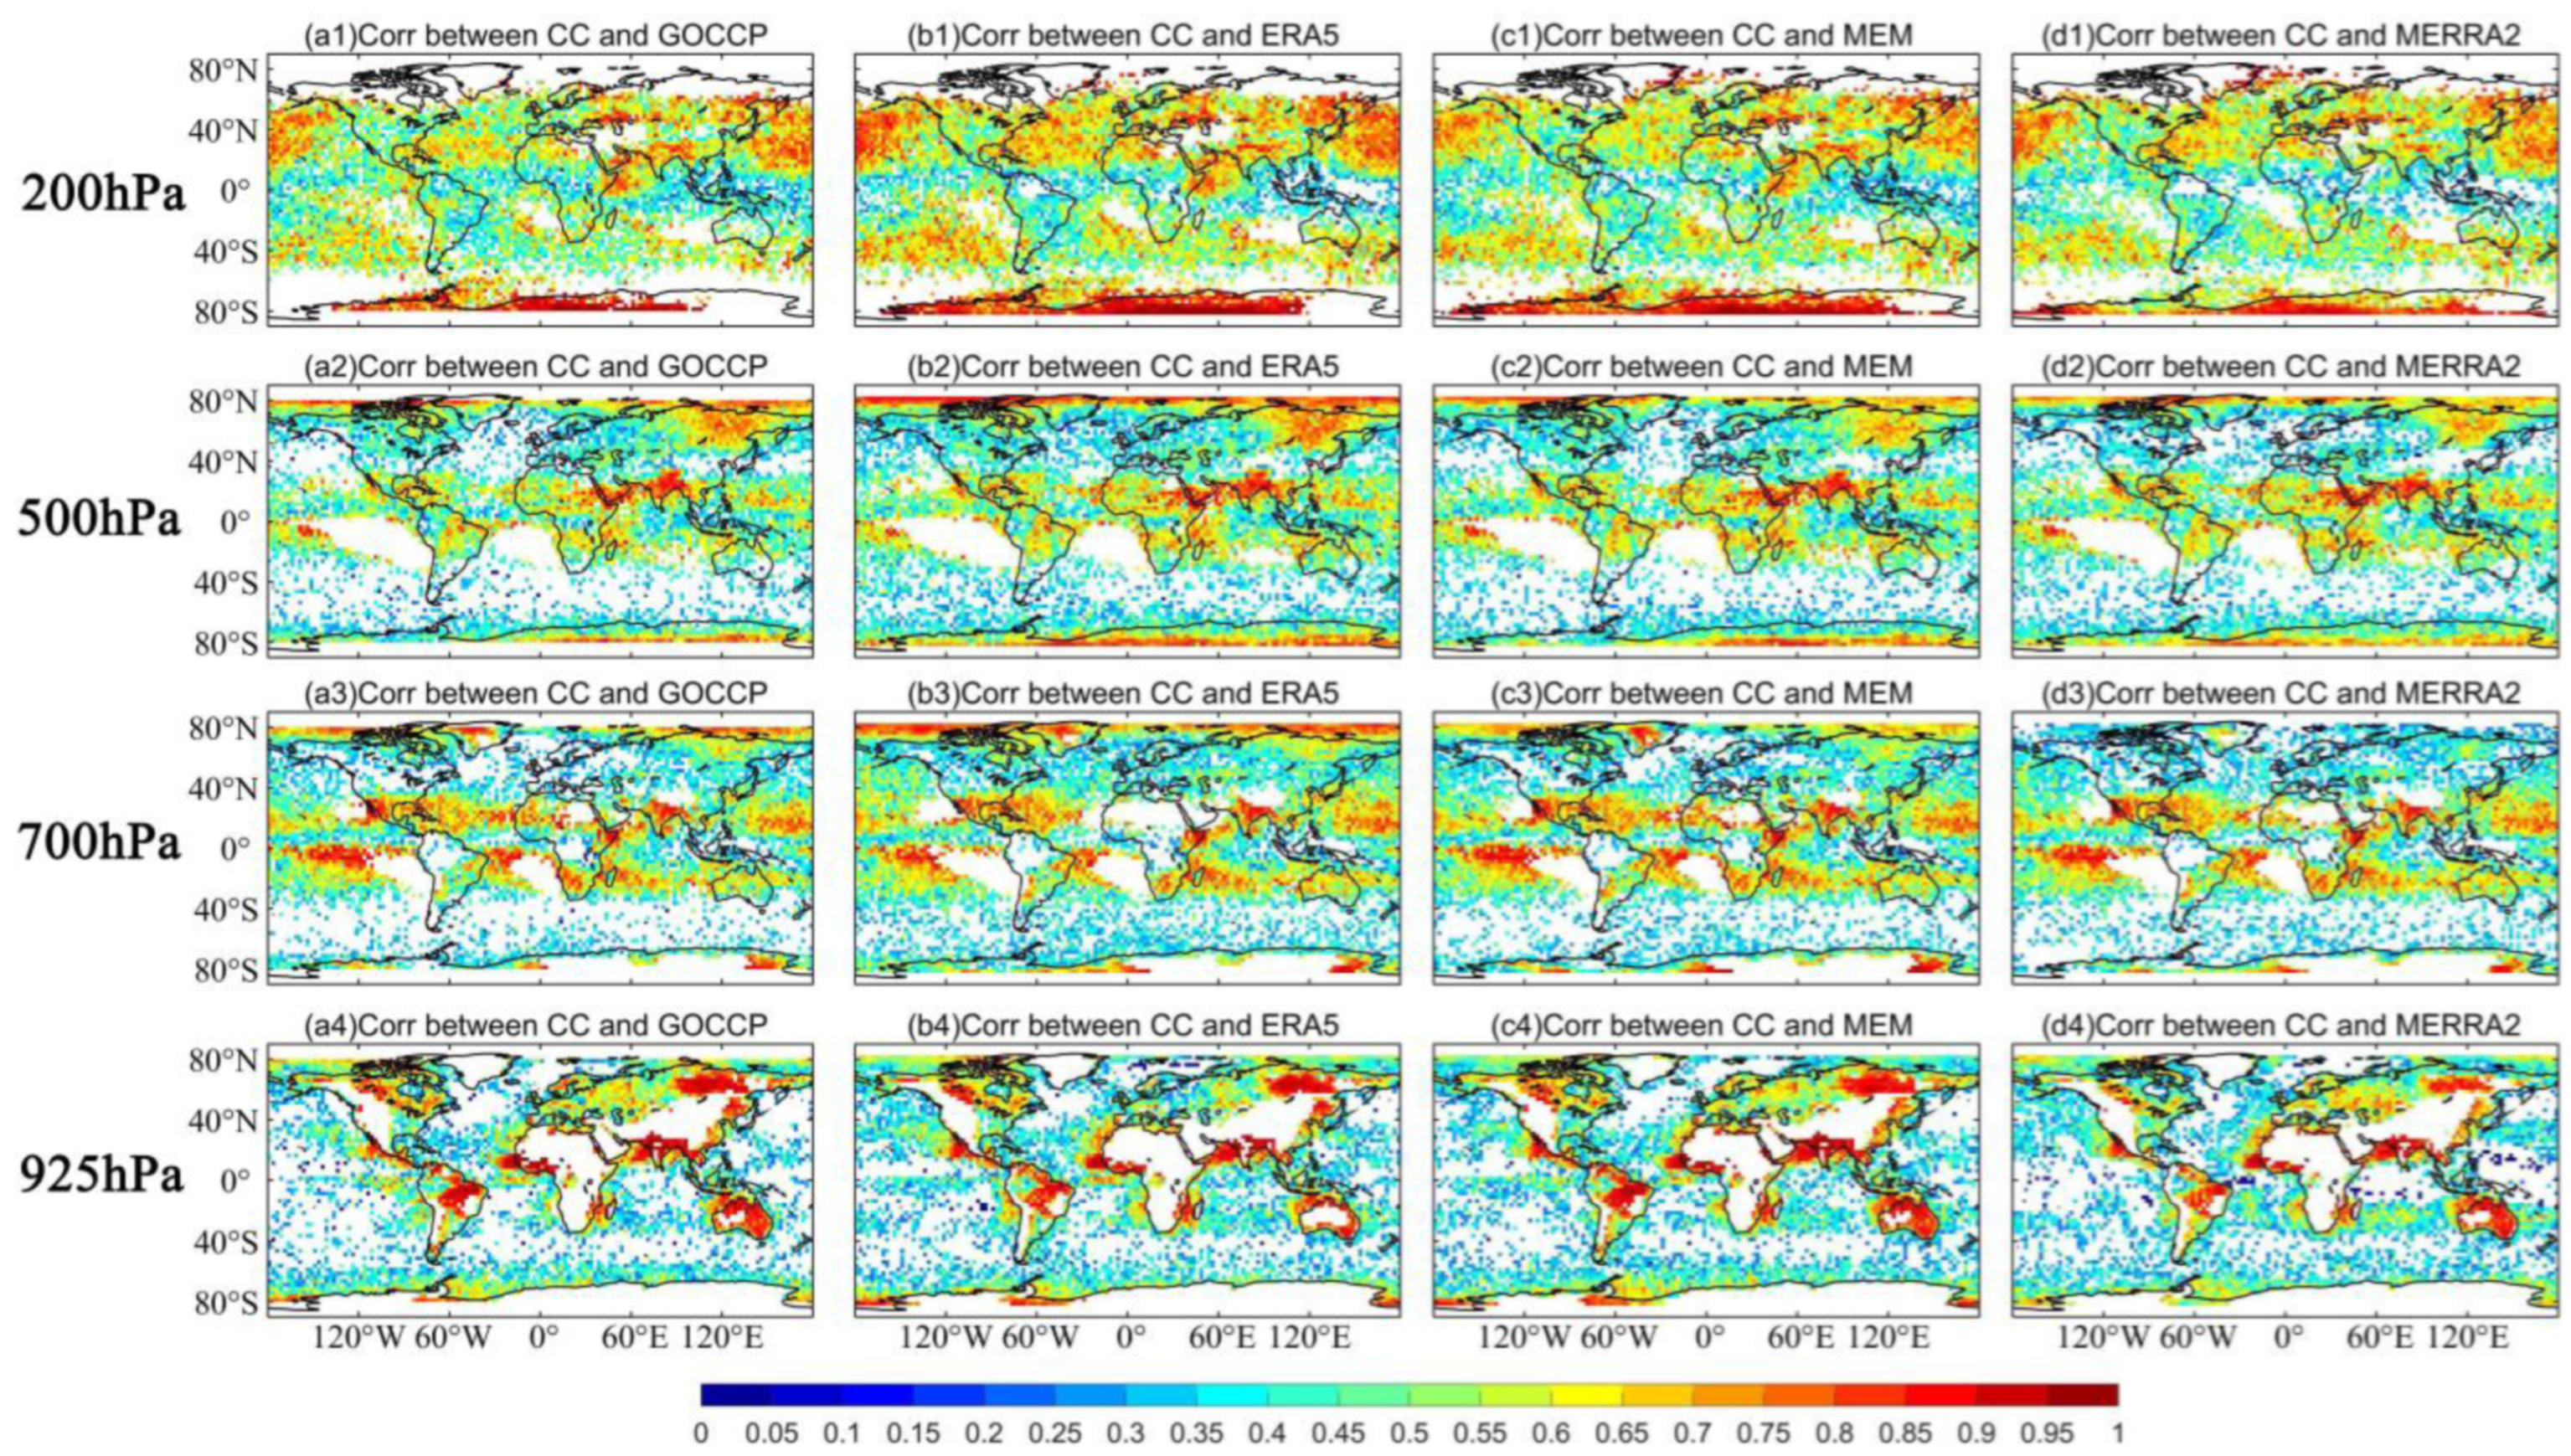
Figure 5 shows the global distributions of the temporal correlations (at the 95% confidence level) between CloudSat and CALIPSO and other datasets for RHc at different pressure levels (200, 500, 700 and 925 hPa). Note that the time series was from January 2007 to December 2014, which excluded months where the satellite failed or had a high level of data loss. As stated in Figure 5, the distribution of correlation coefficients on the time series between different datasets and CloudSat and CALIPSO was basically consistent. However, we can also see that although the distribution of RHc climate states was roughly the same for different data with CC, the correlation in the time series was still relatively poor. Figure 5 indicates that a good correlation mainly occurred at higher levels, and a poor correlation occurred at lower levels. In the upper atmosphere (200 hPa), all four datasets had the best correlation, especially at middle latitudes and in the Antarctic, where correlation coefficients reached 0.8. In the middle atmosphere, the correlation was better in the region between 30°N and 30°S. In the 925 hPa pressure layer, only some areas on land and on the coast had high correlations (e.g., India, Australia, and north-eastern South America), with correlation coefficients reaching 0.9. Over the low atmosphere of the ocean region, the correlations were poorer. Importantly, CloudSat only operates during the sunlit portion of the orbit from 2012 onwards, which may introduce a degree of bias.
Figure S8 is the Taylor diagram for the spatial distributions of the climatological RHc from two reanalysis datasets and four CMIP6 models compared to those from Cloud-Sat/CALIPSO at different pressure levels (200, 500, 700 and 925 hPa). The Taylor diagram [68] has three indicators for reference: the normalized standard deviation (vertical coordinate in Figure S8), the correlation coefficient (peripheral quarter-circle coordinates in Figure S8) and the central pattern root-mean-square (RMS) difference (pink coordinates in Figure S8), which are used to measure how well the magnitudes and patterns of the evaluated data match the reference data. In Figure S8, ERA-5 had the best performance for the spatial distribution with the normalized standard deviations closest to 1 and larger correlation coefficient. For the four climate models, the performance capabilities of the models vary between different pressure layers. Generally speaking, the BCC-CSM2-MR had a better performance.

3.3. Effect of Meteorological Conditions and Aerosols on RHc

From the analysis above, we can see that there was a large spatial variation in RHc, varying with altitude and latitude, as well as a marked monthly variation. There were even large differences between areas with similar water vapour contents in the same temperature layer. This meant that RHc is influenced by other factors (e.g., meteorological conditions and aerosols). In this section, we study the impact of meteorological conditions and aerosols using meteorological factor data from the ERA-5 reanalysis data and aerosol data from the MERRA-2 dataset.
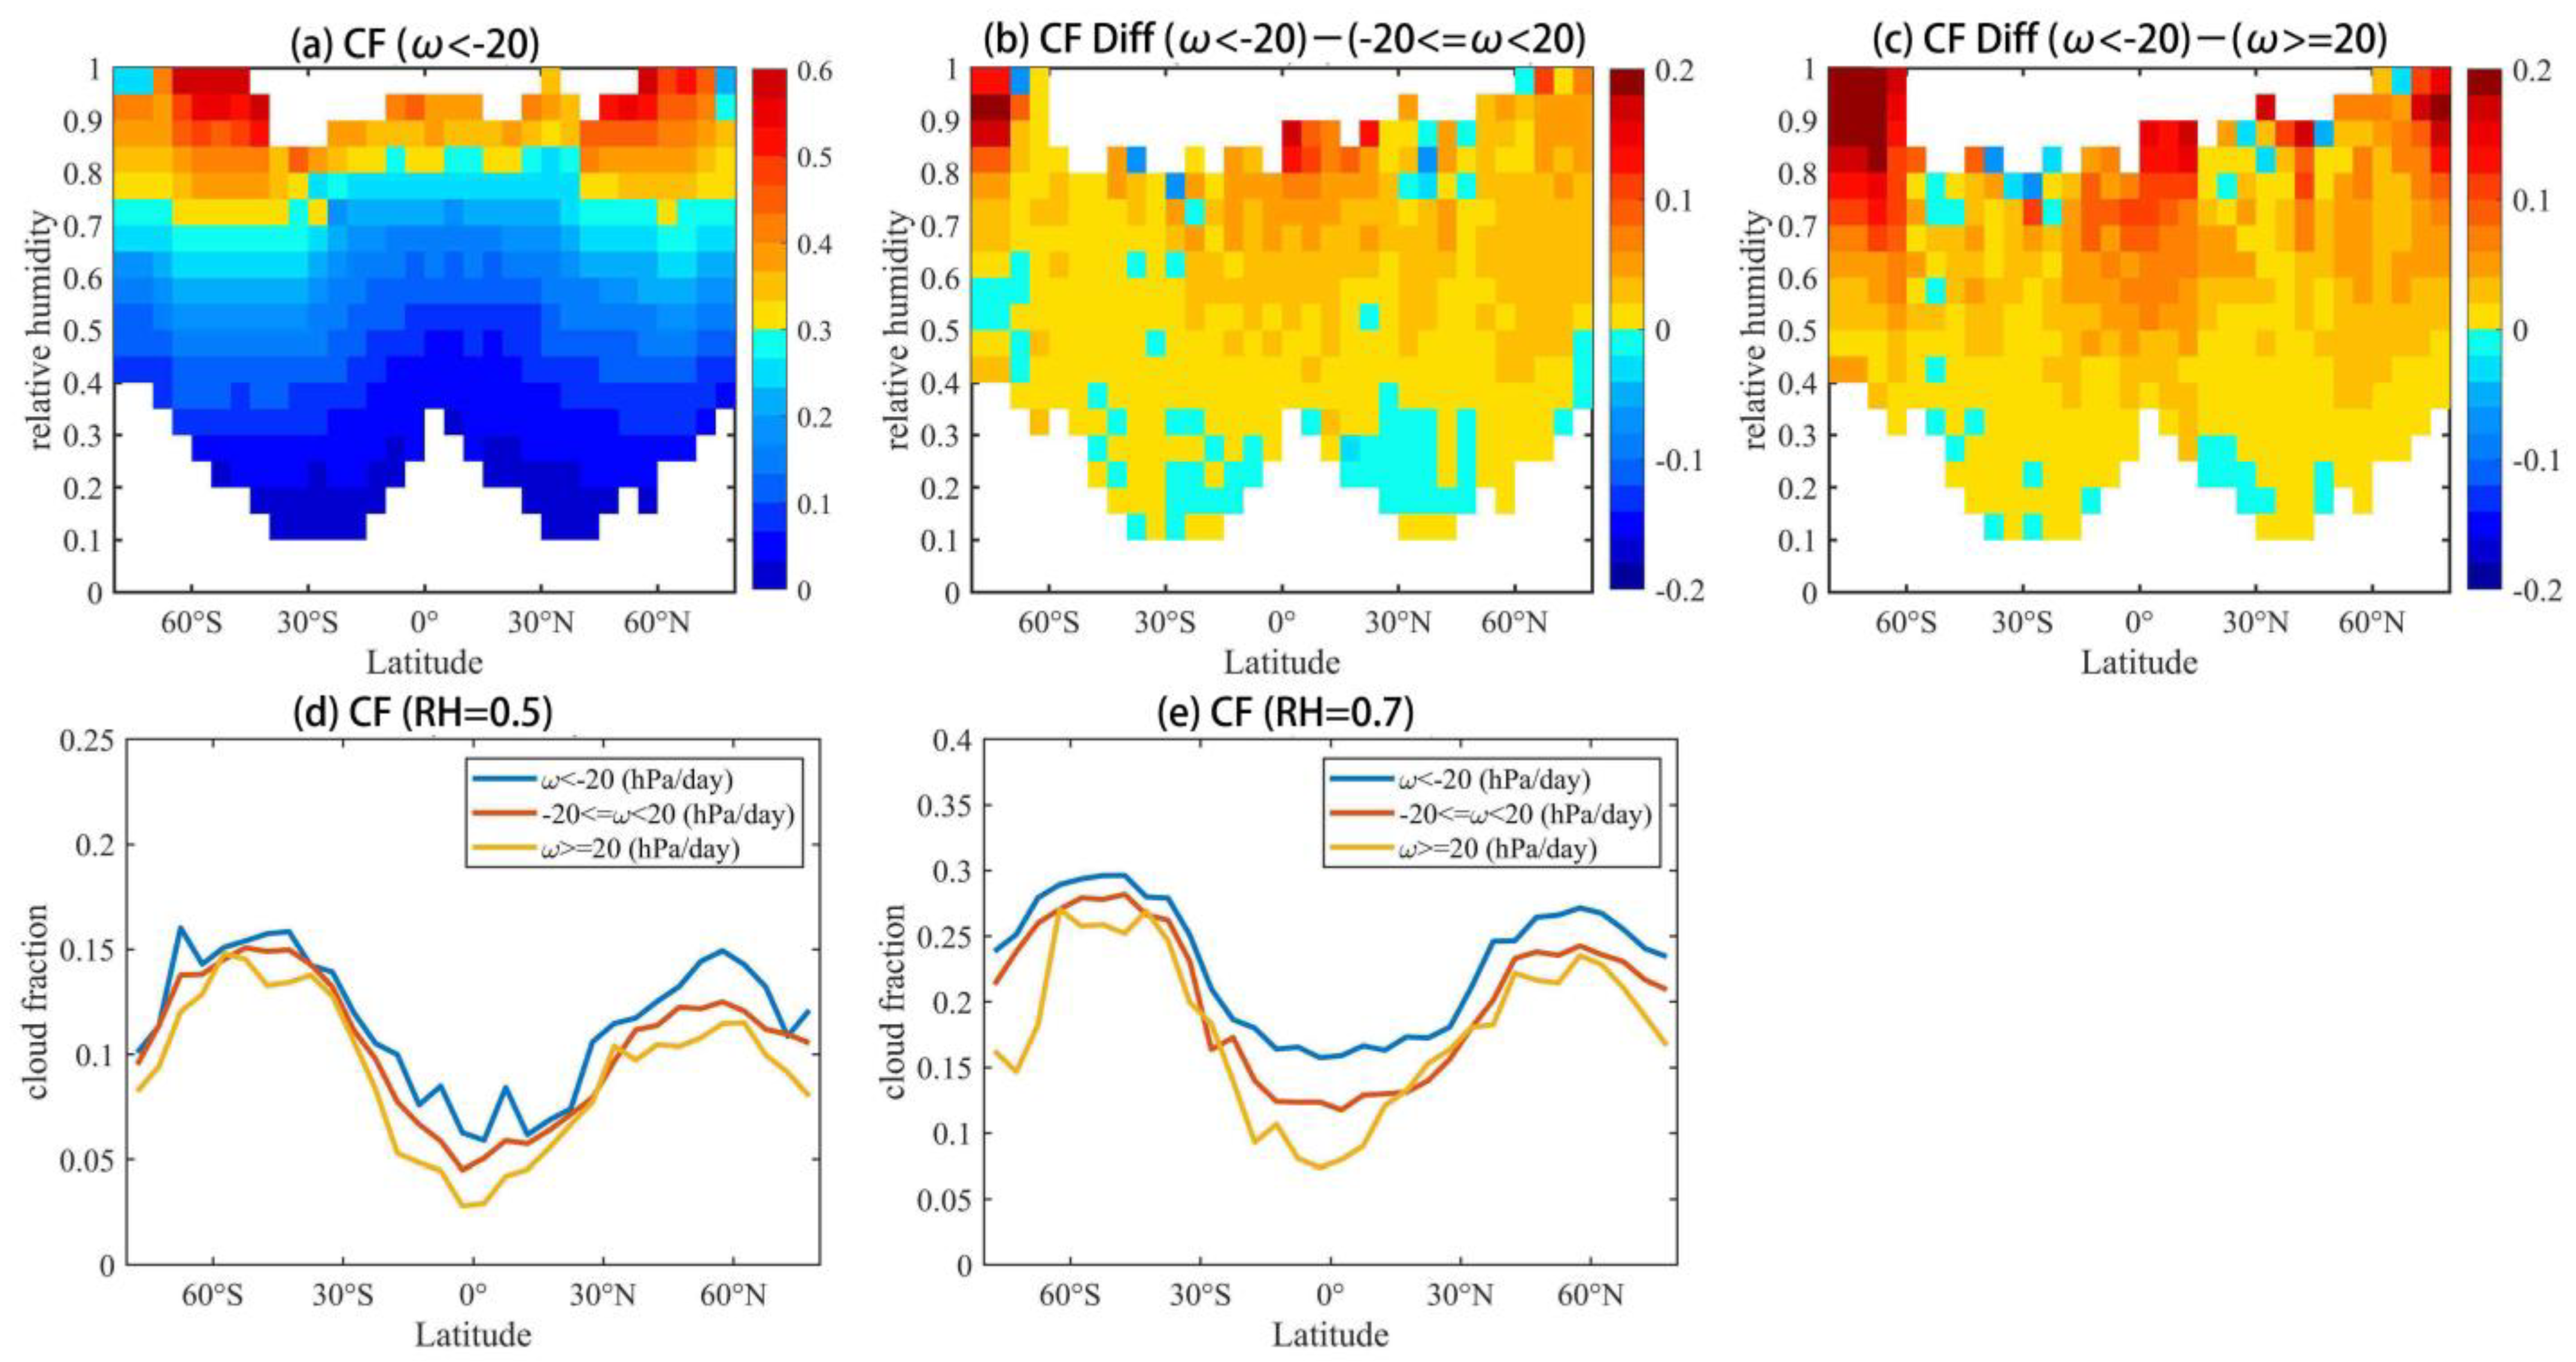
Synoptical-scale dynamic parameters have a crucial influence on cloud formation and cloud properties [69]. Several previous studies have shown that in-cloud updrafts can affect aerosol activation by influencing water vapour supersaturation and can provide large amounts of water vapour to cloud liquid [70,71,72,73]. To explore the effect of vertical velocity, we divided vertical velocity into three bins: ω < –20 hPa/day, –20 <= ω < 20 hPa/day, and ω >= 20 hPa/day. Note that the negative vertical velocity implies updraft in this study, and vice versa. The latitude-relative humidity cross-sections of the cloud fraction for different vertical velocity scenarios were then determined.
Figure 6 shows the latitude-relative humidity distribution of the cloud fraction for ω < –20 hPa/day at 700 hPa (Figure 6a) and the difference in the cloud fraction with the other two vertical velocity bins (Figure 6b–c). This figure also shows the latitudinal variation in the cloud fraction at different vertical velocities when the relative humidity is fixed at a certain value (Figure 6d–e). There were obvious differences in the cloud fraction under different vertical velocity conditions even if the relative humidity was the same. Generally, the stronger the upwards motion was, the larger the cloud fraction was, which was consistent with previous results. For example, Walcek et al. [74] found that the cloud fraction was positively correlated with large-scale vertical velocity and relative humidity through observations. Through aircraft observations, Yang et al. [75] found more total cloud droplets with stronger upwards motion. In addition, by analysing the observations from the Southern Great Plains of the United States during RACORO, Lu et al. [76] found that cloud droplet number concentration increased with increasing vertical velocity.
Notably, there are very few cases where strong upwards motion may inhibit cloud formation compared with downwards motion, corresponding to the negative values in Figure 6b,c. This may occur if the updraft is too strong and the water vapour is quickly lifted to higher altitudes without forming clouds. Bower et al. [77] also found that strong intracloud updrafts in convective clouds do not allow enough time for supercooled water droplets to convert to ice crystals, thus inhibiting ice formation. This could also be because the vertical velocity used in this study was a large-scale vertical motion that smoothed out many cloud-scale vertical motions [78]. The latitudinal variation in the cloud fraction at a given relative humidity (e.g., RH = 0.5; RH = 0.7) can be seen more clearly in Figure 6d,e. Regardless of the vertical velocity, more clouds were found at middle latitudes. However, there were few clouds in the subtropics, probably because cloud formation was inhibited by large-scale subsidence, controlled by the descending branch of the Hadley circulation [24,60]. Again, the stronger the upwards movement, the more clouds were found at the same relative humidity. It has also been suggested in a previous study that convective activity may contribute to high variance in the total-water path [79]. Our results showed that while the grid-averaged relative humidity was consistent, the subgrid variation in humidity varied considerably. Vertical velocity can facilitate water vapour transport and influence subgrid humidity variation. In general, upwards motion can promote cloud formation and increase subgrid humidity variability, but an updraft that is too strong can also be detrimental to cloud formation. Figure S9 shows the latitude-relative humidity distribution of the cloud fraction for ω < –20 hPa/day at 500 hPa (Figure S9a) and the difference in the cloud fraction with the other two vertical velocity bins (Figure S9b,c). It can be seen that this is consistent with the results of 700 hPa.
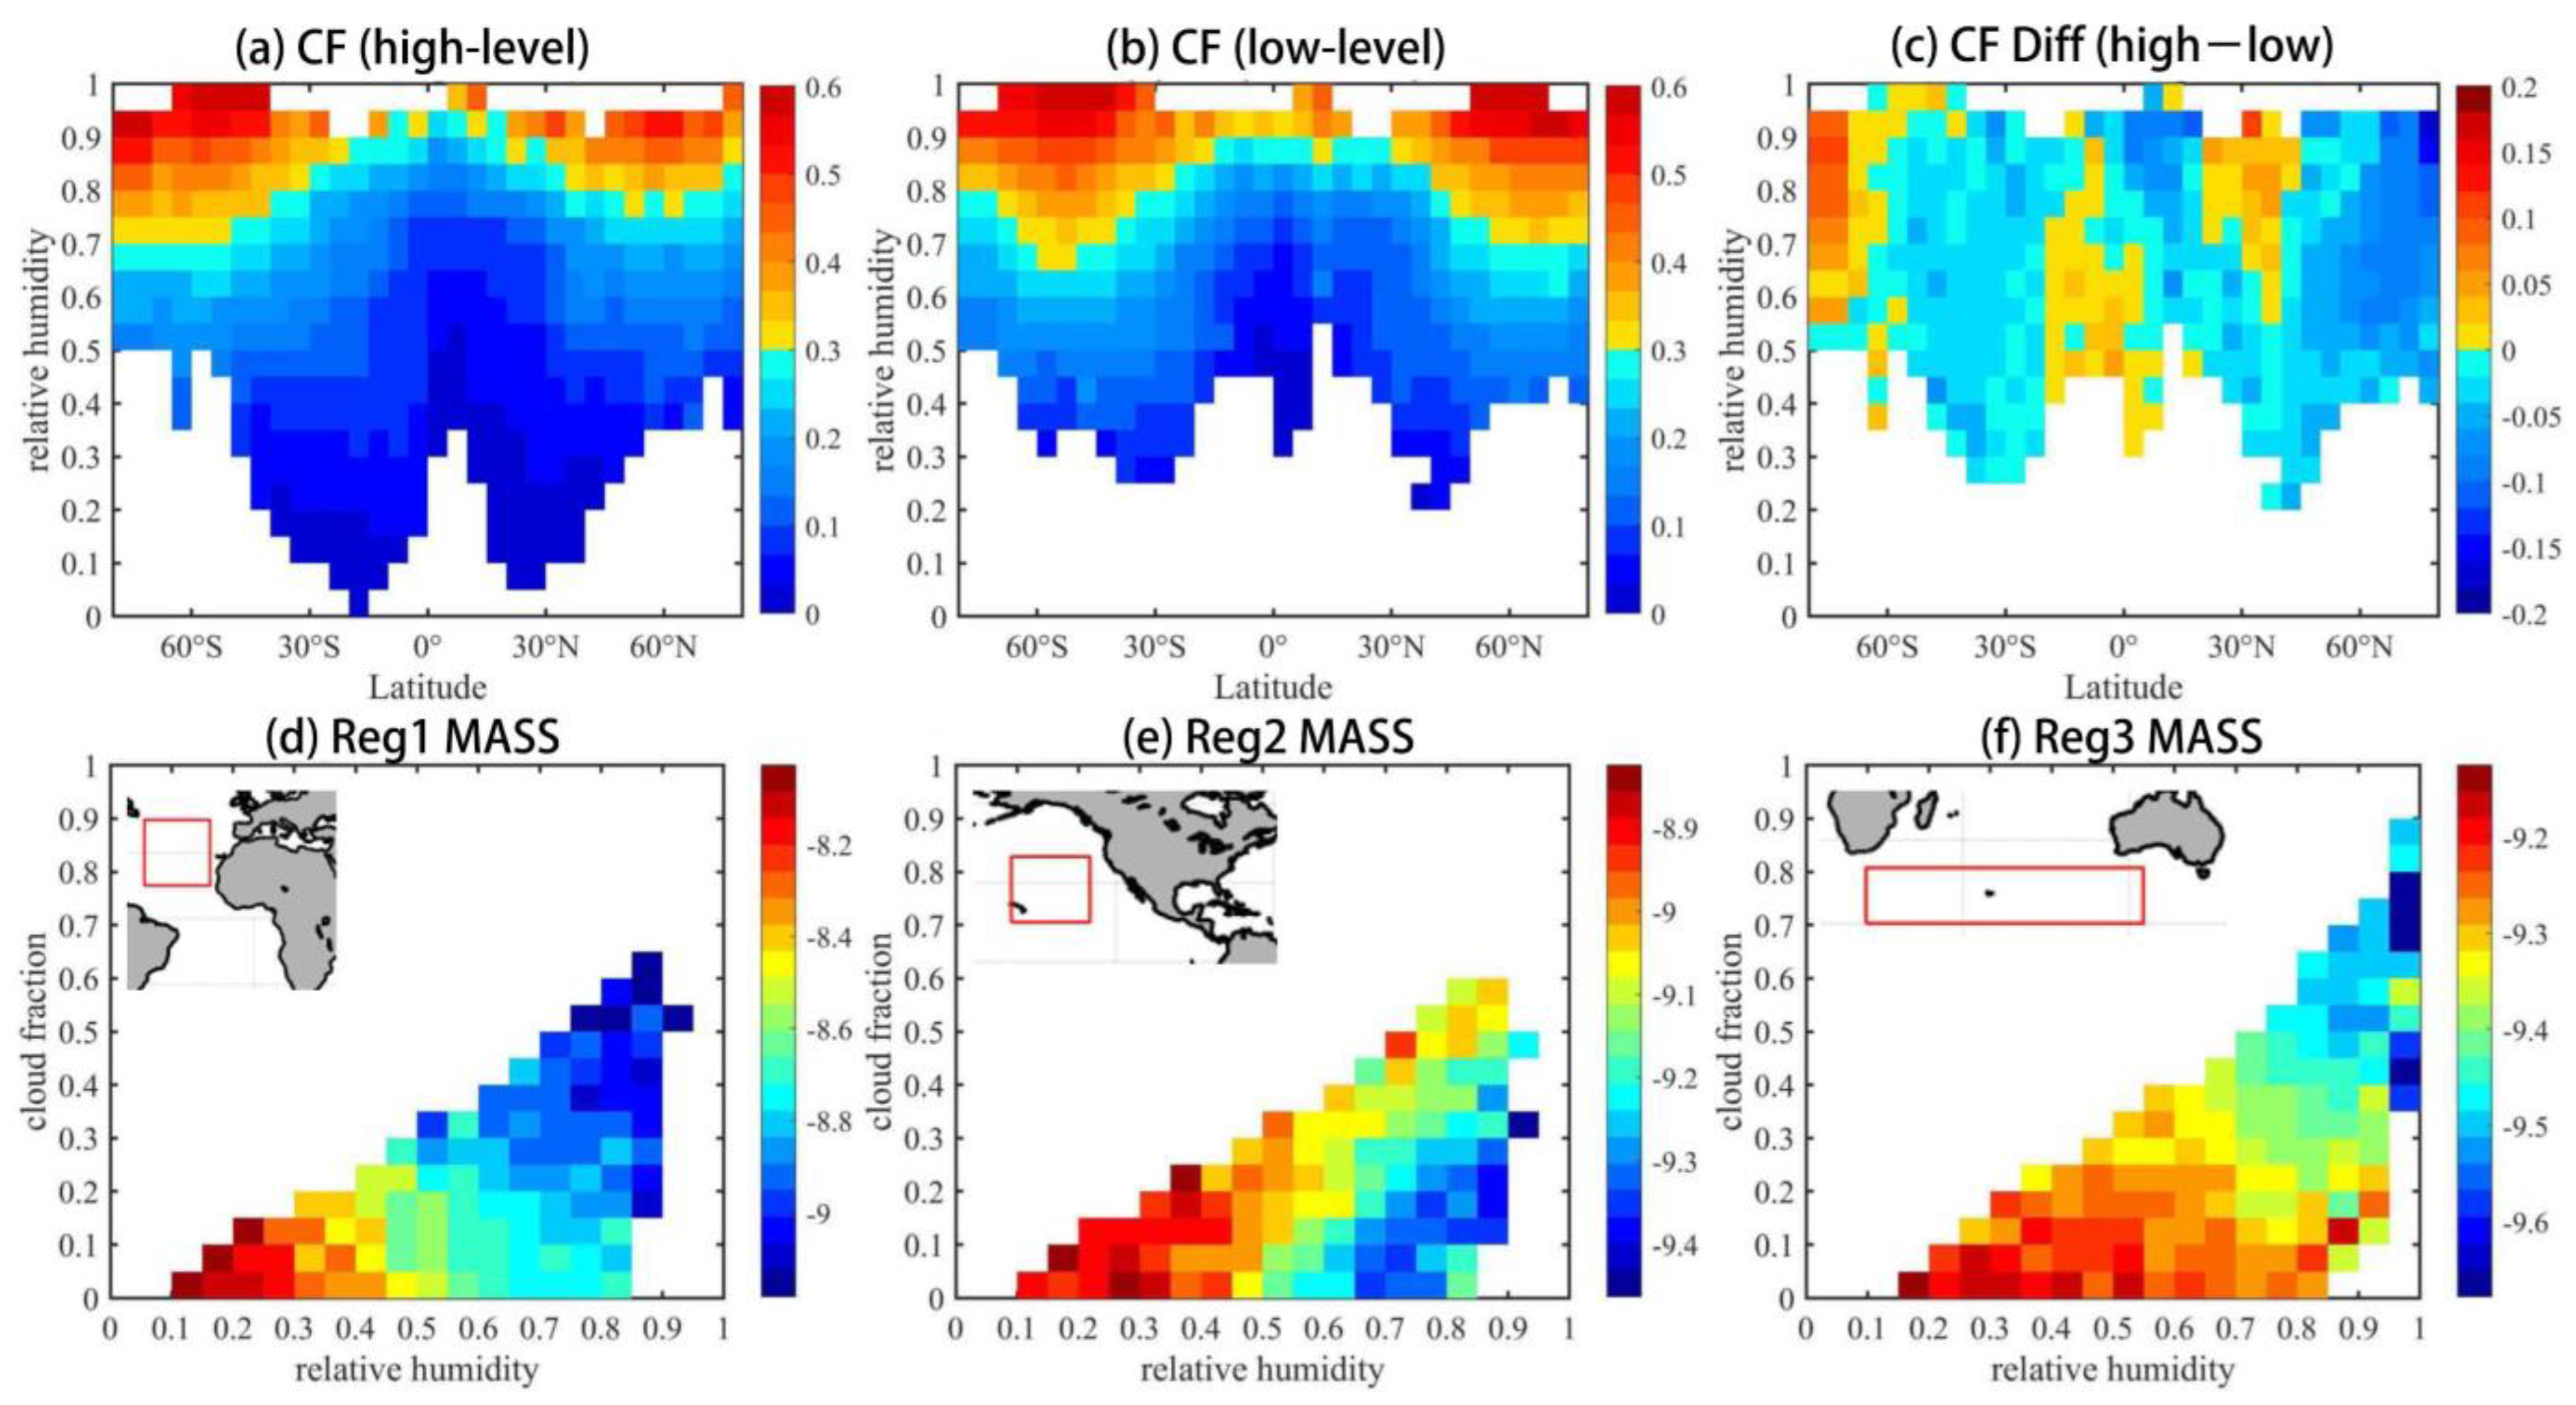
As cloud condensation nuclei, aerosols can modify the macro- and microphysical properties of clouds, with important implications for the hydrological cycle and global energy balance. An increasing number of climate models have also incorporated the effects of aerosols [80,81,82]. The effect of aerosols was also briefly discussed in this study. We used aerosol mass concentration data from MERRA-2. Based on previous studies [83,84], we selected only six types of aerosols: hydrophilic organic carbon (OC), hydrophilic black carbon (BC), smallest particles of dust (DU) and sea salt (SS), sulphur dioxide (SO2) and sulphate aerosol (SO4). Based on their 25th and 75th percentile mass concentrations, aerosol loadings were classified into two classes: high level and low level. The cloud fraction was considered the joint function of latitude and relative humidity, and its distributions at different aerosol levels over the given pressure level (here, as a sample, we provided only the results over 850 hPa) of the marine area are shown in Figure 7a,b. The region with no data indicates a sample size of less than 10 and was thus omitted. In addition, the 850 hPa layer was chosen to ensure, to the extent possible, that the clouds that were examined were water clouds. Similar to Figure 6, regardless of whether the aerosol concentration was high or low, the cloud fraction was higher in the middle latitudes and lower in the subtropics at consistent relative humidity. Figure 7c further exhibits the CF difference between high and low aerosol loadings. Notably, we have only selected regions for comparison for which values are available for both high and low aerosol loading.
For most cases, high concentrations of aerosols suppress cloud formation at the same relative humidity. This may be due to the direct and semidirect effects of absorbent aerosols (e.g., BC, DU). Absorbent aerosols can absorb shortwave solar radiation, thereby heating the atmosphere and causing evaporation of cloud droplets [85,86,87]. This process also increases the stability of the lower atmosphere, leading to weaker convection, which inhibits water vapour transport and is detrimental to cloud production [88,89,90,91]. In some cases, however, more clouds are found at high aerosol levels (corresponding to the positive values in Figure 7c,e,g, high latitudes of the Southern Hemisphere), which may be the result of aerosol microphysical effects. Aerosol particles can act as cloud condensation nuclei (CCN) to modify cloud formation and develop physical mechanisms of cloud formation [92]. Several studies have investigated the effects of SS, OC, BC and sulphate aerosols as CCN [93,94,95,96]. Increases in cloud fraction with aerosol concentration have also been observed in trade wind cumulus clouds, mixed types of clouds, shallow liquid clouds, and deep convective clouds [97,98,99,100,101,102]. Fan et al. [103] found that under the same initial dynamic and thermal conditions, a higher aerosol concentration led to increases in cloud droplet number concentration, cloud water content and cloud coverage and usually led to stronger convection, which was favourable to the increase in hydromorphic concentration.
Here, we selected three regional examples to further explore the impact of aerosols: the Northwest African Seas (15–45°N, 20–50°W; Reg1), Western North American Seas (15–40°N, 130–160°W; Reg2) and Southern Indian Ocean (40–60°S, 25–125°E; Reg3). The distribution of aerosol mass concentrations for different cloud fractions and relative humidity over the different regions is shown in Figure 7d–f, and the logarithm of the mass concentration with a base of ten is shown on the graph. We found that the effect of aerosols on clouds can vary from region to region. For areas with low relative humidity and cloud fraction, the aerosol mass concentrations are generally high. It may be that aerosols compete with each other for water vapour to the detriment of cloud droplet development [104]. At a higher relative humidity, low aerosol mass concentrations and high cloudiness were observed in Reg1 and Reg3, while the opposite pattern was observed in Reg2. Aerosol–cloud interaction (ACI) is a complex process that is influenced by atmospheric dynamics and thermal conditions [105], while aerosol properties such as aerosol absorption, hygroscopicity and size as well as cloud types can also influence ACI to some extent [106,107,108,109,110]. We further analysed the mass concentrations of different types of aerosols and vertical velocities in the three regions (figure not shown) and found that although the DU mass concentrations were greatest in all three areas, the vertical velocities differed significantly. Previous studies have shown that the ultimate effect of aerosols on clouds mainly involves a superposition of microphysical and radiative effects [111]. Kaufman and Koren [100] also noted that aerosols can both increase and decrease cloudiness and that this duality is one of the greatest uncertainties in climate research. At low aerosol loading, the microphysical effect is dominant, with aerosols acting as condensation nuclei to promote cloud formation, while as the CCN in the atmosphere becomes saturated, a further increase in aerosols will instead lead to enhanced radiative effects and reduced cloud fraction [112]. We briefly examined the effect of aerosols and found that for the same relative humidity levels, the aerosol concentration had different effects on the cloud fraction, which in turn may lead to differences in the RHc.

4. Discussion

In this study, we take the RHc from CloudSat and CALIPSO as true, but in fact, measurement error exists in any instrument that measures a target. Even with some potential bias, the cloud fraction profiles from CloudSat and CALIPSO are currently more accurate on a global scale compared to other datasets. Some previous studies have also used the RHc from CloudSat and CALIPSO as a proxy for truth values [20,24]. And we used the monthly averaged relative humidity to calculate RHc, which may introduce some uncertainty due to the significant variation of relative humidity within a month. Figure S10 shows the difference in RHc at 700 hPa layer when the relative humidity is the mean plus one standard deviation (a) and the mean minus one standard deviation (b). Positive (negative) values mean that the RHc obtained is greater (smaller) than the RHc obtained using the monthly averaged relative humidity. The bias due to relative humidity variations on a global scale is roughly between −0.37 and 0.5.
Based on the results shown in Figure 1, we found significant spatial variation in the RHc values. This result was consistent with that of Kahn and Teixeira [113], who studied the variation in temperature and specific humidity over a horizontal range of 150 to 1200 km using AIRS data. They also found that the subgrid-scale variability was greater in the mid-troposphere, that there was a clear difference in the variability between the inner tropics and subtropics, and that there was some evidence of land-sea contrast. For the bias in cloud fraction for reanalysis data and climate models, different assimilation schemes can lead to uncertainty in the cloud fraction. The 3D-FGAT reanalysis system with the Incremental Analysis Update is used in MERRA-2 [45]. To achieve optimal prediction, ERA5 uses 4D-var to assimilate many observations [114]. The use of more assimilated observations and improved schemes should theoretically produce higher-quality cloud products [115]. Additionally, climate models generally underestimate the cloud fraction in the lower troposphere and overestimate higher clouds, and differences in clouds between models are also greatest aloft in the tropics, which correlates with the representation of convection-related clouds in the models [116]. In recent work, Wang et al. [20] proposed a new RHc parameterization method that considers latitude and vertical variation. Applying this new scheme, the simulation of the cloud fraction was effectively improved, and a large impact on the simulation of cloud feedback was also found. But the authors did not take into account the effect of meteorological conditions, which is the possible real factor that leads to changes in RHc. Our study indicated that aerosol loading and meteorological factors can influence the dynamic environment and microphysical properties of clouds and further affect the relationship between relative humidity and cloud fraction, that is, RHc. Notably, in the context of climate change, the atmospheric circulation and dynamic conditions at different latitudes will change to some extent. Previous studies have noted that there will be a poleward expansion of the Hadley circulation [117], a shift of mid-latitude storm tracks towards the poles [118], and a weakening of the tropical atmospheric circulation [119] in response to global warming. In addition, with the push for stricter emission standards and the installation of flue gas desulphurisation devices, there will be significant changes in aerosol concentrations in the future [120,121,122,123]. Under global warming, it seems likely that natural aerosol emissions, such as organic and black carbon aerosols from wildfires and dust, will also increase due to an increase in dry and hot extremes and an increase in wind speeds [124,125,126]. These changes can lead to changes in meteorological factors, which in turn have an impact on the distribution of RHc. Therefore, although RHc parameterization based on latitude and pressure can improve the simulations of cloud fraction and cloud feedback, the impacts of aerosol and meteorological factors should also be considered in future work.

5. Conclusions

RHc is a very important parameter in cloud parameterization schemes. However, it has received relatively little attention. RHc is a measure of the subgrid-scale variation in humidity, which directly affects the cloud fraction. Based on 8 years of data (2008–2014) from CloudSat and CALIPSO, GOCCP, ERA-5, MERRA-2 and CMIP6 outputs, we explored the spatial distribution characteristics of RHc and its monthly variation in this study. We also assessed the ability of reanalysis data and climate models to represent the subgrid variation in humidity. The effect of vertical velocity and aerosols was also briefly examined. The main results are as follows.
Based on the results obtained from the combination of CloudSat and CALIPSO satellite data and ERA-5, RHc had a distinct geographical distribution. The tropical and polar regions had relatively high RHc values. The RHc in the subtropical region was lower, corresponding to the subtropical region having great subgrid variation in humidity. In addition, RHc was generally higher over land areas than over marine areas. A nonmonotonic vertical structure was also found, decreasing from the surface to the middle layer and then increasing in the upper layer. Moreover, RHc had significant monthly variations, which differed among latitudes and between the ocean and land. Other data sources largely reproduced the same spatial patterns as those of CloudSat and CALIPSO. However, there were large differences in the magnitude of the RHc values. Reanalysis data and climate models overestimated the RHc in the lower and middle troposphere, especially over the middle and high latitudes. Reanalysis and climate models essentially reproduced the monthly variation in RHc, but the temporal correlation of RHc between CloudSat and CALIPSO and these models was not good. To provide a reference for RHc parameterization, we also briefly explored the effects of vertical velocity and aerosols. It was found that different vertical velocities and aerosol concentrations could result in different cloud fraction, even when the relative humidity was the same. In general, the stronger the upwards movement, the greater the subgrid variation in humidity. However, the effect of aerosols was not stable and varied with different regions. Therefore, the effects of meteorological factors and aerosols must be accounted for in future parameterization of RHc.

Supplementary Materials

The following supporting information can be downloaded at https://www.mdpi.com/article/10.3390/rs15174187/s1, Figure S1: Latitude-pressure cross-section of the differences between MERRA2 and ERA-5. Figure S2: Geographical distribution of RHc derived from CloudSat and CALIPSO at selected temperature levels. Figure S3: The statistical results of RHc for pure water clouds and pure ice clouds. Figure S4: Longitude-pressure distribution of the zonal-averaged RHc from CloudSat andCALIPSO and the differences between CloudSat and CALIPSO and other datasets. Figure S5: Global mean profiles of RHc derived from CloudSat and CALIPSO, GOCCP, ERA-5, MERRA-2 and CMIP6 climate models. Figure S6: Month-pressure distribution of cloud fraction derived from CloudSat and CALIPSO in 4 different regions. Figure S7: Same as Figure S6, but for relative humidity. Figure S8: Taylor diagram for performance (spatial correlation) of spatial distributions of RHc from GOCCP, ERA5, MERRA-2, CMIP6MEM and 4 CMIP6 models compared with CloudSat and CALIPSO. Figure S9: Latitude-RH profiles of cloud fraction for ω < –20 hPa day–1, the differences with the other two vertical velocity bins. Figure S10: Deviation of RHc when relative humidity is mean plus standard deviation, and mean minus one standard deviation.

Author Contributions

J.L. conceptualised the experiment and revised the whole manuscript. W.Z. wrote the draft, drew the article graph, and analysed and interpreted the data. S.X. modified and checked the paper. Y.Z. and B.J. modified the paper. All authors have read and agreed to the published version of the manuscript.

Funding

This research was jointly supported by the Major Program of the National Natural Science Foundation of China (42090030), the National Science Fund for Excellent Young Scholars (42022037) and the Gansu Provincial Department of Education Outstanding Graduate Students “Innovation Star” Project (2023CXZX-001).

Data Availability Statement

The CloudSat and CALIPSO data can be downloaded from http://cloudsat.atmos.colostate.edu/data (accessed on 1 January 2023). The ERA-5 reanalysis is available at https://cds.climate.copernicus.eu/cdsapp#!/dataset/reanalysis-era5-pressure-levels (accessed on 5 January 2023). The MERRA-2 reanalysis is available at https://disc.gsfc.nasa.gov/datasets?keywords=MERRA-2 (accessed on 1 February 2023). The CMIP-6 products can be downloaded from https://esgf-node.llnl.gov/search/cmip6/ (accessed on 10 February 2023). The CALIPSO-GOCCP product is available at https://climserv.ipsl.polytechnique.fr/cfmip-obs/Calipso_goccp.html#3D_cloudFraction (accessed on 20 January 2023).

Acknowledgments

We would like to thank the CloudSat, CALIPSO, GOCCP, ERA-5, MERRA-2 and CMIP6 science teams for providing excellent and accessible data products that made this study possible. We are also grateful for the constructive comments from the editor and four anonymous reviewers that improved the quality of this paper.

Conflicts of Interest

The authors declare that they have no conflict of interest.

References

  1. Ramanathan, V.; Cess, R.D.; Harrison, E.F.; Minnis, P.; Barkstrom, B.R.; Ahmad, E.; Hartmann, D. Cloud-Radiative Forcing and Climate—Results from the Earth Radiation Budget Experiment. Science 1989, 243, 57–63. [Google Scholar] [CrossRef]
  2. Stephens, G.L. Cloud feedbacks in the climate system: A critical review. J. Clim. 2005, 18, 237–273. [Google Scholar] [CrossRef]
  3. Tompkins, A.M. A prognostic parameterization for the subgrid-scale variability of water vapor and clouds in large-scale models and its use to diagnose cloud cover. J. Atmos. Sci. 2002, 59, 1917–1942. [Google Scholar] [CrossRef]
  4. Cheng, A.; Xu, K.-M. Improved Low-Cloud Simulation from the Community Atmosphere Model with an Advanced Third-Order Turbulence Closure. J. Clim. 2015, 28, 5737–5762. [Google Scholar] [CrossRef]
  5. Qin, Y.; Lin, Y.L.; Xu, S.M.; Ma, H.Y.; Xie, S.C. A Diagnostic PDF Cloud Scheme to Improve Subtropical Low Clouds in NCAR Community Atmosphere Model (CAM5). J. Adv. Model. Earth Syst. 2018, 10, 320–341. [Google Scholar] [CrossRef]
  6. Lin, Y.; Huang, X.; Liang, Y.; Qin, Y.; Xu, S.; Huang, W.; Xu, F.; Liu, L.; Wang, Y.; Peng, Y.; et al. Community Integrated Earth System Model (CIESM): Description and Evaluation. J. Adv. Model. Earth Syst. 2020, 12, e2019MS002036. [Google Scholar] [CrossRef]
  7. Andrews, T.; Gregory, J.M.; Webb, M.J.; Taylor, K.E. Forcing, feedbacks and climate sensitivity in CMIP5 coupled atmosphere-ocean climate models. Geophys. Res. Lett. 2012, 39, L09712. [Google Scholar] [CrossRef]
  8. Seinfeld, J.H.; Bretherton, C.; Carslaw, K.S.; Coe, H.; DeMott, P.J.; Dunlea, E.J.; Feingold, G.; Ghan, S.; Guenther, A.B.; Kahn, R.; et al. Improving our fundamental understanding of the role of aerosol-cloud interactions in the climate system. Proc. Natl. Acad. Sci. USA 2016, 113, 5781–5790. [Google Scholar] [CrossRef]
  9. Stevens, B.; Sherwood, S.C.; Bony, S.; Webb, M.J. Prospects for narrowing bounds on Earth’s equilibrium climate sensitivity. Earths Future 2016, 4, 512–522. [Google Scholar] [CrossRef]
  10. Naud, C.M.; Rangwala, I.; Xu, M.; Miller, J.R. A Satellite View of the Radiative Impact of Clouds on Surface Downward Fluxes in the Tibetan Plateau. J. Appl. Meteorol. Climatol. 2015, 54, 479–493. [Google Scholar] [CrossRef]
  11. Tompkins, A. The parametrization of cloud cover. ECMWF Moist Process. Lect. Note Ser. Tech. Memo 2005, 25, 1–23. [Google Scholar]
  12. Sundqvist, H.; Berge, E.; Kristjansson, J.E. Condensation and Cloud Parameterization Studies with a Mesoscale Numerical Weather Prediction Model. Mon. Weather Rev. 1989, 117, 1641–1657. [Google Scholar] [CrossRef]
  13. Quaas, J. Evaluating the “critical relative humidity” as a measure of subgrid-scale variability of humidity in general circulation model cloud cover parameterizations using satellite data. J. Geophys. Res. Atmos. 2012, 117, D09208. [Google Scholar] [CrossRef]
  14. Chen, G.X.; Wang, W.C.; Yang, S.X.; Wang, Y.X.; Zhang, F.; Wu, K. A Neural Network-Based Scale-Adaptive Cloud-Fraction Scheme for GCMs. J. Adv. Model. Earth Syst. 2023, 15, e2022MS003415. [Google Scholar] [CrossRef]
  15. Schmidt, G.A.; Ruedy, R.; Hansen, J.E.; Aleinov, I.; Bell, N.; Bauer, M.; Bauer, S.; Cairns, B.; Canuto, V.; Cheng, Y.; et al. Present-day atmospheric simulations using GISS ModelE: Comparison to in situ, satellite, and reanalysis data. J. Clim. 2006, 19, 153–192. [Google Scholar] [CrossRef]
  16. Scinocca, J.F.; McFarlane, N.A.; Lazare, M.; Li, J.; Plummer, D. Technical Note: The CCCma third generation AGCM and its extension into the middle atmosphere. Atmos. Chem. Phys. 2008, 8, 7055–7074. [Google Scholar] [CrossRef]
  17. Stevens, B.; Giorgetta, M.; Esch, M.; Mauritsen, T.; Crueger, T.; Rast, S.; Salzmann, M.; Schmidt, H.; Bader, J.; Block, K.; et al. Atmospheric component of the MPI-M Earth System Model: ECHAM6. J. Adv. Model. Earth Syst. 2013, 5, 146–172. [Google Scholar] [CrossRef]
  18. Wang, X.C.; Liu, Y.M.; Bao, Q.; Wu, G.X. Comparisons of GCM cloud cover parameterizations with cloud-resolving model explicit simulations. Sci. China-Earth Sci. 2015, 58, 604–614. [Google Scholar] [CrossRef]
  19. Wang, Y.X.; Yang, S.X.; Chen, G.X.; Bao, Q.; Li, J.D. Evaluating two diagnostic schemes of cloud-fraction parameterization using the CloudSat data. Atmos. Res. 2023, 282, 106510. [Google Scholar] [CrossRef]
  20. Wang, X.C.; Miao, H.; Liu, Y.M.; Bao, Q.; He, B.; Li, J.X.; Zhao, Y.X. The Use of Satellite Data-Based “Critical Relative Humidity” in Cloud Parameterization and Its Role in Modulating Cloud Feedback. J. Adv. Model. Earth Syst. 2022, 14, e2022MS003213. [Google Scholar] [CrossRef]
  21. Hazra, A.; Chaudhari, H.S.; Rao, S.A.; Goswami, B.N.; Dhakate, A.; Pokhrel, S.; Saha, S.K. Impact of revised cloud microphysical scheme in CFSv2 on the simulation of the Indian summer monsoon. Int. J. Climatol. 2015, 35, 4738–4755. [Google Scholar] [CrossRef]
  22. De, S.; Hazra, A.; Chaudhari, H.S. Does the modification in “critical relative humidity” of NCEP CFSv2 dictate Indian mean summer monsoon forecast? Evaluation through thermodynamical and dynamical aspects. Clim. Dyn. 2016, 46, 1197–1222. [Google Scholar] [CrossRef]
  23. Xu, K.M.; Krueger, S.K. Evaluation Of Cloudiness Parameterizations Using a Cumulus Ensemble Model. Mon. Weather Rev. 1991, 119, 342–367. [Google Scholar] [CrossRef]
  24. Miao, H.; Wang, X.C.; Liu, Y.M.; Wu, G.X. An evaluation of cloud vertical structure in three reanalyses against CloudSat/cloud-aerosol lidar and infrared pathfinder satellite observations. Atmos. Sci. Lett. 2019, 20, e906. [Google Scholar] [CrossRef]
  25. Vignesh, P.P.; Jiang, J.H.; Pangaluru, K.; Su, H.; Smay, T.; Brighton, N.; Velicogna, I. Assessment of CMIP6 Cloud Fraction and Comparison with Satellite Observations. Earth Space Sci. 2020, 7, e2019EA000975. [Google Scholar] [CrossRef]
  26. Li, J.D.; Sun, Z.A.; Liu, Y.M.; You, Q.L.; Chen, G.X.; Bao, Q. Top-of-Atmosphere Radiation Budget and Cloud Radiative Effects Over the Tibetan Plateau and Adjacent Monsoon Regions From CMIP6 Simulations. J. Geophys. Res. Atmos. 2021, 126, e2020JD034345. [Google Scholar] [CrossRef]
  27. Naud, C.M.; Del Genio, A.D.; Bauer, M.; Kovari, W. Cloud Vertical Distribution across Warm and Cold Fronts in CloudSat-CALIPSO Data and a General Circulation Model. J. Clim. 2010, 23, 3397–3415. [Google Scholar] [CrossRef]
  28. Van Weverberg, K.; Boutle, I.A.; Morcrette, C.J.; Newsom, R.K. Towards retrieving critical relative humidity from ground-based remote-sensing observations. Q. J. R. Meteorol. Soc. 2016, 142, 2867–2881. [Google Scholar] [CrossRef]
  29. Stephens, G.L.; Vane, D.G.; Tanelli, S.; Im, E.; Durden, S.; Rokey, M.; Reinke, D.; Partain, P.; Mace, G.G.; Austin, R.; et al. CloudSat mission: Performance and early science after the first year of operation. J. Geophys. Res. Atmos. 2008, 113, D00A18. [Google Scholar] [CrossRef]
  30. Winker, D.M.; Vaughan, M.A.; Omar, A.; Hu, Y.X.; Powell, K.A.; Liu, Z.Y.; Hunt, W.H.; Young, S.A. Overview of the CALIPSO Mission and CALIOP Data Processing Algorithms. J. Atmos. Ocean. Technol. 2009, 26, 2310–2323. [Google Scholar] [CrossRef]
  31. Mace, G.G.; Zhang, Q.Q.; Vaughan, M.; Marchand, R.; Stephens, G.; Trepte, C.; Winker, D. A description of hydrometeor layer occurrence statistics derived from the first year of merged Cloudsat and CALIPSO data. J. Geophys. Res. Atmos. 2009, 114, D00A26. [Google Scholar] [CrossRef]
  32. Mace, G.G.; Zhang, Q.Q. The CloudSat radar-lidar geometrical profile product (RL-GeoProf): Updates, improvements, and selected results. J. Geophys. Res. Atmos. 2014, 119, 9441–9462. [Google Scholar] [CrossRef]
  33. Barker, H.W. Overlap of fractional cloud for radiation calculations in GCMs: A global analysis using CloudSat and CALIPSO data. J. Geophys. Res. Atmos. 2008, 113, D00A01. [Google Scholar] [CrossRef]
  34. Di Giuseppe, F.; Tompkins, A.M. Generalizing Cloud Overlap Treatment to Include the Effect of Wind Shear. J. Atmos. Sci. 2015, 72, 2865–2876. [Google Scholar] [CrossRef]
  35. Cesana, G.; Chepfer, H. How well do climate models simulate cloud vertical structure? A comparison between CALIPSO-GOCCP satellite observations and CMIP5 models. Geophys. Res. Lett. 2012, 39, L20803. [Google Scholar] [CrossRef]
  36. Cesana, G.; Waliser, D.E.; Jiang, X.; Li, J.L.F. Multimodel evaluation of cloud phase transition using satellite and reanalysis data. J. Geophys. Res. Atmos. 2015, 120, 7871–7892. [Google Scholar] [CrossRef]
  37. Chepfer, H.; Bony, S.; Winker, D.; Chiriaco, M.; Dufresne, J.L.; Seze, G. Use of CALIPSO lidar observations to evaluate the cloudiness simulated by a climate model. Geophys. Res. Lett. 2008, 35, L15704. [Google Scholar] [CrossRef]
  38. Chepfer, H.; Bony, S.; Winker, D.; Cesana, G.; Dufresne, J.L.; Minnis, P.; Stubenrauch, C.J.; Zeng, S. The GCM-Oriented CALIPSO Cloud Product (CALIPSO-GOCCP). J. Geophys. Res. Atmos. 2010, 115, D00H16. [Google Scholar] [CrossRef]
  39. Lacour, A.; Chepfer, H.; Shupe, M.D.; Miller, N.B.; Noel, V.; Kay, J.; Turner, D.D.; Guzman, R. Greenland Clouds Observed in CALIPSO-GOCCP: Comparison with Ground-Based Summit Observations. J. Clim. 2017, 30, 6065–6083. [Google Scholar] [CrossRef]
  40. Cesana, G.; Chepfer, H.; Winker, D.; Getzewich, B.; Cai, X.; Jourdan, O.; Mioche, G.; Okamoto, H.; Hagihara, Y.; Noel, V.; et al. Using in situ airborne measurements to evaluate three cloud phase products derived from CALIPSO. J. Geophys. Res. Atmos. 2016, 121, 5788–5808. [Google Scholar] [CrossRef]
  41. Wang, F.; Xin, X.G.; Wang, Z.Z.; Cheng, Y.J.; Zhang, J.; Yang, S. Evaluation of cloud vertical structure simulated by recent BCC_AGCM versions through comparison with CALIPSO-GOCCP data. Adv. Atmos. Sci. 2014, 31, 721–733. [Google Scholar] [CrossRef]
  42. Yin, J.F.; Wang, D.H.; Xu, H.B.; Zhai, G.Q. An investigation into the three-dimensional cloud structure over East Asia from the CALIPSO-GOCCP Data. Sci. China-Earth Sci. 2015, 58, 2236–2248. [Google Scholar] [CrossRef]
  43. Boudala, F.S.; Milbrandt, J.A.; Isaac, G.A. Evaluation of CanESM Cloudiness, Cloud Type and Cloud Radiative Forcing Climatologies Using the CALIPSO-GOCCP and CERES Datasets. Remote Sens. 2022, 14, 3668. [Google Scholar] [CrossRef]
  44. Hersbach, H.; Bell, B.; Berrisford, P.; Hirahara, S.; Horanyi, A.; Munoz-Sabater, J.; Nicolas, J.; Peubey, C.; Radu, R.; Schepers, D.; et al. The ERA5 global reanalysis. Q. J. R. Meteorol. Soc. 2020, 146, 1999–2049. [Google Scholar] [CrossRef]
  45. Gelaro, R.; McCarty, W.; Suarez, M.J.; Todling, R.; Molod, A.; Takacs, L.; Randles, C.A.; Darmenov, A.; Bosilovich, M.G.; Reichle, R.; et al. The Modern-Era Retrospective Analysis for Research and Applications, Version 2 (MERRA-2). J. Clim. 2017, 30, 5419–5454. [Google Scholar] [CrossRef] [PubMed]
  46. Rotstayn, L.D. Climate sensitivity of the CSIRO GCM: Effect of cloud modeling assumptions. J. Clim. 1999, 12, 334–356. [Google Scholar] [CrossRef]
  47. Marchand, R.; Mace, G.G.; Ackerman, T.; Stephens, G. Hydrometeor detection using Cloudsat—An earth-orbiting 94-GHz cloud radar. J. Atmos. Ocean. Technol. 2008, 25, 519–533. [Google Scholar] [CrossRef]
  48. Ham, S.-H.; Kato, S.; Rose, F.G.; Winker, D.; L’Ecuyer, T.; Mace, G.G.; Painemal, D.; Sun-Mack, S.; Chen, Y.; Miller, W.F. Cloud occurrences and cloud radiative effects (CREs) from CERES-CALIPSO-CloudSat-MODIS (CCCM) and CloudSat radar-lidar (RL) products. J. Geophys. Res. Atmos. 2017, 122, 8852–8884. [Google Scholar] [CrossRef]
  49. Li, J.D.; Mao, J.Y.; Wang, F. Comparative study of five current reanalyses in characterizing total cloud fraction and top-of-the-atmosphere cloud radiative effects over the Asian monsoon region. Int. J. Climatol. 2017, 37, 5047–5067. [Google Scholar] [CrossRef]
  50. Zhao, Y.; Li, J.; Zhang, L.; Deng, C.; Li, Y.; Jian, B.; Huang, J. Diurnal cycles of cloud cover and its vertical distribution over the Tibetan Plateau revealed by satellite observations, reanalysis datasets, and CMIP6 outputs. Atmos. Chem. Phys. 2023, 23, 743–769. [Google Scholar] [CrossRef]
  51. Naud, C.M.; Booth, J.F.; Del Genio, A.D. Evaluation of ERA-Interim and MERRA Cloudiness in the Southern Ocean. J. Clim. 2014, 27, 2109–2124. [Google Scholar] [CrossRef]
  52. Tan, Z.H.; Ma, S.; Wang, X.; Liu, Y.D.; Ai, W.H.; Yan, W. Estimating Layered Cloud Cover from Geostationary Satellite Radiometric Measurements: A Novel Method and Its Application. Remote Sens. 2022, 14, 5693. [Google Scholar] [CrossRef]
  53. Wu, H.P.; Xu, X.F.; Luo, T.Y.; Yang, Y.D.; Xiong, Z.X.; Wang, Y. Variation and comparison of cloud cover in MODIS and four reanalysis datasets of ERA-interim, ERA5, MERRA-2 and NCEP. Atmos. Res. 2023, 281, 106477. [Google Scholar] [CrossRef]
  54. Molod, A. Constraints on the Profiles of Total Water PDF in AGCMs from AIRS and a High-Resolution Model. J. Clim. 2012, 25, 8341–8352. [Google Scholar] [CrossRef]
  55. Yeo, H.; Kim, M.H.; Son, S.W.; Jeong, J.H.; Yoon, J.H.; Kim, B.M.; Kim, S.W. Arctic cloud properties and associated radiative effects in the three newer reanalysis datasets (ERA5, MERRA-2, JRA-55): Discrepancies and possible causes. Atmos. Res. 2022, 270, 106080. [Google Scholar] [CrossRef]
  56. Tiedtke, M. Representation of Clouds in Large-Scale Models. Mon. Weather Rev. 1993, 121, 3040–3061. [Google Scholar] [CrossRef]
  57. Binder, H.; Boettcher, M.; Joos, H.; Sprenger, M.; Wernli, H. Vertical cloud structure of warm conveyor belts–a comparison and evaluation of ERA5 reanalysis, CloudSat and CALIPSO data. Weather Clim. Dyn. 2020, 1, 577–595. [Google Scholar] [CrossRef]
  58. Chen, G.; Wang, W.-C.; Bao, Q.; Li, J. Evaluation of Simulated Cloud Diurnal Variation in CMIP6 Climate Models. J. Geophys. Res. Atmos. 2022, 127, e2021JD036422. [Google Scholar] [CrossRef]
  59. Zhao, Y.; Li, J.M.; Zhang, W.Y.; Deng, C.; Li, Y.R. Cloud Response Is Significantly Biased by CMIP6 Over the Tibetan Plateau. Geophys. Res. Lett. 2022, 49, e2022GL100903. [Google Scholar] [CrossRef]
  60. Mahlobo, D.D.; Ndarana, T.; Grab, S.; Engelbrecht, F. Integrated climatology and trends in the subtropical Hadley cell, sunshine duration and cloud cover over South Africa. Int. J. Climatol. 2019, 39, 1805–1821. [Google Scholar] [CrossRef]
  61. Carrillo, J.; Guerra, J.C.; Cuevas, E.; Barrancos, J. Characterization of the Marine Boundary Layer and the Trade-Wind Inversion over the Sub-tropical North Atlantic. Bound. Layer Meteorol. 2016, 158, 311–330. [Google Scholar] [CrossRef]
  62. Sherwood, S.C.; Roca, R.; Weckwerth, T.M.; Andronova, N.G. TROPOSPHERIC WATER VAPOR, CONVECTION, AND CLIMATE. Rev. Geophys. 2010, 48, RG2001. [Google Scholar] [CrossRef]
  63. Zhang, D.M.; Wang, Z.; Liu, D. A global view of midlevel liquid-layer topped stratiform cloud distribution and phase partition from CALIPSO and CloudSat measurements. J. Geophys. Res. Atmos. 2010, 115, D00H13. [Google Scholar] [CrossRef]
  64. Cesana, G.; Chepfer, H. Evaluation of the cloud thermodynamic phase in a climate model using CALIPSO-GOCCP. J. Geophys. Res. Atmos. 2013, 118, 7922–7937. [Google Scholar] [CrossRef]
  65. Stengel, M.; Schlundt, C.; Stapelberg, S.; Sus, O.; Eliasson, S.; Willen, U.; Meirink, J.F. Comparing ERA-Interim clouds with satellite observations using a simplified satellite simulator. Atmos. Chem. Phys. 2018, 18, 17601–17614. [Google Scholar] [CrossRef]
  66. Wright, J.S.; Sun, X.Y.; Konopka, P.; Kruger, K.; Legras, B.; Molod, A.M.; Tegtmeier, S.; Zhang, G.J.; Zhao, X. Differences in tropical high clouds among reanalyses: Origins and radiative impacts. Atmos. Chem. Phys. 2020, 20, 8989–9030. [Google Scholar] [CrossRef]
  67. Huang, J.; Guan, X.; Ji, F. Enhanced cold-season warming in semi-arid regions. Atmos. Chem. Phys. 2012, 12, 5391–5398. [Google Scholar] [CrossRef]
  68. Taylor, K.E. Summarizing multiple aspects of model performance in a single diagram. J. Geophys. Res. Atmos. 2001, 106, 7183–7192. [Google Scholar] [CrossRef]
  69. Noel, V.; Chepfer, H. A global view of horizontally oriented crystals in ice clouds from Cloud-Aerosol Lidar and Infrared Pathfinder Satellite Observation (CALIPSO). J. Geophys. Res. Atmos. 2010, 115, D00H23. [Google Scholar] [CrossRef]
  70. Twomey, S. The nuclei of natural cloud formation part II: The supersaturation in natural clouds and the variation of cloud droplet concentration. Geofis. Pura E Appl. 1959, 43, 243–249. [Google Scholar] [CrossRef]
  71. Shupe, M.D.; Matrosov, S.Y.; Uttal, T. Arctic mixed-phase cloud properties derived from surface-based sensors at SHEBA. J. Atmos. Sci. 2006, 63, 697–711. [Google Scholar] [CrossRef]
  72. Reutter, P.; Su, H.; Trentmann, J.; Simmel, M.; Rose, D.; Gunthe, S.S.; Wernli, H.; Andreae, M.O.; Poschl, U. Aerosol- and updraft-limited regimes of cloud droplet formation: Influence of particle number, size and hygroscopicity on the activation of cloud condensation nuclei (CCN). Atmos. Chem. Phys. 2009, 9, 7067–7080. [Google Scholar] [CrossRef]
  73. Liu, Y.Z.; Huang, J.P.; Wang, T.H.; Li, J.M.; Yan, H.R.; He, Y.L. Aerosol-cloud interactions over the Tibetan Plateau: An overview. Earth-Sci. Rev. 2022, 234, 104216. [Google Scholar] [CrossRef]
  74. Walcek, C.J. Cloud Cover and Its Relationship to Relative-Humidity during a Springtime Midlatitude Cyclone. Mon. Weather Rev. 1994, 122, 1021–1035. [Google Scholar] [CrossRef]
  75. Yang, Y.; Zhao, C.F.; Dong, X.B.; Fan, G.C.; Zhou, Y.Q.; Wang, Y.; Zhao, L.J.; Lv, F.; Yan, F. Toward understanding the process-level impacts of aerosols on microphysical properties of shallow cumulus cloud using aircraft observations. Atmos. Res. 2019, 221, 27–33. [Google Scholar] [CrossRef]
  76. Lu, C.S.; Liu, Y.G.; Niu, S.J.; Vogelmann, A.M. Observed impacts of vertical velocity on cloud microphysics and implications for aerosol indirect effects. Geophys. Res. Lett. 2012, 39, L21808. [Google Scholar] [CrossRef]
  77. Bower, K.N.; Moss, S.J.; Johnson, D.W.; Choularton, T.W.; Latham, J.; Brown, P.R.A.; Blyth, A.M.; Cardwell, J. A parametrization of the ice water content observed in frontal and convective clouds. Q. J. R. Meteorol. Soc. 1996, 122, 1815–1844. [Google Scholar] [CrossRef]
  78. Li, J.; Lv, Q.; Zhang, M.; Wang, T.; Kawamoto, K.; Chen, S.; Zhang, B. Effects of atmospheric dynamics and aerosols on the fraction of supercooled water clouds. Atmos. Chem. Phys. 2017, 17, 1847–1863. [Google Scholar] [CrossRef]
  79. Weber, T.; Quaas, J.; Raisanen, P. Evaluation of the statistical cloud scheme in the ECHAM5 model using satellite data. Q. J. R. Meteorol. Soc. 2011, 137, 2079–2091. [Google Scholar] [CrossRef]
  80. Rotstayn, L.D.; Liu, Y.G. A smaller global estimate of the second indirect aerosol effect. Geophys. Res. Lett. 2005, 32, L05708. [Google Scholar] [CrossRef]
  81. Lohmann, U.; Stier, P.; Hoose, C.; Ferrachat, S.; Kloster, S.; Roeckner, E.; Zhang, J. Cloud microphysics and aerosol indirect effects in the global climate model ECHAM5-HAM. Atmos. Chem. Phys. 2007, 7, 3425–3446. [Google Scholar] [CrossRef]
  82. Morrison, H.; Gettelman, A. A new two-moment bulk stratiform cloud microphysics scheme in the community atmosphere model, version 3 (CAM3). Part I: Description and numerical tests. J. Clim. 2008, 21, 3642–3659. [Google Scholar] [CrossRef]
  83. Li, J.M.; Jian, B.D.; Huang, J.P.; Hu, Y.X.; Zhao, C.F.; Kawamoto, K.; Liao, S.J.; Wu, M. Long-term variation of cloud droplet number concentrations from space-based Lidar. Remote Sens. Environ. 2018, 213, 144–161. [Google Scholar] [CrossRef]
  84. Jian, B.; Li, J.; Wang, G.; Zhao, Y.; Li, Y.; Wang, J.; Zhang, M.; Huang, J. Evaluation of the CMIP6 marine subtropical stratocumulus cloud albedo and its controlling factors. Atmos. Chem. Phys. 2021, 21, 9809–9828. [Google Scholar] [CrossRef]
  85. Huang, J.P.; Lin, B.; Minnis, P.; Wang, T.H.; Wang, X.; Hu, Y.X.; Yi, Y.H.; Ayers, J.K. Satellite-based assessment of possible dust aerosols semi-direct effect on cloud water path over East Asia. Geophys. Res. Lett. 2006, 33, L19802. [Google Scholar] [CrossRef]
  86. Koch, D.; Del Genio, A.D. Black carbon semi-direct effects on cloud cover: Review and synthesis. Atmos. Chem. Phys. 2010, 10, 7685–7696. [Google Scholar] [CrossRef]
  87. Sakaeda, N.; Wood, R.; Rasch, P.J. Direct and semidirect aerosol effects of southern African biomass burning aerosol. J. Geophys. Res. Atmos. 2011, 116, D12205. [Google Scholar] [CrossRef]
  88. Menon, S.; Hansen, J.; Nazarenko, L.; Luo, Y.F. Climate effects of black carbon aerosols in China and India. Science 2002, 297, 2250–2253. [Google Scholar] [CrossRef] [PubMed]
  89. Johnson, B.T.; Shine, K.P.; Forster, P.M. The semi-direct aerosol effect: Impact of absorbing aerosols on marine stratocumulus. Q. J. R. Meteorol. Soc. 2004, 130, 1407–1422. [Google Scholar] [CrossRef]
  90. Zhang, Y.; Fu, R.; Yu, H.B.; Dickinson, R.E.; Juarez, R.N.; Chin, M.; Wang, H. A regional climate model study of how biomass burning aerosol impacts land-atmosphere interactions over the Amazon. J. Geophys. Res. Atmos. 2008, 113, D14S15. [Google Scholar] [CrossRef]
  91. Fan, J.W.; Rosenfeld, D.; Yang, Y.; Zhao, C.; Leung, L.R.; Li, Z.Q. Substantial contribution of anthropogenic air pollution to catastrophic floods in Southwest China. Geophys. Res. Lett. 2015, 42, 6066–6075. [Google Scholar] [CrossRef]
  92. Twomey, S. The Influence of Pollution on the Shortwave Albedo of Clouds. J. Atmos. Sci. 1977, 34, 1149–1152. [Google Scholar] [CrossRef]
  93. Lammel, G.; Novakov, T. Water Nucleation Properties of Carbon-Black and Diesel Soot Particles. Atmos. Environ. 1995, 29, 813–823. [Google Scholar] [CrossRef]
  94. Odowd, C.D.; Smith, M.H.; Consterdine, I.E.; Lowe, J.A. Marine aerosol, sea-salt, and the marine sulphur cycle: A short review. Atmos. Environ. 1997, 31, 73–80. [Google Scholar] [CrossRef]
  95. Sun, J.M.; Ariya, P.A. Atmospheric organic and bio-aerosols as cloud condensation nuclei (CCN): A review. Atmos. Environ. 2006, 40, 795–820. [Google Scholar] [CrossRef]
  96. Ruehl, C.R.; Davies, J.F.; Wilson, K.R. An interfacial mechanism for cloud droplet formation on organic aerosols. Science 2016, 351, 1447–1450. [Google Scholar] [CrossRef] [PubMed]
  97. Koren, I.; Kaufman, Y.J.; Remer, L.A.; Martins, J.V. Measurement of the effect of Amazon smoke on inhibition of cloud formation. Science 2004, 303, 1342–1345. [Google Scholar] [CrossRef]
  98. Kaufman, Y.J.; Koren, I.; Remer, L.A.; Rosenfeld, D.; Rudich, Y. The effect of smoke, dust, and pollution aerosol on shallow cloud development over the Atlantic Ocean. Proc. Natl. Acad. Sci. USA 2005, 102, 11207–11212. [Google Scholar] [CrossRef]
  99. Koren, I.; Kaufman, Y.J.; Rosenfeld, D.; Remer, L.A.; Rudich, Y. Aerosol invigoration and restructuring of Atlantic convective clouds. Geophys. Res. Lett. 2005, 32, L14828. [Google Scholar] [CrossRef]
  100. Kaufman, Y.J.; Koren, I. Smoke and pollution aerosol effect on cloud cover. Science 2006, 313, 655–658. [Google Scholar] [CrossRef] [PubMed]
  101. Myhre, G.; Stordal, F.; Johnsrud, M.; Kaufman, Y.J.; Rosenfeld, D.; Storelvmo, T.; Kristjansson, J.E.; Berntsen, T.K.; Myhre, A.; Isaksen, I.S.A. Aerosol-cloud interaction inferred from MODIS satellite data and global aerosol models. Atmos. Chem. Phys. 2007, 7, 3081–3101. [Google Scholar] [CrossRef]
  102. Yuan, T.; Remer, L.A.; Yu, H. Microphysical, macrophysical and radiative signatures of volcanic aerosols in trade wind cumulus observed by the A-Train. Atmos. Chem. Phys. 2011, 11, 7119–7132. [Google Scholar] [CrossRef]
  103. Fan, J.W.; Zhang, R.Y.; Li, G.H.; Tao, W.K. Effects of aerosols and relative humidity on cumulus clouds. J. Geophys. Res. Atmos. 2007, 112, D14204. [Google Scholar] [CrossRef]
  104. Zhao, C.; Yang, Y.; Chi, Y.; Sun, Y.; Zhao, X.; Letu, H.; Xia, Y. Recent progress in cloud physics and associated radiative effects in China from 2016 to 2022. Atmos. Res. 2023, 293, 106899. [Google Scholar] [CrossRef]
  105. Fan, J.W.; Wang, Y.; Rosenfeld, D.; Liu, X.H. Review of Aerosol-Cloud Interactions: Mechanisms, Significance, and Challenges. J. Atmos. Sci. 2016, 73, 4221–4252. [Google Scholar] [CrossRef]
  106. Dusek, U.; Frank, G.P.; Hildebrandt, L.; Curtius, J.; Schneider, J.; Walter, S.; Chand, D.; Drewnick, F.; Hings, S.; Jung, D.; et al. Size matters more than chemistry for cloud-nucleating ability of aerosol particles. Science 2006, 312, 1375–1378. [Google Scholar] [CrossRef]
  107. Almeida, G.P.; Brito, J.; Morales, C.A.; Andrade, M.F.; Artaxo, P. Measured and modelled cloud condensation nuclei (CCN) concentration in Sao Paulo, Brazil: The importance of aerosol size-resolved chemical composition on CCN concentration prediction. Atmos. Chem. Phys. 2014, 14, 7559–7572. [Google Scholar] [CrossRef]
  108. Liu, J.J.; Li, Z.Q. Aerosol properties and their influences on low warm clouds during the Two-Column Aerosol Project. Atmos. Chem. Phys. 2019, 19, 9515–9529. [Google Scholar] [CrossRef]
  109. Zheng, X.J.; Xi, B.K.; Dong, X.Q.; Logan, T.; Wang, Y.; Wu, P. Investigation of aerosol-cloud interactions under different absorptive aerosol regimes using Atmospheric Radiation Measurement (ARM) southern Great Plains (SGP) ground-based measurements. Atmos. Chem. Phys. 2020, 20, 3483–3501. [Google Scholar] [CrossRef]
  110. Zhao, C.F.; Wang, Y.; Letu, H. New Progress and Challenges in Cloud-Aerosol-Radiation-Precipitation Interactions: Preface for a Special Issue. Adv. Atmos. Sci. 2022, 39, 1983–1985. [Google Scholar] [CrossRef]
  111. Koren, I.; Martins, J.V.; Remer, L.A.; Afargan, H. Smoke invigoration versus inhibition of clouds over the Amazon. Science 2008, 321, 946–949. [Google Scholar] [CrossRef]
  112. Guo, J.P.; Su, T.N.; Li, Z.Q.; Miao, Y.C.; Li, J.; Liu, H.; Xu, H.; Cribb, M.; Zhai, P.M. Declining frequency of summertime local-scale precipitation over eastern China from 1970 to 2010 and its potential link to aerosols. Geophys. Res. Lett. 2017, 44, 5700–5708. [Google Scholar] [CrossRef]
  113. Kahn, B.H.; Teixeira, J. A Global Climatology of Temperature and Water Vapor Variance Scaling from the Atmospheric Infrared Sounder. J. Clim. 2009, 22, 5558–5576. [Google Scholar] [CrossRef]
  114. Long, C.S.; Fujiwara, M.; Davis, S.; Mitchell, D.M.; Wright, C.J. Climatology and interannual variability of dynamic variables in multiple reanalyses evaluated by the SPARC Reanalysis Intercomparison Project (S-RIP). Atmos. Chem. Phys. 2017, 17, 14593–14629. [Google Scholar] [CrossRef]
  115. Hersbach, H. Global reanalysis: Goodbye ERA-Interim, hello ERA5. ECMWF Newsl. 2019, 159, 17. [Google Scholar]
  116. Qian, Y.; Long, C.N.; Wang, H.; Comstock, J.M.; McFarlane, S.A.; Xie, S. Evaluation of cloud fraction and its radiative effect simulated by IPCC AR4 global models against ARM surface observations. Atmos. Chem. Phys. 2012, 12, 1785–1810. [Google Scholar] [CrossRef]
  117. Lu, J.; Vecchi, G.A.; Reichler, T. Expansion of the Hadley cell under global warming. Geophys. Res. Lett. 2007, 34, L06805. [Google Scholar] [CrossRef]
  118. Yin, J.H. A consistent poleward shift of the storm tracks in simulations of 21st century climate. Geophys. Res. Lett. 2005, 32, L18701. [Google Scholar] [CrossRef]
  119. Vecchi, G.A.; Soden, B.J. Global warming and the weakening of the tropical circulation. Bull. Am. Meteorol. Soc. 2007, 88, 1529–1530. [Google Scholar]
  120. Lei, Y.; Zhang, Q.; He, K.B.; Streets, D.G. Primary anthropogenic aerosol emission trends for China, 1990–2005. Atmos. Chem. Phys. 2011, 11, 931–954. [Google Scholar] [CrossRef]
  121. Klimont, Z.; Smith, S.J.; Cofala, J. The last decade of global anthropogenic sulfur dioxide: 2000–2011 emissions. Environ. Res. Lett. 2013, 8, 014003. [Google Scholar] [CrossRef]
  122. Krotkov, N.A.; McLinden, C.A.; Li, C.; Lamsal, L.N.; Celarier, E.A.; Marchenko, S.V.; Swartz, W.H.; Bucsela, E.J.; Joiner, J.; Duncan, B.N.; et al. Aura OMI observations of regional SO2 and NO2 pollution changes from 2005 to 2015. Atmos. Chem. Phys. 2016, 16, 4605–4629. [Google Scholar] [CrossRef]
  123. Li, J. Pollution Trends in China from 2000 to 2017: A Multi-Sensor View from Space. Remote Sens. 2020, 12, 208. [Google Scholar] [CrossRef]
  124. Paasonen, P.; Asmi, A.; Petaja, T.; Kajos, M.K.; Aijala, M.; Junninen, H.; Holst, T.; Abbatt, J.P.D.; Arneth, A.; Birmili, W.; et al. Warming-induced increase in aerosol number concentration likely to moderate climate change. Nat. Geosci. 2013, 6, 438–442. [Google Scholar] [CrossRef]
  125. Touma, D.; Stevenson, S.; Lehner, F.; Coats, S. Human-driven greenhouse gas and aerosol emissions cause distinct regional impacts on extreme fire weather. Nat. Commun. 2021, 12, 212. [Google Scholar] [CrossRef] [PubMed]
  126. Li, J.; Carlson, B.E.; Yung, Y.L.; Lv, D.R.; Hansen, J.; Penner, J.E.; Liao, H.; Ramaswamy, V.; Kahn, R.A.; Zhang, P.; et al. Scattering and absorbing aerosols in the climate system. Nat. Rev. Earth Environ. 2022, 3, 363–379. [Google Scholar] [CrossRef]
Figure 1. Geographical distribution of RHc at selected pressure levels derived (a1a5) from CloudSat and CALIPSO and the differences between the CloudSat and CALIPSO and (b1b5) GOCCP, (c1c5) ERA5, (d1d5) MERRA2 and (e1e5) CMIP6 models. Positive (negative) values indicate that a given dataset provides larger (smaller) RHc values than those of CloudSat and CALIPSO.
Remotesensing 15 04187 g001
Figure 2. Latitude-pressure cross-section of the zonal mean RHc from (a) CloudSat and CALIPSO and the differences between CloudSat and CALIPSO and (b) GOCCP, (c) ERA-5, (d) MERRA-2, and (e) CMIP6 models.
Remotesensing 15 04187 g002
Figure 3. Month–pressure distribution of RHc derived from CloudSat and CALIPSO in 12 different regions. Columns from left to right indicate low (30°S–0°S, or 0°N–30°N), middle (30–60°N[S]) and high (60–90°N[S]) latitudes. The results for the Northern Hemisphere (NH) are shown in (af), and those for the Southern Hemisphere (SH) are shown in (gl).
Remotesensing 15 04187 g003
Figure 4. Spatial correlation coefficients between seasonal variation of other data and CloudSat and CALIPSO for the twelve regions in Figure 3.
Remotesensing 15 04187 g004
Figure 5. The global distributions of the temporal correlation of RHc between CC and GOCCP (a1a4), ERA5 (b1b4), MEM (c1c4), and MERRA2 (d1d4) at four pressure layers. Regions with no data indicate that the data for the RHc time series in the grid are less than 20 or the correlation coefficient is not significant, so the default value is substituted.
Remotesensing 15 04187 g005
Figure 6. Latitude-RH profiles of cloud fraction for ω < –20 hPa day–1 (a), the differences with the other two vertical velocity bins (be). Zonal mean cloud fraction when the relative humidity equals 0.5 (d) and 0.7 (e).
Remotesensing 15 04187 g006
Figure 7. Latitude–RH distributions of cloud fraction for high aerosol concentrations (a), low aerosol concentrations (b), and the difference between them (c). Variation in aerosol concentration with cloud fraction and relative humidity at (d) Reg1 (15–45°N, 20–50°W), (e) Reg2 (15–40°N, 130–160°W), and (f) Reg3 (40–60°S, 25–125°E). The colour bar for (df) indicates the logarithm of the aerosol mass concentration with a base of ten.
Remotesensing 15 04187 g007
Table 1. The variables and resolution of the datasets.
DataHorizontal Resolution
(Latitude × Longitude)
Variables
CloudSat and CALIPSOorbital profilesCF
GOCCP2° × 2°CF
MERRA-20.5° × 0.625°CF; RH; Aerosol Mixing
Ratios
ERA-50.25° × 0.25°CF; RH; W
The CMIP-6 model names and their horizontal resolutions
Source IDHorizontal Resolution
(Latitude × Longitude)
Variables
BCC-CSM2-MR1.12° × 1.125°CF
GFDL-CM41° × 1.25°CF
IPSL-CM6A-LR1.258° × 2.5°CF
MRI-ESM2-01.115° × 1.125°CF
Disclaimer/Publisher’s Note: The statements, opinions and data contained in all publications are solely those of the individual author(s) and contributor(s) and not of MDPI and/or the editor(s). MDPI and/or the editor(s) disclaim responsibility for any injury to people or property resulting from any ideas, methods, instructions or products referred to in the content.