Article

Mid-Long-Term Prediction of Surface Seawater Organic Carbon in the Southern South China Sea Based on Multi-Applicability CNN-LSTM Prediction Model

1
Institute of Marine Development of Ocean University of China, Qingdao 266100, China
2
College of Marxism, Ocean University of China, Qingdao 266100, China
3
College of Oceanic and Atmospheric Sciences, Ocean University of China, Qingdao 266100, China
4
School of Marine Science and Technology, Tianjin University, Tianjin 300072, China
5
Institute of Coastal Environmental Pollution Control, College of Environmental Science and Engineering, Key Laboratory of Marine Environment and Ecology, Ministry of Education, Frontiers Science Center for Deep Ocean Multispheres and Earth System, Ocean University of China, Qingdao 266100, China
6
Sanya Oceanographic Institution, Ocean University of China, Sanya 572000, China
*
Author to whom correspondence should be addressed.
These authors contributed equally to this work.
Remote Sens. 2023, 15(17), 4218; https://doi.org/10.3390/rs15174218
Submission received: 10 June 2023 / Revised: 15 August 2023 / Accepted: 21 August 2023 / Published: 28 August 2023

Abstract

:
The organic carbon pool is a crucial component of the ocean carbon cycle. The study of organic carbon distribution and interannual variability in the land-sea interface can contribute to understanding the global ocean carbon cycle and ecological effects in the context of the Anthropocene and help achieve the Sustainable Development Goals (SDGs). At present, there has been a certain amount of research on the source and flux of carbon in the ocean carbon cycle, but the prediction of marine carbon is still in its infancy. In this paper, a CNN-LSTM deep learning model that takes into account spatio-temporal features was used to make a 5-year mid-long-term rolling prediction of particulate organic carbon (POC) and yellow matter (CDOM) using MODIS Level 2 semimonthly synthetic data from the official website of NASA from January 2002 to June 2020. The model uses chlorophyll-a data to adjust the parameters. The results showed that the model could also be applied to the mid-long-term rolling prediction of POC and CDOM. The model was capable of accurately predicting POC and CDOM over periods of three and two years, respectively (R > 0.5). Meanwhile, the 5-year trends of the predicted and actual values were verified using the least squares method and the Mann-Kendall trend test. The results showed that the predicted and actual values of sea surface POC and CDOM in 2015–2020 showed an overall upward trend. The surface-level POC and CDOM in the ocean are considered to be related to primary production. The mid-long-term prediction of surface seawater organic carbon in the southern South China Sea helps humans explore the regional characteristics of organic carbon in the coral reef waters of the South China Sea and study the changing trend of surface seawater organic carbon.

Graphical Abstract

1. Introduction

Particulate organic carbon (POC) and dissolved organic carbon (DOC) are carbon compounds found at the land-ocean interface that originate from the decomposition of living organisms. They have been extensively studied by researchers such as Siegenthaler et al. [1] and Wu et al. [2], who have recognized their significance in understanding carbon cycling. Additionally, POC and DOC play crucial roles in marine ecosystems, as highlighted by studies conducted by Mopper et al. [3], Hansell and Carlson [4], and Kowalczuk et al. [5]. The concentration of POC, when compared to the total organic carbon (TOC), typically represents a relatively small portion, averaging around 4% [2,6]. The flux of POC holds significant importance as it serves as a key indicator of the effectiveness of the oceanic biological pump, as emphasized by Shih et al. [7]. It is widely accepted that new products in the upper ocean are typically offset by the sinking of POC, according to studies conducted by Eppley and Peterson [8] and Pan and Wong [9]. The POC:Chl-a ratio is generally considered a valuable indicator of the ecological and physiological status of the phytoplankton community [10]. Approximately 97% of organic carbon in the ocean is found in dissolved form as dissolved organic matter (DOM), as indicated by studies by Hansell and Carlson [11] and Kowalczuk et al. [5]. In both freshwater and marine systems, DOC represents one of the largest reservoirs of cycling organic matter on Earth [12,13,14]. Recent research has brought attention to the potential underestimation of the role of DOC in the ocean’s carbon cycle [15,16]. Studies conducted by Hansell and Carlson [11], Ducklow et al. [17], and Pan and Wong suggest that the export of DOC from the surface ocean to deeper seas may be comparable to the export of POC [9]. In subtropical regions, recent studies have revealed that the proportion of organic carbon exports attributable to the transport of DOC may exceed 50% of the total carbon export [18,19,20].
The marginal sea covers only 7% of the ocean’s surface area, but its contributions to global ocean primary productivity, nutrient remineralization, and burial of calcium carbonate and organic carbon are much higher in proportion [21,22], making the marginal sea a key area for global carbon cycle studies. Gaining insights into and effectively managing the mechanisms and processes associated with POC and DOC in marginal seas is of utmost importance for comprehending the global carbon cycle [5,23]. The South China Sea (SCS) is a vast tropical marginal sea located within the Pacific Ocean, as indicated by research conducted by Chen et al. [24] and Wong et al. [25]. The SCS has been identified as a significant source of atmospheric CO2, as emphasized by studies conducted by Chen et al. [24], Dai et al. [26], and Dai et al. [27]. Its significance in the global carbon cycle is underscored by research conducted by Wang et al. [28]. High levels of organic carbon content are observed throughout the SCS [28]. The flux and degradation of organic carbon play a significant role in shaping microbial communities within the ocean and have far-reaching implications for the carbon cycle in the SCS [2]. Our understanding of carbon cycling in coral reef systems in the SCS is currently limited due to the lack of research on the distribution and seasonal variations of organic carbon in this region, as emphasized by Zhu et al. [29]. In the face of increasingly serious ocean acidification, coral reef bleaching is severe, and nearly two-thirds of coral reefs are at risk of extinction [30,31]. Further investigations are needed to fill this knowledge gap and enhance our understanding of the carbon cycle in coral reef systems in the SCS.
Previous research on POC in the Chinese offshore region has predominantly concentrated on investigating its sources, distribution patterns, and composition [32]. Some studies have also attempted to explore the dynamics of POC further [33]. There are relatively few studies on the spatial prediction of POC at home and abroad, mainly focusing on the prediction of POC flux [34]. There are also some attempts to predict POC content [35], but they focus on predicting POC in seabed sediments. A study conducted by Diesing et al. [36] involved the use of a random forest model to predict the amount of organic carbon present in the surface sediments of the Northwestern European continental shelf. Seiter et al. [37] conducted a study to predict the total organic carbon content at the top layer of deep-sea sediments globally. They employed a combination of qualitative and quantitative statistical methods with a spatial resolution of 1° × 1°. Regarding long-term predictions, Dzierzbicka-Glowacka et al. [38] conducted a study focusing on long-term predictions of POC concentration in the southern Baltic Sea. They utilized a one-dimensional particulate organic carbon model (1D POC) and analyzed POC concentration trends from 1965 to 1998. Based on these observations, the researchers generated scenarios for POC concentration in the year 2050. However, the study focused on generating future POC concentration scenarios using a modeling approach based on historical trends but did not provide a direct validation of these predictions against observed data.
In recent years, there has been a notable increase in research efforts dedicated to investigating marine DOM, as highlighted by studies conducted by Kowalczuk et al. [5] and Yang et al. [39]. The Joint Global Ocean Flux Study (JGOFS) has made significant strides in unraveling the temporal and spatial variations of DOC in the marine system. Through extensive research, as emphasized by Jeandel et al. [40], JGOFS has successfully identified and characterized the sources and sinks of DOC across different time scales. For many years, researchers have been actively engaged in studying the sources and fluxes of DOC, as evidenced by studies conducted by Aitkenhead et al. [41], Fu et al. [42], and Birkel et al. [43]. Additionally, scholars have been striving to develop methods for predicting DOC concentration based on its absorbance characteristics [44,45,46,47]. This line of research aims to establish a relationship between the optical properties of water and DOC concentration. In the past, the surface distribution of DOC in the ocean has been assessed through the analysis of discrete water samples collected during individual research cruises, as outlined by Hansell and Carlson [4]. However, this method provides limited spatial and temporal coverage as it relies on data from a single cruise [48]. To overcome the limitations of traditional sampling methods, researchers have suggested the use of satellite remote sensing to estimate DOC concentrations in the ocean. Specifically, the retrieval of yellow matter, known as Chromophoric Dissolving Organic Matter (CDOM), from satellite data has been proposed as a potential method to achieve higher spatial and temporal resolution in monitoring DOC levels [5,48,49,50,51]. This approach, as proposed by Ferrari [52], leverages the spectral characteristics of CDOM to estimate DOC concentrations over large areas. By utilizing satellite remote sensing, it is possible to obtain frequent and extensive measurements of CDOM, which can then be used as a proxy for DOC concentrations, allowing for a more comprehensive and dynamic assessment of DOC distribution in the ocean. Despite certain limitations highlighted by Mannino et al. [48], Nelson and Siegel [53], and Hestir et al. [54], the utilization of the DOC-CDOM model for estimating DOC concentrations has demonstrated robustness through testing with independent datasets and methods. It is important to note that there are significant seasonal and spatial variations in the DOC-CDOM relationship, as indicated by studies conducted by Kowalczuk et al. [55], Catala et al. [56], and Iuculano et al. [57]. However, despite these variations, the overall performance of the algorithms used in the model has been found to be reliable, with an estimated uncertainty ranging from 4% to 10% [48]. These findings indicate the potential of employing satellite-based algorithms to provide reasonably accurate estimates of DOC concentrations, despite the inherent challenges associated with seasonal and spatial differences. This method is a quick and inexpensive alternative to direct analytical methods for measuring DOC concentrations [50,58]. Coastal samples have exhibited strong correlations in the prediction of DOC concentrations (0.64 < R2 < 0.82) [59]. Remote sensing-based algorithms utilizing aCDOM data have shown promise in retrieving DOC concentrations for the SCS during the summer and winter seasons. Studies by Siegel et al. [60], Johannessen et al. [61], and Mannino et al. [48] have demonstrated the feasibility of estimating DOC levels using remote sensing data during the months of August and January. They derived DOC from aCDOM through the relationship between aCDOM and DOC and established the pattern and intra-annual variation of DOC distribution in the SCS region, representing the first validated algorithm for offshore aCDOM, DOC, and CDOM spectral slope. A more comprehensive approach for estimating DOC concentrations, even in highly photobleached seawater, was proposed by Fichot and Benner [62]. Their method involves utilizing CDOM coefficients at specific wavelengths, such as 275 nm and 295 nm, to estimate DOC levels. Unlike traditional methods that may struggle to accurately measure DOC in highly photobleached seawater, this approach offers a more reliable means of quantifying DOC concentrations. CDOM, which consists of intricate compounds, is recognized as a valuable indicator of water quality [63]. It serves as a proxy for assessing the level of organic pollution in water to some extent [64,65]. Seasonal and interannual variations in CDOM play a pivotal role in the marine organic carbon cycle, as highlighted by Ma et al. [66]. These fluctuations provide valuable insights into the temporal dynamics of organic carbon in marine ecosystems. By studying the changes in CDOM concentrations and properties over different time scales, researchers can gain a better understanding of the factors influencing organic carbon distribution, transport, and transformation in the marine environment. This knowledge contributes to our comprehension of the overall carbon cycling processes and their impacts on ecosystem functioning. Consequently, studying the seasonal and interannual variation of CDOM is crucial for unraveling the complexities of the marine organic carbon cycle.
While considerable efforts have been made to study and quantify organic carbon distribution in the global oceans [40,67], our understanding of organic carbon dynamics in tropical oligotrophic marginal reef waters remains limited [62,68]. Filling this gap is crucial for gaining a holistic understanding of the global carbon cycle and the intricate interactions between organic carbon and reef ecosystems. This study used an improved CNN-LSTM model that used chlorophyll-a (Chl-a) data for training and learning to extract features and find optimal parameters [69]. The CNN-LSTM model based on Chl-a data directly predicts POC and CDOM over five years and explores the distribution and interannual trend of sea surface organic carbon in the Liyue Tan area of Nansha.

2. Materials and Methods

2.1. Data Processing

There are two giant atolls in the SCS, one of which is Liyue Tan. Liyue Tan is the largest underwater atoll in Nansha, at 9514 km2. There are no islands or sandbanks on the reef. At the southwest corner of Liyue Tan are Antang Jiao, Huoxing Jiao, Gongzhen Jiao, Liyue Nanjiao, and Houteng Jiao. Houteng Jiao can be exposed at low tide. There is Xiongnan Jiao in the east and Dayuan Tan in the west. The Liyue Tan has good pre-Cenozoic oil and gas resource potential [70]. Liyue Tan is situated within the Nansha Islands, located in the southern region of the SCS. The Nansha Islands are driven by terrain and monsoons with frequent mesoscale eddies [71]. The SST in the Nansha Sea area remains above 22 °C all year round; salinity levels in this region are typically above 33,; the concentration of Chl-a is deficient (<0.3 mg/m3) [72,73,74], and the DOC concentration in the oligotrophic area is about 60–80 μM [75]. The hydrological conditions in the Liyue Tan area are mainly influenced by mixing with salt water, warm water, and low-nutrient open SCS. The average surface water temperature of Liyue Tan was significantly lower than that of Nansha, which may be related to the upwelling of low-temperature bottom water caused by the northeastward transport of the west coast of Nansha [76]. The marginal sea has large spatial and temporal variability and complex physical and biogeochemical processes. The SCS is a tropical marginal sea characterized by its semi-enclosed nature. The upper circulation in the SCS exhibits distinct patterns depending on the season. In winter, the circulation is primarily cyclonic and driven by the influence of the East Asian monsoon. However, in summer, it is cyclonic in the north and anticyclonic in the south [77]. Near northern Liyue Tan is the high-abundance area of phytoplankton in the Nansha Islands. Its average abundance is about three times that of the Nansha Islands [76]. Calcification of coral reefs has resulted in a notable rise in sea surface pCO2 levels in the Spratly Islands region [78]. The pCO2 in the surface SCS varies from 310 to 460 µatm [79], surpassing atmospheric pCO2 levels. This indicates that the SCS acts as a source of atmospheric carbon dioxide. The particular geographical location, complex topographic conditions, and hydrological environment of the SCS and the input of major rivers such as the Pearl River and Mekong River, together with the frequent occurrence of meteorological and hydrological events such as typhoons and mesoscale eddies [80], have led to the complex carbon cycle characteristics of the SCS.
The indicators POC and CDOM were chosen for predictive analysis in the study. The decomposition of POC is the primary source of released DOC [81]. Other potential sources of CDOM in water bodies are released as by-products of primary productivity [82]. In the open ocean, CDOM is considered primarily a result of primary production. Additionally, surface primary productivity in marine samples is positively correlated with POC [8]. Therefore, primary productivity is a crucial factor that cannot be ignored in predicting organic carbon content. Chl-a is a significant indicator for assessing a water body’s primary productivity [83]. Thus, incorporating Chl-a data into the model training can be used to predict the organic carbon content of the sea surface.
Nansha Islands are far from the mainland, and the actual measurement and space station observation require a lot of workforce and material resources. Therefore, utilizing remote sensing technologies, the research collected long-term, large-scale data. Satellite ocean color products are usually calibrated based on existing observations to provide more comprehensive coverage. The experiment used data from the NASA Ocean Color website (https://oceancolor.gsfc.nasa.gov/, accessed on 25 June 2020). The downloaded data are satellite time series. To ensure a more comprehensive dataset with minimal missing values, the study utilized semi-monthly MODIS sensor synthetic product data from January 2002 to June 2020. The study utilized satellite data from the Terra and Aqua satellites, which provide accurate measurements with a spatial resolution of 1 km. The selected dataset specifically covered the Liyue Tan area in the southern part of the SCS, bounded by latitudes 11.1°N to 12.1°N and longitudes 115.8°E to 117.5°E (Figure 1). The study reanalyzed the data and expanded it 20 times according to the divided grid to produce a grid product with a 20 km × 20 km spatial resolution. A single grid’s value is replaced with the mean of 400 original data points.
POC (mg/m3) and Chl-a (mg/m3) data can be obtained directly by downloading MODIS Level 2 product data. The POC algorithm [84] adopted by the NASA website can better invert the global oceanic POC surface concentration and obtain remote sensing products with high spatial and temporal resolution, which provides a good data source for POC studies. Cui et al. [85] verified and corrected the monthly average POC remote sensing products of the MODIS/AQUA satellite released by NASA and found that the POC remote sensing products had an excellent linear relationship with the measured data in the northern SCS (R2 = 0.72). Due to the highly complex biochemical composition of CDOM, there is no standard substance so far, so the concentration of CDOM in seawater cannot be directly determined. Studies typically characterize the relative concentration of CDOM in seawater by measuring its spectral absorption coefficient [86], typically using a 400 nm or 440 nm absorption coefficient to represent its concentration broadly. Different optical properties of water bodies lead to different inversion algorithms for CDOM in different water bodies. To quantify the concentration of CDOM in this study, the absorption coefficient at 440 nm was utilized. This parameter was derived through a reflectance inversion process applied to MODIS satellite data, specifically bands 8, 9, and 10. The inversion model refers to the CDOM inversion model (R2 = 0.78) obtained by regression analysis of MODIS remote sensing data in the Ledong sea area of the SCS using the Tassan model by Zhang et al. [87], which is a CDOM inversion model using Sea WiFS data established by Tassan [88] in the Bay of Naples based on relevant information. The vast majority of the sea area of Ledong meets one class’s national water quality standard. In this paper, the water quality of the Liyue Tan Sea area in the southern part of the SCS is high and is also of first-class quality. The inversion equation of CDOM in this study is as follows:
lg a 440 = 2.68 2.28 × lg b 8 ÷ b 10 × b 9 0.66
where a(440) is the absorption coefficient of CDOM at 440 nm and b8, b9, and b10 are the reflectances of MODIS data in the 8, 9, and 10 bands, respectively.
Cloud coverage in the SCS is notably high, especially during the summer months, with cloud coverage reaching around 80%, which may result in sensor data loss and anomalies. Consequently, to preserve the integrity of the data, this study removed outliers outside the quartile range and used spline interpolation for missing values. To ensure the model’s convergence speed and prevent gradient changes, the original data is preprocessed using Min-Max normalization before being fed into the model. In this study, Min-Max normalization was applied to the data using the scikit-learn machine learning preprocessing library. This normalization technique rescaled the data to a range between 0 and 1, ensuring that all values were evenly distributed within this range.
To ensure reliable model training and evaluation, the dataset was divided into three sets: training, validation, and test sets. In terms of the temporal dimension, the dataset encompassed 444 data points spanning from January 2002 to June 2020. The training set consisted of 210 data points spanning from January 2002 to September 2010. The validation set included 114 data points, covering the period from September 2010 to June 2015. Lastly, the test set comprised 120 data points from June 2015 to June 2020.

2.2. CNN-LSTM Model

In this work, CNN and LSTM are combined to form the CNN-LSTM model. CNN has the benefit of recognizing spatial information characteristics and extracting multidimensional picture attributes. Moreover, it still maintains the benefits of LSTM for analyzing time-series data. CNN extracts the intricate characteristics of the indicators in the CNN-LSTM model. The LSTM model is then used to predict based on these depth characteristics [69].
In the CNN-LSTM model, aiming to enhance prediction accuracy, the grid that has a strong association with the target grid is chosen to extract features and predict the organic carbon in the target area. Specifically, in predicting the target grid, the two grids with the most extensive mutual information with the target grid are selected and input to the model together with the target grid to predict the target grid. Therefore, it is essential to verify the grid’s spatial correlation before predicting. To represent grid correlation, calculate mutual information entropy (Equation (S1)).
The experiment used the CNN-LSTM prediction model of Chl-a, improved in the author’s previous study [69]. The dropout rate in the model was set to 0.001. The model selected the LSTM-unified initial Tanh activation function. The LSTM layer was initialized with 64 hidden neural units, the kernel layer utilized the glorot_uniform kernel initializer, the Zeros method was used for weight initialization, and hard_sigmoid was the activation function for the loop steps. The CNN-LSTM model was set with a learning rate of 0.001, a batch size of 8, and an epoch of 150. During execution, the model used the MSE loss function and Adam optimization.
During the single-step prediction process, 30 time steps are used to predict the next set of data. During the rolling prediction procedure, the model uses a sliding window approach, where predicted data is added to the sample to update it. The model then uses a sequence of 72 time steps (equivalent to 3 years) of organic carbon data to predict the subsequent organic carbon values. This iterative process continues, with each prediction being incorporated into the input sequence for the next prediction.

2.3. Trend Analysis

The monotonous trend of the POC and CDOM time series was examined in this study using the Mann-Kendall (M-K) trend test method (Equations (S5)–(S8)) and the least squares method (Equation (S9)). The M-K trend test is a non-parametric statistical method and a commonly used technique for analyzing trends in time series variations. The M-K test statistic Z was determined by dividing the time series into a subset of annual units. The probability that the trend exists was defined as P, and the significance level (α) was chosen at 0.05. The idea of using the least squares method to fit local trends is to establish a linear regression model, where the regression coefficients represent the trend of changes in organic carbon.

3. Results

3.1. Correlation Analysis of Indicators

A Pearson correlation analysis was conducted among Chl-a, POC, and CDOM. Pearson correlation coefficients are shown in Figure 2.
As seen in Figure 2, the Pearson correlation of Chl-a with POC was 0.73, and the Pearson correlation of Chl-a with CDOM reached 0.83. Chl-a was positively correlated with both POC and CDOM, and the correlation was high.

3.2. Parameter Optimization of CNN-LSTM

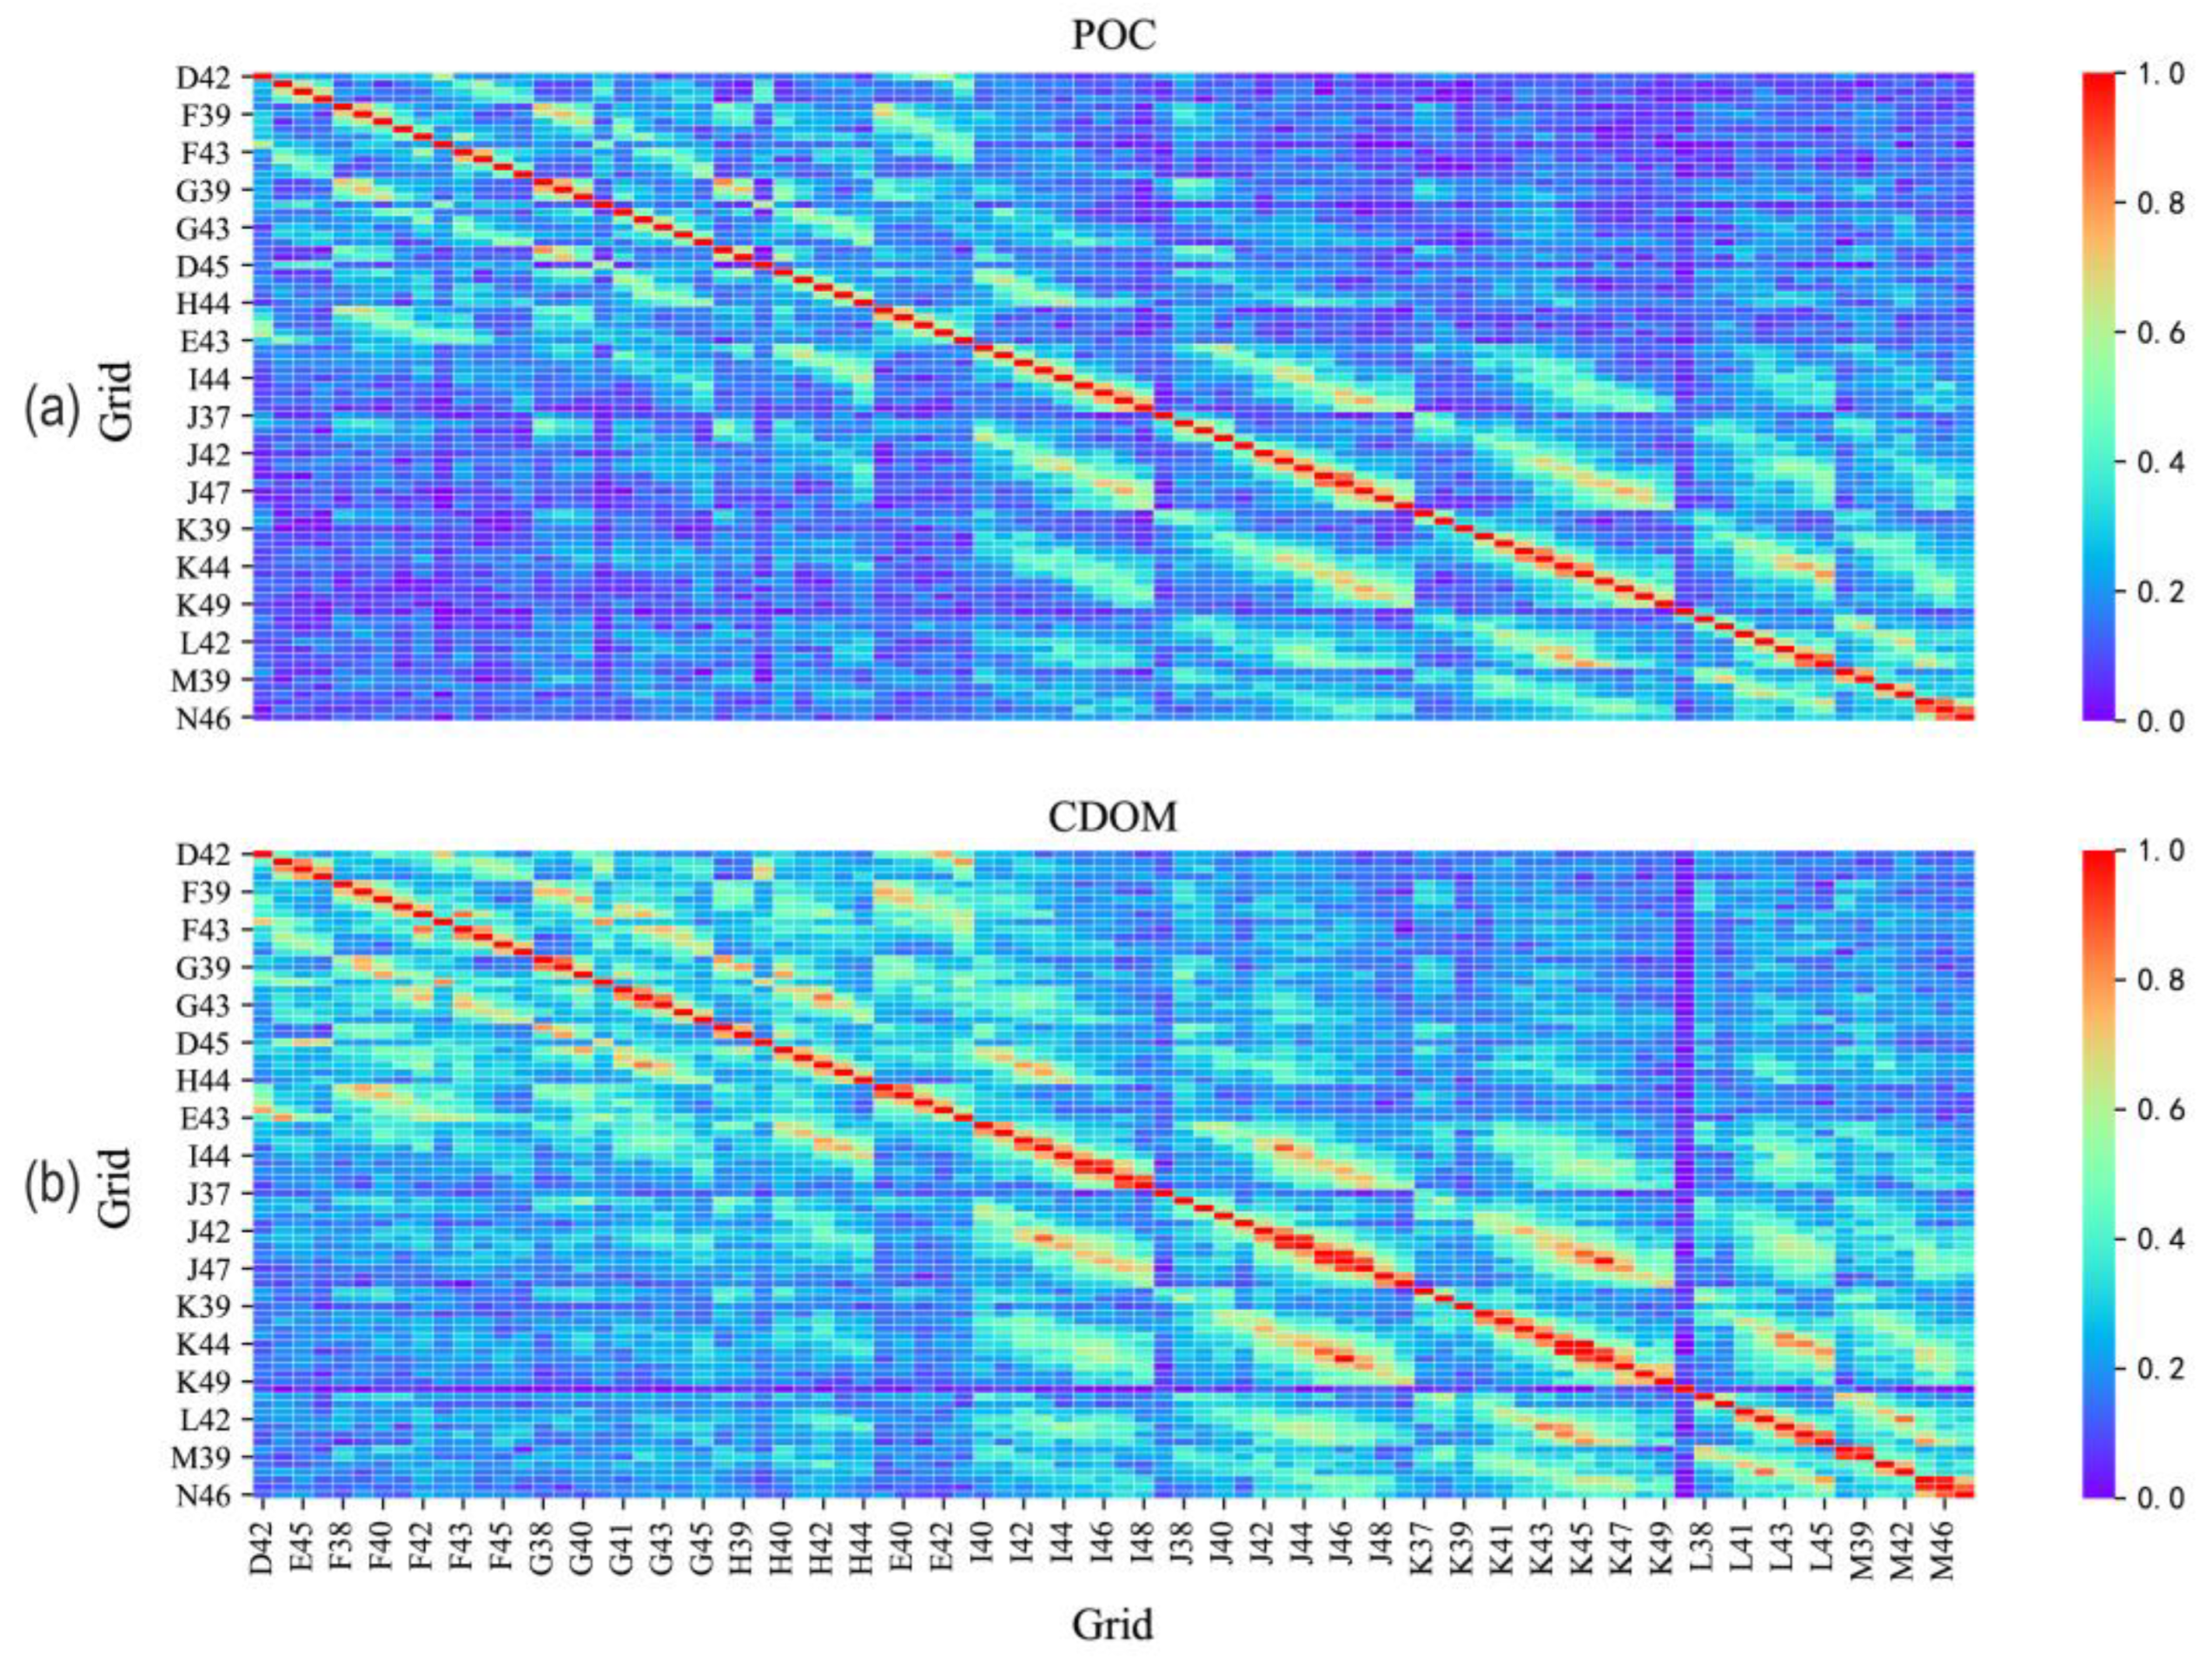
3.2.1. Spatial Correlation

The mutual information entropy between the D42 grid and other grids is computed using the D42 grid region as an example (Figures S1 and S2).
As shown in Figures S1 and S2, Grid D42 shows the highest association with D43 and E42 for both POC and CDOM. The mutual information entropy of grid D42 of POC with D43 and E42 is 0.620 and 0.595, and the mutual information entropy of grid D42 of CDOM with D43 and E42 is 0.955 and 0.807, respectively. The D42 grid is adjacent to D43 and E42. The analysis shows that there is potential for a strong correlation between adjacent grids of POC and CDOM.
On all chosen grids in the study area, mutual information entropy studies were carried out (Figure 3). Each grid area was shown to have a significant correlation with the region around it. The mutual information entropy of the POC grid is smaller than that of the CDOM, indicating that the POC in the Liyue Tan area has a larger grid area than the CDOM.

3.2.2. Training Process

To begin with, we train the CNN-LSTM model and calculate the loss functions for the training and testing datasets. It was observed that for POC and CDOM, after epoch exceeds 150, the loss curves for both the training and testing datasets begin to converge gradually (Figures S3 and S4).

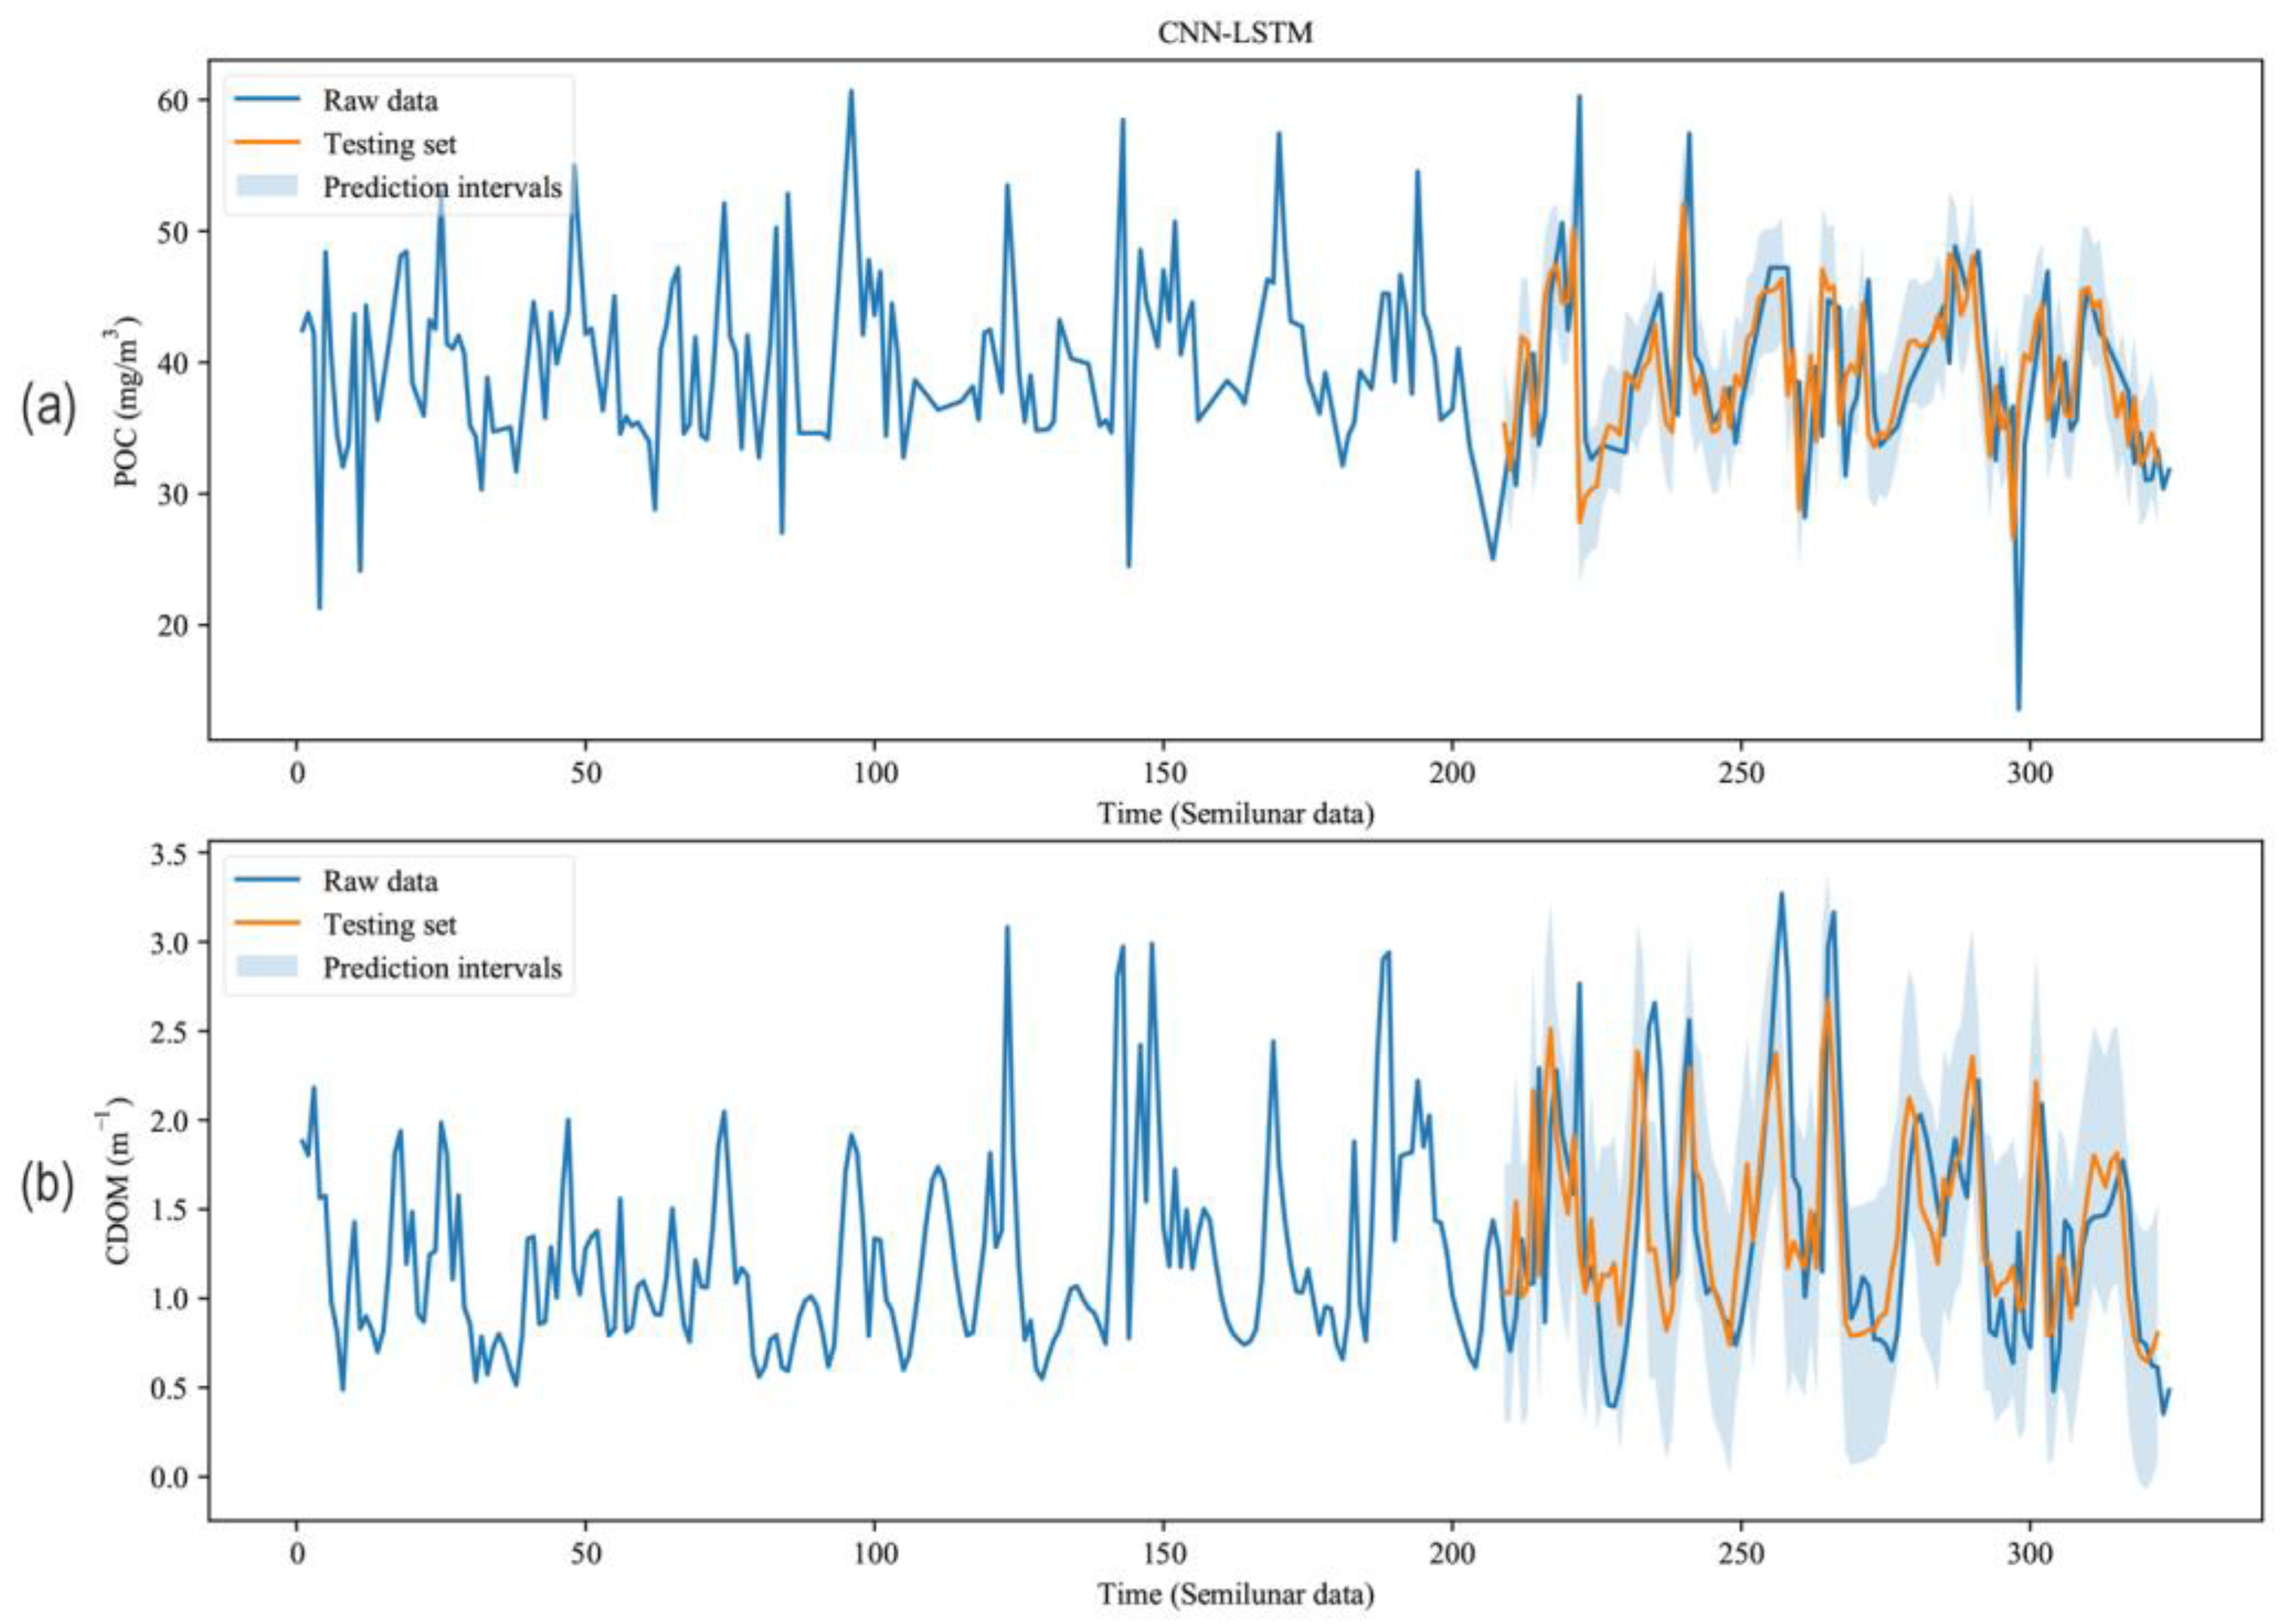
3.3. Single-Step Prediction

The D42 grid’s POC and CDOM sequences were predicted using the CNN-LSTM model, and a 95% confidence interval was calculated. By assessing grid correlations, this study employs the combination of (D42-D43-E42) to predict the grid D42.
As seen in Figure 4, for predicting POC and CDOM, the predicted values fit the actual value curve ideally with narrow confidence intervals.
The MAE (Equation (S3)) and MSE (Equation (S2)) of the prediction were calculated, and the results are shown in Table 1. The MAE was 1.68 mg/m3, and the MSE was 5.84 mg/m3 for POC prediction. The MAE was 0.272 m−1, and the MSE was 0.136 m−1 for CDOM prediction.
The prediction effect of POC and CDOM is ideal. That shows that the Chl-a prediction model can be used for both Chl-a prediction and POC and CDOM prediction. The reason may be that POC and CDOM are highly correlated with Chl-a, so the three indicators can be predicted by a model.

3.4. Long-Term Prediction and Interannual Trend Analysis of Organic Carbon

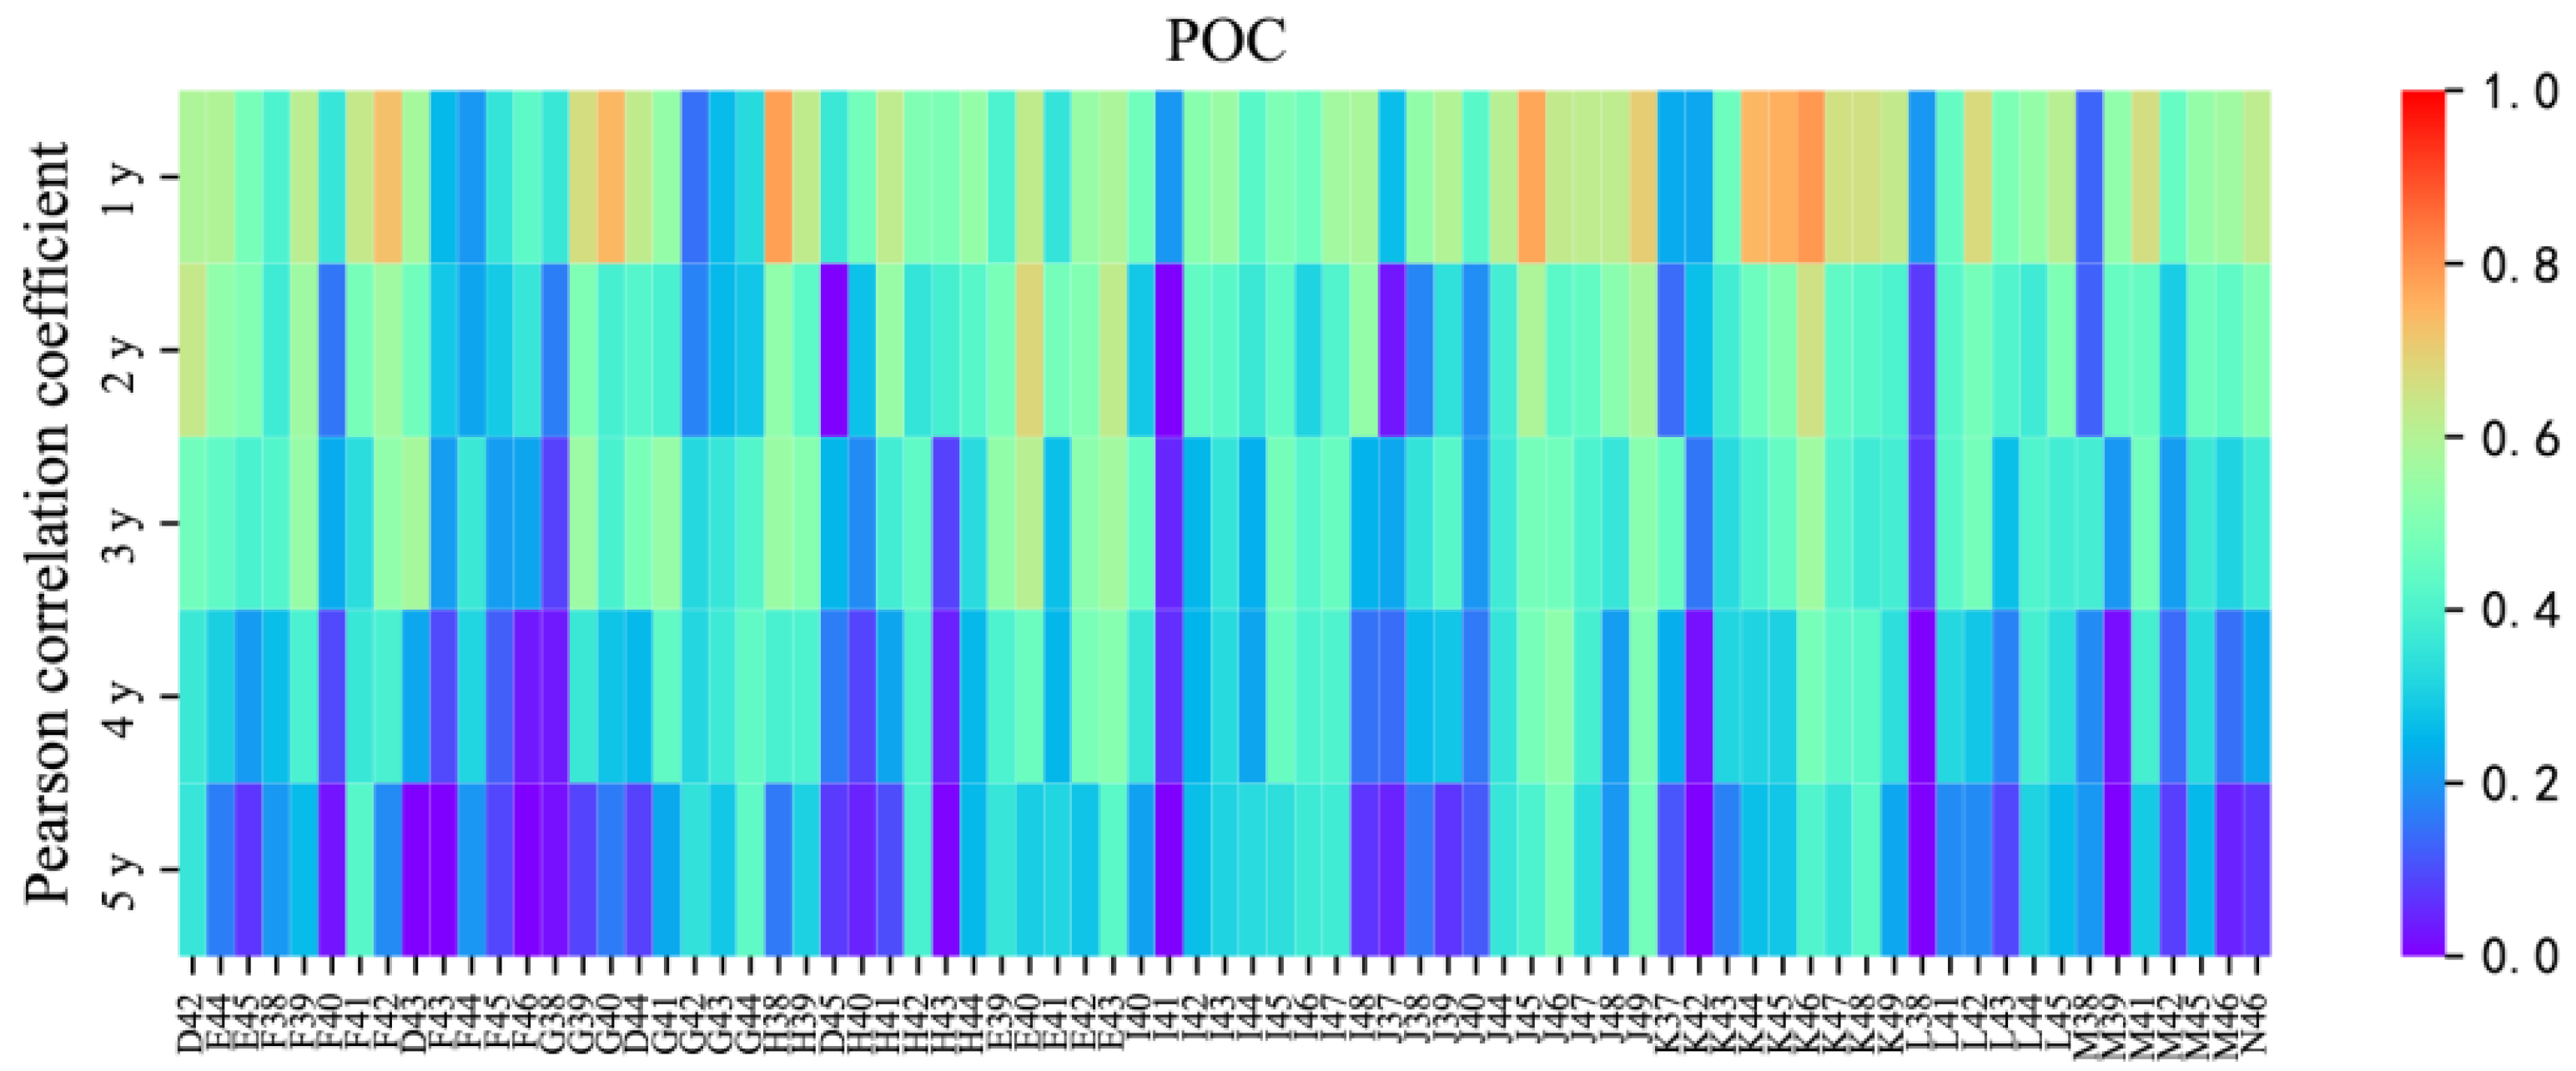
3.4.1. Mid-Long Term Prediction of POC

The study predicted POC sequences for all gridded areas for up to five years in the long term and removed grids where predictions were not ideal due to the presence of reefs (e.g., J41–J43, K38–K41). The Pearson correlation coefficient (Equation (S4)) between the predicted and actual values is shown in Figure 5.
Figure 5 demonstrates that for the prediction of POC, as the prediction time increases, the prediction accuracy of each grid area of the data set gradually decreases. The grid averages of MAE, MSE, and Pearson correlation coefficients of POC long-term prediction were calculated in order to more properly statistic the accuracy of long-term prediction (Table S1).
As the prediction period lengthens, the average MAE and MSE of the prediction region increase, indicating a higher level of prediction uncertainty. Additionally, the Pearson correlation coefficient, which measures the correlation relationship between predicted and actual POC values, gradually decreases. These findings suggest that the accuracy of long-term POC predictions decreases over time. Nevertheless, the results of the long-term POC prediction still provide support for the suitability and effectiveness of the Chl-a CNN-LSTM long-term rolling prediction model. Despite the increasing prediction errors, the model demonstrates its capability to generate POC predictions over an extended period. When estimating the 5-year POC concentration for the entire sea region, the grid’s Pearson correlation coefficient is almost always lowered to less than 0.4, so the predicted value differs significantly from the actual value. The prediction results show that the Pearson correlation coefficient of the 1-year prediction is high (>0.5). The CNN-LSTM model can accurately predict POC for up to one year in the Liyue Tan area in the southern part of the SCS (Table S1).

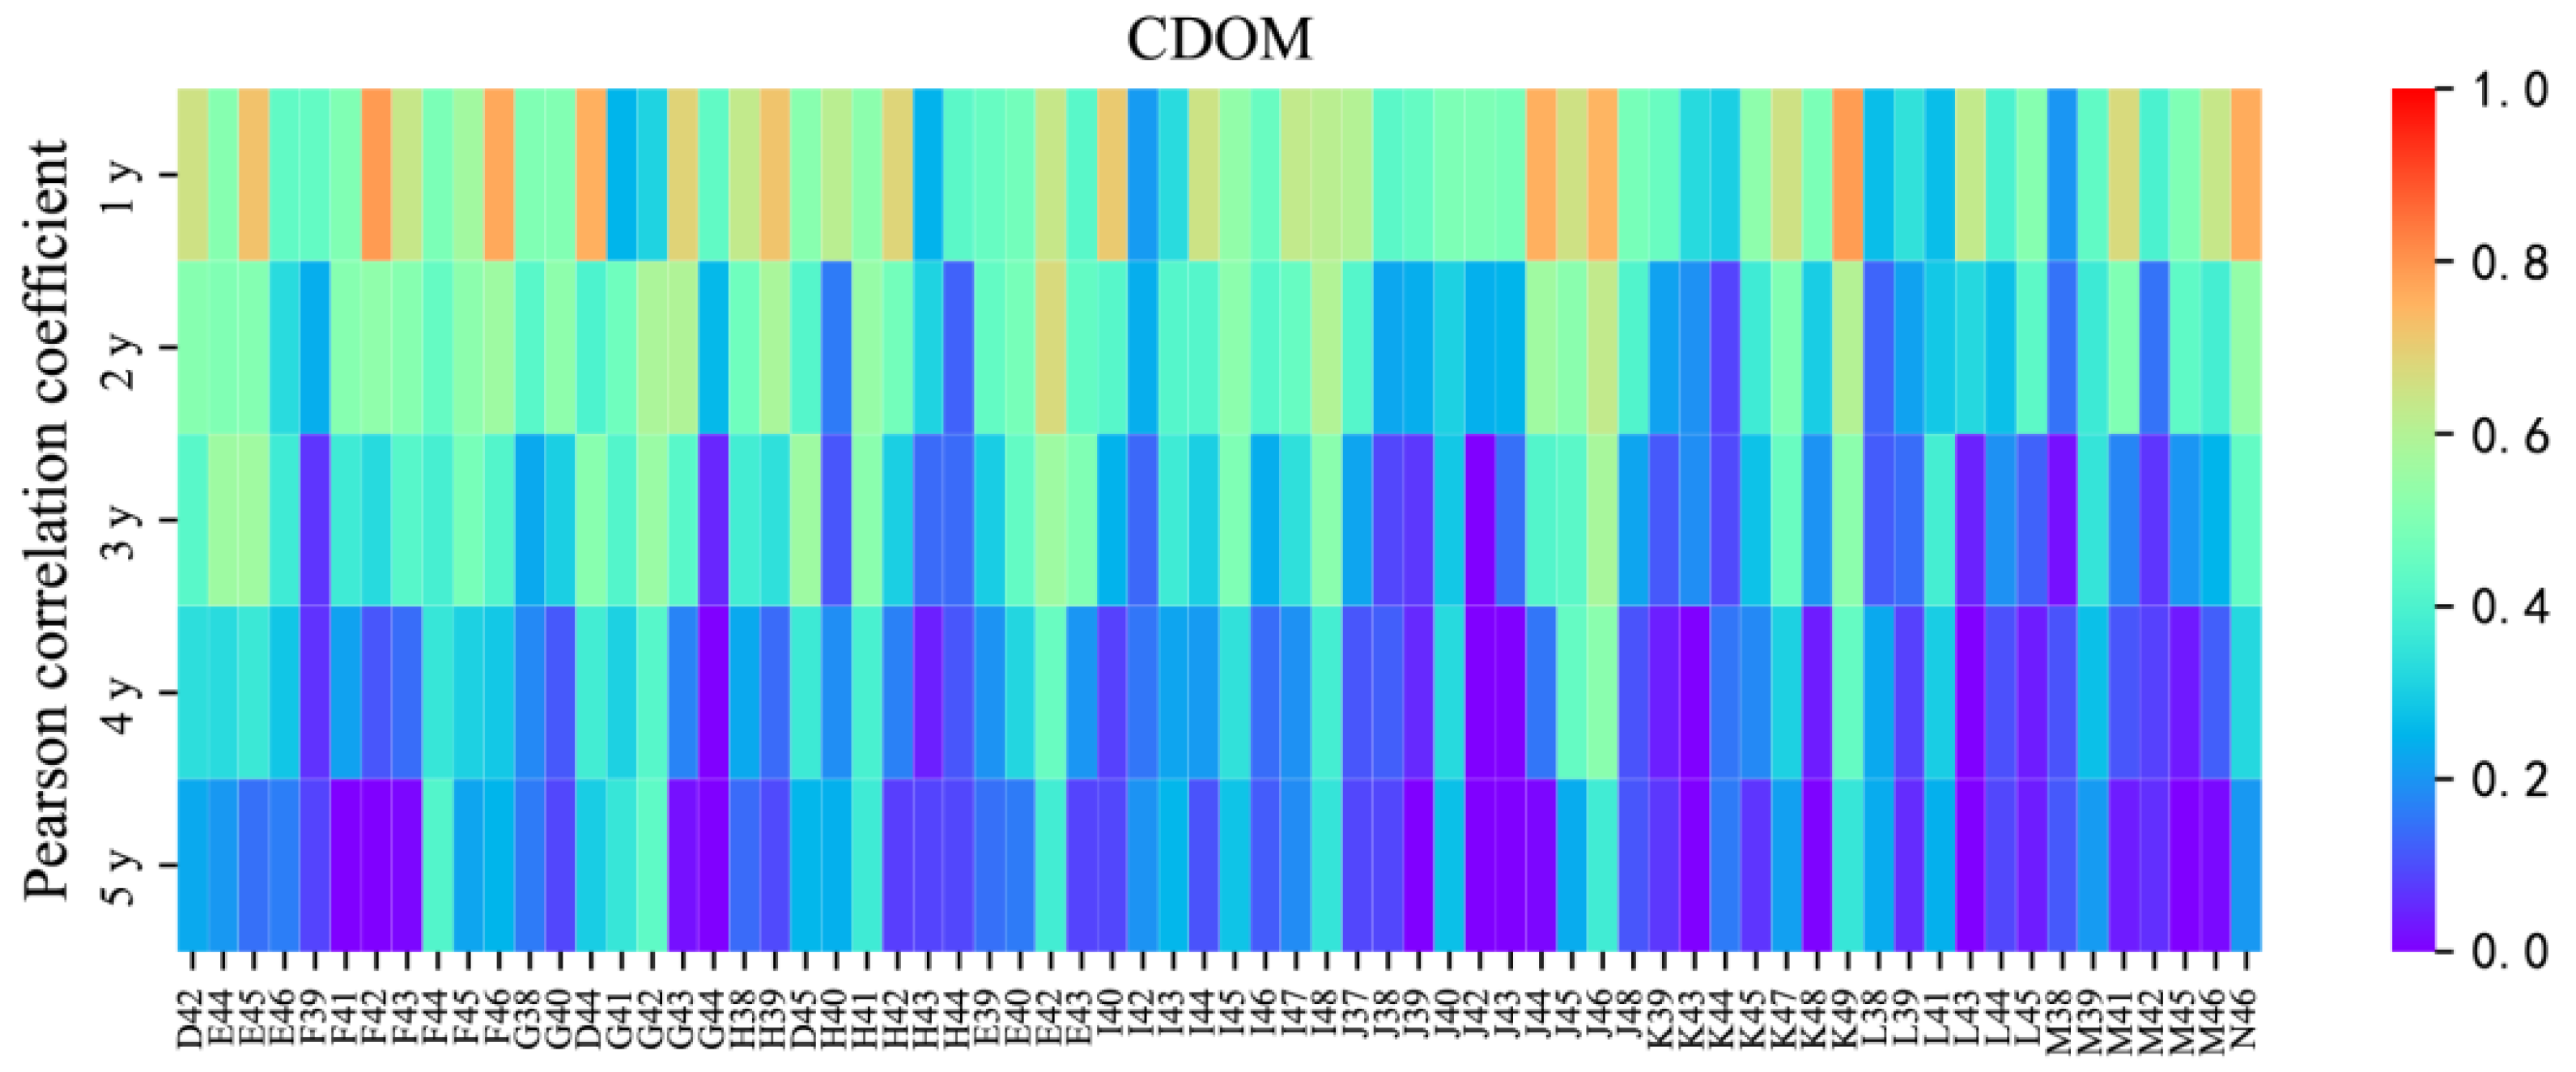
3.4.2. Mid-Long-Term Prediction of CDOM

The study used CNN-LSTM models to make long-term predictions of CDOM sequences for all grid regions for up to five years and removed grids (such as K40–K42) where predictions were not ideal due to the presence of reefs. The correlation between the actual and predicted values is shown in Figure 6.
Figure 6 demonstrates that for the prediction of CDOM, the overall effect of long-term prediction is similar to that of POC. Each grid area’s prediction accuracy gradually declines as prediction time goes up. The prediction accuracy of CDOM is generally worse than that of POC.
In order to provide a more comprehensive assessment of the CNN-LSTM long-term prediction model for CDOM, the average values of MAE, MSE, and Pearson correlation coefficient were calculated for each grid in the study area. This approach allows for a more accurate evaluation of the model’s performance across the entire spatial domain (Table S2).
As the prediction period lengthens, there is a consistent trend observed in the average MAE and MSE within the prediction region. These error metrics tend to increase over time, indicating that the accuracy of the predictions decreases with longer prediction periods. In contrast, the Pearson correlation coefficient, which measures the linear relationship between predicted and actual values, exhibits a gradual decline as the prediction period lengthens. This suggests that the model’s ability to capture the true underlying patterns and variations in the CDOM data diminishes over time. The results of the long-term CDOM prediction provide evidence for the effectiveness of the Chl-a CNN-LSTM model in accurately forecasting CDOM levels over an extended period. From the standpoint of the entire sea region, the Pearson correlation coefficient of the grid is virtually all reduced to less than 0.4 when predicting the three-year CDOM concentration; the predicted value is considerably different from the actual value. The 1-year prediction level was similar to that of POC, and the Pearson correlation coefficient was high (R > 0.5). The CNN-LSTM model can also predict CDOM in the southern SCS for up to one year (Table S2).

3.5. Trend Analysis

The study area’s 5-year long-term predicted CDOM values and actual values were analyzed using statistical methods such as the least squares method and the M-K trend test (Table 2).
The M-K test revealed a slightly rising trend in the actual and predicted values of POC in the overall area from 2015 to 2020, although it was not statistically significant (p < 1 − α). The least squares test also confirmed the upward trend of POC in the study area. Similarly, the trend analysis of the CDOM grid study area showed the interannual variation of CDOM in the study region showed a minor upward trend from 2015 to 2020 (Table 2).

4. Discussion

The single-step prediction experiment and mid-long-term prediction of POC and CDOM show that the CNN-LSTM prediction model for Chl-a is also applicable to POC and CDOM. The reason may be that Chl-a has a high correlation with POC and CDOM (Figure 2). Therefore, the CNN-LSTM model trained by Chl-a data fitting also applies to POC and CDOM in the same region. Hung et al. [89] also verified the high correlation between POC and Chl-a in the northern SCS (R = 0.69), which is close to the results of this study. The high correlation of Chl-a with POC and CDOM indicated that phytoplankton contributed more to POC and CDOM. The positive correlation observed between Chl-a and CDOM can be attributed to several factors. These include the presence of high primary productivity, significant particle influx from the surface, and relatively low levels of photodegradation within the water column. These combined conditions contribute to the accumulation of CDOM in the water [28]. According to the findings of Wang et al. [90], it is proposed that in situ primary production, along with subsequent microbial transformation processes, play a crucial role in shaping the dynamics of DOM.
The correlation between Chl-a and CDOM was higher than that of POC (Figure 2), and the spatial grid correlation of CDOM was also higher (Figures S1 and S2). However, the prediction accuracy of CDOM is generally lower than that of POC. The reason may be that there may be errors in the direct application of the CDOM inversion model in the Ledong Sea area of the SCS [87]. It may also be due to the apparent seasonal variation of POC. The concentration of POC is low in the spring and summer, and the lowest value generally occurs in May. The concentration of POC reaches its highest in winter, and the concentration of POC in autumn begins to rise rapidly until reaching its peak in winter. However, CDOM has no apparent seasonality.
Previous studies have found that, like Chl-a, POC is significantly affected by the monsoon and temperature. More excellent primary production, variations in monsoon intensity, and frequent internal solid waves in the SCS facilitated POC’s downward and lateral flow [91,92], resulting in higher POC concentrations. The POC concentration in the surface seawater of Liyue Tan in the SCS is between 20 and 60 mg/m3 (Figure 4), consistent with the previous research results [6,89,93]. When the temperature rises, both Chl-a and POC show a downward trend. When the temperature falls, both Chl-a and POC show a significant upward trend [85]. In addition, the high correlation between POC and Chl-a indicates that POC is sensitive to biological changes and is greatly affected by organisms. The increase in phytoplankton biomass and primary production will result in increased zooplankton biomass and upper-middle layer debris concentration, as well as more zooplankton consumers, including fish [38], increasing POC content.
CDOM has no apparent seasonality and has the lowest concentration in the summer [94]. CDOM in seawater can be divided into two categories according to their sources: in situ degradation of organisms in the ocean and dissolved organic matter in terrestrial soil brought into the ocean through river runoff [29]. Compared with nearshore and estuarine areas, the Nansha Sea area is not influenced by land-based sources and belongs to Class I water bodies with low CDOM content [95]. The CDOM content in the Liyue Tan Sea area ranges from 0.5 m−1 to 3 m−1 (Figure 4). The majority of DOM found in the upper ocean is susceptible to biodegradation processes, with varying turnover times that can span from minutes to decades. Apart from biodegradation, DOM is also influenced by photochemical reactions occurring in the presence of light. These photochemical processes lead to the photobleaching of CDOM and the direct breakdown of biologically unstable or refractory compounds [96,97]. CDOM is mostly formed in situ by biological production in the marginal seas of the SCS, and it is eliminated via photochemical degradation and microbial consumption [53]. The dominant component of CDOM in the Nansha Sea area is humus, as observed by Siegel et al. [60]. These components are resistant to microbial degradation but susceptible to solar radiation. Photodegradation processes, influenced by solar radiation, have a significant impact on the abundance and distribution of CDOM in the surface layer of the SCS [98]. In summer, the absorption of CDOM in sea surface water decreases rapidly due to intense photobleaching [99]. The amount and composition of CDOM in the upper layer of the SCS are influenced by various factors, including lateral and vertical mixing processes. These mixing processes, such as mesoscale eddies and frontal zones, play a crucial role in altering biogeochemical variables and controlling the distribution of CDOM. Wang et al. [28] suggest that the interaction between different water flows, mediated by mixing processes, can significantly impact the quantity and characteristics of CDOM in the upper layer of the SCS. In winter, surface water mixed with upwelling brings new nutrients and CDOM from the deep.
The study found that the presence of islands and reefs and whether the grid arrangement is regular may affect the prediction accuracy. The mid-long term prediction accuracy of some grids (such as F43–F46) in the study area of POC is low, and the Pearson correlation coefficient of 2 years is almost below 0.4 (Figure 5). The reason may be that the existence of islands and reefs has an impact on the prediction of POC. When excluding part of the grid where the reefs exist, the study found that the Pearson correlation coefficient of the three-year POC value prediction is above 0.5 for mid-long-term POC prediction in the open ocean. That indicates that the CNN-LSTM model can predict POC in the open ocean for up to three years. The M and N grid areas’ ability to predict outcomes is poor. The reason is that the irregular shape of the grid area leads to low mutual information entropy between the target grid and the surrounding grid. The input of the CNN-LSTM model is no longer high-correlation spatial data, thereby reducing the prediction accuracy.
As with the POC index, the mid-long-term prediction accuracy of the regional partial grid (J37–J48, K39–K43) of CDOM is low. The Pearson correlation coefficient of the two-year prediction is almost below 0.4 (Figure 6). The reason may be due to the influence of Antang Jiao, Huoxing Jiao, Gongzhen Jiao, Liyue Nanjiao, and Houteng Jiao on CDOM prediction. For the sea area where the reefs exist, the Pearson correlation coefficient of 1-year prediction in more grid areas is above 0.5, indicating that the 1-year prediction of the reef sea area is ideal. Excluding some grids where islands and reefs exist, the study found that the CDOM long-term prediction in the open ocean is worse than that of POC. The long-term prediction of POC in the open ocean can reach three years, while the Pearson correlation coefficient of the 3-year prediction of CDOM is almost below 0.4. The Pearson correlation coefficient of the 2-year prediction of CDOM is mostly above 0.5. Thus, the CNN-LSTM model can predict CDOM in the open ocean for up to two years. The grid prediction accuracy of numbers L, H, and M is low, possibly due to the irregular shape of these regions and the low correlation between the predicted target grid and the surrounding grid. When the CNN-LSTM model predicts, the data with a significant difference from the target grid is added as the spatial input, which affects the prediction effect. Therefore, organic carbon prediction should divide the study area into more regular grid areas.
The M-K trend and the least squares test showed that POC showed a slight upward trend from 2015 to 2020 (Table 2). Previous studies showed that the primary productivity on the surface of sea samples was positively correlated with POC [8], and the concentration of Chl-a in the Liyue Tan area also showed an upward trend [69], which verified the upward trend of POC. CDOM shows a slight upward trend from 2015–2020 (Table 2). The changing trend of CDOM is the same that of POC. Studies have pointed out that the decomposition of POC is the primary source of DOC release [81]. It is speculated that the same change trend of CDOM and POC may be related to the conversion between the two. The M-K trend test P value is relatively low because the data is from remote sensing. Due to the lack of measured data validation, there is a deviation between the actual value and the obtained value. Additionally, there are a lot of missing values in the remote sensing data, and the interpolated sequence has an inaccuracy when compared to the actual value.
The variation trend of the single grid predicted value is different from the actual value, indicating that the grid’s mid-long-term prediction is unstable and has an error. That is most likely because the prediction’s accuracy will decrease year over year as predicted data is added to the series to predict the subsequent value in the rolling prediction for 2015–2020. Additionally, the prediction accuracy of a single grid area is also influenced by elements like human activity trajectories and coral reefs. Oil and gas resources are abundant in Liyue Tan, and oil and gas development operations in neighboring nations may have an impact on the anticipated level of organic carbon. Greater human development activities may have an impact on changes in organic carbon, making the model inapplicable or impairing its ability to predict the future. The presence of reefs in the Liyue Tan region may also have an impact on the distribution of organic carbon among the various grid areas. A single grid area’s mid-long-term projection contains errors. However, the long-term prediction of organic carbon is in line with reality for the entire region. In light of this, the study concludes that the model provides better performance in large-scale prediction than in a single grid region. This finding suggests the model has the potential to be utilized in a broader range of areas, including additional SCS seas and even international seas.

5. Conclusions

The prediction of carbon cycle elements at home and abroad is in the initial stage. This study predicted the organic carbon in tropical oligotrophic marginal reef seas for the first time. The results of single-step prediction experiments in POC and CDOM show that the CNN-LSTM prediction model of Chl-a is also suitable for POC and CDOM, which indicates that the CNN-LSTM model has the potential to predict more elements. The Pearson correlation coefficients (R) of regional POC and CDOM rolling predictions for one year were 0.514 and 0.524, respectively. From the general study area, the CNN-LSTM model can predict POC and CDOM in the Nansha Sea area for up to one year. The study found that, compared with the prediction of organic carbon in open oceans, the prediction performance of reefs is relatively poor. The CNN-LSTM model can predict POC in open seas for up to 3 years and CDOM for up to 2 years. The mid-long-term prediction of organic carbon in coral reef waters of the southern SCS can help us understand the carbon cycle and the changes in ecological effects in coral reef areas in the context of climate change.
The study found that the POC and CDOM concentration on the surface of the sea area of Liyue Tan showed an upward trend from 2015 to 2020. Previous studies have pointed out that the decomposition of POC is the primary source of DOC released [81]. It is speculated that the same trend of CDOM and POC may be related to the conversion between the two. Predicting organic carbon trends in coral reef areas is conducive to exploring the carbon conversion mechanism in the ocean carbon cycle. The predicted trend of organic carbon is consistent with the actual trend, which verifies the accuracy of the multi-year trend prediction of the CNN-LSTM model. The trend test for large-scale regions is more favorable, indicating that the model may be applicable to large-scale sea areas and has the potential to predict global organic carbon.

Supplementary Materials

The following supporting information can be downloaded at: https://www.mdpi.com/article/10.3390/rs15174218/s1, Figure S1: Mutual information entropy of POC of D42 grid. Figure S2: Mutual information entropy of CDOM of D42 grid. Figure S3: The loss curve of POC prediction in D42 grid area. Figure S4: The loss curve predicted by CDOM in D42 grid area. Table S1: Average performance of the grid area. Table S2: Average performance of the grid area.

Author Contributions

Conceptualization, N.L. and K.Z.; methodology, N.L.; software, N.L.; validation, J.Y., K.Z., S.C. and H.Z.; formal analysis, N.L.; data curation, N.L.; writing—original draft preparation, N.L.; writing—review and editing, J.Y., K.Z., S.C. and H.Z.; visualization, N.L.; supervision, J.Y. and K.Z.; funding acquisition, J.Y. and S.C. All authors have read and agreed to the published version of the manuscript.

Funding

The work is supported by the National Social Science Foundation of China (No. 20VHQ002) and Key Laboratory of Coastal Science and Integrated Management, Ministry of Natural Resources (2022COSIMQ002).

Data Availability Statement

The MODIS secondary product data used in this study were obtained from the NASA Ocean Color website (https://oceancolor.gsfc.nasa.gov/ (accessed on 25 June 2020)).

Acknowledgments

We would like to acknowledge the anonymous reviewers for their valuable suggestions.

Conflicts of Interest

The authors declare no conflict of interest.

References

  1. Siegenthaler, U.; Sarmiento, J. Atmospheric Carbon-Dioxide and the Ocean. Nature 1993, 365, 119–125. [Google Scholar]
  2. Wu, K.; Dai, M.; Chen, J.; Meng, F.; Li, X.; Liu, Z.; Du, C.; Gan, J. Dissolved Organic Carbon in the South China Sea and Its Exchange with the Western Pacific Ocean. Deep Sea Res. Part II-Top. Stud. Oceanogr. 2015, 122, 41–51. [Google Scholar]
  3. Mopper, K.; Zhou, X.; Kieber, R.; Kieber, D.; Sikorski, R.; Jones, R. Photochemical Degradation of Dissolved Organic-Carbon and Its Impact on the Oceanic Carbon-Cycle. Nature 1991, 353, 60–62. [Google Scholar]
  4. Hansell, D.A.; Carlson, C.A. Marine Dissolved Organic Matter and the Carbon Cycle. Oceanography 2001, 14, 41–49. [Google Scholar] [CrossRef]
  5. Kowalczuk, P.; Cooper, W.J.; Durako, M.J.; Kahn, A.E.; Gonsior, M.; Young, H. Characterization of Dissolved Organic Matter Fluorescence in the South Atlantic Bight with Use of PARAFAC Model: Relationships between Fluorescence and Its Components, Absorption Coefficients and Organic Carbon Concentrations. Mar. Chem. 2010, 118, 22–36. [Google Scholar]
  6. Cai, P.; Zhao, D.; Wang, L.; Huang, B.; Dai, M. Role of Particle Stock and Phytoplankton Community Structure in Regulating Particulate Organic Carbon Export in a Large Marginal Sea. J. Geophys. Res. Oceans 2015, 120, 2063–2095. [Google Scholar]
  7. Shih, Y.Y.; Hung, C.C.; Tuo, S.; Shao, H.J.; Chow, C.H.; Muller, F.L.L.; Cai, Y.H. The Impact of Eddies on Nutrient Supply, Diatom Biomass and Carbon Export in the Northern South China Sea. Front. Earth Sci. 2020, 8, 537332. [Google Scholar]
  8. Eppley, R.W.; Peterson, B.J. Particulate Organic Matter Flux and Planktonic New Production in the Deep Ocean. Nature 1979, 282, 677–680. [Google Scholar]
  9. Pan, X.; Wong, G.T.F. An Improved Algorithm for Remotely Sensing Marine Dissolved Organic Carbon: Climatology in the Northern South China Sea Shelf-Sea and Adjacent Waters. Deep Sea Res. Part II-Top. Stud. Oceanogr. 2015, 117, 131–142. [Google Scholar]
  10. Lee, D.; Son, S.; Joo, H.; Kim, K.; Kim, M.J.; Jang, H.K.; Yun, M.S.; Kang, C.K.; Lee, S.H. Estimation of the Particulate Organic Carbon to Chlorophyll-a Ratio Using MODIS-Aqua in the East/Japan Sea, South Korea. Remote Sens. 2020, 12, 840. [Google Scholar]
  11. Hansell, D.A.; Carlson, C.A. Net Community Production of Dissolved Organic Carbon. Glob. Biogeochem. Cycles 1998, 12, 443–453. [Google Scholar] [CrossRef]
  12. Cole, J.J.; Prairie, Y.T.; Caraco, N.F.; McDowell, W.H.; Tranvik, L.J.; Striegl, R.G.; Duarte, C.M.; Kortelainen, P.; Downing, J.A.; Middelburg, J.J.; et al. Plumbing the Global Carbon Cycle: Integrating Inland Waters into the Terrestrial Carbon Budget. Ecosystems 2007, 10, 171–184. [Google Scholar] [CrossRef]
  13. Butman, D.; Raymond, P.A. Significant Efflux of Carbon Dioxide from Streams and Rivers in the United States. Nat. Geosci. 2011, 4, 839–842. [Google Scholar] [CrossRef]
  14. Ren, W.; Tian, H.; Cai, W.J.; Lohrenz, S.E.; Hopkinson, C.S.; Huang, W.J.; Yang, J.; Tao, B.; Pan, S.; He, R. Century-Long Increasing Trend and Variability of Dissolved Organic Carbon Export from the Mississippi River Basin Driven by Natural and Anthropogenic Forcing. Glob. Biogeochem. Cycles 2016, 30, 1288–1299. [Google Scholar] [CrossRef]
  15. Carlson, C.; Ducklow, H.; Michaels, A. Annual Flux of Dissolved Organic-Carbon from the Euphotic Zone in the Northwestern Sargasso Sea. Nature 1994, 371, 405–408. [Google Scholar] [CrossRef]
  16. Dunne, J.P.; Sarmiento, J.L.; Gnanadesikan, A.A. Synthesis of Global Particle Export from the Surface Ocean and Cycling through the Ocean Interior and on the Seafloor. Glob. Biogeochem. Cycles 2007, 21, GB4006. [Google Scholar] [CrossRef]
  17. Ducklow, H.W.; Steinberg, D.K.; Buesseler, K.O. Upper Ocean Carbon Export and the Biological Pump. Oceanography 2001, 14, 50–58. [Google Scholar] [CrossRef]
  18. Abell, J.; Emerson, S.; Renaud, P. Distributions of TOP, TON and TOC in the North Pacific Subtropical Gyre: Implications for Nutrient Supply in the Surface Ocean and Remineralization in the Upper Thermocline. J. Mar. Res. 2000, 58, 203–222. [Google Scholar] [CrossRef]
  19. Doval, M.; Hansell, D.A. Organic Carbon and Apparent Oxygen Utilization in the Western South Pacific and the Central Indian Oceans. Mar. Chem. 2000, 68, 249–264. [Google Scholar] [CrossRef]
  20. Emerson, S. Annual Net Community Production and the Biological Carbon Flux in the Ocean. Glob. Biogeochem. Cycles 2014, 28, 14–28. [Google Scholar] [CrossRef]
  21. Walsh, J. Importance of Continental Margins in the Marine Biogeochemical Cycling of Carbon and Nitrogen. Nature 1991, 350, 53–55. [Google Scholar] [CrossRef]
  22. Cai, W.J. Estuarine and Coastal Ocean Carbon Paradox: CO2 Sinks or Sites of Terrestrial Carbon Incineration? Ann. Rev. Mar. Sci. 2011, 3, 123–145. [Google Scholar] [CrossRef] [PubMed]
  23. Sexton, P.F.; Norris, R.D.; Wilson, P.A.; Paelike, H.; Westerhold, T.; Roehl, U.; Bolton, C.T.; Gibbs, S. Eocene Global Warming Events Driven by Ventilation of Oceanic Dissolved Organic Carbon. Nature 2011, 471, 349. [Google Scholar] [CrossRef] [PubMed]
  24. Chen, C.T.A.; Wang, S.L.; Wang, B.J.; Pai, S.C. Nutrient Budgets for the South China Sea Basin. Mar. Chem. 2001, 75, 281–300. [Google Scholar] [CrossRef]
  25. Wong, G.T.F.; Ku, T.L.; Mulholland, M.; Tseng, C.M.; Wang, D.P. The SouthEast Asian Time-Series Study (SEATS) and the Biogeochemistry of the South China Sea–An Overview. Deep Sea Res. Part II-Top. Stud. Oceanogr. 2007, 54, 1434–1447. [Google Scholar] [CrossRef]
  26. Dai, M.; Meng, F.; Tang, T.; Kao, S.J.; Lin, J.; Chen, J.; Huang, J.C.; Tian, J.; Gan, J.; Yang, S. Excess Total Organic Carbon in the Intermediate Water of the South China Sea and Its Export to the North Pacific. Geochem. Geophys. Geosyst. 2009, 10, Q12002. [Google Scholar] [CrossRef]
  27. Dai, M.; Cao, Z.; Guo, X.; Zhai, W.; Liu, Z.; Yin, Z.; Xu, Y.; Gan, J.; Hu, J.; Du, C. Why Are Some Marginal Seas Sources of Atmospheric CO2? Geophys. Res. Lett. 2013, 40, 2154–2158. [Google Scholar] [CrossRef]
  28. Wang, C.; Guo, W.; Li, Y.; Stubbins, A.; Li, Y.; Song, G.; Wang, L.; Cheng, Y. Hydrological and Biogeochemical Controls on Absorption and Fluorescence of Dissolved Organic Matter in the Northern South China Sea. J. Geophys. Res. Biogeosci. 2017, 122, 3405–3418. [Google Scholar] [CrossRef]
  29. Zhu, Z.; Wei, H.; Guan, Y.; Zhang, L.; Jia, R.; Sun, P.; Yang, Y.; Zhang, Z.; Zhang, Q. Distribution, Spectral Characteristics, and Seasonal Variation of Dissolved Organic Matter in the Northern Beibu Gulf, South China Sea. Front. Mar. Sci. 2022, 9, 1023953. [Google Scholar] [CrossRef]
  30. Schleyer, M.H.; Kruger, A.; Celliers, L. Long-Term Community Changes on a High-Latitude Coral Reef in the Greater St Lucia Wetland Park, South Africa. Mar. Pollut. Bull. 2008, 56, 493–502. [Google Scholar] [CrossRef]
  31. Savini, A.; Vertino, A.; Marchese, F.; Beuck, L.; Freiwald, A. Mapping Cold-Water Coral Habitats at Different Scales within the Northern Ionian Sea (Central Mediterranean): An Assessment of Coral Coverage and Associated Vulnerability. PLoS ONE 2014, 9, e87108. [Google Scholar] [CrossRef] [PubMed]
  32. Shen, Z.; Yang, H.; Liu, Q. Particulate Organic Carbon and Its Composition in Jiaozhou Bay. In Studies of the Biogeochemistry of Typical Estuaries and Bays in China; Springer: Berlin/Heidelberg, Germany, 2019; pp. 227–235. [Google Scholar]
  33. Liu, Q.; Kandasamy, S.; Wang, H.; Wang, L.; Lin, B.; Gao, A.; Chen, C.T.A. Impact of Hydrological Conditions on the Biogeochemical Dynamics of Suspended Particulate Organic Matter in the Upper Mixed Layer of the Southern East China Sea. J. Geophys. Res. Oceans 2019, 124, 6120–6140. [Google Scholar] [CrossRef]
  34. Marwick, T.R.; Tamooh, F.; Teodoru, C.R.; Borges, A.V.; Darchambeau, F.; Bouillon, S. The Age of River-Transported Carbon: A Global Perspective. Glob. Biogeochem. Cycles 2015, 29, 122–137. [Google Scholar] [CrossRef]
  35. van Pinxteren, M.; Barthel, S.; Fomba, K.W.; Mueller, K.; von Tuempling, W.; Herrmann, H. The Influence of Environmental Drivers on the Enrichment of Organic Carbon in the Sea Surface Microlayer and in Submicron Aerosol Particles–Measurements from the Atlantic Ocean. Elem. Sci. Anthr. 2017, 5, 35. [Google Scholar] [CrossRef]
  36. Diesing, M.; Kroger, S.; Parker, R.; Jenkins, C.; Mason, C.; Weston, K. Predicting the Standing Stock of Organic Carbon in Surface Sediments of the North-West European Continental Shelf. Biogeochemistry 2017, 135, 183–200. [Google Scholar] [CrossRef]
  37. Seiter, K.; Hensen, C.; Schroter, E.; Zabel, M. Organic Carbon Content in Surface Sediments–Defining Regional Provinces. Deep-Sea Res. Part. Oceanogr. Res. Pap. 2004, 51, 2001–2026. [Google Scholar] [CrossRef]
  38. Dzierzbicka-Glowacka, L.; Kulinski, K.; Maciejewska, A.; Jakacki, J.; Pempkowiak, J. Numerical Modelling of POC Dynamics in the Southern Baltic under Possible Future Conditions Determined by Nutrients, Light and Temperature. Oceanologia 2011, 53, 971–992. [Google Scholar] [CrossRef]
  39. Yang, F.; Song, G.; Massicotte, P.; Wei, H.; Xie, H. Depth-Resolved Photochemical Lability of Dissolved Organic Matter in the Western Tropical Pacific Ocean. J. Geophys. Res. Biogeosci. 2020, 125, e2019JG005425. [Google Scholar] [CrossRef]
  40. Jeandel, C.; van Der Loeff, M.R.; Lam, P.J.; Roy-Barman, M.; Sherrell, R.M.; Kretschmer, S.; German, C.; Dehairs, F. What Did We Learn about Ocean Particle Dynamics in the GEOSECS–JGOFS Era? Prog. Oceanogr. 2015, 133, 6–16. [Google Scholar] [CrossRef]
  41. Aitkenhead, M.J.; Aitkenhead-Peterson, J.A.; McDowell, W.H.; Smart, R.P.; Cresser, M.S. Modelling DOC Export from Watersheds in Scotland Using Neural Networks. Comput. Geosci. 2007, 33, 423–436. [Google Scholar] [CrossRef]
  42. Fu, Y.; Zhao, Y.; Zhang, Y.; Guo, T.; He, Z.; Chen, J. GIS and ANN-Based Spatial Prediction of DOC in River Networks: A Case Study in Dongjiang, Southern China. Environ. Earth Sci. 2013, 68, 1495–1505. [Google Scholar] [CrossRef]
  43. Birkel, C.; Soulsby, C.; Tetzlaff, D. Integrating Parsimonious Models of Hydrological Connectivity and Soil Biogeochemistry to Simulate Stream DOC Dynamics. J. Geophys. Res. Biogeosci. 2014, 119, 1030–1047. [Google Scholar] [CrossRef]
  44. Banoub, M.W. Ultra Violet Absorption as a Measure of Organic Matter in Natural Waters in Bodensee. Arch. Hydrobiol. 1973, 71, 159–165. [Google Scholar]
  45. Stewart, A.J.; Wetzel, R.G. Asymmetrical Relationships between Absorbance, Fluorescence, and Dissolved Organic Carbon 1. Limnol. Oceanogr. 1981, 26, 590–597. [Google Scholar] [CrossRef]
  46. Marhaba, T.F.; Bengraine, K.; Pu, Y.; Aragó, J. Spectral Fluorescence Signatures and Partial Least Squares Regression: Model to Predict Dissolved Organic Carbon in Water. J. Hazard. Mater. 2003, 97, 83–97. [Google Scholar] [CrossRef]
  47. Carter, H.T.; Tipping, E.; Koprivnjak, J.F.; Miller, M.P.; Cookson, B.; Hamilton-Taylor, J. Freshwater DOM Quantity and Quality from a Two-Component Model of UV Absorbance. Water Res. 2012, 46, 4532–4542. [Google Scholar] [CrossRef] [PubMed]
  48. Mannino, A.; Russ, M.E.; Hooker, S.B. Algorithm Development and Validation for Satellite-Derived Distributions of DOC and CDOM in the US Middle Atlantic Bight. J. Geophys. Res. Oceans 2008, 113, C07051. [Google Scholar] [CrossRef]
  49. Hoge, F.E.; Williams, M.E.; Swift, R.N.; Yungel, J.K.; Vodacek, A. Satellite Retrieval of the Absorption Coefficient of Chromophoric Dissolved Organic Matter in Continental Margins. J. Geophys. Res. Oceans 1995, 100, 24847–24854. [Google Scholar] [CrossRef]
  50. Asmala, E.; Stedmon, C.A.; Thomas, D.N. Linking CDOM Spectral Absorption to Dissolved Organic Carbon Concentrations and Loadings in Boreal Estuaries. Estuar. Coast. Shelf Sci. 2012, 111, 107–117. [Google Scholar] [CrossRef]
  51. Tehrani, N.C.; D’Sa, E.J.; Osburn, C.L.; Bianchi, T.S.; Schaeffer, B.A. Chromophoric Dissolved Organic Matter and Dissolved Organic Carbon from Sea-Viewing Wide Field-of-View Sensor (SeaWiFS), Moderate Resolution Imaging Spectroradiometer (MODIS) and MERIS Sensors: Case Study for the Northern Gulf of Mexico. Remote Sens. 2013, 5, 1439–1464. [Google Scholar] [CrossRef]
  52. Ferrari, G.M. The Relationship between Chromophoric Dissolved Organic Matter and Dissolved Organic Carbon in the European Atlantic Coastal Area and in the West Mediterranean Sea (Gulf of Lions). Mar. Chem. 2000, 70, 339–357. [Google Scholar] [CrossRef]
  53. Nelson, N.B.; Siegel, D.A. The Global Distribution and Dynamics of Chromophoric Dissolved Organic Matter. Ann. Rev. Mar. Sci. 2013, 5, 447–476. [Google Scholar] [CrossRef] [PubMed]
  54. Hestir, E.L.; Brando, V.; Campbell, G.; Dekker, A.; Malthus, T. The Relationship between Dissolved Organic Matter Absorption and Dissolved Organic Carbon in Reservoirs along a Temperate to Tropical Gradient. Remote Sens. Environ. 2015, 156, 395–402. [Google Scholar] [CrossRef]
  55. Kowalczuk, P.; Tilstone, G.H.; Zablocka, M.; Roettgers, R.; Thomas, R. Composition of Dissolved Organic Matter along an Atlantic Meridional Transect from Fluorescence Spectroscopy and Parallel Factor Analysis. Mar. Chem. 2013, 157, 170–184. [Google Scholar] [CrossRef]
  56. Catala, T.S.; Alvarez-Salgado, X.A.; Otero, J.; Iuculano, F.; Companys, B.; Horstkotte, B.; Romera-Castillo, C.; Nieto-Cid, M.; Latasa, M.; Moran, X.A.G.; et al. Drivers of Fluorescent Dissolved Organic Matter in the Global Epipelagic Ocean. Limnol. Oceanogr. 2016, 61, 1101–1119. [Google Scholar] [CrossRef]
  57. Iuculano, F.; Alvarez-Salgado, X.A.; Otero, J.; Catala, T.S.; Sobrino, C.; Duarte, C.M.; Agusti, S. Patterns and Drivers of UV Absorbing Chromophoric Dissolved Organic Matter in the Euphotic Layer of the Open Ocean. Front. Mar. Sci. 2019, 6, 320. [Google Scholar] [CrossRef]
  58. Spencer, R.G.M.; Ahad, J.M.E.; Baker, A.; Cowie, G.L.; Ganeshram, R.; Upstill-Goddard, R.C.; Uher, G. The Estuarine Mixing Behaviour of Peatland Derived Dissolved Organic Carbon and Its Relationship to Chromophoric Dissolved Organic Matter in Two North Sea Estuaries (UK). Estuar. Coast. Shelf Sci. 2007, 74, 131–144. [Google Scholar] [CrossRef]
  59. Massicotte, P.; Asmala, E.; Stedmon, C.; Markager, S. Global Distribution of Dissolved Organic Matter along the Aquatic Continuum: Across Rivers, Lakes and Oceans. Sci. Total Environ. 2017, 609, 180–191. [Google Scholar] [CrossRef]
  60. Siegel, D.A.; Maritorena, S.; Nelson, N.B.; Hansell, D.A.; Lorenzi-Kayser, M. Global Distribution and Dynamics of Colored Dissolved and Detrital Organic Materials. J. Geophys. Res. Oceans 2002, 107, 3228. [Google Scholar] [CrossRef]
  61. Johannessen, S.C.; Miller, W.L.; Cullen, J.J. Calculation of UV Attenuation and Colored Dissolved Organic Matter Absorption Spectra from Measurements of Ocean Color. J. Geophys. Res. Oceans 2003, 108, 3301. [Google Scholar] [CrossRef]
  62. Fichot, C.G.; Benner, R.A. Novel Method to Estimate DOC Concentrations from CDOM Absorption Coefficients in Coastal Waters. Geophys. Res. Lett. 2011, 38, L03610. [Google Scholar] [CrossRef]
  63. Li, S.; Chen, Y.; Zhang, J.; Song, K.; Mu, G.; Sun, C.; Ju, H.; Ji, M. The Relationship of Chromophoric Dissolved Organic Matter Parallel Factor Analysis Fluorescence and Polycyclic Aromatic Hydrocarbons in Natural Surface Waters. Environ. Sci. Pollut. Res. 2018, 25, 1428–1438. [Google Scholar] [CrossRef] [PubMed]
  64. Shao, T.; Wang, T. Effects of Land Use on the Characteristics and Composition of Fluvial Chromophoric Dissolved Organic Matter (CDOM) in the Yiluo River Watershed, China. Ecol. Indic. 2020, 114, 106332. [Google Scholar] [CrossRef]
  65. Li, D.; Pan, B.; Han, X.; Li, J.; Zhu, Q.; Li, M. Assessing the Potential to Use CDOM as an Indicator of Water Quality for the Sediment-Laden Yellow River, China. Environ. Pollut. 2021, 289, 117970. [Google Scholar] [CrossRef] [PubMed]
  66. Ma, J.; Zhan, H.; Du, Y. Seasonal and Interannual Variability of Surface CDOM in the South China Sea Associated with El Nino. J. Mar. Syst. 2011, 85, 86–95. [Google Scholar] [CrossRef]
  67. Gardner, W.D.; Mishonov, A.V.; Richardson, M.J. Global POC Concentrations from In-Situ and Satellite Data. Deep Sea Res. Part II-Top. Stud. Oceanogr. 2006, 53, 718–740. [Google Scholar] [CrossRef]
  68. Lorenzoni, L.; Hu, C.; Varela, R.; Arias, G.; Guzman, L.; Muller-Karger, F. Bio-Optical Characteristics of Cariaco Basin (Caribbean Sea) Waters. Cont. Shelf Res. 2011, 31, 582–593. [Google Scholar] [CrossRef]
  69. Liu, N.; Chen, S.; Cheng, Z.; Wang, X.; Xiao, Y.; Xiao, L.; Gong, Y.; Wang, T.; Zhang, X.; Liu, S. Long-Term Prediction of Sea Surface Chlorophyll-a Concentration Based on the Combination of Spatio-Temporal Features. Water Res. 2022, 211, 118040. [Google Scholar]
  70. Hu, W.J.; Jiang, W.W.; Hao, T.Y.; Xu, Y.; Zhao, B.M. Integrated geophysical research on the distribution of Pre-Cenozoic residual basins in the South China Sea. Chin. J. Geophys. Chin. Ed. 2011, 54, 3315–3324. [Google Scholar]
  71. Chu, P.C.; Fan, C.W.; Lozano, C.J.; Kerling, J.L. An Airborne Expendable Bathythermograph Survey of the South China Sea, May 1995. J. Geophys. Res. Oceans 1998, 103, 21637–21652. [Google Scholar] [CrossRef]
  72. Pan, X.; Wong, G.T.F.; Shiah, F.K.; Ho, T.Y. Enhancement of Biological Productivity by Internal Waves: Observations in the Summertime in the Northern South China Sea. J. Oceanogr. 2012, 68, 427–437. [Google Scholar] [CrossRef]
  73. Pan, X.; Wong, G.T.F.; Ho, T.Y.; Shiah, F.K.; Liu, H. Remote Sensing of Picophytoplankton Distribution in the Northern South China Sea. Remote Sens. Environ. 2013, 128, 162–175. [Google Scholar] [CrossRef]
  74. Ho, T.Y.; Pan, X.; Yang, H.H.; Wong, G.T.F.; Shiah, F.K. Controls on Temporal and Spatial Variations of Phytoplankton Pigment Distribution in the Northern South China Sea. Deep-Sea Res. Part II-Top. Stud. Oceanogr. 2015, 117, 65–85. [Google Scholar] [CrossRef]
  75. Callahan, J.; Dai, M.H.; Chen, R.F.; Li, X.L.; Lu, Z.M.; Huang, W. Distribution of Dissolved Organic Matter in the Pearl River Estuary, China. Mar. Chem. 2004, 89, 211–224. [Google Scholar] [CrossRef]
  76. Dai, M.; Liu, H.X.; Liao, X.L.; Li, K.Z.; Yan, J.G.; Qi, H.Z.; Huang, H.H. Characteristics of net phytoplankton community and their relationships to environmental factors in the waters around Nansha Islands. J. Appl. Ecol. 2013, 24, 3553–3560. [Google Scholar]
  77. Qu, T.; Song, Y.T.; Yamagata, T. An Introduction to the South China Sea Throughflow: Its Dynamics, Variability, and Application for Climate. Dyn. Atmos. Ocean 2009, 47, 3–14. [Google Scholar] [CrossRef]
  78. Yan, H.; Yu, K.; Shi, Q.; Tan, Y.; Zhang, H.; Zhao, M.; Li, S.; Chen, T.; Huang, L.; Wang, P. Coral Reef Ecosystems in the South China Sea as a Source of Atmospheric CO2 in Summer. Chin. Sci. Bull. 2011, 56, 676–684. [Google Scholar] [CrossRef]
  79. Chai, F.; Liu, G.; Xue, H.; Shi, L.; Chao, Y.; Tseng, C.M.; Chou, W.C.; Liu, K.K. Seasonal and Interannual Variability of Carbon Cycle in South China Sea: A Three-Dimensional Physical-Biogeochemical Modeling Study. J. Oceanogr. 2009, 65, 703–720. [Google Scholar] [CrossRef]
  80. Sun, Q.; Tang, D.; Legendre, L.; Shi, P. Enhanced Sea-Air CO2 Exchange Influenced by a Tropical Depression in the South China Sea. J. Geophys. Res.-Oceans 2014, 119, 6792–6804. [Google Scholar] [CrossRef]
  81. Boss, E.; Pegau, W.S.; Zaneveld, J.R.V.; Barnard, A.H. Spatial and Temporal Variability of Absorption by Dissolved Material at a Continental Shelf. J. Geophys. Res. Oceans 2001, 106, 9499–9507. [Google Scholar] [CrossRef]
  82. Bricaud, A.; Morel, A.; Prieur, L. Absorption by Dissolved Organic Matter of the Sea (Yellow Substance) in the UV and Visible Domains. Limnol Oceanogr. 1981, 26, 43–53. [Google Scholar] [CrossRef]
  83. Seferian, R.; Bopp, L.; Gehlen, M.; Swingedouw, D.; Mignot, J.; Guilyardi, E.; Servonnat, J. Multiyear Predictability of Tropical Marine Productivity. Proc. Natl. Acad. Sci. USA 2014, 111, 11646–11651. [Google Scholar] [CrossRef] [PubMed]
  84. Stramski, D.; Reynolds, R.A.; Babin, M.; Kaczmarek, S.; Lewis, M.R.; Roettgers, R.; Sciandra, A.; Stramska, M.; Twardowski, M.S.; Franz, B.A.; et al. Relationships between the Surface Concentration of Particulate Organic Carbon and Optical Properties in the Eastern South Pacific and Eastern Atlantic Oceans. Biogeosciences 2008, 5, 171–201. [Google Scholar] [CrossRef]
  85. Cui, W.S.; Pan, D.L.; Bai, Y.; He, X.Q.; Zhu, Q.K.; Hu, Z.F.; Li, T.; Gong, F.; Zhang, L. Satellite Views of the Seasonal and Interannual Variations of the Particulate Organic Carbon in the Northern South China Sea. Hai Yang Xue Bao 2017, 39, 122–134. [Google Scholar]
  86. Kim, J.; Jang, W.; Kim, J.H.; Lee, J.; Cho, K.H.; Lee, Y.G.; Chon, K.; Park, S.; Pyo, J.; Park, Y.; et al. Application of Airborne Hyperspectral Imagery to Retrieve Spatiotemporal CDOM Distribution Using Machine Learning in a Reservoir. Int. J. Appl. Earth Obs. Geoinform. 2022, 114, 103053. [Google Scholar] [CrossRef]
  87. Zhang, G.; Chen, S.; Meng, F.; Fan, X. Inversion of yellow substance concentration and its spatialtemporal variation analysis in Ledong waters, South China Sea. Glob. Geol. 2017, 36, 305–310. (In Chinese) [Google Scholar]
  88. Tassan, S. Local Algorithms Using Seawifs Data for the Retrieval of Phytoplankton, Pigments, Suspended Sediment, and Yellow Substance in Coastal Waters. Appl. Opt. 1994, 33, 2369–2378. [Google Scholar] [CrossRef]
  89. Hung, J.J.; Wang, S.M.; Chen, Y.L. Biogeochemical Controls on Distributions and Fluxes of Dissolved and Particulate Organic Carbon in the Northern South China Sea. Deep Sea Res. Part II-Top. Stud. Oceanogr. 2007, 54, 1486–1503. [Google Scholar] [CrossRef]
  90. Wang, C.; Li, Y.; Li, Y.; Zhou, H.; Stubbins, A.; Dahlgren, R.A.; Wang, Z.; Guo, W. Dissolved Organic Matter Dynamics in the Epipelagic Northwest Pacific Low-Latitude Western Boundary Current System: Insights from Optical Analyses. J. Geophys. Res. Oceans 2021, 126, e2021JC017458. [Google Scholar] [CrossRef]
  91. Alford, M.H.; Peacock, T.; MacKinnon, J.A.; Nash, J.D.; Buijsman, M.C.; Centuroni, L.R.; Chao, S.Y.; Chang, M.H.; Farmer, D.M.; Fringer, O.B.; et al. The Formation and Fate of Internal Waves in the South China Sea. Nature 2015, 521, 65–69. [Google Scholar] [CrossRef]
  92. Ma, H.; Yang, W.; Zhang, L.; Zhang, R.; Chen, M.; Qiu, Y.; Zheng, M. Utilizing 210 P o Deficit to Constrain Particle Dynamics in Mesopelagic Water, Western S Outh C Hina S Ea. Geochem. Geophys. Geosyst. 2017, 18, 1594–1607. [Google Scholar] [CrossRef]
  93. Liu, K.K.; Kao, S.J.; Hu, H.C.; Chou, W.C.; Hung, G.W.; Tseng, C.M. Carbon Isotopic Composition of Suspended and Sinking Particulate Organic Matter in the Northern South China Sea–From Production to Deposition. Deep Sea Res. Part II-Top. Stud. Oceanogr. 2007, 54, 1504–1527. [Google Scholar] [CrossRef]
  94. Li, Y.; Song, G.; Massicotte, P.; Yang, F.; Li, R.; Xie, H. Distribution, Seasonality, and Fluxes of Dissolved Organic Matter in the Pearl River (Zhujiang) Estuary, China. Biogeosciences 2019, 16, 2751–2770. [Google Scholar] [CrossRef]
  95. Nelson, N.B.; Siegel, D.A.; Michaels, A.F. Seasonal Dynamics of Colored Dissolved Material in the Sargasso Sea. Deep Sea Res. Part Oceanogr. Res. Pap. 1998, 45, 931–957. [Google Scholar] [CrossRef]
  96. Moran, M.A.; Zepp, R.G. Role of Photoreactions in the Formation of Biologically Labile Compounds from Dissolved Organic Matter. Limnol. Oceanogr. 1997, 42, 1307–1316. [Google Scholar] [CrossRef]
  97. Sharpless, C.M.; Blough, N.V. The Importance of Charge-Transfer Interactions in Determining Chromophoric Dissolved Organic Matter (CDOM) Optical and Photochemical Properties. Environ. Sci. Process. Impacts 2014, 16, 654–671. [Google Scholar] [CrossRef]
  98. Helms, J.R.; Stubbins, A.; Perdue, E.M.; Green, N.W.; Chen, H.; Mopper, K. Photochemical Bleaching of Oceanic Dissolved Organic Matter and Its Effect on Absorption Spectral Slope and Fluorescence. Mar. Chem. 2013, 155, 81–91. [Google Scholar] [CrossRef]
  99. Vodacek, A.; Blough, N.V.; DeGrandpre, M.D.; Peltzer, E.T.; Nelson, R.K. Seasonal Variation of CDOM and DOC in the Middle Atlantic Bight: Terrestrial Inputs and Photooxidation. Limnol. Oceanogr. 1997, 42, 674–686. [Google Scholar] [CrossRef]
Figure 1. Study area that has undergone grid-based processing. The solid line represents Liyue Tan. The location map in the figure was prepared by the Ministry of Natural Resources of the People’s Republic of China under review number GS(2019)1652.
Remotesensing 15 04218 g001
Figure 2. Correlation analysis of three indicators: Chl-a, POC, and CDOM.
Remotesensing 15 04218 g002
Figure 3. The mutual information heatmaps among all grid cells. In (a), the mutual information entropy of the POC metric is visualized, while in (b), the mutual information entropy of the CDOM metric is depicted.
Remotesensing 15 04218 g003
Figure 4. The fitting curves of actual and predicted values for single-step prediction using the CNN-LSTM model. (a) represents the fitting curve for actual and predicted values of POC, while (b) illustrates the fitting curve for actual and predicted values of CDOM.
Remotesensing 15 04218 g004
Figure 5. Pearson correlation coefficient of the 5-year long-term prediction of the POC series in all grid regions.
Remotesensing 15 04218 g005
Figure 6. Pearson correlation coefficient of the 5-year long-term prediction of CDOM sequences in all grid regions.
Remotesensing 15 04218 g006
Table 1. Prediction error of POC and CDOM.
POC (mg/m3)CDOM (m−1)
MAE1.680.272
MSE5.840.136
Table 2. Interannual trend analysis.
IndexTrend TestActual ValuePredicted Value
POCM-K testZ1.160.160
P0.3200.250
Least squaresk1.84 × 10−23.28 × 10⁻³
b39.141.6
CDOMM-K testZ0.452−0.376
P0.6080.234
Least squaresk1.31 × 10−33.69 × 10⁻⁴
b1.341.43
Disclaimer/Publisher’s Note: The statements, opinions and data contained in all publications are solely those of the individual author(s) and contributor(s) and not of MDPI and/or the editor(s). MDPI and/or the editor(s) disclaim responsibility for any injury to people or property resulting from any ideas, methods, instructions or products referred to in the content.

