Article

Improving the Accuracy of Random Forest Classifier for Identifying Burned Areas in the Tangier-Tetouan-Al Hoceima Region Using Google Earth Engine

1
Geomatics, Remote Sensing and Cartography Unit FSTT, Abdelmalek Essaadi University, Tetouan 93000, Morocco
2
Institute for Systems and Robotics (ISR), Insituto Superior Technico, 1049-001 Lisbon, Portugal
3
National Institute of Oceanography and Applied Geophysics (OGS), Centre for Management of Maritime Infrastructure (CGN), Borgo Grotta Gigante 42/C, 34010 Sgonico Trieste, Italy
4
MARETEC—Marine, Environment and Technology Center, Instituto Superior Tecnico, Universidade de Lisboa, Av. Rovisco Pais 1, 1049-001 Lisboa, Portugal
*
Author to whom correspondence should be addressed.
Remote Sens. 2023, 15(17), 4226; https://doi.org/10.3390/rs15174226
Submission received: 14 July 2023 / Revised: 11 August 2023 / Accepted: 22 August 2023 / Published: 28 August 2023
(This article belongs to the Special Issue Image Analysis for Forest Environmental Monitoring)

Abstract

:
Forest fires have become a major concern in the northern parts of Morocco, particularly in the Tangier-Tetouan-Al Hoceima (TTA) region, causing significant damage to the environment and human lives. To address this pressing issue, this study proposes an approach that utilizes remote sensing (RS) and machine learning (ML) techniques to detect burned areas in the TTA region within the Google Earth Engine platform. The study focuses on burned areas resulting from forest fires in three specific locations in the TTA region that have experienced such fires in recent years, namely Tangier-Assilah in 2017, M’diq Fnideq in 2020, and Chefchaouen in 2021. In our study, we extensively explored multiple combinations of spectral indices, such as normalized burn ratio (dNBR), normalized difference vegetation index (dNDVI), soil-adjusted vegetation index (dSAVI), and burned area index (dBAI), in conjunction with Sentinel-2 (S2) satellite images. These combinations were employed within the Random Forest (RF) algorithm, allowing us to draw important conclusions. Initially, we assess the individual effectiveness of the dNBR index, which yields accuracy rates of 83%, 90%, and 82% for Tangier-Assilah, Chefchaouen, and M’diq Fnideq, respectively. Recognizing the need for improved outcomes, we expand our analysis by incorporating spectral indices and S2 bands. However, the results obtained from this expanded combination lack consistency and stability across different locations. While Tangier-Assilah and M’diq Fnideq experience accuracy improvements, reaching 95% and 88%, respectively, the inclusion of Sentinel bands has an adverse effect on Chefchaouen, resulting in a decreased accuracy of 87%. To achieve optimal accuracy, our focus shifted towards the combination of dNBR and the other spectral indices. The results were truly remarkable, with accuracy rates of 96%, 97%, and 97% achieved for Tangier-Assilah, Chefchaouen, and M’diq Fnideq, respectively. Our decision to prioritize the spectral indices was based on the feature importance method, which highlights the significance of each feature in the classification process. The practical implications of our study extend to fire management and prevention in the TTA region. The insights gained from our analysis can inform the development of effective policies and strategies to mitigate the impact of forest fires. By harnessing the potential of RS and ML techniques, along with the utilization of spectral indices, we pave the way for enhanced fire monitoring and response capabilities in the region.

1. Introduction

Forests are precious assets that provide us with valuable resources, such as wood, and support more than half of all species, playing a vital role in regulating the global climate and preventing soil erosion [1]. Despite their importance, forests are facing various threats, including natural disasters such as forest fires, which not only destroy vegetation cover and impact biodiversity [2,3], but also have significant economic and physical impacts on humans, such as respiratory diseases [1]. Fires have long been an important component of ecosystems and have been used for many years to regulate their functioning; they also contribute to mineralization and nutrient release [3]. However, lately, with climate change and the increase in human activities, the intensity of forest fires is causing more damage than benefits [1,3]. The main causes of forest fires are human, such as smoking, the use of explosives, and sparks in power lines; and natural, such as lightning [4], dry seasons, or temperature conditions [5].
The spread of forest fires is influenced by various forest characteristics, including the density and height of trees, the amount of dead wood and debris, and the amount of moisture present in the vegetation. To effectively manage forest fires, it is crucial to identify burned areas accurately and monitor their temporal progression [5]. In this context, RS and ML techniques have proven to be effective for monitoring burned areas, providing accurate and cost-effective data over large areas with high temporal resolution [5,6,7,8].
RS-based forest fire monitoring has been used for different purposes, such as fire area detection, smoke detection, and burned area recovery [4,9,10]. In [11], the authors used remote sensing techniques to detect and track wildfires in Greece. Specifically, they used data from the Spinning Enhanced Visible and Infrared Imager (SEVIRI) sensor onboard the Meteosat Second Generation (MSG) satellite to detect and track active fires in near real-time. Ref. [12] used high spatial resolution satellite imagery to estimate the burn severity of the vegetation at multiple spatial scales, ranging from individual trees to the entire ecosystem. The study aimed to evaluate the potential of using remote sensing data to improve post-fire management and restoration efforts. Many studies have relied on the calculation of spectral indices to study forest fires. For example, in [13], a new approach for detecting burned areas using a fire index-based method with Landsat-8 OLI data is discussed. The article explores the calculation of various spectral indices and their potential for identifying changes in burned regions. In the article [14], a study was conducted to assess various spectral indices for detecting burned regions in the savannas of southern Burkina Faso through Landsat time series imagery.
Combining RS and ML using cloud computing can improve image processing speed and avoid cloud cover bias [15]. ML algorithms provide optimal results by selecting important features [4]. Many studies have mapped burned areas on this basis. For example, Ref. [16] discusses the development and testing of an artificial neural network (ANN) for mapping burned areas on a regional scale in the Iberian Peninsula using MODIS (Moderate Resolution Imaging Spectroradiometer) imagery. Ref. [17] compares two machine learning classification methods, RF and Support Vector Machine (SVM), for remote sensing predictive modeling of forest fires in northeastern Siberia. Ref. [18] used three different machine learning algorithms, namely RF, SVM, and ANN, along with remotely sensed data, to predict the likelihood of wildfire occurrence in the Adana and Mersin provinces of Turkey.
Our research addresses a research gap existing in the northern region of Morocco, specifically focusing on the accurate identification of areas that have been burned. This gap becomes evident within the delicate forests that are subjected to changing climate patterns and human influences. In particular, there is an opportunity to enhance detection capabilities by combining spectral indices with machine learning techniques. In light of this, our study’s objective is to identify burned areas in this region by employing S2 imagery, machine learning, and the GEE platform.
The study’s context underscores the importance of forests and their vulnerability to wildfires, which have become more frequent due to climate change and human activities. To enhance the accuracy of detecting burned areas, our study presents a methodology that integrates various spectral indices and machine learning algorithms, with a specific focus on Random Forest (RF). Additionally, the article investigates how the accuracy of RF is affected by the combination of multiple spectral indices. The technical development of the study involves using RS data to map burned areas by identifying changes in vegetation indices before and after a fire event. The study employs ML algorithms to analyze the spectral indices and classify the burned areas. The combination of spectral indices and an RF algorithm enhances the accuracy of burned area detection, providing a cost-effective and efficient way to monitor forest fires. The findings have significant implications for forest management and conservation efforts, as accurate and timely monitoring of forest fires is critical for protecting these vital ecosystems.
Overall, this study contributes to the development of more effective methods for identifying and monitoring burned areas using RS and ML techniques. By improving the accuracy of burned area detection, this research can help forest managers and conservationists take proactive measures to mitigate the impact of forest fires and preserve these invaluable ecosystems.

2. Materials and Methods

2.1. Study Areas

This study was conducted in the TTA region, which is one of the twelve regions of Morocco and located in its northernmost part [19]. It is a diverse region, both geologically (coastal areas such as Tangier and Tetouan, mountain ranges such as Chefchaouen) and environmentally due to the variety of its climate, ranging from humid Mediterranean to sub-humid. It is bounded by the Mediterranean Sea to the north, the Rabat-Sale-Kenitra region to the south, the Oriental region to the east, and the Atlantic Ocean to the west [20].
Our first region is Tangier-Assilah, located in the northwest of Morocco. It is the second economic center of Morocco and the capital of the TTA region [21]. We will mainly focus on the Cap Spartel area, one of the most famous forests in northern Morocco, located in Jbel Kebir, west of Tangier, in northern Morocco. Cap Spartel serves as the meeting point between the Mediterranean Sea and the Atlantic Ocean, located about 300 m above sea level, 14 km west of Tangier [22]. The forests of Cap Spartel are known for their density and are located on the coastal area of Tangier, with cliffs, beaches, and forests with native vegetation that are part of the Cape Spartel Nature Reserve [22] (Figure 1).
The second region is Chefchaouen, which is located in the Rif Mountains in northwest Morocco [23]. It is bounded on the northwest by Tetouan, on the northeast by the Mediterranean Sea, on the east by Al Hoceima, on the southeast by Taounate, on the southwest by Ouezzane, and on the west by Larache [24]. The climate is Mediterranean: pre-humid in the mountainous areas, humid in winter, and dry in summer in the plain [25]. One of the most remarkable places in Chefchaouen is Jbel Sougna, which is known for its cork oak forest [26] (Figure 2).
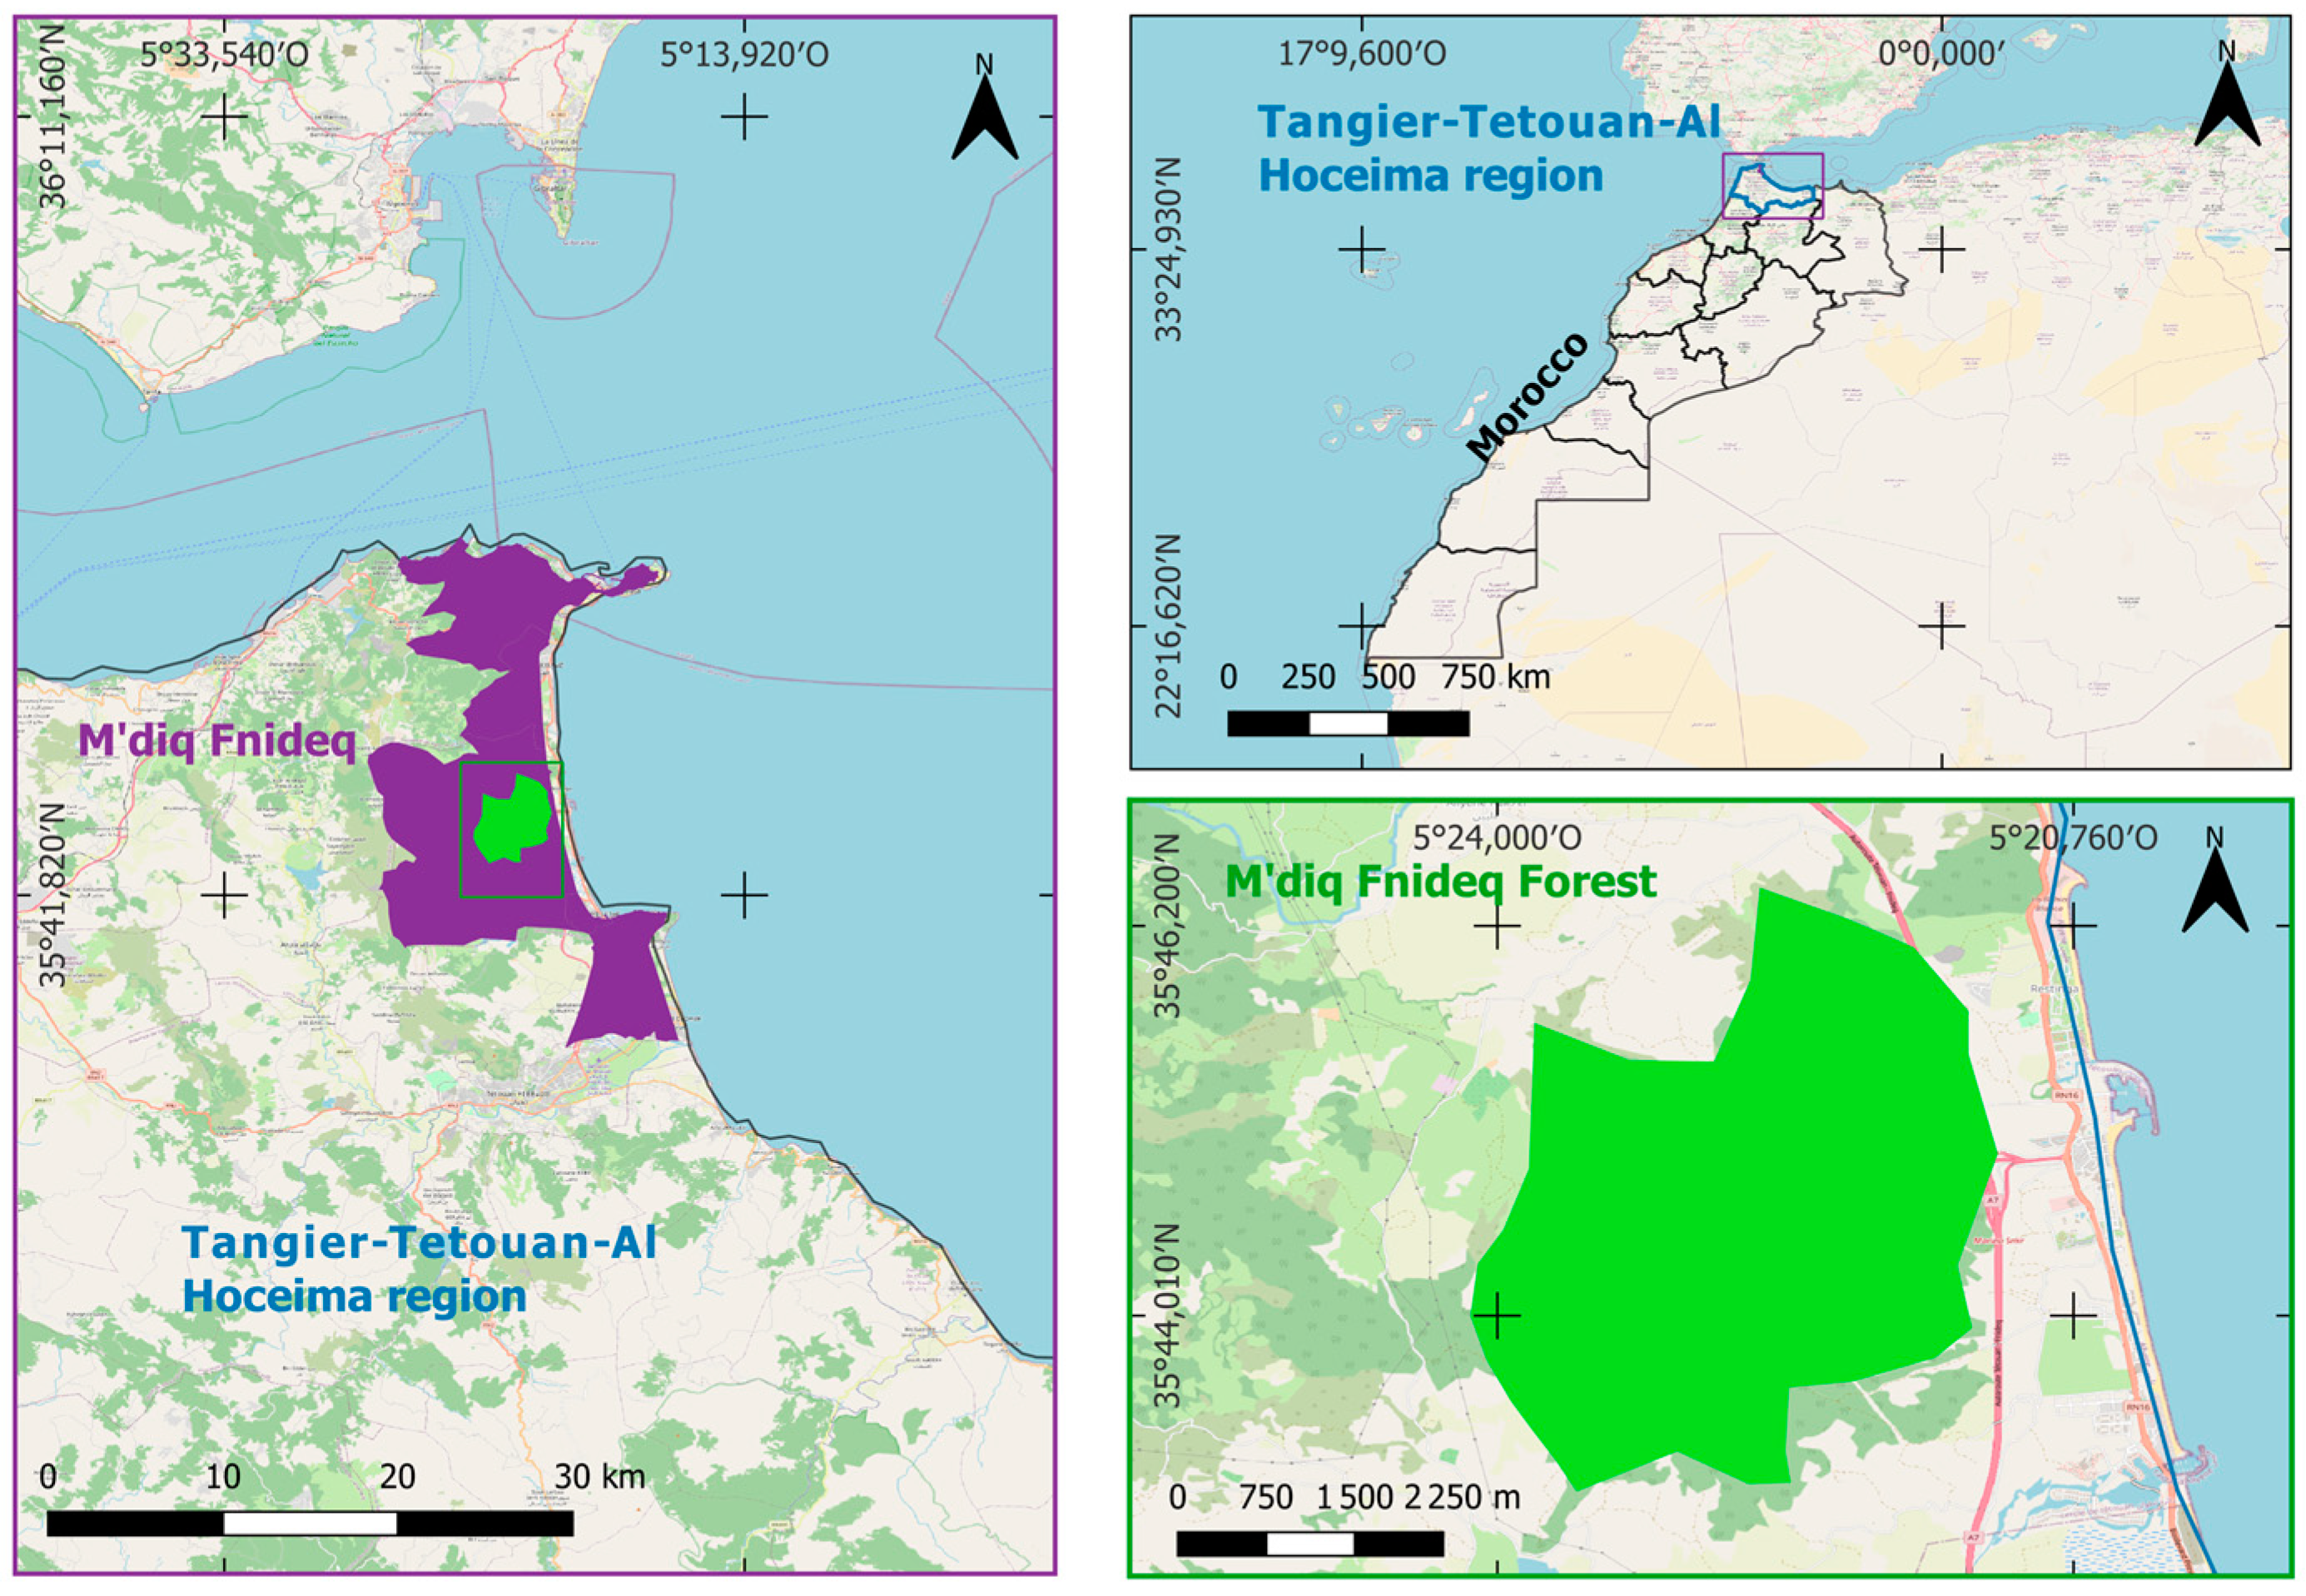
Our third area is in M’diq Fnideq. It is located 7 km from Tetouan and is bordered to the north by Fnideq, to the south by Mallaliyine, to the west by the municipality of Alleyine, and to the east by the Mediterranean Sea [27]. In general, the climate is characterized by hot and dry summers and sometimes very cold winters [28]. It has two different forest ecosystems (cork oak and cedar) and a very rich fauna [29] (Figure 3).

2.2. Data and Processing Tools

2.2.1. Harmonized Sentinel-2

For the present study, we used the Harmonized S2 MSI: Multispectral Instrument, Level-2A collection. S2 was developed by the European Space Agency (ESA) for Earth observation as part of the Copernicus program [30]. The Multi-Spectral Instrument (MSI) bands have different spatial resolutions between 10 and 20 m, depending on the band considered [30] (Table 1). S2 has high resolution, a large field of view, and multispectral bands [31]. S2 bands are suitable for fire monitoring; short-wave infrared bands (SWIR) are particularly instructive because the energy in the wavelength can penetrate moderate smoke [32].

2.2.2. Google Earth Engine (GEE) Platform

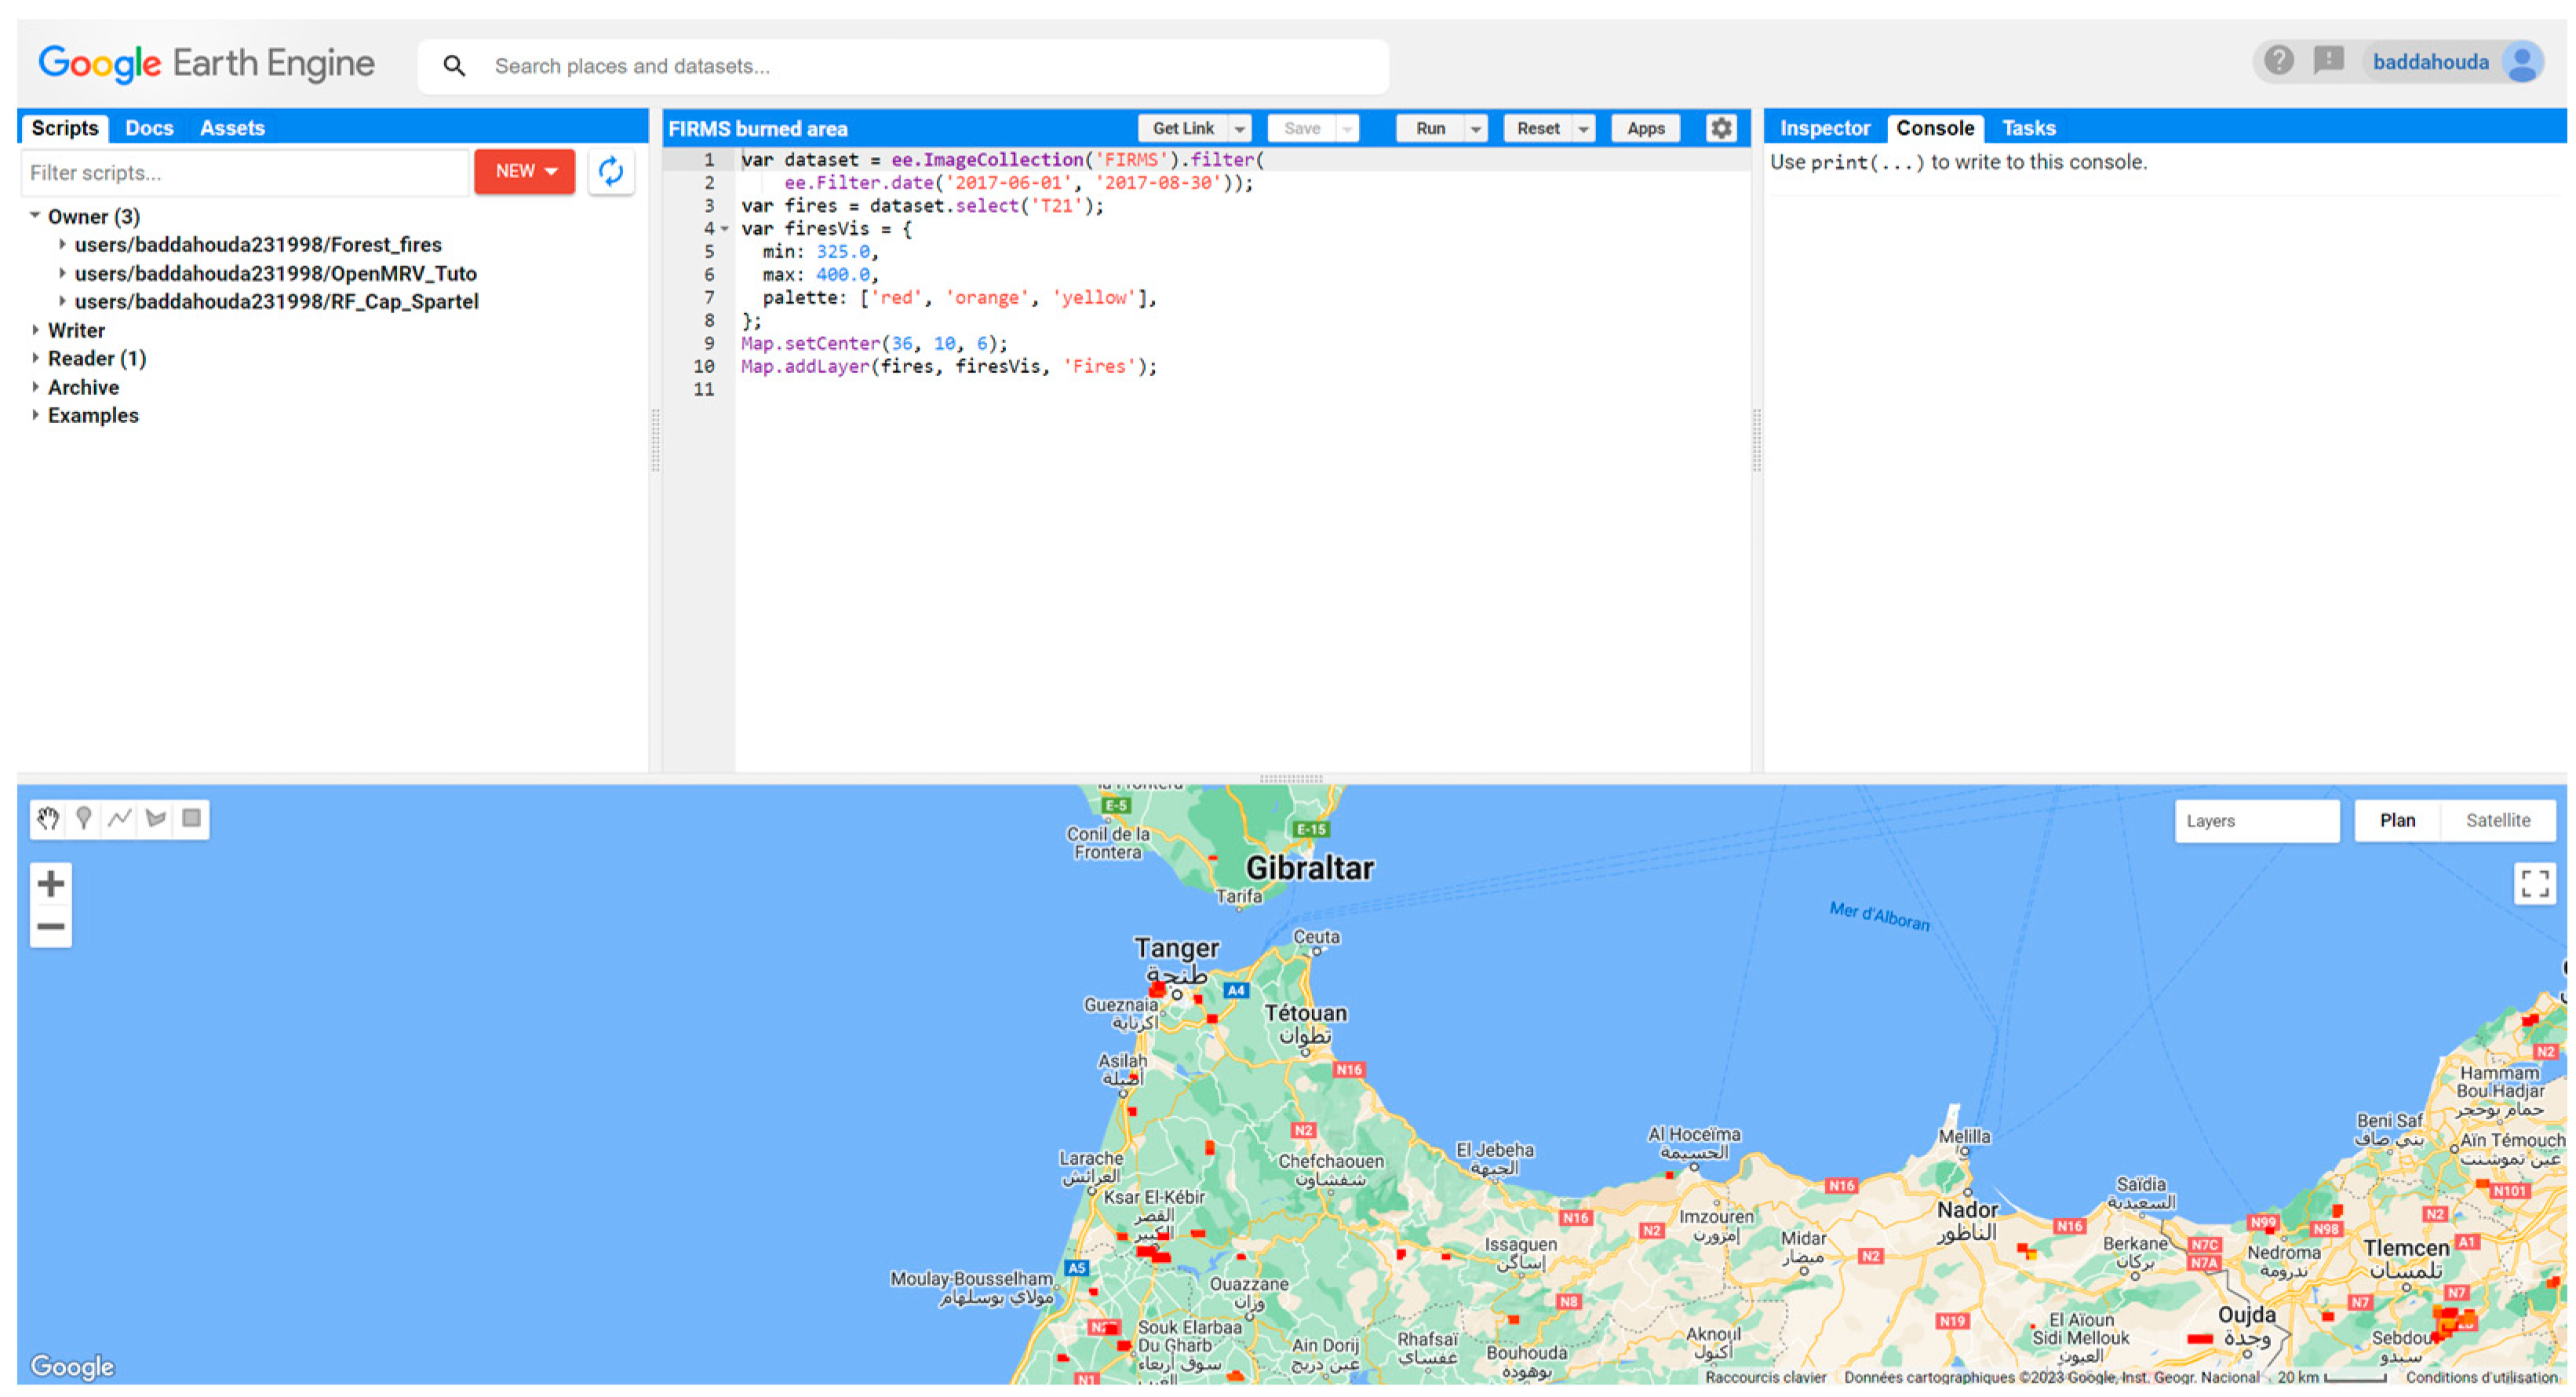
GEE is an open-source cloud computing platform for processing satellite imagery [15] (Figure 4). It uses the Google cloud and JavaScript and takes advantage of Google’s computing infrastructure to speed up time-consuming processing tasks [34]. GEE is widely used due to its access to satellite image time series from multiple sources, including Sentinel 1, 2, and 3, the Landsat series, MODIS, and vector data, as well as its software and algorithms for processing these data [35]. GEE is used in various fields, including land cover classification and forest monitoring [36]. Additionally, GEE enables users to perform analyses and interpretations without the need to download the data by calling available functions [2]. The link to GEE is https://code.earthengine.google.com/ (accessed on 10 July 2023).

2.2.3. Random Forest Classifier

The RF algorithm is a non-parametric, supervised ML classifier [2]. RF classifiers are constructed from multiple aggregated random decision trees to classify a dataset using the prediction mode of all decision trees [37]. This classifier is often used in RS applications, such as the forest fire field, due to the accuracy of its classifications compared to simple decision trees [32,37]. The RF algorithm is optimized according to the number of regression trees and the number of predictors at each split [2]. RF classification can be performed in GEE. It uses six input parameters: the number of classification trees, the number of variables used in each classification tree, the minimum leaf population, the bagged fraction of input variables per decision tree, the out-of-bag mode, and the construction of random seed variable decision trees [37].

2.2.4. Fire Information for Resource Management System (FIRMS)

FIRMS data are based on MODIS and VIIRS (Visible Infrared Imaging Radiometer Suite) products, providing near-real-time active fires/hotspots in over 160 countries through an interactive Web GIS [38]. It was initially developed by the University of Maryland with funding from NASA’s Applied Science Program and the Food and Agriculture Organization of the United Nations [39]. The four primary applications of FIRMS are Online Mapping Services, MODIS Active Fire Datasets, MODIS Image Subsets, and Email Fire Alerts [40].

2.2.5. Global Land Analysis and Discovery (GLAD)

Global Land Analysis and Discovery (GLAD) is developed at the University of Maryland. It is used to generate maps of forest cover, i.e., trees at least 5 m tall, at 30 m spatial resolution from the year 2000 to 2020 [41,42]. GLAD forest cover products are mainly intended to serve as a near-real-time indicator of areas of forest loss [41]. They are free and widely available [43]. GLAD uses satellite imagery to collect weekly data on deforestation in all areas and compares it to historical data to determine where trees have been lost [44]. We can access GLAD data directly on GEE [44].

2.3. Data Processing

2.3.1. Spectral Indices

In this study, we used four spectral indices. Their descriptions are given below.
  • Normalized burn ratio (NBR): The NBR is an index used to measure the severity of a fire based on the reflectance of the NIR and SWIR bands. For S2, we calculate it using the wavelengths of bands B8 and B12 [45]. A high NBR value generally indicates good vegetation, while a low NBR value indicates empty land and recently burned sites, as burned areas have high reflectance in the SWIR band and low reflectance in the NIR band [46,47]. It is calculated using Equation (1):
    N B R = N I R S W I R N I R + S W I R
    dNBR is the differenced normalized burn ratio. It is calculated to estimate the severity of the fire [46], by subtracting the post-fire NBR image from the pre-fire NBR image, as follows:
    d N B R = P r e f i r e N B R P o s t f i r e N B R
    Burned areas have positive dNBR values, while unburned areas have negative or near zero values [48].
  • Normalized difference vegetation index (NDVI): The NDVI index is the best known and most widely used vegetation index to quantify green vegetation in the near-infrared wavelength region and chlorophyll absorption in the red wavelength region [49]. The NDVI always varies between −1 and +1. Negative values usually indicate the presence of water, while values close to +1 indicate dense green leaves [50]. NDVI uses the NIR and red bands, with healthy vegetation reflecting more in the NIR but absorbing more in the red [50].
    N D V I = N I R R E D N I R + R E D
    dNDVI represents the subtraction of the Post-fire NDVI from the Pre-fire NDVI and it is calculated as follows:
    d N D V I = P r e f i r e N D V I P o s t f i r e N D V I
  • Soil adjusted vegetation index (SAVI): SAVI is similar to NDVI but with the addition of a “soil brightness correction factor” [51].
    S A V I = N I R R E D ( N I R + R E D + L ) 1 + L
    where L is the soil adjustment factor of SAVI. The SAVI index ranges from −1.5 to 1.5 (Table 2) and was developed as a modification of the NDVI to correct for the effect of soil brightness when vegetation canopy is low [52]. Recent studies have revealed that the soil adjustment factor employed in the SAVI formula can occasionally take on negative values, particularly in instances of dense vegetation that exhibits resistance to saturation effects. In light of this observation, it is important to recognize that extreme conditions involving a negative soil adjustment factor can lead to alterations in the conventional SAVI index ranges. Similarly, like dNDVI, dSAVI is calculated by subtracting the post-fire SAVI from the pre-fire SAVI using the following equation:
    d S A V I = P r e f i r e S A V I P o s t f i r e S A V I
  • Burn Area Index (BAI): By analyzing the spectral distance between each pixel and a reference spectral point, this index is able to highlight the charcoal signal present in the red and near-infrared bands of post-fire images. This approach is effective because recently burned areas tend to exhibit distinct spectral characteristics [53,54,55]:
    B A I = 1 ( 0.1 R E D ) 2 + ( 0.06 N I R ) 2
    We also calculated the difference between the Pre-fire BAI and the Post-fire BAI following the Equation (8):
    d B A I = P r e f i r e B A I P o s t f i r e B A I

2.3.2. Processing Steps

The S2 product images available on GEE are already radiometrically and geometrically corrected [56]. However, some standard pre-processing is required on the images, such as identification of study areas, date filtering to match dates of interest, cloud masking, and reduction.
The first step is to identify the study areas, which are Tangier-Assilah, Chefchaouen, and M’diq Fnideq in this case, as they are highly vulnerable to forest fires. These regions have a Mediterranean climate characterized by hot, dry summers and mild, wet winters. The vegetation in these regions is dominated by forested areas consisting of conifers, cork oak, and eucalyptus, among other species. The dry and hot climate, coupled with the presence of highly flammable vegetation such as pine trees, further increases the risk of forest fires. These forests are often located on steep slopes, which can create challenging terrain for firefighters and hinder firefighting efforts. Furthermore, these regions have a high incidence of forest fires due to a combination of factors, including human activities such as agricultural burning and negligence, as well as natural causes such as lightning strikes [57,58]. Additionally, the proximity of human settlements to forested areas increases the risk of fires caused by human activities such as cigarette smoking, campfires, and agricultural activities. Climate change is also expected to exacerbate the risk of forest fires in these regions, as rising temperatures and changes in precipitation patterns can increase the frequency and severity of droughts. All these factors contribute to the high vulnerability of the Tangier-Assilah, Chefchaouen, and M’diq Fnideq regions to forest fires, making them an ideal area of focus for this study.
Using the geometry option of GEE, we create or download the geometry directly [59]. This step enables us to determine the relevant satellite images for our study areas.
Next, we filter the S2 images based on dates to select the pre- and post-fire images for each area. The data used in this study include S2 images from 2017 for Tangier, 2020 for M’diq Fnideq, and 2021 for Chefchaouen, as mentioned in Table 3.
The reason we chose these dates is that in Tangier, a massive fire ravaged 215 hectares of forest in Mediouna from 30 June to 4 July 2017 [60]. It was even worse in 2020, when fires destroyed 1024 hectares of forest in M’diq Fnideq on 1 August 2020 [61]. In 2021, Chefchaouen suffered the greatest damage in Morocco, caused by the worst forest fire of the year at Jbel Sougna in the rural community of Derdara, which burned about 1100 ha in August 2021 [62].
S2 products do not incorporate a cloud mask, which can disturb the quality of the results [32]. To improve image quality and avoid spectral confusion, we applied a cloud mask function. The QA60 binary mask band of S2 contains information about whether the pixels are cloudy or not, and GEE contains a predefined function to mask opaque clouds and cirrus clouds using this band [63].
Our next step consisted of calculating the NBR for the pre-fire and post-fire periods in each area using Equation (1). To emphasize the burned areas, we computed the differenced dNBR and applied the United States Geological Survey (USGS) wildfire severity classification system based on the dNBR values [64], as shown in the following Table 4.
We marked sample points in areas that experienced vegetation changes based on pre- and post-fire image visualization, as well as FIRMS data, GLAD data, and USGS classification in Tangier. Subsequently, we used 60% of the sample points from Tangier for training and 40% of the remaining data for validation. The classification is based on the ‘Intensity’ label, representing three classes: ‘Unburned’, ‘Low severity’, and ‘High severity’, assigned to each sample point. We then trained the model using the RF classifier ee.classifier.smileRandomForest() predefined in GEE and generated a three-class image.
To assess the performance of the models, the main metrics used are as follows:
  • The Confusion matrix: Presents a cross-tabulation of the class labels assigned by the classification of the map data against the reference data [66].
  • Overall Accuracy: Determines the proportion of the total reference sites that were mapped correctly. This is usually presented as a percentage [67].
  • Kappa coefficient: Compares the performance of the classification conducted to a random assignment of values [67].
  • Producer’s Accuracy: Represents the degree to which the reference pixels are classified from the point of view of the map maker [67,68].
  • Consumer’s Accuracy: Indicates how often the class shown on the map will actually occur in the field [67].
Our study focused on evaluating the influence of spectral indices and S2 bands on classification accuracy. To accomplish this, we retrained the RF classifier by incorporating the dNDVI, dSAVI, and dBAI bands, along with the twelve S2 bands, in addition to dNBR. This allowed us to examine the individual contribution of each variable to the classification process and assess its impact on accuracy. To determine the importance of each variable, we employed feature importance techniques. These techniques assign scores to input features, reflecting their relative significance in the model’s predictions for a specific variable [69]. By considering feature importance, we gained valuable insights into the relative importance of each variable and prioritized them accordingly. This approach enabled us to focus on the variables that played a significant role in influencing the classification process, thereby enhancing the accuracy and relevance of our findings. For assessing variable importance, we utilized the “ee.classifier.explain” algorithm within the Google Earth Engine platform. This algorithm provides us with insights into the results obtained from the trained classifier, allowing us to identify the variables that exerted a substantial influence on the classification process. By incorporating this approach, we were able to select and prioritize the variables that had a notable impact on the classifier’s performance, deepening our understanding of their significance within our study. The selection of the dNBR, dSAVI, dBAI, and dNDVI indices was based on their relevance to vegetation and forest fires. These indices have been widely used in previous studies and are sensitive to changes in vegetation cover and condition, making them useful for detecting burn severity and mapping fire extent. For instance, the dNBR index is highly sensitive to changes in vegetation cover and is commonly used to estimate fire severity. The dSAVI index, which accounts for the influence of soil reflectance on vegetation indices, is well-suited for detecting vegetation damage and recovery after fires. The dBAI and dNDVI indices, on the other hand, are sensitive to changes in vegetation density and greenness, respectively, which are important factors in determining fire risk and severity. Therefore, using these indices in our study will provide more relevant results compared to using other indices.

3. Results and Discussion

3.1. NBR and dNBR Processing

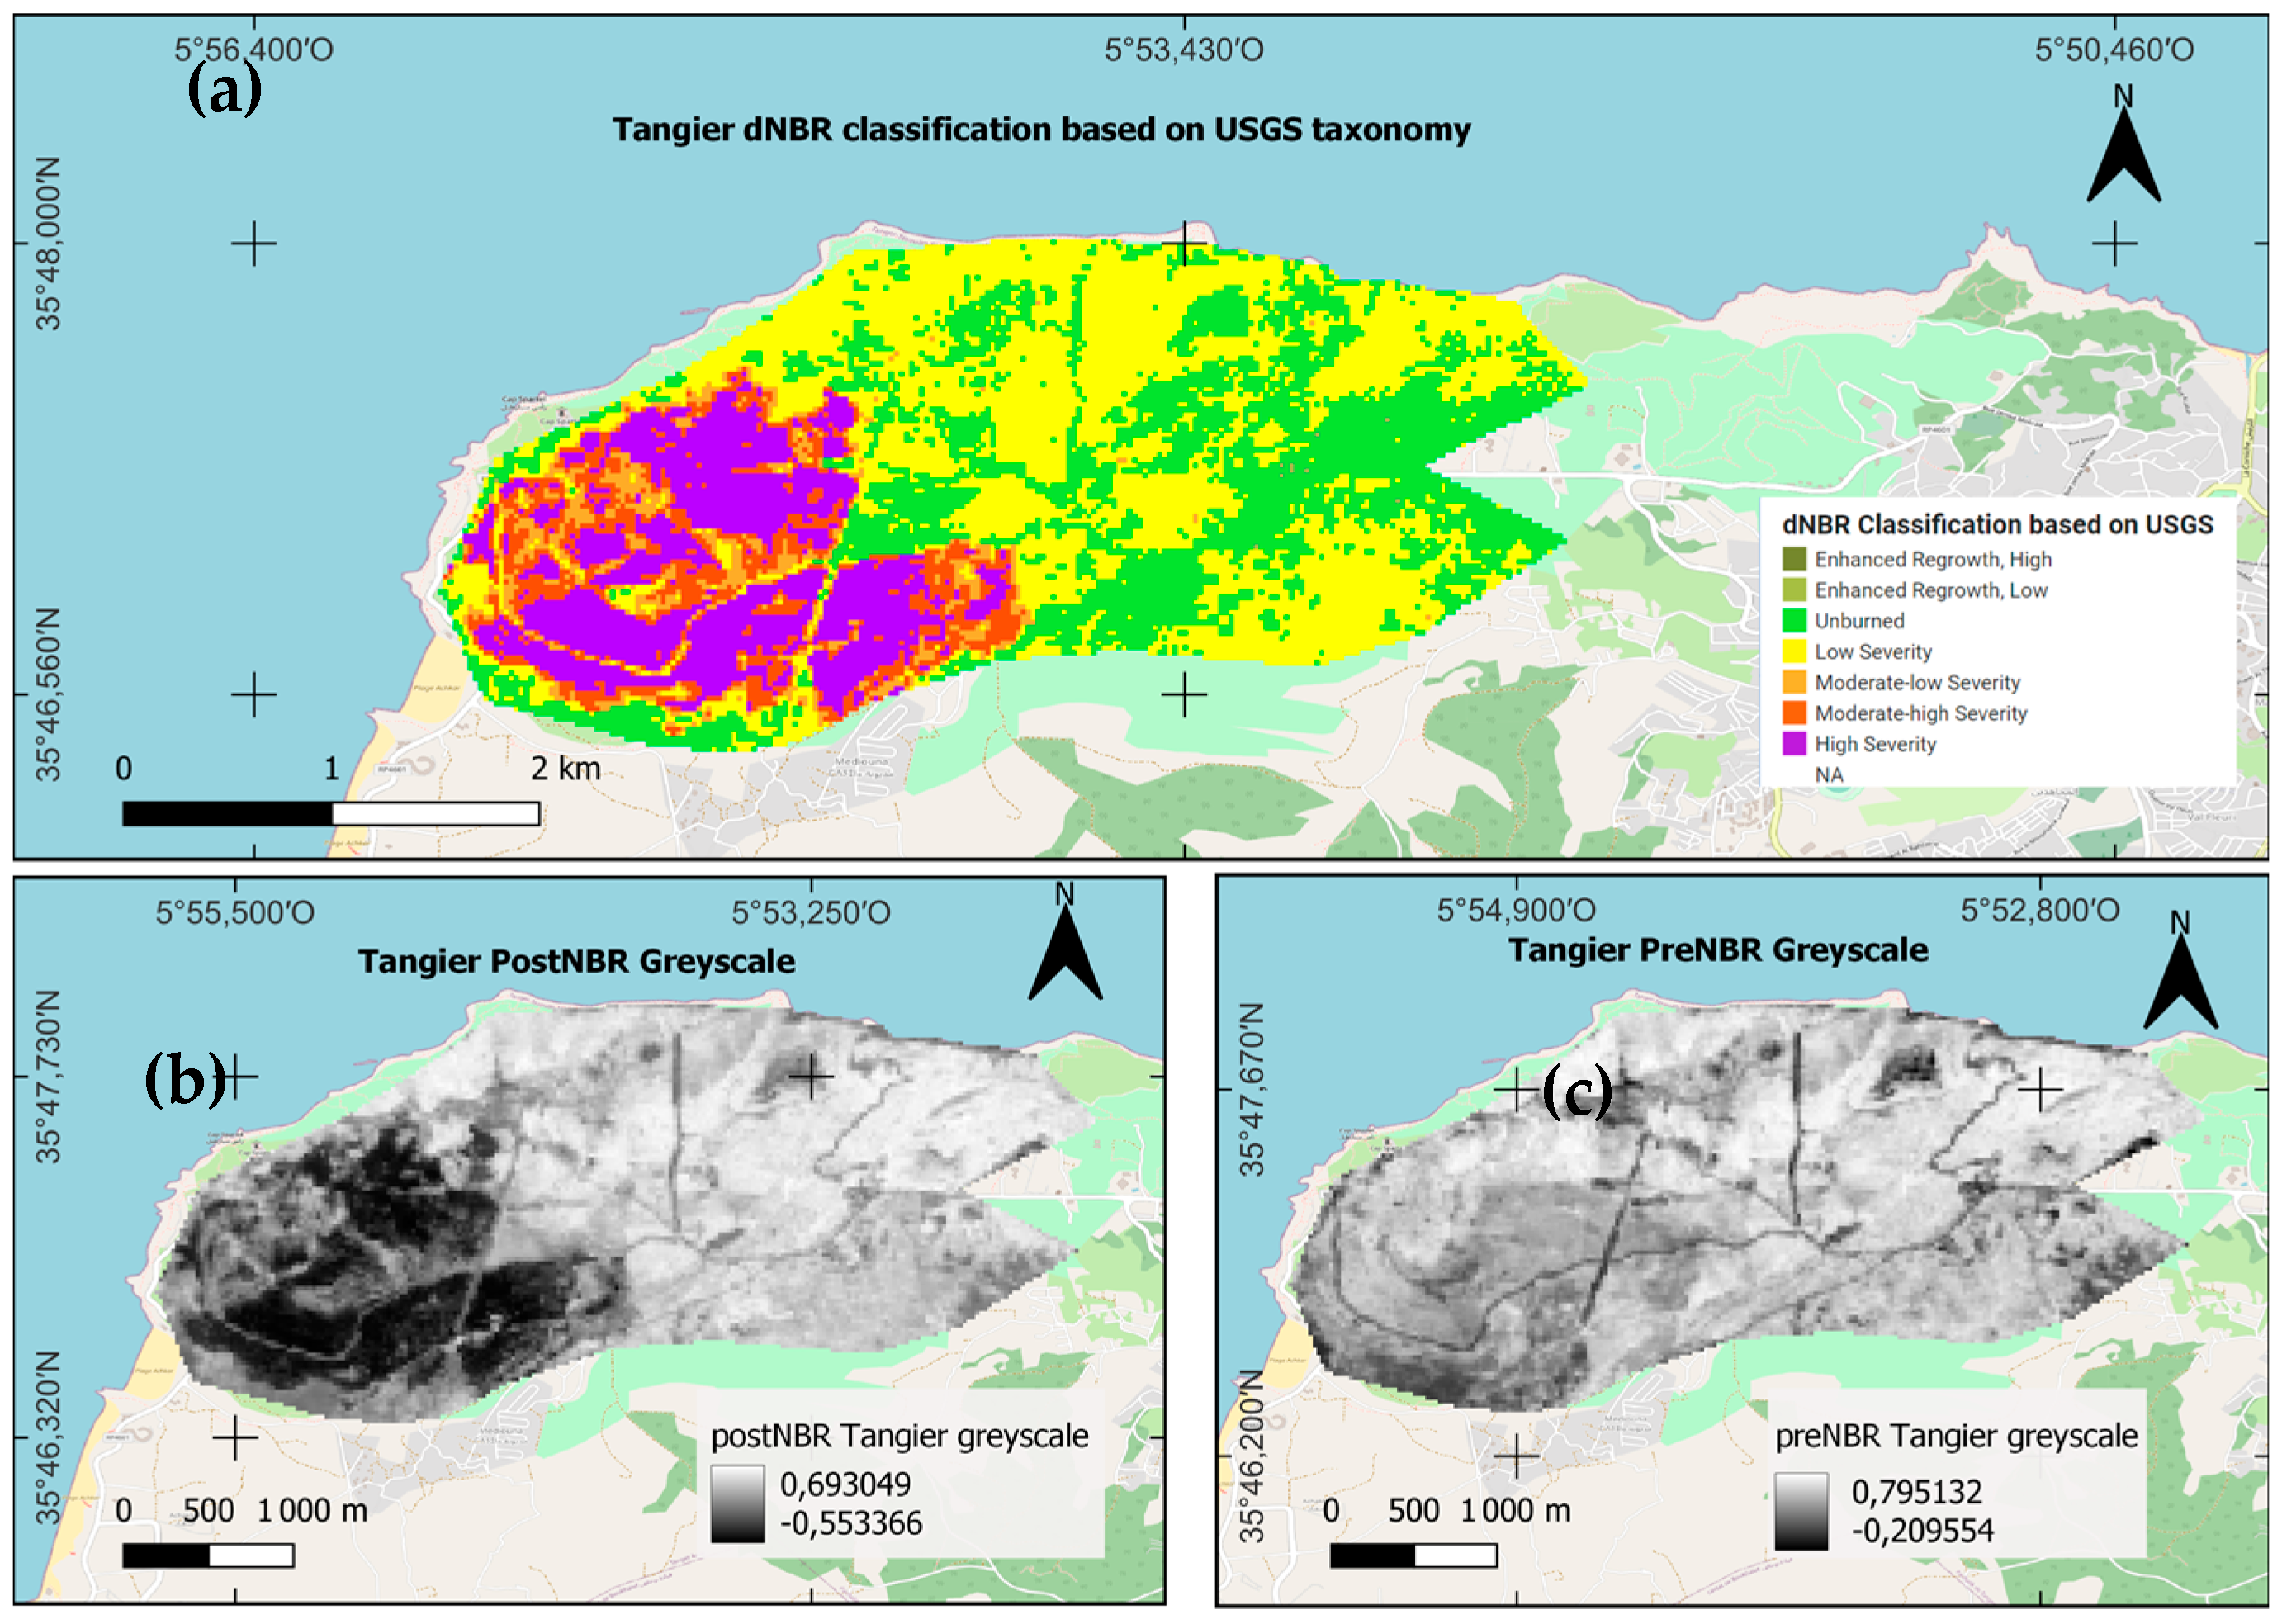
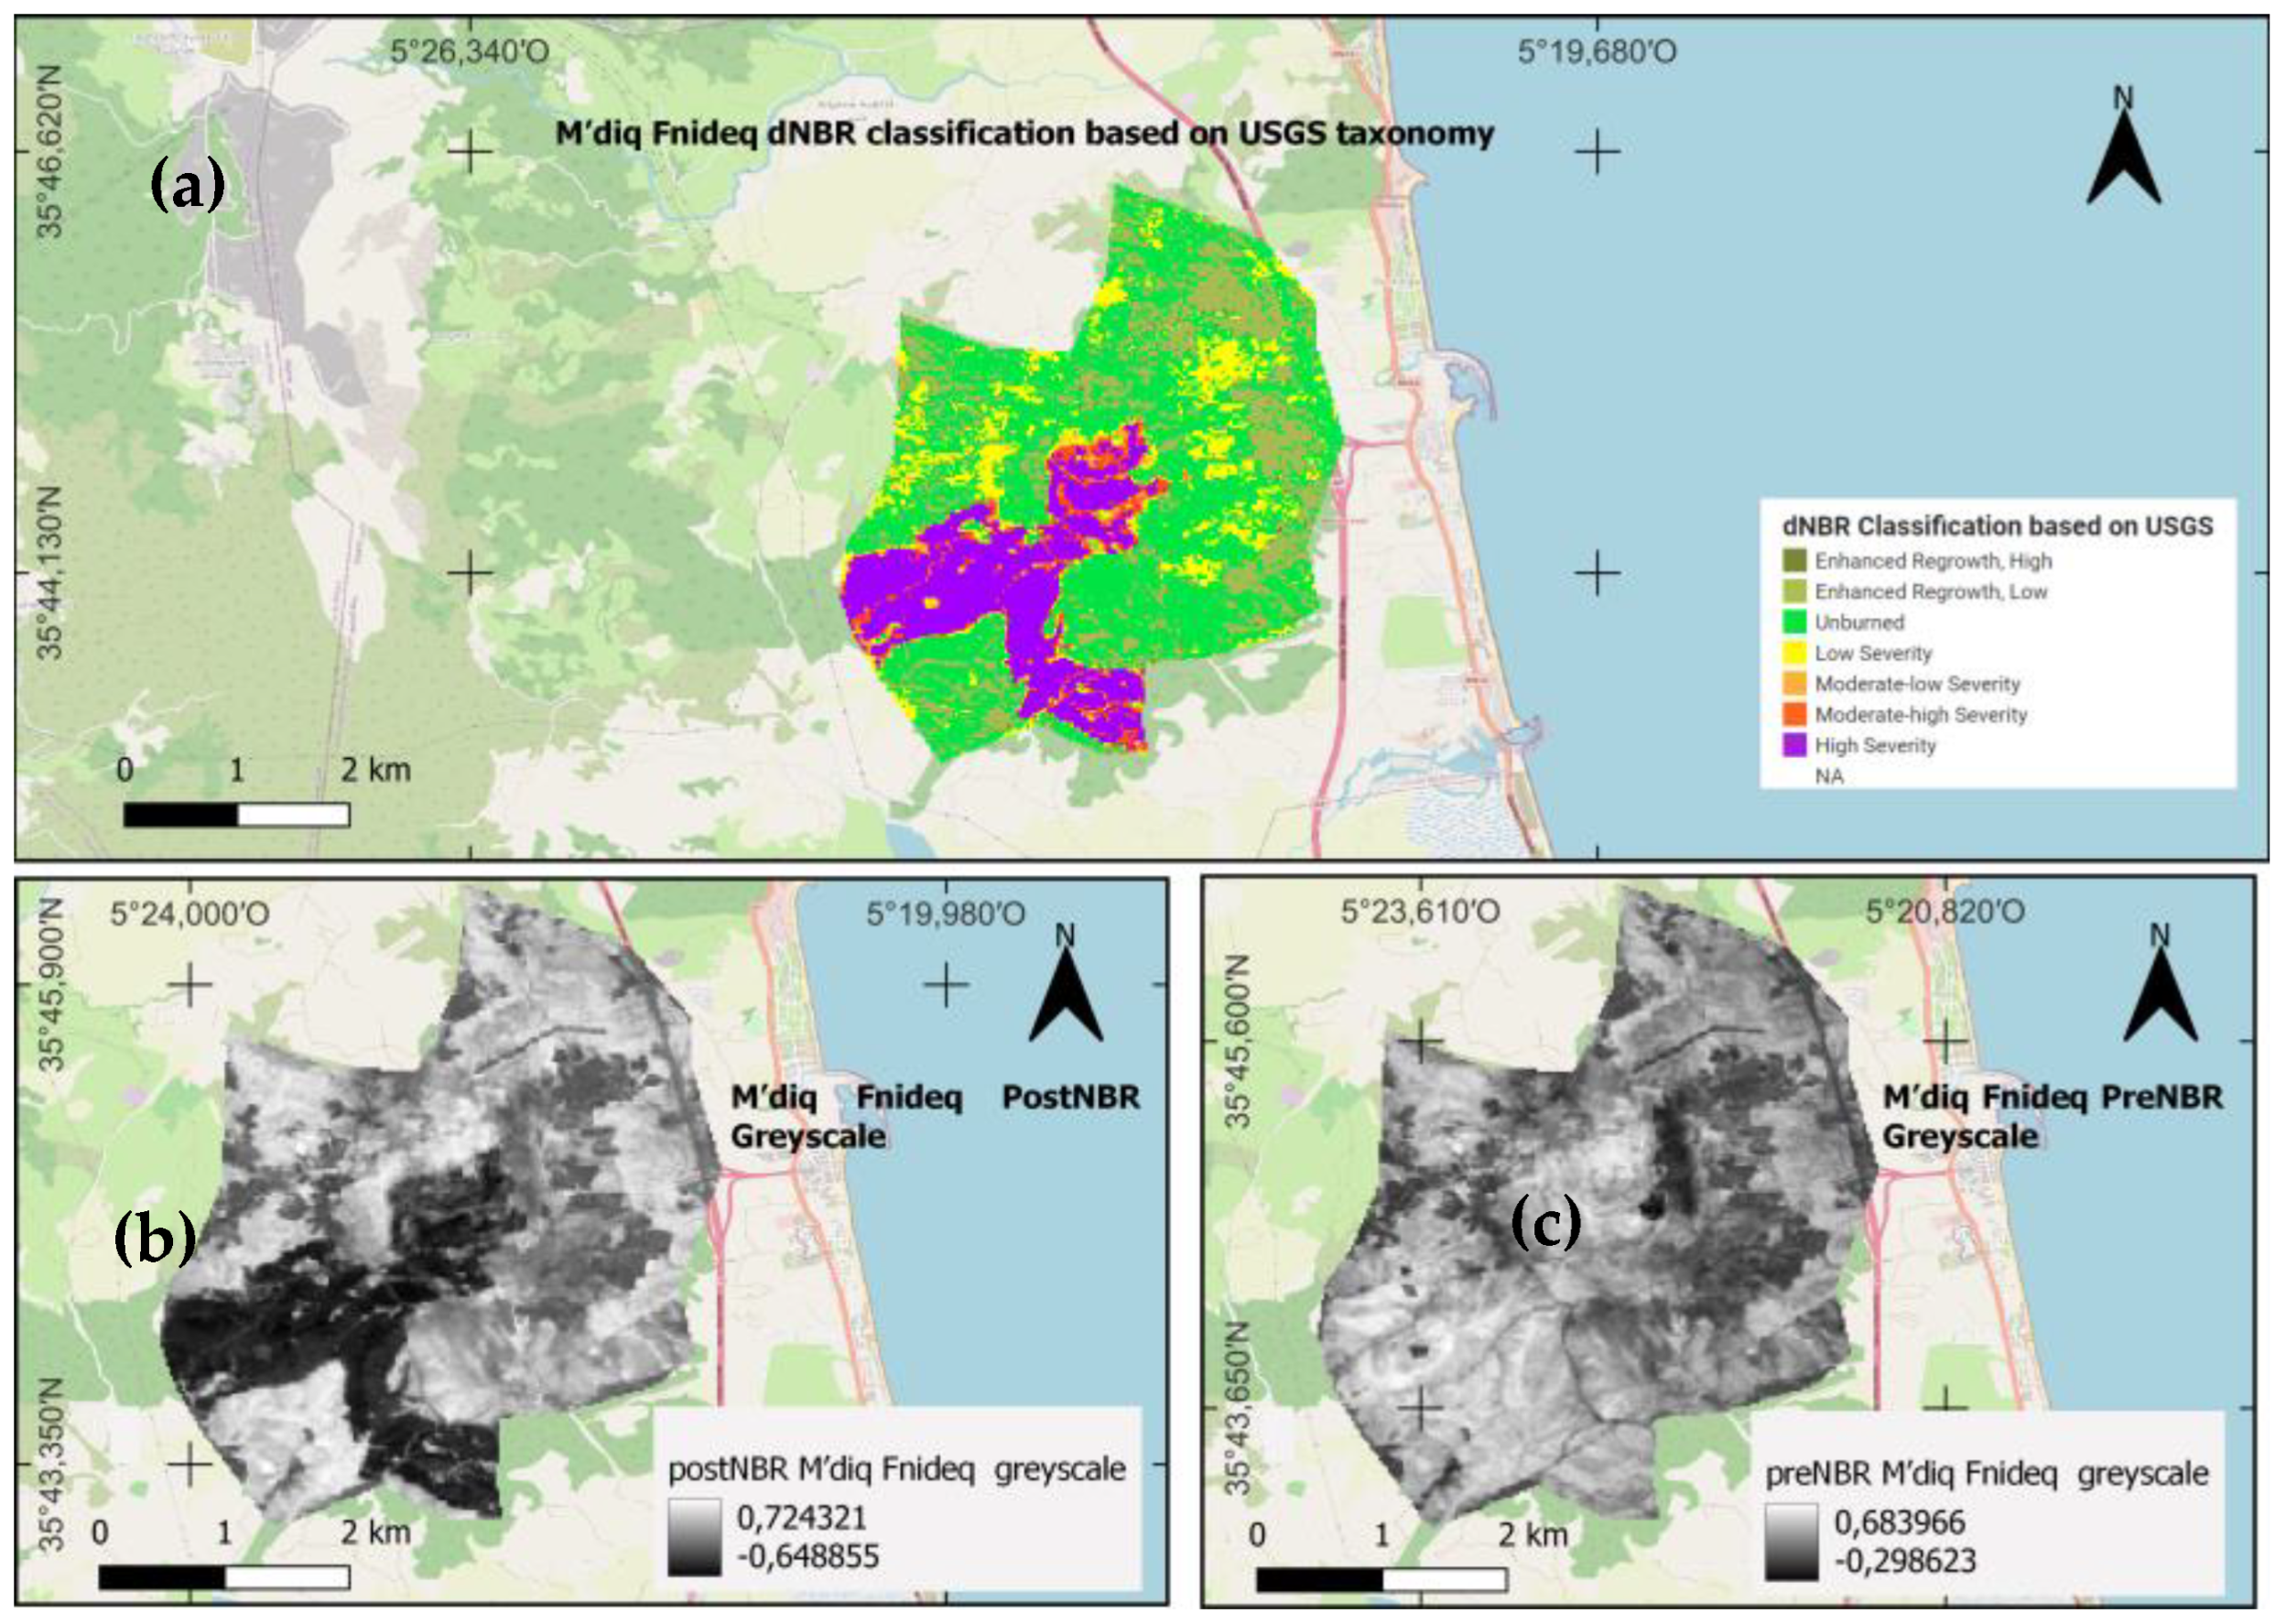
The results of Equation (1) applied to the pre- and post-fire images for each area, as well as the results of Equation (2) of dNBR based on USGS classification, are as follows (Figure 5, Figure 6 and Figure 7):

3.2. Sample Point Determination

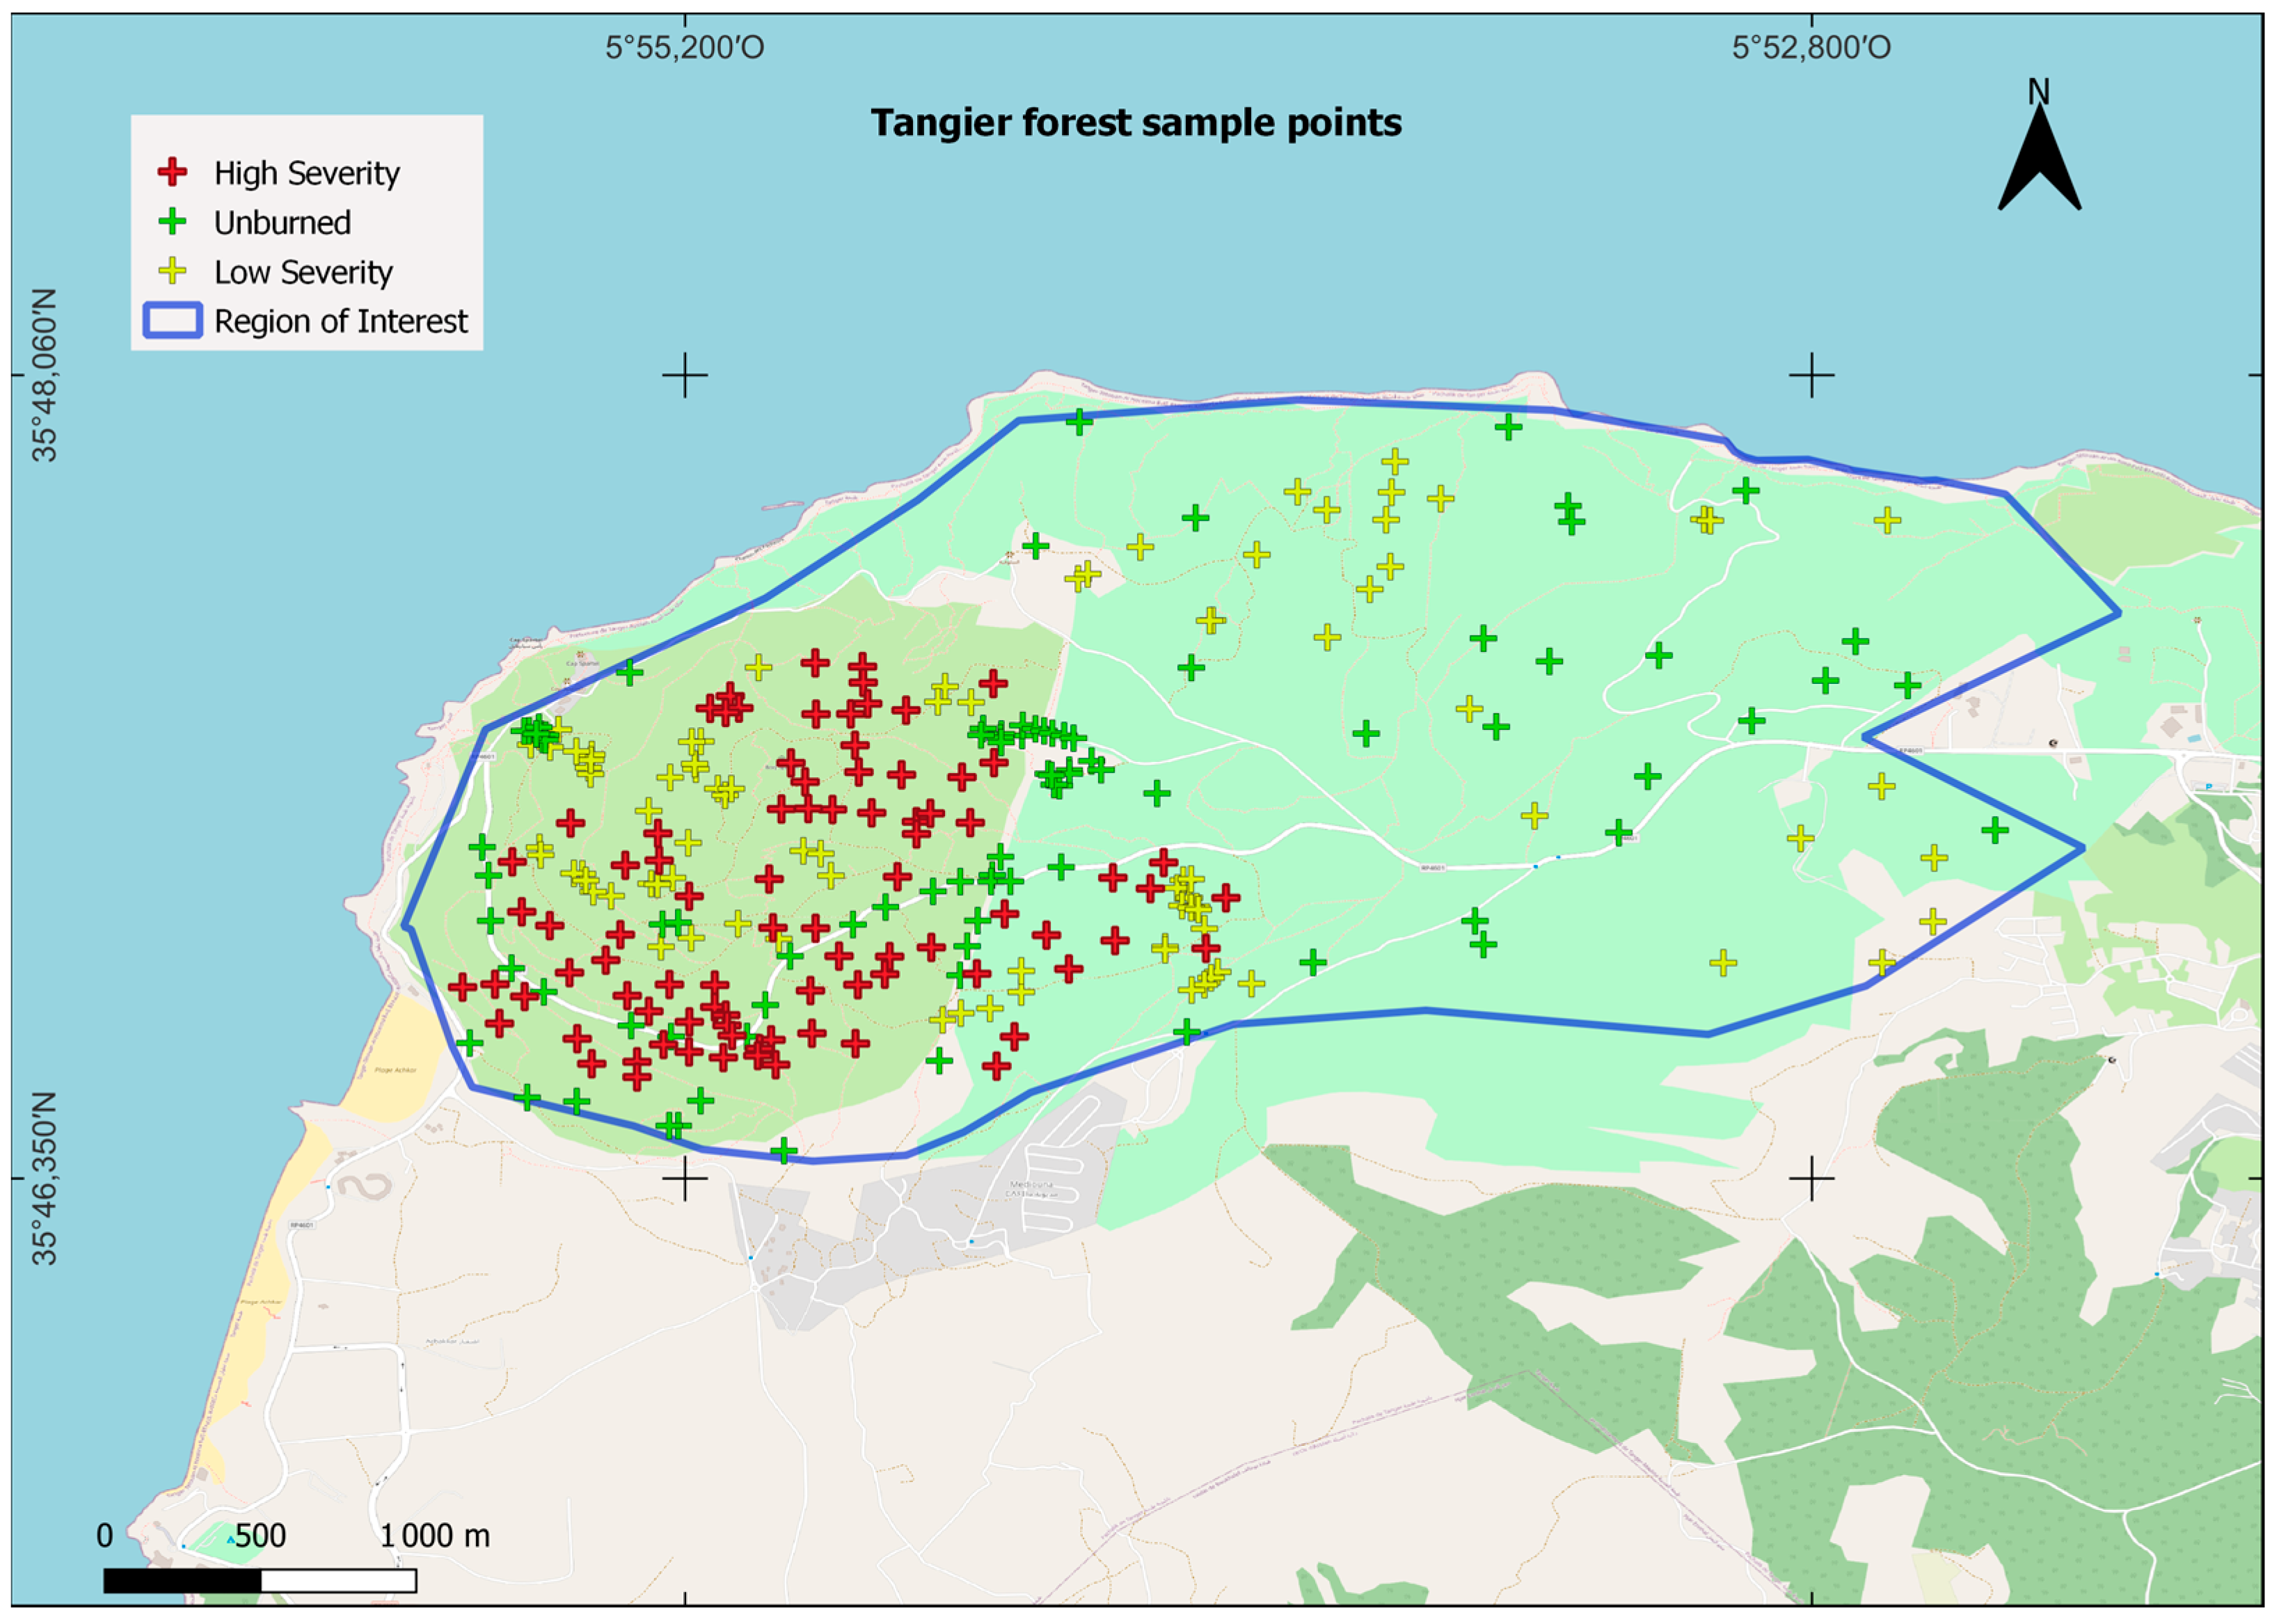
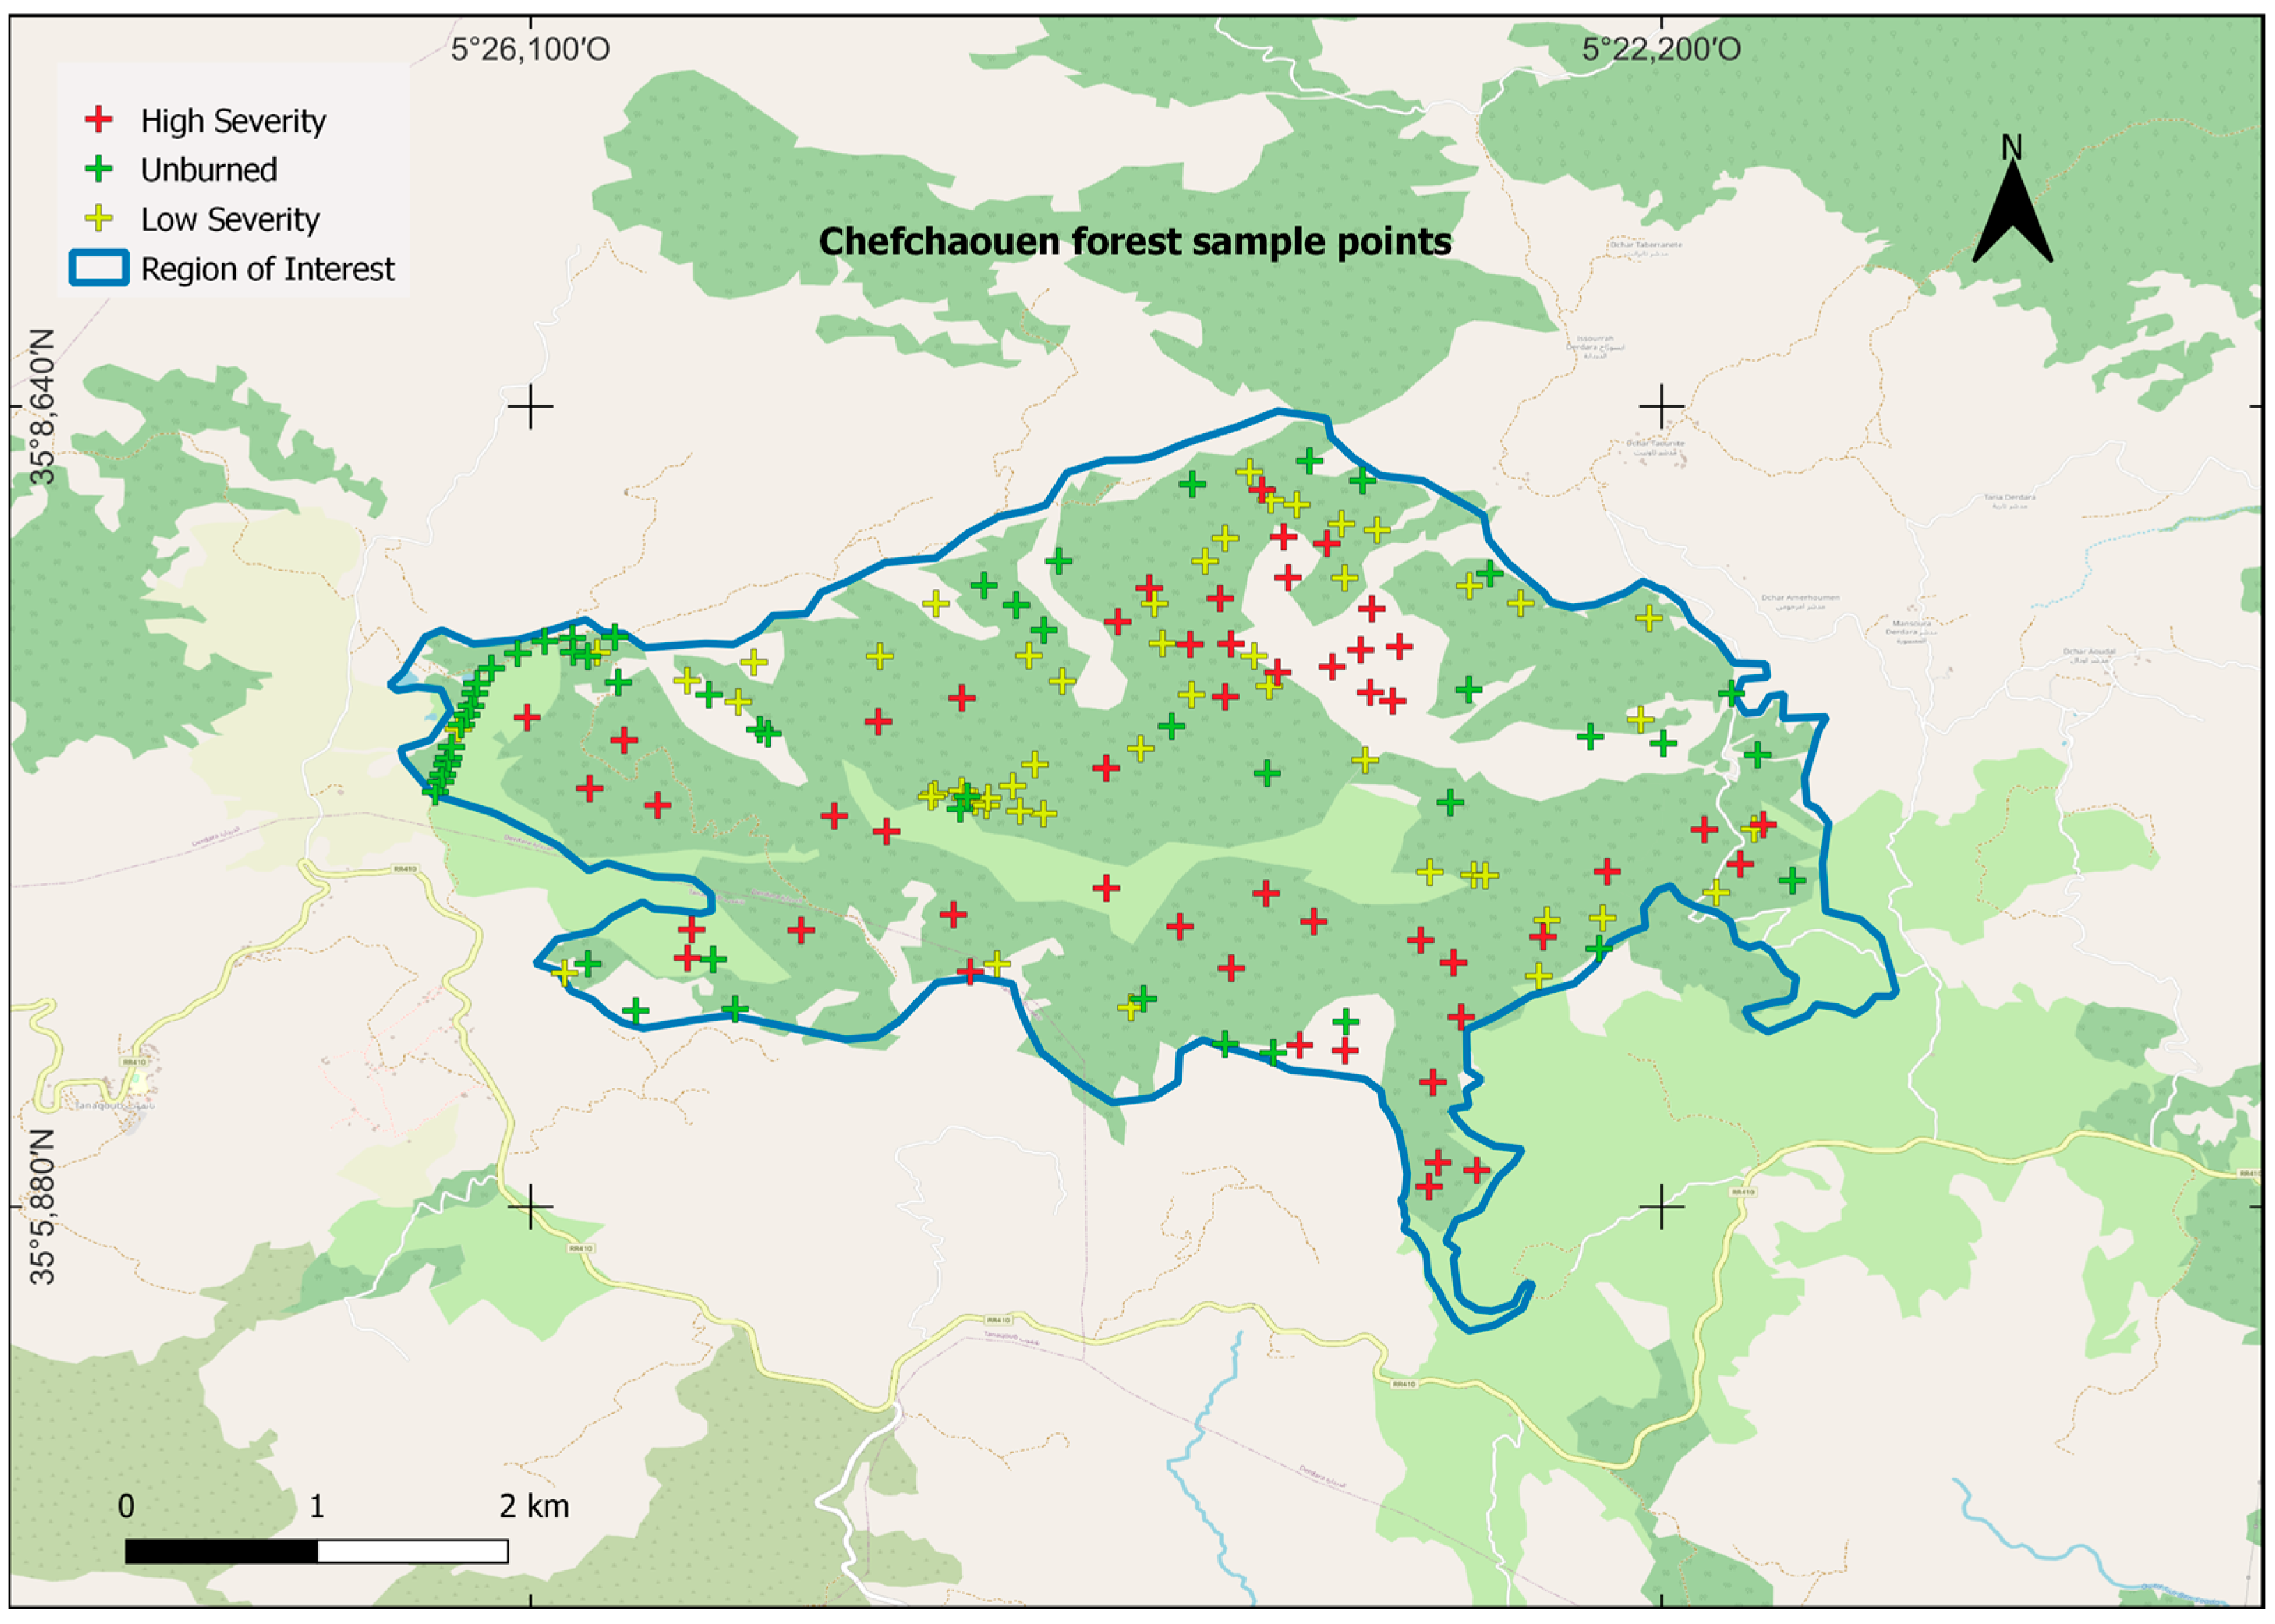
Based on FIRMS and GLAD data, as well as significant changes observed in pre- and post-fire images, we selected 258 sample points for Tangier, 150 sample points for Chefchaouen, and 180 sample points for M’diq Fnideq. The sample points were evenly distributed among the three classes: Unburned, Low severity, and High severity, as demonstrated in Figure 8, Figure 9 and Figure 10.

3.3. Random Forest Classification

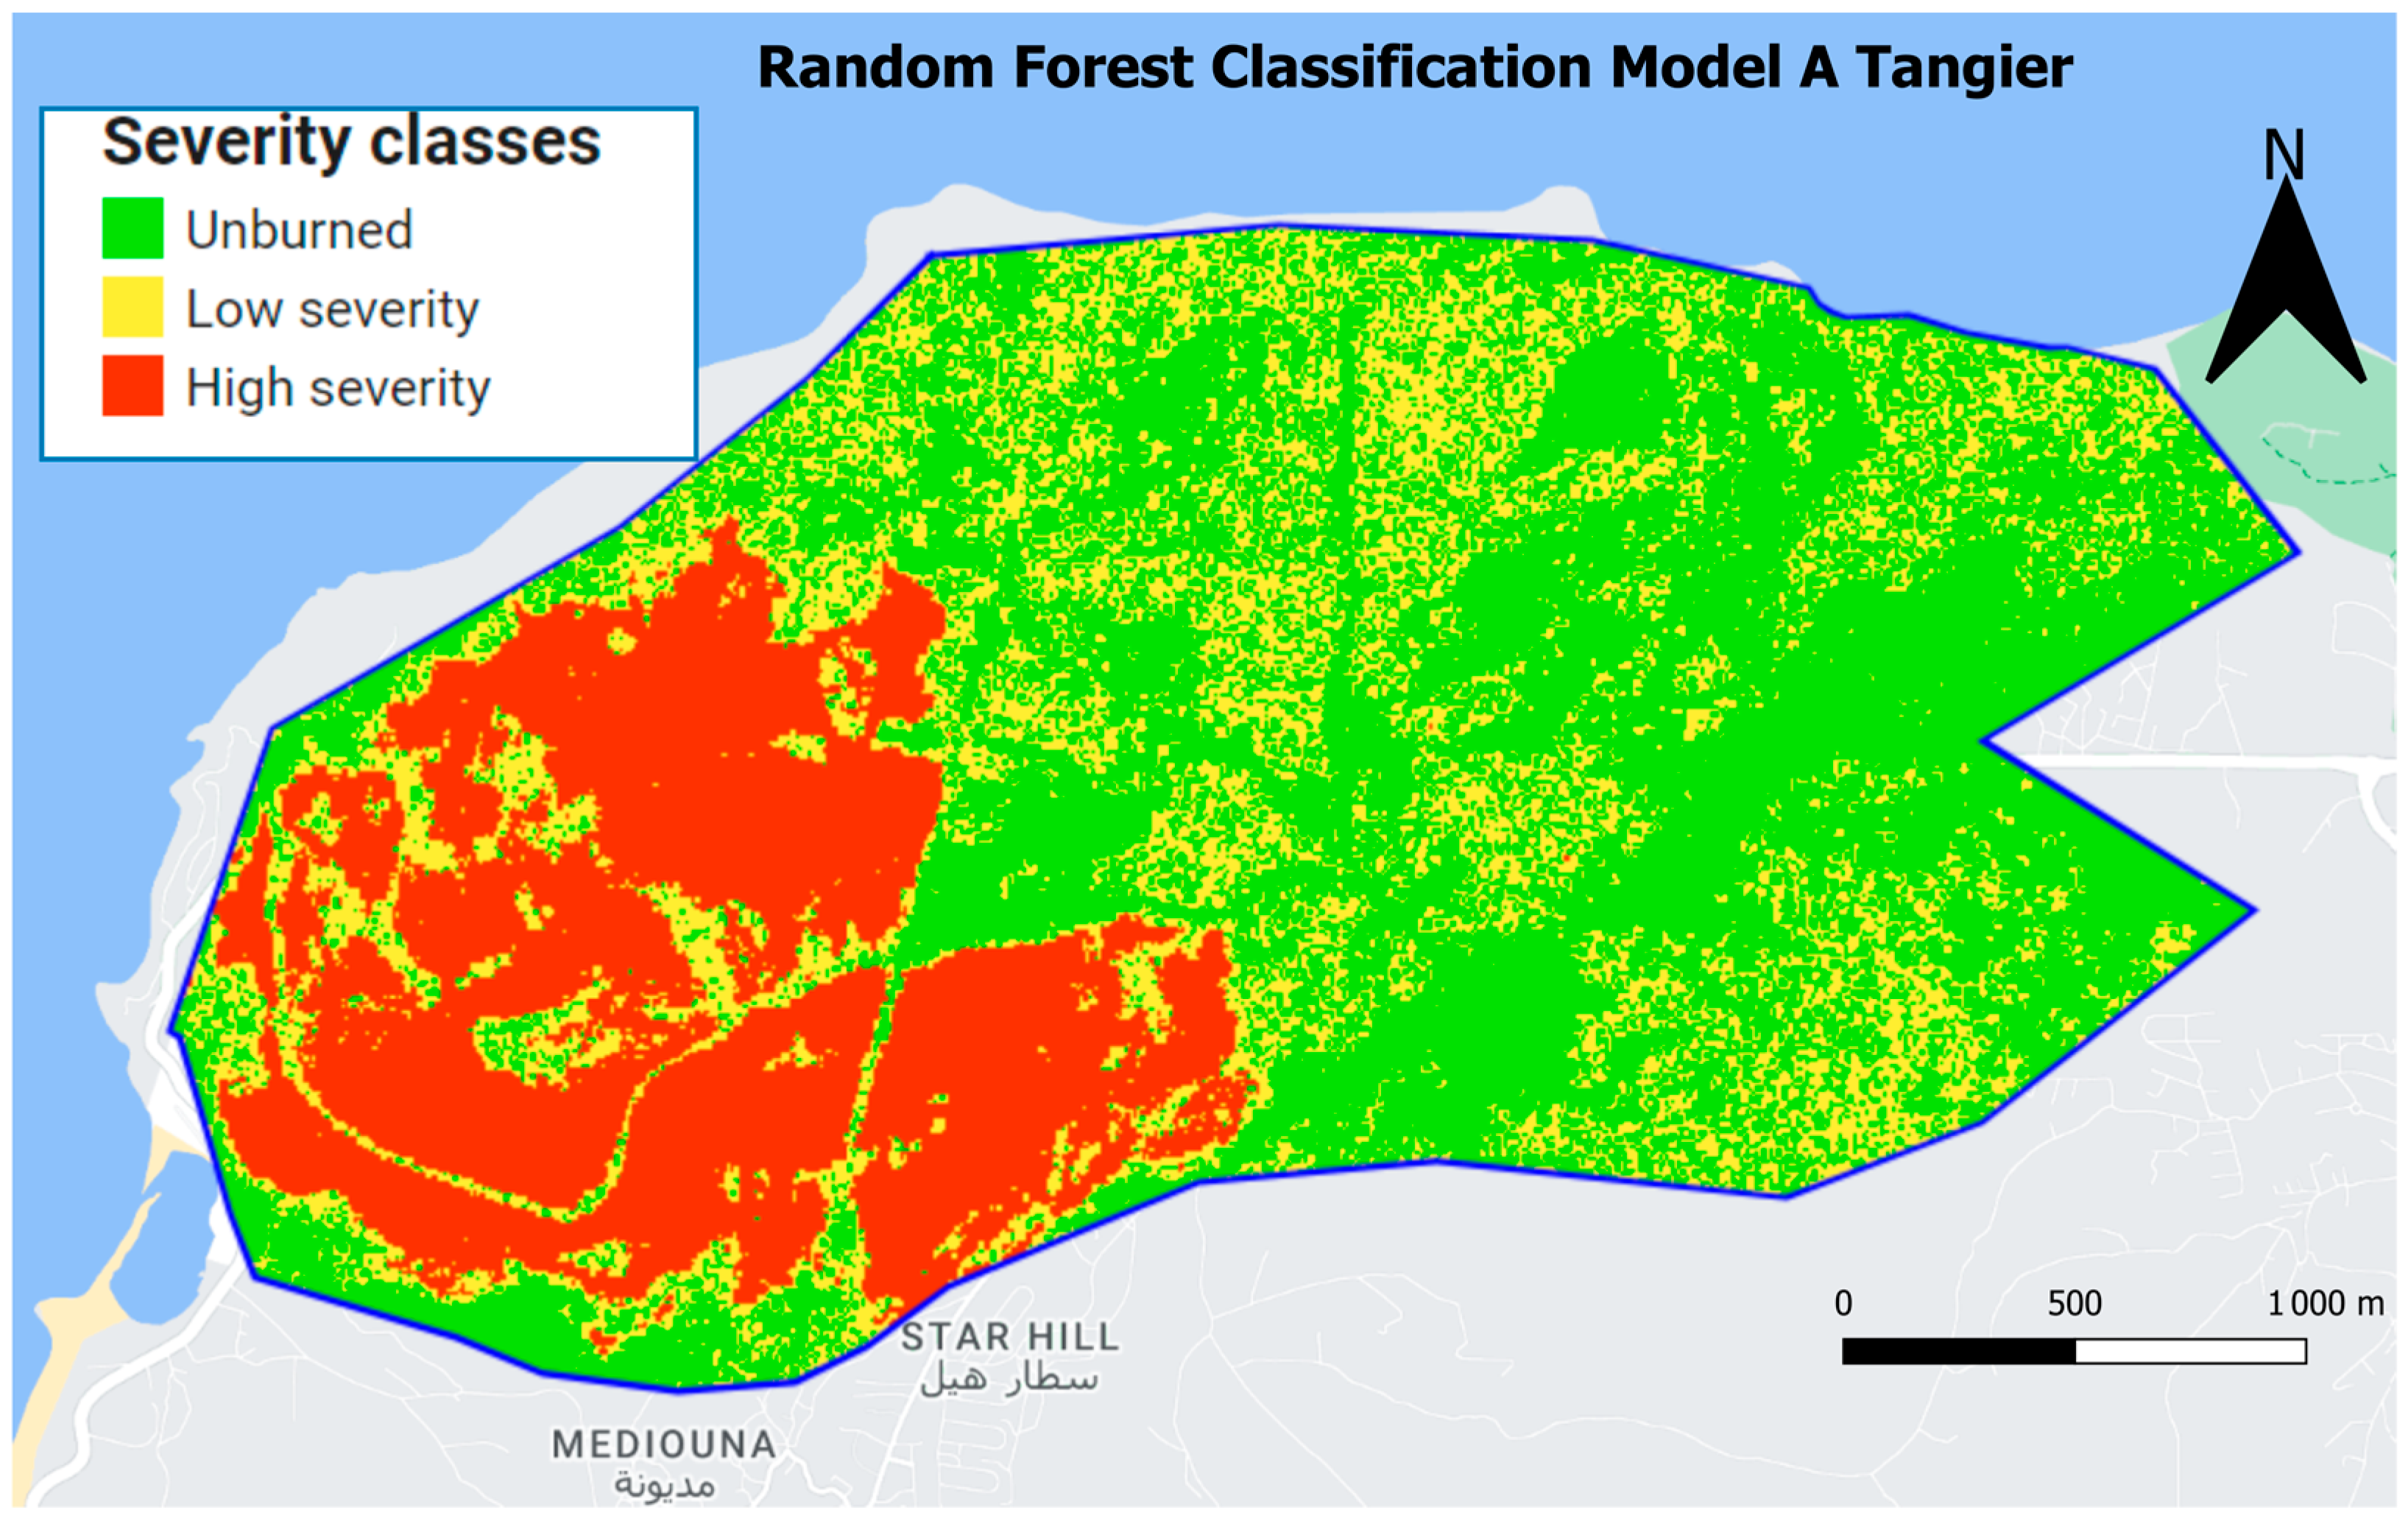
The RF classifier is performed on GEE using the dNBR band; we will call this model “Model A”. Based on the ee.Classifier.smileRandomForest function, the classification result is as follows (Figure 11):
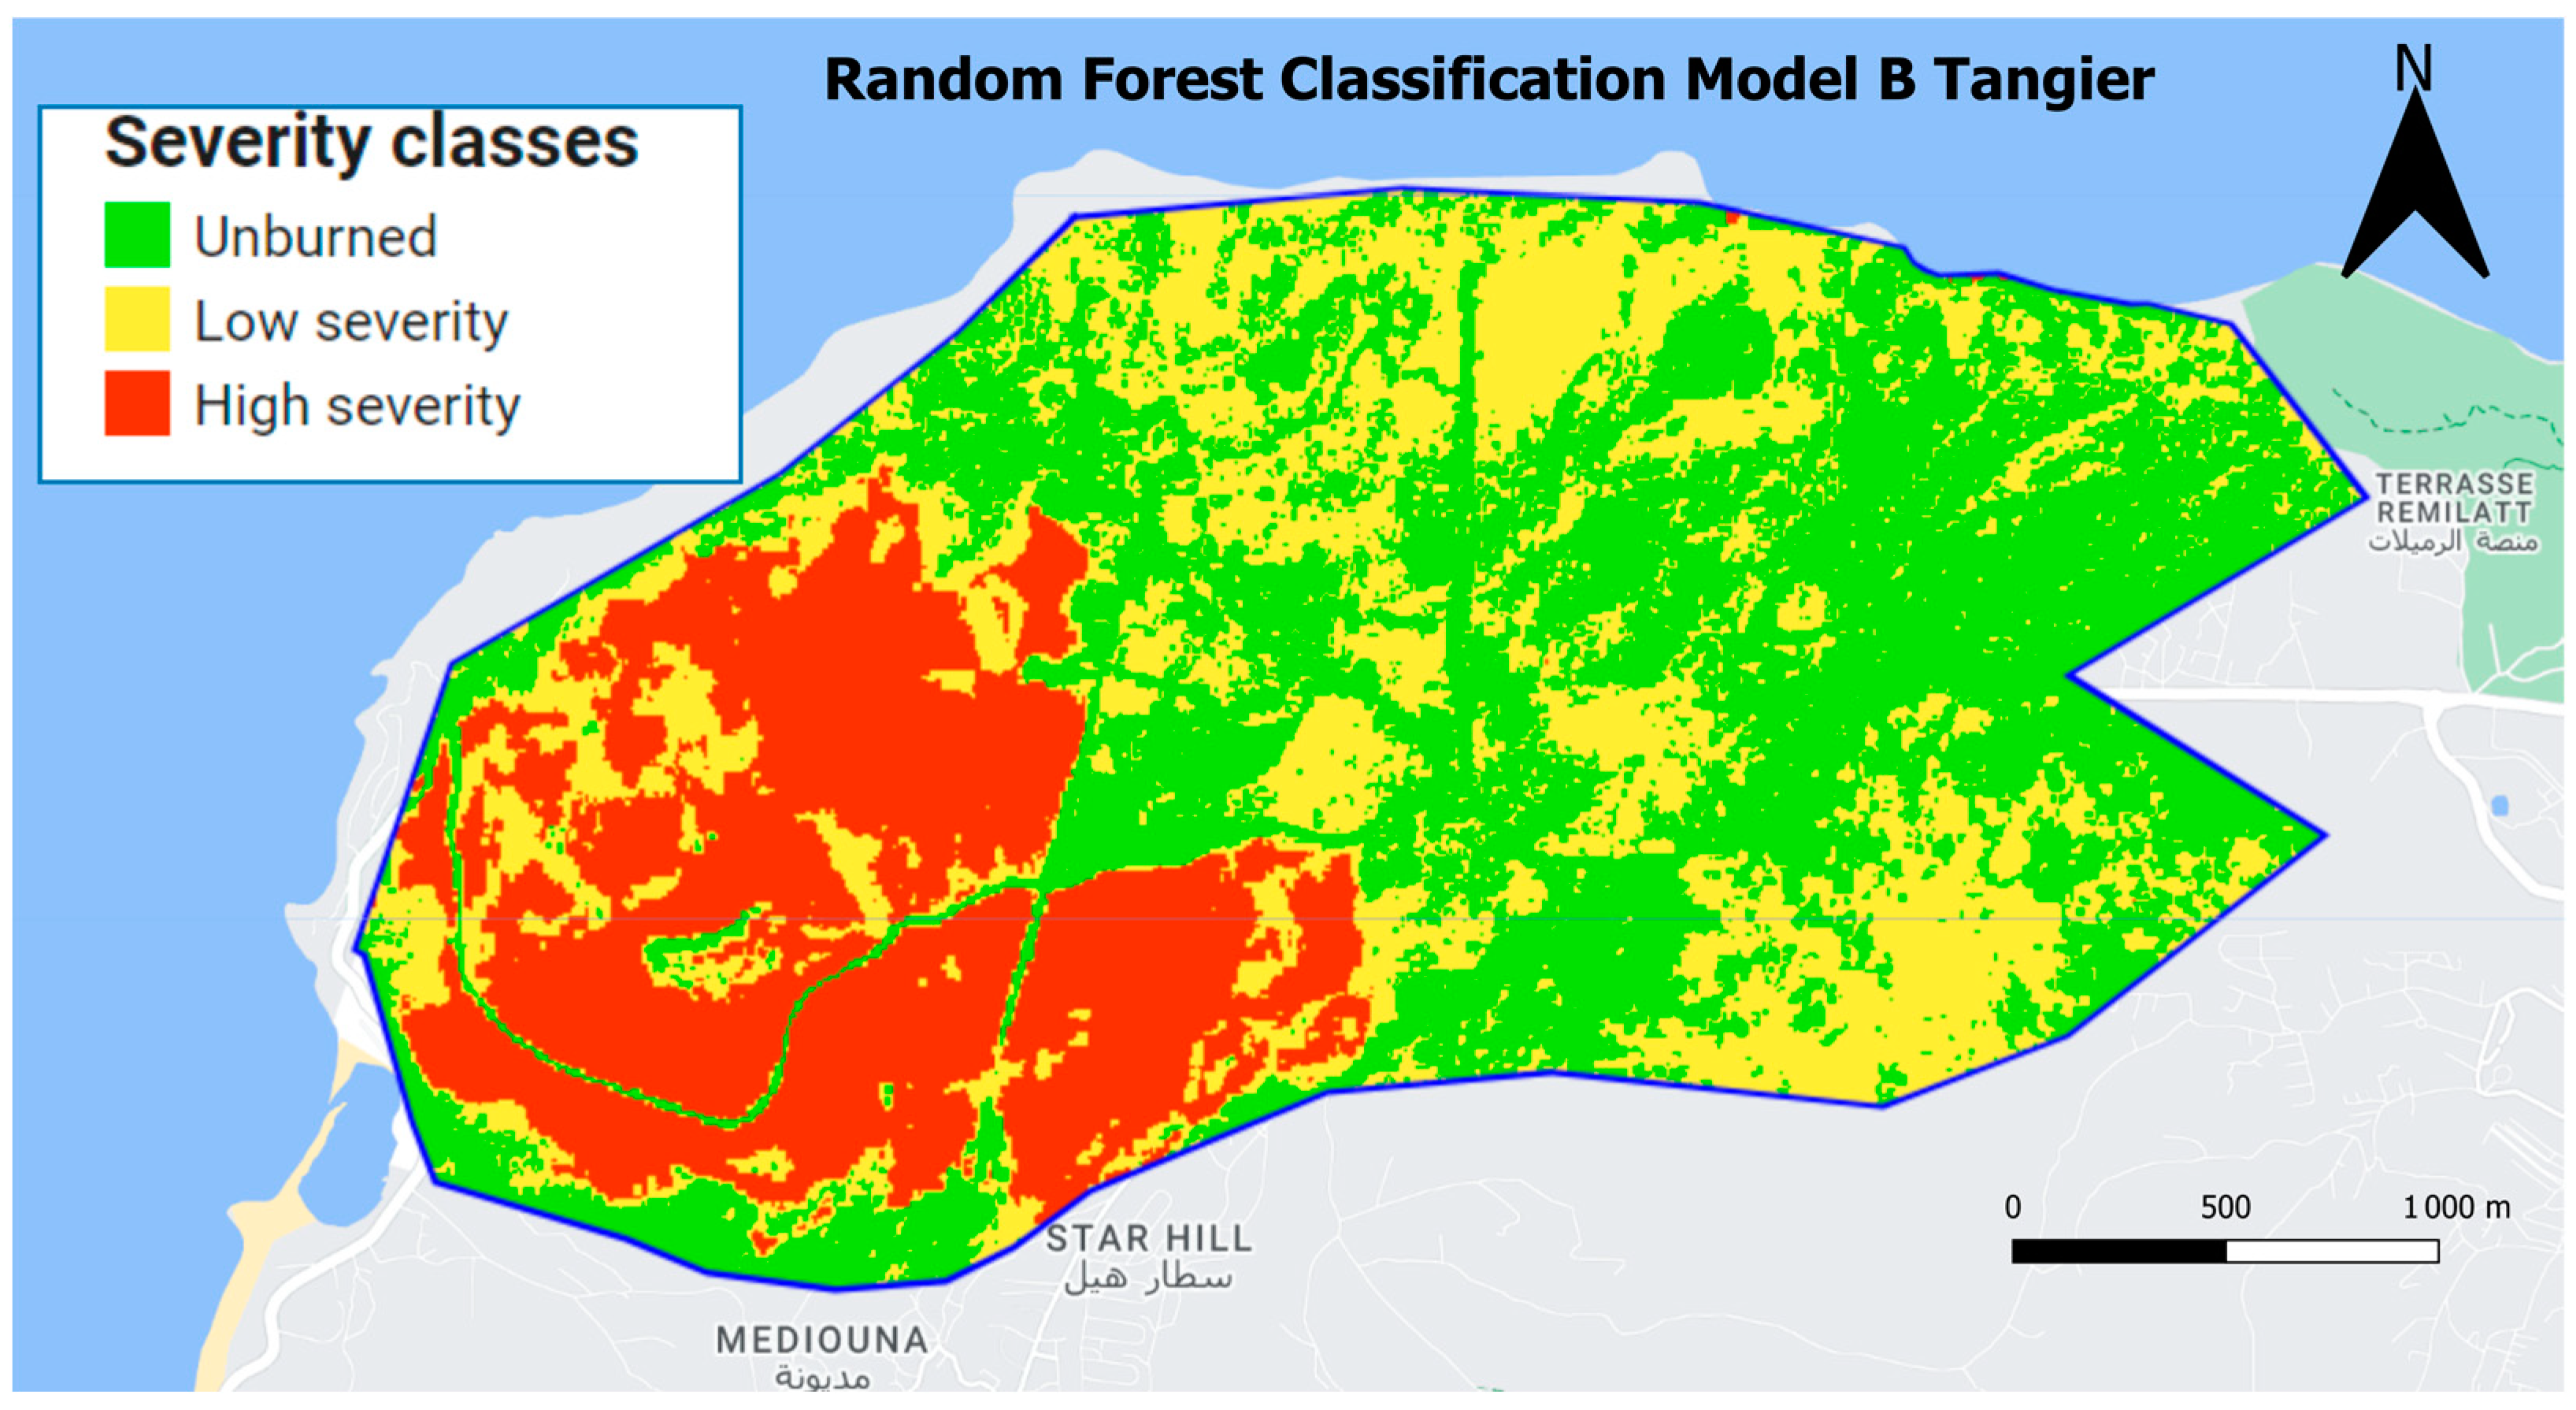
In our study, we aimed to assess the impact of combining different variables and RF on the accuracy of fire-burned area detection. To achieve this, we introduced “Model B” as an additional approach, specifically developed to enhance the discrimination of burned areas. Model B incorporated the normalized difference of four vegetation indices (dNBR, dNDVI, dSAVI, and dBAI) along with the twelve bands from the post-fire image of S2 as input variables (Figure 12). This integration allowed us to leverage relevant bitemporal images, covering both pre- and post-fire conditions [63]. Our objective was to investigate how the combination of spectral indices, S2 bands, and RF influences the accuracy of fire-burned area detection.
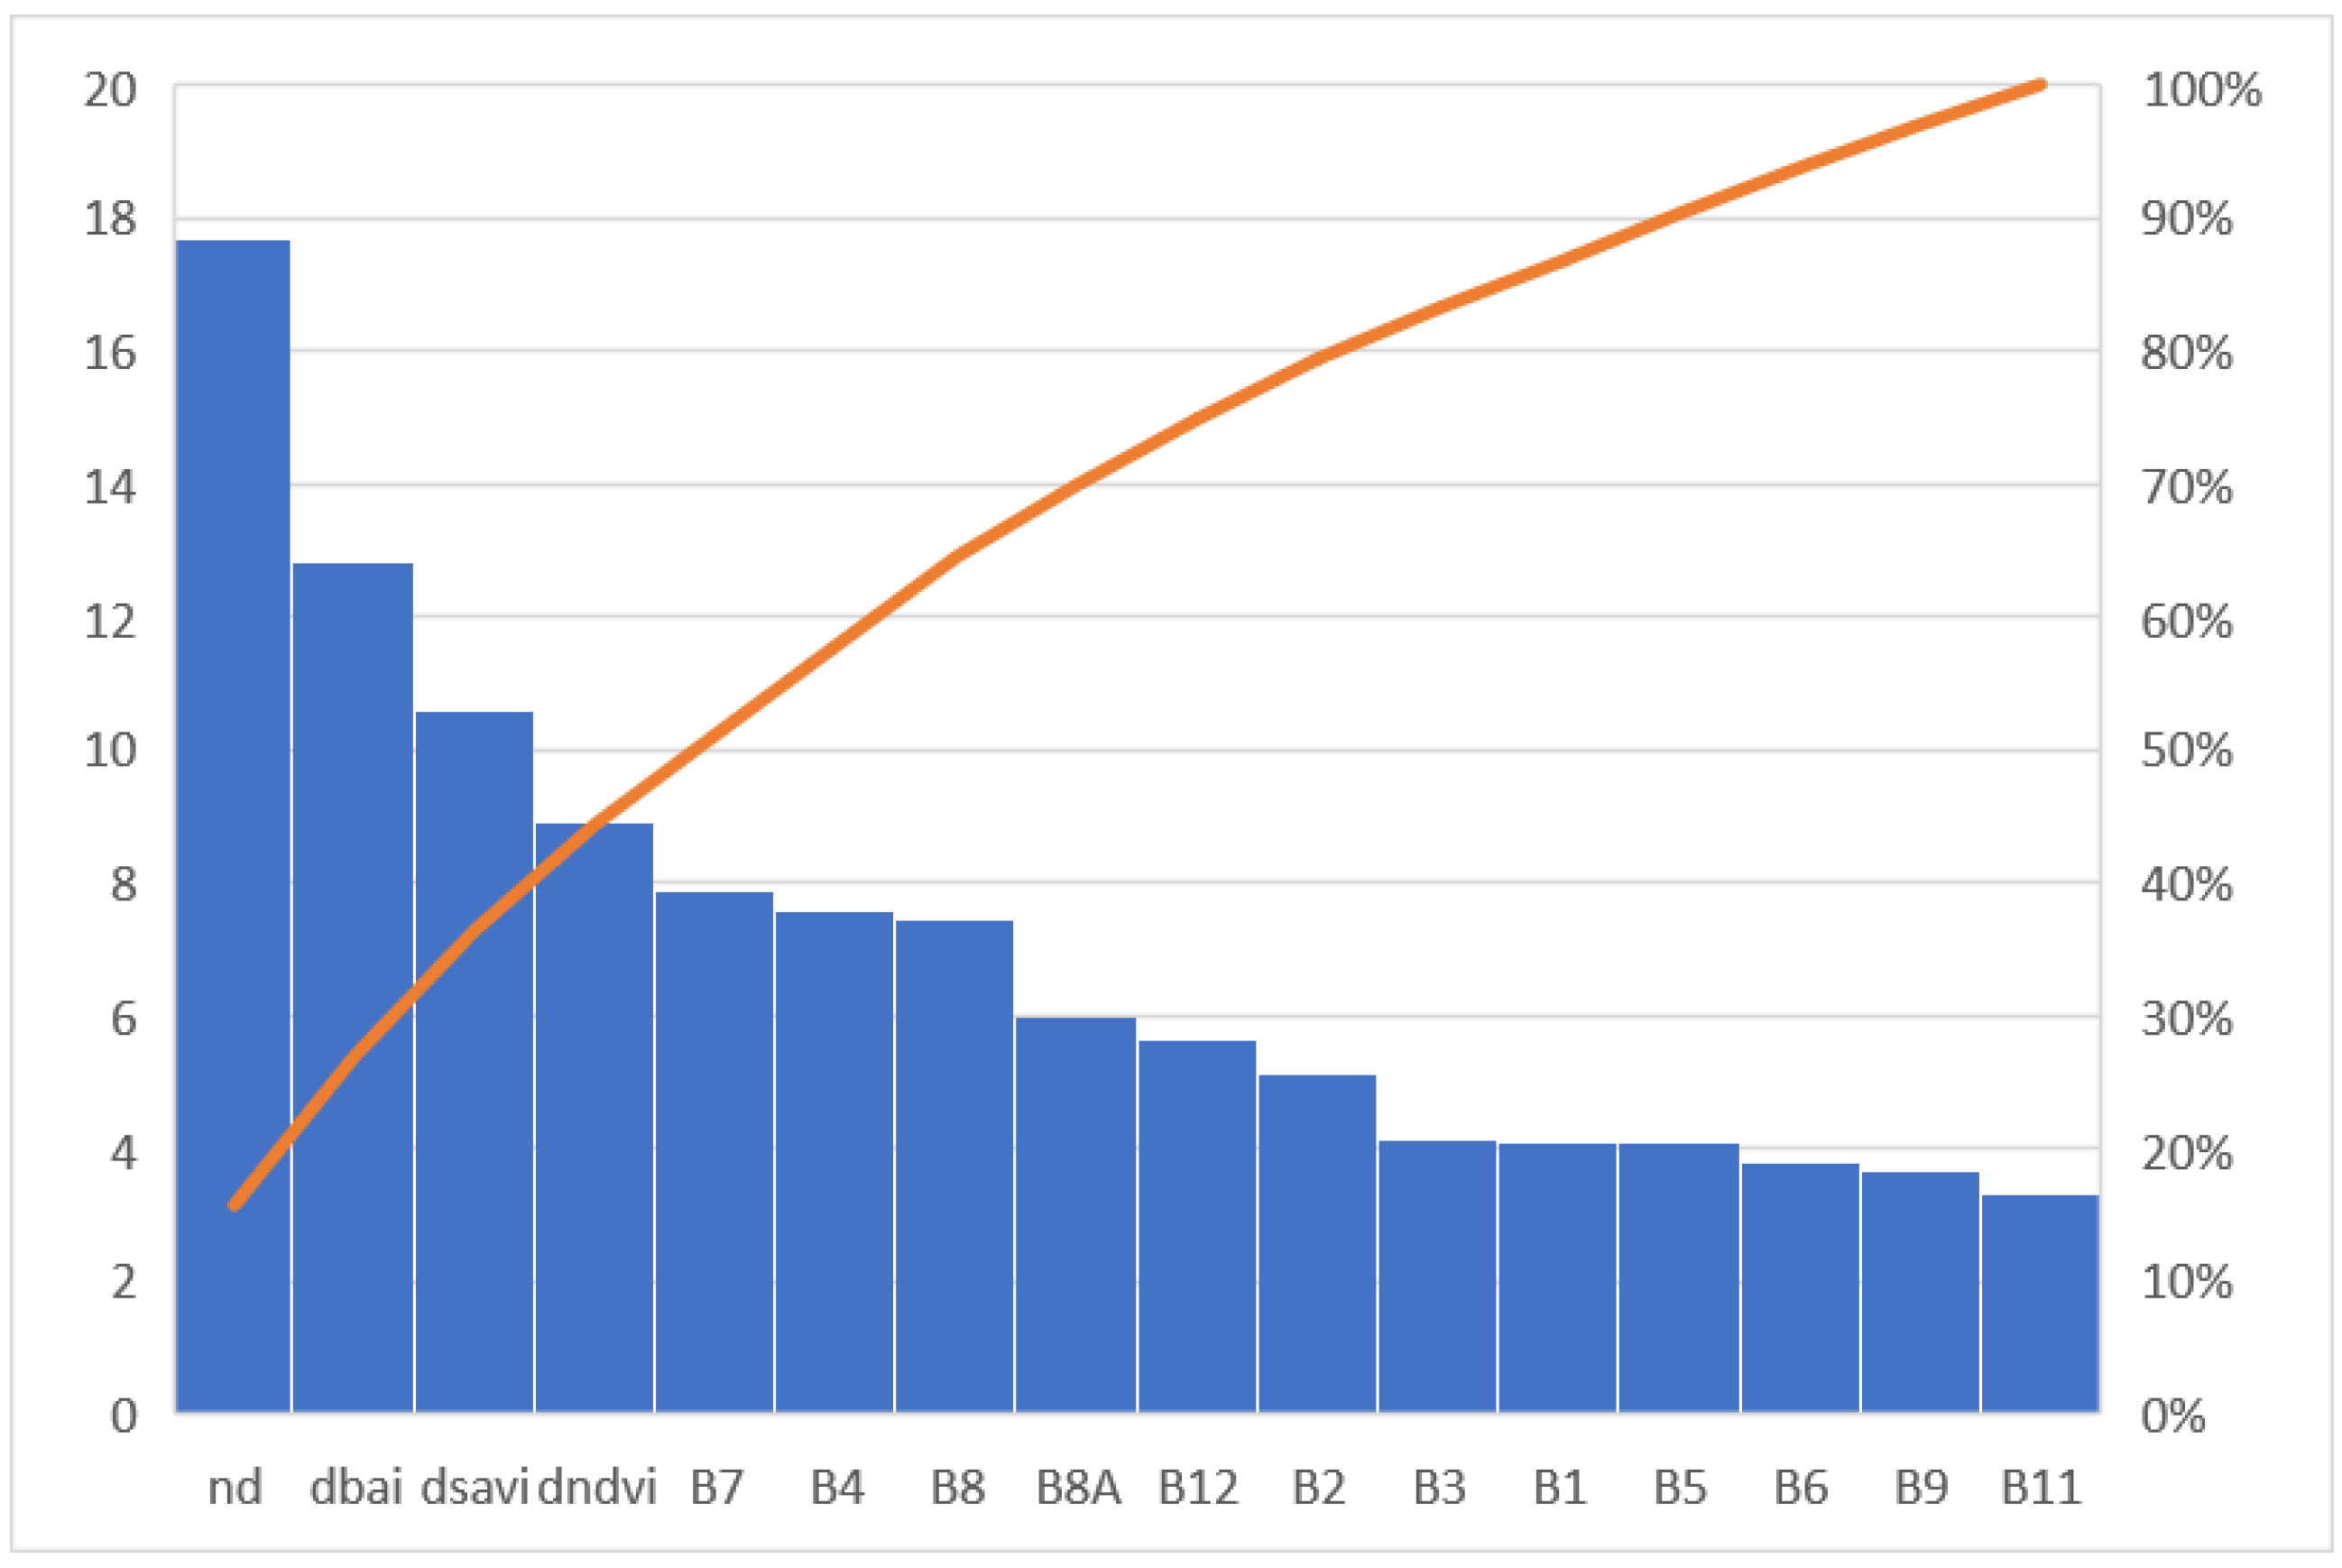
In our study, gaining insights into the data inputs for the model was a crucial aspect. To accomplish this, we employed feature importance analysis, which aided us in understanding the relevance of different features. By assessing the scores derived from feature importance, we were able to reduce the model’s dimensionality. Typically, features with higher scores were retained as they played a more significant role in the model, while those with lower scores were deemed less important and subsequently excluded [69].
To achieve this, we employed the “ee.classifier.explain()” method on the Model B classifier (Table 5). This method allowed us to obtain insights into the relevant features that significantly influenced the classification process. By identifying and excluding unnecessary data, we mitigated the potential bias that could impact the final results of our machine learning analysis. This approach ensured that our model was focused on the most valuable and informative features, leading to more accurate and reliable outcomes.
To provide a clearer understanding of the relative contributions of each feature, we utilized a chart (Figure 13) to visualize the feature importance scores. This graphical representation facilitated a more intuitive interpretation of the results. By examining the chart, we observed that the bands nd (referring to dNBR), dbai, dsavi, and dndvi accounted for a significant portion, comprising 44% of the overall feature importance. These features played a pivotal role in influencing the model’s predictions and were deemed highly influential in the classification process.
It is important to note that the importance scores represent the relative contribution or influence of each feature within the context of the random forest classifier. Higher scores indicate features that have a stronger impact on the classifier’s predictions, while lower scores indicate features with lesser influence. Therefore, while feature importance scores are informative for assessing the significance of features, they do not have a specific unit or direct interpretation in terms of a measurable quantity [69].
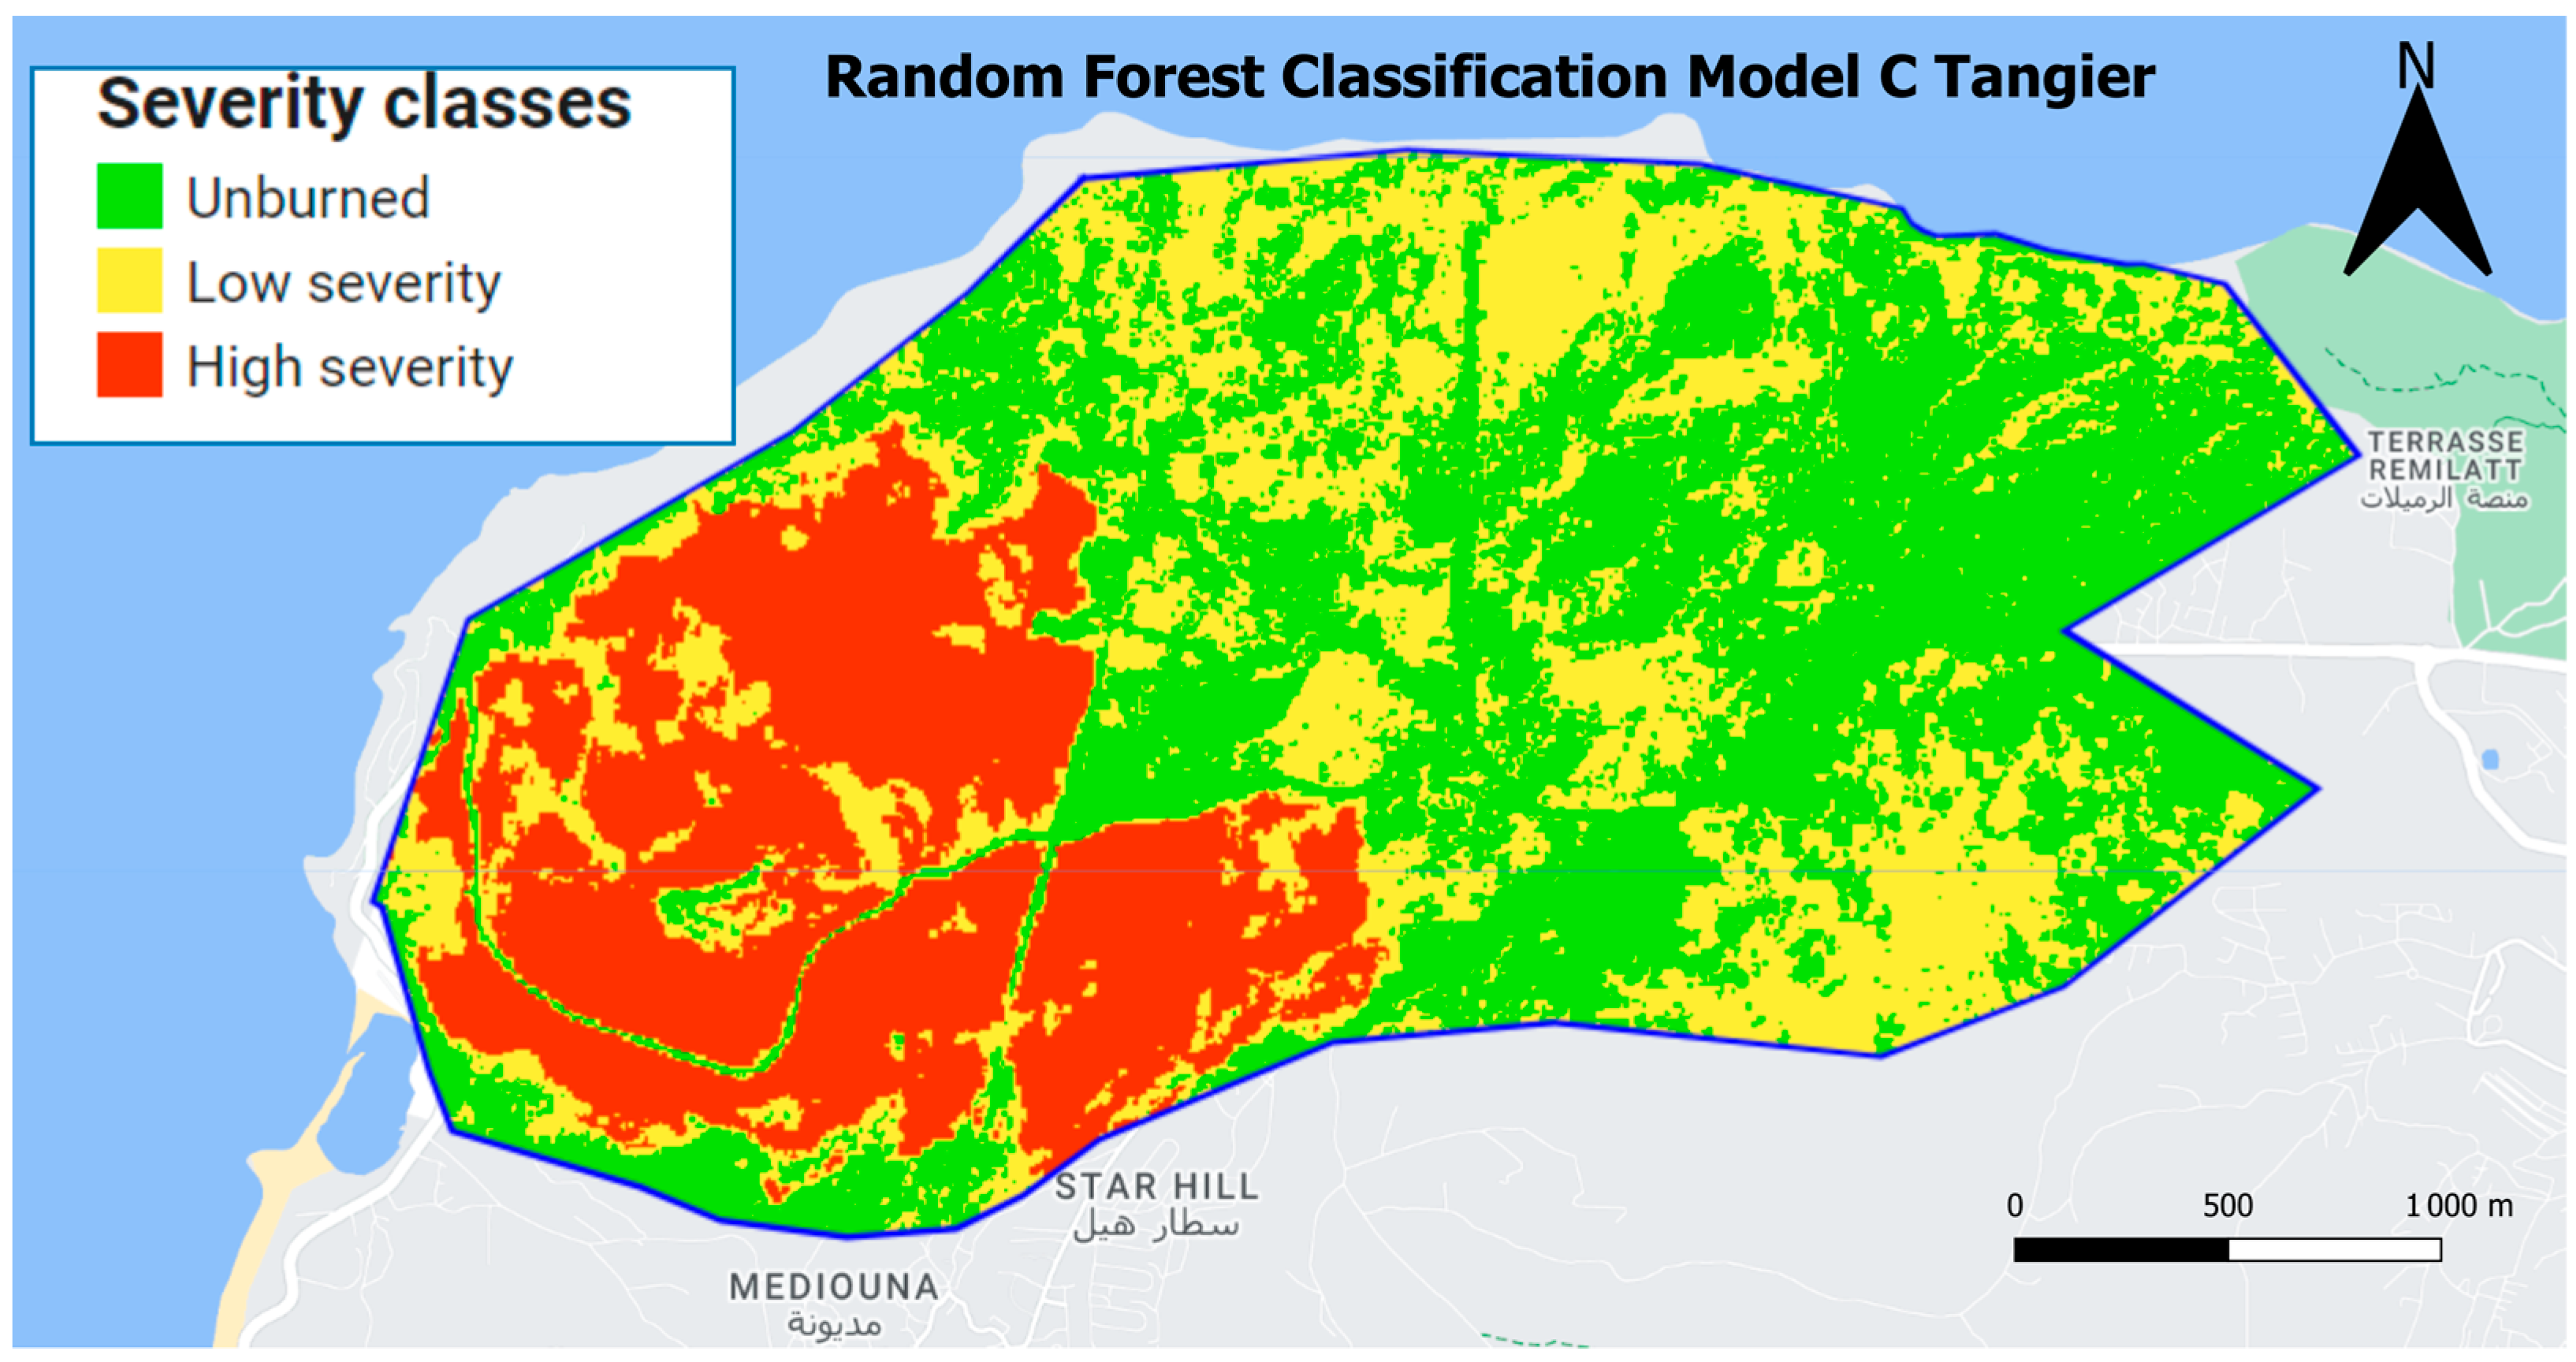
Based on the insights derived from the feature importance analysis, our study put forth the hypothesis that the combination of the random forest (RF) algorithm with the four indices (dNBR, dSAVI, dBAI, and dNDVI) would yield the highest accuracy in fire burned area detection (Table 6). To test this hypothesis, we introduced “Model C” as an additional classifier (Figure 14). Model C was specifically designed to incorporate these key variables and evaluate their impact on the accuracy of the classification process. By including the most important variables identified through feature importance, we aimed to thoroughly assess their individual contributions and determine their influence on the overall performance of the RF classifier. The creation of Model C allowed us to gain a deeper understanding of the specific influence of these bands and their overall impact on the classification process.
In general, the results obtained in the classification can be considered good if the value of the accuracy is higher than 85% [65].
Based on the findings presented in Table 7, Model C, which incorporates the bands (nd, dbai, dsavi, and dndvi) in combination with the random forest (RF) algorithm, demonstrates improved performance.

3.4. Test and Validation

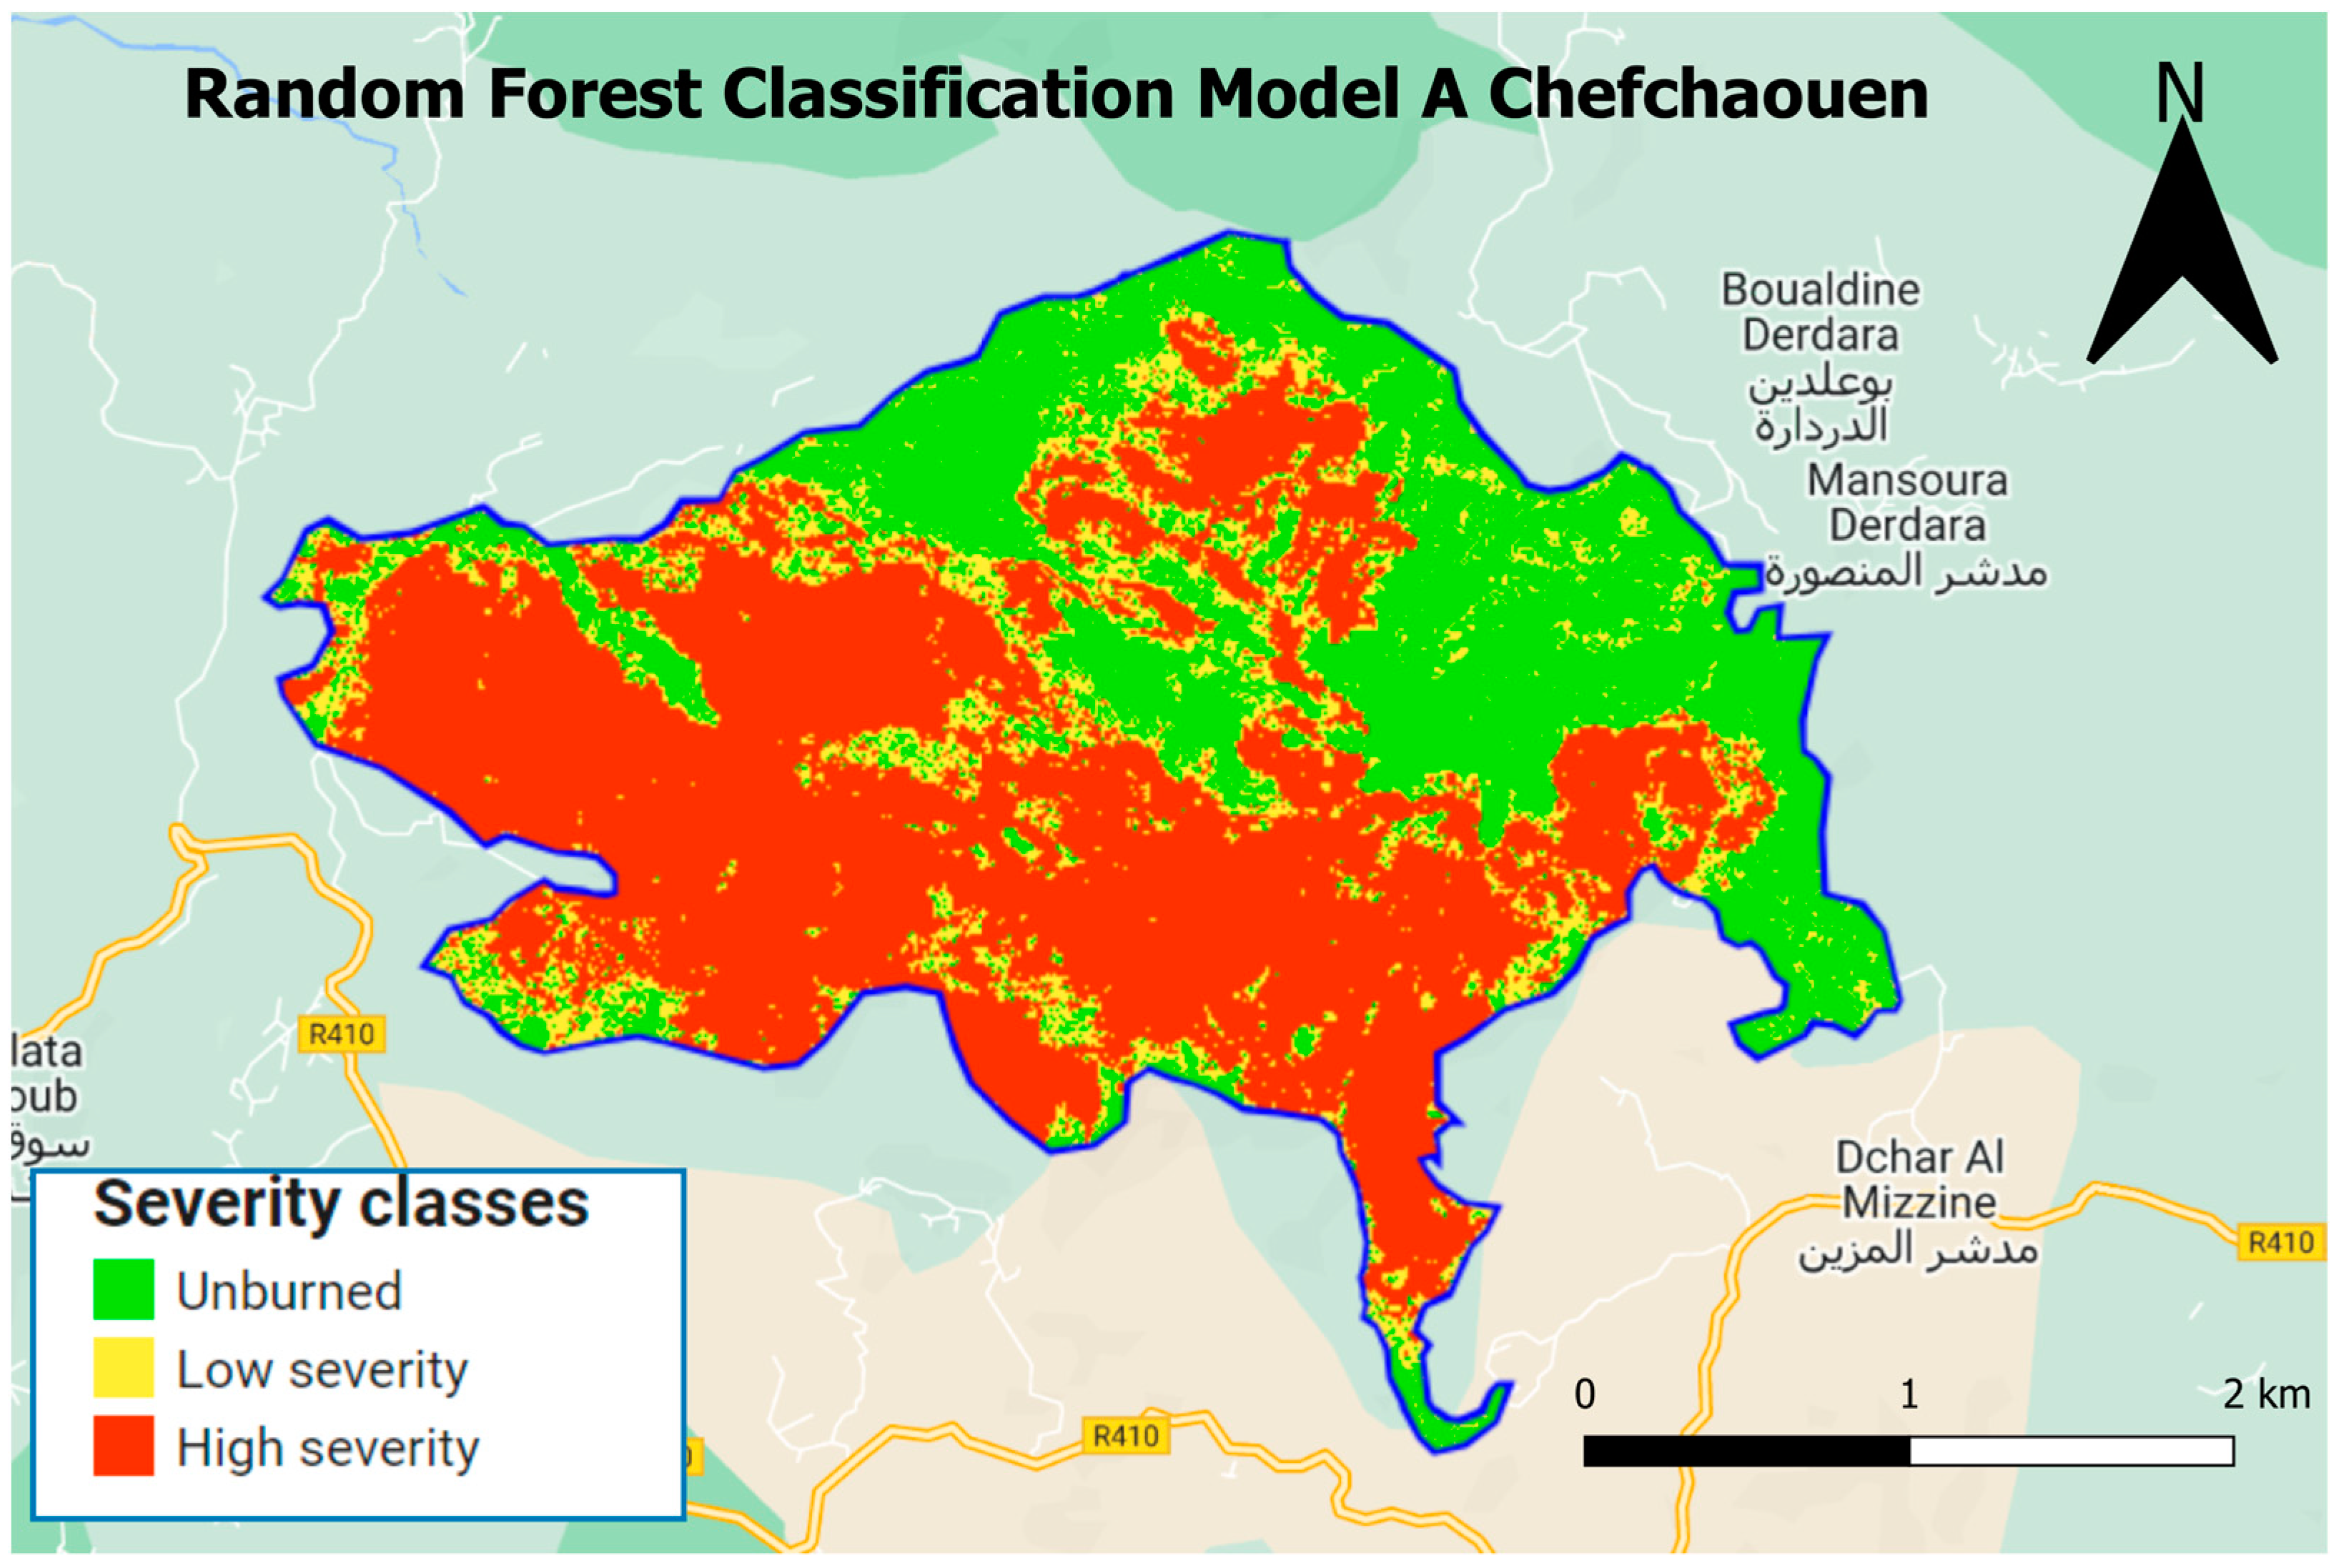
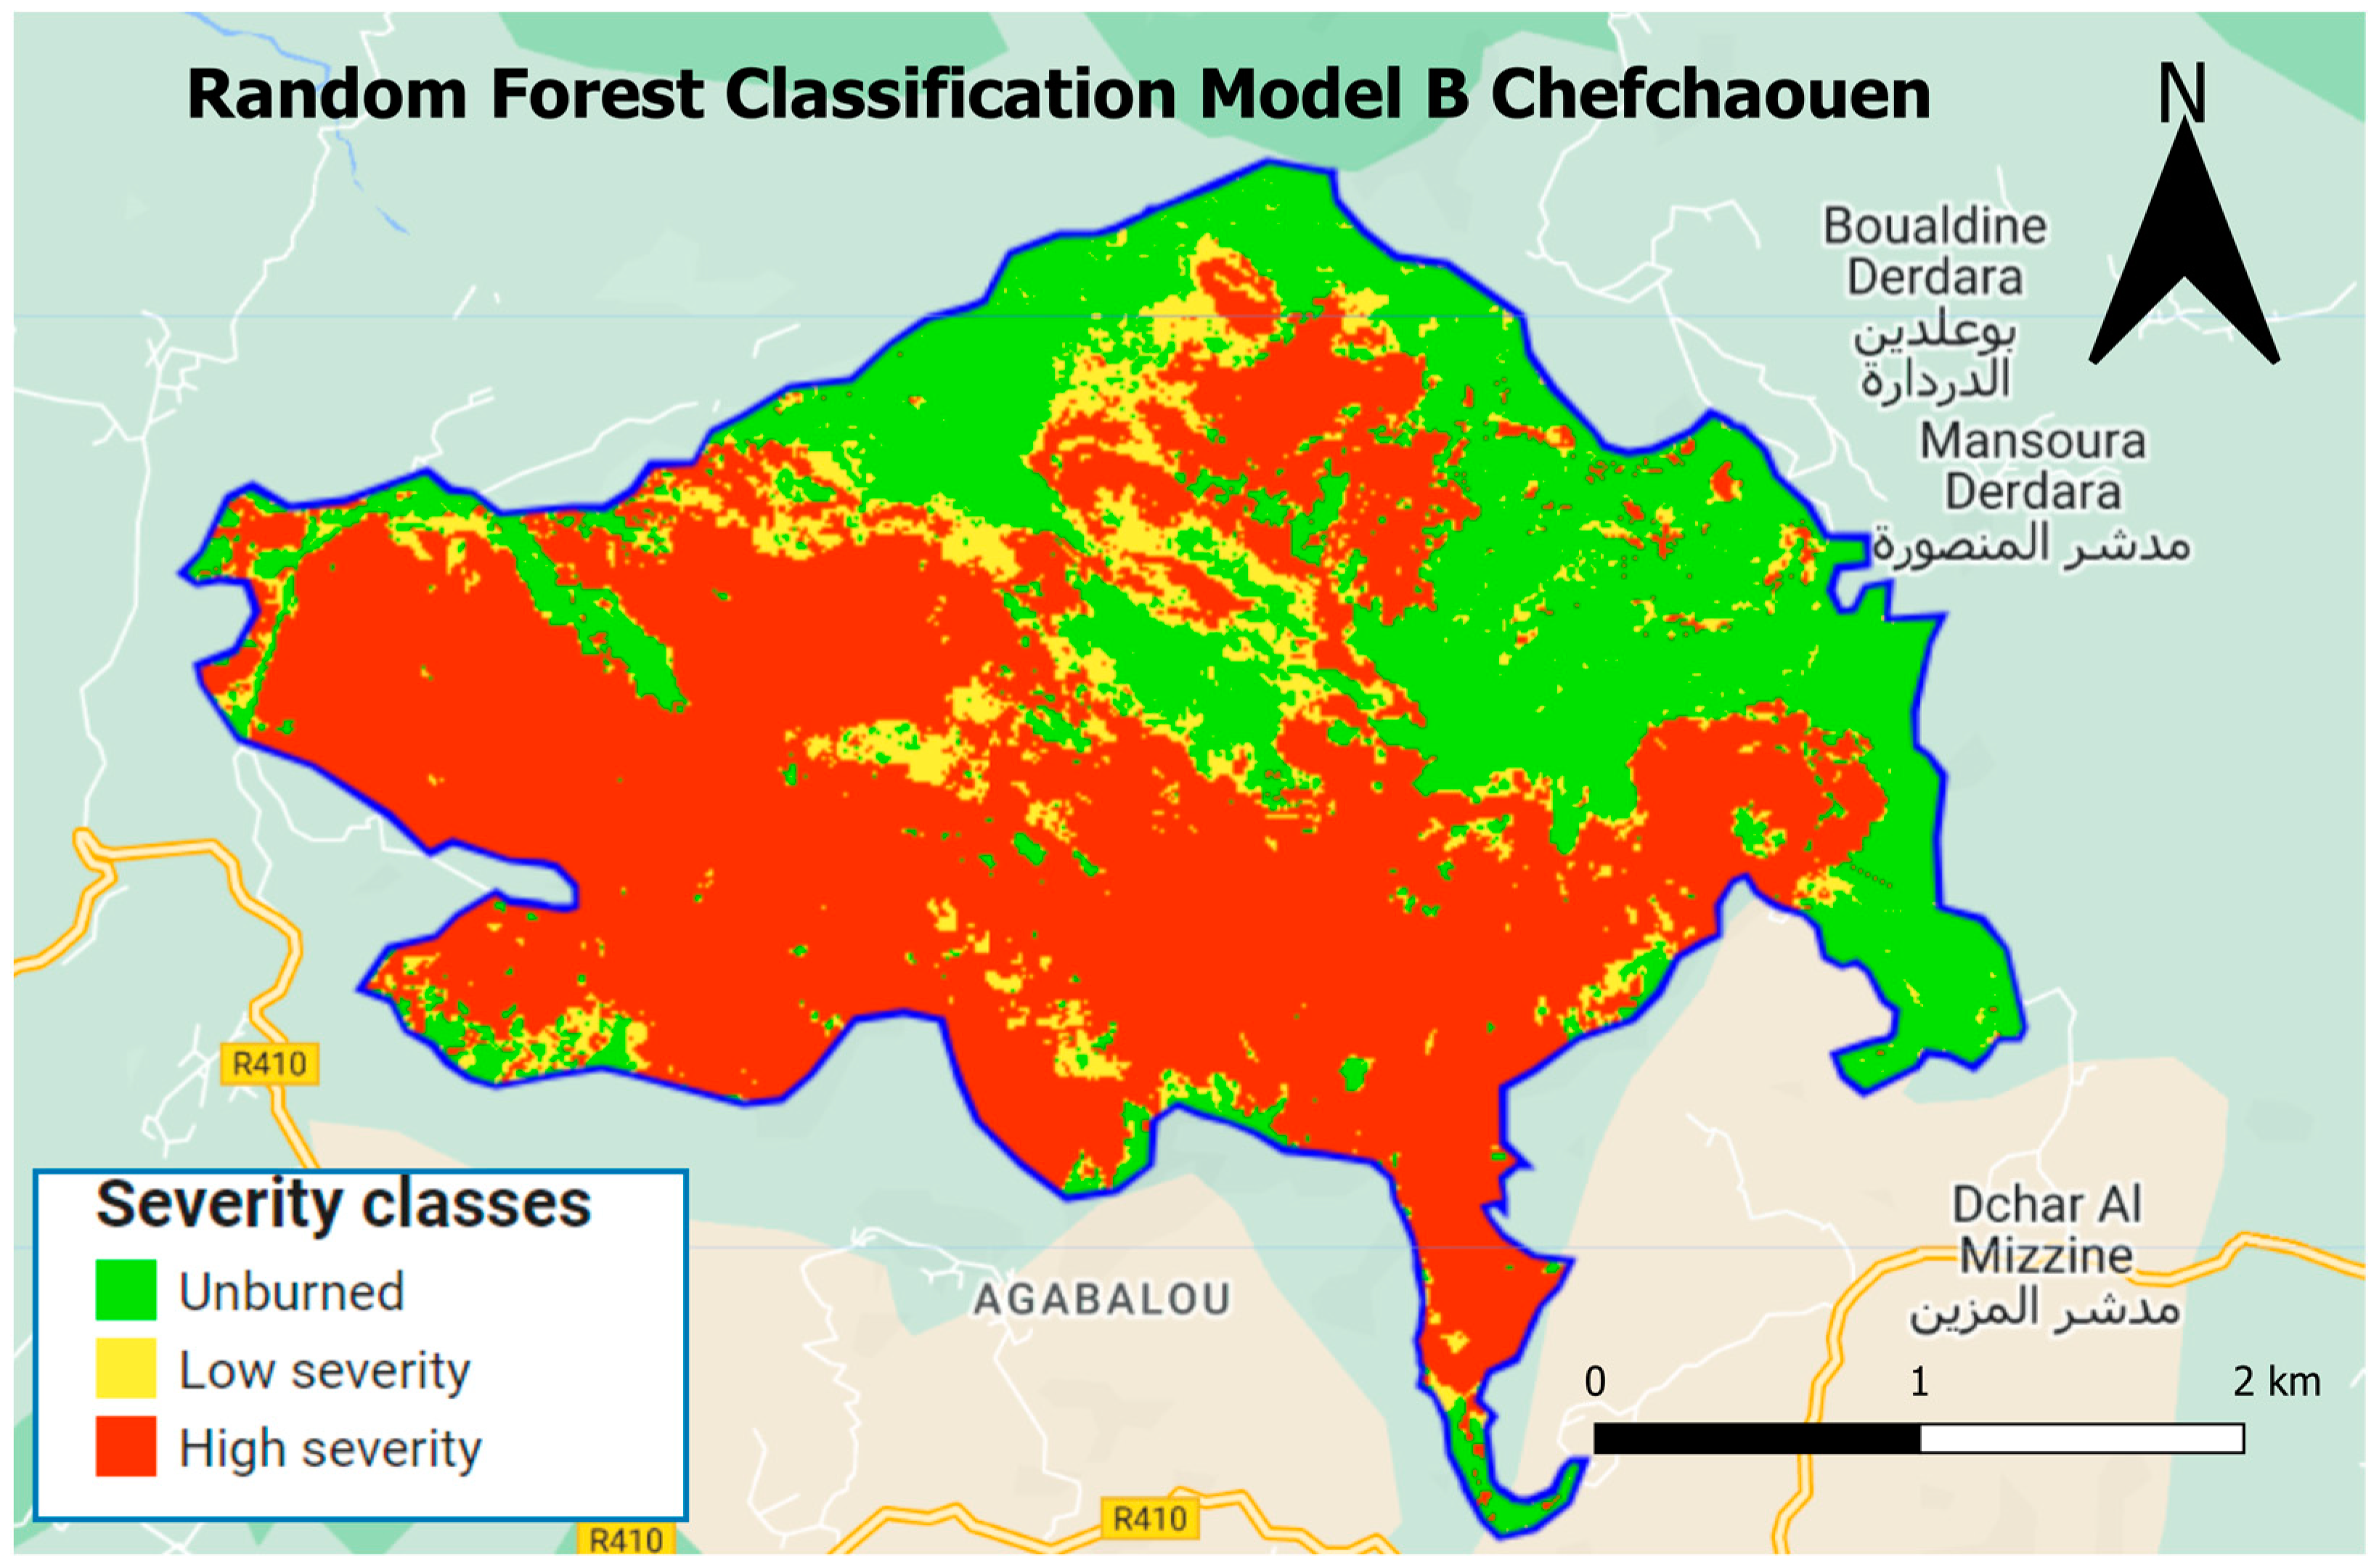
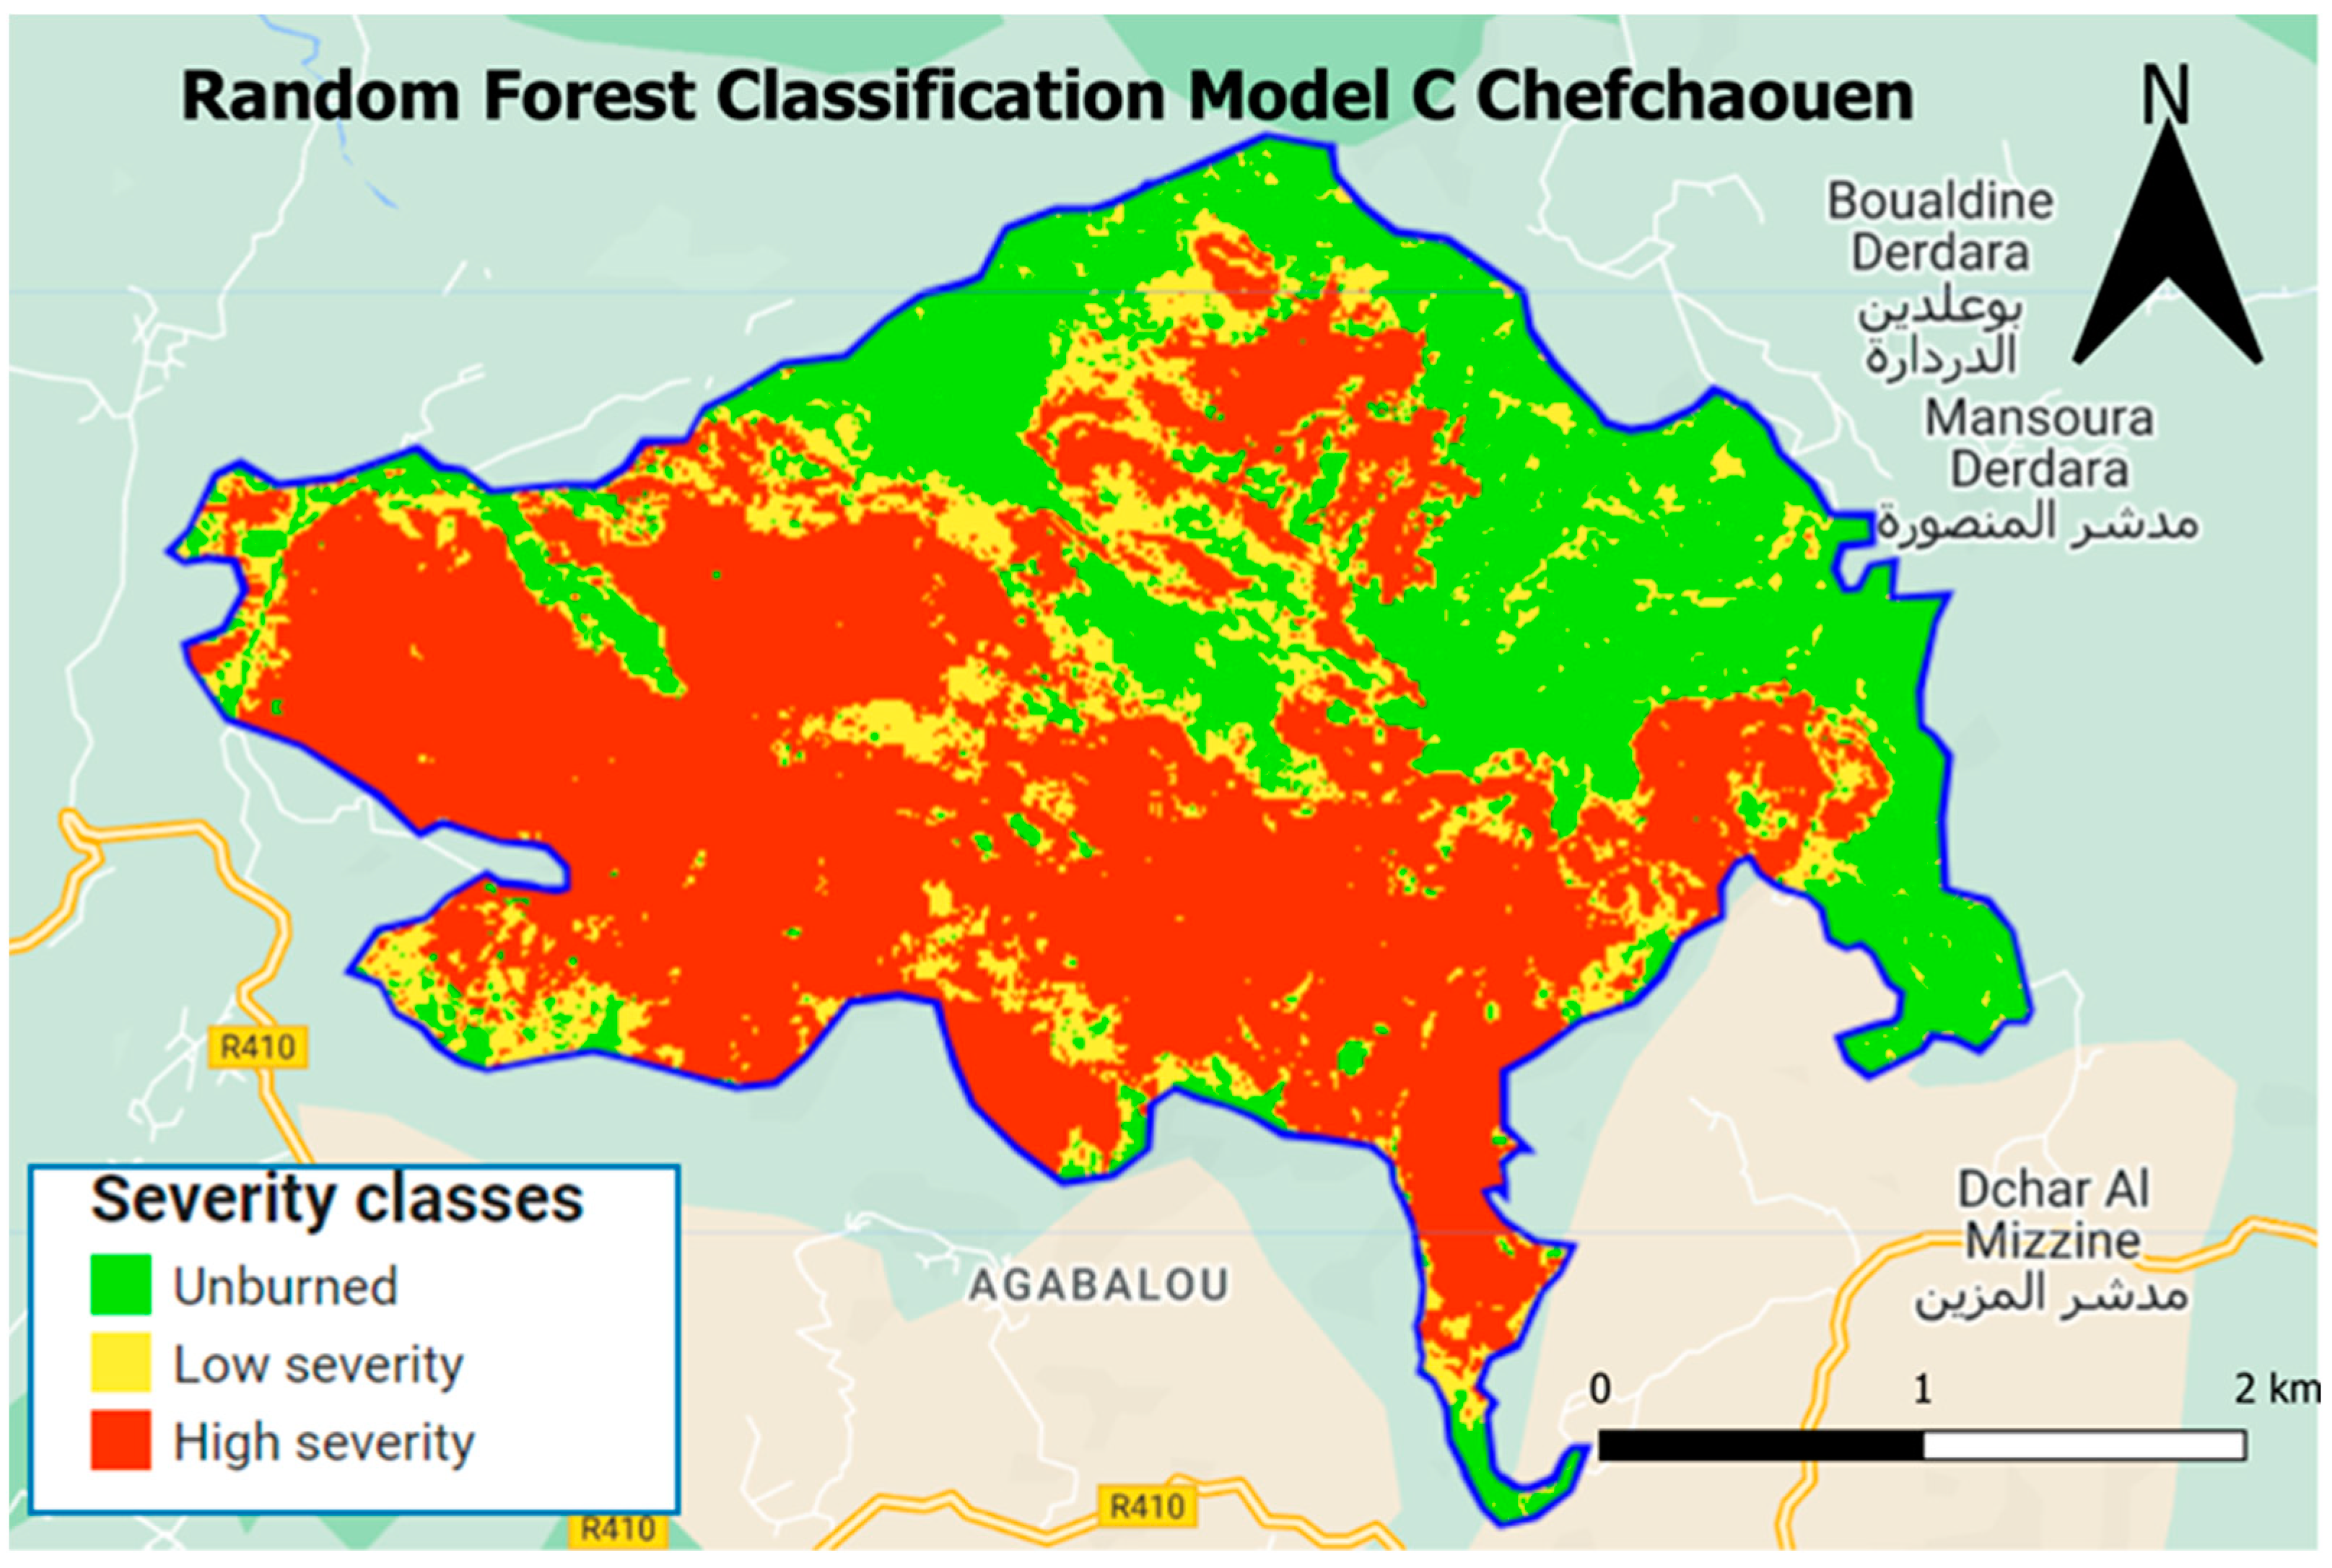
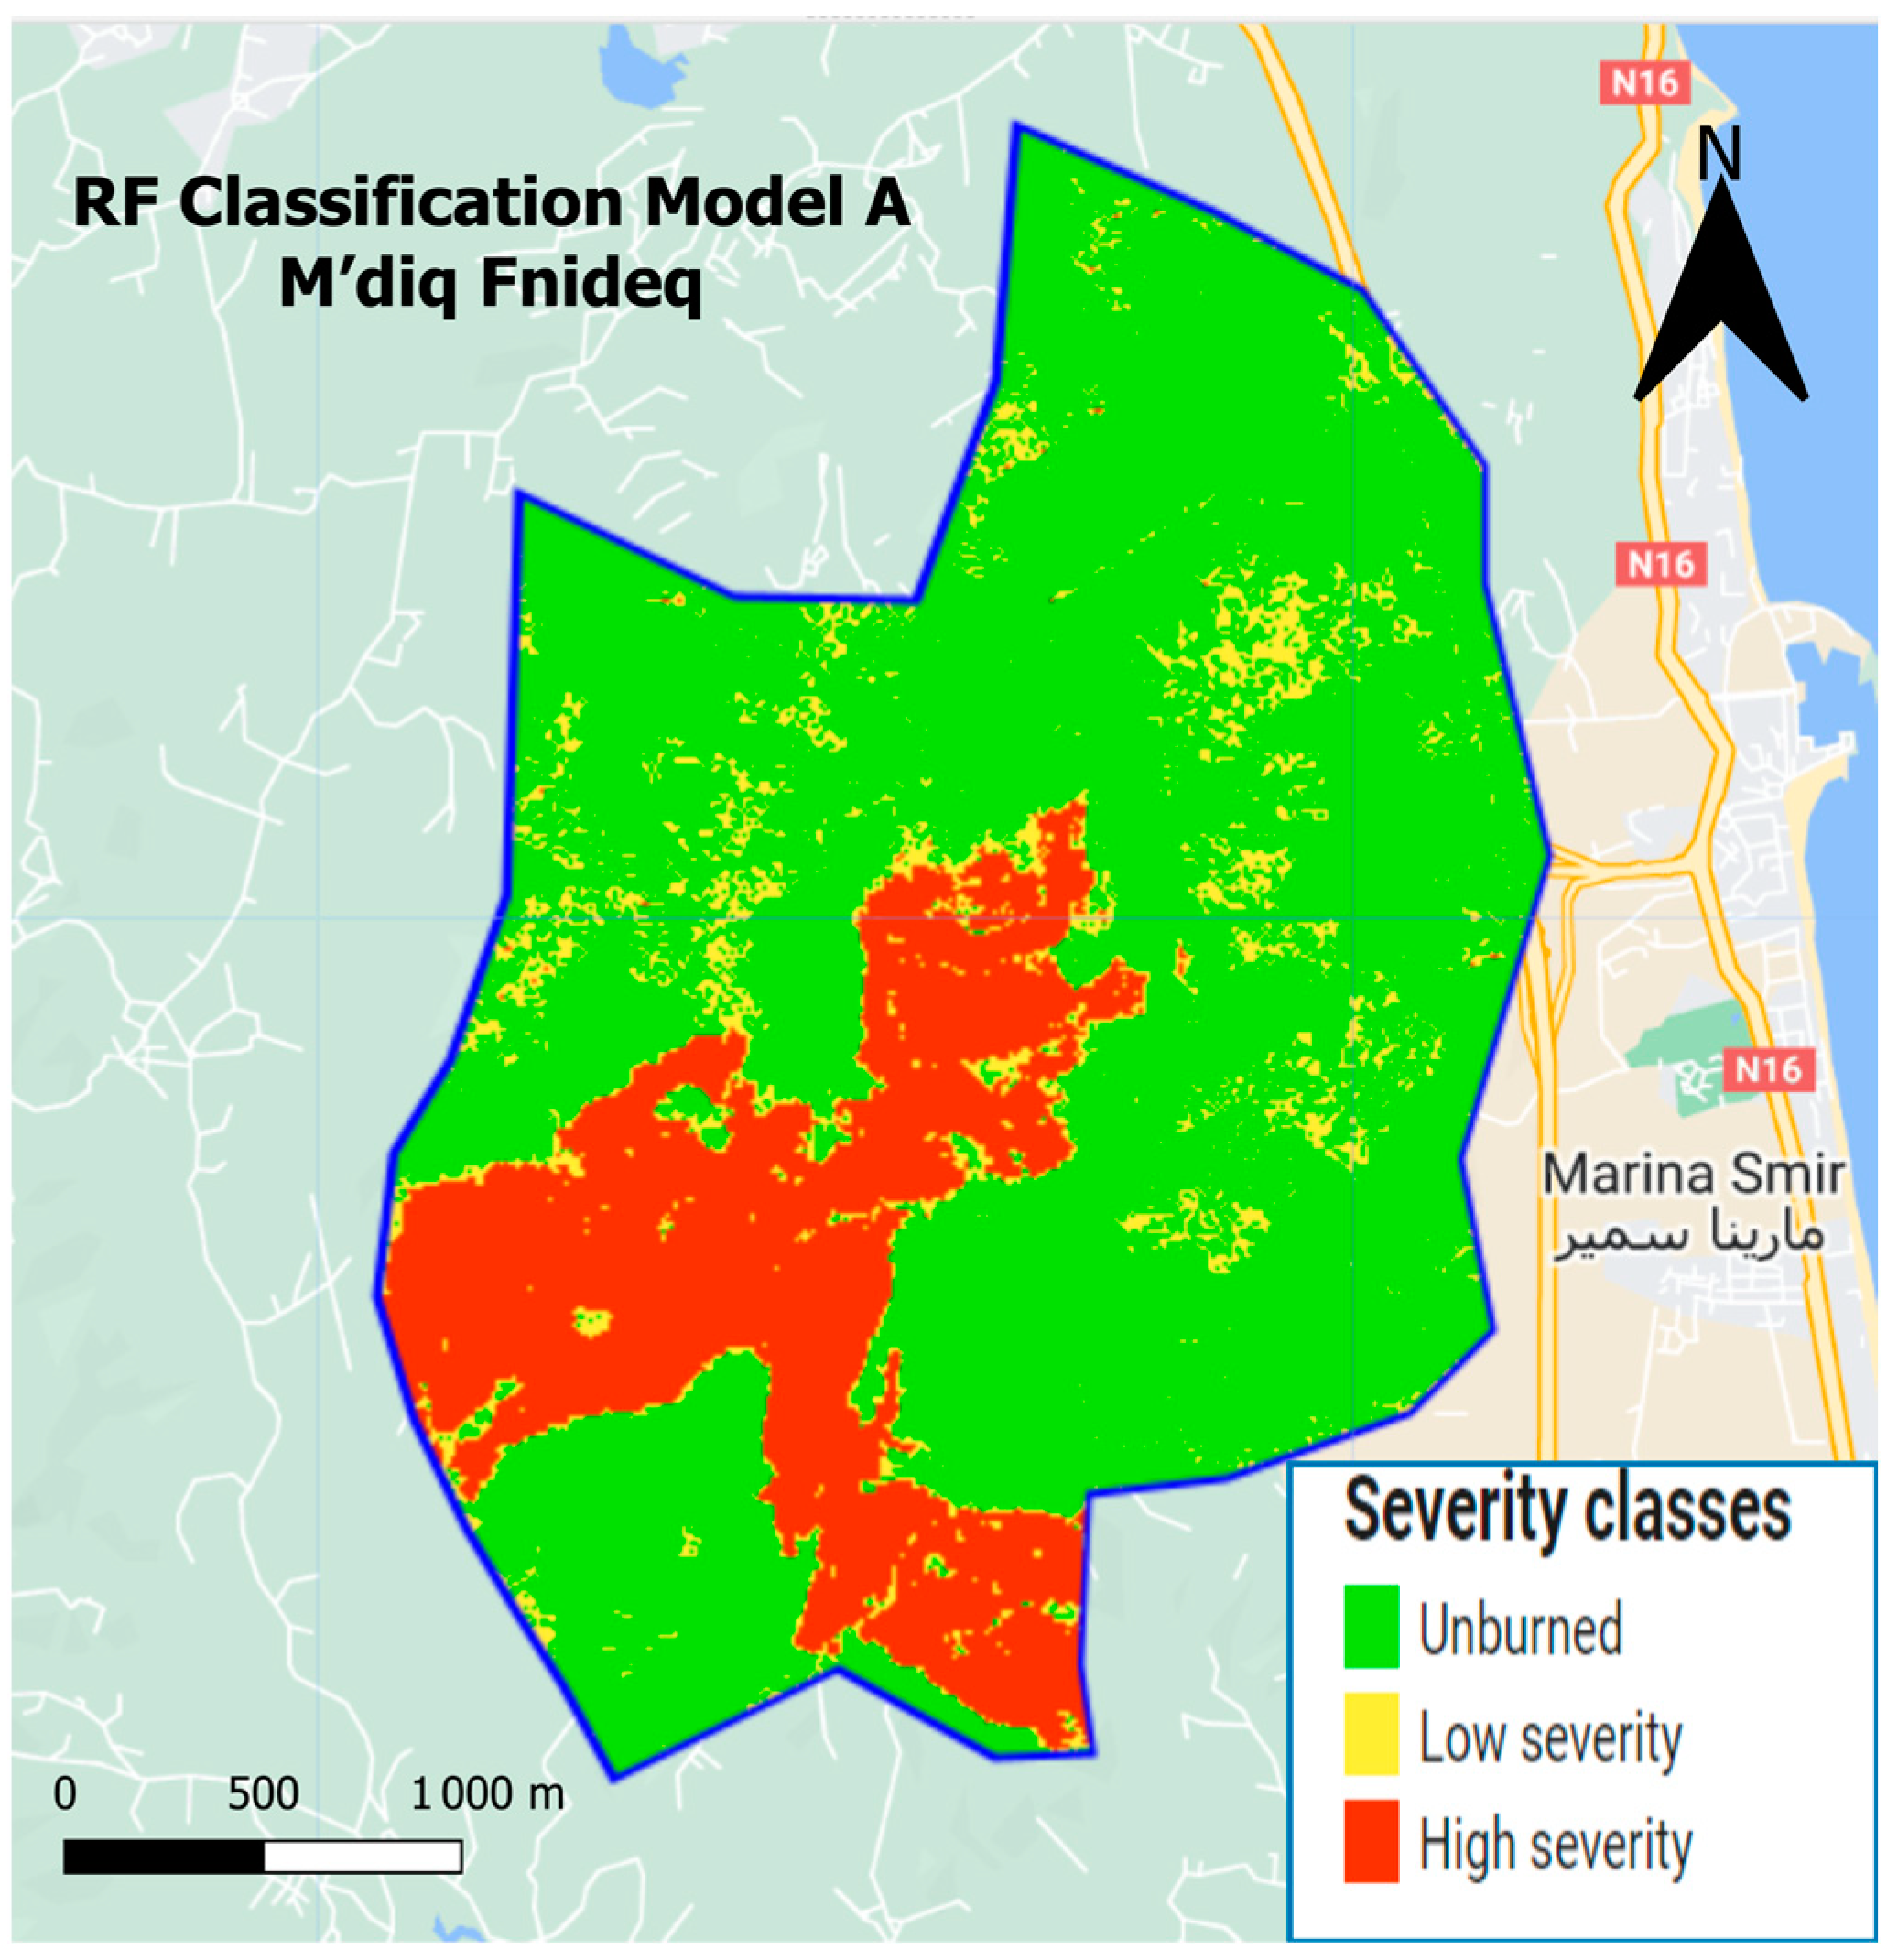
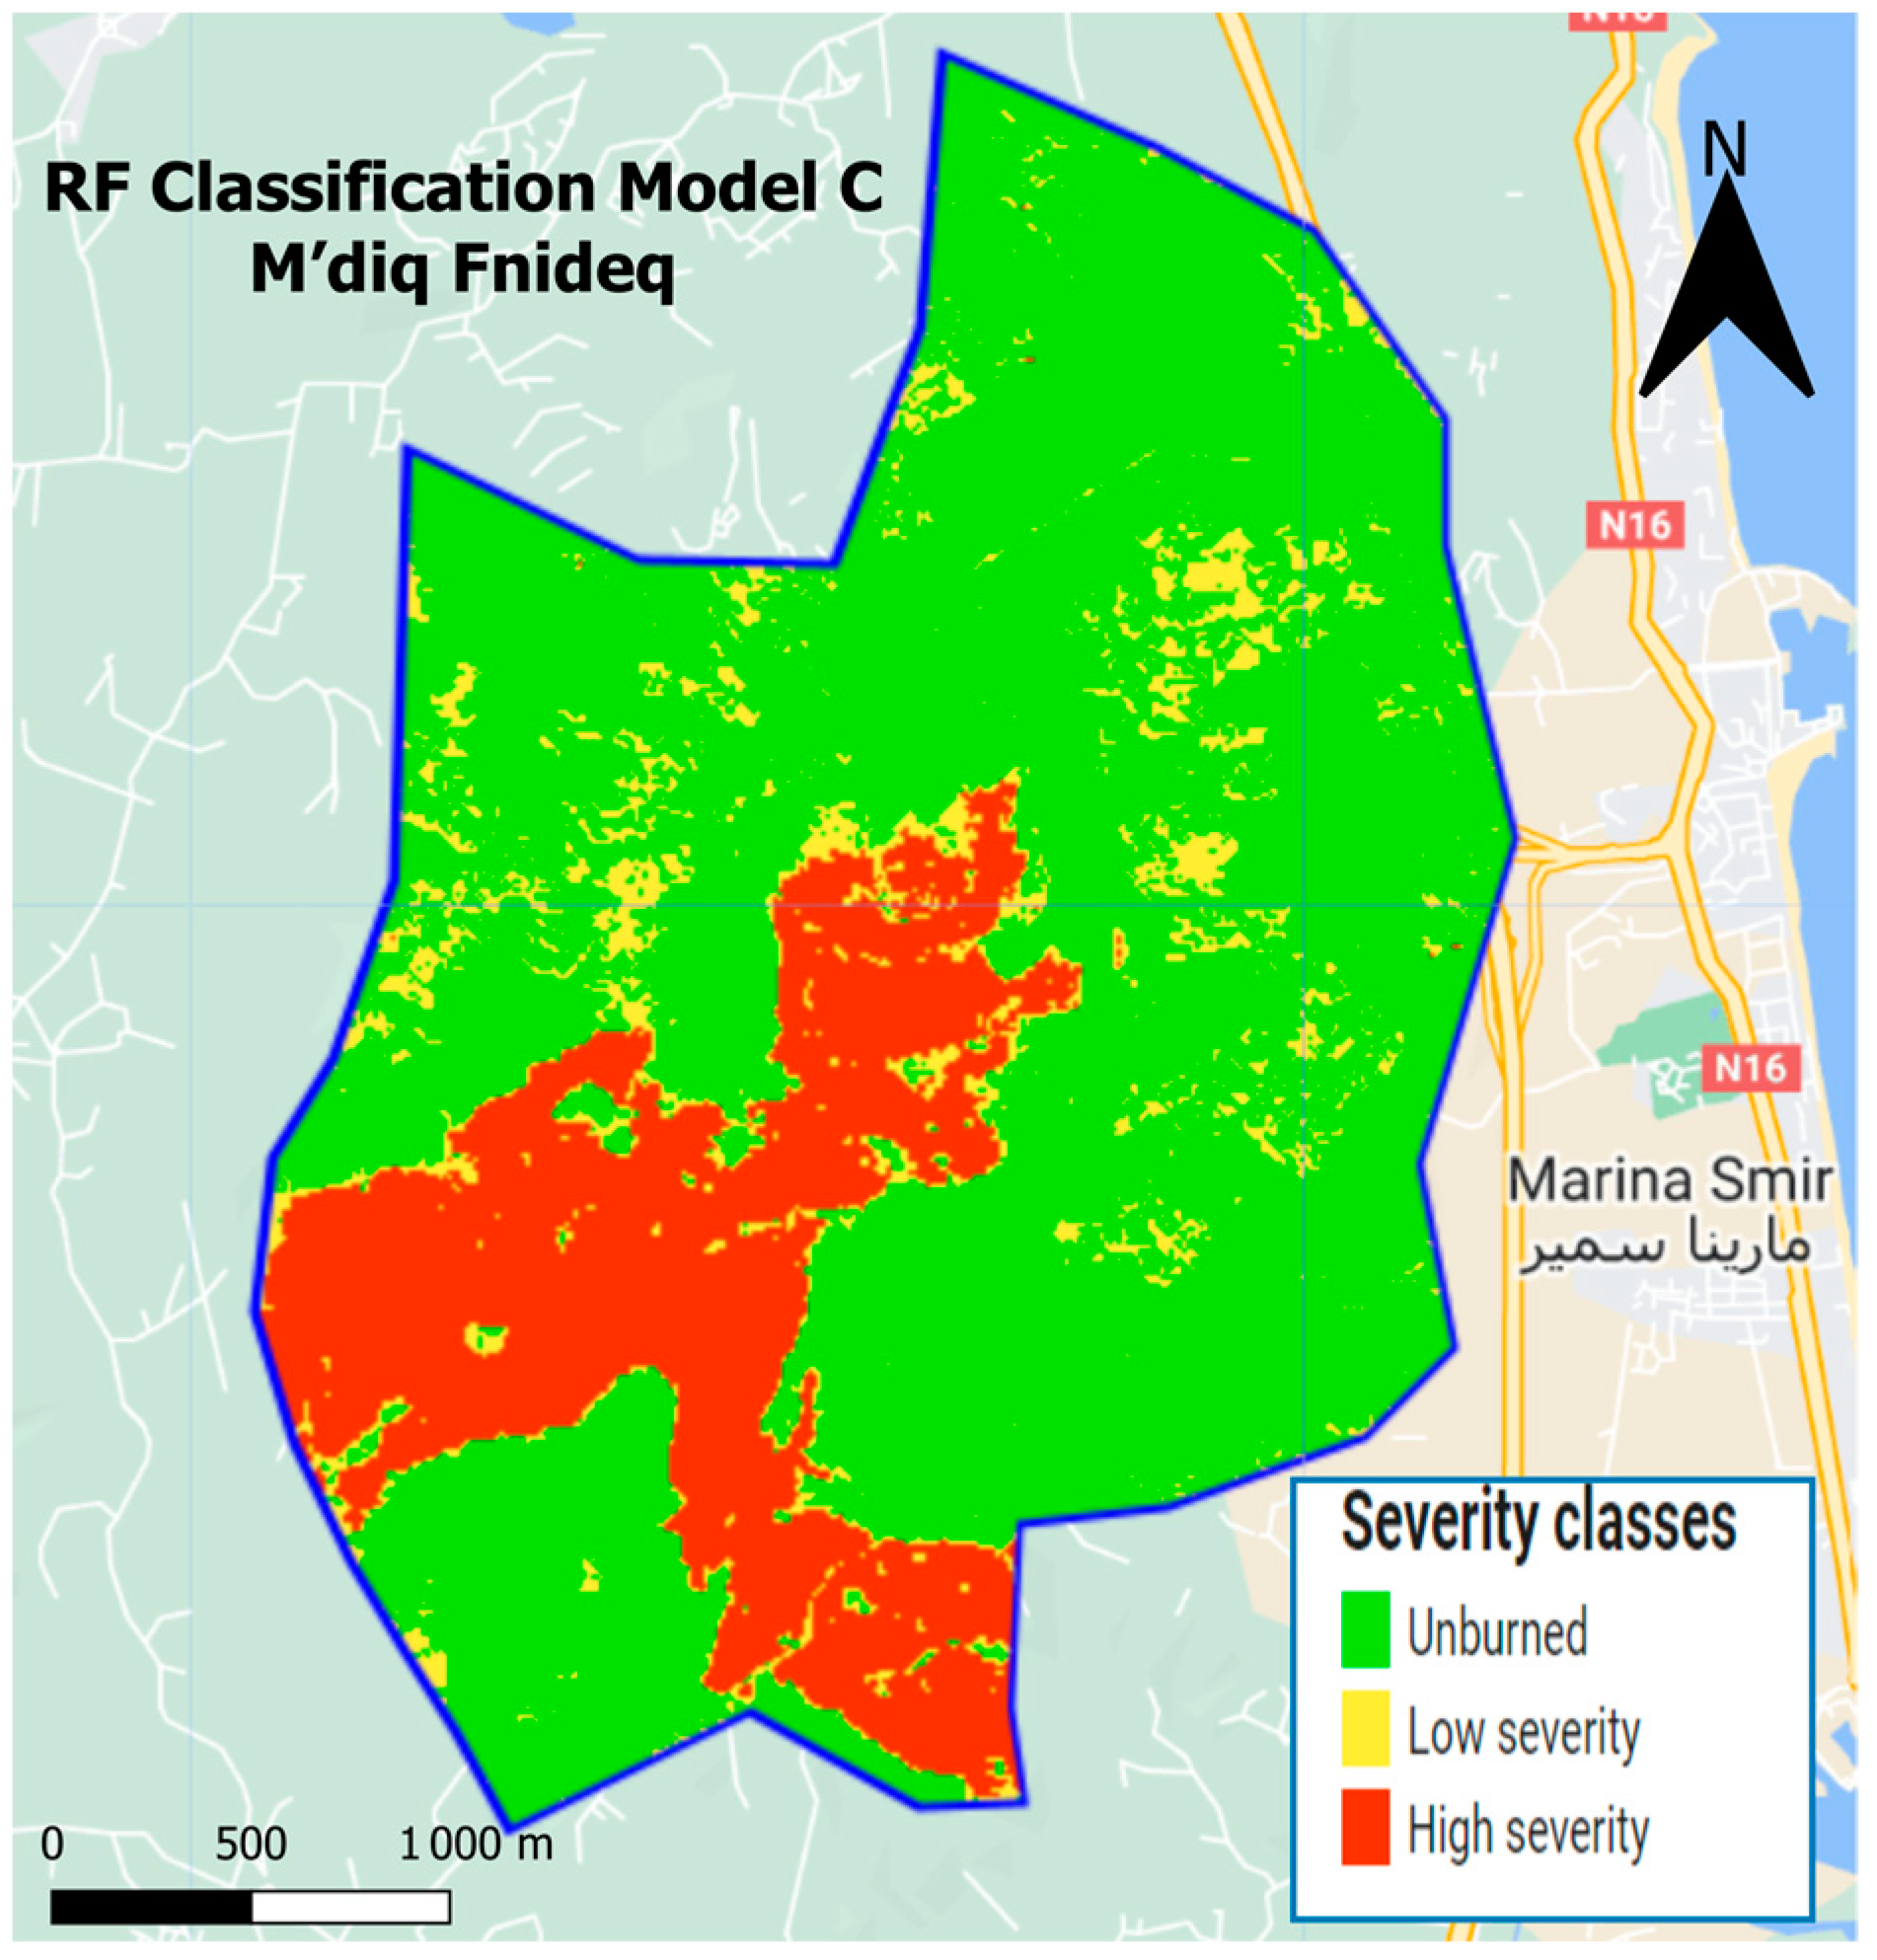
For validation purposes, we applied Model A, Model B, and Model C to Chefchaouen and M’diq Fnideq and obtained the following results (Figure 15, Figure 16, Figure 17, Figure 18, Figure 19 and Figure 20):
Samples from Chefchaouen and M’diq Fnideq, consisting of 150 and 180 in each class (high severity, low severity, and unburned) respectively, were used to calculate model accuracy and validate the results of Table 7.
Based on the accuracy analysis (Table 8, Table 9 and Table 10), it was observed that Model C, which utilizes only the spectral indices (dNDVI, dBAI, dNBR, and dSAVI), achieved the highest accuracy levels. In contrast, Model B, which incorporates all spectral indices and S2 bands, exhibited inconsistent and unstable results. Furthermore, Model A, which solely relies on the dNBR index, demonstrates relatively poor accuracy. These findings highlight the superior performance of Model C in accurately detecting fire-burned areas, emphasizing the importance of the selected indices in enhancing the classification accuracy.

3.5. Results of Mapping the Burned Area on GEE

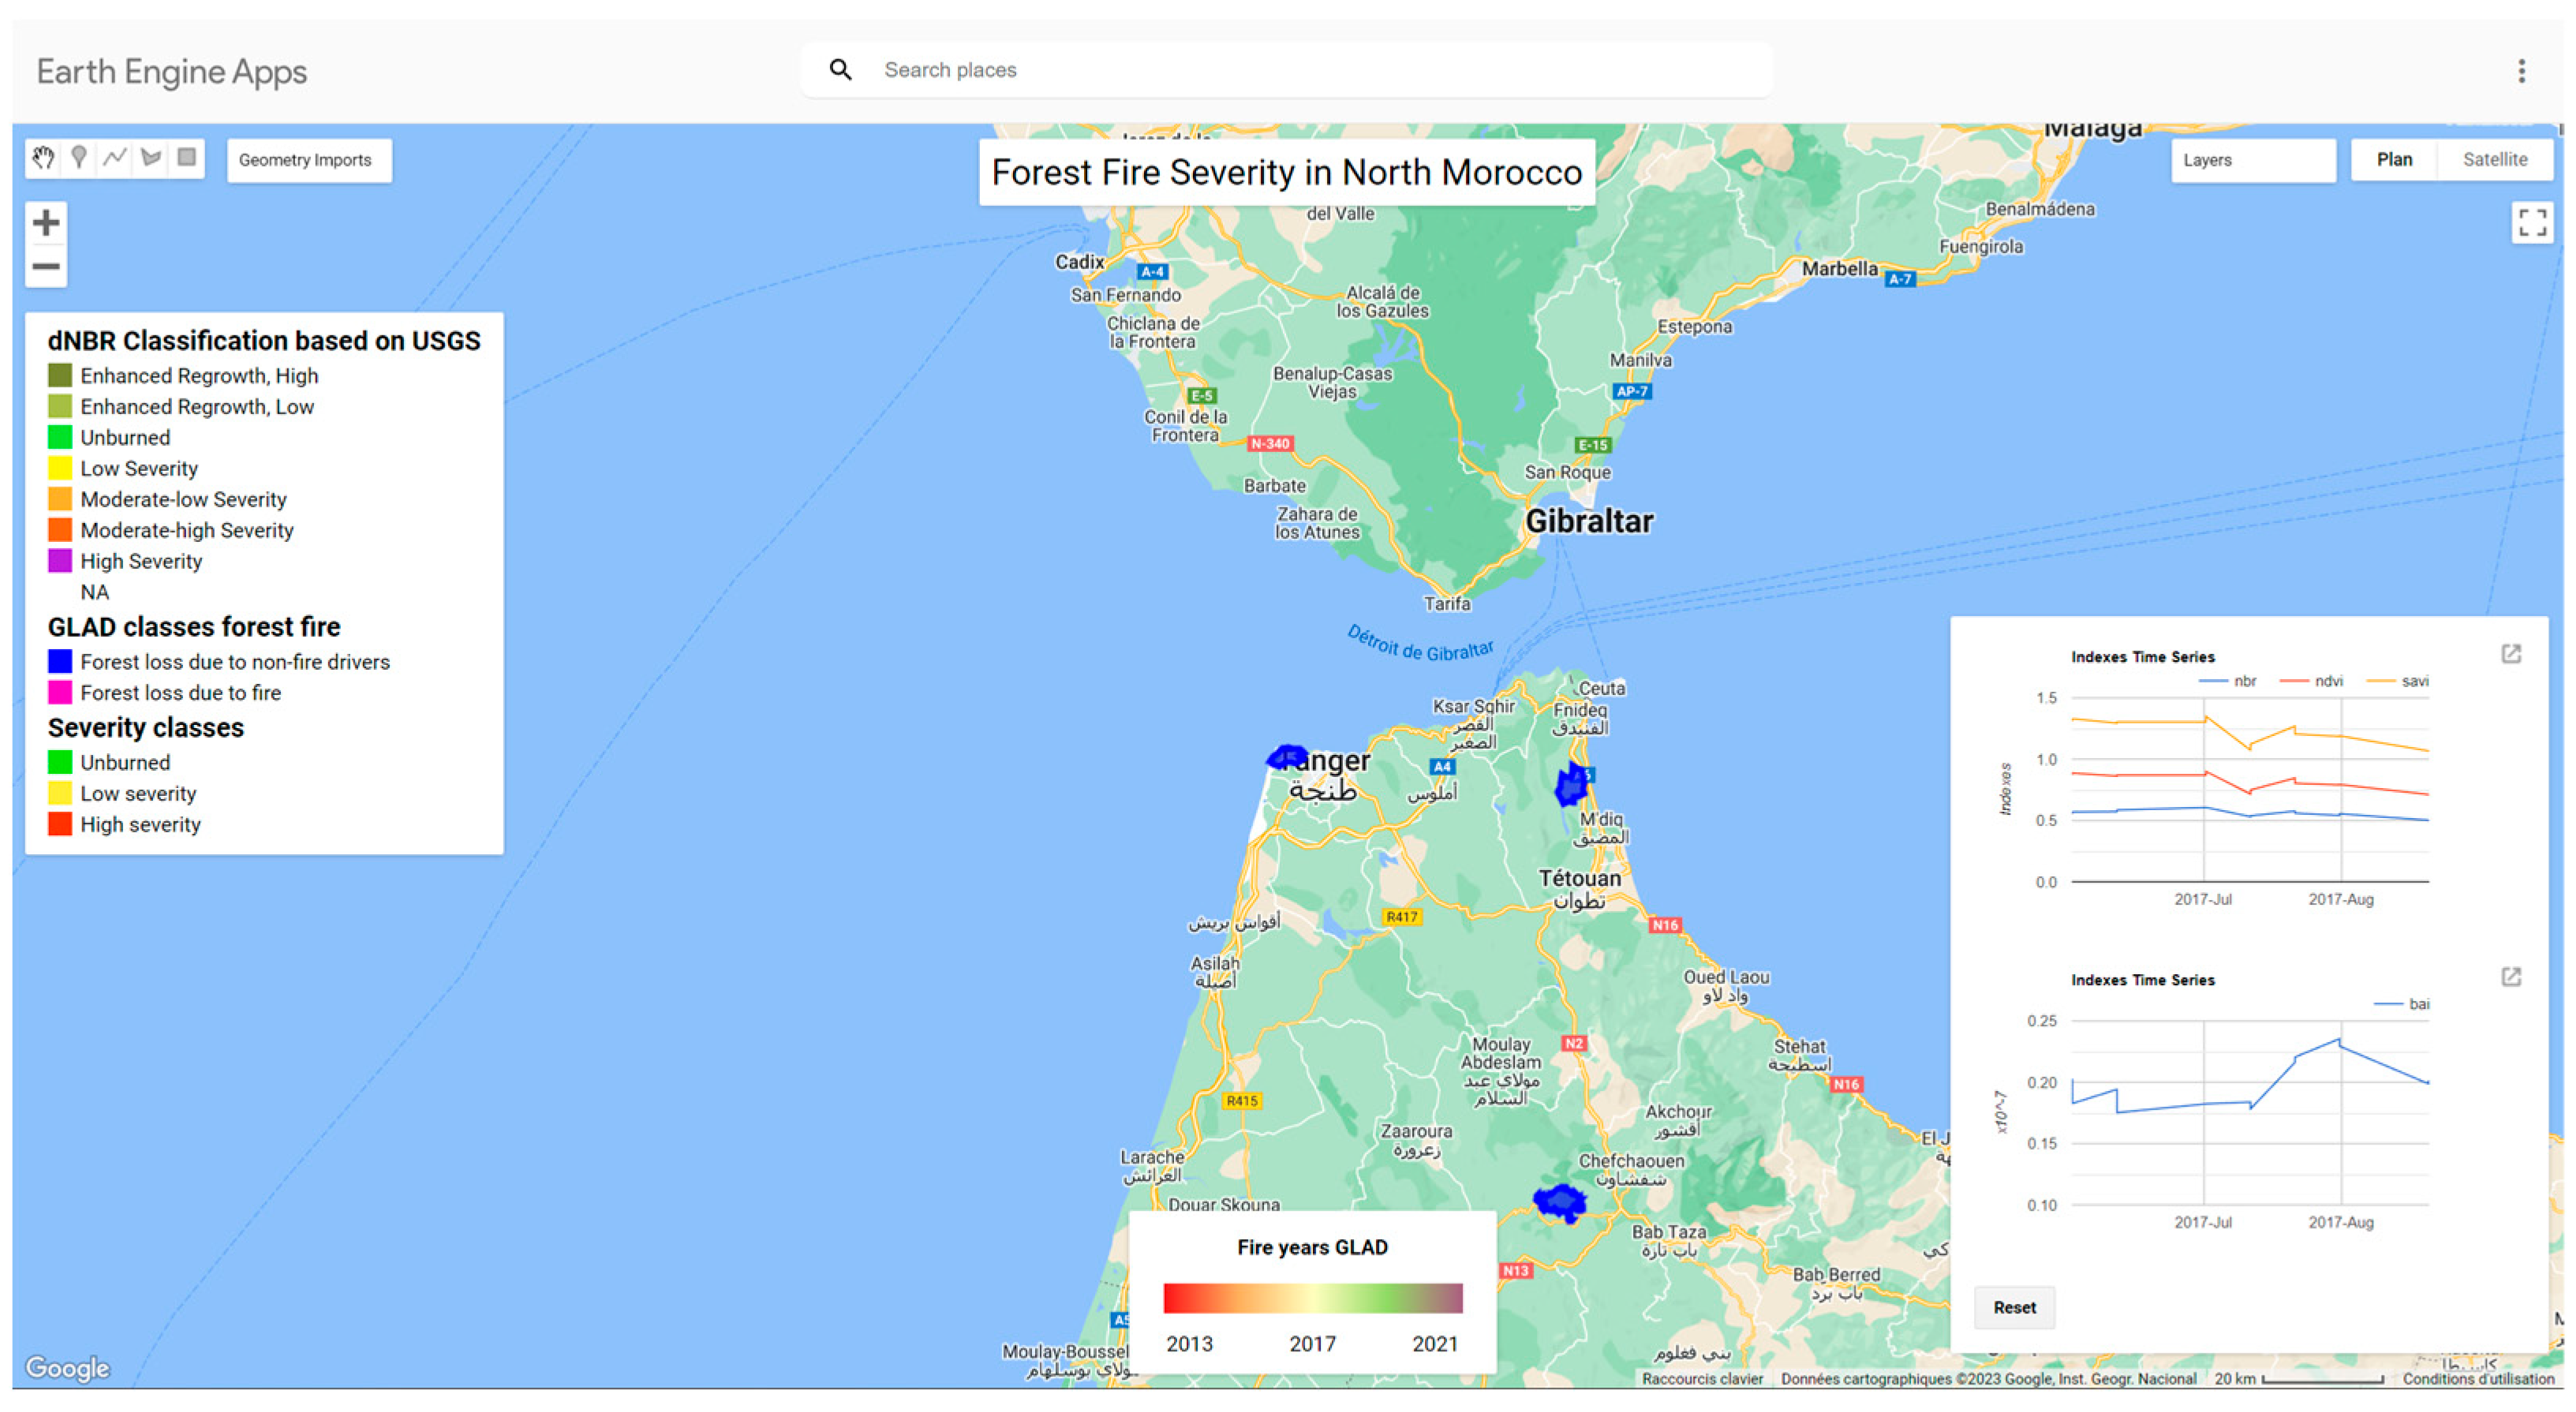
We extracted the diverse results of the burned area classification in Tangier-Assilah, Chefchaouen, and M’diq Fnideq from the website that we developed using Google Earth Engine (GEE). The website allows us to visualize graphs displaying the variations of spectral indices such as NBR, NDVI, SAVI, and BAI for any selected point, as long as it falls within one of the three regions of interest (Figure 21).

3.6. Discussion

In this study, RF, which is a ML classifier, was used to detect the burned area caused by forest fires in Tangier-Assilah, Chefchaouen, and M’diq Fnideq, North Morocco. The MSI sensor of the S2 satellite was used for the pre- and post-fire images. Three models, each composed of different combinations, were assessed. Based on the accuracy evaluation, the most suitable model for the detection of burned areas was identified. In all sites, Model C shows a higher overall accuracy than Model A and Model B.
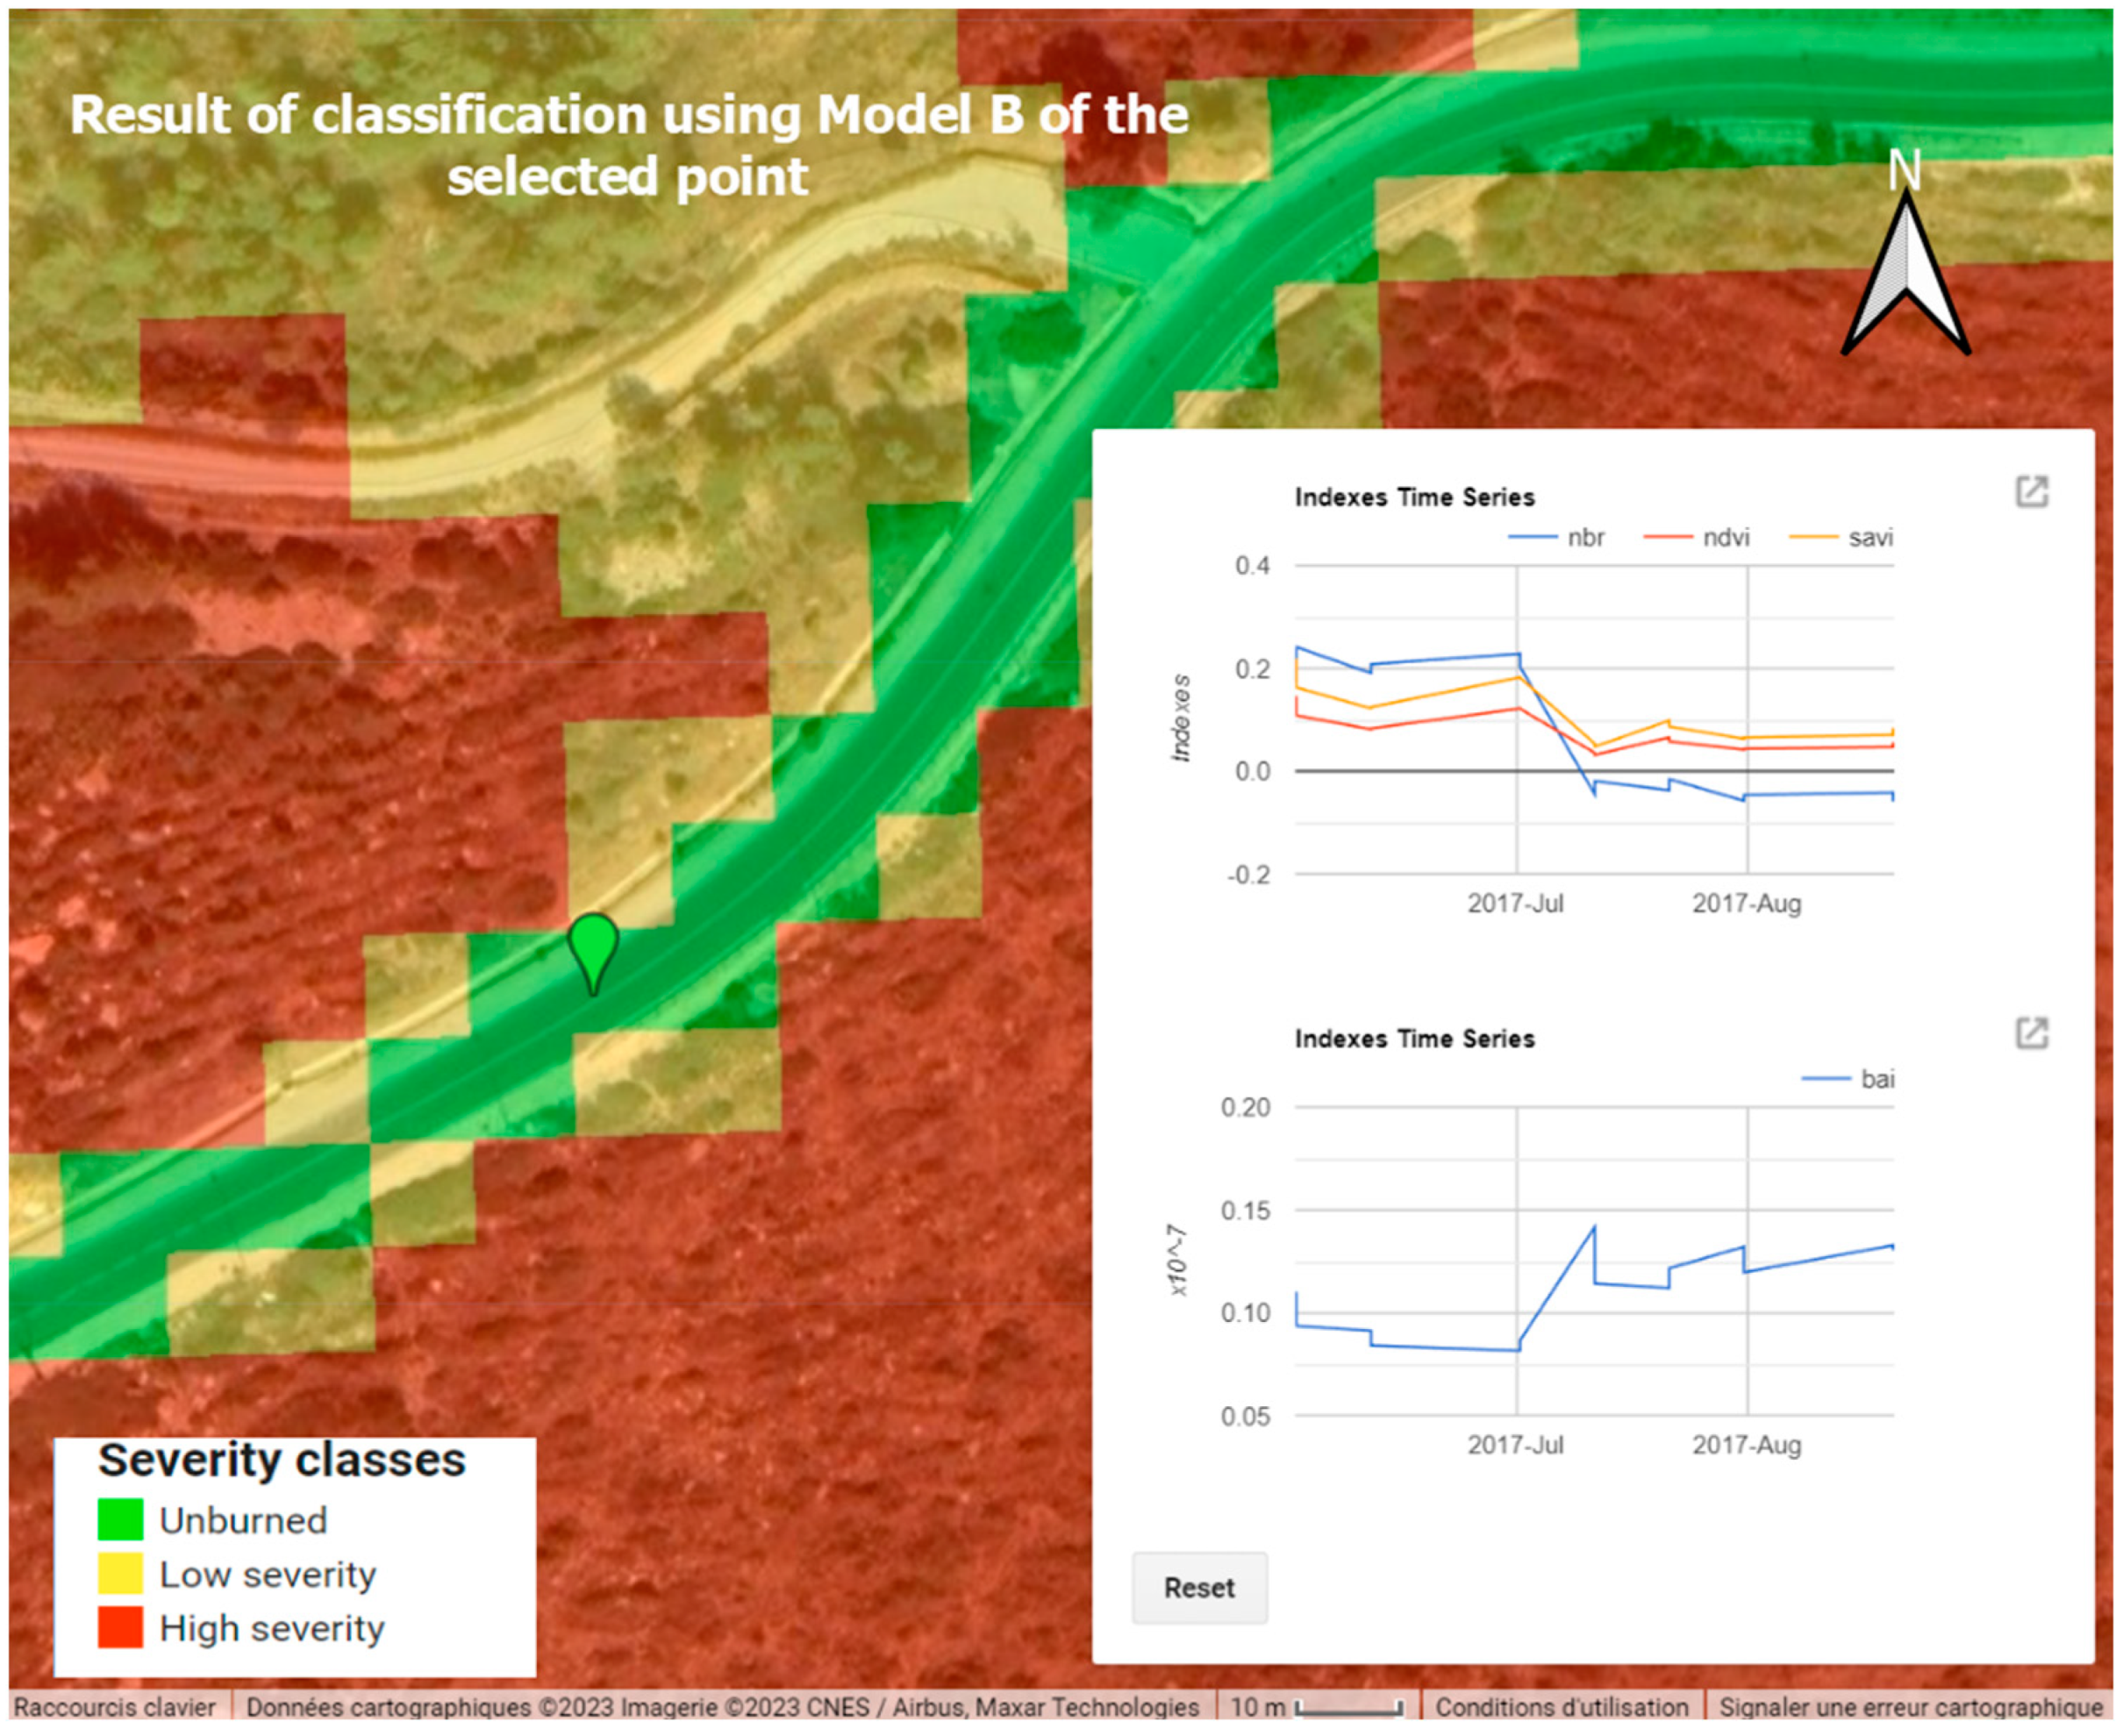
To explain this result, we chose a point that was considered low severity with Model A and unburned with Model B (Figure 22 and Figure 23).
We can observe that the selected point was classified differently in the three models. With Model A, the point was weakly burned (yellow color), whereas with Models B and C, it was classified as unburned (green color), which seems more logical as the point is located in the middle of a road. Furthermore, it can be observed that with Model A, a large portion of the road was considered weakly burned, as can be seen in Figure 22 and Figure 23. The misclassification can be attributed to the fact that in Model A, only dNBR was used, which has a positive value indicating a burned area. In contrast, with Models B and C, the addition of other spectral indices resulted in more accurate classification results. This observation is consistent with previous studies that have found that incorporating multiple spectral indices in the classification process improves the accuracy of machine learning techniques. For instance, the study conducted by [70] used machine learning algorithms, including Support Vector Machines (SVM) and Random Forest (RF), to classify the land cover using both the aerial imagery and vegetation indices such as NDVI and the Enhanced Vegetation Index (EVI), concluding that incorporating the vegetation indices with the multispectral aerial imagery improved the accuracy of the land cover classification. These findings highlight the importance of using multiple spectral indices to improve the accuracy of ML algorithms.
The instability observed in the accuracy of Model B, which incorporated all spectral indices and S2 bands, can be attributed to the inclusion of less important or noisy variables in the dataset. The presence of irrelevant information or noise may have introduced inconsistencies in the model’s classifications, resulting in unstable accuracy. In contrast, Model C focused on utilizing only the essential variables identified through feature importance analysis, namely the dNDVI, dBAI, dNBR, and dSAVI bands. By selectively including these significant variables, Model C achieved higher accuracy levels and demonstrates more stability compared to Model B. The improved performance of Model C can be attributed to its reduced dimensionality and the emphasis placed on the most influential variables. By incorporating only the key bands that carry relevant information for fire-burned area detection, Model C effectively captured the important patterns and made accurate classifications, leading to its high accuracy.

4. Conclusions

This study introduces a novel and deductive approach to identify the optimal combination of variables in the random forest (RF) algorithm for improving the accuracy of burned area detection. Through a comparative analysis and systematic investigation, the research explores the effectiveness of different models. Three models were evaluated: Model A, which solely utilized the dNBR index; Model B, incorporating additional spectral indices (dNDVI, dBAI, and dSAVI) along with the twelve bands of S2 imagery; and Model C, focusing exclusively on the selected spectral indices (dNDVI, dBAI, dSAVI, and dNBR).
The results demonstrate that incorporating multiple variables significantly enhances the accuracy of the RF classifier in detecting burned areas. However, it is worth noting that Model B exhibited varying performance across different regions, suggesting that an excessive number of variables can introduce bias and impact the classification outcomes. While Model B shows promising improvements in accuracy for Tangier-Assilah (from 83% in Model A to 95%) and M’diq Fnideq (from 82% in Model A to 88%), its accuracy was comparatively lower in Chefchaouen (from 90% in Model A to 87%). On the other hand, Model C consistently outperformed both Model A and Model B in all regions, achieving high accuracies of 96% for Tangier-Assilah, 96% for Chefchaouen, and 97% for M’diq Fnideq. These results underscore the effectiveness of the selected combination of spectral indices bands (dNDVI, dBAI, dSAVI, and dNBR) in Model C, leading to improved accuracy and reliability in detecting burned areas. The identification of the suitable bands for Model C was based on the feature importance analysis of Model B, which revealed the four spectral indices (dNBR, dSAVI, dBAI, and dNDVI) as the most valuable variables.
In conclusion, this research offers valuable insights through a comparative and deductive study, identifying the optimal combination of variables within the random forest algorithm for accurate burned area detection. The findings emphasize the significance of selecting appropriate variables to achieve superior performance in fire monitoring and management applications.

Future Work

In this work, this model requires sample points, which were manually selected based on data such as FIRMS, GLAD, and the visual difference between pre- and post-fire images. It would have been more reliable if the selection of sample points for training the model had been based on a reference map for fire severity.
It may be considered a future perspective to generate the model over all of northern Morocco to produce a reference map that will help decision-makers control fire damage. We used spectral indices to improve the accuracy of the classification, but we believe that other variables should be taken into account, including topography-related variables such as elevation and slope, since fire moves more rapidly over topographically high terrain than over flat terrain, and meteorological factors such as temperature, air humidity, wind speed, and others. A possible next step would be to go beyond mapping burned areas to predicting areas vulnerable to wildfire, which would be of great use for countries frequently affected by wildfire, such as Morocco.

Author Contributions

Conceptualization, H.B. (Houda Badda); methodology, H.B. (Houda Badda) and H.B. (Hakim Boulaassal); software, H.B. (Houda Badda); validation, E.K.C., M.W., O.Y.A., O.E.K., M.M. and H.B. (Hakim Boulaassal); formal analysis, H.B. (Houda Badda); investigation, H.B. (Houda Badda); resources, H.B. (Houda Badda); data curation, H.B. (Houda Badda); writing—original draft preparation, H.B. (Houda Badda); writing—review and editing, E.K.C., M.W., O.Y.A., O.E.K., M.M. and H.B. (Hakim Boulaassal); supervision, E.K.C., A.B., M.W., O.Y.A., O.E.K., M.M. and H.B. (Hakim Boulaassal); project administration, E.K.C., A.B., F.C. and H.B. (Hakim Boulaassal); funding acquisition, F.C. and E.K.C. All authors have read and agreed to the published version of the manuscript.

Funding

This research received no external funding.

Data Availability Statement

Not applicable.

Conflicts of Interest

The authors declare no conflict of interest.

References

  1. Dutra, D.J.; Anderson, L.O.; Fearnside, P.M.; Graça, P.M.L.d.A.; Yanai, A.M.; Dalagnol, R.; Burton, C.; Jones, C.; Betts, R.; Aragão, L.E.O.e.C.d. Fire Dynamics in an Emerging Deforestation Frontier in Southwestern Amazonia, Brazil. Fire 2023, 6, 2. [Google Scholar] [CrossRef]
  2. Gholamrezaie, H.; Hasanlou, M.; Amani, M.; Mirmazloumi, S.M. Automatic Mapping of Burned Areas Using Landsat 8 Time-Series Images in Google Earth Engine: A Case Study from Iran. Remote Sens. 2022, 14, 6376. [Google Scholar] [CrossRef]
  3. López-Cruz, S.d.C.; Aryal, D.R.; Velázquez-Sanabria, C.A.; Guevara-Hernández, F.; Venegas-Sandoval, A.; Casanova-Lugo, F.; La O-Arias, M.A.; Venegas-Venegas, J.A.; Reyes-Sosa, M.B.; Pinto-Ruiz, R.; et al. Effect of Prescribed Burning on Tree Diversity, Biomass Stocks and Soil Organic Carbon Storage in Tropical Highland Forests. Forests 2022, 13, 2164. [Google Scholar] [CrossRef]
  4. Arif, M.; Alghamdi, K.; Sahel, A.; Alosaimi, O.; Alsahaft, E.; Alharthi, A.; Arif, M. Role of Machine Learning Algorithms in Forest Fire Management: A Literature Review. J. Robot. Autom. 2021, 5, 372. [Google Scholar] [CrossRef]
  5. Baek, S.; Lim, J.; Kim, W. Analysis on the Fire Progression and Severity Variation of the Massive Forest Fire Occurred in Uljin, Korea, 2022. Forests 2022, 13, 2185. [Google Scholar] [CrossRef]
  6. Liu, J.; Heiskanen, J.; Maeda, E.E.; Pellikka, P.K.E. Burned Area Detection Based on Landsat Time Series in Savannas of Southern Burkina Faso. Int. J. Appl. Earth Obs. Geoinf. 2018, 64, 210–220. [Google Scholar] [CrossRef]
  7. Bar, S.; Parida, B.R.; Pandey, A.C. Landsat-8 and Sentinel-2 Based Forest Fire Burn Area Mapping Using Machine Learning Algorithms on GEE Cloud Platform over Uttarakhand, Western Himalaya. Remote Sens. Appl. Soc. Environ. 2020, 18, 100324. [Google Scholar] [CrossRef]
  8. Luz, A.E.O.; Negri, R.G.; Massi, K.G.; Colnago, M.; Silva, E.A.; Casaca, W. Mapping Fire Susceptibility in the Brazilian Amazon Forests Using Multitemporal Remote Sensing and Time-Varying Unsupervised Anomaly Detection. Remote Sens. 2022, 14, 2429. [Google Scholar] [CrossRef]
  9. Jang, E.; Kang, Y.; Im, J.; Lee, D.-W.; Yoon, J.; Kim, S.-K. Detection and Monitoring of Forest Fires Using Himawari-8 Geostationary Satellite Data in South Korea. Remote Sens. 2019, 11, 271. [Google Scholar] [CrossRef]
  10. Negri, R.G.; Luz, A.E.O.; Frery, A.C.; Casaca, W. Mapping Burned Areas with Multitemporal–Multispectral Data and Probabilistic Unsupervised Learning. Remote Sens. 2022, 14, 5413. [Google Scholar] [CrossRef]
  11. Sifakis, N.I.; Iossifidis, C.; Kontoes, C.; Keramitsoglou, I. Wildfire Detection and Tracking over Greece Using MSG-SEVIRI Satellite Data. Remote Sens. 2011, 3, 524–538. [Google Scholar] [CrossRef]
  12. Meng, R.; Wu, J.; Schwager, K.L.; Zhao, F.; Dennison, P.E.; Cook, B.D.; Brewster, K.; Green, T.M.; Serbin, S.P. Using High Spatial Resolution Satellite Imagery to Map Forest Burn Severity across Spatial Scales in a Pine Barrens Ecosystem. Remote Sens. Environ. 2017, 191, 95–109. [Google Scholar] [CrossRef]
  13. Liu, S.; Zheng, Y.; Dalponte, M.; Tong, X. A Novel Fire Index-Based Burned Area Change Detection Approach Using Landsat-8 OLI Data. Eur. J. Remote Sens. 2020, 53, 104–112. [Google Scholar] [CrossRef]
  14. Liu, J.; Maeda, E.E.; Wang, D.; Heiskanen, J. Sensitivity of Spectral Indices on Burned Area Detection Using Landsat Time Series in Savannas of Southern Burkina Faso. Remote Sens. 2021, 13, 2492. [Google Scholar] [CrossRef]
  15. Rokhmatuloh, A.; Indratmoko, S.; Riyanto, I.; Margatama, L.; Arief, R. Burnt-Area Quick Mapping Method with Synthetic Aperture Radar Data. Appl. Sci. 2022, 12, 11922. [Google Scholar] [CrossRef]
  16. Gómez, I.; Martín, M.P. Prototyping an Artificial Neural Network for Burned Area Mapping on a Regional Scale in Mediterranean Areas Using MODIS Images. Int. J. Appl. Earth Obs. Geoinf. 2011, 13, 741–752. [Google Scholar] [CrossRef]
  17. Janiec, P.; Gadal, S. A Comparison of Two Machine Learning Classification Methods for Remote Sensing Predictive Modeling of the Forest Fire in the North-Eastern Siberia. Remote Sens. 2020, 12, 4157. [Google Scholar] [CrossRef]
  18. Iban, M.C.; Sekertekin, A. Machine Learning Based Wildfire Susceptibility Mapping Using Remotely Sensed Fire Data and GIS: A Case Study of Adana and Mersin Provinces, Turkey. Ecol. Inform. 2022, 69, 101647. [Google Scholar] [CrossRef]
  19. Tanger-Tetouan-Al Hoceima. Wikipedia 2022.
  20. Chebli, Y.; Chentouf, M.; Ozer, P.; Hornick, J.-L.; Cabaraux, J.-F. Forest and Silvopastoral Cover Changes and Its Drivers in Northern Morocco. Appl. Geogr. 2018, 101, 23–35. [Google Scholar] [CrossRef]
  21. Spatial Accessibility of Urban Parks in Tangier City, MOROCCO-ProQuest. Available online: https://www.proquest.com/openview/b618a8410648b9a7f1055cf01f56d322/1?pq-origsite=gscholar&cbl=2037674 (accessed on 12 January 2023).
  22. Cape Spartel in Tangier: Things to See and How to Get to This Site. Available online: https://www.barcelo.com/guia-turismo/en/morocco/tanger/things-to-do/cape-spartel/ (accessed on 12 January 2023).
  23. Alasli, M. Static Risk Mapping of Forest Fires in the Case of the Province of Chefchaouen (Morocco). Proc. Int. Cartogr. Assoc. 2019, 2, 1–7. [Google Scholar] [CrossRef]
  24. Chebli, Y.; El Otmani, S. Mapping Forest and Pasture Cover of Western Rif (Chefchaouen). Afr. Mediterr. Agric. J. Al Awamia 2021, 132, 180–200. [Google Scholar]
  25. Chebli, Y.; Otmani, S.E.; Chentouf, M.; Hornick, J.-L.; Bindelle, J.; Cabaraux, J.-F. Foraging Behavior of Goats Browsing in Southern Mediterranean Forest Rangeland. Animals 2020, 10, 196. [Google Scholar] [CrossRef]
  26. Chamal/Tanger-Tetouan-Al Hoceima-Site Officiel. Available online: https://www.visittanger.com/en/nature/jbel-sougna/606ca1d2057e230016cc9af8 (accessed on 12 January 2023).
  27. Alshawafi, A.; Analla, M.; Alwashali, E.; Ahechti, M.; Aksissou, M. Impacts of Marine Waste, Ingestion of Microplastic in the Fish, Impact on Fishing Yield, M’diq, Morocco. Int. J. Marine Biol. Res. 2018, 3, 1–14. [Google Scholar] [CrossRef] [PubMed]
  28. Drtta, E. Monographie Préfectorale de Mdiq Fnideq. 2018. Available online: https://www.hcp.ma/region-tanger/Monographie-prefectorale-de-Mdiq-Fnideq-2018_a340.html (accessed on 12 January 2023).
  29. Nachite, D.; Baijot, E.; Marchesi, N.; Zyadi, F. Plan Local Gizc Pour La Prefecture Littorale De M’diq-Fnideq; SMAP: Cairo, Egypt, 2009. [Google Scholar]
  30. Roteta, E.; Bastarrika, A.; Ibisate, A.; Chuvieco, E. A Preliminary Global Automatic Burned-Area Algorithm at Medium Resolution in Google Earth Engine. Remote Sens. 2021, 13, 4298. [Google Scholar] [CrossRef]
  31. Sonia; Ghosh, T.; Gacem, A.; Alsufyani, T.; Alam, M.M.; Yadav, K.K.; Amanullah, M.; Cabral-Pinto, M.M.S. Geospatial Evaluation of Cropping Pattern and Cropping Intensity Using Multi Temporal Harmonized Product of Sentinel-2 Dataset on Google Earth Engine. Appl. Sci. 2022, 12, 12583. [Google Scholar] [CrossRef]
  32. Tagestad, J.D.; Saltiel, T.M.; Coleman, A.M. Rapid Spaceborne Mapping of Wildfire Retardant Drops for Active Wildfire Management. Remote Sens. 2023, 15, 342. [Google Scholar] [CrossRef]
  33. Martínez-Casasnovas, J.A.; Escolà, A.; Arnó, J. Use of Farmer Knowledge in the Delineation of Potential Management Zones in Precision Agriculture: A Case Study in Maize (Zea mays L.). Agriculture 2018, 8, 84. [Google Scholar] [CrossRef]
  34. Praticò, S.; Solano, F.; Di Fazio, S.; Modica, G. Machine Learning Classification of Mediterranean Forest Habitats in Google Earth Engine Based on Seasonal Sentinel-2 Time-Series and Input Image Composition Optimisation. Remote Sens. 2021, 13, 586. [Google Scholar] [CrossRef]
  35. Kumar, L.; Mutanga, O. Google Earth Engine Applications Since Inception: Usage, Trends, and Potential. Remote Sens. 2018, 10, 1509. [Google Scholar] [CrossRef]
  36. Piao, Y.; Lee, D.; Park, S.; Kim, H.G.; Jin, Y. Forest Fire Susceptibility Assessment Using Google Earth Engine in Gangwon-Do, Republic of Korea. Geomat. Nat. Hazards Risk 2022, 13, 432–450. [Google Scholar] [CrossRef]
  37. Teluguntla, P.; Thenkabail, P.S.; Oliphant, A.; Xiong, J.; Gumma, M.K.; Congalton, R.G.; Yadav, K.; Huete, A. A 30-m Landsat-Derived Cropland Extent Product of Australia and China Using Random Forest Machine Learning Algorithm on Google Earth Engine Cloud Computing Platform. ISPRS J. Photogramm. Remote Sens. 2018, 144, 325–340. [Google Scholar] [CrossRef]
  38. Çolak, E.; Sunar, F. The Importance of Ground-Truth and Crowdsourcing Data for the Statistical and Spatial Analyses of the NASA FIRMS Active Fires in the Mediterranean Turkish Forests. Remote Sens. Appl. Soc. Environ. 2020, 19, 100327. [Google Scholar] [CrossRef]
  39. NASA; LANCE Firms. Available online: https://firms.modaps.eosdis.nasa.gov/ (accessed on 12 January 2023).
  40. Roteta, E.; Bastarrika, A.; Franquesa, M.; Chuvieco, E. Landsat and Sentinel-2 Based Burned Area Mapping Tools in Google Earth Engine. Remote Sens. 2021, 13, 816. [Google Scholar] [CrossRef]
  41. Price, C.; Elsner, P. Uncertainty of Historic GLAD Forest Data in Temperate Climates and Implications for Forest Change Modelling. ISPRS Int. J. Geo-Inf. 2022, 11, 177. [Google Scholar] [CrossRef]
  42. GLAD. Global Land Cover and Land Use Change, 2000–2020. Available online: https://glad.umd.edu/dataset/GLCLUC2020 (accessed on 12 January 2023).
  43. Ballère, M.; Bouvet, A.; Mermoz, S.; Le Toan, T.; Koleck, T.; Bedeau, C.; André, M.; Forestier, E.; Frison, P.-L.; Lardeux, C. SAR Data for Tropical Forest Disturbance Alerts in French Guiana: Benefit over Optical Imagery. Remote Sens. Environ. 2021, 252, 112159. [Google Scholar] [CrossRef]
  44. GLAD. Deforestation Alerts, Explained|Global Forest Watch Blog. Available online: https://www.globalforestwatch.org/blog/data-and-research/glad-deforestation-alerts/ (accessed on 12 January 2023).
  45. Alcaras, E.; Costantino, D.; Guastaferro, F.; Parente, C.; Pepe, M. Normalized Burn Ratio Plus (NBR+): A New Index for Sentinel-2 Imagery. Remote Sens. 2022, 14, 1727. [Google Scholar] [CrossRef]
  46. Arisanty, D.; Feindhi Ramadhan, M.; Angriani, P.; Muhaimin, M.; Nur Saputra, A.; Puji Hastuti, K.; Rosadi, D. Utilizing Sentinel-2 Data for Mapping Burned Areas in Banjarbaru Wetlands, South Kalimantan Province. Int. J. For. Res. 2022, 2022, e7936392. [Google Scholar] [CrossRef]
  47. Meneses, B.M. Vegetation Recovery Patterns in Burned Areas Assessed with Landsat 8 OLI Imagery and Environmental Biophysical Data. Fire 2021, 4, 76. [Google Scholar] [CrossRef]
  48. Burnt Area Mapping Using Sentinel-2 Data—Digital Earth Africa 2021 Documentation. Available online: https://docs.digitalearthafrica.org/en/latest/sandbox/notebooks/Real_world_examples/Burnt_area_mapping.html (accessed on 12 January 2023).
  49. Avetisyan, D.; Velizarova, E.; Filchev, L. Post-Fire Forest Vegetation State Monitoring through Satellite Remote Sensing and In Situ Data. Remote Sens. 2022, 14, 6266. [Google Scholar] [CrossRef]
  50. GISGeography. What Is NDVI (Normalized Difference Vegetation Index)? Available online: https://gisgeography.com/ndvi-normalized-difference-vegetation-index/ (accessed on 12 January 2023).
  51. Farooq, A. Spectral Vegetation Indices Performance Evaluated for Cholistan Desert. J. Geogr. Reg. Plann. 2012, 5, 98. [Google Scholar] [CrossRef]
  52. Teshaev, N.; Mamadaliyev, B.; Ibragimov, A.; Khasanov, S. The Soil-Adjusted Vegetation Index for Soil Salinity Assessment in Uzbekistan. ICIGIS 2020, 26, 324–333. [Google Scholar] [CrossRef]
  53. Burn Indices Background. Available online: https://www.l3harrisgeospatial.com/docs/backgroundburnindices.html (accessed on 12 January 2023).
  54. Martín, M.; Gómez, I.; Chuvieco, E. Burnt Area Index (BAIM) for Burned Area Discrimination at Regional Scale Using MODIS Data. For. Ecol. Manag. 2006, 234, S221. [Google Scholar] [CrossRef]
  55. Chuvieco, E.; Martín, M.P.; Palacios, A. Assessment of Different Spectral Indices in the Red-near-Infrared Spectral Domain for Burned Land Discrimination. Int. J. Remote Sens. 2002, 23, 5103–5110. [Google Scholar] [CrossRef]
  56. Yu, Z.; Di, L.; Rahman, M.S.; Tang, J. Fishpond Mapping by Spectral and Spatial-Based Filtering on Google Earth Engine: A Case Study in Singra Upazila of Bangladesh. Remote Sens. 2020, 12, 2692. [Google Scholar] [CrossRef]
  57. Rybansky, M. Determination of Forest Structure from Remote Sensing Data for Modeling the Navigation of Rescue Vehicles. Appl. Sci. 2022, 12, 3939. [Google Scholar] [CrossRef]
  58. Ganteaume, A.; Camia, A.; Jappiot, M.; San-Miguel-Ayanz, J.; Long-Fournel, M.; Lampin, C. A Review of the Main Driving Factors of Forest Fire Ignition Over Europe. Environ. Manag. 2013, 51, 651–662. [Google Scholar] [CrossRef]
  59. Tazmul Islam, M.; Meng, Q. An Exploratory Study of Sentinel-1 SAR for Rapid Urban Flood Mapping on Google Earth Engine. Int. J. Appl. Earth Obs. Geoinf. 2022, 113, 103002. [Google Scholar] [CrossRef]
  60. Morocco: Forest Fire near Tangier June 30–July 4|Crisis24. Available online: https://crisis24.garda.com/alerts/2017/07/morocco-forest-fire-near-tangier-june-30-july-4?origin=fr_riskalert (accessed on 12 January 2023).
  61. Morocco World News. Available online: https://morocco1039.rssing.com/chan-55514505/all_p647.html (accessed on 12 January 2023).
  62. Chefchaouen. Sougna Wildfire “Under Control”, Nearly 1100 Ha of Vegetation Ravaged. Available online: https://maroc.ma/en/news/chefchaouen-sougna-wildfire-under-control-nearly-1100-ha-vegetation-ravaged (accessed on 12 January 2023).
  63. Traganos, D.; Poursanidis, D.; Aggarwal, B.; Chrysoulakis, N.; Reinartz, P. Estimating Satellite-Derived Bathymetry (SDB) with the Google Earth Engine and Sentinel-2. Remote Sens. 2018, 10, 859. [Google Scholar] [CrossRef]
  64. Lee, C.; Park, S.; Kim, T.; Liu, S.; Md Reba, M.N.; Oh, J.; Han, Y. Machine Learning-Based Forest Burned Area Detection with Various Input Variables: A Case Study of South Korea. Appl. Sci. 2022, 12, 10077. [Google Scholar] [CrossRef]
  65. Sukojo, B.M.; Arimurti, A.S.P. Forest Fire Mapping Using Normalized Burned Ratio and Cloud Computing to Calculate the Losses Incurred in Mount Lawu, Magetan Regency. IOP Conf. Ser. Earth Environ. Sci. 2021, 936, 012002. [Google Scholar] [CrossRef]
  66. Available online: https://redd.unfccc.int/files/annex_8_mapaa_methodologyresults_ug_frl_1_.pdf (accessed on 10 July 2023).
  67. 33 Accuracy Assessment–Geemap. Available online: https://geemap.org/notebooks/33_accuracy_assessment/#export-the-result (accessed on 12 January 2023).
  68. Accuracy Metrics. Available online: http://gsp.humboldt.edu/olm/Courses/GSP_216/lessons/accuracy/metrics.html (accessed on 12 January 2023).
  69. Shin, T. Understanding Feature Importance and How to Implement It in Python. Available online: https://towardsdatascience.com/understanding-feature-importance-and-how-to-implement-it-in-python-ff0287b20285 (accessed on 10 July 2023).
  70. Zhang, Y.; Yang, W.; Sun, Y.; Chang, C.; Yu, J.; Zhang, W. Fusion of Multispectral Aerial Imagery and Vegetation Indices for Machine Learning-Based Ground Classification. Remote Sens. 2021, 13, 1411. [Google Scholar] [CrossRef]
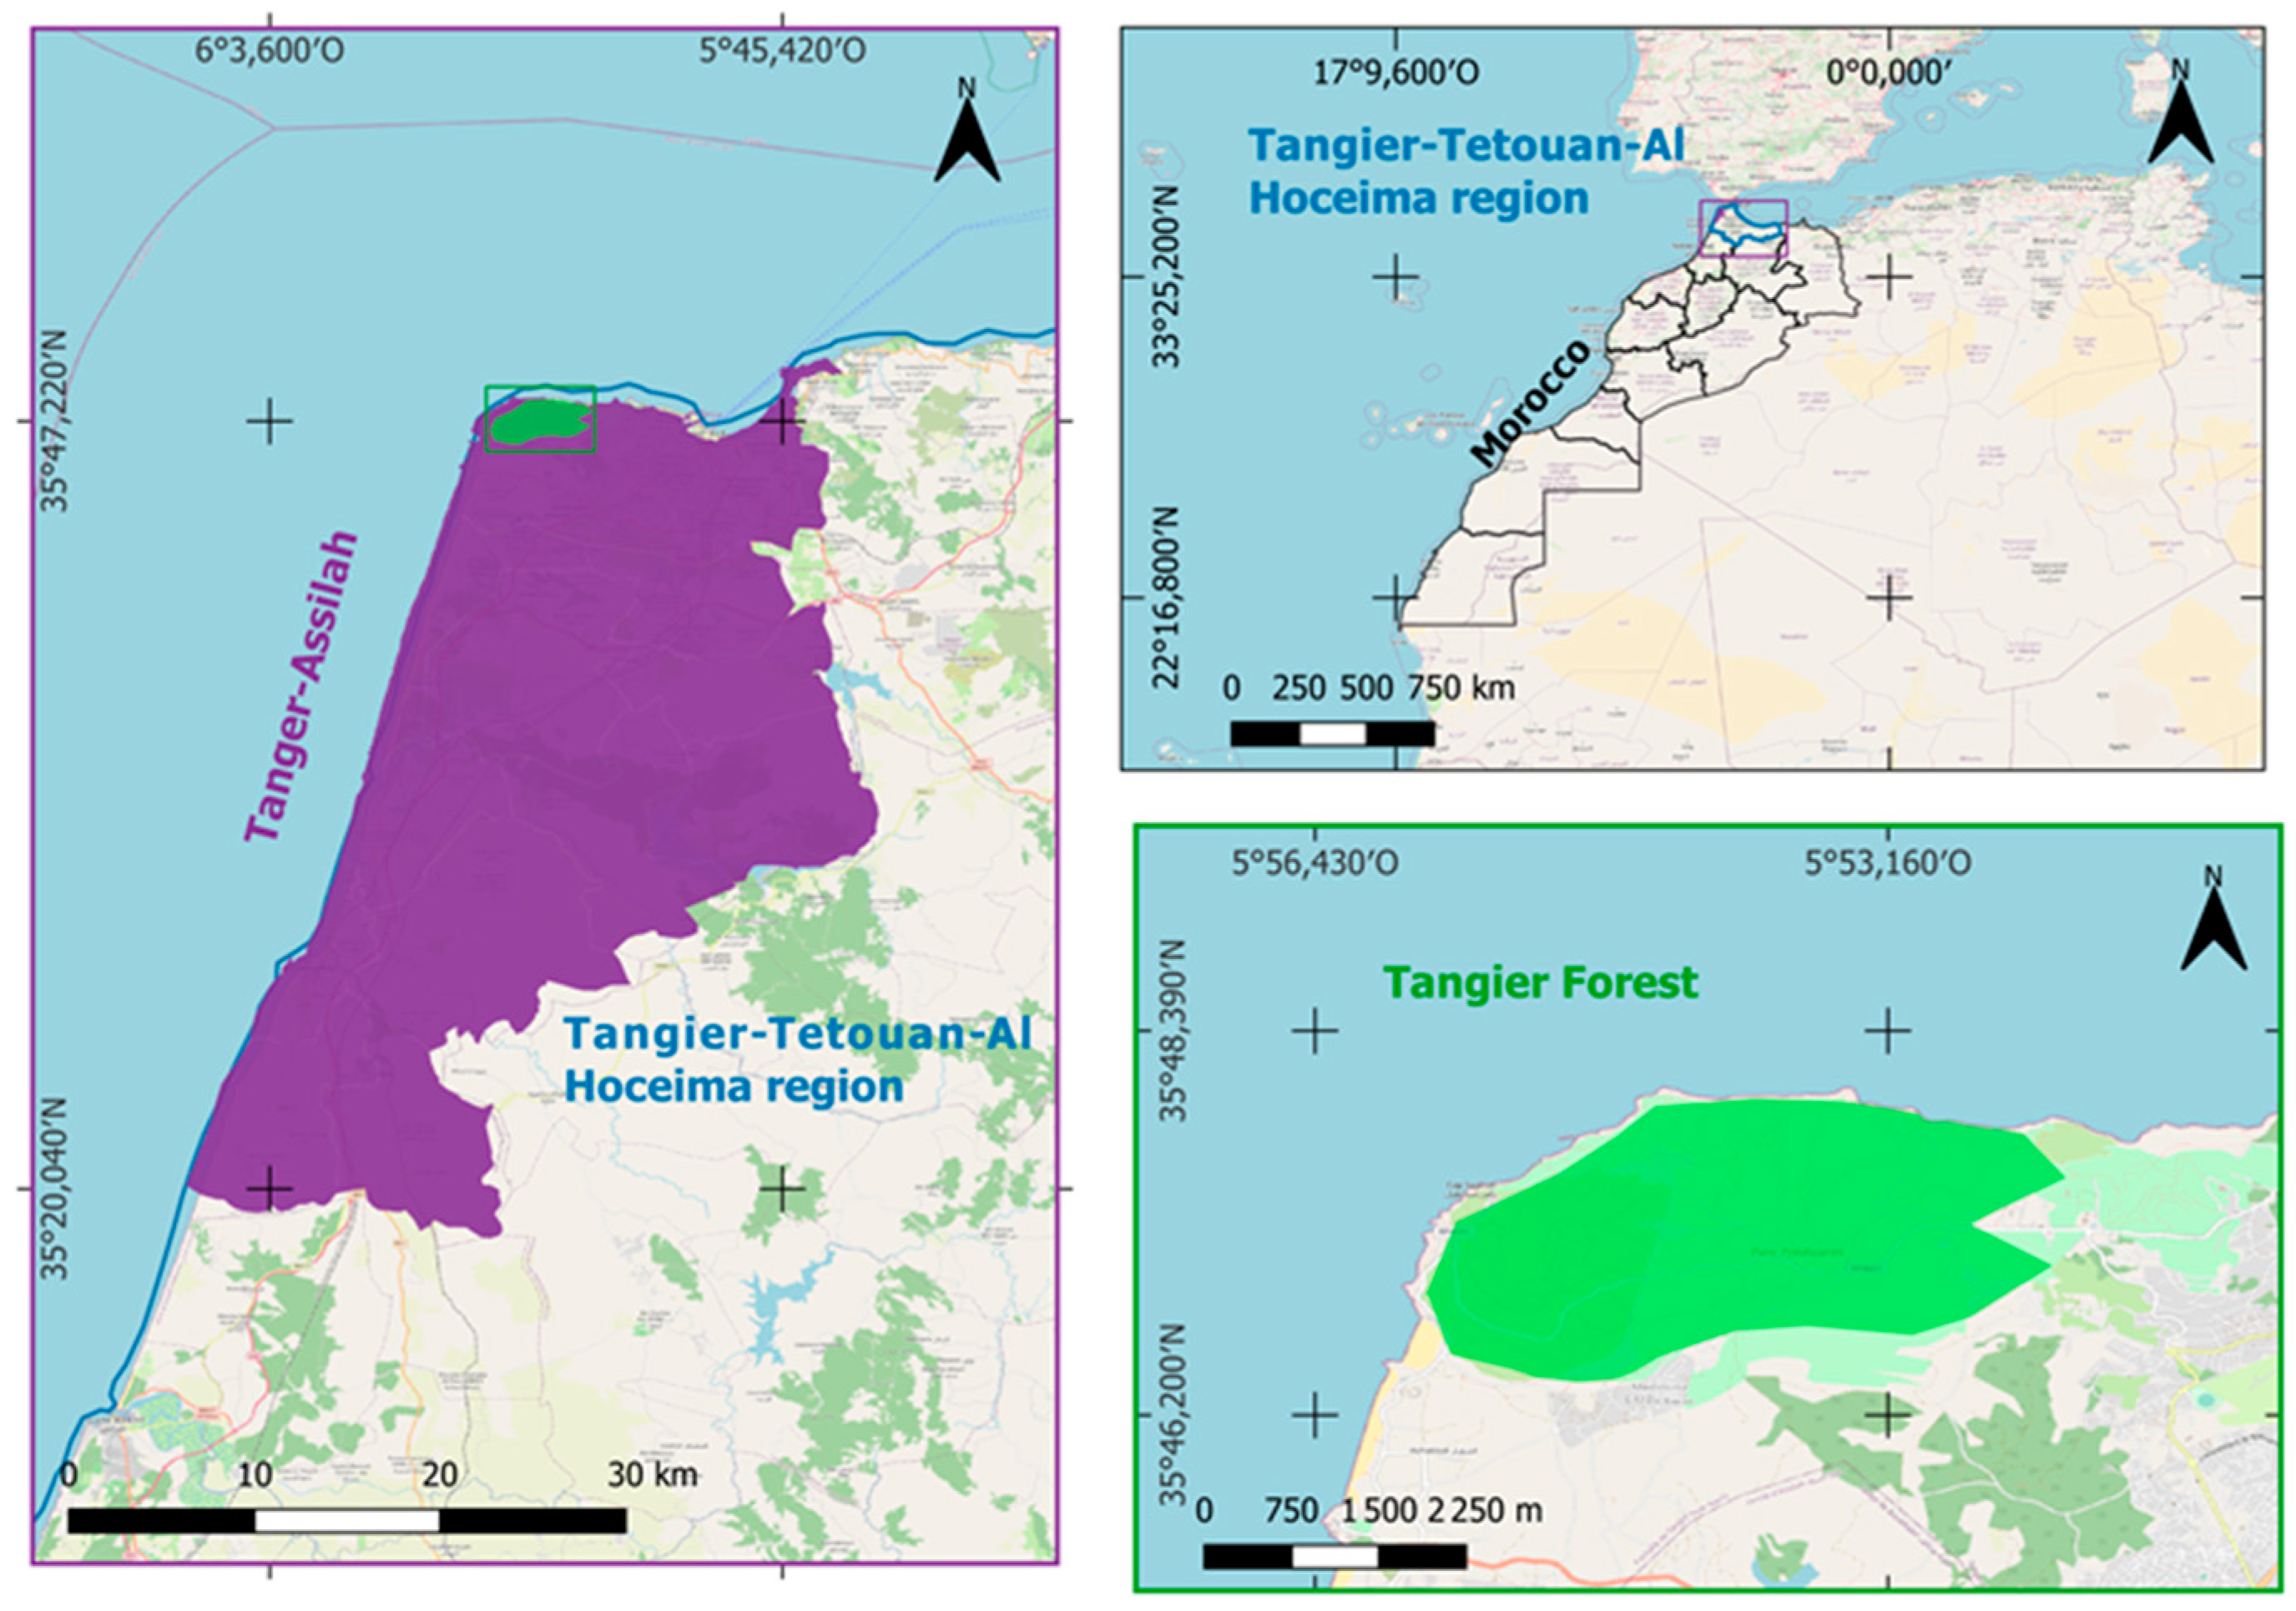
Figure 1. Tangier forest (Cap Spartel) in northern Morocco burned in 2017.
Remotesensing 15 04226 g001
Figure 2. Chefchaouen forest in northern Morocco burned in 2021.
Remotesensing 15 04226 g002
Figure 3. M’diq Fnideq forest in northern Morocco burned in 2020.
Remotesensing 15 04226 g003
Figure 4. GEE interface.
Remotesensing 15 04226 g004
Figure 5. (a) Pre-fire NBR of Tangier area grayscale; (b) Post-fire NBR of Tangier area grayscale; (c) USGS dNBR Classification of Tangier area.
Remotesensing 15 04226 g005
Figure 6. (a) Pre-fire NBR of Chefchaouen area grayscale; (b) Post-fire NBR of Chefchaouen area grayscale; (c) USGS dNBR Classification of Chefchaouen area.
Remotesensing 15 04226 g006
Figure 7. (a) Pre-fire NBR of M’diq Fnideq area grayscale; (b) Post-fire NBR of M’diq Fnideq area grayscale; (c) USGS dNBR Classification of M’diq Fnideq area.
Remotesensing 15 04226 g007
Figure 8. Tangier manually selected sample points based on FIRMS, GLAD, and visual changes before and after the fire. They represent 258 sample points evenly distributed among the classes.
Remotesensing 15 04226 g008
Figure 9. Chefchaouen manually selected sample points based on FIRMS, GLAD, and visual changes before and after the fire. They represent 150 sample points evenly distributed among the classes.
Remotesensing 15 04226 g009
Figure 10. M’diq Fnideq manually selected sample points based on FIRMS, GLAD, and visual changes before and after the fire. They represent 180 sample points evenly distributed among the classes.
Remotesensing 15 04226 g010
Figure 11. Random Forest Classification Model A for the Tangier-Assilah area.
Remotesensing 15 04226 g011
Figure 12. Random Forest Classification Model B for the Tangier-Assilah area.
Remotesensing 15 04226 g012
Figure 13. Model B feature importance chart.
Remotesensing 15 04226 g013
Figure 14. Random Forest Classification Model C for the Tangier-Assilah area.
Remotesensing 15 04226 g014
Figure 15. Random Forest Classification Model A for the Chefchaouen area.
Remotesensing 15 04226 g015
Figure 16. Random Forest Classification Model B for the Chefchaouen area.
Remotesensing 15 04226 g016
Figure 17. Random Forest Classification Model C for the Chefchaouen area.
Remotesensing 15 04226 g017
Figure 18. Random Forest Classification Model A for the M’diq Fnideq area.
Remotesensing 15 04226 g018
Figure 19. Random Forest Classification Model B for the M’diq Fnideq area.
Remotesensing 15 04226 g019
Figure 20. Random Forest Classification Model C for the M’diq Fnideq area.
Remotesensing 15 04226 g020
Figure 21. The application interface in GEE.
Remotesensing 15 04226 g021
Figure 22. Result of classification using Model A of the selected point. We can see the variation of the NBR, NDVI, SAVI, and BAI in the charts.
Remotesensing 15 04226 g022
Figure 23. Result of classification using Model B (same thing for Model C) of the selected point. We can see the variation of the NBR, NDVI, SAVI, and BAI in the charts.
Remotesensing 15 04226 g023
Table 1. Spectral bands of the Sentinel-2A multi-spectral instrument (MSI) [33].
Band NumberBand NameCentral Wavelength (nm)Bandwidth (nm)
1Coastal aerosol443.927
2Blue496.698
3Green560.045
4Red664.538
5Red Edge 1703.919
6Red Edge 2740.218
7Red Edge 3782.528
8NIR835.1145
8ANarrow NIR864.833
9Water vapor945.026
10SWIR-Cirrus1373.575
11SWIR 11613.7143
12SWIR 22202.4242
Table 2. SAVI classification by soil salinity level [52].
RangeSAVI Classification
−1.5–0Water
0.01–0.37High salinity
0.38–0.76Moderate salinity
0.77–1.10Weak salinity
1.11–1.50No salinity
Table 3. Pre-fire and Post-fire dates for study areas.
AreaPre-Fire StartPre-Fire EndPost-Fire StartPost-Fire End
Tangier01-06-201720-06-201701-08-201730-08-2017
M’diq Fnideq01-07-202030-07-202001-10-202030-10-2020
Chefchaouen01-07-202130-07-202101-10-202130-10-2021
Table 4. USGS classification of dNBR severity levels [65].
Severity ColorRangeBurn Severity
Remotesensing 15 04226 i001<−0.25High post-fire regrowth
Remotesensing 15 04226 i002−0.25 to −0.1Low post-fire regrowth
Remotesensing 15 04226 i003−0.1 to +0.1Unburned
Remotesensing 15 04226 i0040.1 to 0.27Low severity
Remotesensing 15 04226 i0050.27 to 0.44Moderate–low severity
Remotesensing 15 04226 i0060.44 to 0.66Moderate–high severity
Remotesensing 15 04226 i007>0.66High severity
Table 5. Feature Importance of Model B bands.
BandFeature Importance ScoreFeature Importance Score %Cumulative Importance
nd17,68916%16%
dbai12,80911%27%
dsavi10,6059%36%
dndvi89088%44%
B778697%51%
B475797%58%
B874737%65%
B8A59955%70%
B1256415%75%
B251365%80%
B341514%83%
B140984%87%
B540924%90%
B638093%94%
B936513%97%
B1133233%100%
Table 6. Model components by indices.
ModelNumber of Indices
Model A1 (dNBR)
Model B16 (dNBR, dNDVI, dSAVI, dBAI, twelve bands of S2)
Model C4 (dNBR, dNDVI, dSAVI, dBAI)
Table 7. Accuracy by model calculated in GEE for Tangier-Assilah.
Overall Model AOverall Model BOverall Model CKappa Model AKappa Model BKappa Model C
83%95%96%75%92%94%
Table 8. Accuracy Model A calculated in GEE.
AreaOverall AccuracyKappa Accuracy
Chefchaouen90%85%
M’diq Fnideq82%73%
Table 9. Accuracy Model B calculated in GEE.
AreaOverall Accuracy Kappa Accuracy
Chefchaouen87%81%
M’diq Fnideq88%82%
Table 10. Accuracy Model C calculated in GEE.
AreaOverall Accuracy Kappa Accuracy
Chefchaouen96%94%
M’diq Fnideq97%95%
Disclaimer/Publisher’s Note: The statements, opinions and data contained in all publications are solely those of the individual author(s) and contributor(s) and not of MDPI and/or the editor(s). MDPI and/or the editor(s) disclaim responsibility for any injury to people or property resulting from any ideas, methods, instructions or products referred to in the content.