Article

Estimation of Soybean Yield by Combining Maturity Group Information and Unmanned Aerial Vehicle Multi-Sensor Data Using Machine Learning

1
College of Agricultural Engineering, Shanxi Agricultural University, Jinzhong 030801, China
2
Key Laboratory of Quantitative Remote Sensing in Agriculture of Ministry of Agriculture and Rural Affairs, Information Technology Research Center, Beijing Academy of Agriculture and Forestry Sciences, Beijing 100097, China
3
National Engineering Research Center for Information Technology in Agriculture, Beijing 100097, China
*
Author to whom correspondence should be addressed.
Remote Sens. 2023, 15(17), 4286; https://doi.org/10.3390/rs15174286
Submission received: 25 July 2023 / Revised: 19 August 2023 / Accepted: 29 August 2023 / Published: 31 August 2023

Abstract

:
Accurate and rapid estimation of the crop yield is essential to precision agriculture. Critical to crop improvement, yield is a primary index for selecting excellent genotypes in crop breeding. Recently developed unmanned aerial vehicle (UAV) platforms and advanced algorithms can provide powerful tools for plant breeders. Genotype category information such as the maturity group information (M) can significantly influence soybean yield estimation using remote sensing data. The objective of this study was to improve soybean yield prediction by combining M with UAV-based multi-sensor data using machine learning methods. We investigated three types of maturity groups (Early, Median and Late) of soybean, and collected the UAV-based hyperspectral and red–green–blue (RGB) images at three key growth stages. Vegetation indices (VI) and texture features (Te) were extracted and combined with M to predict yield using partial least square regression (PLSR), Gaussian process regression (GPR), random forest regression (RFR) and kernel ridge regression (KRR). The results showed that (1) the method of combining M with remote sensing data could significantly improve the estimation performances of soybean yield. (2) The combinations of three variables (VI, Te and M) gave the best estimation accuracy. Meanwhile, the flowering stage was the optimal single time point for yield estimation (R2 = 0.689, RMSE = 408.099 kg/hm2), while using multiple growth stages produced the best estimation performance (R2 = 0.700, RMSE = 400.946 kg/hm2). (3) By comparing the models constructed by different algorithms for different growth stages, it showed that the models built by GPR showed the best performances. Overall, the results of this study provide insights into soybean yield estimation based on UAV remote sensing data and maturity information.

Graphical Abstract

1. Introduction

Soybean is one of the important food crops in China and the most widely cultivated legume crop in the world. Rich in protein and oil, it is widely used in human food, animal feed, biofuel and other products [1]. To meet the needs of the growing population, increasing soybean yield is always the primary task of breeding programs [2]. Hence, the accurate evaluation of yield for breeding lines in breeding projects is a key step in screening genetic materials, which is related to the efficient selection of excellent high-yield genotypes. Furthermore, precise understanding of crop production is essential for developing agricultural policies related to ensuring food security. Yield is a phenotypically complicated trait, which is affected by various intricate factors including genetic, environmental and cultivation management [3]. Therefore, it is challenging to explore the soybean cultivars with the highest yields.
Crop harvesting in large breeding programs involves thousands of genotypes, which require extensive field measurements and destructive sampling and is time-consuming and laborious. If the yield estimation models could be established early using traits closely related to yield and then used to identify the genetic material with a high yield potential, it will help breeders make timely and rational decisions for shortening the cycle of breeding and reducing costs [4,5,6].
The recent rapid development of high-throughput phenotyping platforms has had a great impact on current crop monitoring research. In field experiments, enormous remote sensing phenotype datasets can be characterized conveniently, quickly and simultaneously by close-range phenotyping platforms. An unmanned aerial vehicle (UAV) platform, generally equipped with various sensors, such as digital cameras, multispectral, hyperspectral, thermal infrared and lidar devices, could screen hundreds of plots precisely in a short period of time. Due to its advantages of simple operation, low cost, fast acquisition speed and high spatial and temporal resolution, the implementation of these platforms has benefited large-scale crop monitoring and have been widely and successfully used in assessing crop performance under different conditions, such as crop nitrogen content [7], yield estimation [8,9], drought-resistant [10] or disease and pest detection [11], crop growth evaluation [12,13,14] and other parameters. Meanwhile, crop monitoring is challenged by the analysis of large datasets obtained from the phenotyping platforms, which requires extensive computation and statistical analysis for accurate phenotype predictions [15]. Therefore, a variety of machine learning (ML) algorithms, such as partial least square regression (PLSR), Gaussian process regression (GPR), k-nearest neighbor (KNN), support vector machine (SVM), ridge regression (RR), random forest (RF), ensemble learning and deep learning algorithms have been introduced, which are regarded as reliable and effective methods for prediction models. They can greatly improve the processing speed and analysis accuracy, and thus play a vital role in crop detection [16,17]. So far, they have been used to measure above-ground biomass [18,19], LAI [20,21], and to predict the yield [22,23,24,25] of various crops.
Numerous methods have been established for estimating crop yield, such as using crop growth models [26], remote sensing data [27,28] or coupling with phenological factors or variety information [29]. For example, Ma et al. [26] used the crop growth model of SAFY to estimate wheat yields. The results obtained an R2 of 0.73, 0.83 and 0.49 for LAI, biomass, and yield with an RMSE of 0.72, 1.13 t/ha and 1.14 t/ha. Moreover, several studies estimated crop yield using hyperspectral, multispectral and red–green–blue (RGB) data in combination with machine learning or deep learning. Fei et al. [22] adopted an ensemble learning algorithm to estimate wheat yield under two irrigation conditions using vegetation indices (VI) with a heritability greater than 0.5 based on multispectral images. Yoosefzadeh-Najafabadi et al. [30] used three machine learning algorithms to estimate soybean yield with hyperspectral reflectance. Maimaitijiang et al. [27] pointed out that using UAV multi-modal data fusion under the framework of deep neural networks could provide relatively accurate and robust soybean yield estimation.
Although various studies have been conducted on yield estimation, a common problem is that these kinds of models neglect the fact that crop yield has variety or category specificity [29]. Generally, yield differences are caused by both genetic and environmental diversity. Planting across geographical locations in the field increases spatial differences, which in turn, causes phenotypic differences between genotypes, resulting in instability of model estimations. Also, crops are significantly different between various maturity groups. For soybean, plants in different maturity groups have an allometry process, and the senescence process of leaves are inconsistent, which have a remarkable impact on spectral reflectance and its relationship with yield. Studies have suggested that different genotypic materials exhibited various spectral characteristics at different stages [31], and most of the spectral information was related to plant pigment content, yield, growth state and other parameters. Sinha et al. [32] distinguished 12 banana genotypes with leaf reflectance. Galvao et al. [33] used the Hyperion scenario to classify three soybean genotypes with an accuracy of more than 89%. Hence, it is necessary to assess the effect of category information of soybean genotypes, such as the maturity types, on yield and then predict yield taking maturity types into account. So far, very limited studies have been performed to explore the influence of maturity group information (M) on yield prediction. In addition, most crop yield prediction models involved limited varieties, and ignored the influence of genetic factors. So, the model accuracy performances were high in a few varieties but were unsatisfactory when dealing with the identification of breeding germplasm resources. Thus, yield estimation for breeding purposes has been challenging and was rarely reported. In summary, through investigation, most current grain yield (GY) estimation models of soybean have been established using multiple remote sensing features. However, few studies considered the effect of maturity group information on soybean yield estimation and integrated it into the model. The addition of maturity group information is attractive to adjust the model instability in multi-genotype scenarios.
So, the objectives of this study were as follows: (1) to analyze the effect of the maturity group information on the soybean yield estimation models based on UAV remote sensing data; (2) to test the contributions of vegetation indices, texture features, M and their combinations to yield estimation and to determine the optimal period for soybean prediction; and (3) to compare the accuracy of four ML algorithms (PLSR, GPR, RFR and KRR) in the construction of prediction models for soybean.

2. Materials and Methods

This section contained five parts, of which Section 2.1 introduces the situation of the field experiment site and specific experimental design contents, Section 2.2 introduces the acquisition process of the UAV-based data and ground data, Section 2.3 describes the processing of UAV-based images and feature extraction, Section 2.4 describes the statistical analysis of the data and the establishment of the models and Section 2.5 shows the evaluation indicators of the models.

2.1. Materials and Field Experiments

This part introduced the situation of the study site and the design content of the field experiment.

2.1.1. Study Site

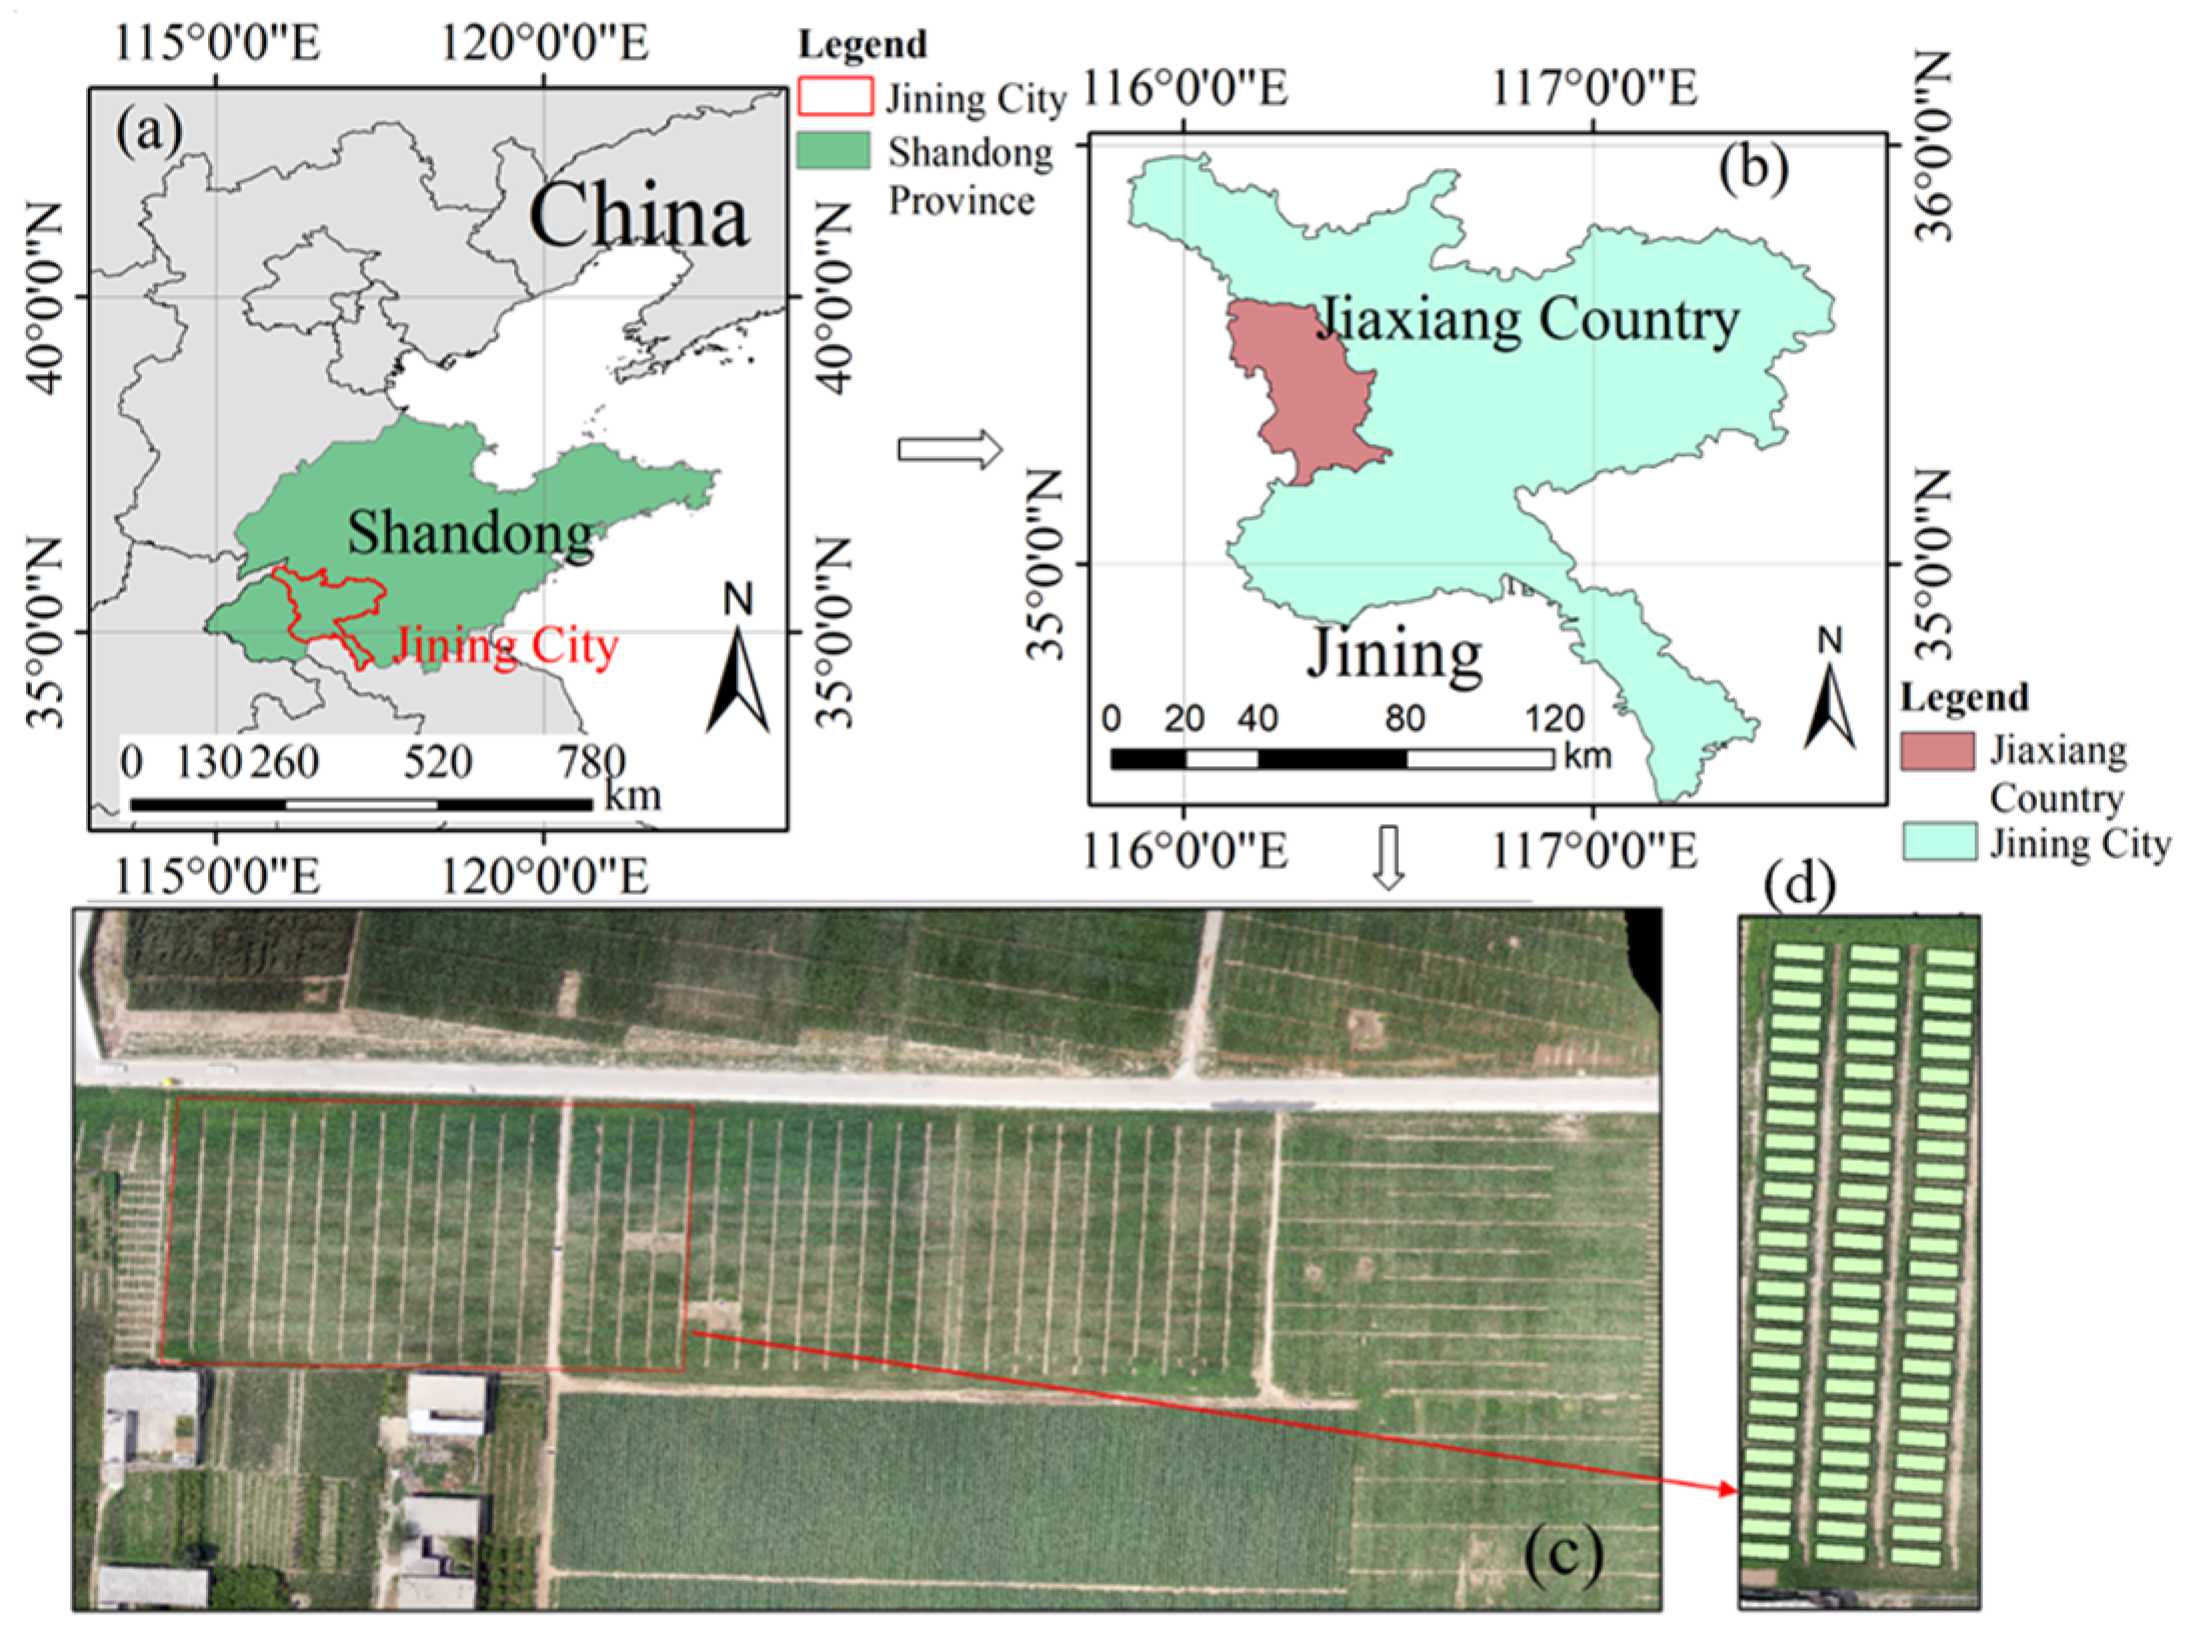
The study site is located in Jiaxiang County (116°22′10″–20″E, 35°25′50″–35°26′10″N), Jining City, Shandong Province, China (Figure 1). The field site lies on the Yellow River alluvial plain and the soil is a clay loam (pH 7.9), which has a temperate subhumid continental monsoon climate with four distinct seasons: warm spring, hot summer, cool fall and cold winter. It has an average altitude of 35 m, an average annual precipitation of 701 mm and an average annual temperature of 13.9 °C. The annual mean sunshine duration at the site is 2405.20 h, and the annual frost-free period is 210.70 d. We provide the weather information (data from https://cds.climate.copernicus.eu/ accessed on 6 May 2023) during the experiment in Figure 2.

2.1.2. Experimental Design

A set of 275 soybean genetic materials with extensive genetic diversity were used as the study materials. According to the length of the growth and development period of soybean varieties, these materials were divided into three groups, including an early maturity group, median maturity group and late maturity group. The approximate growth periods of the early, median and late maturity groups were 90–105 days, 105–120 days and more than 120 days, respectively. Each plot contained material from one genotype, and the size of each plot was 5 m × 2.5 m. The row spacing was 0.5 m and each plot had 5 rows. The plant density was 190,000 plants ha−1. The sowing date of soybean was 13 June 2015. The field experiments used a complete randomized block design with three replicates. We performed field management procedures, including weed control, pest management, irrigation modes and the application of nitrogen, phosphate and potassium fertilizer following local standard practices for soybean production. In total, 33 representative materials (14 early maturity genotypes, 14 median maturity genotypes and 5 late maturity genotypes) from different maturity groups were selected for the study. The selected varieties have differences in podding characteristics (finite, sub-finite and infinite), plant height, flower color, leaf shape, 100-seed weight, effective pod number per plant, seed number per plant, disease resistance, lodging resistance, maturity, etc. For example, in the early maturity group, there were some hybrids with Zhonghuang 13 or Kefeng 14 as parents; in median maturity group, there were some hybrids with Yudou 22 or Jinyi 30 as parents; and in late maturity group, there were some hybrids with Kexin 4 or Fendou 55 as parents.

2.2. Data Acquisition

This section consists of two parts, which introduce the acquisition processes for the UAV data and yield data in the experiment, respectively.

2.2.1. UAV Data Collection

In the study, the field crop-canopy RGB images and hyperspectral images were collected using a snapshot hyperspectral sensor (Cubert UHD 185) and a high-definition digital camera (SONY DSC-QX100, Tokyo, Japan) mounted on an eight-armed DJI S-1000 UAV (Dajiang Innovation, Sham Chun, China). The operating range of the UHD 185 is from the visible to the NIR wavelengths (450–950 nm). The detailed information of the sensors is provided in Table 1. In addition, a Trimble GeoXT6000 GPS receiver was used to determine the location of the ground control point (GCP) of the test field.
Flight missions were carried out from 11:00 to 14:00 under clear, cloud-free conditions. All flights were flown at a 50 m height to obtain high-quality photos. Before obtaining the hyperspectral data using the UAV, the dark-current collection and standard whiteboard calibration were performed to ensure accurate reflectance data at each growth period. The flight was conducted according to the planned route. The remote sensing data using the UAV were collected at three critical growth periods of soybean during 2015 (1 August 2015 (flowering stage), 1 September 2015 (podding stage) and 17 September 2015 (bean-filling stage)).

2.2.2. Yield Data Collection

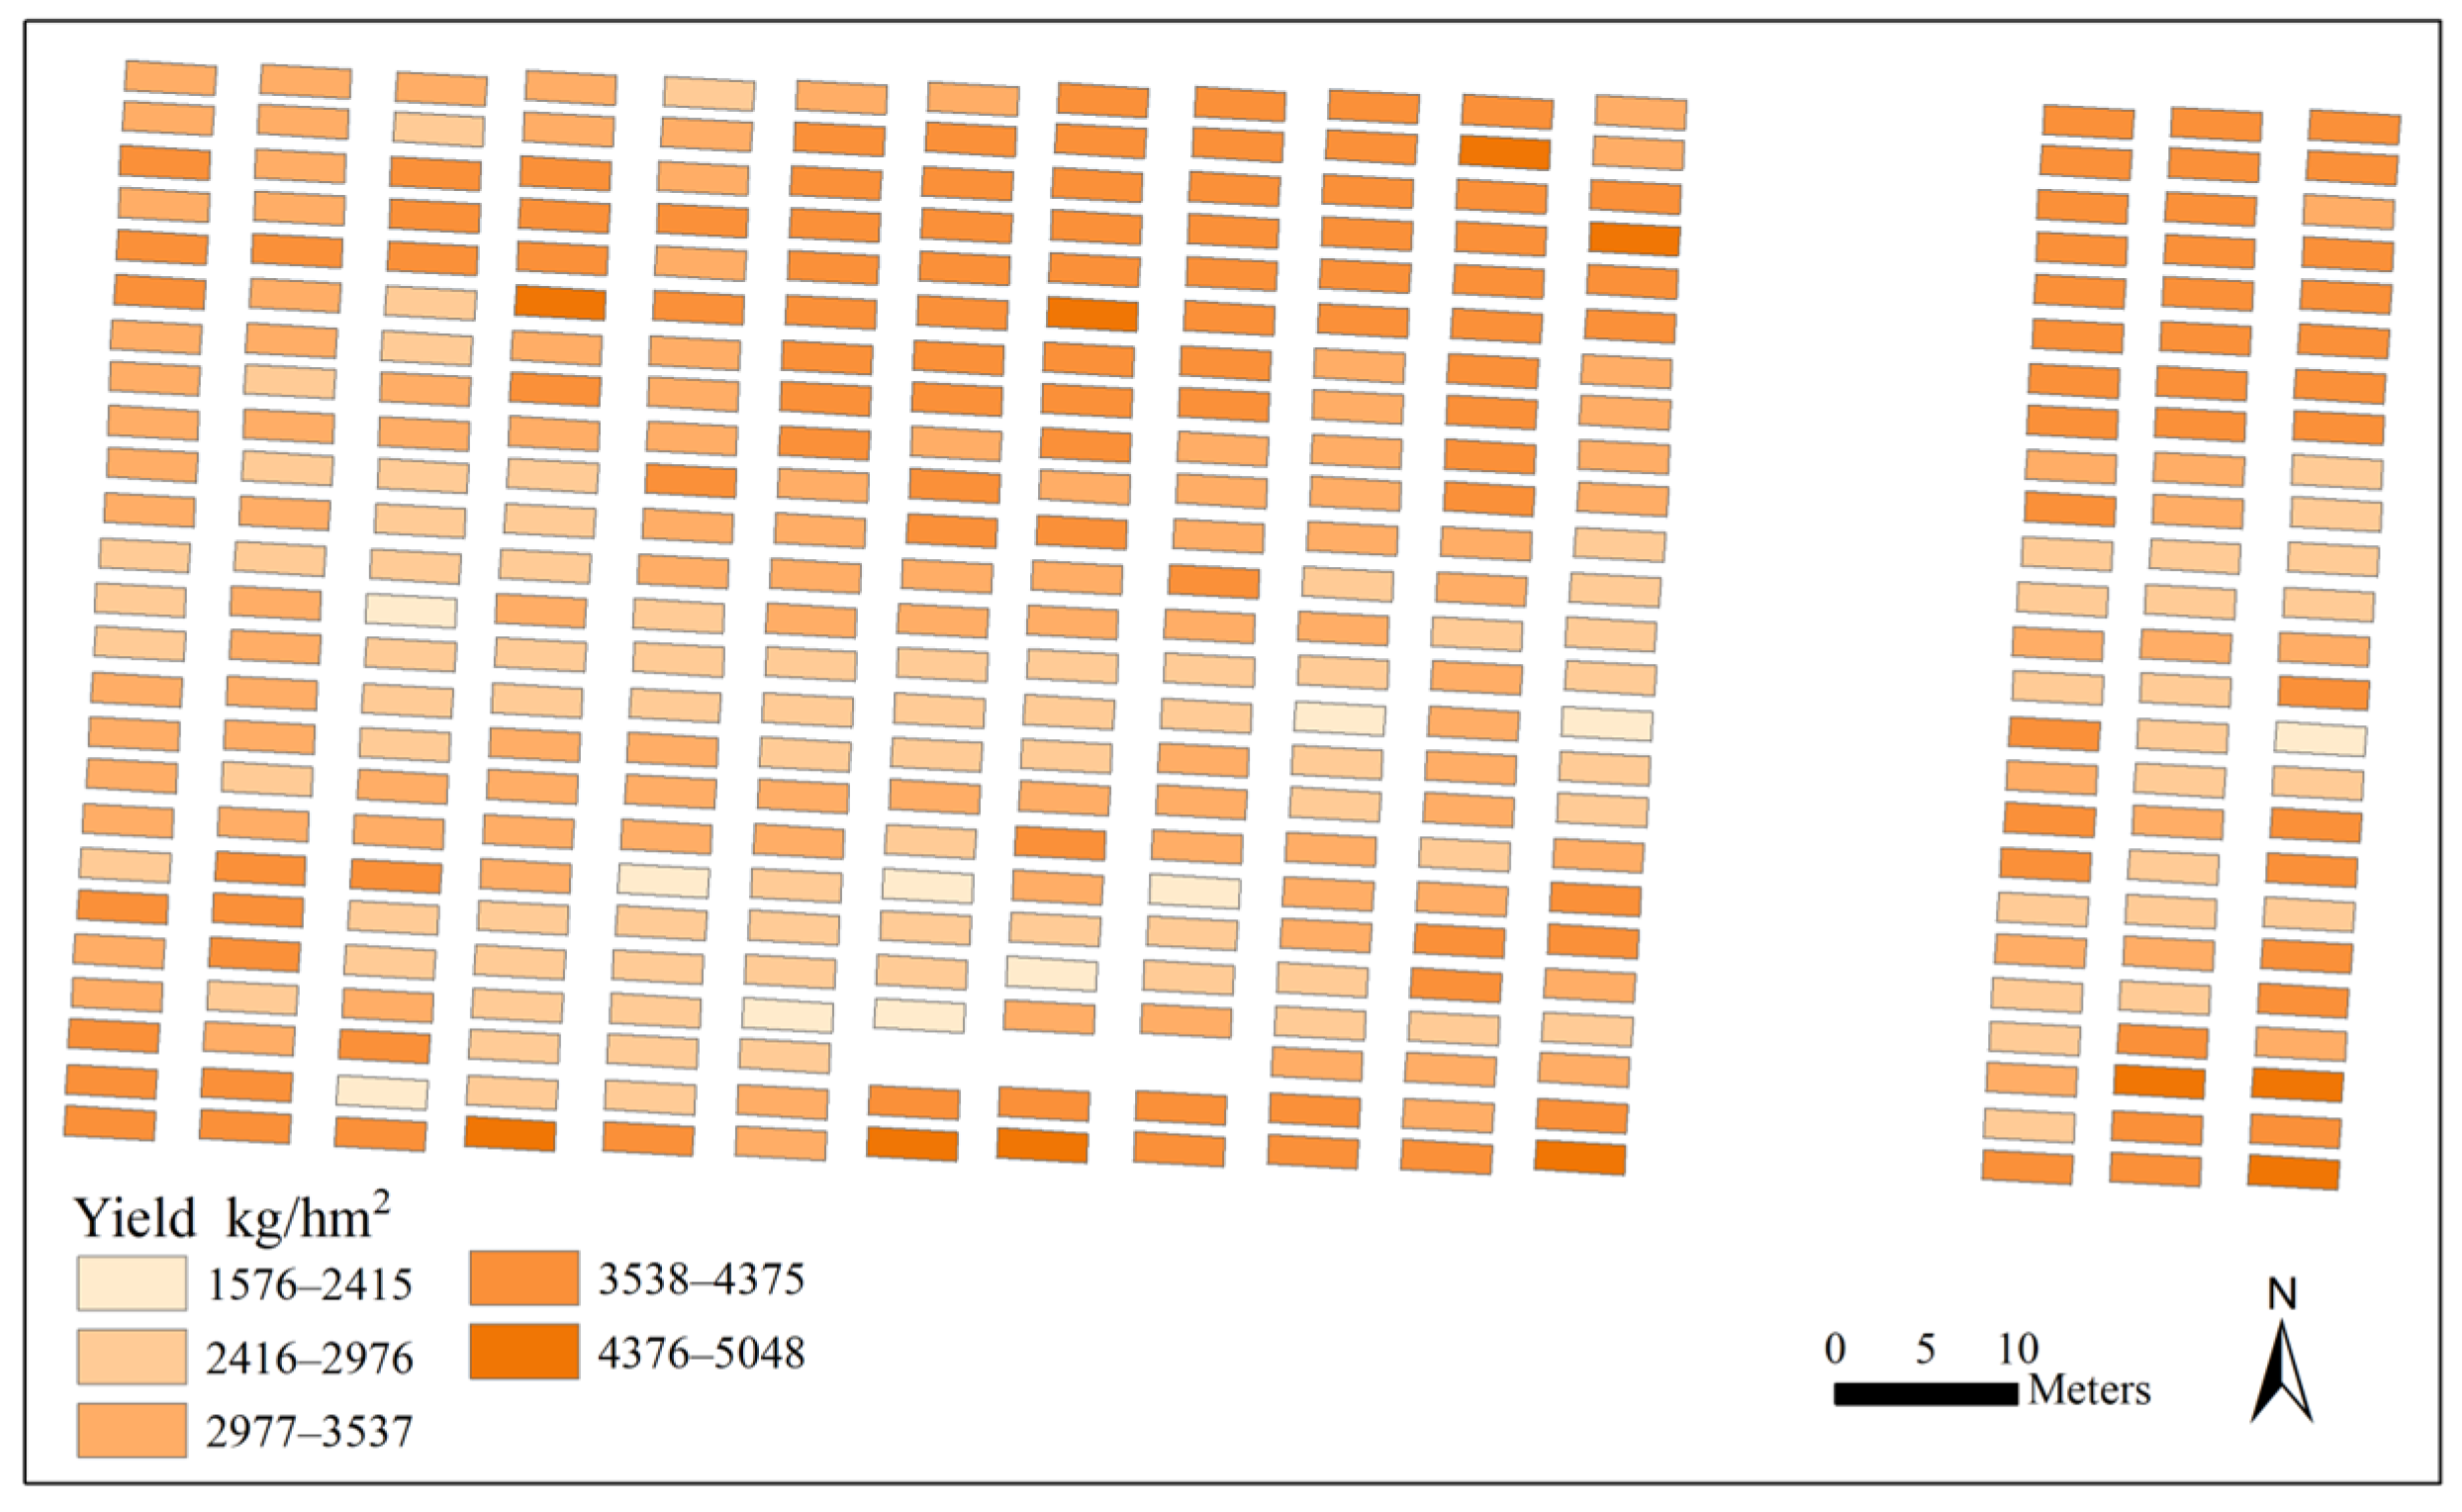
Grain yield for each plot was measured by harvesting three middle rows, with a calculated area of 7.5 m2, when the soybean genotypes in the experimental plot were matured. The soybean plants were harvested and the plot seed yield was measured with the seed moisture adjusted to 13% and was expressed as kg/hm2 for further analysis.

2.3. Image Processing and Feature Extraction

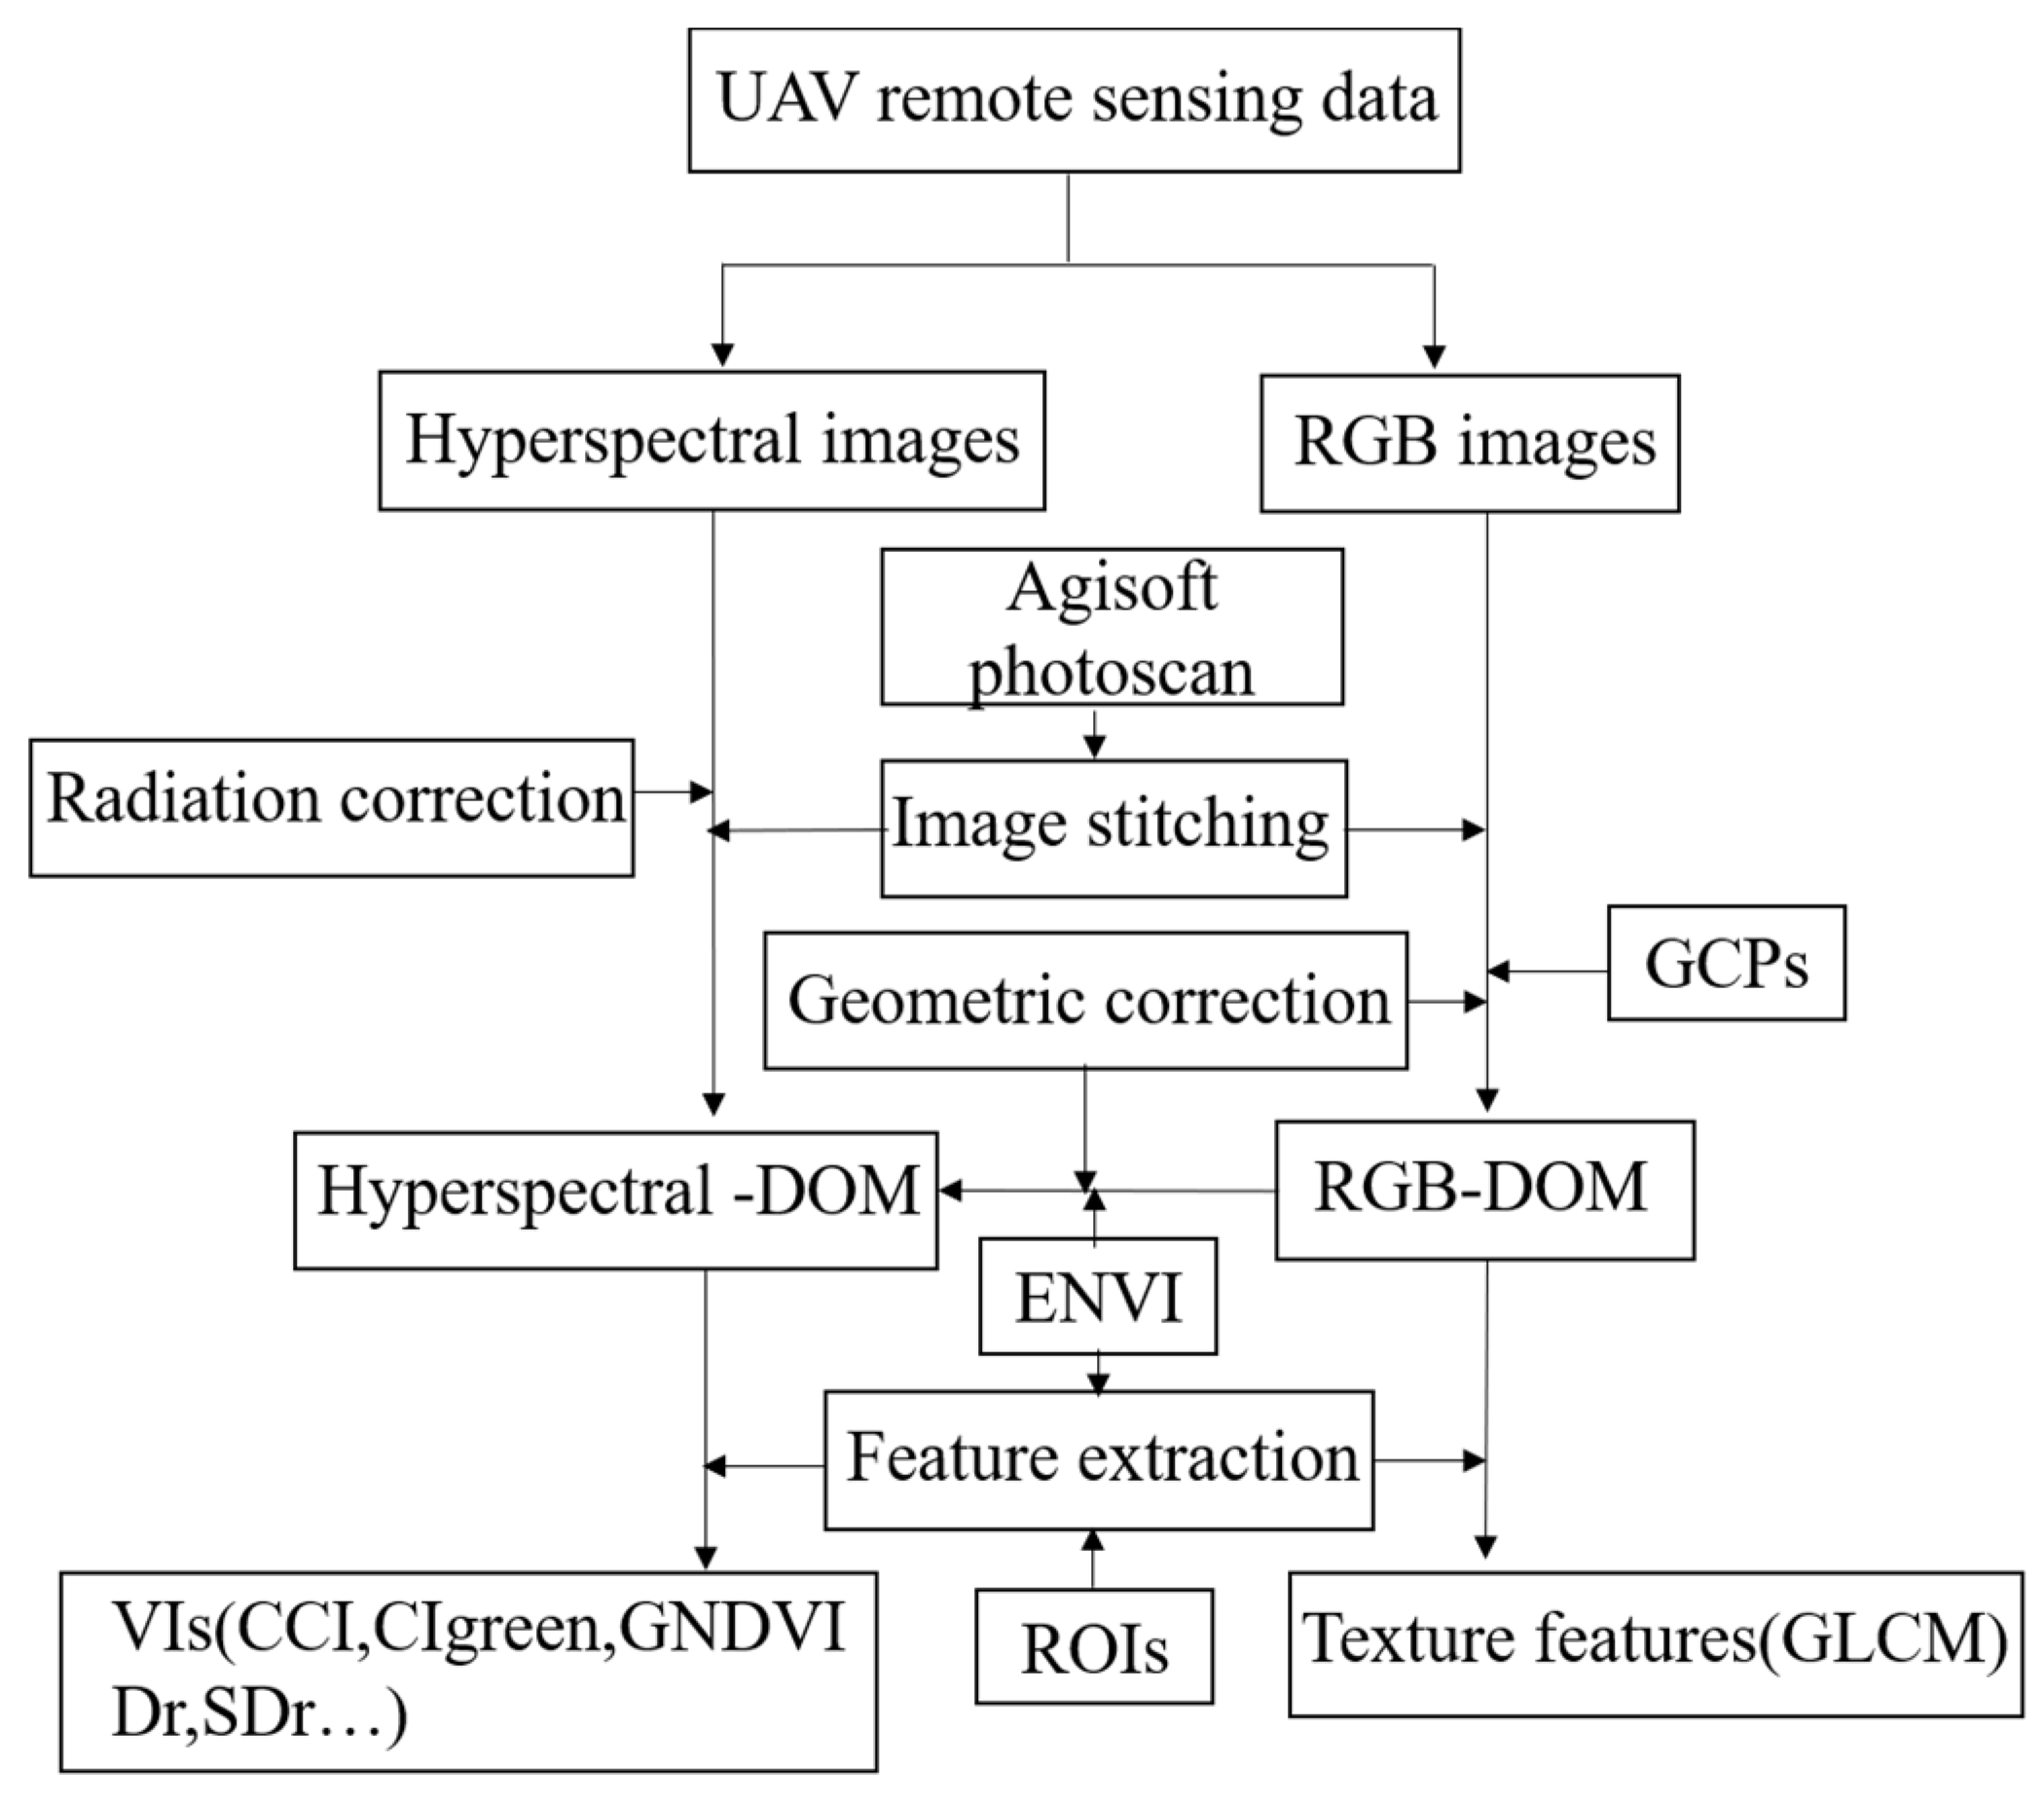
After the flight, the UAV hyperspectral data were processed by geometric correction, image stitching and spectral data extraction. First, the surface reflectance of the hyperspectral images was calibrated based on black-and-white panel data. Then, we calibrated the collected images and processed them into several ortho-mosaic maps. The canopy hyperspectral and digital images of soybean were stitched together using Agisoft PhotoScan software (version 1.5.5, Agisoft LLC, St. Petersburg, Russia) to generate the hyperspectral and RGB digital orthophoto images (DOMs) of the experimental site, respectively. The UAV-based RGB DOMs were rectified by applying a field-measured GCPs in the ENVI software (version 5.3, Harris Geospatial Solutions, Boulder, CO, USA). And, the UAV-based hyperspectral DOMs were rectified by using the UAV-based RGB DOMs. Finally, the regions of interest (ROIs) in all soybean plots were manually delineated in ENVI and the corresponding reflectance data were extracted from the hyperspectral DOMs using the ROI tools. We calculated the average of all pixel values in plots as the extraction results.
In this study, we used three types of features, including VI based on the hyperspectral images as the first type, texture features (Te) based on the RGB images for the second type, and the known maturity group information (M) for the third type. In order to fully explore these parameters, a set of VI including red-edge position (REP), red-edge amplitude (Dr), the minimum red-edge amplitude (Drmin), red-edge area (SDr) and the ratio of the red-edge amplitude and the minimum red-edge amplitude (Dr/Drmin) were selected (Table 2). REP is the wavelength of the maximum first derivative of the spectrum in the range of 680–760 nm [34]. Drmin is the value of the minimum red-edge amplitude [35]. Texture features reflect the spatial dimensional information of the images, which can describe the spatial distribution. In this study, the commonly used gray-level co-occurrence matrix (GLCM) was used to extract Te from RGB images of the red, green and blue bands in ENVI 5.3, which include the mean, variance, homogeneity, contrast, dissimilarity, entropy, second moment and correlation. The same ROIs used for reflectance extraction were applied to extract the texture features of each plot. As for the third type, to maintain data uniformity, we simplified the maturity group information into numbers of 1, 2 and 3 to represent the early maturity group, median maturity group and late maturity group, respectively. The details of the features are listed in Table 2. The main process of image processing and feature extraction in this study is given in Figure 3.

2.4. Data Analysis and Model Establishment

This section covered three parts, including statistical analysis of the data, feature selection, and the model building process.

2.4.1. Statistical Analysis

To explore the differences in GY of soybean genotypes between the three maturity groups, a one-way analysis of variance (ANOVA) with an honest significant difference Tukey test was carried out to evaluate it. The threshold for statistical significance was p < 0.05.
For a further understanding of the significance of variation between genotypes, replicates and their interactions for remote sensing features and grain yield, broad-sense heritability (H2) was computed. The heritability was estimated through the following formula:
H 2 = σ g 2 σ g 2 + σ e 2 r
where r   is the number of replicates, and σ g 2 and σ e 2 are the genotypic and error variance components, respectively [59]. The above data analysis processes were conducted in R software (4.0.4).

2.4.2. Feature Selection

Feature selection is an important part in machine learning. In this study, we adopted the least absolute shrinkage and selection operator (LASSO) algorithm to select sensitive features for yield estimation. The LASSO algorithm executes both variable selection and regularization to improve model accuracy and interpretability [60]. Under the constraint condition that the sum of absolute values of regression coefficients is less than a constant, some regression coefficients which are equal to zero are generated by adding a penalty term (the L 1 norm ||β||1) to the least square linear regression (Equation (2)), minimizing the sum of residual squares.
R S S + β 1 = ( y i β 0 j = 1 P β j x i j ) 2 + λ j = 1 P β j .
where y i is the response of the i th variable, β 0 is the intercept of the model, β j is the coefficient of the j th predictor, j = 1, 2, …, P and x i j is the value of the j th predictor of the i th variable. λ is a tuning parameter. When λ = 0, the penalty term has no impact, and the model will produce the least squares estimates. However, as λ changes to , the effect of the shrinkage penalty increases, and the coefficients of features hardly contributing to the model will become equal to zero. The feature selection process was conducted in python 3.8 using the “LassoCV” function with a specified range of model parameters of λ, c v = 10 and max _ i t e r = 100,000 to optimized the models’ hyperparameters, as well as other default parameters. Finally, the parameter λ with the least error is selected and the selected feature and coefficients are returned.

2.4.3. Model Construction for GY Estimation

The LASSO method was used to select important variables which were used as inputs to the yield estimation models. As mentioned above, we divided all the features into three types, and the feature selection was executed between the first and the second type of features. The maturity group information, as the third type of feature, was introduced in the machine learning models together with the selected variables to build the soybean yield estimation models.
In the study, the partial least square regression (PLSR), Gaussian processes regression (GPR), random forest regression (RFR) and kernel ridge regression (KRR) were adopted to construct the prediction models at three growth stages and multiple growth stages. The PLSR method combines the advantages of multiple linear regression, canonical correlation analysis and principal component regression. It projects the predictor variables and observed variables into a new space. It can reduce multicollinearity between variables and determine the optimal number of components by minimizing the sum of squares of predicted residuals. GPR is a probabilistic kernel machine based on Bayesian and statistical learning theory. It is a non-parametric model for regression using Gaussian priori process. In the process of estimation, GP maximizes the type-II maximum likelihood through the boundary likelihood of observations. Moreover, it can calculate the posterior distribution of unknown variables and adjusts the hyperparameters. RF is an ensemble method, where many decision trees are integrated into a forest and combined to predict the final outcome. The final prediction results are the averaged value of all the trees. SVR is a regression algorithm derived from SVM, which uses kernel function to map data to a high-dimensional space and realizes regression by finding the optimal hyperplane. The introduction of an insensitive loss function and regularization enables it to solve nonlinear regression problems. KRR has an identical model form to SVR, but it uses square error loss as a loss function. It shrinks the coefficients by applying penalties to constrain their possible values. All the yield estimation models were built in Python 3.8.

2.5. Model Evaluation

We used two commonly used metrics, R2 and RMSE, to compare the performance of the GY estimation models. We optimized the models’ hyperparameters and evaluated all the models by a 10-fold cross-validation method and used the mean results of the cross-validation in the model comparisons. The calculation formula of R2 and RMSE are as follows:
R 2 = 1 i = 1 n ( y i y ^ i ) 2 i = 1 n ( y i y ¯ ) 2   .
RMSE = i = 1 n ( y i y ^ i ) 2 n
where n is the number of samples;   y i and y ^ i are the measured and the predicted grain yield of sample i , respectively; and y ¯   represents the mean of the measured grain yield. The model with a higher value of R2 and lower values of RMSE can predict grain yield better.

3. Results

3.1. Statistics of GY among Different Maturity Groups

The statistical results of soybean yield in the different maturity groups are summarized in Figure 4 and Table 3. There was a noticeably significant difference in soybean yield between the early maturity group and the late maturity group, while the difference between the early maturity group and the median maturity group was not obvious. The average yield of the early maturity group was higher than that of the other two maturity groups, and the mean yield of the late maturity group was remarkably lower than the other two categories. Meanwhile, the yield of the median maturity group had a wide range of variation (CV > 20%). In summary, different maturity group types may affect soybean yield performance.

3.2. Results and Heritability Evaluation of Selected Features

We presented the relative importance of M and the features screened using the LASSO method for VI and Te in Figure 5. It can be seen that the features selected all including indices related to the red edge, such as Dr/Drmin and SDr at all stages. In particular, Dr/Drmin participated in the yield modeling at each stage, which indicated that the red-edge band had great potential in the estimation of soybean yield. Similarly, it can be seen that some texture parameters were selected to estimate yield at each stage, implying that texture information plays a vital role in estimation. Overall, 3 of the 9 sensitive features screened at the flowering stage, 5 of the 13 features screened at the podding stage and 3 of the 9 sensitive features screened at the bean-filling stage were texture parameters. In addition, PRI related to the utilization of light energy was also involved in modeling of each period. Most importantly, our interested M had a relative importance of 6.2%, 5.3%, 12.6% and 6.9% at different stages, respectively, which provide a stable and noticeable effect on the yield estimation.
Broad-sense heritability is used to characterize the genetic diversity of selected remote sensing features, as shown in Figure 6. The values of H2 reflected the extent to which variations in these features were determined by genetic rather than environmental factors. Its value of selected features varied from 0 to 0.83 at the three time points, and five traits showed a certain heritability at the flowering stage and podding stage, while almost all of the traits presented high heritability at the bean-filling stage. Meanwhile, more than half of the features exhibited high heritability in the combination of multiple growth stages. It is worth noting that Dr/Drmin which contained red-edge information and relevant for predicting chlorophyll, biomass and yield, presented a stable genetic performance in all periods. High heritability indicated that these traits were highly heritable and could be passed down from generation to generation, showing high robustness if they were used for yield estimation.

3.3. Estimation Models of GY at Single Growth Stage

As previously stated, the yield of soybean genotypes in different maturity groups varied significantly. So, we evaluated whether the maturity group information would affect the performance of the yield estimation models. Also, we compared the accuracy of various feature combinations and multiple machine learning algorithms in predicting yield at the three individual stages.
The yield estimation results are shown in Table 4 and Figure 7. We found that of all the single feature estimation results, VI provided better GY estimations at the flowering and bean-filling stages, while the performances of VI and Te at the podding stage were almost identical. When the yield was estimated with two types of variables, almost all of the results were better than with a single one, especially when the maturity group information was added to it. At the flowering stage, the R2 of bivariate combinations combined with the maturity information improved from 0.019 to 0.126 over univariate ones. At the podding stage, the bivariate combinations with added maturity information achieved a higher R2 with an increase of 0.028 up to 0.124. Similarly, the R2 increased by 0.021 to 0.117 at the bean-filling stage. Additionally, the combination of the three types of variables exhibited the best accuracy, which achieved a higher R2 and lower RMSE for the GY estimation performance than all of other models at the three individual periods. The greatest improvement was in the bean-filling stage with an increase of 0.074, when M was added into the VI + Te combination. In general, the combinations of multi-source data improved the prediction accuracy in terms of the R2 and RMSE. And, this improvement was especially evident when the maturity group information was incorporated, which confirms the effectiveness of integrating the maturity information into the model.
In this study, four machine learning algorithms were adopted to estimate soybean yield. For the flowering stage, all the methods performed similarly for a single type of traits. The PLSR method performed slightly better (Figure 7). When the number of types was increased, they were clearly split into three levels. The RFR model was relatively poor, and the GPR was in the middle, while the KRR and PLSR performed slightly better. Overall, the PLSR, GPR and KRR methods performed the best and similarly with R2 values of 0.689, 0.686 and 0.688, and RMSE values of 408.099 kg/hm2, 410.625 kg/hm2 and 408.890 kg/hm2, respectively, when three types of features were involved. At the podding stage and the bean-filling stage, all the methods exhibited similar trends for single and multiple types of features. They were roughly split into two levels. The GPR, KRR and PLSR models were relatively superior, while RFR performed slightly unsatisfactorily. At the podding stage, GPR exhibited the best performance with an R2 of 0.630 and RMSE of 446.778 kg/hm2. For the bean-filling stage, the best yield estimate was R2 = 0.551 and RMSE = 490.044 kg/hm2 when the GPR method was adopted. Overall, in terms of each growth stage, the performance of GPR, KRR and PLSR were similar and excellent, while RFR exhibited a lower estimation performance. Moreover, four machine learning algorithms exhibited stable and better estimation performance in both two or three types of feature combinations than single ones. The R2 gradually increased and the RMSE gradually decreased as the input types increased for all the regression methods, indicating that all the algorithms can handle the fusion of multi-sensor data to some extent.
Furthermore, we found that the optimal time point to predict yield was the flowering stage. At this period, the best result of R2 was 0.689 and RMSE was 408.099 kg/hm2, followed by the podding stage, with the best R2 value of 0.63 and RMSE of 446.778 kg/hm2, and the bean-filling stage, with the best R2 value of 0.551 and RMSE of 490.044 kg/hm2, which were all built with three types of traits. It can be concluded that features at an early reproductive stage have great potential in estimating the yield of soybean, and the accuracy decreases gradually from the flowering to bean-filling stage. Moreover, the best regression models of the podding stage and the bean-filling stage seemed to underestimate the samples with yields greater than 4500 kg/hm2 [8,27], as showed by the data points covered by the blue circles in Figure 8. It was more pronounced in the later growth stages, which is consistent with previous studies.

3.4. Estimation Models of GY for Multiple Growth Stages

To our knowledge, most of the studies employed single-stage data to estimate soybean yield, and few considered the combination of multiple growth stages. To evaluate the yield estimation performances, we constructed models based on data from three individual growth stages. The results are shown in Table 5. Regardless of the type, bivariate combinations or combinations of three types of features, all GY estimation models for multiple growth periods exhibited significantly better than results from individual growth periods, no matter what machine learning algorithm was adopted (Figure 9). As was the case in the individual growth periods, the addition of maturity group information improved the estimation performances of soybean yield for the multiple growth stages. Overall, GPR exhibited the best performance with an R2 of 0.700 and RMSE of 400.946 kg/hm2 by using three types of features (Figure 10). Also, the GPR yield prediction model was applied to the UAV images to produce the soybean yield distribution map, which is shown in Figure 11. Based on the UAV, the yield distribution map of the study area can be quickly generated, and the yield distribution of each plot or genotype can be observed visually, helping breeders to carry out further analysis.

4. Discussion

4.1. Feasibility of Using Maturity Group Information to Enhance Yield Model Performances

The maturity group types have an important influence on soybean yield. Generally, the differences in plant varieties are reflected in the dynamics of nitrogen uptake and changes in biomass [61]. There are differences in plant height, lodging resistance, growth rate, etc., among soybean varieties of different maturity groups [62]. The inconsistent growth and development process of soybean in the three maturity groups, and the differences in biochemical characteristics and structure of leaves in specific periods, created spectral variability between the groups at different wavelengths. Moreover, the differences in canopy greenness are caused by the senescence process or genetic discrepancies, while senescence is considerably determined by genotype [63]. Some studies have suggested that there were differences in spectral reflectance of soybean leaves from different genotypes [31,33,64,65]. Due to the allometric growth of plants in different maturity groups, the senescence process of leaves was inconsistent, and the color and coverage of leaves were different at various growing periods, which affected the changes of vegetation indices and its relationship with yield. For example, the early-maturing varieties of soybean entered the maturity state earlier and the leaves turn yellow, while the late-maturing ones may still be green at this time.
In this study, the yield of late maturity varieties was lower than that of early ones (Table 3). On the one hand, this might be because there were only five late maturity varieties studied, which could not represent the average yield level of all late maturity genotypes. Many years of experiments with more varieties are needed to obtain more accurate conclusions. On the other hand, some late maturity plants might have lower rates of bean-filling due to low night temperatures in the later growth period, and the generation of dark pods and dark grains might affect the yield. It may require a comprehensive consideration of other environmental and physiological factors, and changes in pigment content, lodging and photosynthesis processes to determine the final yield. Generally, soybean yield and seed quality such as protein, isoflavone and oil content are different in different maturity groups, so appropriate maturity groups should be selected and appropriate field management should be implemented according to planting needs. In terms of yield, in Jiaxiang County, when planting early maturity soybeans, the plants can be harvested in a relatively short time without affecting the planting of the next crop, but the appropriate plant morphology and reasonable planting density must be selected to obtain high yields. For late maturity genotypes, the longer growth period can be used to obtain dry matter accumulation, but they need to be sown early, and the appropriate planting density and the plant type need to be selected to avoid lodging and pod explosion in the late growth period to obtain high yields. For median maturity soybean, its growth period is moderate, and a reasonable planting environment can be set up to obtain high yields. No matter what type of soybean is grown, it is necessary to meet the high yield environment required for each maturity group to maximize the yield potential [66].
Soybean is a short-day crop that is not drought-tolerant, and its growth and development are greatly affected by environmental factors [67]. Temperature and soil moisture will affect the emergence time, flowering time and daily growth rate of soybean. Generally, rising temperatures will advance the phenology and shorten the key growth period, while low temperatures will delay the growth period, and their effects on each growth period are different. Also, the optimum base temperature of different genotypes is different. Moreover, soil moisture will affect the photosynthetic rate and stomatal conductance of soybean leaves. The water requirement of soybean at different latitudes is different, and the water requirement at different growth stages is also different. Many years of long-term experiments are needed to further analyze the effects of climatic changes and irrigation systems on the growth period of soybean.
We studied three maturity groups of soybean genotypes (early, median and late maturity). The result showed that a combination of maturity information with any individual or two types of variables exhibited higher accuracies. This clearly indicates that maturity group information had a favorable effect on soybean yield estimation. Several studies emphasized the importance of maturity group information [68]. However, they all did not conduct a detailed analysis comparing the effect of adding and not adding the maturity group information on yield estimation for different individual growth stages and multiple growth stages. In this study, we used digitized maturity group information representing genotypic differences to estimate soybean yield by incorporating it into the models. In addition, we considered other approaches such as substituting the growing degree days (GDDs) for M to represent different genotypes in three maturity groups, and analyzed the potential of combining it into models to estimate soybean yield. GDD is a commonly used parameter that affects the maturity date and yield of crops. Here, the estimation models were built by replacing M with GDD using all combinations in this study. GDD was calculated from the planting date to maturity date using the following equation:
GDD = T m a x + T m i n 2 T b a s e .
where T m a x represents the daily maximum temperature, T m i n   represents the daily minimum temperature, and T b a s e represents the base temperature. The T b a s e value used in the study was 10 °C [69].
The yield estimation models had similarly improved results when combining GDD into the models (Table 6). The results suggested that incorporating parameters which represent different maturity stages into the model could improve the accuracy.

4.2. Contribution of Features in GY Estimation

From the results of the selected features, we saw that the red-edge parameters such as Dr/Drmin participated in the modeling process of GY estimation from single and multiple growth periods (Figure 5). Since the red-edge band could indicate the overall plant health and photosynthetic capacity, it plays a vital role in crop growth detection and yield estimation, which was consistent with previous research [20,68,70]. Additionally, PRI, formulated to capture the normalized difference of plant reflectance between the major green wavelength, can be used to assess nitrogen use efficiency and radiation use efficiency [71], and has been used in GY estimation. We also found the PRI contributed significantly to yield estimation in each phase. Moreover, canopy texture features, which can potentially provide information related to spatial canopy structure, have good potential in yield estimation using each stage [8,27,28]. Most of the features involved in modeling exhibited high broad-sense heritabilities (Figure 6), which means that modeling with them can improve the robustness and stability of the estimation models. Since the traditional phenotypic traits are difficult, time-consuming and labor-consuming to measure, people have begun to focus on the remote sensing of phenotypic traits based on high-throughput platforms as complementary traits. Broad-sense heritability was calculated to describe the percentage of genetic variation to total phenotypic variation, and to reflect the repeatability and reproducibility of phenotypic traits in field trials. Thus, we should spare no effort to try to utilize the indices with high heritability to describe the genotypes to ensure the high robustness of the model. The heritability of remote sensing traits and their genetic correlation with yield could be used as the basis for indirect selection to assist breeders in decision-making [22].
In this study, VI, Te and M and their combinations were adopted to estimate soybean yield. We found that use of VI achieved better estimation performance than Te (Table 4), which may be because narrowband VI derived from hyperspectral images contained a lot of band information, making it a more accurate estimation than Te. However, Te can alleviate the inherent saturation problem of spectral features and can adjust the underestimation or overestimation of yield estimation [72]. Therefore, combining VI and Te improved the estimation accuracy compared with using only a single sensor, which was a common finding in other studies [8,27,28]. Inclusion of the maturity group information to VI and Te further improved grain yield prediction accuracy. We found that the fusion of all features was mostly better than the combination of any two patterns, which was probably due to the multi-source data which can provide more explanatory variable information. Nevertheless, it should be noted that the accuracy improvement in some cases was not substantial when combing all features as compared to using only VI and M, which was likely attributed to the information redundancy between VI and Te.

4.3. Comparison of GY Estimation Models Based on Different Algorithms

The algorithms are critical to the construction of the model, and selection of the most appropriate one can effectively improve the accuracy of the yield predictions. Several studies have used various machine learning algorithms and remote sensing datasets to estimate crop traits and one was found to perform better than the others in different studies [18,20,27,28]. Maimaitijiang et al. [27] reported less of a difference between the various regression algorithms to estimate soybean yield. The variation in estimation performances may be due to the different periods, different crops and different numbers of varieties. This study tested four commonly used machine learning algorithms to predict yield based on remote sensing data at different stages, and used 10-fold cross-validation to compare the predictive performance of the various models. From the results (Table 5), we found that the four machine learning algorithms were roughly divided into two parts, which exhibited different results. On the whole, GPR, KRR and PLSR showed similar performances, among which, GPR was slightly better. The results were partially consistent with the conclusions of Ganeva et al. [9] who found that GPR performed better in estimating certain traits and showed a higher accuracy. The reason for the preferable performance of GPR was probably because it can use a concise way to maximize edge likelihood to give better regularization results. Also, it has smooth properties and can fit nonlinear data, which is especially suitable for handling small datasets. However, the RFR method exhibited lower accuracies, which may be due to its applicability to larger datasets, which suggested that it might not be appropriate for the model in this study. Meanwhile, with the increase in feature types, R2 increased and RMSE decreased for all the methods, but the degree of increase or decrease varied. In addition, we presented a comparison between the results of this study and other relevant studies on soybean yield estimations (Table 7). Although the accuracy of the result in this paper was not very high, the method used was relatively simple and mainly focused on the impact of maturity group information on yield estimation, which needs to be further improved in the future.
However, there were some limitations in this study. The number of samples and varieties used was relatively small, and only one year of experimental data from one site was employed for model construction, which had certain instability. The applicability of the model to other crops remains to be studied. Hence, future studies should consider multi-year, multiple time point experiments, and increase the number of samples and types of sensors to verify the reliability and applicability of the model.

4.4. The Effects of Growth Stages on Yield Estimation

The soybean yield estimation models based on remote sensing data were date-specific. With regard to the optimal time to estimate yield, the results in this paper showed that the most suitable model was at the flowering stage, which is consistent with previous studies. Bai et al. [8] reported that the best period to estimate the yield of soybean was at the flowering stage, and spectral information was easier to distinguish at this stage. Zhou et al. [4] stated that the image features of the early reproductive stage have great potential in estimating yield and was of great benefit in improving the efficiency of soybean breeding. The next best period was the podding stage and the worst was the bean-filling stage. The morphology of a plant varied in different growth periods. At the flowering stage, the plants are in a vigorous growth state and may show characteristics highly related to yield such as the number of flowers. However, at the later stages of growth, the complexity of the canopy structure increases and spectral features become gradually saturated, which reduces the prediction ability of models. In the study, the models using data from multiple growth stages were combined to estimate yield. The best result exhibited a slightly higher accuracy than the best model using only flowering stage data (Figure 9), indicating that the use of a reasonable data combination resulted in the highest estimation performance.

5. Conclusions

This study explored the potential of combining maturity group information with the UAV-based remote sensing data from different growth periods to estimate soybean yield, and investigated the impact of different types of features and machine learning algorithms on the model accuracy. The conclusions of the study are as follows:
  • The maturity group information of soybean exhibited great potential for improving the GY estimation using data from individual growth stages and multiple growth stages.
  • The models based on combinations of VI, Te and M yielded higher estimation accuracies than the models based on single or two types of features. The optimal individual time point for GY estimation is the flowering stage, while multiple growth stages produced the best estimation (R2 = 0.7, RMSE = 400.946 kg/hm2).
  • The comparison of four machine learning algorithms (PLSR, GPR, RFR and KRR) showed that GPR exhibited the highest yield estimation accuracy, followed by KRR and PLSR, and the RFR-based models showed the worst performances.
This research suggests that there is great potential to estimate yield using multi-sensor data fusion combined with the maturity information, and the results can provide an important basis for decision-making in soybean breeding programs to help accelerate the breeding process. Additionally, future studies of multi-year and multiple time points are needed to use different data types representing cultivar or genotypic differences to improve the applicability and stability of the model. Also, we should consider adding other relevant information such as phenological and meteorological data to estimate soybean yield, as well as introducing other kinds of advanced algorithms into the model.

Author Contributions

Conceptualization, P.R.; data curation, P.R.; investigation, H.F.; methodology, H.L. and P.R.; software, H.L.; validation, P.R.; formal analysis, S.H., H.Y. and R.C.; writing—original draft preparation, P.R.; supervision and review, G.Y. and C.Z. All authors have read and agreed to the published version of the manuscript.

Funding

This study was supported by the National Key Research and Development Program of China (2021YFD1201601).

Data Availability Statement

Not applicable.

Acknowledgments

The authors would like thank Bo Xu for acquiring data in the field experiments of this study.

Conflicts of Interest

The authors declare no conflict of interest.

References

  1. Singh, P.; Krishnaswamy, K. Sustainable zero-waste processing system for soybeans and soy by-product valorization. Trends Food Sci. Technol. 2022, 128, 331–344. [Google Scholar] [CrossRef]
  2. Liu, S.L.; Zhang, M.; Feng, F.; Tian, Z.X. Toward a “Green Revolution” for Soybean. Mol. Plant 2020, 13, 688–697. [Google Scholar] [CrossRef] [PubMed]
  3. Vogel, J.T.; Liu, W.D.; Olhoft, P.; Crafts-Brandner, S.J.; Pennycooke, J.C.; Christiansen, N. Soybean Yield Formation Physiology—A Foundation for Precision Breeding Based Improvement. Front. Plant Sci. 2021, 12, 719706. [Google Scholar] [CrossRef]
  4. Zhou, J.; Zhou, J.F.; Ye, H.; Ali, M.L.; Chen, P.Y.; Nguyen, H.T. Yield estimation of soybean breeding lines under drought stress using unmanned aerial vehicle-based imagery and convolutional neural network. Biosyst. Eng. 2021, 204, 90–103. [Google Scholar] [CrossRef]
  5. Zhou, J.; Beche, E.; Vieira, C.C.; Yungbluth, D.; Zhou, J.F.; Scaboo, A.; Chen, P.Y. Improve Soybean Variety Selection Accuracy Using UAV-Based High-Throughput Phenotyping Technology. Front. Plant Sci. 2022, 12, 768742. [Google Scholar] [CrossRef] [PubMed]
  6. Roth, L.; Barendregt, C.; Betrix, C.A.; Hund, A.; Walter, A. High-throughput field phenotyping of soybean: Spotting an ideotype. Remote Sens. Environ. 2022, 269, 112797. [Google Scholar] [CrossRef]
  7. Liu, J.K.; Zhu, Y.J.; Tao, X.Y.; Chen, X.F.; Li, X.W. Rapid prediction of winter wheat yield and nitrogen use efficiency using consumer-grade unmanned aerial vehicles multispectral imagery. Front. Plant Sci. 2022, 13, 1032170. [Google Scholar] [CrossRef]
  8. Bai, D.; Li, D.L.; Zhao, C.S.; Wang, Z.X.; Shao, M.C.; Guo, B.F.; Liu, Y.D.; Wang, Q.; Li, J.D.; Guo, S.Y.; et al. Estimation of soybean yield parameters under lodging conditions using RGB information from unmanned aerial vehicles. Front. Plant Sci. 2022, 13, 1012293. [Google Scholar] [CrossRef]
  9. Ganeva, D.; Roumenina, E.; Dimitrov, P.; Gikov, A.; Jelev, G.; Dragov, R.; Bozhanova, V.; Taneva, K. Phenotypic Traits Estimation and Preliminary Yield Assessment in Different Phenophases of Wheat Breeding Experiment Based on UAV Multispectral Images. Remote Sens. 2022, 14, 1019. [Google Scholar] [CrossRef]
  10. Yousfi, S.; Marin, J.; Parra, L.; Lloret, J.; Mauri, P.V. Remote sensing devices as key methods in the advanced turfgrass phenotyping under different water regimes. Agric. Water Manag. 2022, 266, 107581. [Google Scholar] [CrossRef]
  11. Sugiura, R.; Tsuda, S.; Tamiya, S.; Itoh, A.; Nishiwaki, K.; Murakami, N.; Shibuya, Y.; Hirafuji, M.; Nuske, S. Field phenotyping system for the assessment of potato late blight resistance using RGB imagery from an unmanned aerial vehicle. Biosyst. Eng. 2016, 148, 1–10. [Google Scholar] [CrossRef]
  12. Zhou, J.; Zhou, J.F.; Ye, H.; Ali, M.L.; Nguyen, H.T.; Chen, P.Y. Classification of soybean leaf wilting due to drought stress using UAV-based imagery. Comput. Electron. Agric. 2020, 175, 105576. [Google Scholar] [CrossRef]
  13. Han, S.Y.; Zhao, Y.; Cheng, J.P.; Zhao, F.; Yang, H.; Feng, H.K.; Li, Z.H.; Ma, X.M.; Zhao, C.J.; Yang, G.J. Monitoring Key Wheat Growth Variables by Integrating Phenology and UAV Multispectral Imagery Data into Random Forest Model. Remote Sens. 2022, 14, 3723. [Google Scholar] [CrossRef]
  14. Borra-Serrano, I.; De Swaef, T.; Quataert, P.; Aper, J.; Saleem, A.; Saeys, W.; Somers, B.; Roldan-Ruiz, I.; Lootens, P. Closing the Phenotyping Gap: High Resolution UAV Time Series for Soybean Growth Analysis Provides Objective Data from Field Trials. Remote Sens. 2020, 12, 1644. [Google Scholar] [CrossRef]
  15. Lopez-Cruz, M.; Olson, E.; Rovere, G.; Crossa, J.; Dreisigacker, S.; Mondal, S.; Singh, R.; de los Campos, G. Regularized selection indices for breeding value prediction using hyper-spectral image data. Sci. Rep. 2020, 10, 8195. [Google Scholar] [CrossRef]
  16. Fei, S.P.; Hassan, M.A.; Xiao, Y.G.; Rasheed, A.; Xia, X.C.; Ma, Y.T.; Fu, L.P.; Chen, Z.; He, Z.H. Application of multi-layer neural network and hyperspectral reflectance in genome-wide association study for grain yield in bread wheat. Field Crops Res. 2022, 289, 108730. [Google Scholar] [CrossRef]
  17. Teodoro, P.E.; Teodoro, L.P.R.; Baio, F.H.R.; da Silva, C.A.; dos Santos, R.G.; Ramos, A.P.M.; Pinheiro, M.M.F.; Osco, L.P.; Goncalves, W.N.; Carneiro, A.M.; et al. Predicting Days to Maturity, Plant Height, and Grain Yield in Soybean: A Machine and Deep Learning Approach Using Multispectral Data. Remote Sens. 2021, 13, 4632. [Google Scholar] [CrossRef]
  18. Zhang, Y.; Xia, C.Z.; Zhang, X.Y.; Cheng, X.H.; Feng, G.Z.; Wang, Y.; Gao, Q. Estimating the maize biomass by crop height and narrowband vegetation indices derived from UAV-based hyperspectral images. Ecol. Indic. 2021, 129, 107985. [Google Scholar] [CrossRef]
  19. Geng, L.Y.; Che, T.; Ma, M.G.; Tan, J.L.; Wang, H.B. Corn Biomass Estimation by Integrating Remote Sensing and Long-Term Observation Data Based on Machine Learning Techniques. Remote Sens. 2021, 13, 2352. [Google Scholar] [CrossRef]
  20. Zhang, Y.; Yang, Y.Z.; Zhang, Q.W.; Duan, R.Q.; Liu, J.Q.; Qin, Y.C.; Wang, X.Z. Toward Multi-Stage Phenotyping of Soybean with Multimodal UAV Sensor Data: A Comparison of Machine Learning Approaches for Leaf Area Index Estimation. Remote Sens. 2023, 15, 7. [Google Scholar] [CrossRef]
  21. Ma, Y.R.; Zhang, Q.; Yi, X.; Ma, L.L.; Zhang, L.F.; Huang, C.P.; Zhang, Z.; Lv, X. Estimation of Cotton Leaf Area Index (LAI) Based on Spectral Transformation and Vegetation Index. Remote Sens. 2022, 14, 136. [Google Scholar] [CrossRef]
  22. Fei, S.P.; Hassan, M.A.; He, Z.H.; Chen, Z.; Shu, M.Y.; Wang, J.K.; Li, C.C.; Xiao, Y.G. Assessment of Ensemble Learning to Predict Wheat Grain Yield Based on UAV-Multispectral Reflectance. Remote Sens. 2021, 13, 2338. [Google Scholar] [CrossRef]
  23. Yoosefzadeh-Najafabadi, M.; Tulpan, D.; Eskandari, M. Using Hybrid Artificial Intelligence and Evolutionary Optimization Algorithms for Estimating Soybean Yield and Fresh Biomass Using Hyperspectral Vegetation Indices. Remote Sens. 2021, 13, 2555. [Google Scholar] [CrossRef]
  24. Fei, S.P.; Chen, Z.; Li, L.; Ma, Y.T.; Xiao, Y.G. Bayesian model averaging to improve the yield prediction in wheat breeding trials. Agric. For. Meteorol. 2023, 328, 109237. [Google Scholar] [CrossRef]
  25. Sun, Z.Z.; Li, Q.; Jin, S.C.; Song, Y.L.; Xu, S.; Wang, X.; Cai, J.; Zhou, Q.; Ge, Y.; Zhang, R.N.; et al. Simultaneous Prediction of Wheat Yield and Grain Protein Content Using Multitask Deep Learning from Time-Series Proximal Sensing. Plant Phenomics 2022, 2022, 9757948. [Google Scholar] [CrossRef]
  26. Ma, C.Y.; Liu, M.X.; Ding, F.; Li, C.C.; Cui, Y.Q.; Chen, W.N.; Wang, Y.L. Wheat growth monitoring and yield estimation based on remote sensing data assimilation into the SAFY crop growth model. Sci. Rep. 2022, 12, 5473. [Google Scholar] [CrossRef]
  27. Maimaitijiang, M.; Sagan, V.; Sidike, P.; Hartling, S.; Esposito, F.; Fritschi, F.B. Soybean yield prediction from UAV using multimodal data fusion and deep learning. Remote Sens. Environ. 2020, 237, 111599. [Google Scholar] [CrossRef]
  28. Ji, Y.S.; Liu, R.; Xiao, Y.G.; Cui, Y.X.; Chen, Z.; Zong, X.X.; Yang, T. Faba bean above-ground biomass and bean yield estimation based on consumer-grade unmanned aerial vehicle RGB images and ensemble learning. Precis. Agric. 2023, 24, 1439–1460. [Google Scholar] [CrossRef]
  29. Li, D.; Miao, Y.X.; Gupta, S.K.; Rosen, C.J.; Yuan, F.; Wang, C.Y.; Wang, L.; Huang, Y.B. Improving Potato Yield Prediction by Combining Cultivar Information and UAV Remote Sensing Data Using Machine Learning. Remote Sens. 2021, 13, 3322. [Google Scholar] [CrossRef]
  30. Yoosefzadeh-Najafabadi, M.; Earl, H.J.; Tulpan, D.; Sulik, J.; Eskandari, M. Application of Machine Learning Algorithms in Plant Breeding: Predicting Yield From Hyperspectral Reflectance in Soybean. Front. Plant Sci. 2021, 11, 624273. [Google Scholar] [CrossRef]
  31. Crusiol, L.G.T.; Nanni, M.R.; Furlanetto, R.H.; Sibaldelli, R.N.R.; Cezar, E.; Sun, L.; Foloni, J.S.S.; Mertz-Henning, L.M.; Nepomuceno, A.L.; Neumaier, N.; et al. Classification of Soybean Genotypes Assessed under Different Water Availability and at Different Phenological Stages Using Leaf-Based Hyperspectral Reflectance. Remote Sens. 2021, 13, 172. [Google Scholar] [CrossRef]
  32. Sinha, P.; Robson, A.; Schneider, D.; Kilic, T.; Mugera, H.K.; Ilukor, J.; Tindamanyire, J.M. The potential of in-situ hyperspectral remote sensing for differentiating 12 banana genotypes grown in Uganda. ISPRS J. Photogramm. Remote Sens. 2020, 167, 85–103. [Google Scholar] [CrossRef]
  33. Galvao, L.S.; Roberts, D.A.; Formaggio, A.R.; Numata, I.; Breunig, F.M. View angle effects on the discrimination of soybean varieties and on the relationships between vegetation indices and yield using off-nadir Hyperion data. Remote Sens. Environ. 2009, 113, 846–856. [Google Scholar] [CrossRef]
  34. Dawson, T.P.; Curran, P.J. Technical note A new technique for interpolating the reflectance red edge position. Int. J. Remote Sens. 1998, 19, 2133–2139. [Google Scholar] [CrossRef]
  35. Gong, P.; Pu, R.; Heald, R.C. Analysis of in situ hyperspectral data for nutrient estimation of giant sequoia. Int. J. Remote Sens. 2002, 23, 1827–1850. [Google Scholar] [CrossRef]
  36. Sims, D.A.; Luo, H.Y.; Hastings, S.; Oechel, W.C.; Rahman, A.F.; Gamon, J.A. Parallel adjustments in vegetation greenness and ecosystem CO2 exchange in response to drought in a Southern California chaparral ecosystem. Remote Sens. Environ. 2006, 103, 289–303. [Google Scholar] [CrossRef]
  37. Gitelson, A.A.; Gritz, Y.; Merzlyak, M.N. Relationships between leaf chlorophyll content and spectral reflectance and algorithms for non-destructive chlorophyll assessment in higher plant leaves. J. Plant Physiol. 2003, 160, 271–282. [Google Scholar] [CrossRef]
  38. Li, F.; Mistele, B.; Hu, Y.C.; Yue, X.L.; Yue, S.C.; Miao, Y.X.; Chen, X.P.; Cui, Z.L.; Meng, Q.F.; Schmidhalter, U. Remotely estimating aerial N status of phenologically differing winter wheat cultivars grown in contrasting climatic and geographic zones in China and Germany. Field Crops Res. 2012, 138, 21–32. [Google Scholar] [CrossRef]
  39. Huete, A.; Justice, C.; Liu, H. Development of vegetation and soil indices for MODIS-EOS. Remote Sens. Environ. 1994, 49, 224–234. [Google Scholar] [CrossRef]
  40. Gitelson, A.A.; Merzlyak, M.N. Signature analysis of leaf reflectance spectra: Algorithm development for remote sensing of chlorophyll. J. Plant Physiol. 1996, 148, 494–500. [Google Scholar] [CrossRef]
  41. Maccioni, A.; Agati, G.; Mazzinghi, P. New vegetation indices for remote measurement of chlorophylls based on leaf directional reflectance spectra. J. Photochem. Photobiol. B 2001, 61, 52–61. [Google Scholar] [CrossRef] [PubMed]
  42. Dash, J.; Curran, P.J. The MERIS terrestrial chlorophyll index. Int. J. Remote Sens. 2004, 25, 5403–5413. [Google Scholar] [CrossRef]
  43. Datt, B. A new reflectance Index for remote rensing of chlorophyll content in higher plants: Tests using eucalyptus leaves. J. Plant Physiol. 1999, 154, 30–36. [Google Scholar] [CrossRef]
  44. Sims, D.A.; Gamon, J.A. Relationships between leaf pigment content and spectral reflectance across a wide range of species, leaf structures and developmental stages. Remote Sens. Environ. 2002, 81, 337–354. [Google Scholar] [CrossRef]
  45. Fitzgerald, G.; Rodriguez, D.; O’Leary, G. Measuring and predicting canopy nitrogen nutrition in wheat using a spectral index-The canopy chlorophyll content index (CCCI). Field Crops Res. 2010, 116, 318–324. [Google Scholar] [CrossRef]
  46. Haboudane, D.; Miller, J.R.; Pattey, E.; Zarco-Tejada, P.J.; Strachan, I.B. Hyperspectral vegetation indices and novel algorithms for predicting green LAI of crop canopies: Modeling and validation in the context of precision agriculture. Remote Sens. Environ. 2004, 90, 337–352. [Google Scholar] [CrossRef]
  47. Yao, X.; Zhu, Y.; Tian, Y.C.; Feng, W.; Cao, W.X. Exploring hyperspectral bands and estimation indices for leaf nitrogen accumulation in wheat. Int. J. Appl. Earth Obs. Geoinf. 2010, 12, 89–100. [Google Scholar] [CrossRef]
  48. Rouse, J.W.; Haas, R.H.; Schell, J.A.; Deering, D.W. Monitoring Vegetation Systems in the Great Plains with Erts. In Third ERTS-1 Symposium; NASA: Washington, DC, USA, 1974; Volume 351, p. 309. [Google Scholar]
  49. Broge, N.H.; Leblanc, E. Comparing prediction power and stability of broadband and hyperspectral vegetation indices for estimation of green leaf area index and canopy chlorophyll density. Remote Sens. Environ. 2001, 76, 156–172. [Google Scholar] [CrossRef]
  50. Thenot, F.; Methy, M.; Winkel, T. The Photochemical Reflectance Index (PRI) as a water-stress index. Int. J. Remote Sens. 2002, 23, 5135–5139. [Google Scholar] [CrossRef]
  51. Gitelson, A.A.; Vina, A.; Ciganda, V.; Rundquist, D.C.; Arkebauer, T.J. Remote estimation of canopy chlorophyll content in crops. Geophys. Res. Lett. 2005, 32, L08403. [Google Scholar] [CrossRef]
  52. Peuelas, J.; Gamon, J.A.; Fredeen, A.L.; Merino, J.; Field, C.B. Reflectance indices associated with physiological changes in nitrogen- and water-limited sunflower leaves. Remote Sens. Environ. 1994, 48, 135–146. [Google Scholar] [CrossRef]
  53. Inoue, Y.; Dabrowska-Zierinska, K.; Qi, J. Synoptic assessment of environmental impact of agricultural management: A case study on nitrogen fertiliser impact on groundwater quality, using a fine-scale geoinformation system. Int. J. Environ. Stud. 2012, 69, 443–460. [Google Scholar] [CrossRef]
  54. Jordan, C.F. Derivation of leaf-area index from quality of light on the forest floor. Ecology 1969, 50, 663–666. [Google Scholar] [CrossRef]
  55. Penuelas, J.; Baret, F.; Filella, I. Semi-empirical indices to assess carotenoids/chlorophyll A ratio from leaf spectral reflectances. Photosynthetica 1995, 31, 221–230. [Google Scholar]
  56. Vogelmann, J.E.; Rock, B.N.; Moss, D.M. Red edge spectral measurements from sugar maple leaves. Int. J. Remote Sens. 1993, 14, 1563–1575. [Google Scholar] [CrossRef]
  57. Wu, C.Y.; Niu, Z.; Tang, Q.; Huang, W.J. Estimating chlorophyll content from hyperspectral vegetation indices: Modeling and validation. Agric. For. Meteorol. 2008, 148, 1230–1241. [Google Scholar] [CrossRef]
  58. Nichol, J.E.; Sarker, M.L.R. Improved Biomass Estimation Using the Texture Parameters of Two High-Resolution Optical Sensors. IEEE Trans. Geosci. Remote Sens. 2011, 49, 930–948. [Google Scholar] [CrossRef]
  59. Sehgal, D.; Skot, L.; Singh, R.; Srivastava, R.K.; Das, S.P.; Taunk, J.; Sharma, P.C.; Pal, R.; Raj, B.; Hash, C.T.; et al. Exploring Potential of Pearl Millet Germplasm Association Panel for Association Mapping of Drought Tolerance Traits. PLoS ONE 2015, 10, e0122165. [Google Scholar] [CrossRef]
  60. James, G.; Witten, D.; Hastie, T.; Tibshirani, R. An Introduction to Statistical Learning; Springer: New York, NY, USA, 2013. [Google Scholar]
  61. Maltas, A.; Dupuis, B.; Sinaj, S. Yield and Quality Response of Two Potato Cultivars to Nitrogen Fertilization. Potato Res. 2018, 61, 97–114. [Google Scholar] [CrossRef]
  62. Keep, N.R.; Schapaugh, W.T.; Prasad, P.V.V.; Boyer, E. Changes in Physiological Traits in Soybean with Breeding Advancements. Crop Sci. 2016, 56, 122–131. [Google Scholar] [CrossRef]
  63. Thomas, H.; Ougham, H. The stay-green trait. J. Exp. Bot. 2014, 65, 3889–3900. [Google Scholar] [CrossRef] [PubMed]
  64. Silva, C.A.; Nanni, M.R.; Shakir, M.; Teodoro, P.E.; de Oliveira, J.F.; Cezar, E.; de Gois, G.; Lima, M.; Wojciechowski, J.C.; Shiratsuchi, L.S. Soybean varieties discrimination using non-imaging hyperspectral sensor. Infrared Phys. Technol. 2018, 89, 338–350. [Google Scholar] [CrossRef]
  65. Breunig, F.M.; Galvao, L.S.; Formaggio, A.R.; Epiphanio, J.C.N. Classification of soybean varieties using different techniques: Case study with Hyperion and sensor spectral resolution simulations. J. Appl. Remote Sens. 2011, 5, 053533. [Google Scholar] [CrossRef]
  66. Edwards, J.T.; Purcell, L.C. Soybean yield and biomass responses to increasing plant population among diverse maturity groups: I. Agronomic characteristics. Crop Sci. 2005, 45, 1770–1777. [Google Scholar] [CrossRef]
  67. Lozovaya, V.V.; Lygin, A.V.; Ulanov, A.V.; Nelson, R.L.; Dayde, J.; Widhohn, J.M. Effect of temperature and soil moisture status during seed development on soybean seed isoflavone concentration and composition. Crop Sci. 2005, 45, 1934–1940. [Google Scholar] [CrossRef]
  68. Christenson, B.S.; Schapaugh, W.T.; An, N.; Price, K.P.; Prasad, V.; Fritz, A.K. Predicting Soybean Relative Maturity and Seed Yield Using Canopy Reflectance. Crop Sci. 2016, 56, 625–643. [Google Scholar] [CrossRef]
  69. Myeongryeol, P.; Seo, M.J.; Yun, H.-T.; Ryu, Y.H.; Moon, H.P.; Kim, D.S. Analysis of Agronomic Traits of Soybeans Adaptable to Northern Area of the Korean Peninsula. Plant Breed. Biotechnol. 2019, 7, 386–394. [Google Scholar] [CrossRef]
  70. Tao, H.L.; Feng, H.K.; Xu, L.J.; Miao, M.K.; Long, H.L.; Yue, J.B.; Li, Z.H.; Yang, G.J.; Yang, X.D.; Fan, L.L. Estimation of Crop Growth Parameters Using UAV-Based Hyperspectral Remote Sensing Data. Sensors 2020, 20, 1296. [Google Scholar] [CrossRef]
  71. Garbulsky, M.F.; Penuelas, J.; Gamon, J.; Inoue, Y.; Filella, I. The photochemical reflectance index (PRI) and the remote sensing of leaf, canopy and ecosystem radiation use efficiencies: A review and meta-analysis. Remote Sens. Environ. 2011, 115, 281–297. [Google Scholar] [CrossRef]
  72. Wang, F.M.; Yi, Q.X.; Hu, J.H.; Xie, L.L.; Yao, X.P.; Xu, T.Y.; Zheng, J.Y. Combining spectral and textural information in UAV hyperspectral images to estimate rice grain yield. Int. J. Appl. Earth Obs. Geoinf. 2021, 102, 102397. [Google Scholar] [CrossRef]
Figure 1. The location of the study area and field experimental design: (a) location of Jining City in China; (b) location of Jiaxiang County in Jining City; (c) experimental field; (d) experimental design.
Remotesensing 15 04286 g001
Figure 2. Maximum temperature, minimum temperature and precipitation during growing season.
Remotesensing 15 04286 g002
Figure 3. The main process of image processing and feature extraction.
Remotesensing 15 04286 g003
Figure 4. Box plot of soybean yield in different maturity groups. The letters on top of the boxes are significance marks.
Remotesensing 15 04286 g004
Figure 5. Relative importance of different features in best yield estimation models at different stages (%): (a) flowering stage; (b) podding stage; (c) bean-filling stage; (d) multiple growth stages. Note: -R, -G and -B represent red, green and blue bands, respectively; -1, -2 and -3 represent flowering, podding and bean-filling stage, respectively; M represents maturity group information.
Remotesensing 15 04286 g005
Figure 6. H2 of different features in best yield estimation models at different stages: (a) flowering stage; (b) podding stage; (c) bean-filling stage; (d) multiple growth stages.
Remotesensing 15 04286 g006
Figure 7. Grain yield prediction performances of different models with various features at three individual stages: (a) R2 of flowering stage; (b) RMSE of flowering stage; (c) R2 of podding stage; (d) RMSE of podding stage; (e) R2 of bean-filling stage; (f) RMSE of bean-filling stage. Note: Te represents texture features, VI represents vegetation indices, M represents maturity group information.
Remotesensing 15 04286 g007
Figure 8. Grain yield prediction performances based on the best models at three individual stages: (a) flowering stage; (b) podding stage; (c) bean-filling stage. The 1:1 lines were plotted in black. The red solid line is the data fitted lines. The blue dashed-line circles represent underestimated samples with yields more than 4500 kg/hm2.
Remotesensing 15 04286 g008
Figure 9. R2 of GY estimation models with individual growth period and multiple growth periods based on different algorithms and different feature combinations: (a) PLSR; (b) GPR; (c) RFR; (d) KRR.
Remotesensing 15 04286 g009
Figure 10. Grain yield prediction performance based on the best model for multiple growth stages.
Remotesensing 15 04286 g010
Figure 11. The soybean yield estimation map based on the best model using data from multiple growth stages.
Remotesensing 15 04286 g011
Table 1. The parameters of the UHD 185 hyperspectral imaging sensor and the digital camera used in this study.
ParameterSONY DSC-QX100ParameterUHD185
Image size5472 × 3648Working height50 m aboveground
Image dpi350Spectral Information450–950 nm
Ground spatial resolution0.016 mPixel resolution0.03 m
Exposure1/1250 sData spectral resolution4 nm
Table 2. Features from different sensors used in this study.
Data TypeIndex NameEquationReference
CCI (Canopy Chlorophyll Index) R 720 / R 700 [36]
CIgreen (Green Chlorophyll Index) R 780 / R 550 1 [37]
CIred-edge (RedEdge Chlorophyll Index) R 800 / R 740 1 [38]
EVI (Enhanced Vegetation Index) 2.5   ×   R 800 R 670 R 800 + 6   ×   R 670 7.5   ×   R 475 + 1 [39]
GNDVI (Green Normalized Difference Vegetation Index) R 750 R 550 / R 750 + R 550 [40]
Maccioni R 780 R 710 / R 780 R 680 [41]
HyperspectralMTCI (Modified Chlorophyll Absorption Ratio Index) R 754 R 709 / R 709 R 681 [42]
NDI (Normalized Difference Index) R 850 R 710 / R 850 + R 680 [43]
mSR705 (Modified Red Edge Simple Ratio Index) R 750 R 445 / R 705 R 445 [44]
NDRE (Normalized Difference Red Edge Index) R 790 R 720 / R 790 + R 720 [45]
MTVI (Modified Triangular Vegetation Index) 1.5   ×   1.2   ×   R 800 R 550 2.5   ×   R 670 R 550 2   ×   R 800 + 1 2 6   ×   R 800 5   ×   R 670 0.5 [46]
NDSI (Normalized Difference Spectral Indices) R 860 R 720 / R 860 + R 720 [47]
NDVI (Normalized Difference Vegetation Index) R 850 R 675 / R 850 + R 675 [48]
TVI (Triangular Vegetation Index) 0.5 [ 120 R 750 R 550 200 R 670 R 550 [49]
PRI (Photochemical Reflectance Index) R 531 R 570 / ( R 531 + R 570 ) [50]
Datt R 850 R 710 / ( R 850 R 680 ) [43]
R-M (Red Model) R 750 / R 720 1 [51]
SRPI (Simple Ratio Pigment Index) R 430 / R 680 [52]
RSI (Ratio Spectral Index) R 825 / R 735 [53]
RVI (Ratio vegetation index) R 800 / R 670 [54]
SIPI (Structure-Intensive Pigment Index) R 800 R 445 / R 800 R 680 [55]
VARI (Visible Atmospherically Resistant Index) R 550 R 660 / R 550 + R 660 R 470 [37]
VOG (Vogelmann Index)) R 740 / R 720 [56]
MND705 R 750 R 705 / R 750 + R 705 2 R 445 [44]
OSAVI (Optimized Soil-Adjusted Vegetation Index) 1.16   ×   R 800 R 670 / ( R 800 + R 670 + 0.16 ) [57]
TCARI (Transformed Chlorophyll Absorption in Reflectance Index)/OSAVI 3   ×   R 700 R 670 0.2   ×   R 700 R 550 R 700 R 670 O S A V I [57]
MSR R 800 / R 670 1 / R 800 / R 670 + 1 0.5 [57]
REPthe wavelength of the maximum first derivative of the spectrum in the range of 680–760 nm[34]
Dr The value of the first derivative corresponding to the red-edge position[35]
SDrArea enclosed by first derivative spectra in the red-edge range (680 nm~760 nm)[35]
Dr/DrminThe ratio of the red-edge amplitude and the minimum red-edge amplitude[35]
Maturity group M1 (Early maturity), 2 (Median maturity), 3 (Late maturity)/
RGBGray-level co-occurrence matrix (GLCM)Mean, variance, homogeneity, contrast, dissimilarity, entropy, second moment and correlation[58]
Note: R is spectral reflectance.
Table 3. Descriptive statistics for GY.
ParameterNo. of SamplesMin.Max.MeanSDCV
Early422272.8035069.23661.274681.21118.61%
Median421854.2604905.7853451.765796.98923.09%
Late151877.6053598.4653027.847489.86616.18%
Note: SD represents standard deviation, CV represents coefficient of variation.
Table 4. Performance of GY estimation models with data from a single growth stage.
ModelFeature TypeFlowering StagePodding StageBean-Filling Stage
R2RMSE (kg/hm2)R2RMSE (kg/hm2)R2RMSE (kg/hm2)
PLSRVI0.543494.7440.537499.5980.346611.424
Te0.466535.4730.528503.3800.288625.183
VI + Te0.668421.4000.592468.2310.455544.294
VI + M0.591468.0230.597465.0170.459542.746
Te + M0.558486.6560.580474.1220.398569.885
VI + Te + M0.689408.0990.617453.0120.529504.235
GPRVI0.484525.3040.501516.2280.379576.267
Te0.397567.6940.493523.1380.282641.840
VI + Te0.635442.2080.594467.8520.477528.630
VI + M0.523505.4860.625447.7970.400570.107
Te + M0.523505.2740.549490.8330.399567.057
VI + Te + M0.686410.6250.630446.7780.551490.044
RFRVI0.523505.6380.455543.4560.321607.768
Te0.409563.2600.446545.8540.260641.840
VI + Te0.608458.7610.514510.1100.378579.355
VI + M0.542495.3400.570479.9050.383575.314
Te + M0.473530.7040.557487.9740.360588.458
VI + Te + M0.625448.5120.583472.6860.440547.525
KRRVI0.530505.7950.530502.3560.358601.382
Te0.417562.0800.518511.2630.309612.221
VI + Te0.663425.0050.603461.5220.457543.153
VI + M0.583473.9980.607458.7800.468536.102
Te + M0.515513.8000.546492.7720.411563.061
VI + Te + M0.688408.8900.617453.8160.531504.219
Note: Te represents texture features, VI represents vegetation indices, M represents maturity group information.
Table 5. Performance of GY estimation models using data from multiple growth stages.
ModelFeature TypeWhole Stage
R2RMSE (kg/hm2)
PLSRVI0.631445.635
Te0.623450.226
VI + Te0.681413.999
VI + M0.657429.419
Te + M0.659427.993
VI + Te + M0.688409.275
GPRVI0.628446.030
Te0.640439.021
VI + Te0.686410.270
VI + M0.660426.6996
Te + M0.672419.599
VI + Te + M0.700400.946
RFRVI0.586470.437
Te0.523506.485
VI + Te0.651432.067
VI + M0.608458.502
Te + M0.568482.686
VI + Te + M0.671419.685
KRRVI0.626448.887
Te0.634444.077
VI + Te0.661426.846
VI + M0.661425.896
Te + M0.674418.804
VI + Te + M0.683411.771
Table 6. Performance of GY estimation models with data from a single growth stage using GDD.
ModelFeature TypeFlowering StagePodding StageBean-Filling Stage
R2RMSE (kg/hm2)R2RMSE (kg/hm2)R2RMSE (kg/hm2)
PLSRVI0.543494.7440.537499.5980.346611.424
Te0.466535.4730.528503.3800.288625.183
VI + Te0.668421.4000.592468.2310.455544.294
VI + G0.584471.9610.592467.6150.449547.616
Te + G0.562484.4680.573478.5280.393572.616
VI + Te + G0.690407.7420.613455.5470.524507.219
GPRVI0.484525.3040.501516.2280.379576.267
Te0.397567.6940.493523.1380.282641.840
VI + Te0.635442.2080.594467.8520.477528.630
VI + G0.534499.3870.618452.1380.450542.198
Te + G0.529501.9880.540495.9590.385573.910
VI + Te + G0.680413.8530.625448.0670.546492.421
RFRVI0.523505.6380.455543.4560.321607.768
Te0.409563.2600.446545.8540.260641.840
VI + Te0.608458.7610.514510.1100.378579.355
VI + G0.545493.5720.566482.2160.399568.401
Te + G0.474530.3840.540496.6860.366584.545
VI + Te + G0.618452.5060.601462.3070.440547.510
KRRVI0.530505.7950.530502.3560.358601.382
Te0.417562.0800.518511.2630.309612.221
VI + Te0.663425.0050.603461.5220.457543.153
VI + G0.579476.5510.601462.6490.434557.913
Te + G0.519511.6130.543494.8750.404566.658
VI + Te + G0.684411.2160.614455.5990.527506.137
Note: Te represents texture features, VI represents vegetation indices, G represents the growing degree days (GDD).
Table 7. Comparison of results of soybean yield estimation models from different studies.
TypeR2 rRMSE (kg/hm2)Reference
This study0.70/400.954/
Study 10.72/478.900[27]
Study 20.78/391.000[4]
Study 3/0.451000.48[17]
Study 40.77/224.97[23]
Disclaimer/Publisher’s Note: The statements, opinions and data contained in all publications are solely those of the individual author(s) and contributor(s) and not of MDPI and/or the editor(s). MDPI and/or the editor(s) disclaim responsibility for any injury to people or property resulting from any ideas, methods, instructions or products referred to in the content.

