

Remotely Sensed Agriculture Drought Indices for Assessing the Impact on Cereal Yield

 , , , and
Abstract
:
1. Introduction
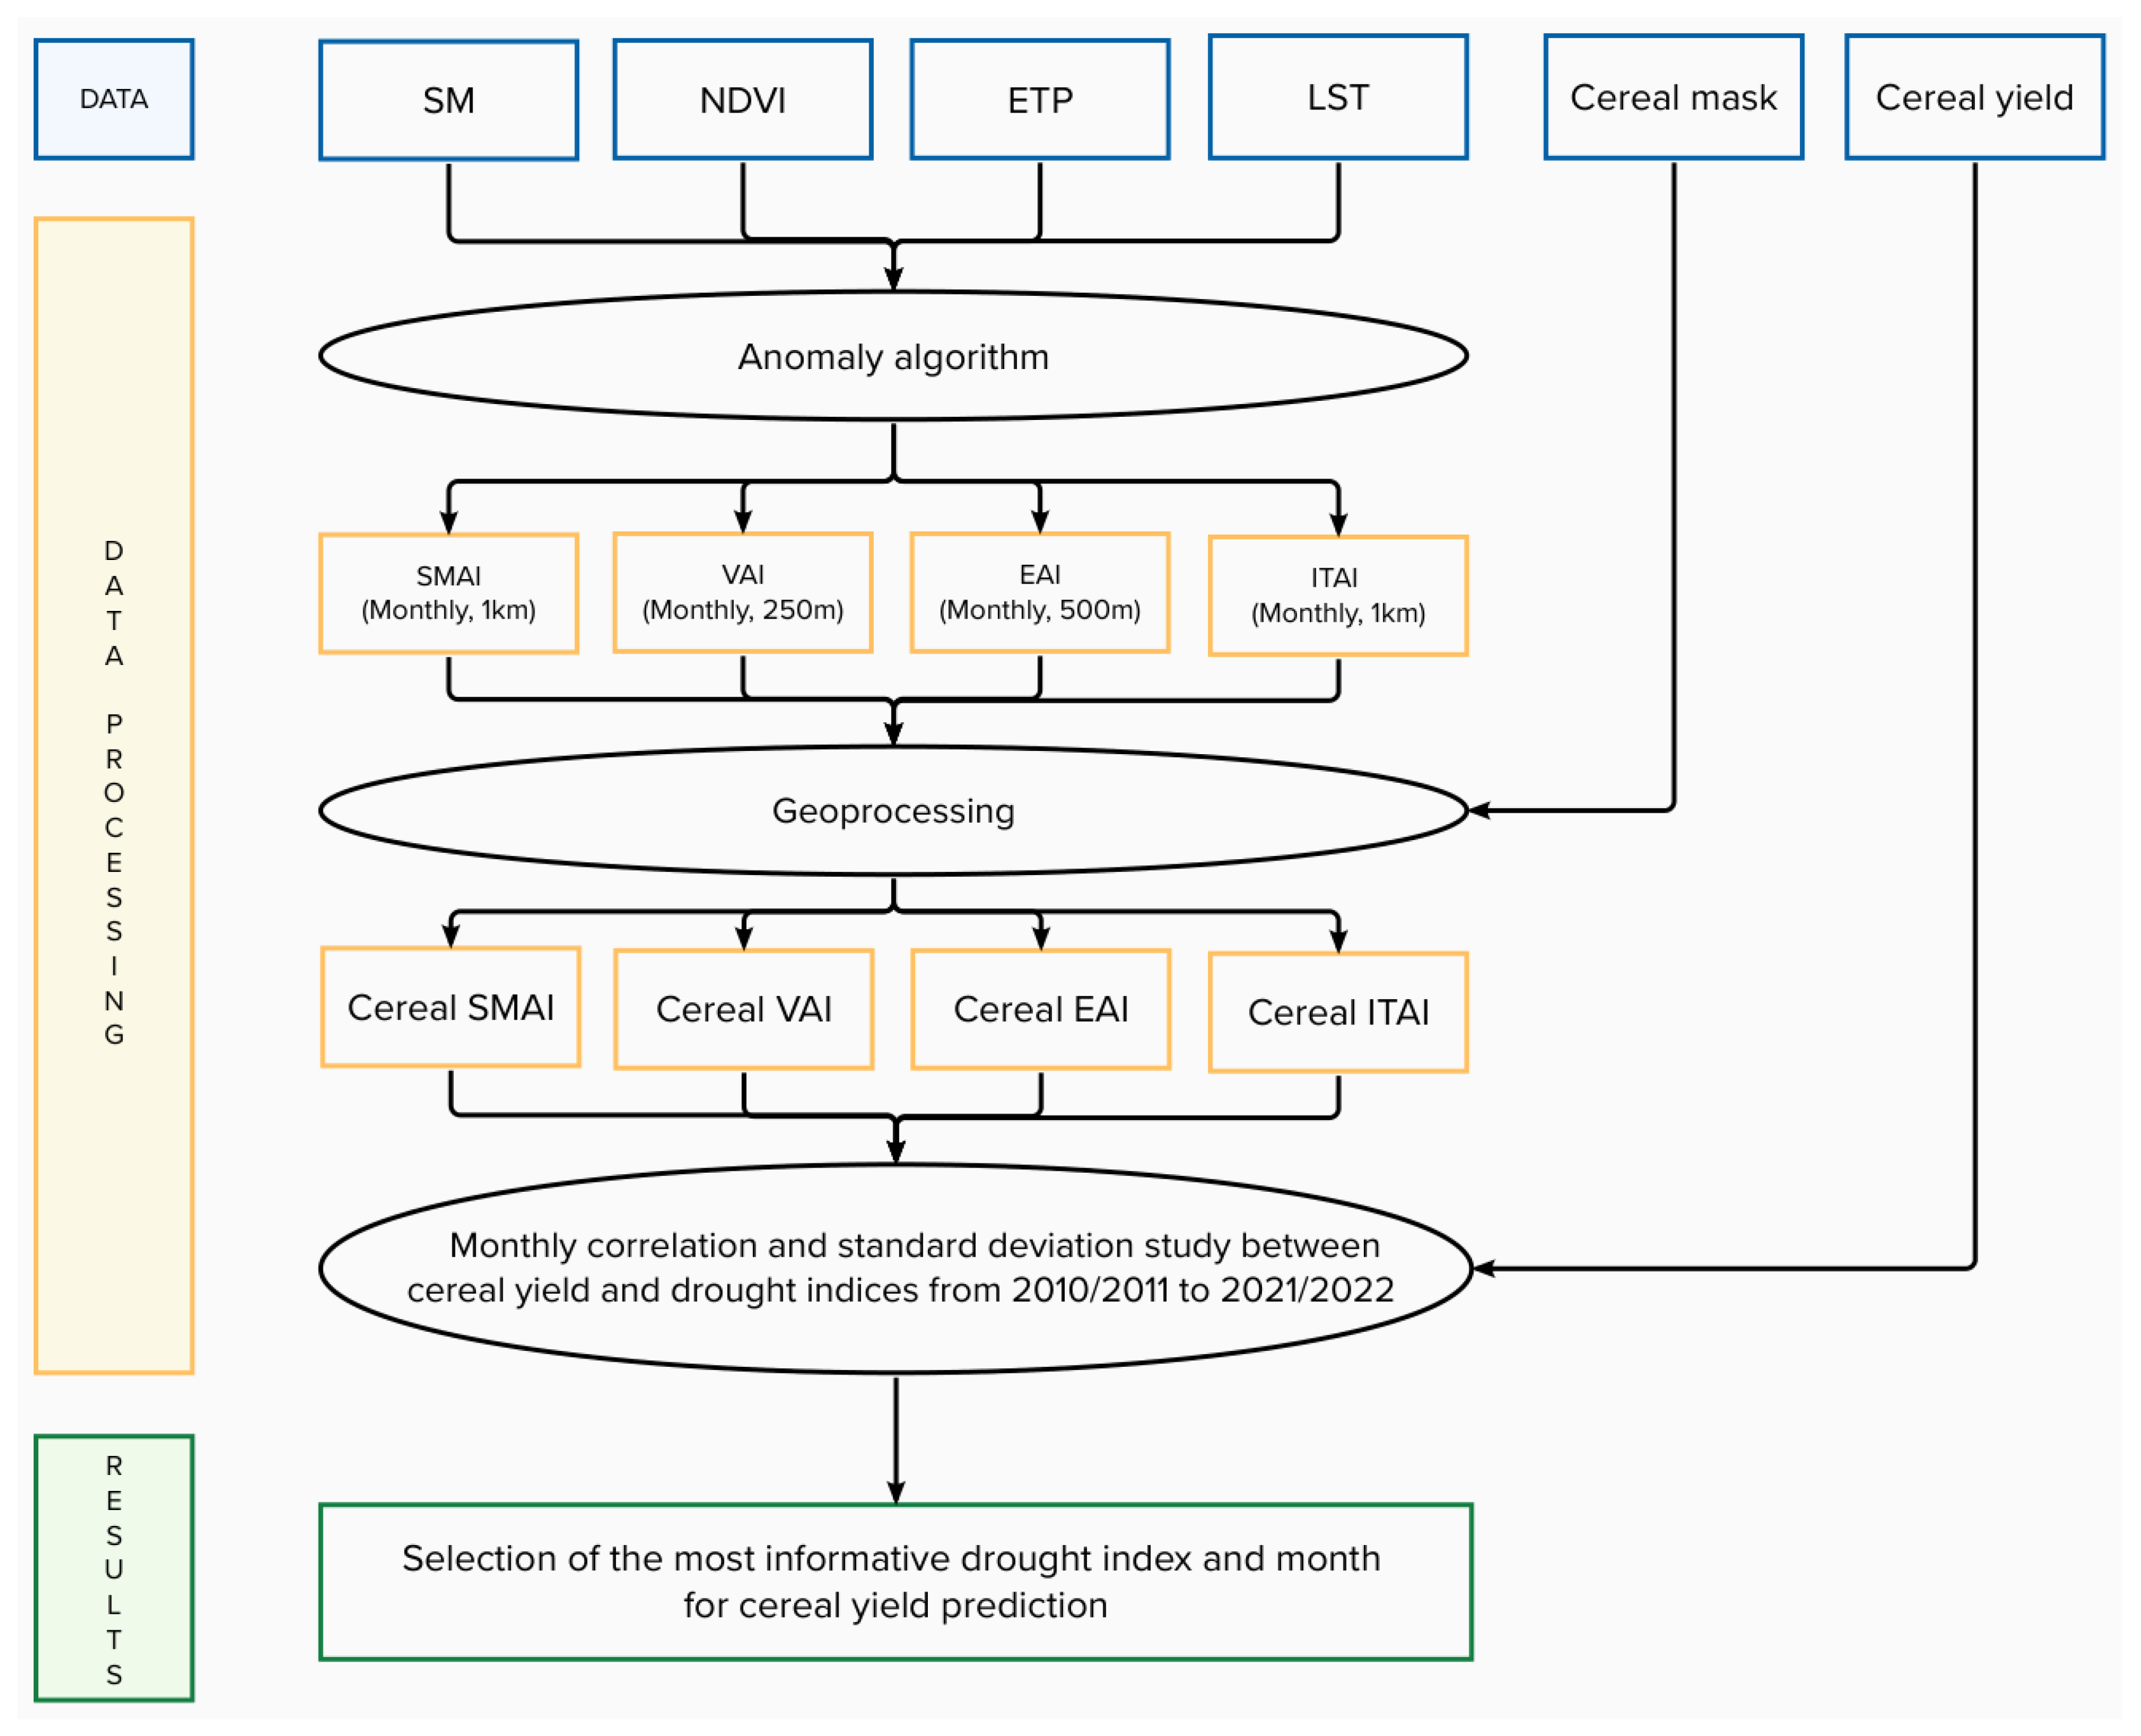
2. Materials and Methods
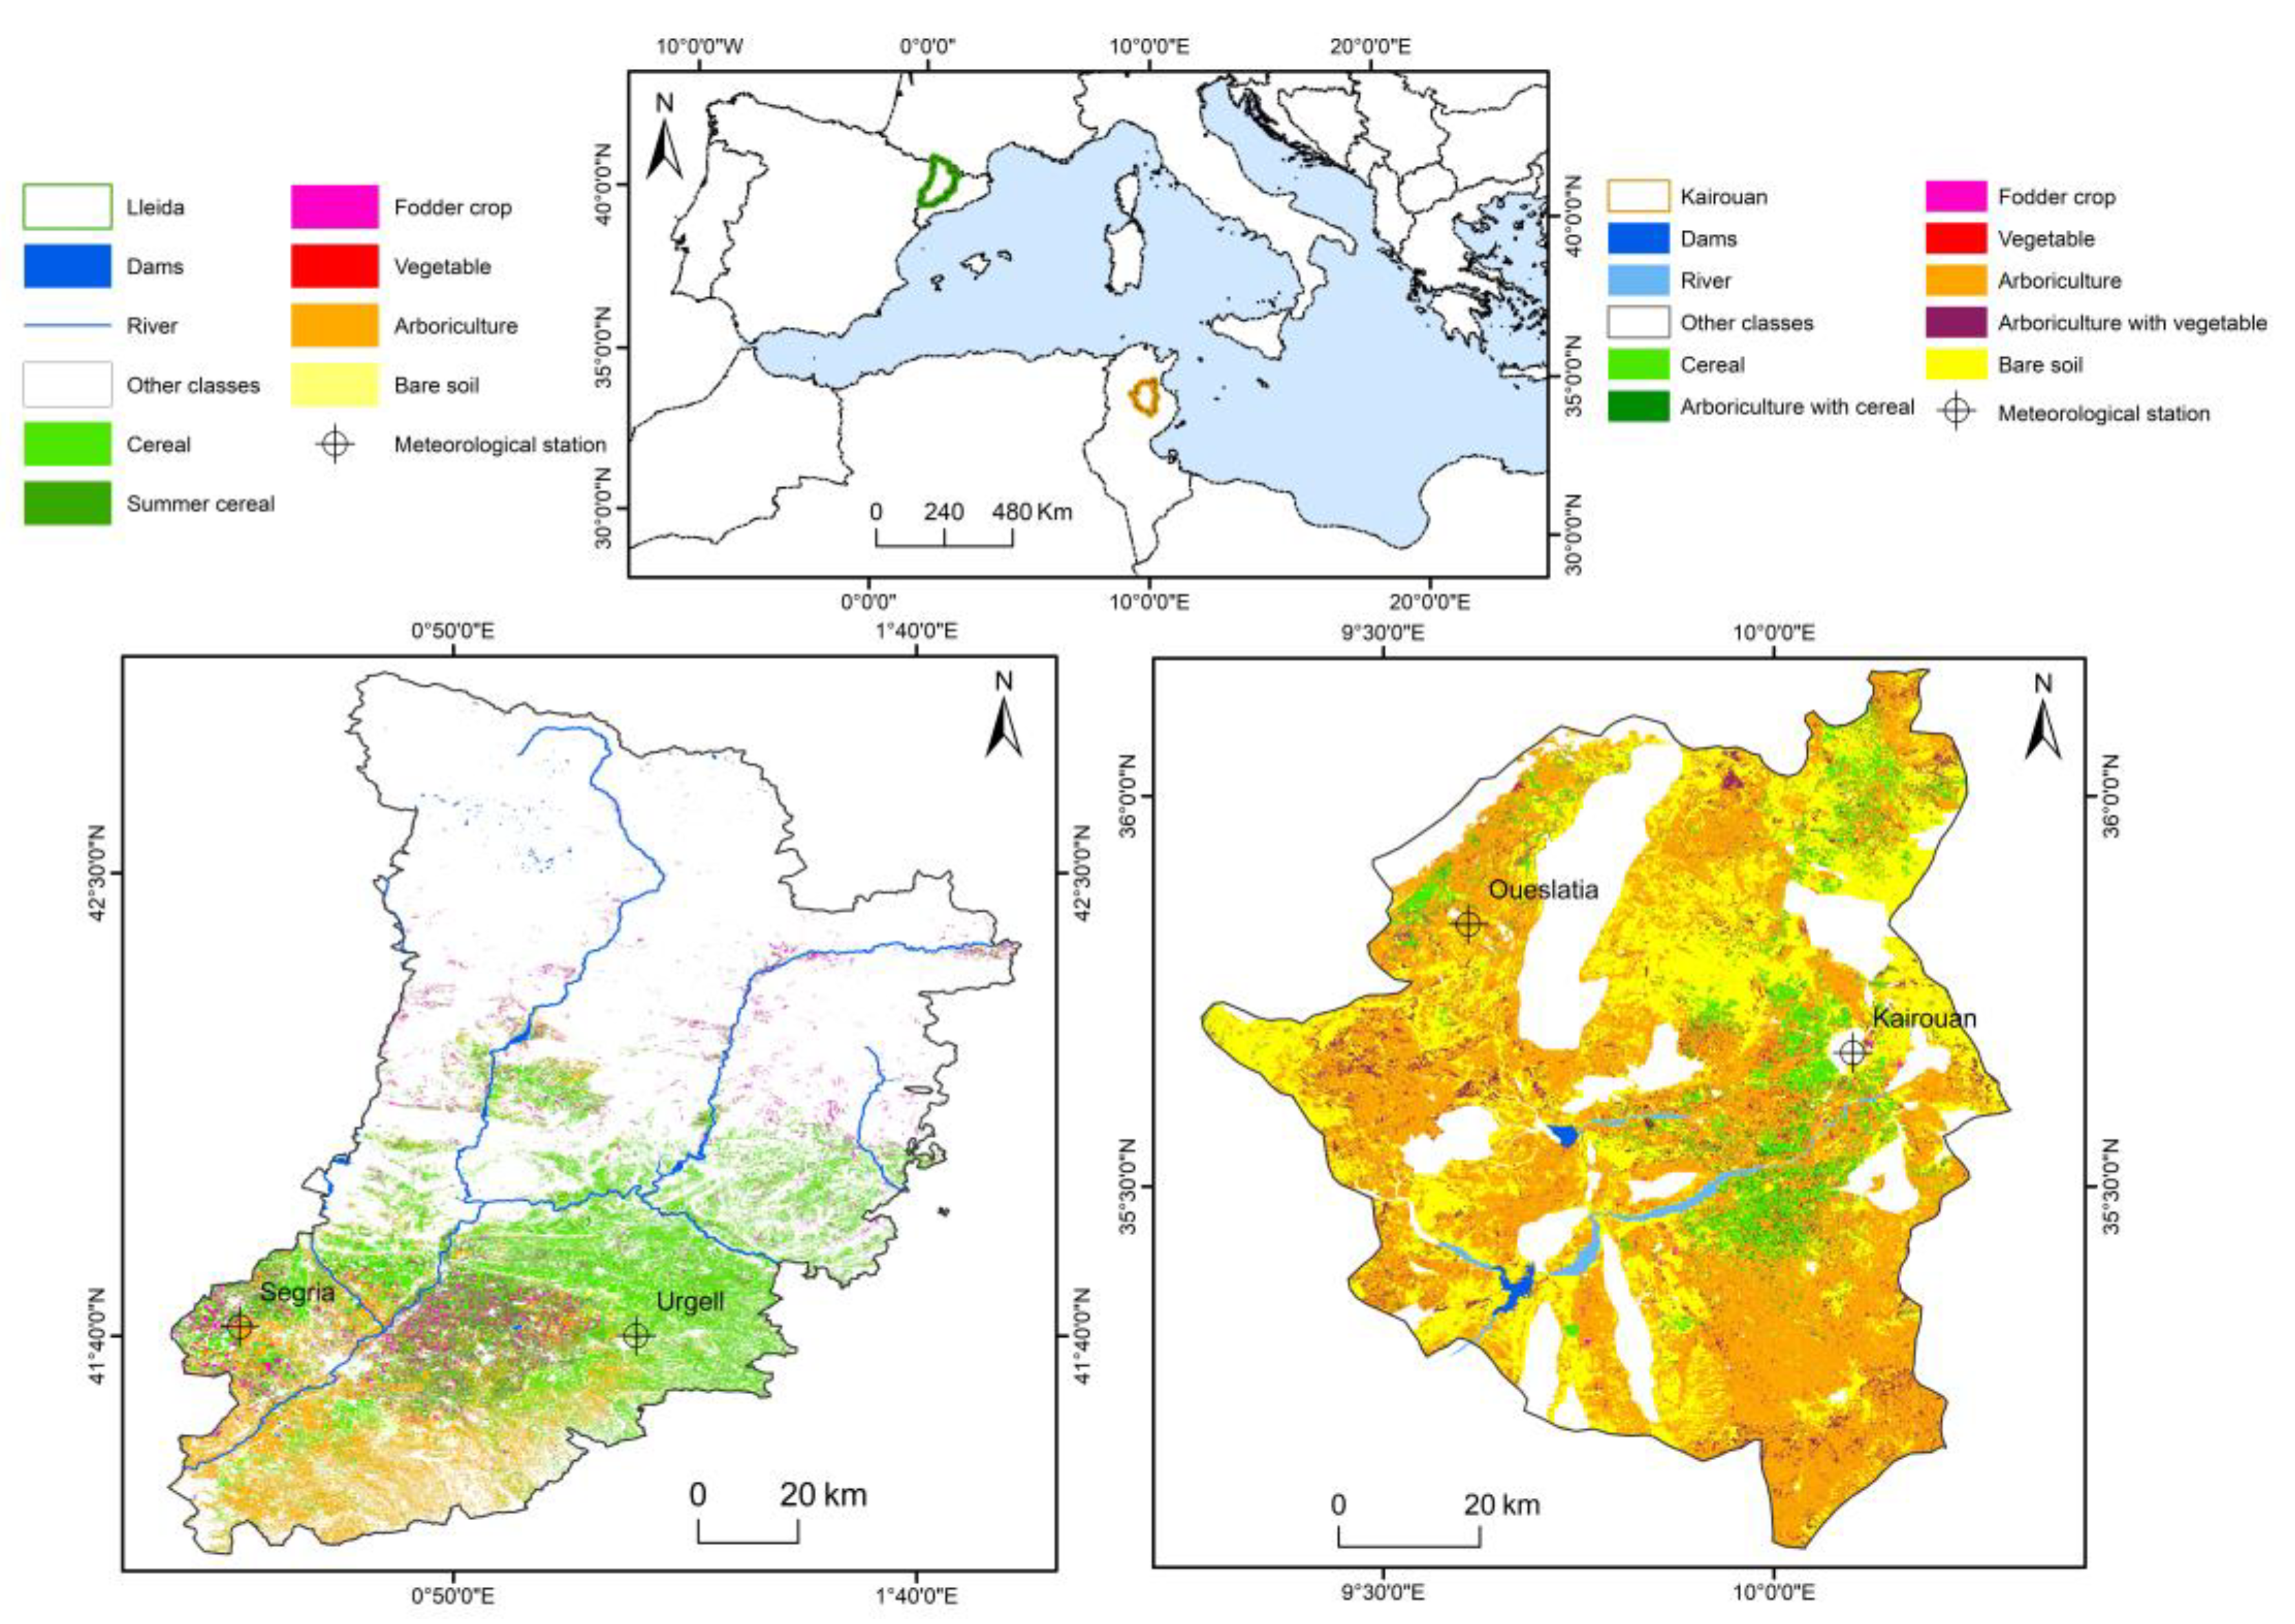
2.1. Study Area
2.1.1. Lleida, Catalonia
2.1.2. Kairouan, Tunisia
2.2. Database
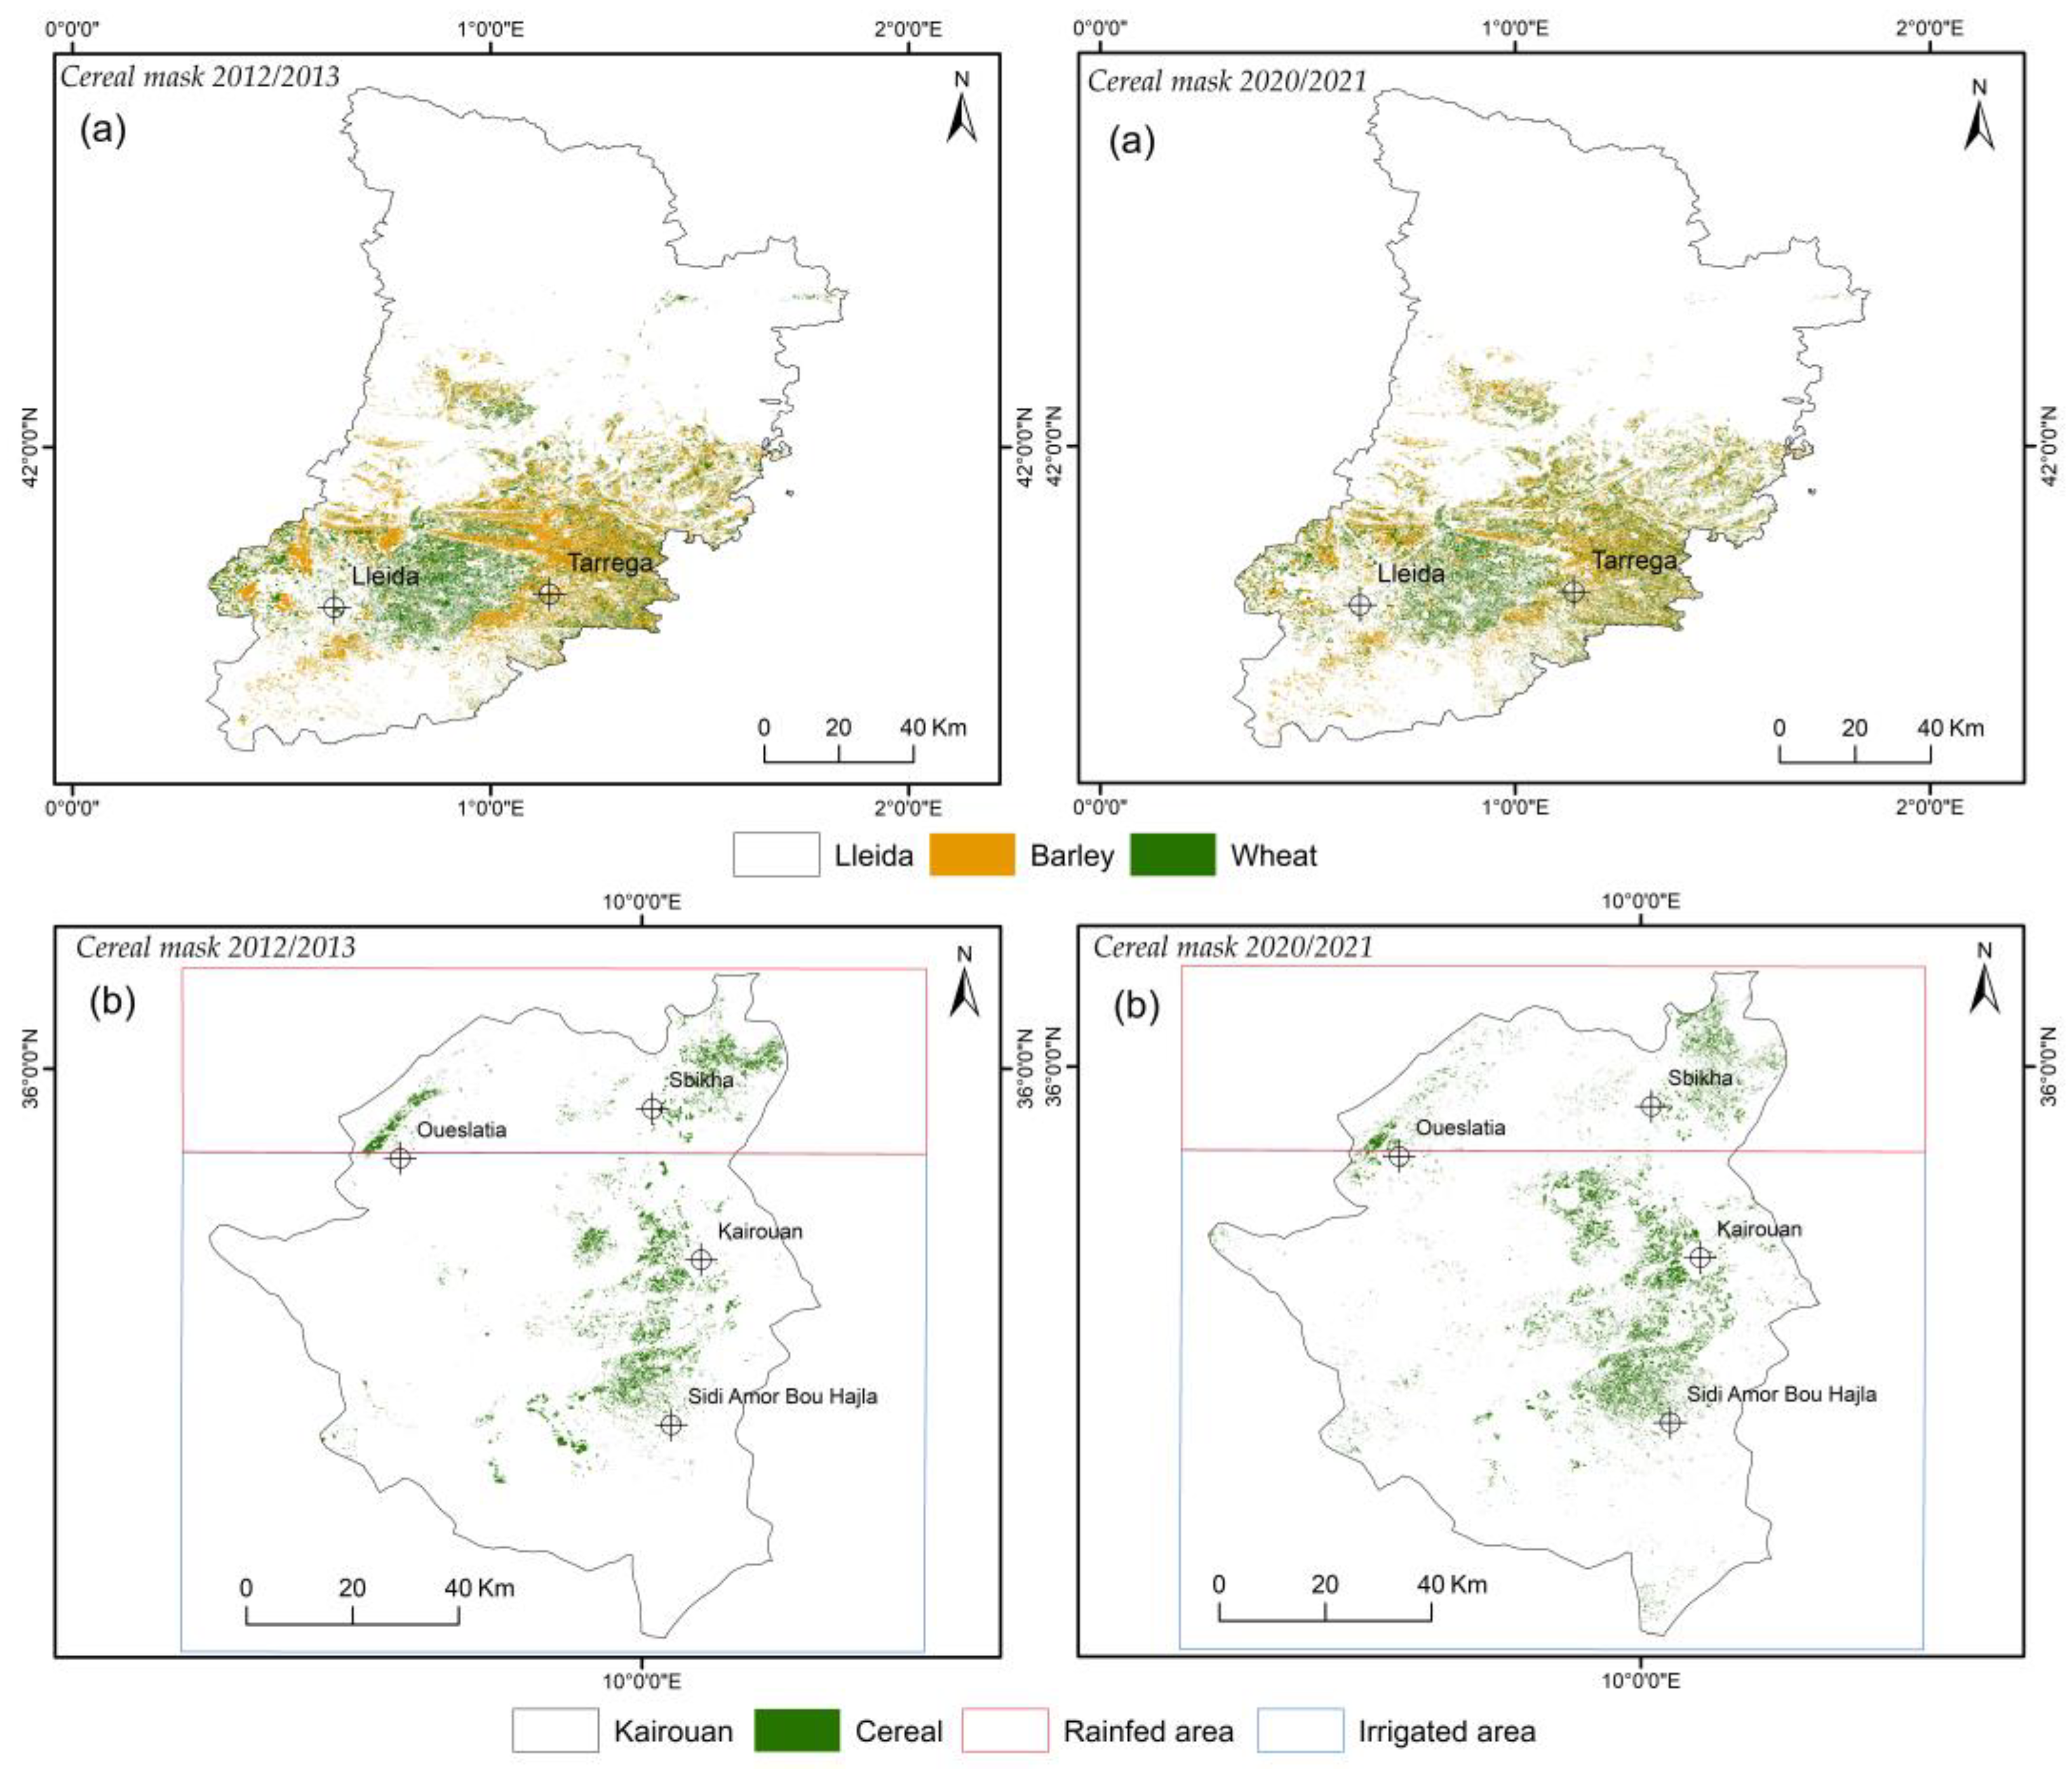
2.2.1. Annual Cereal Masks
2.2.2. Cereal Yields
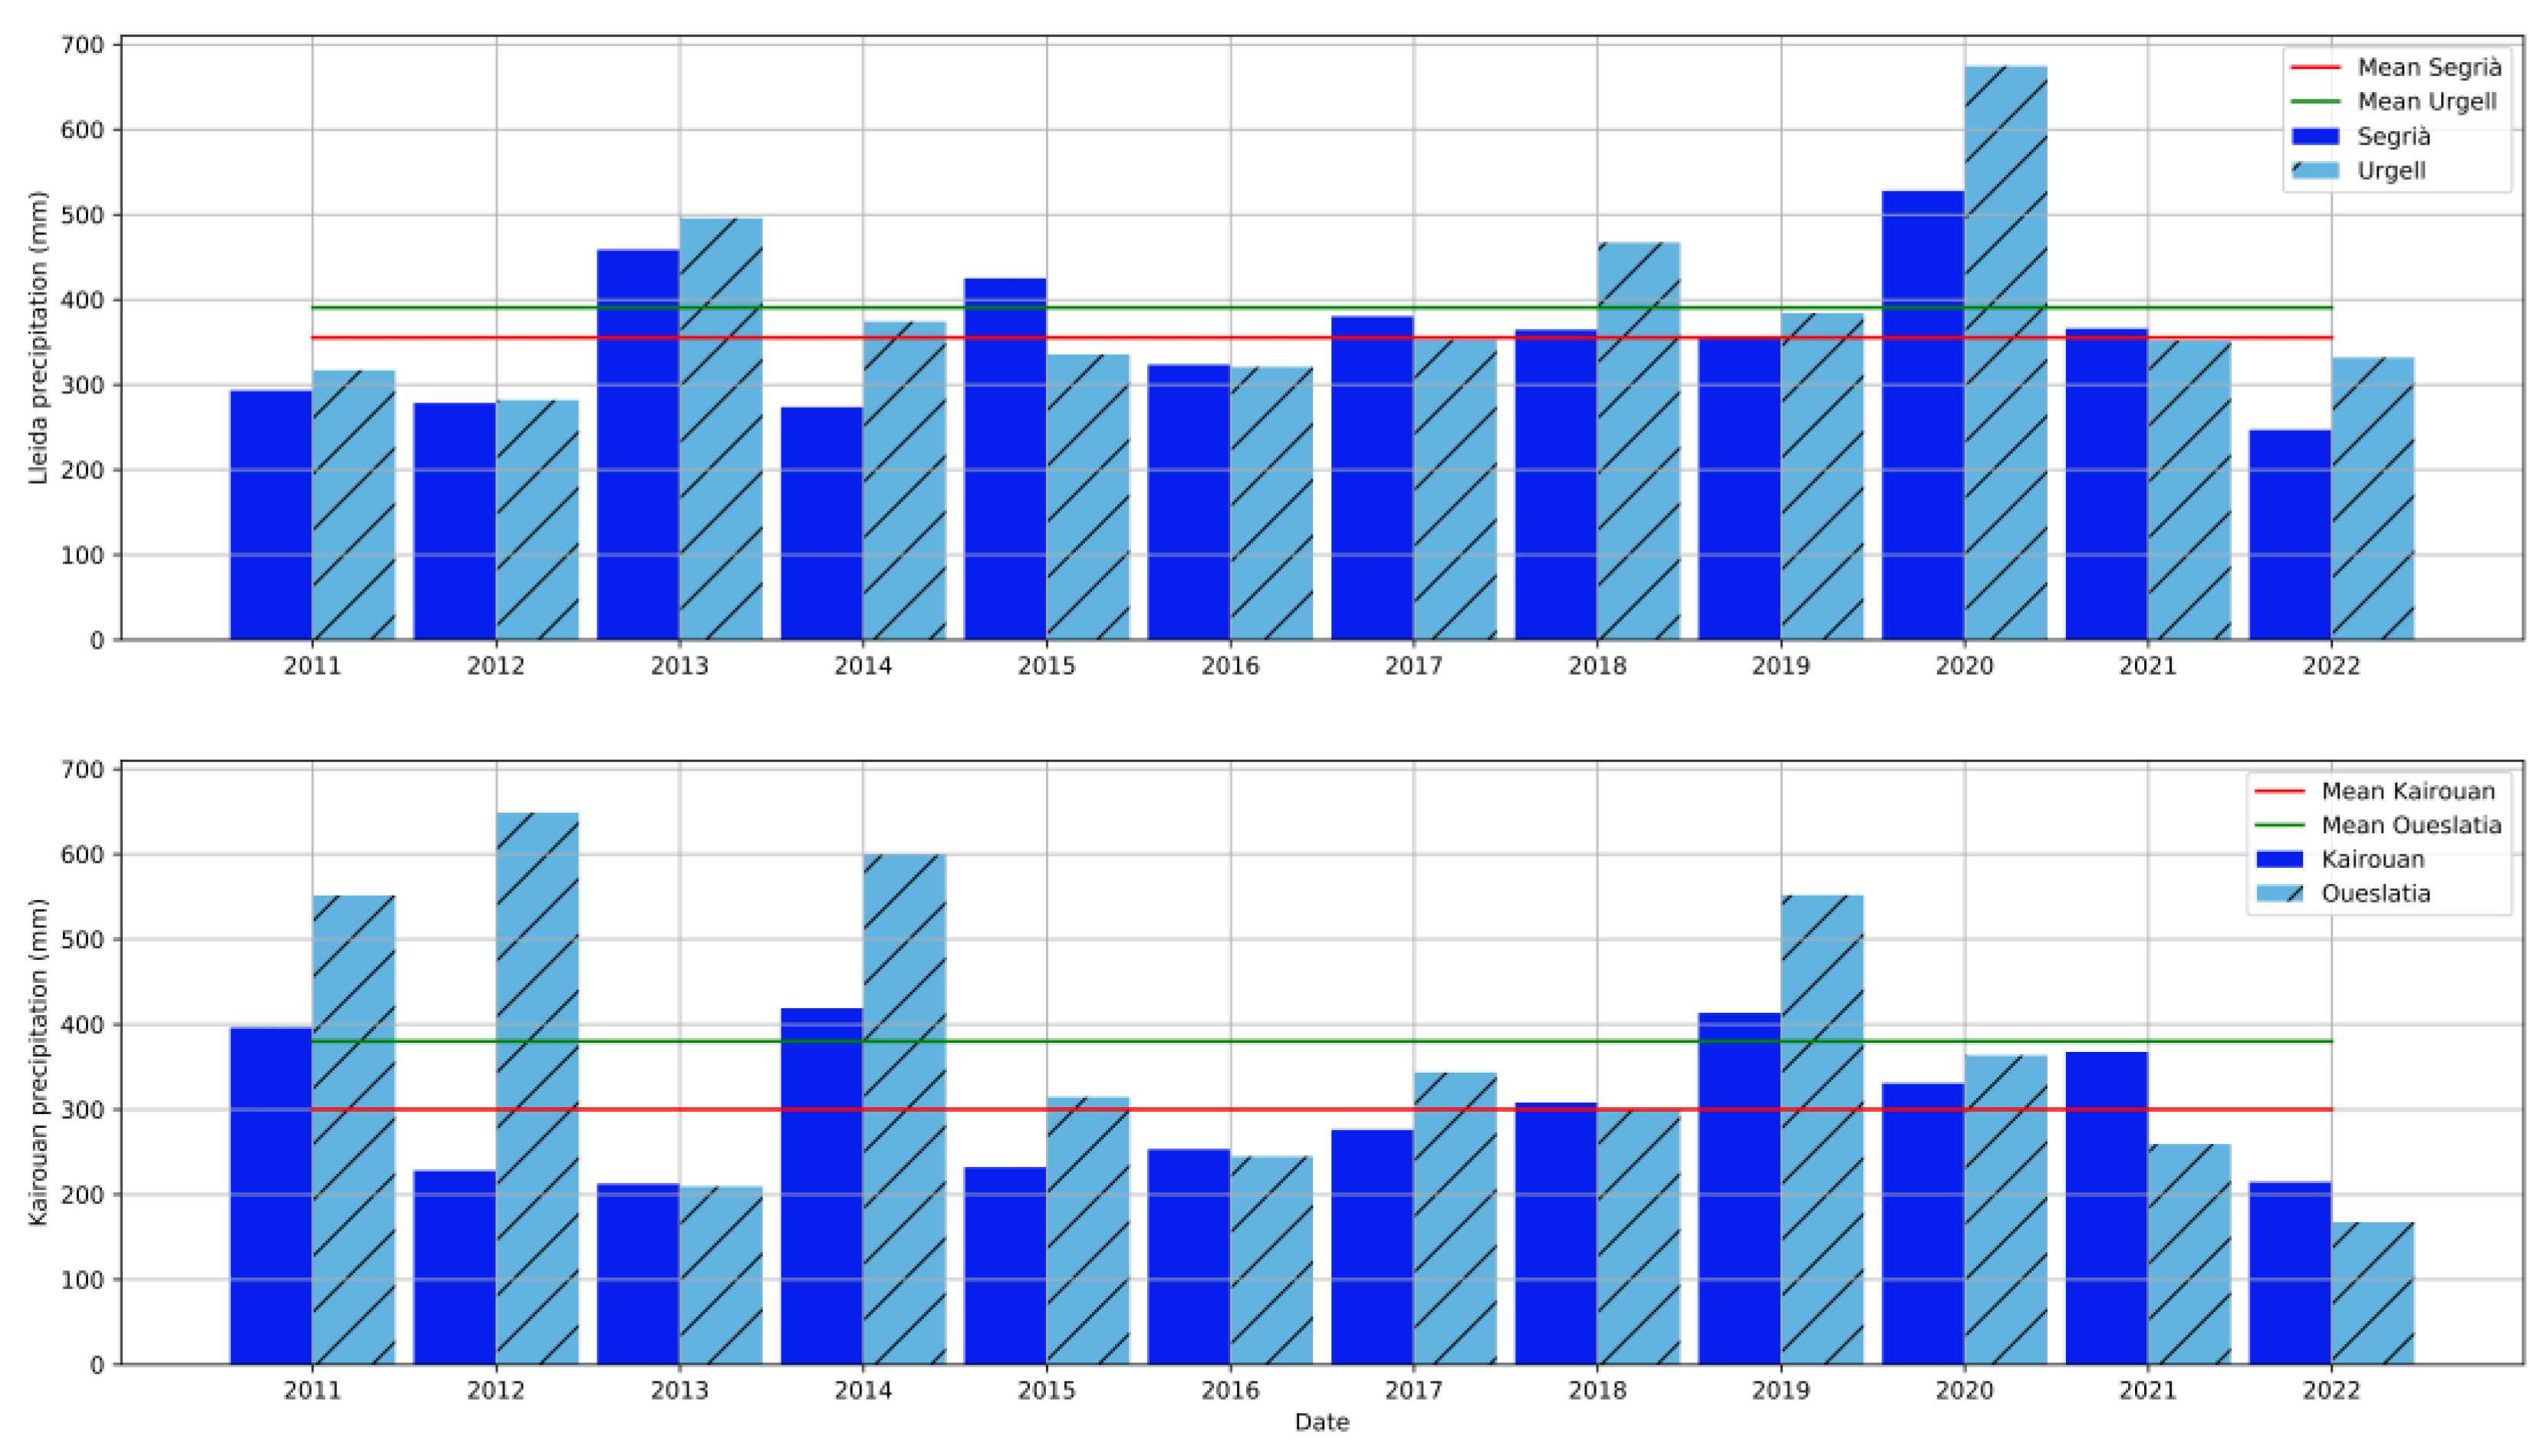
2.2.3. Precipitation Data
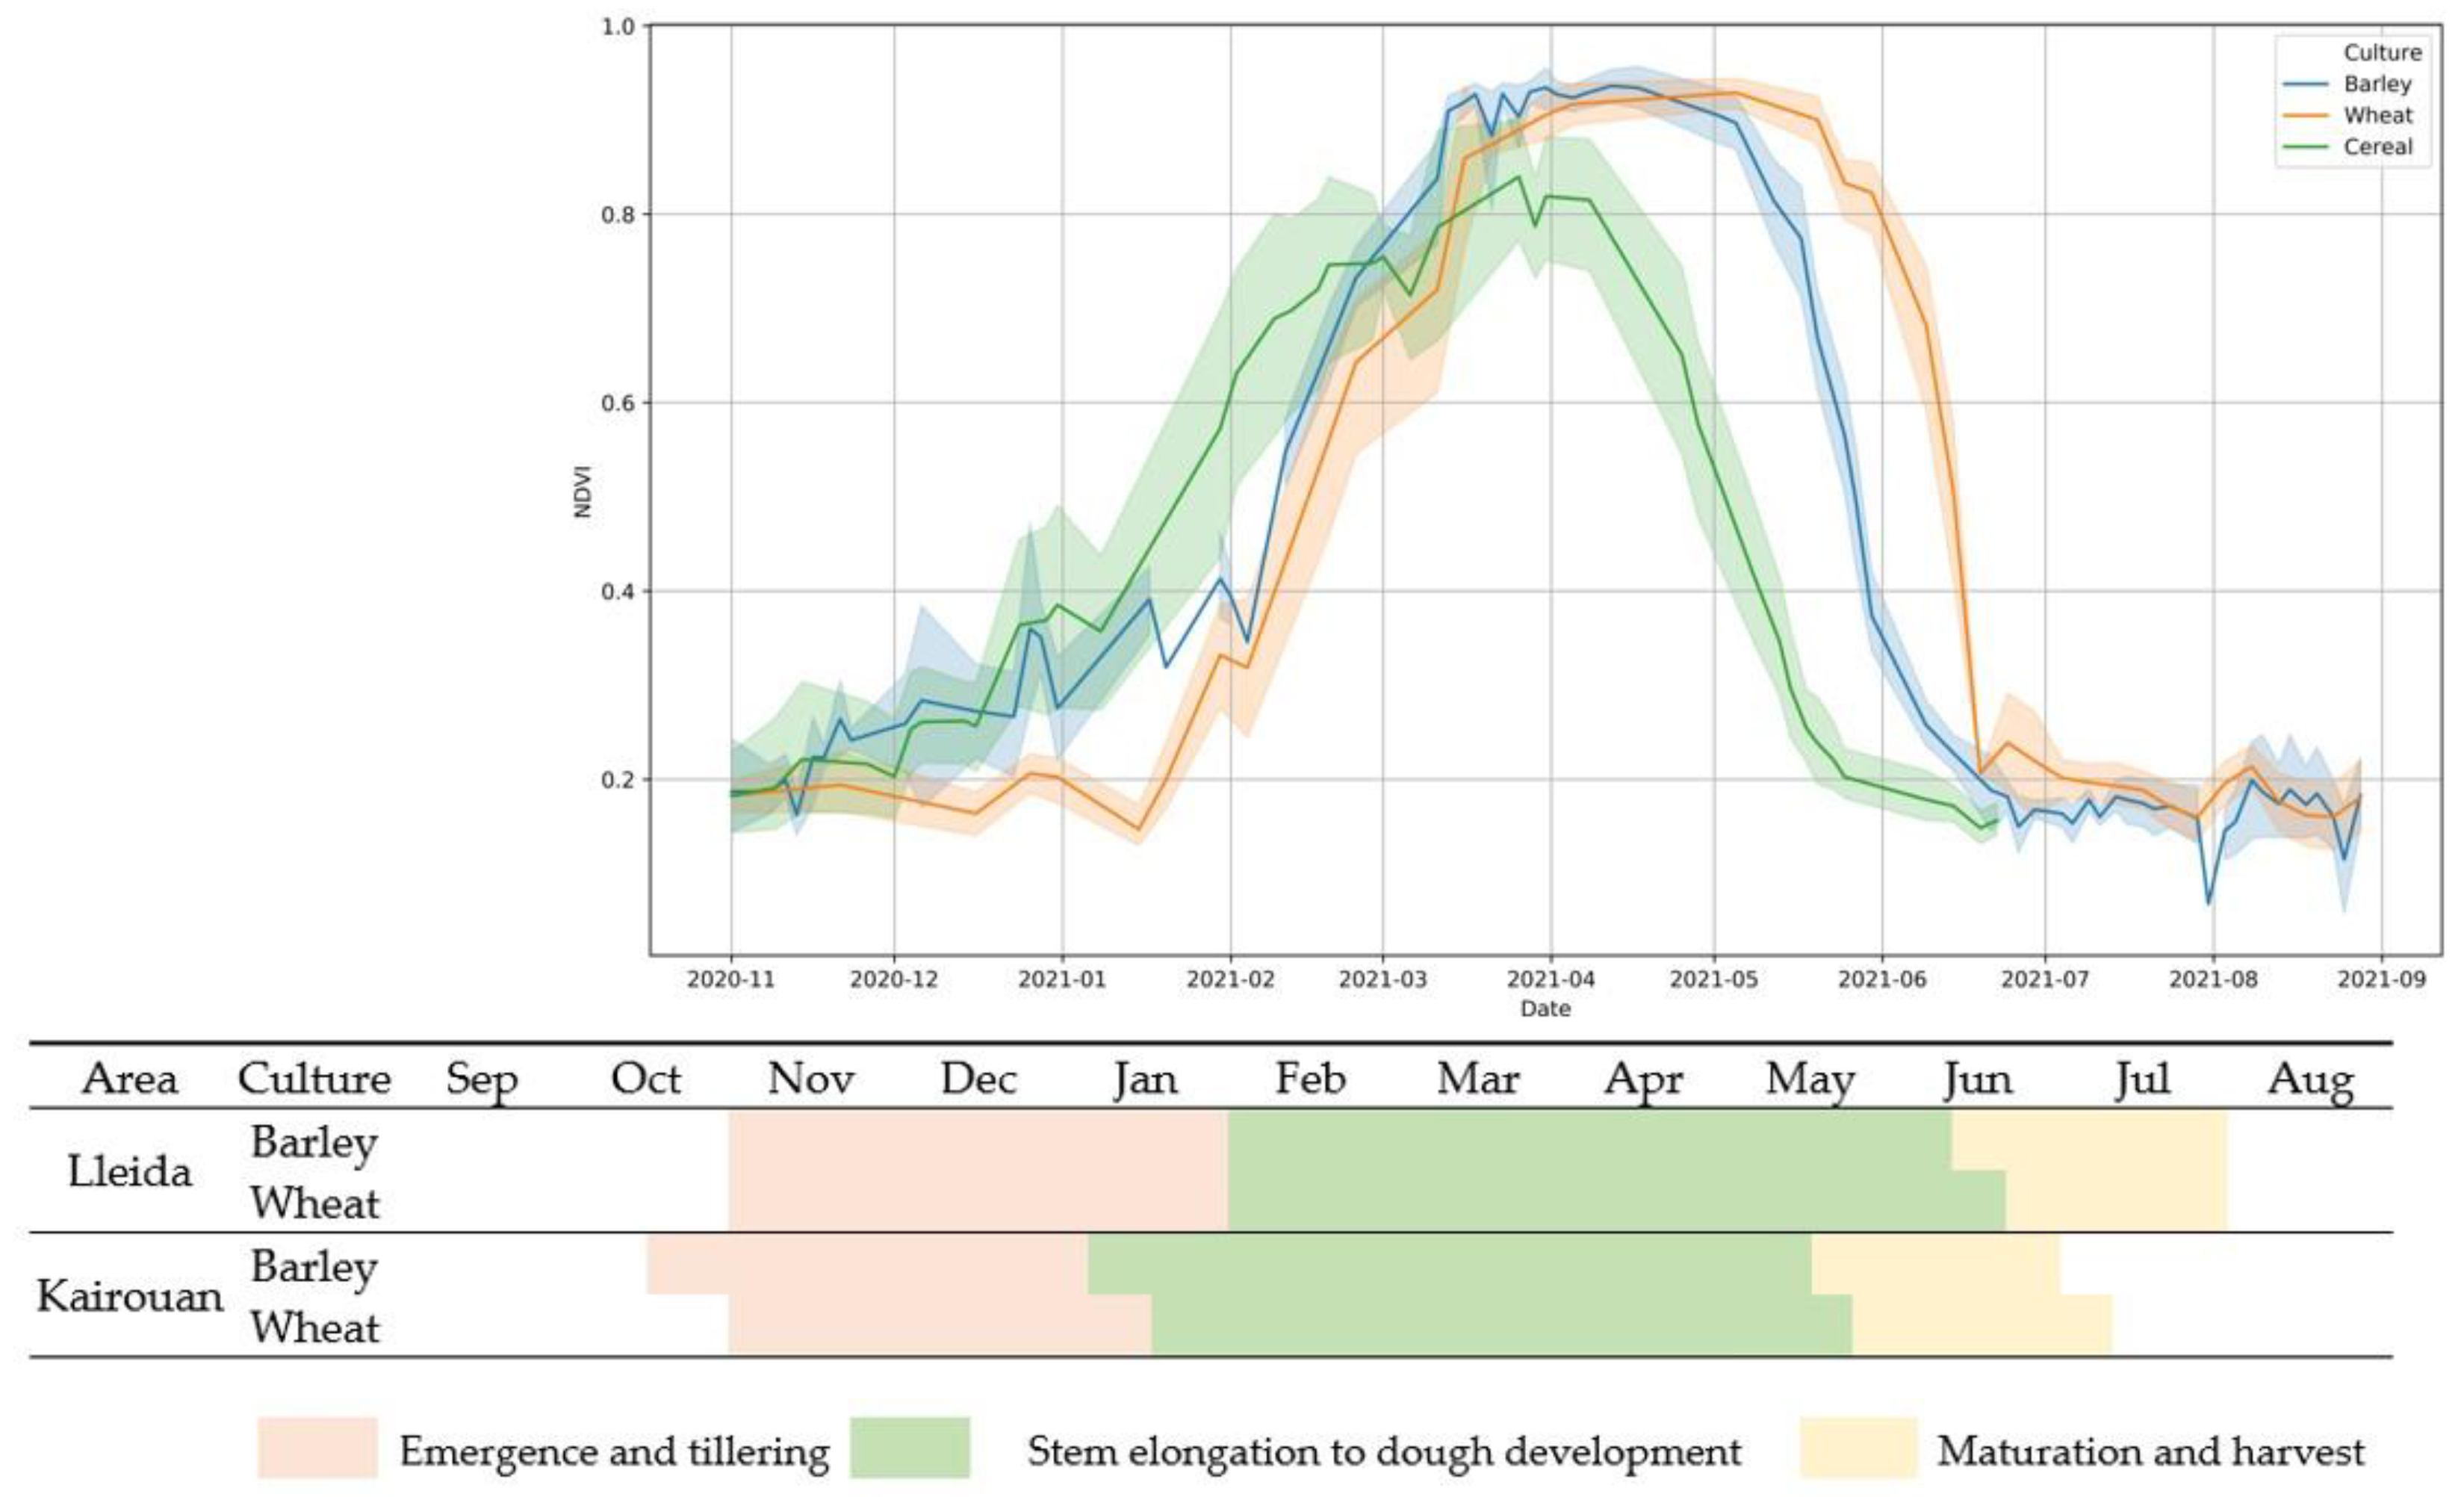
2.2.4. Remote Sensing Data
- a.
- Soil Moisture data
- b.
- NDVI
- c.
- ETP
- d.
- LST
2.3. Methods
- Soil Moisture Anomaly Index (SMAI)
- -
- If the SMAI < 0, i.e., the average SM of the month i is lower than the historical average SM of the same month, it can be a dry period.
- -
- If the SMAI > 0, i.e., the average SM of the month i is higher than the historical average SM of the same month, it can be a wet period due to rain or irrigation.
- Vegetation Anomaly Index (VAI)
- -
- If the VAI < 0, i.e., the average NDVI of the month i is lower than the historical average NDVI of the same month. Such conditions indicate that the plant is facing stress and may be going through a period of prolonged water stress or drought, which is characterized by limited rainfall or irrigation.
- -
- If the VAI > 0, i.e., the average NDVI of the month i is higher than the historical average NDVI of the same month, it is, therefore, a well-producing agricultural year. These conditions usually correspond to a wet period, suggesting that the plant is in good health.
- Evapotranspiration Anomaly Index (EAI)
- -
- If the EAI < 0, i.e., the average ETP of the month i is lower than the historical average ETP of the same month, the plant is in a stressful situation and may correspond to a period of drought or prolonged water stress (absence of rainfall or irrigation).
- -
- If the EAI > 0, i.e., the average ETP of the month i is higher than the historical average ETP of the same month, which indicates a productive agricultural year with good vegetative growth. These conditions typically coincide with a wet period, signaling that the plant is in good health.
- Inverse Temperature Anomaly Index (ITAI)
- -
- If the ITAI < 0, the average temperature of the month i is higher than the historical average temperature of the same month. So, it is a period of high temperature and may correspond to a dry period. The high temperatures can also correspond to the absence of vegetation or disease in the plant.
- -
- If the ITAI > 0, the temperature average of the month i is lower than the temperature historical average of the same month; it is, therefore, a period of low temperature that can correspond to a wet period.
3. Results
3.1. Drought Periods
- 2014/2015 in Lleida, where record-low barley and wheat production occurred;
- 2021/2022 in Kairouan, where despite the long dry period lasting most of the agricultural year, January and March rainfall significantly improved yields for both irrigated and rainfed crops.
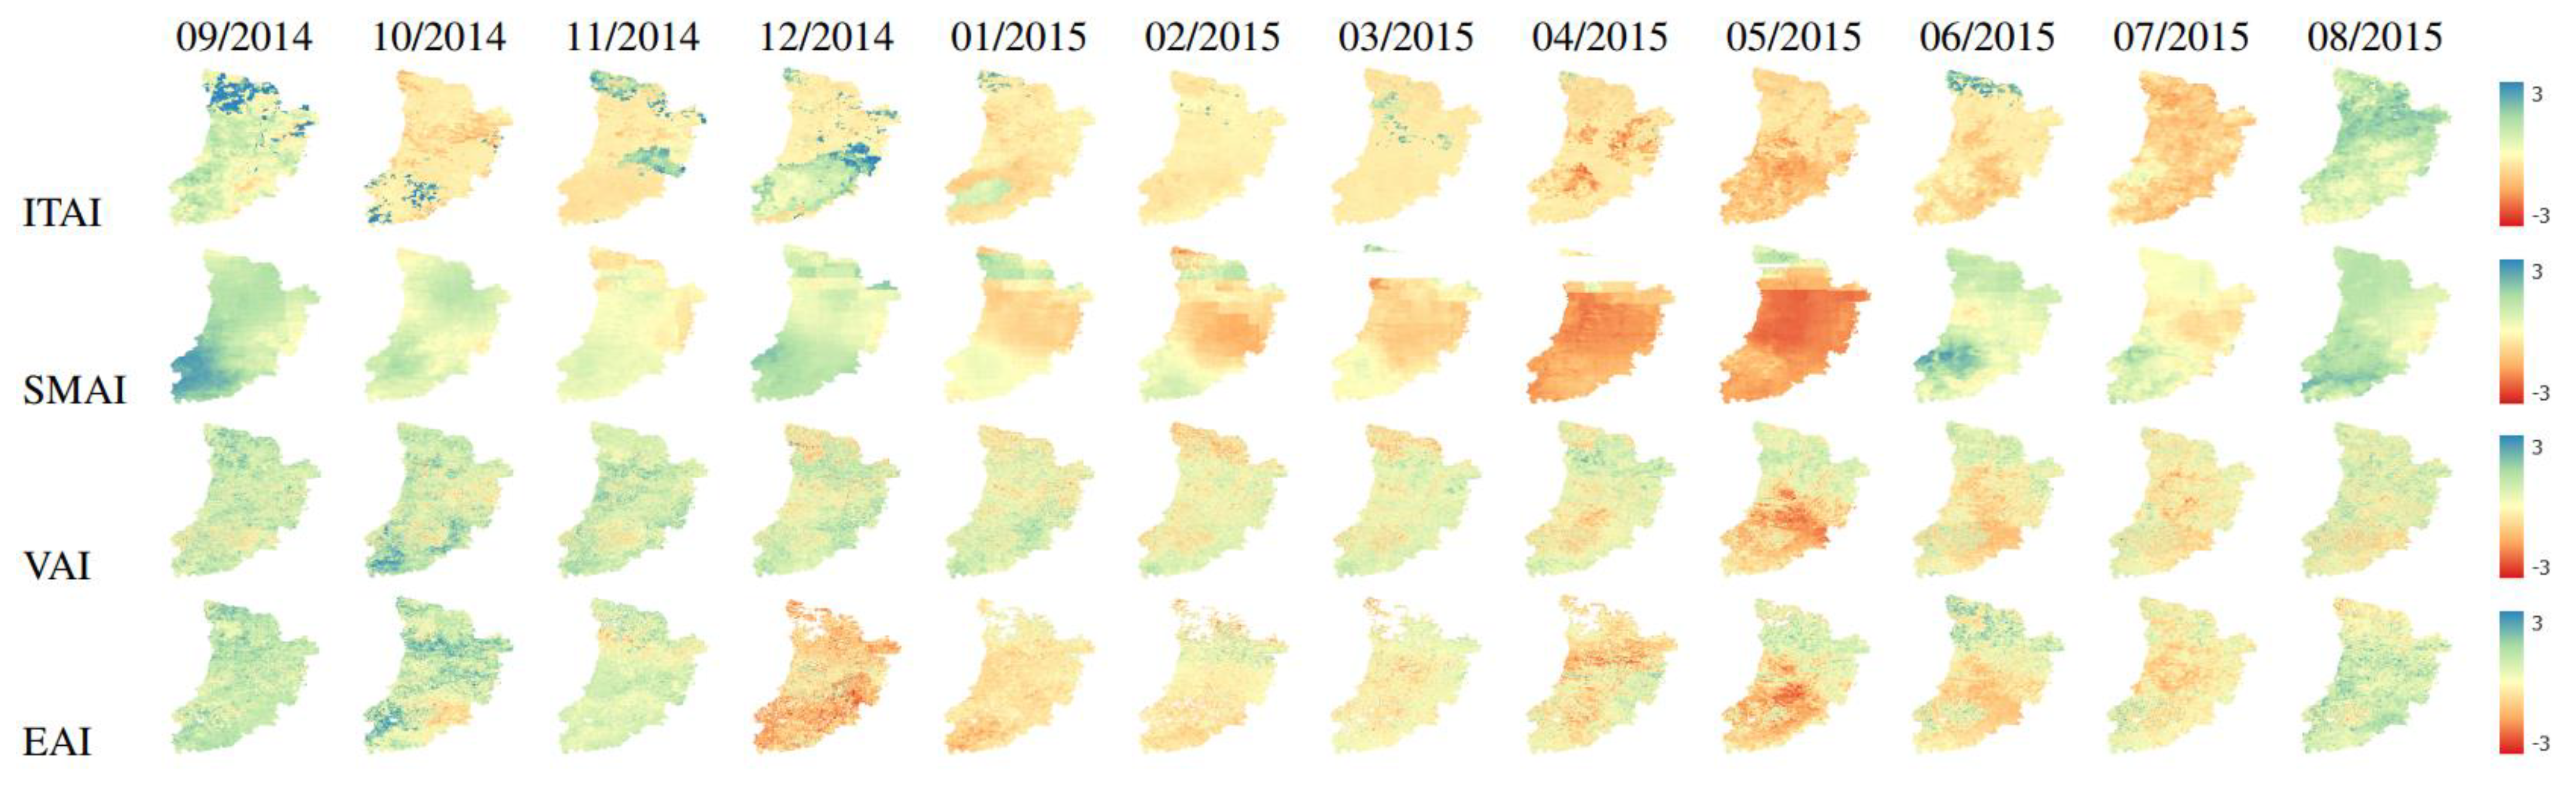
3.1.1. Case Study of Drought 2014/2015 in Lleida
3.1.2. Case Study of Drought 2021/2022 in Kairouan
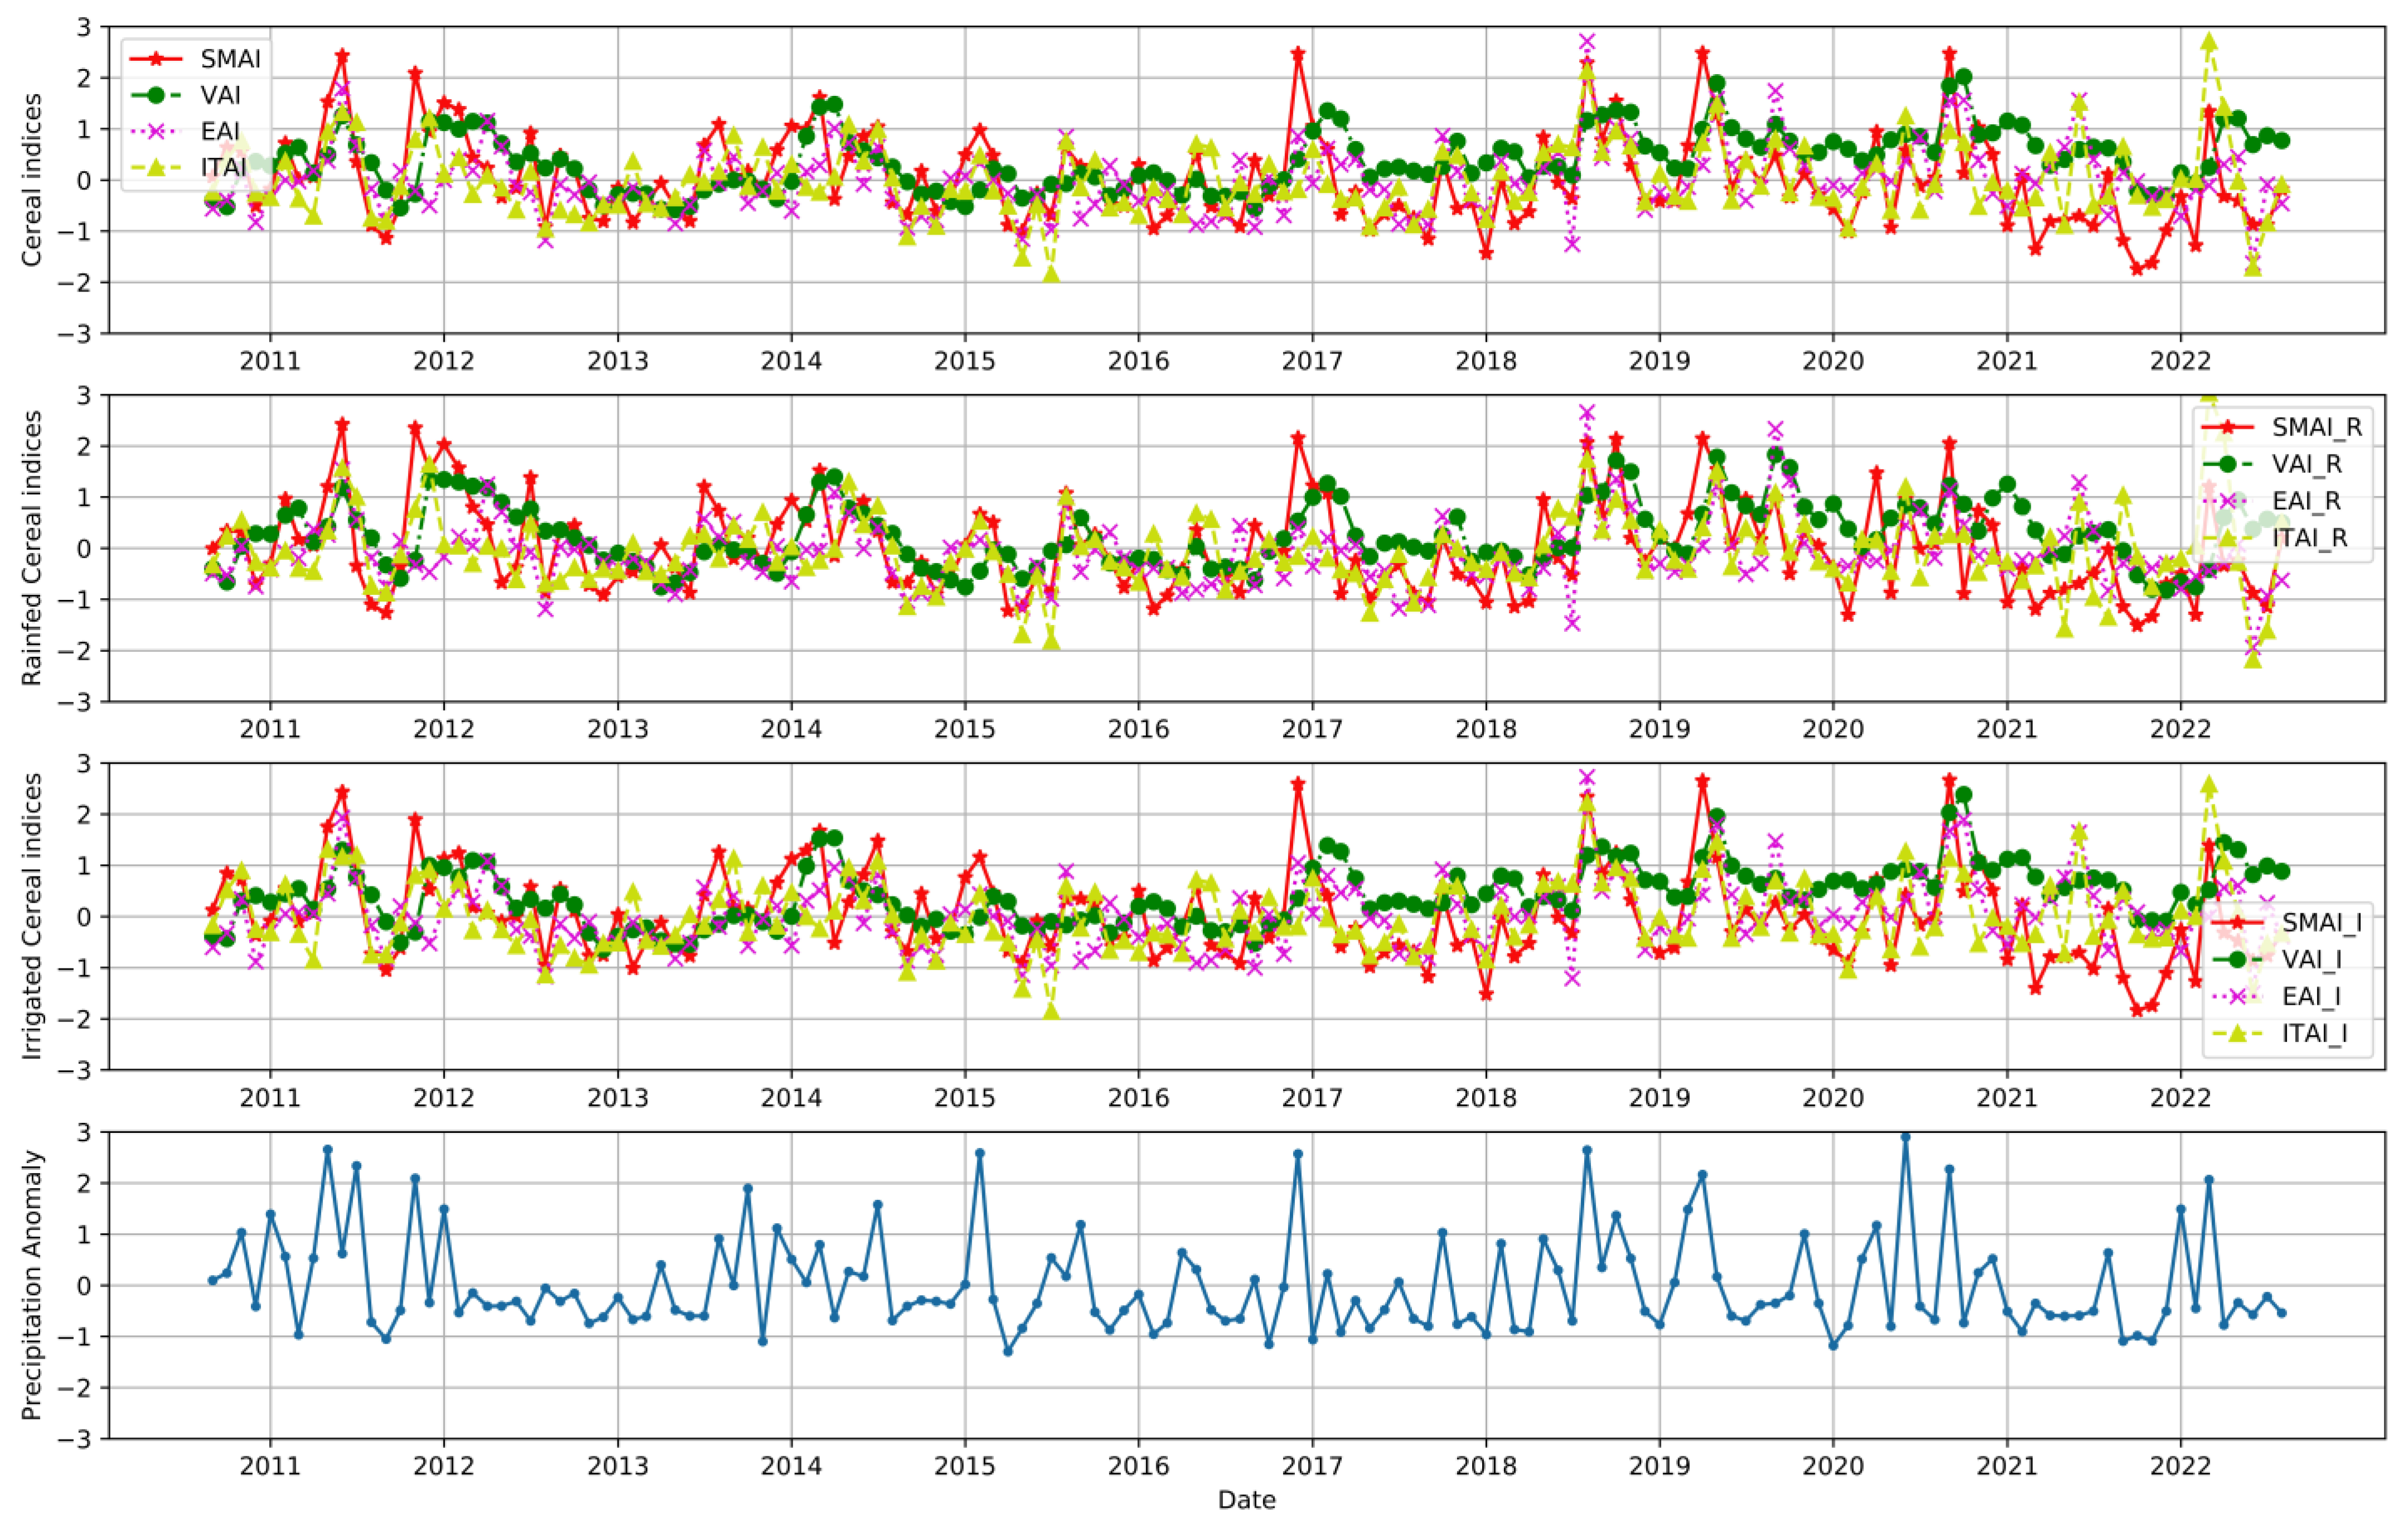
3.1.3. Cereal Drought Indices
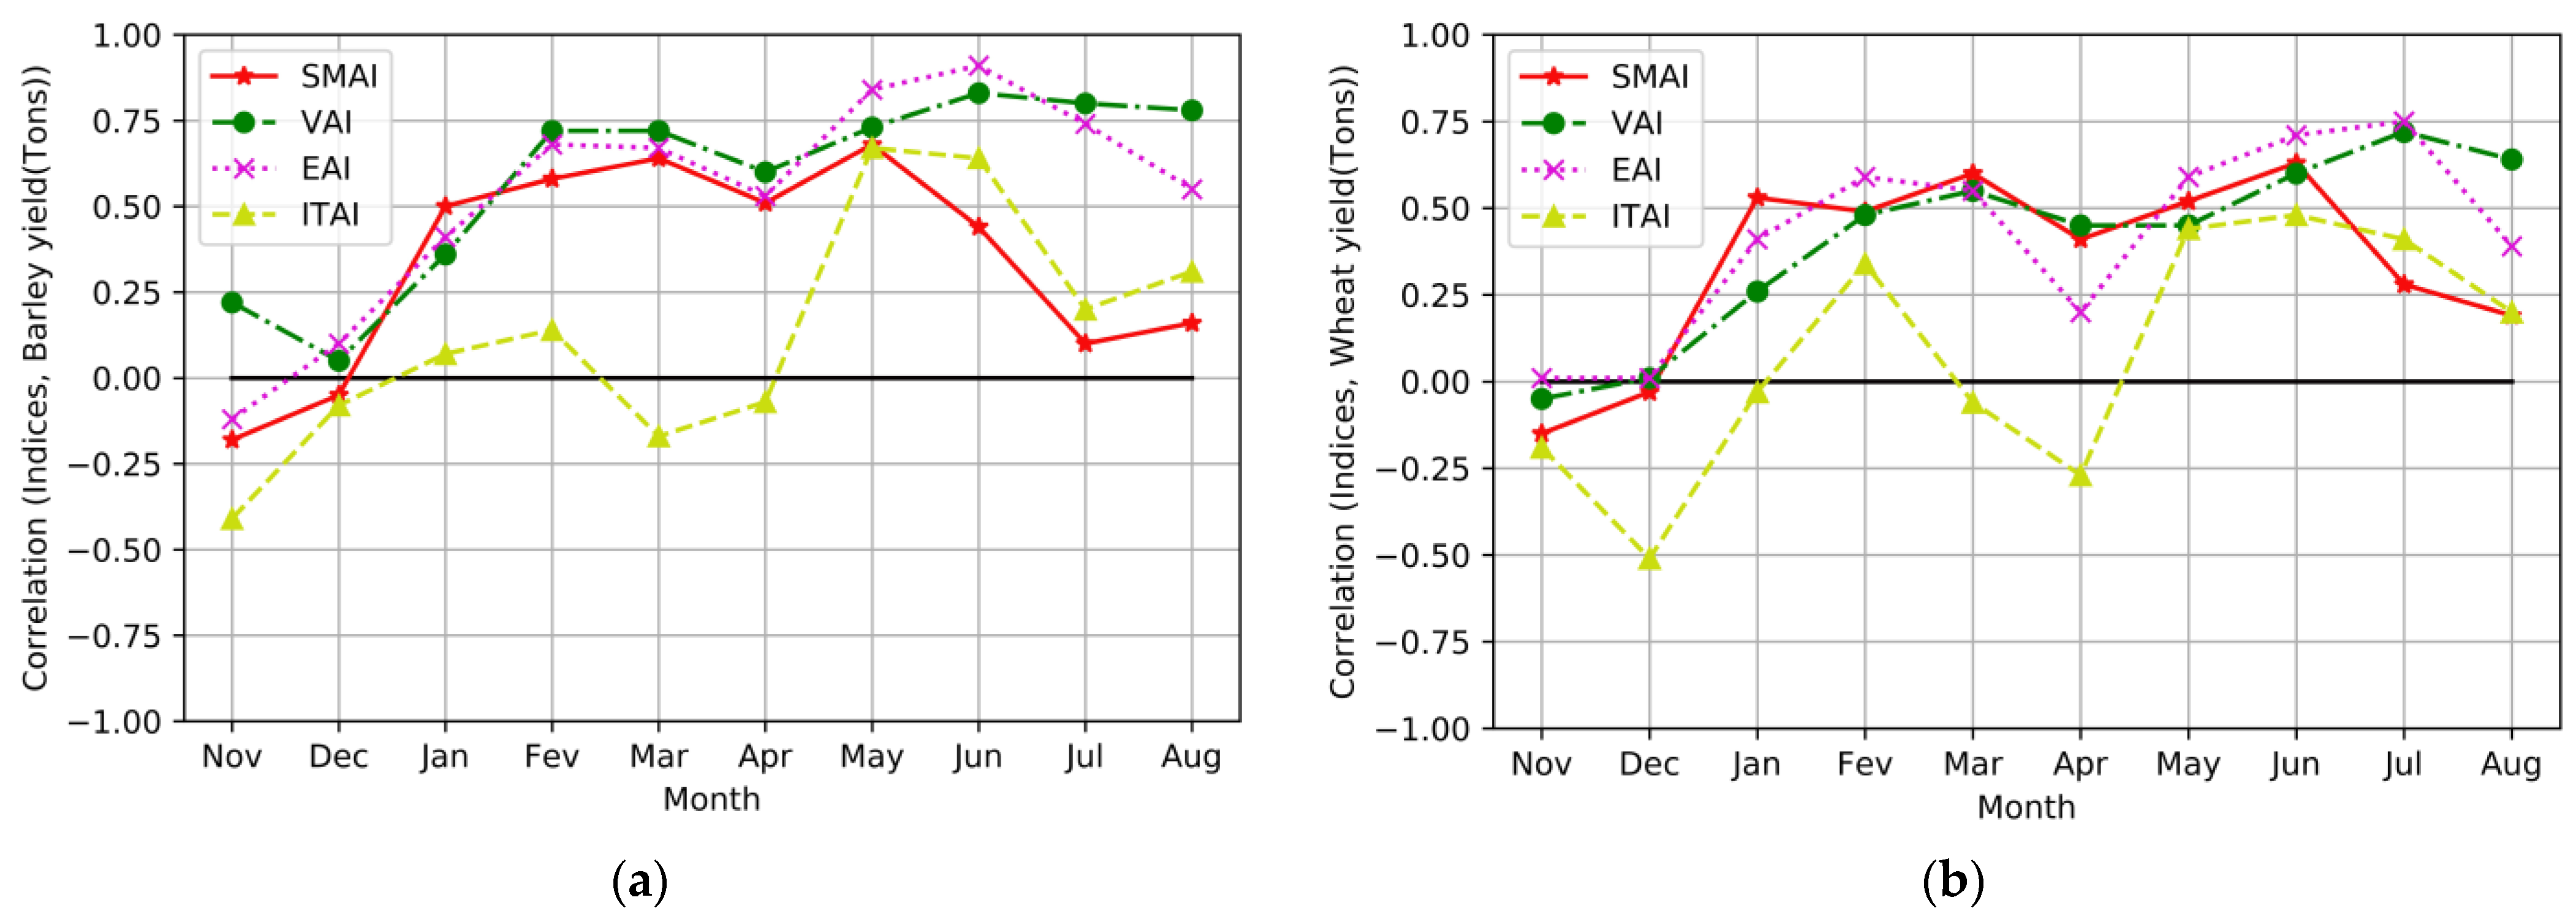
3.2. Correlation Analysis between Drought Indices and Cereal Yield
3.2.1. Lleida’s Correlation Results
3.2.2. Kairouan’s Correlation Results
4. Discussion
5. Conclusions
Author Contributions
Funding
Data Availability Statement
Acknowledgments
Conflicts of Interest
Appendix A

| Parameter | 09/2014 | 10/2014 | 11/2014 | 12/2014 | 01/2015 | 02/2015 | 03/2015 | 04/2015 | 05/2015 | 06/2015 | 07/2015 | 08/2015 | |
|---|---|---|---|---|---|---|---|---|---|---|---|---|---|
| Segrià | P (mm) | 118.6 | 21.4 | 108.4 | 11.1 | 16 | 19.6 | 29.6 | 8.6 | 2 | 40.9 | 29.7 | 19.1 |
| T max (°C) | 27.4 | 23.9 | 16.3 | 10 | 8.9 | 11.4 | 17.4 | 20.9 | 25.9 | 30 | 33.3 | 30.5 | |
| T min (°C) | 15.4 | 10.7 | 6.7 | 0.9 | −0.7 | −0.3 | 4.9 | 7 | 10.5 | 15 | 19.1 | 17.1 | |
| T mean (°C) | 21.4 | 17.3 | 11.5 | 5.5 | 4.1 | 5.6 | 11.2 | 14 | 18.2 | 22.5 | 26.2 | 23.8 | |
| Urgell | P (mm) | 29.9 | 32 | 88.5 | 13.1 | 11.4 | 13 | 20.6 | 23.1 | 3.8 | 35.7 | 35.4 | 29.2 |
| T max (°C) | 28.2 | 24.4 | 16.2 | 8.7 | 9.1 | 11.3 | 17.4 | 21.5 | 27.5 | 30.9 | 35.2 | 31.5 | |
| T min (°C) | 16.4 | 12.8 | 7.9 | 1.7 | 0.4 | 0.2 | 5.2 | 7.2 | 11.7 | 16 | 20.1 | 17.7 | |
| T mean (°C) | 22.3 | 18.6 | 12.1 | 5.2 | 4.8 | 5.8 | 11.3 | 14.4 | 19.6 | 23.5 | 27.7 | 24.6 |
| Parameter | 09/2021 | 10/2021 | 11/2021 | 12/2021 | 01/2022 | 02/2022 | 03/2022 | 04/2022 | 05/2022 | 06/2022 | 07/2022 | 08/2022 |
|---|---|---|---|---|---|---|---|---|---|---|---|---|
| P (mm) | - | 8 | 1.2 | 5.4 | 29 | 9 | 128.8 | 9.4 | 12.6 | 0.6 | 5 | 5.4 |
| T max (°C) | 41.5 | 36.9 | 33.1 | 25 | 25.9 | 28.5 | 26.5 | 31.8 | 41.9 | 46.6 | 48 | 47.6 |
| T min (°C) | 20.4 | 12.8 | 8.1 | 4.7 | 2.9 | 4.8 | 6.4 | 9.7 | 13.8 | 20.4 | 22 | 23.1 |
| T mean (°C) | 29.8 | 22.7 | 18.6 | 14.8 | 12.6 | 14.4 | 15.5 | 19 | 25 | 31.3 | 32.9 | 32.3 |
References
- Sivakumar, M.V.K.; Stefanski, R.; Bazza, M.; Zelaya, S.; Wilhite, D.; Magalhaes, A.R. High Level Meeting on National Drought Policy: Summary and Major Outcomes. Weather Clim. Extrem. 2014, 3, 126–132. [Google Scholar] [CrossRef]
- Van Hateren, T.C.; Chini, M.; Matgen, P.; Teuling, A.J. Ambiguous Agricultural Drought: Characterising Soil Moisture and Vegetation Droughts in Europe from Earth Observation. Remote Sens. 2021, 13, 1990. [Google Scholar] [CrossRef]
- Manning, C.; Widmann, M.; Bevacqua, E.; Loon, A.F.V.; Maraun, D.; Vrac, M. Soil Moisture Drought in Europe: A Compound Event of Precipitation and Potential Evapotranspiration on Multiple Time Scales. J. Hydrometeorol. 2018, 19, 1255–1271. [Google Scholar] [CrossRef]
- He, Q.-L.; Xiao, J.-L.; Shi, W.-Y. Responses of Terrestrial Evapotranspiration to Extreme Drought: A Review. Water 2022, 14, 3847. [Google Scholar] [CrossRef]
- Hazaymeh, K.; Hassan, Q.K. Remote Sensing of Agricultural Drought Monitoring: A State of Art Review. AIMS Environ. Sci. 2016, 3, 604–630. [Google Scholar] [CrossRef]
- Wakjira, M.T.; Peleg, N.; Anghileri, D.; Molnar, D.; Alamirew, T.; Six, J.; Molnar, P. Rainfall Seasonality and Timing: Implications for Cereal Crop Production in Ethiopia. Agric. For. Meteorol. 2021, 310, 108633. [Google Scholar] [CrossRef]
- MacCarthy, D.S.; Adam, M.; Freduah, B.S.; Fosu-Mensah, B.Y.; Ampim, P.A.Y.; Ly, M.; Traore, P.S.; Adiku, S.G.K. Climate Change Impact and Variability on Cereal Productivity among Smallholder Farmers under Future Production Systems in West Africa. Sustainability 2021, 13, 5191. [Google Scholar] [CrossRef]
- Verner, D.; Treguer, D.; Redwood, J.; Christensen, J.; McDonnell, R.; Elbert, C.; Konishi, Y. Climate Variability, Drought, and Drought Management in Tunisia’s Agricultural Sector; World Bank: Washington, DC, USA, 2018. [Google Scholar]
- Salvador, C.; Nieto, R.; Linares, C.; Díaz, J.; Gimeno, L. Quantification of the Effects of Droughts on Daily Mortality in Spain at Different Timescales at Regional and National Levels: A Meta-Analysis. Int. J. Environ. Res. Public Health 2020, 17, 6114. [Google Scholar] [CrossRef]
- Tramblay, Y.; Koutroulis, A.; Samaniego, L.; Vicente-Serrano, S.M.; Volaire, F.; Boone, A.; Le Page, M.; Llasat, M.C.; Albergel, C.; Burak, S.; et al. Challenges for Drought Assessment in the Mediterranean Region under Future Climate Scenarios. Earth-Sci. Rev. 2020, 210, 103348. [Google Scholar] [CrossRef]
- Wilhite, D.A.; Glantz, M.H. Understanding: The Drought Phenomenon: The Role of Definitions. Water Int. 1985, 10, 111–120. [Google Scholar] [CrossRef]
- Climate Change and Food Security: Risks and Responses; FAO: Rome, Italy, 2016; ISBN 978-92-5-108998-9.
- B6—3 Water Management and Climate Change | Climate Smart Agriculture Sourcebook | Food and Agriculture Organization of the United Nations. Available online: https://www.fao.org/climate-smart-agriculture-sourcebook/production-resources/module-b6-water/chapter-b6-3/en/ (accessed on 16 November 2021).
- Luo, T.; Young, R.; Reig, P. Aqueduct Projected Water Stress Country Rankings; Technical Note; World Resources Institute: Washington, DC, USA, 2015; Available online: https://www.wri.org/research/aqueduct-projected-water-stress-country-rankings (accessed on 17 March 2023).
- Climate Change 2022 Impacts, Adaptation and Vulnerability, 1st ed.; Cambridge University Press: Cambridge, UK, 2022; ISBN 978-1-00-932584-4.
- Lionello, P.; Scarascia, L. The Relation between Climate Change in the Mediterranean Region and Global Warming. Reg. Environ. Chang. 2018, 18, 1481–1493. [Google Scholar] [CrossRef]
- Neupane, D.; Adhikari, P.; Bhattarai, D.; Rana, B.; Ahmed, Z.; Sharma, U.; Adhikari, D. Does Climate Change Affect the Yield of the Top Three Cereals and Food Security in the World? Earth 2022, 3, 45–71. [Google Scholar] [CrossRef]
- Leroux, L.; Baron, C.; Zoungrana, B.; Traore, S.B.; Lo Seen, D.; Begue, A. Crop Monitoring Using Vegetation and Thermal Indices for Yield Estimates: Case Study of a Rainfed Cereal in Semi-Arid West Africa. IEEE J. Sel. Top. Appl. Earth Obs. Remote Sens. 2016, 9, 347–362. [Google Scholar] [CrossRef]
- Newton, A.C.; Johnson, S.N.; Gregory, P.J. Implications of Climate Change for Diseases, Crop Yields and Food Security. Euphytica 2011, 179, 3–18. [Google Scholar] [CrossRef]
- Park, S.; Im, J.; Han, D.; Rhee, J. Short-Term Forecasting of Satellite-Based Drought Indices Using Their Temporal Patterns and Numerical Model Output. Remote Sens. 2020, 12, 3499. [Google Scholar] [CrossRef]
- The Impact of Disasters and Crises on Agriculture and Food Security; FAO: Rome, Italy, 2021; ISBN 978-92-5-134071-4.
- Thome, K.; Smith, M.D.; Daugherty, K.; Rada, N.; Christensen, C.; Meade, B. International Food Security Assessment, 2019–2029; GFA-30; U.S. Department of Agriculture, Economic Research Service: Washington, DC, USA, 2019.
- Asseng, S.; Ewert, F.; Martre, P.; Rötter, R.P.; Lobell, D.B.; Cammarano, D.; Kimball, B.A.; Ottman, M.J.; Wall, G.W.; White, J.W.; et al. Rising Temperatures Reduce Global Wheat Production. Nat. Clim. Chang. 2015, 5, 143–147. [Google Scholar] [CrossRef]
- Anderson, M.C.; Zolin, C.A.; Sentelhas, P.C.; Hain, C.R.; Semmens, K.; Yilmaz, M.T.; Gao, F.; Otkin, J.A.; Tetrault, R. The Evaporative Stress Index as an Indicator of Agricultural Drought in Brazil: An Assessment Based on Crop Yield Impacts. Remote Sens. Environ. 2016, 174, 82–99. [Google Scholar] [CrossRef]
- Bouras, E.; Jarlan, L.; Khabba, S.; Er-Raki, S.; Dezetter, A.; Sghir, F.; Tramblay, Y. Assessing the Impact of Global Climate Changes on Irrigated Wheat Yields and Water Requirements in a Semi-Arid Environment of Morocco. Sci. Rep. 2019, 9, 19142. [Google Scholar] [CrossRef]
- Bento, V.A.; Ribeiro, A.F.S.; Russo, A.; Gouveia, C.M.; Cardoso, R.M.; Soares, P.M.M. The Impact of Climate Change in Wheat and Barley Yields in the Iberian Peninsula. Sci. Rep. 2021, 11, 15484. [Google Scholar] [CrossRef]
- Peña-Gallardo, M.; Vicente-Serrano, S.M.; Domínguez-Castro, F.; Beguería, S. The Impact of Drought on the Productivity of Two Rainfed Crops in Spain. Nat. Hazards Earth Syst. Sci. 2019, 19, 1215–1234. [Google Scholar] [CrossRef]
- Araneda-Cabrera, R.J.; Bermúdez, M.; Puertas, J. Assessment of the Performance of Drought Indices for Explaining Crop Yield Variability at the National Scale: Methodological Framework and Application to Mozambique. Agric. Water Manag. 2021, 246, 106692. [Google Scholar] [CrossRef]
- Kloos, S.; Yuan, Y.; Castelli, M.; Menzel, A. Agricultural Drought Detection with MODIS Based Vegetation Health Indices in Southeast Germany. Remote Sens. 2021, 13, 3907. [Google Scholar] [CrossRef]
- Bouras, E.H.; Jarlan, L.; Er-Raki, S.; Balaghi, R.; Amazirh, A.; Richard, B.; Khabba, S. Cereal Yield Forecasting with Satellite Drought-Based Indices, Weather Data and Regional Climate Indices Using Machine Learning in Morocco. Remote Sens. 2021, 13, 3101. [Google Scholar] [CrossRef]
- Rembold, F.; Atzberger, C.; Savin, I.; Rojas, O. Using Low Resolution Satellite Imagery for Yield Prediction and Yield Anomaly Detection. Remote Sens. 2013, 5, 1704–1733. [Google Scholar] [CrossRef]
- Wilhite, D.A.; Sivakumar, M.V.K.; Pulwarty, R. Managing Drought Risk in a Changing Climate: The Role of National Drought Policy. Weather Clim. Extrem. 2014, 3, 4–13. [Google Scholar] [CrossRef]
- McKee, T.B.; Doesken, N.J.; Kleist, J. The Relationship of Drought Frequency and Duration to Time Scales. In Proceedings of the 8th Conference on Applied Climatology, Anaheim, CA, USA, 17–22 January 1993. [Google Scholar]
- Palmer, W.C. Meteorological Drought; Weather Bureau Research Paper No. 45; U.S. Department of Commerce: Washington, DC, USA, 1965; 58p.
- Mishra, A.K.; Singh, V.P. Drought Modeling—A Review. J. Hydrol. 2011, 403, 157–175. [Google Scholar] [CrossRef]
- Wang, P.X.; Li, X.W.; Gong, J.Y. Conghe Song Vegetation Temperature Condition Index and Its Application for Drought Monitoring. In Proceedings of the IGARSS 2001—IEEE 2001 International Geoscience and Remote Sensing Symposium (Cat. No. 01CH37217), Sydney, NSW, Australia, 9–13 July 2001; Volume 1, pp. 141–143. [Google Scholar] [CrossRef]
- Kogan, F.N. Application of Vegetation Index and Brightness Temperature for Drought Detection. Adv. Space Res. 1995, 15, 91–100. [Google Scholar] [CrossRef]
- Heng, L.K.; Asseng, S.; Mejahed, K.; Rusan, M. Optimizing Wheat Productivity in Two Rain-Fed Environments of the West Asia–North Africa Region Using a Simulation Model. Eur. J. Agron. 2007, 26, 121–129. [Google Scholar] [CrossRef]
- Timmermans, B.G.H.; Vos, J.; Van Nieuwburg, J.; Stomph, T.J.; Van Der Putten, P.E.L. Germination Rates of Solanum Sisymbriifolium: Temperature Response Models, Effects of Temperature Fluctuations and Soil Water Potential. Seed Sci. Res. 2007, 17, 221–231. [Google Scholar] [CrossRef]
- Hatfield, J.L.; Prueger, J.H. Temperature Extremes: Effect on Plant Growth and Development. Weather Clim. Extrem. 2015, 10, 4–10. [Google Scholar] [CrossRef]
- Zhao, C.; Liu, B.; Piao, S.; Wang, X.; Lobell, D.B.; Huang, Y.; Huang, M.; Yao, Y.; Bassu, S.; Ciais, P.; et al. Temperature Increase Reduces Global Yields of Major Crops in Four Independent Estimates. Proc. Natl. Acad. Sci. USA 2017, 114, 9326–9331. [Google Scholar] [CrossRef]
- Agnolucci, P.; Rapti, C.; Alexander, P.; De Lipsis, V.; Holland, R.A.; Eigenbrod, F.; Ekins, P. Impacts of Rising Temperatures and Farm Management Practices on Global Yields of 18 Crops. Nat. Food 2020, 1, 562–571. [Google Scholar] [CrossRef]
- Hu, Q.; Willson, G.D. Effects of Temperature Anomalies on the Palmer Drought Severity Index in the Central United States. Int. J. Climatol. 2000, 20, 1899–1911. [Google Scholar] [CrossRef]
- Bouras, E.H.; Jarlan, L.; Er-Raki, S.; Albergel, C.; Richard, B.; Balaghi, R.; Khabba, S. Linkages between Rainfed Cereal Production and Agricultural Drought through Remote Sensing Indices and a Land Data Assimilation System: A Case Study in Morocco. Remote Sens. 2020, 12, 4018. [Google Scholar] [CrossRef]
- Singh, R.P.; Roy, S.; Kogan, F. Vegetation and Temperature Condition Indices from NOAA AVHRR Data for Drought Monitoring over India. Int. J. Remote Sens. 2003, 24, 4393–4402. [Google Scholar] [CrossRef]
- Zribi, M.; Nativel, S.; Le Page, M. Analysis of Agronomic Drought in a Highly Anthropogenic Context Based on Satellite Monitoring of Vegetation and Soil Moisture. Remote Sens. 2021, 13, 2698. [Google Scholar] [CrossRef]
- Kogan, F.N. Global Drought Watch from Space. Bull. Amer. Meteor. Soc. 1997, 78, 621–636. [Google Scholar] [CrossRef]
- Peters, A.J.; Walter-Shea, E.A.; Ji, L.; Viña, A.; Hayes, M.; Svoboda, M.D. Drought Monitoring with NDVI-Based Standardized Vegetation Index. Photogramm. Eng. 2002, 68, 71–75. [Google Scholar]
- Tucker, C.J. Red and Photographic Infrared Linear Combinations for Monitoring Vegetation. Remote Sens. Environ. 1979, 8, 127–150. [Google Scholar] [CrossRef]
- Amri, R.; Zribi, M.; Lili-Chabaane, Z.; Duchemin, B.; Gruhier, C.; Chehbouni, A. Analysis of Vegetation Behavior in a North African Semi-Arid Region, Using SPOT-VEGETATION NDVI Data. Remote Sens. 2011, 3, 2568–2590. [Google Scholar] [CrossRef]
- Le Page, M.; Zribi, M. Analysis and Predictability of Drought in Northwest Africa Using Optical and Microwave Satellite Remote Sensing Products. Sci. Rep. 2019, 9, 1466. [Google Scholar] [CrossRef] [PubMed]
- Reddy, G.P.O.; Kumar, N.; Sahu, N.; Srivastava, R.; Singh, S.K.; Naidu, L.G.K.; Chary, G.R.; Biradar, C.M.; Gumma, M.K.; Reddy, B.S.; et al. Assessment of Spatio-Temporal Vegetation Dynamics in Tropical Arid Ecosystem of India Using MODIS Time-Series Vegetation Indices. Arab J. Geosci. 2020, 13, 704. [Google Scholar] [CrossRef]
- Lorenz, D.J.; Otkin, J.A.; Svoboda, M.; Hain, C.R.; Anderson, M.C.; Zhong, Y. Predicting U.S. Drought Monitor States Using Precipitation, Soil Moisture, and Evapotranspiration Anomalies. Part I: Development of a Nondiscrete USDM Index. J. Hydrometeorol. 2017, 18, 1943–1962. [Google Scholar] [CrossRef]
- Anderson, M.C.; Norman, J.M.; Mecikalski, J.R.; Otkin, J.A.; Kustas, W.P. A Climatological Study of Evapotranspiration and Moisture Stress across the Continental United States Based on Thermal Remote Sensing: 2. Surface Moisture Climatology. J. Geophys. Res. 2007, 112, D11112. [Google Scholar] [CrossRef]
- Hobbins, M.T.; Wood, A.; McEvoy, D.J.; Huntington, J.L.; Morton, C.; Anderson, M.; Hain, C. The Evaporative Demand Drought Index. Part I: Linking Drought Evolution to Variations in Evaporative Demand. J. Hydrometeorol. 2016, 17, 1745–1761. [Google Scholar] [CrossRef]
- Idso, S.B.; Reginato, R.J.; Jackson, R.D.; Pinter, P.J. Measuring Yield-Reducing Plant Water Potential Depressions in Wheat by Infrared Thermometry. Irrig. Sci. 1981, 2, 205–212. [Google Scholar] [CrossRef]
- Moran, M.S.; Clarke, T.R.; Inoue, Y.; Vidal, A. Estimating Crop Water Deficit Using the Relation between Surface-Air Temperature and Spectral Vegetation Index. Remote Sens. Environ. 1994, 49, 246–263. [Google Scholar] [CrossRef]
- Zhang, J.; Mu, Q.; Huang, J. Assessing the Remotely Sensed Drought Severity Index for Agricultural Drought Monitoring and Impact Analysis in North China. Ecol. Indic. 2016, 63, 296–309. [Google Scholar] [CrossRef]
- Mu, Q.; Zhao, M.; Kimball, J.S.; McDowell, N.G.; Running, S.W. A Remotely Sensed Global Terrestrial Drought Severity Index. Bull. Am. Meteorol. Soc. 2013, 94, 83–98. [Google Scholar] [CrossRef]
- Anderson, M.C.; Hain, C.; Wardlow, B.; Pimstein, A.; Mecikalski, J.R.; Kustas, W.P. Evaluation of Drought Indices Based on Thermal Remote Sensing of Evapotranspiration over the Continental United States. J. Clim. 2011, 24, 2025–2044. [Google Scholar] [CrossRef]
- Narasimhan, B.; Srinivasan, R. Development and Evaluation of Soil Moisture Deficit Index (SMDI) and Evapotranspiration Deficit Index (ETDI) for Agricultural Drought Monitoring. Agric. For. Meteorol. 2005, 133, 69–88. [Google Scholar] [CrossRef]
- Zhang, A.; Jia, G. Monitoring Meteorological Drought in Semiarid Regions Using Multi-Sensor Microwave Remote Sensing Data. Remote Sens. Environ. 2013, 134, 12–23. [Google Scholar] [CrossRef]
- Hao, Z.; AghaKouchak, A. Multivariate Standardized Drought Index: A Parametric Multi-Index Model. Adv. Water Resour. 2013, 57, 12–18. [Google Scholar] [CrossRef]
- Bergman, K.H.; Sabol, P.; Miskus, D. Experimental indices for monitoring global drought conditions. In Proceedings of the 13th Annual Climate Diagnostics Workshop, Cambridge, MA, USA, 31 October–4 November 1988; Volume 31, pp. 190–197. [Google Scholar]
- Niu, J.; Chen, J.; Sun, L. Exploration of Drought Evolution Using Numerical Simulations over the Xijiang (West River) Basin in South China. J. Hydrol. 2015, 526, 68–77. [Google Scholar] [CrossRef]
- Wen, L.; Lin, C.A.; Wu, Z.; Lu, G.; Pomeroy, J.; Zhu, Y. Reconstructing Sixty Year (1950–2009) Daily Soil Moisture over the Canadian Prairies Using the Variable Infiltration Capacity Model. Can. Water Resour. J. 2011, 36, 83–102. [Google Scholar] [CrossRef]
- Amri, R.; Zribi, M.; Lili-Chabaane, Z.; Wagner, W.; Hasenauer, S. Analysis of C-Band Scatterometer Moisture Estimations Derived Over a Semiarid Region. IEEE Trans. Geosci. Remote Sens. 2012, 50, 2630–2638. [Google Scholar] [CrossRef]
- Tatar, O.; Cakalogullari, U.; Aykut Tonk, F.; Istipliler, D.; Karakoc, R. Effect of Drought Stress on Yield and Quality Traits of Common Wheat During Grain Filling Stage. Turk. J. Field Crops 2020, 25, 236–244. [Google Scholar] [CrossRef]
- Samarah, N.H. Effects of Drought Stress on Growth and Yield of Barley. Agron. Sustain. Dev. 2005, 25, 145–149. [Google Scholar] [CrossRef]
- Afshari-Behbahanizadeh, S.; Akbari, G.A.; Shahbazi, M.; Alahdadi, I.; Farahani, L.; Tabatabaee, S.A.; Ganji, M. Qualitative and Physical Properties of Barley Grains under Terminal Drought Stress Conditions. J. Agric. Sci. Technol. 2016, 18, 1303–1317. [Google Scholar]
- Mehraban, A.; Tobe, A.; Gholipouri, A.; Amiri, E.; Ghafari, A.; Rostaii, M. The Effects of Drought Stress on Yield, Yield Components, and Yield Stabilityat Different Growth Stages in Bread WheatCultivar (Triticum Aestivum L.). Pol. J. Environ. Stud. 2018, 28, 739–746. [Google Scholar] [CrossRef]
- Chen, X.; Mo, X.; Zhang, Y.; Sun, Z.; Liu, Y.; Hu, S.; Liu, S. Drought Detection and Assessment with Solar-Induced Chlorophyll Fluorescence in Summer Maize Growth Period over North China Plain. Ecol. Indic. 2019, 104, 347–356. [Google Scholar] [CrossRef]
- Sarto, M.V.M.; Sarto, J.R.W.; Rampim, L.; Rosset, J.S.; Bassegio, D.; da Costa, P.F.; Inagaki, A.M. Wheat Phenology and Yield under Drought: A Review. Aust. J. Crop Sci. 2017, 11, 941–946. [Google Scholar] [CrossRef]
- Becker-Reshef, I.; Vermote, E.; Lindeman, M.; Justice, C. A Generalized Regression-Based Model for Forecasting Winter Wheat Yields in Kansas and Ukraine Using MODIS Data. Remote Sens. Environ. 2010, 114, 1312–1323. [Google Scholar] [CrossRef]
- Zhang, X.; Obringer, R.; Wei, C.; Chen, N.; Niyogi, D. Droughts in India from 1981 to 2013 and Implications to Wheat Production. Sci. Rep. 2017, 7, 44552. [Google Scholar] [CrossRef]
- Modanesi, S.; Massari, C.; Camici, S.; Brocca, L.; Amarnath, G. Do Satellite Surface Soil Moisture Observations Better Retain Information About Crop-Yield Variability in Drought Conditions? Water Resour. Res. 2020, 56, e2019WR025855. [Google Scholar] [CrossRef]
- Idescat. Anuari Estadístic de Catalunya. Pluviometria. Precipitació Mensual. Comarques i Aran. 2021. Available online: https://www.idescat.cat/indicadors/?id=aec&n=15195&t=202100 (accessed on 15 May 2023).
- Paolini, G.; Escorihuela, M.J.; Merlin, O.; Sans, M.P.; Bellvert, J. Classification of Different Irrigation Systems at Field Scale Using Time-Series of Remote Sensing Data. IEEE J. Sel. Top. Appl. Earth Obs. Remote Sens. 2022, 15, 10055–10072. [Google Scholar] [CrossRef]
- Idescat. Anuari Estadístic de Catalunya. Producció Agrícola. Per Productes. Províncies. Available online: https://www.idescat.cat/indicadors/?id=aec&n=15424 (accessed on 16 March 2023).
- Vicente-Serrano, S.M.; Tomas-Burguera, M.; Beguería, S.; Reig, F.; Latorre, B.; Peña-Gallardo, M.; Luna, M.Y.; Morata, A.; González-Hidalgo, J.C. A High Resolution Dataset of Drought Indices for Spain. Data 2017, 2, 22. [Google Scholar] [CrossRef]
- Vicente-Serrano, S.M. Spatial and Temporal Analysis of Droughts in the Iberian Peninsula (1910–2000). Hydrol. Sci. J. 2006, 51, 83–97. [Google Scholar] [CrossRef]
- Vicente-Serrano, S.M.; Cuadrat, J.M. North Atlantic Oscillation Control of Droughts in North-East Spain: Evaluation since 1600 a.d. Clim. Chang. 2007, 85, 357–379. [Google Scholar] [CrossRef]
- Merzougui, A.; Slimani, M. Régionalisation Des Lois de Distribution Des Pluies Mensuelles En Tunisie. Hydrological Sciences Journal 2012, 57, 668–685. [Google Scholar] [CrossRef]
- Farhani, N.; Carreau, J.; Kassouk, Z.; Le Page, M.; Lili Chabaane, Z.; Boulet, G. Analysis of Multispectral Drought Indices in Central Tunisia. Remote Sens. 2022, 14, 1813. [Google Scholar] [CrossRef]
- Ben Mhenni, N.; Shinoda, M.; Nandintsetseg, B. Assessment of Drought Frequency, Severity, and Duration and Its Impacts on Vegetation Greenness and Agriculture Production in Mediterranean Dryland: A Case Study in Tunisia. Nat. Hazards 2021, 105, 2755–2776. [Google Scholar] [CrossRef]
- Leduc, C.; Ammar, S.B.; Favreau, G.; Beji, R.; Virrion, R.; Lacombe, G.; Tarhouni, J.; Aouadi, C.; Chelli, B.Z.; Jebnoun, N.; et al. Impacts of Hydrological Changes in the Mediterranean Zone: Environmental Modifications and Rural Development in the Merguellil Catchment, Central Tunisia/Un Exemple d’évolution Hydrologique En Méditerranée: Impacts Des Modifications Environnementales et Du Développement Agricole Dans Le Bassin-Versant Du Merguellil (Tunisie Centrale). Hydrol. Sci. J. 2007, 52, 1162–1178. [Google Scholar] [CrossRef]
- Ayari, E.; Kassouk, Z.; Lili-Chabaane, Z.; Baghdadi, N.; Bousbih, S.; Zribi, M. Cereal Crops Soil Parameters Retrieval Using L-Band ALOS-2 and C-Band Sentinel-1 Sensors. Remote Sens. 2021, 13, 1393. [Google Scholar] [CrossRef]
- Ayari, E.; Kassouk, Z.; Lili-Chabaane, Z.; Baghdadi, N.; Zribi, M. Investigation of Multi-Frequency SAR Data to Retrieve the Soil Moisture within a Drip Irrigation Context Using Modified Water Cloud Model. Sensors 2022, 22, 580. [Google Scholar] [CrossRef] [PubMed]
- Zribi, M.; Chahbi, A.; Shabou, M.; Lili-Chabaane, Z.; Duchemin, B.; Baghdadi, N.; Amri, R.; Chehbouni, A. Soil Surface Moisture Estimation over a Semi-Arid Region Using ENVISAT ASAR Radar Data for Soil Evaporation Evaluation. Hydrol. Earth Syst. Sci. 2011, 15, 345–358. [Google Scholar] [CrossRef]
- Chahbi, A.; Zribi, M.; Lili-Chabaane, Z.; Duchemin, B.; Shabou, M.; Mougenot, B.; Boulet, G. Estimation of the Dynamics and Yields of Cereals in a Semi-Arid Area Using Remote Sensing and the SAFY Growth Model. Int. J. Remote Sens. 2014, 35, 1004–1028. [Google Scholar] [CrossRef]
- Bousbih, S.; Zribi, M.; Lili-Chabaane, Z.; Baghdadi, N.; El Hajj, M.; Gao, Q.; Mougenot, B. Potential of Sentinel-1 Radar Data for the Assessment of Soil and Cereal Cover Parameters. Sensors 2017, 17, 2617. [Google Scholar] [CrossRef]
- SMOS—Earth Online. Available online: https://earth.esa.int/eogateway/missions/smos (accessed on 16 November 2021).
- Merlin, O.; Rudiger, C.; Al Bitar, A.; Richaume, P.; Walker, J.P.; Kerr, Y.H. Disaggregation of SMOS Soil Moisture in Southeastern Australia. IEEE Trans. Geosci. Remote Sens. 2012, 50, 1556–1571. [Google Scholar] [CrossRef]
- Escorihuela, M.J.; Quintana-Seguí, P. Comparison of Remote Sensing and Simulated Soil Moisture Datasets in Mediterranean Landscapes. Remote Sens. Environ. 2016, 180, 99–114. [Google Scholar] [CrossRef]
- Escorihuela, M.J.; Merlin, O.; Stefan, V.; Moyano, G.; Eweys, O.A.; Zribi, M.; Kamara, S.; Benahi, A.S.; Ebbe, M.A.B.; Chihrane, J.; et al. SMOS Based High Resolution Soil Moisture Estimates for Desert Locust Preventive Management. Remote Sens. Appl. Soc. Environ. 2018, 11, 140–150. [Google Scholar] [CrossRef]
- Merlin, O.; Escorihuela, M.J.; Mayoral, M.A.; Hagolle, O.; Al Bitar, A.; Kerr, Y. Self-Calibrated Evaporation-Based Disaggregation of SMOS Soil Moisture: An Evaluation Study at 3 Km and 100 m Resolution in Catalunya, Spain. Remote Sens. Environ. 2013, 130, 25–38. [Google Scholar] [CrossRef]
- Stefan, V.-G.; Merlin, O.; Escorihuela, M.-J.; Molero, B.; Chihrane, J.; Villar, J.M.; Er-Raki, S. Temporal Calibration of an Evaporation-Based Spatial Disaggregation Method of SMOS Soil Moisture Data. Remote Sens. 2020, 12, 1671. [Google Scholar] [CrossRef]
- Kamel, D. MOD13Q1 MODIS/Terra Vegetation Indices 16-Day L3 Global 250m SIN Grid V006. NASA EOSDIS Land Process. DAAC 2015. [Google Scholar] [CrossRef]
- Vermote, E.F.; El Saleous, N.Z.; Justice, C.O. Atmospheric Correction of MODIS Data in the Visible to Middle Infrared: First Results. Remote Sens. Environ. 2002, 83, 97–111. [Google Scholar] [CrossRef]
- Giglio, L.; Justice, C.; Boschetti, L.; Roy, D. MODIS/Terra+Aqua Burned Area Monthly L3 Global 500m SIN Grid V061. NASA EOSDIS Land Process. DAAC 2021. [Google Scholar] [CrossRef]
- Monteith, J.L. Evaporation and Environment. Symp. Soc. Exp. Biol. 1965, 19, 205–234. [Google Scholar]
- Wan, Z.; Hook, S.; Hulley, G. MOD11A2 MODIS/Terra Land Surface Temperature/Emissivity 8-Day L3 Global 1km SIN Grid V006. NASA EOSDIS Land Process. DAAC 2015. [Google Scholar] [CrossRef]
- Grubbs, F.E. Procedures for Detecting Outlying Observations in Samples. Technometrics 1969, 11, 1–21. [Google Scholar] [CrossRef]
- Nettleton, D. Selection of Variables and Factor Derivation. In Commercial Data Mining; Elsevier: Amsterdam, The Netherlands, 2014; pp. 79–104. ISBN 978-0-12-416602-8. [Google Scholar]
- Climatologie de l’Année 2022 à Kairouan—Infoclimat. Available online: https://www.infoclimat.fr/climatologie/annee/2022/kairouan/valeurs/60735.html (accessed on 16 May 2023).
- Yang, M.; Wang, G.; Lazin, R.; Shen, X.; Anagnostou, E. Impact of Planting Time Soil Moisture on Cereal Crop Yield in the Upper Blue Nile Basin: A Novel Insight towards Agricultural Water Management. Agric. Water Manag. 2021, 243, 106430. [Google Scholar] [CrossRef]
- Gandía, M.L.; Del Monte, J.P.; Tenorio, J.L.; Santín-Montanyá, M.I. The Influence of Rainfall and Tillage on Wheat Yield Parameters and Weed Population in Monoculture versus Rotation Systems. Sci. Rep. 2021, 11, 22138. [Google Scholar] [CrossRef] [PubMed]
- Chahbi Bellakanji, A.; Zribi, M.; Lili-Chabaane, Z.; Mougenot, B. Forecasting of Cereal Yields in a Semi-Arid Area Using the Simple Algorithm for Yield Estimation (SAFY) Agro-Meteorological Model Combined with Optical SPOT/HRV Images. Sensors 2018, 18, 2138. [Google Scholar] [CrossRef] [PubMed]
- Páscoa, P.; Gouveia, C.M.; Russo, A.; Trigo, R.M. The Role of Drought on Wheat Yield Interannual Variability in the Iberian Peninsula from 1929 to 2012. Int. J. Biometeorol. 2017, 61, 439–451. [Google Scholar] [CrossRef] [PubMed]


| Variable | Data | Time Resolution | Spatial Resolution |
|---|---|---|---|
| SM | DISPATCh SM | 1 day | 1 km |
| NDVI | MOD13Q1 | 16 days | 250 m |
| ETP | MOD16A2 | 16 days | 500 m |
| LST | MOD11A2 | 8 days | 1 km |
| Cereal | Month | SMAI | VAI | EAI | ITAI | ||||
|---|---|---|---|---|---|---|---|---|---|
| R | std | R | std | R | std | R | std | ||
| Barley | November | −0.18 | 32.37 | 0.22 | 56.57 | −0.12 | 35.76 | −0.41 | 43.76 |
| December | −0.05 | 33.43 | 0.05 | 58.00 | 0.10 | 63.35 | −0.08 | 47.58 | |
| January | 0.50 | 29.12 | 0.36 | 51.88 | 0.41 | 39.11 | 0.07 | 82.40 | |
| February | 0.58 | 28.65 | 0.72 | 31.59 | 0.68 | 23.69 | 0.14 | 31.59 | |
| March | 0.64 | 26.69 | 0.72 | 34.70 | 0.67 | 29.65 | −0.17 | 28.12 | |
| April | 0.51 | 28.88 | 0.60 | 51.12 | 0.53 | 43.23 | −0.07 | 44.63 | |
| May | 0.68 | 25.83 | 0.73 | 31.43 | 0.84 | 28.87 | 0.67 | 27.94 | |
| June | 0.44 | 32.08 | 0.83 | 30.08 | 0.91 | 18.18 | 0.64 | 28.67 | |
| July | 0.10 | 37.52 | 0.80 | 30.78 | 0.74 | 32.39 | 0.20 | 41.92 | |
| August | 0.16 | 36.26 | 0.78 | 33.11 | 0.55 | 30.68 | 0.31 | 39.24 | |
| Wheat | November | −0.15 | 16.04 | −0.05 | 31.46 | 0.01 | 17.36 | −0.19 | 22.31 |
| December | −0.03 | 16.25 | 0.01 | 28.92 | 0.01 | 32.53 | −0.51 | 20.36 | |
| January | 0.53 | 13.67 | 0.26 | 26.07 | 0.41 | 19.98 | −0.03 | 38.49 | |
| February | 0.49 | 14.35 | 0.48 | 18.18 | 0.59 | 12.75 | 0.34 | 14.12 | |
| March | 0.60 | 13.36 | 0.55 | 21.22 | 0.55 | 16.45 | −0.06 | 14.18 | |
| April | 0.41 | 14.78 | 0.45 | 27.00 | 0.20 | 23.86 | −0.27 | 18.08 | |
| May | 0.52 | 15.25 | 0.45 | 21.57 | 0.59 | 21.38 | 0.44 | 16.50 | |
| June | 0.63 | 13.92 | 0.60 | 24.13 | 0.71 | 17.10 | 0.48 | 15.69 | |
| July | 0.28 | 17.48 | 0.72 | 19.83 | 0.75 | 16.78 | 0.41 | 17.65 | |
| August | 0.19 | 18.55 | 0.64 | 22.38 | 0.39 | 18.41 | 0.20 | 19.82 | |
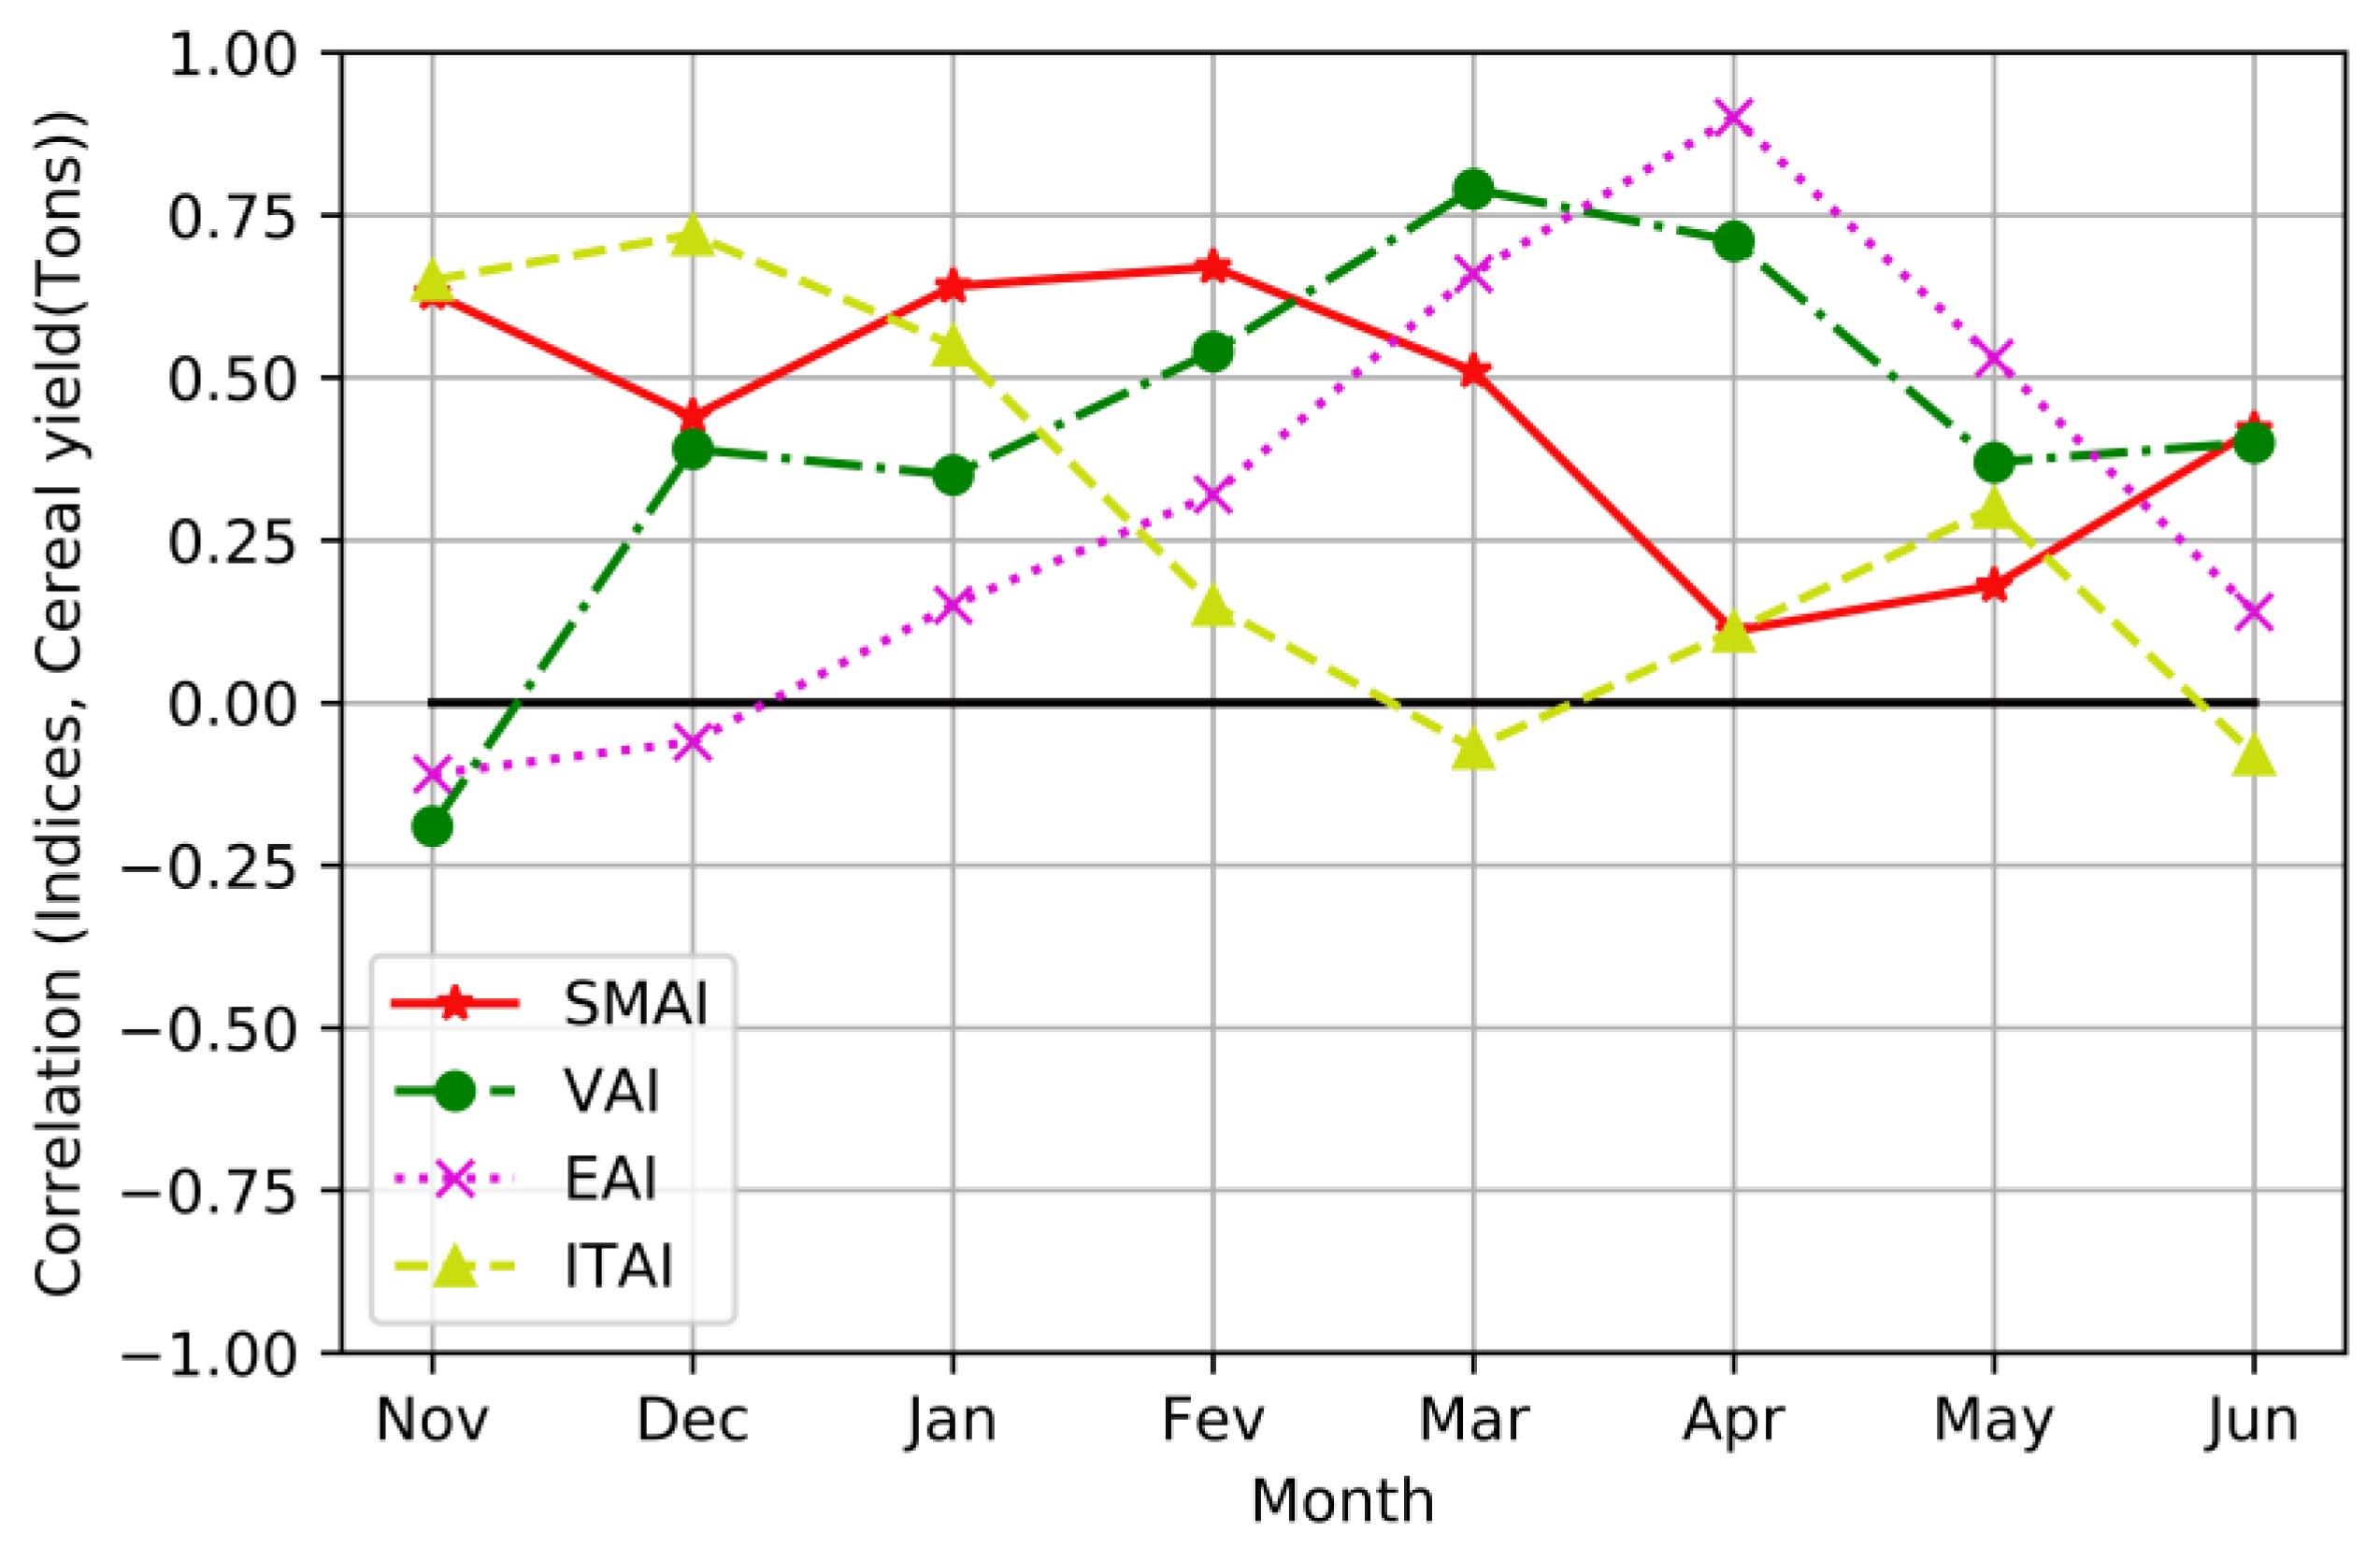
| Month | SMAI | VAI | EAI | ITAI | ||||
|---|---|---|---|---|---|---|---|---|
| R | std | R | std | R | std | R | std | |
| November | 0.63 | 14.03 | −0.19 | 30.41 | −0.11 | 37.01 | 0.65 | 18.99 |
| December | 0.44 | 15.88 | 0.39 | 28.24 | −0.06 | 39.69 | 0.72 | 26.47 |
| January | 0.64 | 15.24 | 0.35 | 29.64 | 0.15 | 64.13 | 0.55 | 35.14 |
| February | 0.67 | 13.88 | 0.54 | 27.57 | 0.32 | 50.14 | 0.15 | 39.18 |
| March | 0.51 | 16.23 | 0.79 | 20.32 | 0.66 | 64.19 | −0.07 | 19.29 |
| April | 0.11 | 18.50 | 0.71 | 19.10 | 0.90 | 13.43 | 0.11 | 26.18 |
| May | 0.18 | 18.54 | 0.37 | 23.54 | 0.53 | 18.26 | 0.30 | 17.65 |
| June | 0.42 | 16.54 | 0.40 | 28.05 | 0.14 | 18.03 | −0.08 | 17.69 |
Disclaimer/Publisher’s Note: The statements, opinions and data contained in all publications are solely those of the individual author(s) and contributor(s) and not of MDPI and/or the editor(s). MDPI and/or the editor(s) disclaim responsibility for any injury to people or property resulting from any ideas, methods, instructions or products referred to in the content. |
© 2023 by the authors. Licensee MDPI, Basel, Switzerland. This article is an open access article distributed under the terms and conditions of the Creative Commons Attribution (CC BY) license (https://creativecommons.org/licenses/by/4.0/).
Share and Cite
Khlif, M.; Escorihuela, M.J.; Chahbi Bellakanji, A.; Paolini, G.; Lili Chabaane, Z. Remotely Sensed Agriculture Drought Indices for Assessing the Impact on Cereal Yield. Remote Sens. 2023, 15, 4298. https://doi.org/10.3390/rs15174298
Khlif M, Escorihuela MJ, Chahbi Bellakanji A, Paolini G, Lili Chabaane Z. Remotely Sensed Agriculture Drought Indices for Assessing the Impact on Cereal Yield. Remote Sensing. 2023; 15(17):4298. https://doi.org/10.3390/rs15174298
Chicago/Turabian StyleKhlif, Manel, Maria José Escorihuela, Aicha Chahbi Bellakanji, Giovanni Paolini, and Zohra Lili Chabaane. 2023. "Remotely Sensed Agriculture Drought Indices for Assessing the Impact on Cereal Yield" Remote Sensing 15, no. 17: 4298. https://doi.org/10.3390/rs15174298