Article

Comparative Analysis of Gully Morphology Extraction Suitability Using Unmanned Aerial Vehicle and Google Earth Imagery

1
Shaanxi Key Laboratory Earth Surface System and Environmental Carrying Capacity, College of Urban and Environmental Sciences, Northwest University, Xi’an 710127, China
2
Key Laboratory of Ecohydrology and Disaster Prevention in Arid Regions, National Forestry and Grassland Administration, Xi’an 710048, China
*
Author to whom correspondence should be addressed.
Remote Sens. 2023, 15(17), 4302; https://doi.org/10.3390/rs15174302
Submission received: 13 July 2023 / Revised: 29 August 2023 / Accepted: 29 August 2023 / Published: 31 August 2023

Abstract

:
Gully erosion is considered to be a highly destructive form of soil erosion, often leading to the occurrence of natural calamities like landslides and mudslides. Remote sensing images have been extensively utilized in gully erosion research, and the suitability of extracting gully morphology parameters in various topographic regions needs to be clarified. Based on field measurements, this paper focuses on two widely used high-resolution remote sensing images: Unmanned Aerial Vehicle (UAV) and Google Earth (GE) imagery. It systematically examines the accuracy of gully morphological characteristic extraction using remote sensing in two regions with different terrain characteristics. The results show the following: (1) Compared to interpreting wide gullies with unclear shoulder lines, centimeter-level UAV imagery is more suitable for interpreting narrow gullies with clear shoulder lines. Conversely, the interpretability of sub-meter-level GE imagery is exactly the opposite. (2) The error in interpreting gully head points (GHPs) based on UAV images is less than 1 m, while the errors in gully length (GL), width (GW), perimeter (GP) and area (GA) are all below 3%, and these errors are hardly affected by gully morphology. (3) The error of GHPs based on GE images is concentrated within the range of 1–3 m. Meanwhile, the errors associated with GL, GP and GA are less than 10%. Conversely, the error of GW exceeds 11%. Furthermore, the aforementioned errors tend to increase as the gully width decreases and the complexity of the gully shoulder line increases. These findings shed light on the suitability of two commonly used remote sensing images for gully morphology extraction and provide valuable guidance for image selection in future research endeavors in this field.

1. Introduction

Gully erosion is a globally prevalent phenomenon that exerts a significant destructive force on Earth’s surface [1]. Gully occurrence and the development process are often related to the spalling and collapse of soil on various scales [2]. Gullies are active channels that are strongly linked to human activities, which pose a substantial threat to soil and ecological environment quality [3,4,5], and often accompany and trigger natural disasters such as landslides and mudslides. The rapid and accurate acquisition of multi-dimensional gully morphology is crucial for evaluating gully erosion [6,7]. Remote sensing imaging is an important data source for addressing this issue, and the systematic evaluation of its suitability is a key challenge.
A gully refers to a channel with a certain width and depth that normal tillage cannot pass through [8]. The cross-sectional area (CSA) of a gully is typically above 1 ft2 (0.093 m2) [9,10], and its morphology can be characterized by multiple dimensions such as gully head point (GHP), gully length (GL), gully width (GW), gully perimeter (GP), gully area (GA), gully depth (GD) and gully volume (GV) [11,12]. Determining the initial position of a gully is a crucial step in studying its occurrence patterns and retreat rate [13]. Gully morphology, including GL, GW, GD, GP, GA and GV, is strongly associated with the process of gully erosion evolution [7]. These parameters provide valuable insights into comprehending the current gully erosion status and its hazards, as well as facilitating the identification of effective mitigation strategies.
In previous studies, the acquisition of gully morphological characteristics primarily involved on-site surveys and measurements using erosion pins, total stations, or the Global Positioning System (GPS) [13,14,15,16]. While this method provides the most direct and accurate information about erosion gullies, it is typically costly and impractical for large-scale gully erosion research. However, advancements in satellite remote sensing technology and aerial photogrammetry have enabled the acquisition of numerous images from aerospace and aerial remote sensing, with spatial resolutions reaching sub-meter or even centimeter levels [17,18]. Notably, Unmanned Aerial Vehicle (UAV) photogrammetry can also provide high-precision elevation data and generate Digital Surface Models (DSMs) for similar research purposes [12]. The advancements in technology have eliminated the necessity of solely relying on field survey methods for acquiring morphological information about gullies [12,13]. This can now be accomplished via the automated extraction of parameters such as GHPs and GL using a high-precision Digital Elevation Model (DEM) [11,19,20]. Alternatively, parameters like GHPs, GL, GW, GD, GP and GA can be visually obtained by utilizing multi-source remote sensing images [21,22,23]. With continuous improvement in the quality of remote sensing images, their application advantages on various scales are becoming increasingly prominent. After comprehensively considering factors such as research costs and accuracy requirements, an increasing number of researchers are choosing to utilize high-resolution images for extracting gully morphological information.
Obviously, the quality of the selected remote sensing images and DEM data in the study will significantly interfere with the results. The research demonstrates that using a very-high-resolution DEM can result in an overestimation of the gully extent due to increased local positional errors in gully mapping [24]. On the other hand, if the resolution is too low, the range of gullies may be underestimated, and the mapping accuracy may be compromised by the morphological characteristics of the gullies. Regarding remote sensing images, as the resolution improves, the derived morphological information of the gullies becomes more detailed, thus enhancing the accuracy of visual interpretation. Gully length is the most accessible morphological information through visual interpretation in remote sensing images. The research demonstrated that using Advanced Land Observing Satellite (Alos) images with a spatial resolution of 2.5 m, only fuzzy traces of gullies could be identified [25]. However, when combined with other auxiliary data, it was possible to extract the optimal GL [26]. On the other hand, the accuracy of GF-1 image extraction with a resolution of 2 m reached more than 90% [27]. With the spatial resolution of remote sensing images being greater than 2 m, the extraction accuracy of GL is significantly improved, enabling reliable extraction of gully morphological parameters with more complex dimensions. For instance, an aerial photograph with a resolution of 1.2 m can be utilized to interpret the boundary of the gully [28]. With a QuickBird (QB) image of 0.61 m resolution, the visual interpretation error of the GA and GP can be controlled at around 5% [29]. Furthermore, the accuracy of GL extracted based on a 0.51 m Google Earth (GE) image is as high as 98% [23]. The accuracy of GP and GA obtained from a 0.5 m Pleiades-1 panchromatic image is also approximately 90% [30]. Additionally, when using centimeter-level UAV images, the errors in morphological parameters such as GL, GW, GP and GA are less than 9% [12]. The accuracy requirements for the location of GHPs in remote sensing images are the highest. They are commonly extracted based on sub-meter- or centimeter-level remote sensing images, such as QB [29], Pleiades [30] and UAV images [31].
UAV images and GE images have become common data sources for gully erosion research in recent years. Among them, decimeter-level and centimeter-level UAV images can provide substantial support for the extraction of multi-dimensional morphological parameters of gullies, and further provide valuable data for erosion sensitivity prediction and erosion model construction [12,32,33]. However, the application of UAV images is primarily focused on small watersheds due to its high technological and manpower costs, limiting its use on larger spatial scales. Conversely, sub-meter-resolution GE images offer wide coverage and high spatial resolution, making them advantageous for gully erosion research. They can provide historical sub-meter level images of most regions worldwide. In recent years, they have been frequently used in gully erosion research [34], and have shown clear advantages in studying gully dynamics [17,22,35].
The geomorphological features of different terrain areas exhibit significant variations, resulting in diverse, multi-dimensional, morphological characteristics of gullies in each area. As a consequence, these differences manifest in distinct surface textures, shadows and color characteristics in remote sensing images, thereby influencing the accuracy of researchers’ gully identification using such images [27]. However, this issue has not received sufficient attention. The lack of sufficient comparative analysis between the accuracy of remote sensing interpretation in similar images from different terrains and the accuracy of interpretation within diverse images within the same terrain has resulted in some studies relying on accuracy verification results from other regions [29,36]. We believe that this drawback greatly impacts the selection of remote sensing images and the grasp of research results in this specific study.
This paper focuses on the research of widely applied centimeter-level UAV imagery and sub-meter-level GE imagery. The objectives of the paper were as follows: (1) Based on field measurements in two regions with different terrain characteristics, comprehensively evaluate the accuracy of visually interpreting multi-dimensional morphological parameters of gullies using sub-meter-level GE imagery and centimeter-level UAV imagery. (2) Clarify the suitability of these two commonly used remote sensing images in gully-erosion-related research, and analyze the factors that affect the remote sensing interpretation errors of gully morphology, providing accuracy assurance for gully erosion hazard assessments.

2. Materials and Methods
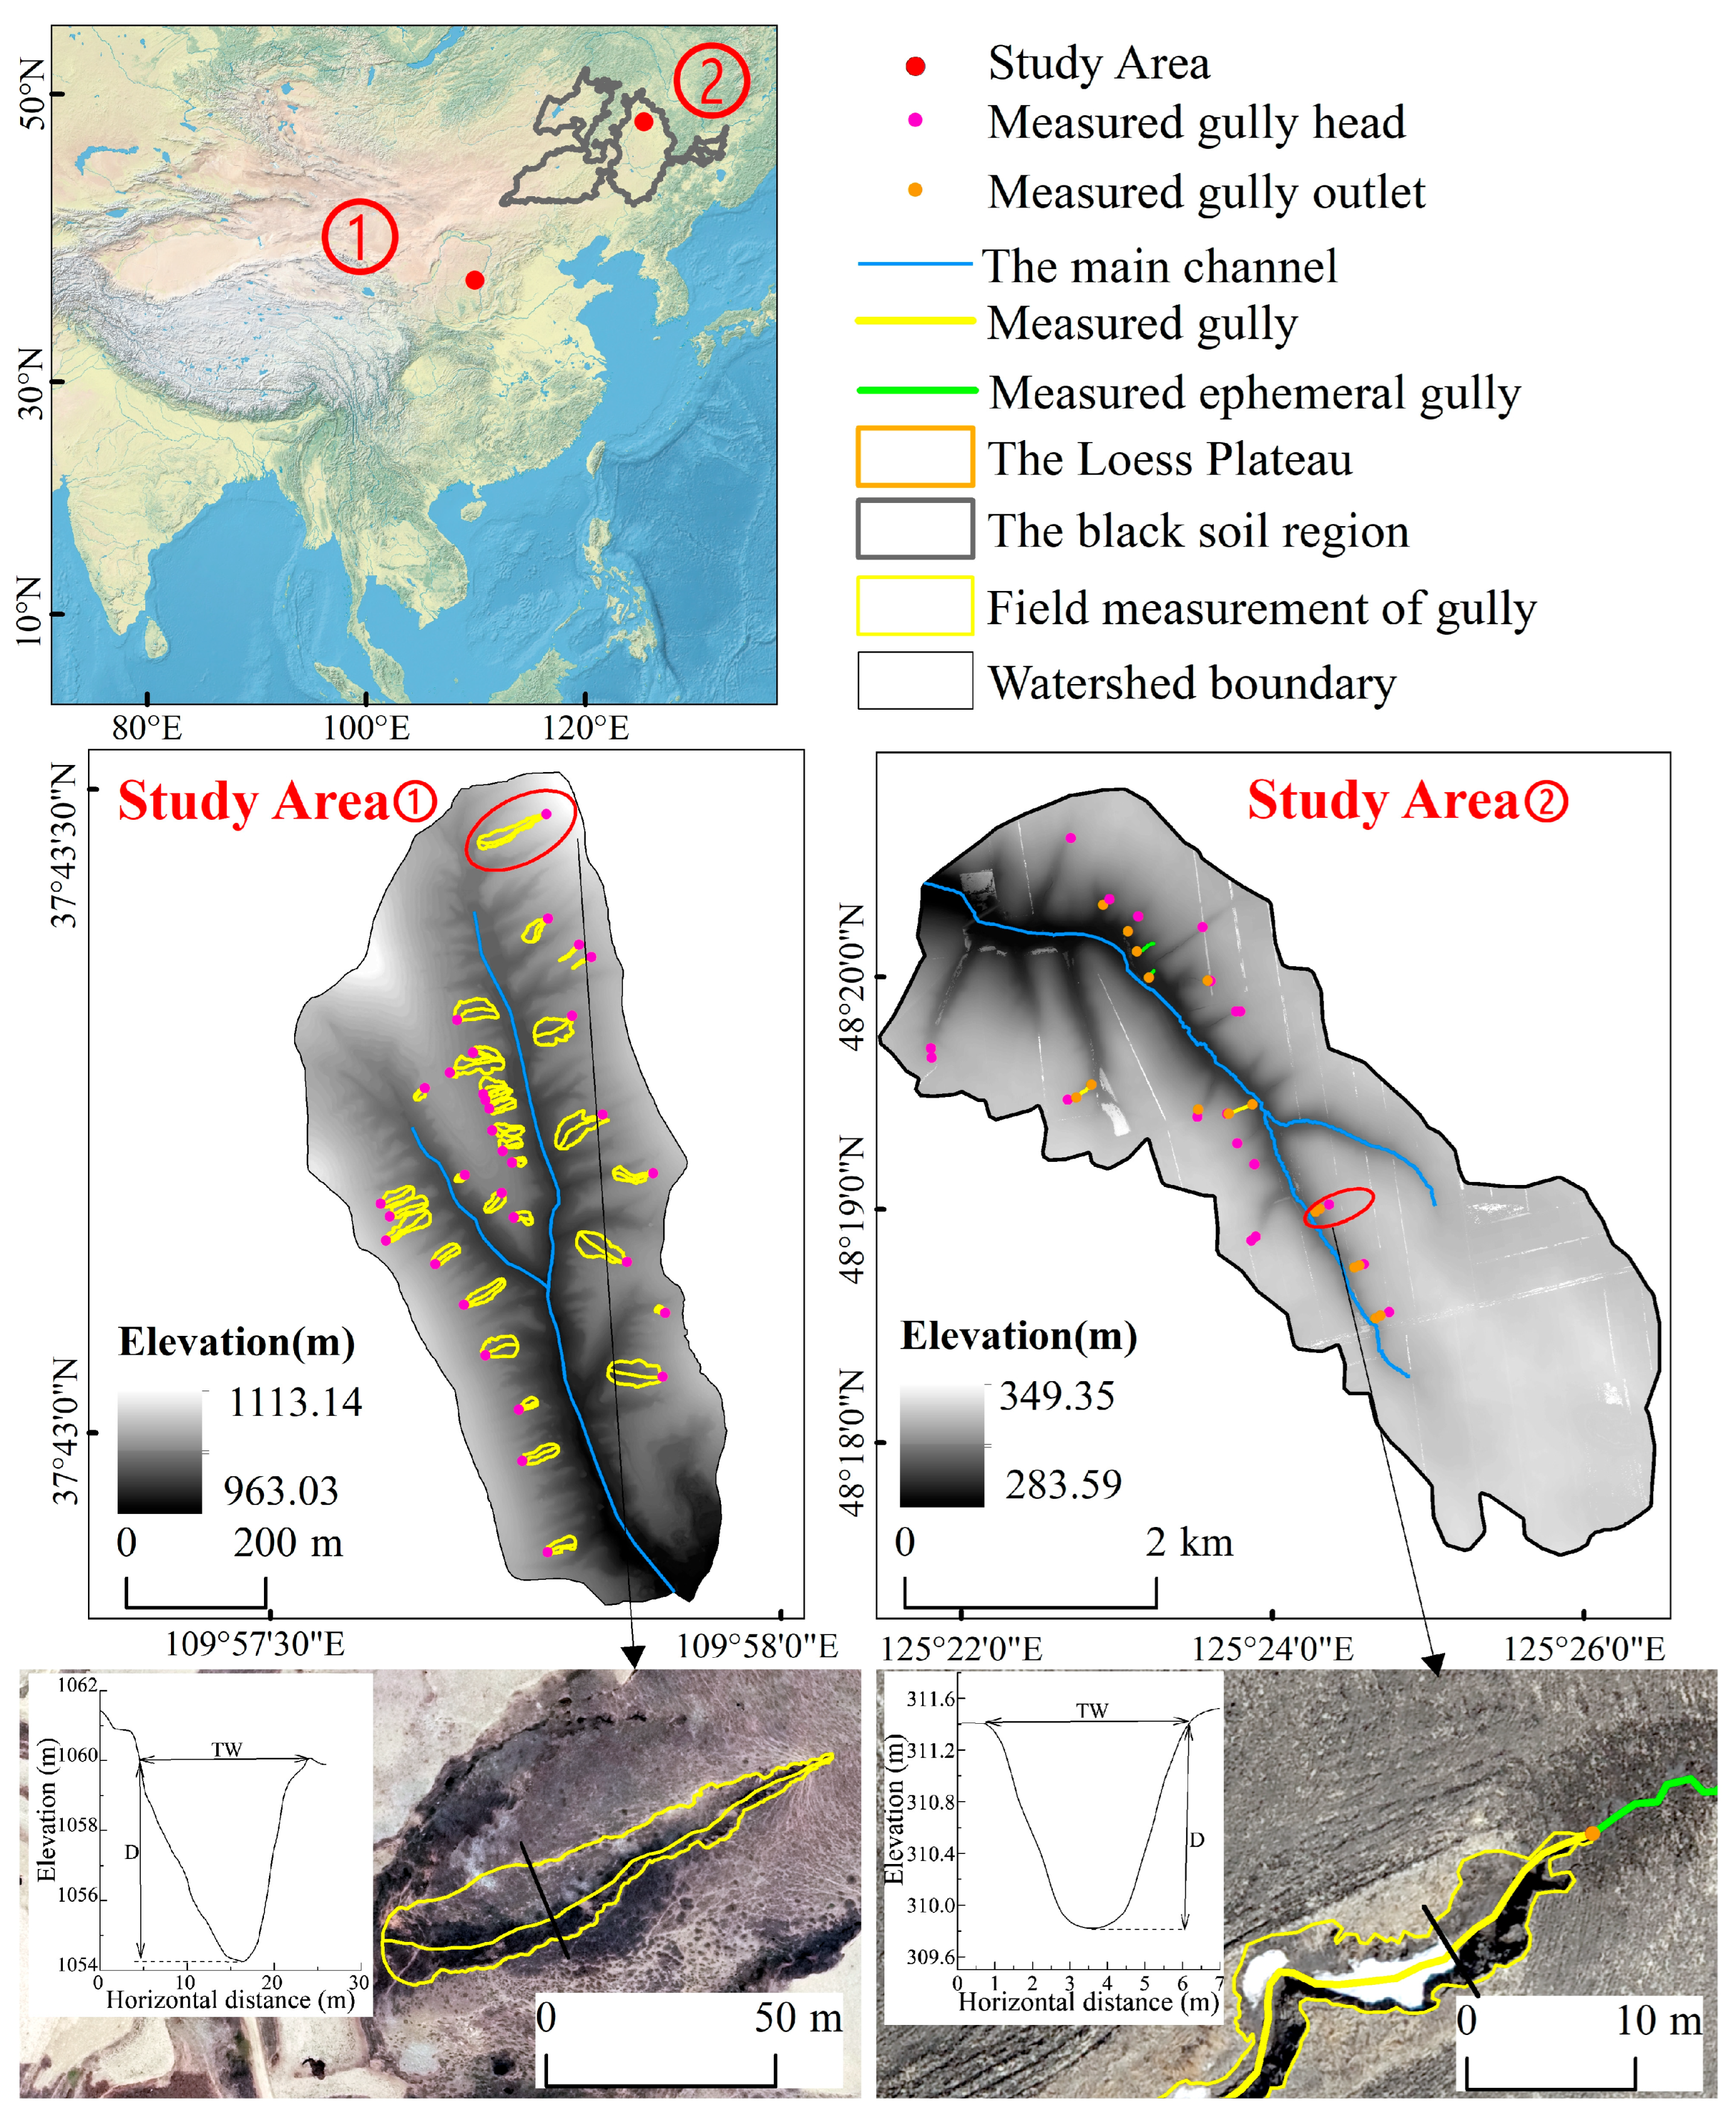
2.1. Study Area

The development of gullies in the Loess Plateau and the typical black soil region in China is widespread, and there are significant differences in gully morphology. This provides an excellent opportunity for a systematic analysis of the accuracy of parameter extraction for gullies of different dimensions. Therefore, this article selects representative watersheds in these two regions to conduct thorough field investigations (Figure 1).
Study Area 1 is Wangwugou watershed (109°57′31″~109°57′57″E, 37°42′51″~37°43′30″N), which is located in the first sub-area of the hilly and gully region of the Loess Plateau. The soil texture in this watershed primarily consists of silt particles, with loose soil texture. The watershed covers an area of 0.44 km2, with an elevation ranging from 963.03 m to 1113.14 m. The average slope gradient is 29.57°. The land use here is mostly cultivated land and grassland, with cultivated land accounting for over 50% (approximately 27% of which is on sloping terrain). According to the annual mean results, the temperature in the area is 9.5 °C, with wind speeds below 2 m/s and approximately 450 mm of precipitation, predominantly concentrated in the summer. Gully erosion is a frequent phenomenon in this region, primarily observed on steep slopes. These gullies exhibit significant dimensions, often exceeding 10 m in depth and width. However, their length is relatively short, typically not exceeding 100 m. Additionally, the edges of the gullies tend to be straight.
Study Area 2, the Yangpaigou watershed, is located in Keshan Farm (125°21′26″~125°26′28″E, 48°17′32″~48°20′49″N), which is a typical rolling-hill mollisol area in Northeast China. The soil texture in this watershed is classified as silty clay (United States Department of Agriculture). The watershed covers approximately 15.98 km2, with an elevation ranging from 283.59 m to 349.35 m and an average slope of 1.50°. The predominant land use here is cultivated land, accounting for 89.18% of the total area, with oblique ridge tillage. The annual mean results reveal that the temperature in the area is 2.4 °C, with a wind speed of 4 m/s and approximately 499 mm of precipitation. The watershed experiences composite soil erosion resulting from the combined effects of freeze–thaw–wind–hydraulic processes occurring simultaneously in both time and space. Gully erosion is prevalent in the region, particularly on gentle slopes. These gullies typically exhibit smaller dimensions, with depths and widths mostly below 5 m. In contrast, their length is relatively long, extending up to several hundred meters. Moreover, the edges of the gullies tend to meander.

2.2. Field Measurement of Gully

The instruments utilized for conducting field surveys and measurements in both research areas are the Zhonghaida H32 Global Navigation Satellite System (GNSS) Real-Time Kinematic (RTK) receivers. These instruments offer a dynamic measurement accuracy with a plane accuracy of ±(8 + D0 × 10−6) mm (where D0 represents the distance between the measured points), and an elevation accuracy of ±(15 + D0 × 10−6) mm. Field survey in the Loess Plateau was carried out in April 2021, characterized by low vegetation cover and clear weather conditions, which provided favorable conditions for fieldwork. In the black soil region, the fieldwork took place in April 2022 when there was less snow cover and spring plowing had not yet been carried out. This allowed for a relatively clear delineation of the gully boundaries. To ensure efficiency in the field investigation and measurement tasks, we standardized the measurement accuracy. In the northeast black area, we employed the GNSS network differential mode as the preferred measurement mode. However, due to the network signal instability in the Loess Plateau, we had to resort to using the GNSS single base station differential mode for measurements in that specific region. A total of 32 typical Loess gullies and 7 black soil gullies were surveyed, including essential morphological parameters such as GHPs, GL, GW, GP, GA, GD and CSA. The step size for parameter measurements was set at 0.3–0.5 m, which could be shortened to 0.1 m in areas with significant terrain variations. Additionally, when conditions permitted, we expanded the measurement of GHPs in the black soil region, resulting in a total of 14 points being measured.

2.3. UAV Aerial Photogrammetry and GE Image Preprocessing

The Da Jiang Innovation (DJI) 4 RTK UAV was used for aerial photogrammetry. The flying height was 300 m, with recommended course side overlap rates (80% and 70%). The terrain of the Loess Plateau changes greatly. To ensure consistent photo resolution, ground-like flights were employed for course adjustments. In order to maintain consistency between field measurements and aerial survey accuracy, as well as coordinate systems, the GNSS post-processed kinematic (PPK) method was adopted in the Loess Plateau, where network signal stability was a concern. Meanwhile, the GNSS network differential model continued to be used in black soil areas. For the black soil region, six ground control points were established through the GNSS network differential mode, serving as image control points for aerial photogrammetry. In aerial photogrammetry, 6 ground control points with ‘+’ shaped markers were evenly arranged for geographical reference, with a size of 0.5 m × 0.5 m. The aerial data processing was carried out using Pix4mapper (https://pix4d.com/ (accessed on 1 June 2021 and 12 June 2022)), and finally a Digital Orthophoto Map (DOM) with a resolution of 8 cm in the two study areas was generated for visual interpretation. In the centimeter-level UAV image, the accuracy of the image control points was within 3 cm, and the edge of the gully was clearly visible.
The GE images were obtained from the official website (https://earth.google.com/ (accessed on 16 March 2023)), which contains 20 levels. The image level selected in this study was the 19th level, and the accuracy reached the sub-meter level. The acquisition time of the image needed to be close to the field measurement time without snow cover. After rigorous screening, two periods of GE images were selected on 21 June 2021 (Study Area 1) and 29 September 2021 (Study Area 2), in which various morphological information of the gullies could be clearly seen. The downloaded GE images were in image format, without any coordinate or projection information. A manual definition of projection and coordinate conversion was required. Then, the geographic registration tool in the ArcGIS 10.5 software platform was used to align the GE images with the UAV images. It is important to note that the registration accuracy differed between the two study areas. In Study Area 1, which had smaller coverage, the registration accuracy reached 20 cm or even higher. On the other hand, in Study Area 2, which had larger image coverage and more factors influencing registration, the difficulty of registration increased. As a result, the registration error in Study Area 2 was approximately four times that of Study Area 1.

2.4. Method of Interpretation of Gully Shape Parameters

Visual interpretation was conducted indoors using the ArcGIS 10.5 software platform, which involved interpreting the morphology of gullies in both the UAV images and GE images. The interpretation results for the two study areas are presented in Figure 2. The gully head point refers to the exact location where a gully has cut through the ground surface. It represents the closest point along a gully to the watershed divide. The gully length refers to the projected distance of the flow path from the head point to the outlet point. The boundary of each gully was digitized, and a closed curve was drawn along the vertical contour line at the end of the gully. The area covered by the closed curve means the gully area, and the boundary length indicates the gully perimeter. In the Loess Plateau, each gully was measured three times (1/4, 1/2 and 3/4), while in the black soil zone of Northeast China, we measured the width and depth every 10 m. Finally, the mean value was taken as the GW, GD and CSA of the gully. The width of the gully refers to the straight distance between the left and right sides of the gully. The CSAs were extracted using 3D analysis tools in ArcGIS 10.5.

2.5. Gully Morphological Indexes and Calculation Methods

In this study, the parameters used to evaluate gully morphology included directly extracted measurements from the gully itself, such as gully length, width, perimeter, area, depth and cross-sectional area. Additionally, derived morphological indices that required calculations were utilized, including gully length-to-width ratio (L/W), width-to-depth ratio (W/D) and gully sinuosity index (SI). These parameters and indices were employed to assess the planform shape, cross-sectional profile and edge complexity of the gullies. The L/W is the gully’s narrowness, and a larger index value means that the gully plane is slender. The W/D was utilized to express the gully’s cross-section characteristics, and the larger value indicates that the GW is much larger than GD. The SI is the complexity of the gully shoulder line, which is the knowledge of the landscape pattern patch shape index (Equation (1)) [36,37]. The larger value indicates that the gully’s shoulder line is more tortuous.
S I = 0.25   *   G P G A
where GP is the gully’s perimeter, m; GA is the gully’s area, m2; and SI is the shoulder line complexity of the erosion gully.

2.6. Error Evaluation Indexes

The GHP positioning accuracy is expressed by the length from the interpretation point to the measured point in Equation (2). Gully length (GL), gully width (GW), perimeter (GP) and area (GA) errors are described by the mean absolute error (MAE), mean square error (MSE), root-mean-square error (RMSE), mean absolute percentage error (MAPE) (Equation (3)) and Nash–Sutcliffe efficiency coefficient (NSE) (Equation (4)) [12].
R d = X 0 X s 2 + Y 0 Y s 2 2
R M A P E = A B S ( p i P i ) / P i × 100
R N S E = 1 i = 1 n ( p i P i ) 2 i = 1 n ( p i P ) 2
where Rd represents the positioning error of the gully head point; X0 and Y0 are the image interpretation coordinates of gullies; XS and YS are the coordinates of RTK points; RMAPE and RNSE represent mean absolute percentage error and Nash–Sutcliffe efficiency coefficient; pi is the interpretation value; Pi is the measured average; P is the measured mean; and n is the sample size.

3. Results

3.1. Gully Morphologies in Different Terrain Regions

The multi-dimensional morphological differences in gullies in diverse terrain regions are shown in Table 1, and the differences in the morphological characteristic indices are shown in Figure 3. More detailed information is shown in Appendix A, Table A1. The multi-dimensional morphological differences between Loess gullies and black soil gullies are obvious, with significant differences in the morphological characteristic indices such as L/W, W/D and SI (p < 0.01). The lengths of Loess gullies range from 15.17 to 109.98 m (mean 49.63 m). They are short and wide, with an L/W of 4.78 and a width and depth variation range of 1.12–30.92 m (mean 15.54 m) and 0.18–13.47 m (mean 6.70 m), respectively; the average perimeter and area are 128.87 m and 779.18 m2, with a CSA of 78.42 m2 and an SI of 1.32. The lengths of black soil gullies range from 45.15 to 206.10 m (mean 92.88 m). The gully plane is slender, with an L/W of 33.99, a variation in width and depth ranging from 2.09 to 4.28 m (mean 2.97 m) and 0.37–1.13 m (mean 0.73 m), an average perimeter of 208.78 m, a surface area of 254.31 m2, a CSA of 1.27 m2 and an SI of 3.20. Overall, the Loess gullies are short and wide with a relatively low SI, while the black soil gullies are long and narrow with a high SI.

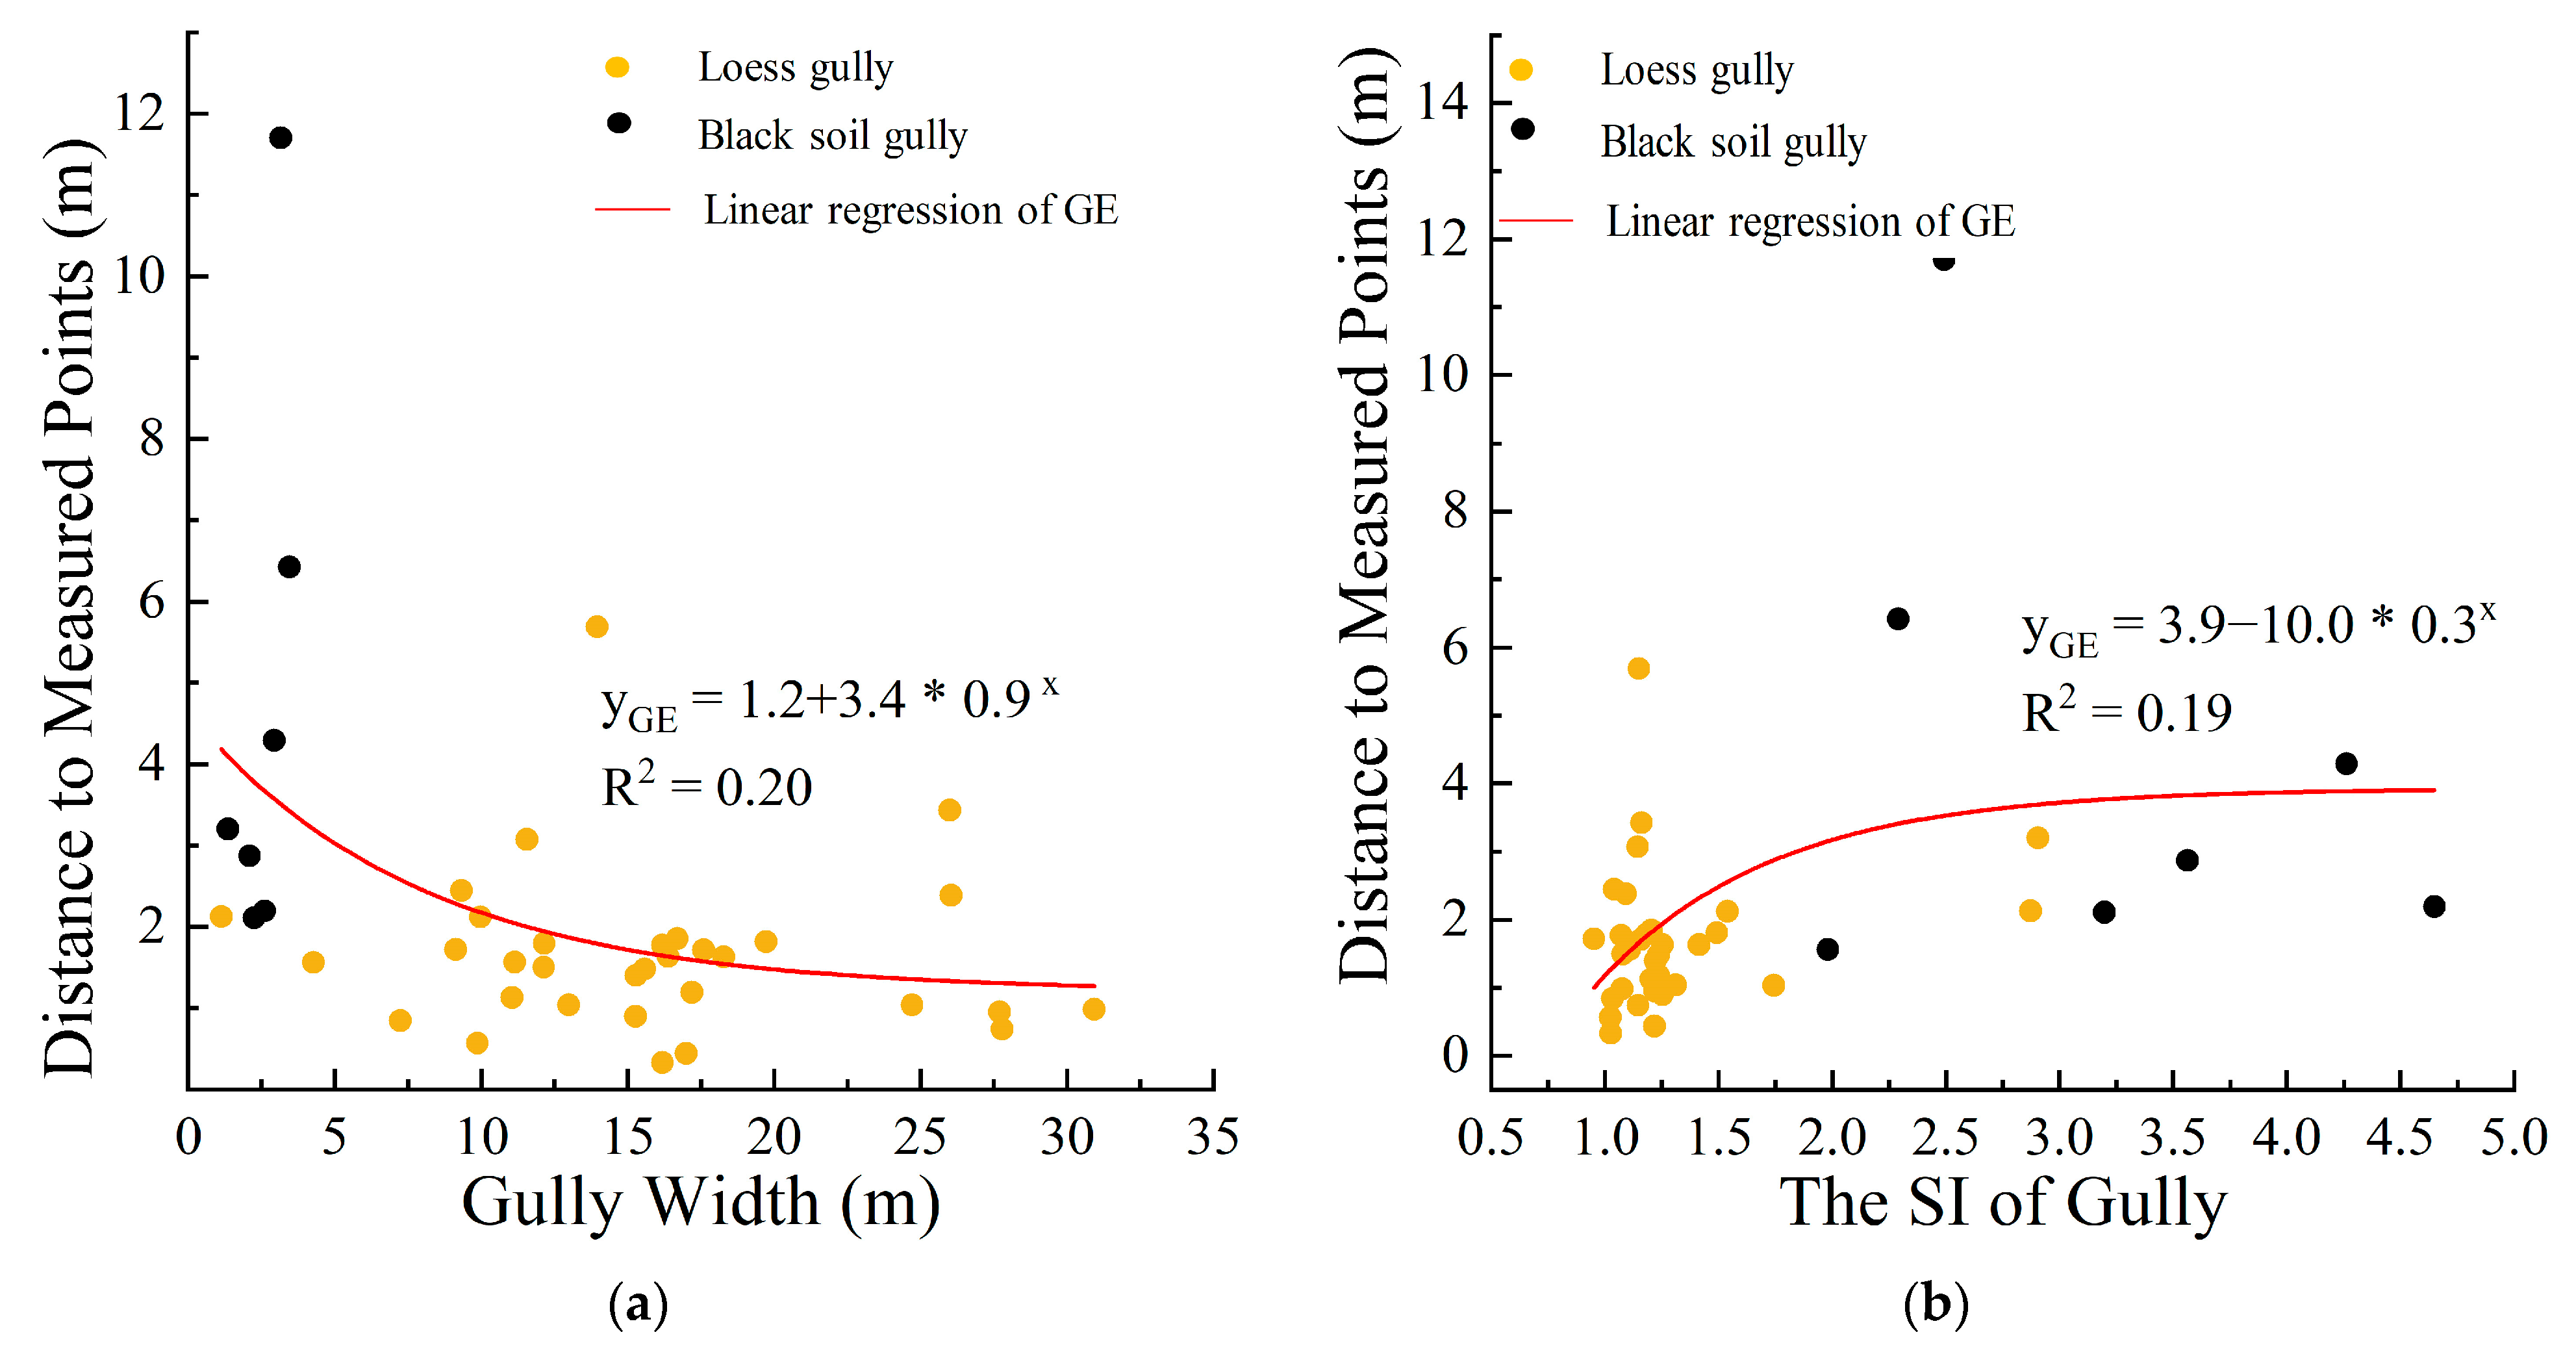
3.2. Analysis of the Positioning Error of the Gully Head Points

Table 2 shows the statistical distances between the field-measured gully head points and the remote-sensing image-interpreted gully head points. Among the 46 gully head points determined in the field (32 in the Loess region and 14 in the black soil region), the distances between the gully head points and the measured points based on UAV images and GE images are 0.67 m and 2.32 m, of which the distances between the gully head points and the measured points based on UAV interpretation are 0.87 m and 0.21 m for the Loess gullies and black soil gullies, respectively, and the corresponding results based on GE image interpretation were 1.71 m and 3.72 m, respectively. This indicates that the distance between the head points of the gullies and the measured points based on the UAV images is much smaller than that determined by the GE images, and the head points of the gullies are located more accurately. The accuracy of the gully head point positioning based on UAV images is better for the black soil gullies than for the Loess gullies, while the accuracy of the gully head point positioning based on GE images is better for the Loess gullies than for the black soil gullies.
Figure 4 illustrates the relationship between the positioning accuracy of GHPs and gully morphological factors. The positioning accuracy of the gully head based on the UAV image interpretation generally falls within a range of 2 m, with most of them being below 1 m. The influence of gully morphology on this deviation is not significant. Considering that there might be some errors during the field measurement, Figure 4 only analyzes the relationship between the positioning accuracy of the GHP based on GE images and the gully morphological indexes. The two gully morphological indexes that are most closely related to the accuracy of the gully head positioning are GW and SI. The GHP error based on GE image interpretation decreases with increasing GW and increases with increasing SI. When the GW is less than 5 m, the distance from the location of the interpreted GHP to the measured GHP is generally more than 2 m, and vice versa; when the SI is greater than 1.5, the distance from the location of the interpreted GHP to the measured GHP is generally more than 2 m, and vice versa. For sub-meter-resolution GE images, when visually interpreting the GHP indoors, the positioning accuracy of the GHP decreases as the width of the gully becomes smaller and the SI increases.

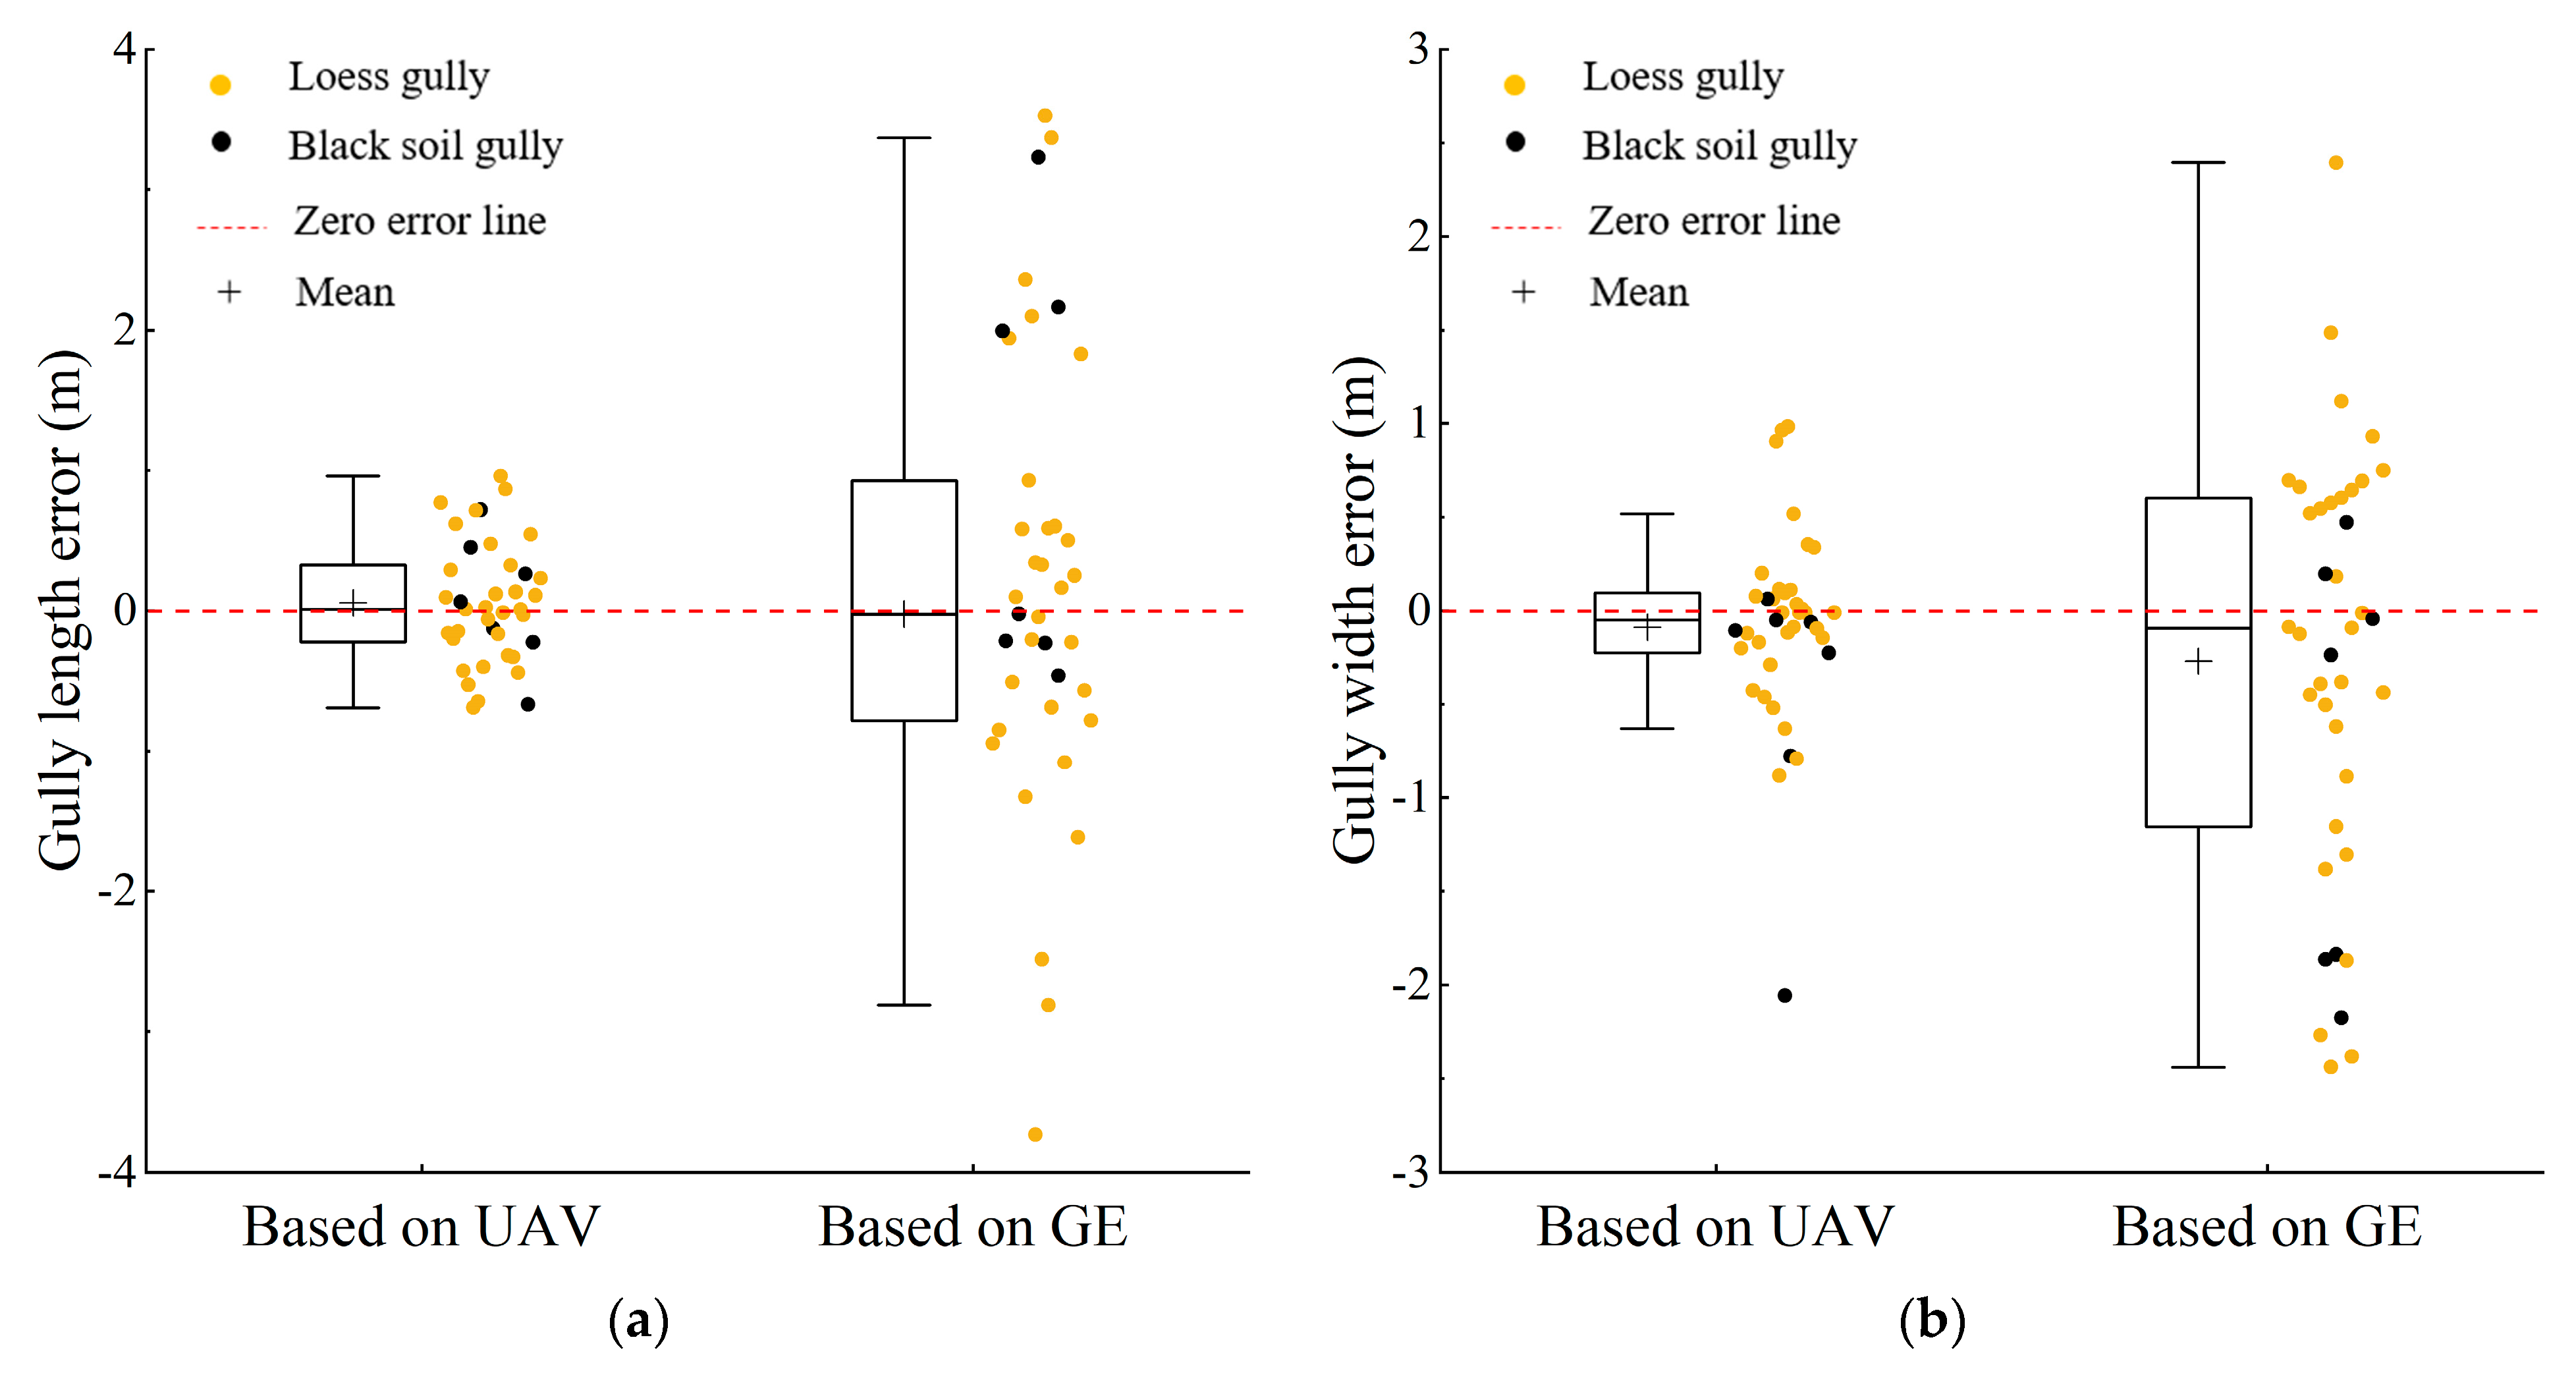
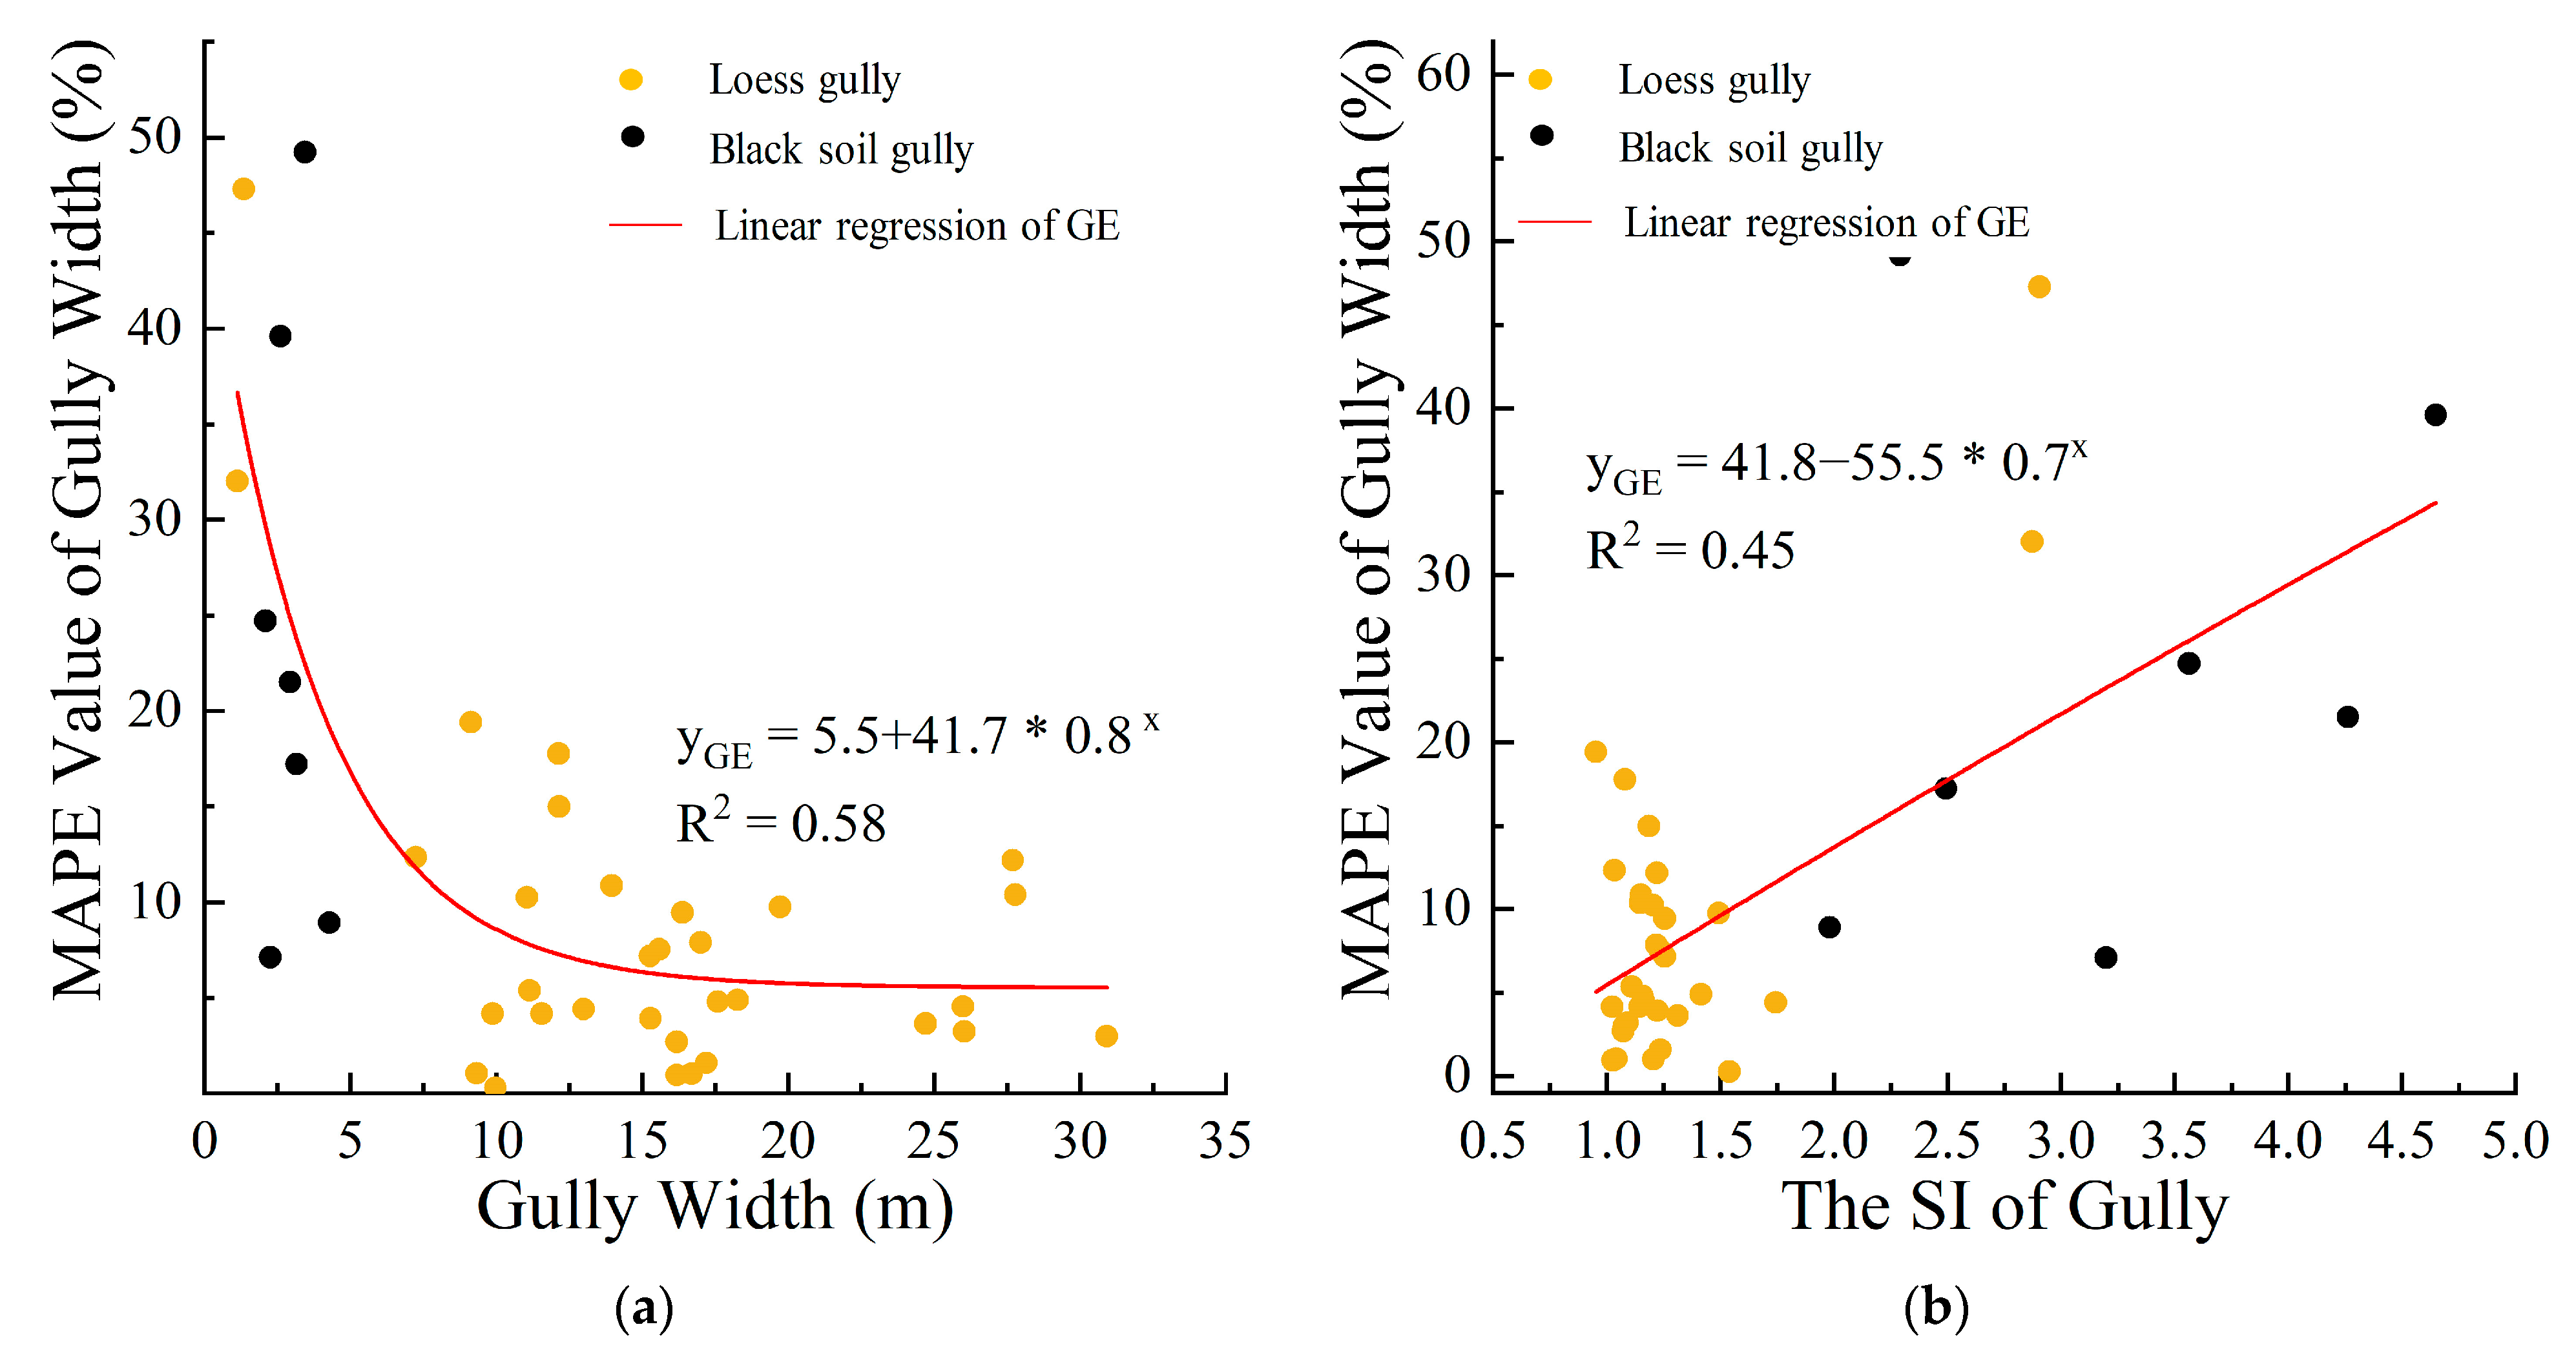
3.3. Analysis of Gully Length and Width Interpreting Errors

The analysis results of the remote sensing interpretation errors for gully length and width are presented in Table 3. There are significant differences in the length and width errors among gullies with different morphologies based on the interpretation of the remote sensing images. Specifically, the mean errors of gully length and width based on UAV image interpretation are 0.71% and 2.63%, respectively. Additionally, the length interpretation error of gullies is higher in the Loess Plateau, approximately twice that of the black soil region. On the other hand, the width interpretation error is higher in the black soil region, approximately 1.6 times that of the Loess Plateau. The MAPEs of GL and GW based on GE image interpretation are 3.46% and 11.59%, respectively. Moreover, the MAPE of GL interpretation is slightly higher in the black soil area, while the width interpretation error of the black soil gullies is significantly higher than that of the Loess gullies, approximately three times as much. In conclusion, the visual interpretation accuracy of GL and GW based on UAV images yields high accuracy, exceeding 97%. On the other hand, the accuracy of GL is relatively high, but the accuracy of GW is lower when interpreted using GE images. This difference is especially pronounced when interpreting the width of gullies in the black soil region, where errors are significant.
The difference between the GL and GW based on manual visual interpretation and the field-measured GL and GW is shown in Figure 5. The difference between the GL and GW obtained from the UAV images and those measured in the field lies around the zero error line, as well as the differences between the measured values and the GL and GW, are mostly concentrated within ±1 m. The mean value of the difference between GW and the measured length based on GE image interpretation also lies around the zero error line, but the error distribution is more discrete, with the difference between ±4 m, and the mean value of the difference between GW distribution and the measured width lies below the zero error line, with the GW distribution within ±3 m. Overall, the errors in GL and GW based on UAV image interpretation are smaller than the corresponding errors based on GE image interpretation, and the GW based on GE image interpretation is overall underestimated.
Figure 6 represents the analysis of the relationship between the interpretation error of the gully width and gully morphological factors. The MAPE of GL and GW based on the UAV image is hardly affected by the gully morphology, and the correlation between the GL MAPE and gully morphological indexes based on GE image interpretation is less obvious. Therefore, Figure 6 only analyzes the relationship between the gully width error and gully morphological indexes based on the GE image. The two gully morphological indexes most closely related to the gully width accuracy are GW and SI. The error in GW based on GE image interpretation decreases with increasing GW and increases with increasing SI. When the GW is less than 10 m, the MAPE of the GW will mostly exceed 10%, and vice versa, where it will generally be less than 10%; when the SI is less than 1.5, the MAPE of the GW is less than 20%, and most of them are concentrated within 10%, while on the contrary, most of them are more than 10% or even more than 20%. For the GE images, the visual interpretation accuracy of the GW with large GW and small SI is higher.

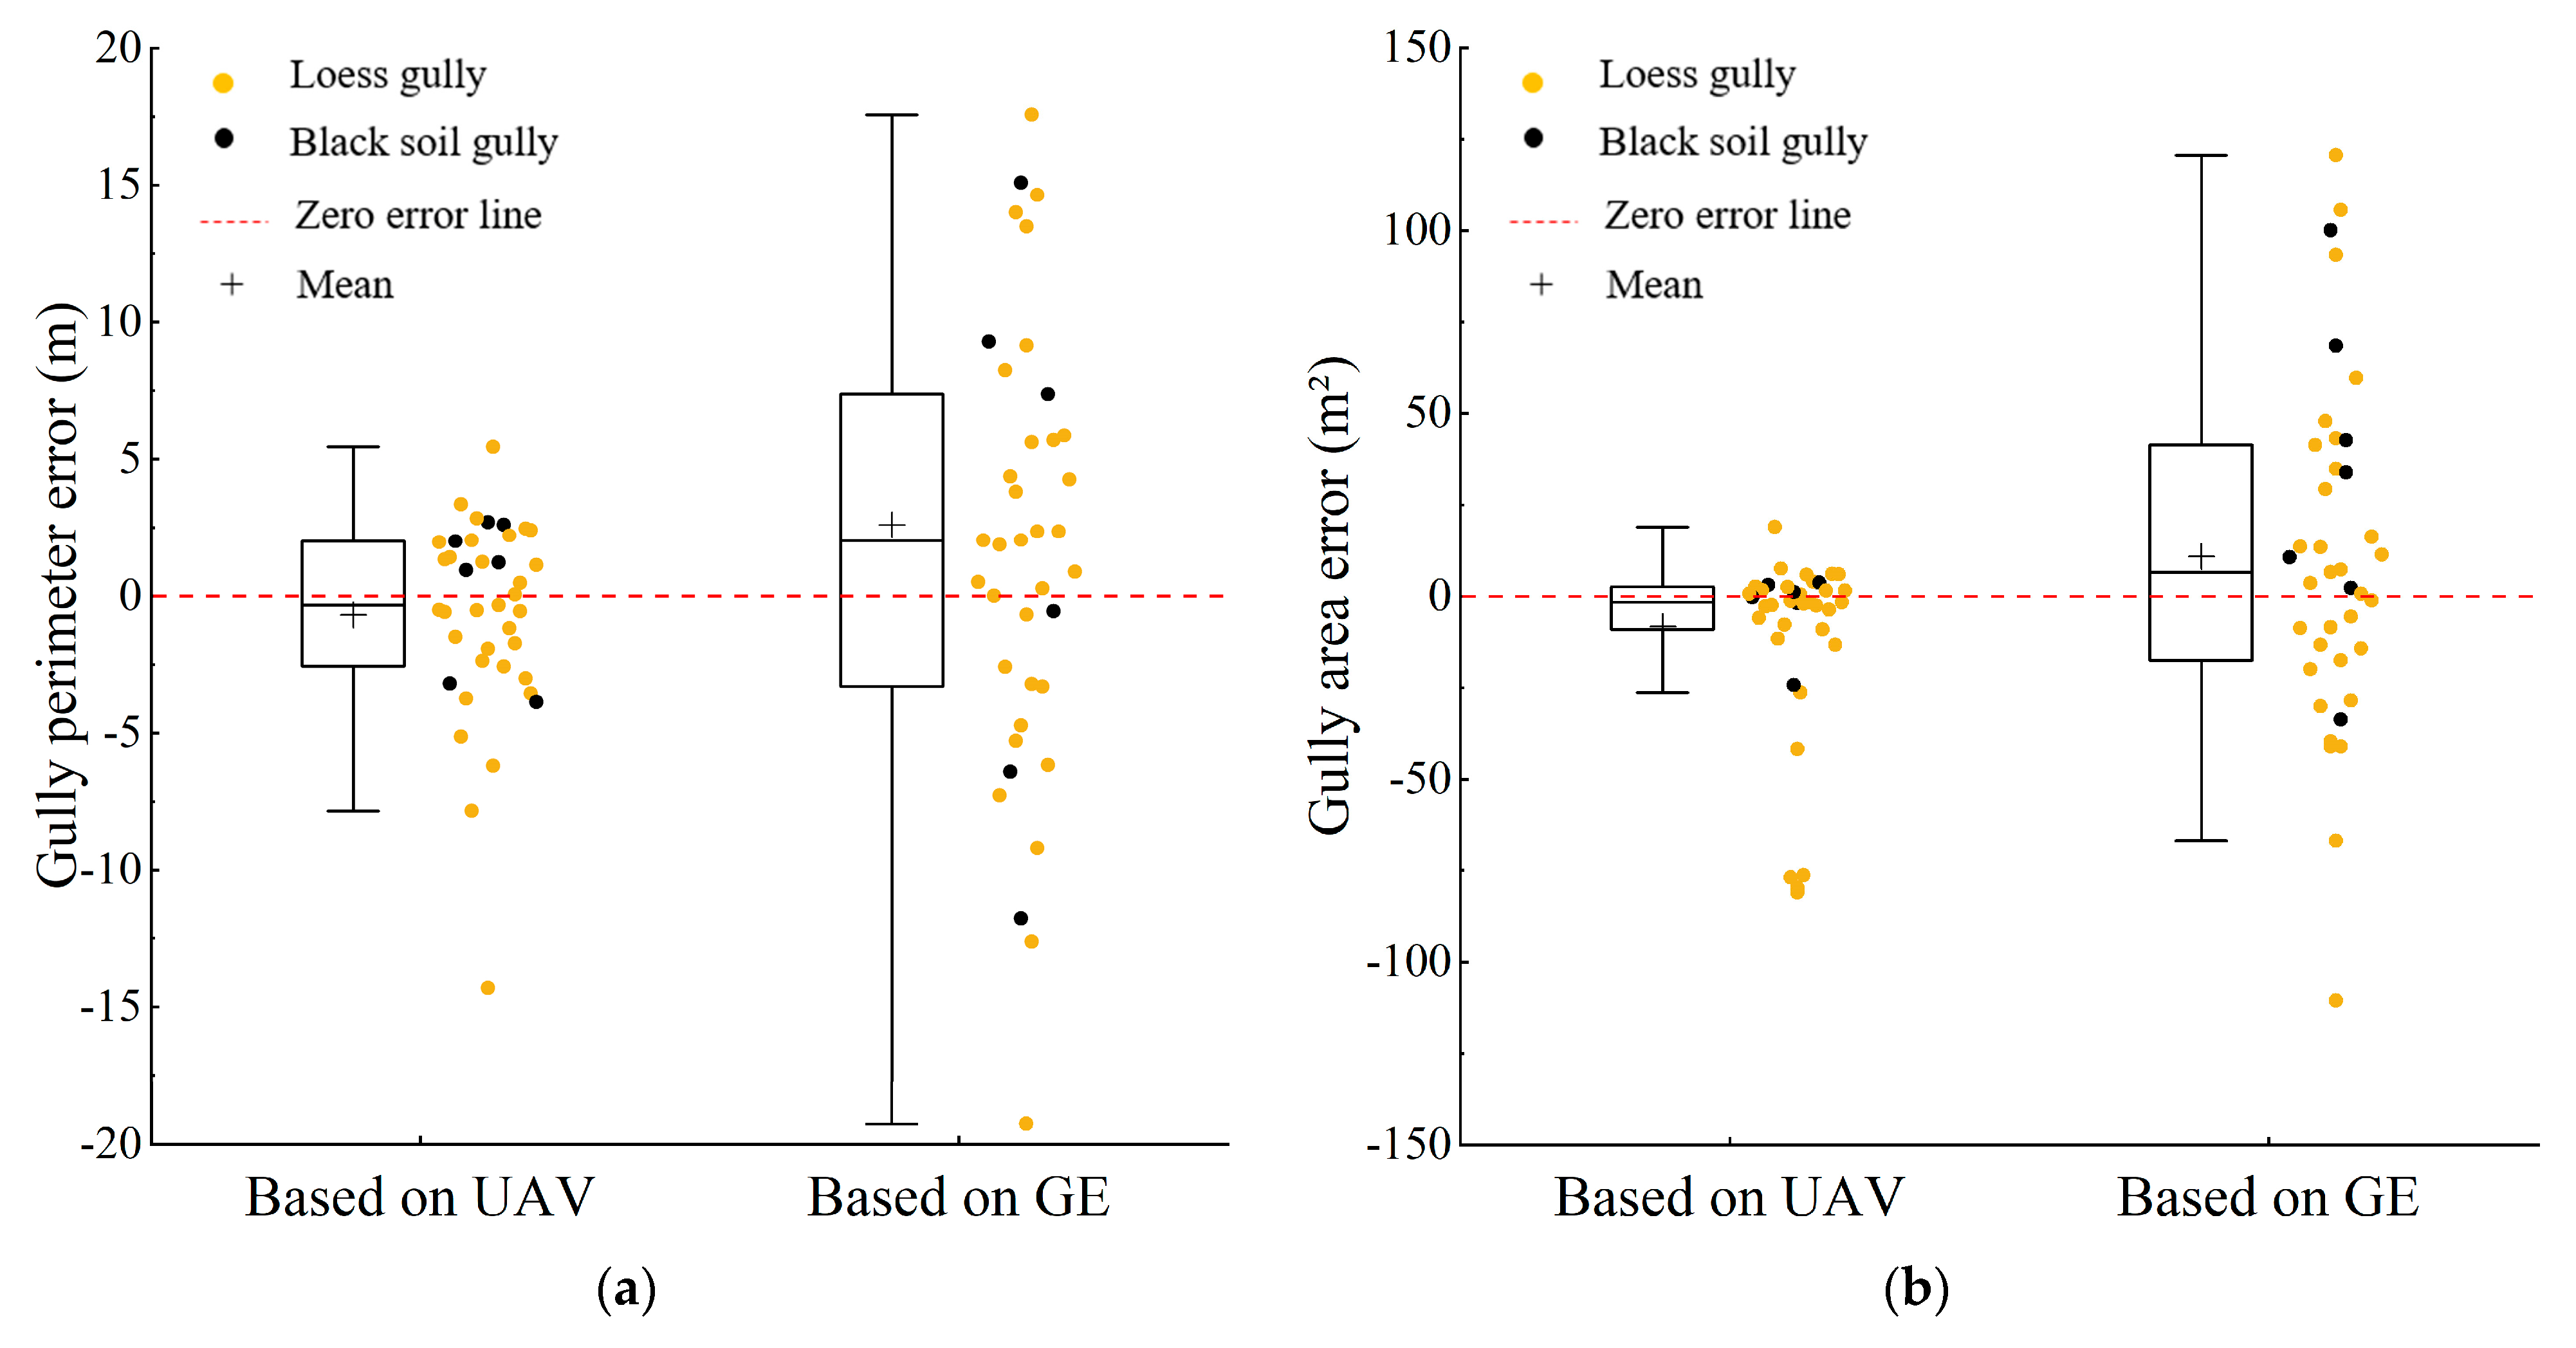
3.4. Analysis of Gully Perimeter and Area Interpretation Errors

The analysis results of the remote sensing interpretation errors for gully perimeter and area are presented in Table 4. There are significant differences in the perimeter and area errors among gullies with different morphologies based on the interpretation of the remote sensing images. Specifically, the mean errors of GP and GA based on UAV image interpretation are 2.12% and 2.56%, respectively. Furthermore, the perimeter and area interpretation errors of gullies are higher in the Loess Plateau, approximately 1.5 times that of the black soil area. On the other hand, the mean errors of GP and GA based on GE image interpretation are 5.53% and 8.66%, respectively. Additionally, the perimeter interpretation error of gullies is slightly higher in the black soil area, while the area interpretation error of black soil gullies is approximately twice that of the Loess gullies. In summary, the interpretation of GP and GA based on UAV image analysis yields high accuracy. On the other hand, when interpreting GP, GE images exhibit higher accuracy, while the accuracy of the gully area is relatively lower. This discrepancy is especially pronounced when interpreting the area of gullies in the black soil region, where errors are significant.
The differences between the GP and GA obtained via manual visual interpretation and the field-measured GP and GA are visualized in Figure 7. The mean of GP and GA differences based on UAV interpretation are slightly below the zero error line, with the differences concentrated in ±5 m and ±25 m2. The mean values of the differences in GP and GA based on GE image interpretation lie above the zero error line, with the differences controlled at ±15 m and ±100 m2. Overall, the interpretation of GP and GA based on the UAV images tends to slightly underestimate the actual measured values. On the other hand, the interpretation results based on the GE images tend to slightly overestimate the GP and GA of the gully.
Figure 8 represents the analysis of the relationship between the accuracy of the remote sensing interpretation of the gully area and gully morphological indexes. The correlation between the GP MAPE interpreted from the UAV image and GE image interpretation and the gully morphological indexes is not significant, and the accuracy of GA based on the UAV image interpretation is also above 97%. Therefore, Figure 8 only analyzes the correlation between the GA MAPE interpreted from the GE image and gully morphological indexes. The four gully morphological indexes that are most closely related to the accuracy of GA are GW, GA, L/W and SI. The error of GA based on GE image interpretation decreases with the increase in GW and GA, and increases with the increase in L/W and SI. When the GW is less than 10 m and the GA is less than 500 m2, the MAPE of the GA will mostly exceed 10%, and vice versa. When the L/W is less than 10 and the SI is less than 1.5, the MAPE of the GA interpretation is mostly less than 10%, while the MAPE is mostly more than 10% or even more than 20%. It is evident that for GE images, there are multiple factors influencing the interpretation of the gully area. Generally, gullies with a smaller width and area, as well as a larger L/W and higher SI, tend to have larger errors in the interpretation of the gully area.

4. Discussion

4.1. Explanation of the Correlation between Remote Sensing Image Selection and Gully Morphology

This study establishes a correlation between the accuracy of the remote sensing visual interpretation of gully morphological information and the initial morphological attributes of the gully. Notably, factors such as GW, GA, L/W and SI significantly influence the interpretation accuracy. As the GW expands and SI decreases, the accuracy in interpreting the GHP and GW through remote sensing improves. Additionally, the accuracy in determining the GA is positively influenced by the GW and GA, but negatively influenced by the L/W and SI. These findings are consistent with the premise that larger gullies yield smaller errors in visual interpretation, as found by Li Zhen et al. [29]. However, it is crucial to highlight that this study distinguishes itself in terms of its objective, which centers on evaluating the suitability of remote sensing images obtained via various sources for the accurate interpretation of gully morphological parameters. The findings of this study underscore the necessity of considering gully morphology as a significant factor when selecting appropriate remote sensing images for analysis.
Gullies in different terrain regions often exhibit significant differences in multi-dimensional morphology, which can significantly impact the accuracy of researchers’ attempts to extract gully morphology parameters from remote sensing images [27]. Therefore, the suitability of the same image to interpret gullies in different regions varies. This issue has not received sufficient attention. Due to the lack of image interpretation accuracy comparison and systematic research in different regions, the verification results of accuracy in other regions have to be used in some studies [29,36]. In order to make up for this shortcoming and confirm the problem of accuracy differences in different regions, this study selected gullies with obvious morphological differences in the two terrain regions where erosion gullies are widely developed in China, and explored the visual interpretation effect of different morphological characteristics of gullies. The findings demonstrate significant variations in the suitability of the same image for visually interpreting different forms of gullies. Particularly, the suitability of the centimeter-level UAV image to the parameter interpretation of narrow gullies in the black soil area is much better than that of the wide and large gullies in the Loess region. The primary reason is that the black soil gully is generally in the rapid development period [38], and the shoulder line of the gully is more obvious. As long as the image resolution is high enough, it is easier to identify. Based on the suitability of interpreting sub-meter-resolution GE images, it can be concluded that the effectiveness of identifying Loess gullies is relatively higher compared to black soil gullies. This distinction is primarily influenced by the width of the gullies and constrained by the resolution capabilities of GE images. Gullies with a width of less than 5 m tend to exhibit lower accuracy in visual interpretation. In Loess regions, there is a significant presence of large-scale gullies, with widths mostly exceeding 10 m. Consequently, these gullies can be readily identified in the imagery. Conversely, in black soil areas, gullies occur along gently sloping terrains, leading to the development of narrow and elongated channels. Furthermore, in black soil areas, the complexity of gully edges is higher, making it challenging to accurately delineate the edges of the gullies on GE images with relatively low resolution. Therefore, it is crucial to take into account the width of the gully and the specific characteristics of the area when utilizing GE imagery for gully interpretation. While GE images can yield satisfactory outcomes for Loess gullies, accurately depicting the edges of gullies in the black soil region may pose certain limitations. In such cases, employing higher-resolution images or alternative remote sensing techniques may be necessary to enhance the accuracy of gully interpretation in these regions.

4.2. Characteristics and Limitations of Gully Morphological Parameter Interpretation Using UAV and GE Images

Utilizing UAV remote sensing technology enables the acquisition of high-resolution DOM images and the generation of DSM within the designated study area. The combination of these two datasets allows for a more comprehensive extraction of multi-dimensional morphological parameters of the gully [17,35,39]. However, certain studies have indicated that due to terrain factors or the influence of vegetation cover, it is challenging to accurately obtain gully morphological characteristics on steep slopes using UAV data [40], suggesting that oblique photography is more suitable for extracting three-dimensional (3D) gully information compared to orthophotography. The accuracy of two-dimensional (2D) parameters such as GL, GW, GP and GA is better than that of 3D morphological parameters such as GD, CAS and GV. The MAPE value of 2D parameter interpretation results is less than 10%, and the 3D parameters are less than 20% [12,41,42]. In this study, only the UAV aerial photography image was used to obtain the gully’s 2D information. The deviation between the interpreted GHP and the field-determined position is primarily within 1 m, with the visual interpretation accuracy of GL, GW, GP and GA being concentrated at or above 97%. In addition, the GW, GP and GA based on UAV image interpretation are slightly lower than the actual measurement results, and the GL is slightly overestimated. Similar conclusions have been documented in other comparable studies [12,42]. This reminds us to carefully consider whether the degree of overestimation or underestimation of the parameters during interpretation would affect the experimental results when using UAV imagery to obtain gully morphological parameters. Efforts should be made to mitigate any disputes that may arise from the potential data overestimation or underestimation.
The feasibility of interpreting gullies using GE remote sensing imagery has been repeatedly confirmed in numerous similar studies [22,34,43]. In addition, some researchers suggest that the 0.5 m resolution GE imagery is more suitable for extracting the morphological parameters of gullies. This conclusion takes into account both interpretation accuracy and research cost considerations [23]. In recent years, many researchers have combined sub-meter-resolution GE imagery with centimeter-level UAV imagery for the study of small newly formed gullies [17,35]. In this paper, the difference between the position of the GHP determined by the sub-meter GE image and the position determined in the field is mostly within 3 m, the length error is mostly about 5% and the perimeter and area errors are mostly within 10%. The application of satellite images, such as GE, for interpreting several morphological parameters appears to be suitable. However, the results of this study also indicate that caution should be exercised when interpreting GW based on the GE image, as its suitability needs to be considered. The accuracy of width interpretation is acceptable for wider gullies, with accuracy generally within 10% in Loess areas. However, in this study, the MAPE of GW in the black soil area interpreted using a GE image reached 24.05%. Therefore, when the GW is less than 5 m or the gully edges are complex, great care should be taken in interpreting GW using a GE image. Google imagery presents another well-known issue of variable distortion and displacement, which necessitates careful consideration when applying it. However, this study has demonstrated through research that high-precision morphological parameters of channel incision can be interpreted from sub-meter-level Google imagery. This suggests the feasibility of utilizing sub-meter-level GE imagery in gully erosion research. Furthermore, the author has observed a significant length interpretation error when using GE imagery to address gully erosion issues due to the difference between the image acquisition date and the actual date. Although this study selected GE imagery that was closest to the field measurement date, there is still a one-season difference, including the snowmelt period. This leads to a variation of up to 10 m in the length of individual gullies, caused by the unstable headward erosion during the snowmelt season, resulting in the retreat of gully heads. Therefore, when selecting remote sensing imagery, it is important to not only choose images that are as close in time as possible but also avoid intervals that include the snowmelt or heavy rainfall seasons. Another well-known issue with GE imagery is the variability and inconsistency in image deformation and displacement, requiring careful consideration when applying GE imagery. However, this study has demonstrated through research that the high-precision morphological parameters of gullies can be extracted from sub-meter-resolution GE imagery. This suggests that the application of sub-meter-resolution GE imagery in studying gully erosion is feasible.
It is commonly believed that an enhancement in remote sensing image resolution can provide more detailed gully morphology information and improve the accuracy of visual interpretation. However, several studies have indicated that excessively high-resolution data may introduce unwanted interference and affect the experimental results. For instance, very-high-resolution DEMs could result in an overestimation of the extent of gully erosion mapping [24], while high-resolution remote sensing images may have increased noise information in interpretation [25]. When utilizing centimeter-level UAV images or sub-meter-level GE images, it is quite simple to obtain planar parameters such as the GHPs, GL, GW, GP and GA. Nonetheless, acquiring 3D morphological information like GP, CSA and GV typically requires field measurements or elevation data [12]. The limitation of not obtaining 3D information undermines the usefulness of remote sensing images in gully erosion evaluation and soil and water conservation planning. Moreover, visual interpretation, while offering high-precision gully morphology information, demands experienced interpreters [44], thus placing certain restrictions on the widespread application of remote sensing images.

4.3. Future Research

Remote sensing images are extensively used in gully erosion research, especially in large-scale research, and offer notable advantages. The extent of these advantages relies on the ability to rapidly and accurately obtain gully morphological information from remote sensing images, supporting the evaluation of gully erosion on a large scale. Hence, this paper focuses on the commonly utilized centimeter-level UAV images and sub-meter-level GE images in gully erosion research [12,17,43,45], employing visual interpretation to systematically compare and analyze their suitability in interpreting the two-dimensional morphological parameters of gullies. This facilitates researchers in swiftly selecting appropriate remote sensing images based on their research purposes and the characteristics of the gully. It should be noted that although centimeter-level UAV images possess excellent timeliness and ultra-high resolution, they might lack historical images of the region. Although the sub-meter-level GE images cover a larger portion of the region and can provide historical images, the temporal distribution of the images is not uniform, which limits the application to a certain extent [18]. Particularly in long-term dynamic gully erosion research, combining multiple images is often necessary to obtain reliable research results.
However, this paper specifically focuses on the suitability of centimeter-level UAV images and sub-meter-level GE images for obtaining gully morphology in soil erosion research. The suitability of other high-resolution images such as QB images [46], Pleiades images [21] and Spot 5 images [30] still needs to be investigated. Additionally, only 2D morphological information of gullies can be obtained visually from the image. The extraction of three-dimensional information has to rely on DEM data. Determining which type of DEM data is best suited for obtaining the three-dimensional morphological information of the gully is beyond the scope of this study and should be explored in future research.

5. Conclusions

Based on GNSS RTK measurements, this paper provides a comprehensive analysis of the suitability of commonly used centimeter-level UAV images and sub-meter-level GE images for interpreting multi-dimensional morphological parameters of different gully morphologies. The suitability of a single image exhibits significant variation across different gullies. Compared to interpreting wide gullies with low SI, centimeter-level UAV imagery is more suitable for interpreting narrow gullies with high SI in the black soil region of Northeast China, while GE images are more suitable for interpreting large-width and low-SI gullies in the Loess Plateau. The advantage of UAV images lies in their considerably lower interpretation error, with an MAPE of the GHP being less than 1 m and the MAPE of GL, GW, GP and GA all being below 3%, which is not impacted by gully morphology. On the other hand, the advantage of GE images lies in their ability to meet the interpretation accuracy requirements of conventional gully erosion research. The MAPE of the GHP mainly falls within the range of 1–3 m, while the MAPE of GL, GP and GA remains below 10%. However, one drawback is that the interpretation error is heavily influenced by morphological factors such as GW and SI; especially when obtaining width and area information, the morphological characteristics of the gully need to be carefully considered. Consequently, it is crucial to comprehensively consider the specific gully morphological characteristics based on the research objectives when selecting the appropriate images for gully erosion analysis.

Author Contributions

C.Z. and C.W.: conceptualization. C.Z., C.W. and Y.L.: methodology. C.Z. and Y.L.: software. Y.L.: validation. G.P., L.W. and H.S.: investigation. G.P., Y.L. and L.W.: resources. Y.L., L.W., C.Z. and H.S.: data curation. C.Z.: writing—original draft preparation. C.W., Y.L. and Q.Y.: writing—review and editing. C.W.: project administration. Q.Y.: research group leader. All authors have read and agreed to the published version of the manuscript.

Funding

This research was funded by the National Key R&D Program of China (grant number 2021YFD1500600) and the National Natural Science Foundation of China (grant number 41977062).

Data Availability Statement

Not applicable.

Conflicts of Interest

The authors declare no conflict of interest.

Appendix A

Table A1. Field investigation and measured information of gully morphological characteristics.
IDL/mW/mP/mA/m2D/mL/WW/DSICSA/m2
Loess gully (n = 32)01109.9813.00248.201269.534.858.472.681.7439.18
0242.0216.69120.20622.289.502.521.761.2091.25
0366.3427.70202.391723.7113.472.402.061.22250.97
0483.6624.70229.221915.3611.633.392.121.31219.34
0559.069.97151.40605.165.365.921.861.5432.30
0682.9725.99197.041800.929.083.192.861.16148.45
0780.6130.92202.262213.0711.142.612.781.07231.06
0841.7815.26127.44646.773.882.733.931.2541.69
0956.1917.00142.09852.737.053.312.411.2279.11
1030.8111.1478.40312.505.662.761.971.1140.00
1147.0027.78159.991221.1711.271.692.471.14179.49
1269.6216.38156.33972.234.984.253.291.2551.07
1354.5315.28135.22765.744.693.573.261.2246.50
1473.9018.27202.721287.028.884.042.061.41106.27
1555.3317.19145.05862.395.053.223.401.2358.99
1653.4717.58137.86888.615.903.042.981.1659.35
1735.4416.1891.03493.568.712.191.861.0282.54
1820.359.3352.73160.655.522.181.691.0431.78
1933.7211.0591.59362.654.793.052.311.2030.78
2047.9515.58117.82568.907.263.082.151.2366.00
2139.6113.95103.16504.994.982.842.801.1546.95
2239.6311.5593.45417.284.633.432.501.1430.52
2338.3816.18100.71553.536.512.372.491.0762.64
2483.4219.72219.791359.8011.494.231.721.49127.10
2533.0812.1492.11378.034.882.722.491.1839.64
2660.5426.04162.801388.1810.542.332.471.09184.50
2716.579.1342.10122.373.691.822.470.9515.92
2826.5712.1373.49290.725.782.192.101.0840.09
2936.551.1278.0646.190.1832.726.212.870.14
3031.971.3570.9337.260.1923.767.232.900.17
3115.167.2442.74107.083.492.102.071.0317.25
3221.979.8755.38183.169.342.231.061.0258.35
Black soil gully (n = 7)1164.482.93383.72506.491.1356.122.614.261.39
263.252.09152.29114.220.8530.312.453.560.95
3206.102.60431.49538.690.8079.233.254.651.39
445.153.45108.12139.440.8813.073.932.292.34
549.223.15113.92130.610.5415.613.932.291.35
650.314.28108.39187.190.3711.7511.611.980.72
771.672.25163.50163.510.4931.854.623.200.78
Note: L, gully length; W, gully width; P, gully perimeter; A, gully area; D, gully depth; L/W, the ratio of gully length to gully width; W/D, the ratio of gully width to gully depth; SI, the complexity of the gully shoulder line; CSA, the gully cross-sectional area.

References

  1. Castillo, C.; Gómez, J.A. A century of gully erosion research: Urgency, complexity and study approaches. Earth-Sci. Rev. 2016, 160, 300–319. [Google Scholar] [CrossRef]
  2. Vanmaercke, M.; Poesen, J.; Van Mele, B.; Demuzere, M.; Bruynseels, A.; Golosov, V.; Bezerra, J.F.R.; Bolysov, S.; Dvinskih, A.; Frankl, A.; et al. How fast do gully headcuts retreat. Earth-Sci. Rev. 2016, 154, 336–355. [Google Scholar] [CrossRef]
  3. Li, Y.; Poesen, J.; Yang, J.C.; Fu, B.; Zhang, J.H. Evaluating gully erosion using Cs-137 and Pb-210/Cs-137 ratio in a reservoir catchment. Soil Tillage Res. 2003, 69, 107–115. [Google Scholar] [CrossRef]
  4. Samani, A.N.; Wasson, R.J.; Malekian, A. Application of multiple sediment fingerprinting techniques to determine the sediment source contribution of gully erosion: Review and case study from Boushehr province, southwestern Iran. Prog. Phys. Geogr. -Earth Environ. 2011, 35, 375–391. [Google Scholar] [CrossRef]
  5. Zhang, T.Y.; Liu, G.; Duan, X.W.; Wilson, G.V. Spatial distribution and morphologic characteristics of gullies in the Black Soil Region of Northeast China: Hebei watershed. Phys. Geogr. 2016, 37, 228–250. [Google Scholar] [CrossRef]
  6. Gimenez, R.; Marzolff, I.; Campo, M.A.; Seeger, M.; Ries, J.B.; Casali, J.; Alvarez-Mozos, J. Accuracy of high-resolution photogrammetric measurements of gullies with contrasting morphology. Earth Surf. Process. Landf. 2009, 34, 1915–1926. [Google Scholar] [CrossRef]
  7. Wu, H.Y.; Xu, X.M.; Zheng, F.L.; Qin, C.; He, X. Gully morphological characteristics in the loess hilly-gully region based on 3D laser scanning technique. Earth Surf. Process. Landf. 2018, 43, 1701–1710. [Google Scholar] [CrossRef]
  8. Soil Science Society of America. Glossary of Soil Science Terms; Soil Science Society of America: Madison, WI, USA, 2016. [Google Scholar]
  9. Hauge, C. Soil erosion definitions. Calif. Geo. 1977, 30, 202–203. [Google Scholar]
  10. Poesen, J.; Vandaele, K.; Van Wesemael, B. Contribution of Gully Erosion to Sediment Production in Cultivated Lands and Rangelands. IAHS Publ. Ser. Proc. Rep. Intern Assoc Hydrol. Sci. 1996, 236, 251–266. [Google Scholar]
  11. Zhu, H.C.; Tang, G.A.; Qian, K.J.; Liu, H.Y. Extraction and analysis of gully head of Loess Plateau in China based on digital elevation model. Chin. Geogr. Sci. 2014, 24, 328–338. [Google Scholar] [CrossRef]
  12. Wang, Z.G.; Zhang, G.H.; Wang, C.S.; Xing, S.K. Gully Morphological Characteristics and Topographic Threshold Determined by UA V in a Small Watershed on the Loess Plateau. Remote Sens. 2022, 14, 3529. [Google Scholar] [CrossRef]
  13. Wu, Y.Q.; Cheng, H. Monitoring of gully erosion on the Loess Plateau of China using a global positioning system. Catena 2005, 63, 154–166. [Google Scholar] [CrossRef]
  14. Castillo, C.; Perez, R.; James, M.R.; Quinton, J.N.; Taguas, E.V.; Gomez, J.A. Comparing the Accuracy of Several Field Methods for Measuring Gully Erosion. Soil Sci. Soc. Am. 2012, 76, 1319–1332. [Google Scholar] [CrossRef]
  15. Ionita, I.; Niacsu, L.; Petrovici, G.; Blebea-Apostu, A.M. Gully development in eastern Romania: A case study from Falciu Hills. Nat. Hazards 2015, 79, 113–138. [Google Scholar] [CrossRef]
  16. Crouch, R.J. Short communications erosion processes and rates for gullies in Granitic soils Bathurst, New South Wales, Australia. Earth Surf. Process Landf. 1990, 15, 169–173. [Google Scholar] [CrossRef]
  17. Yuan, M.T.; Zhang, Y.; Zhao, Y.Y.; Deng, J.Y. Effect of rainfall gradient and vegetation restoration on gully initiation under a large-scale extreme rainfall event on the hilly Loess Plateau: A case study from the Wuding River basin, China. Sci. Total Environ. 2020, 739, 140066. [Google Scholar] [CrossRef]
  18. Potere, D. Horizontal Positional Accuracy of Google Earth’s High-Resolution Imagery Archive. Sensors 2008, 8, 7973–7981. [Google Scholar] [CrossRef]
  19. Na, J.M.; Yang, X.; Tang, G.A.; Dang, W.Q.; Strobl, J. Population Characteristics of Loess Gully System in the Loess Plateau of China. Remote Sens. 2020, 12, 2639. [Google Scholar] [CrossRef]
  20. Yang, X.; Na, J.M.; Tang, G.A.; Wang, T.T.; Zhu, A.X. Bank gully extraction from DEMs utilizing the geomorphologic features of a loess hilly area in China. Front. Earth Sci. 2019, 13, 151–168. [Google Scholar] [CrossRef]
  21. Chen, Y.H.; Jiao, J.Y.; Wei, Y.H.; Zhao, H.K.; Yu, W.J.; Cao, B.T.; Xu, H.Y.; Yan, F.C.; Wu, D.Y.; Li, H. Accuracy assessment of the planar morphology of valley bank gullies extracted with high resolution remote sensing imagery on the loess plateau, China. Environ. Res. Public Health 2019, 16, 369. [Google Scholar] [CrossRef]
  22. Prasad, D.; Sheshukov, A.Y.; Douglas-Mankin, K.R. Evaluating ephemeral gullies with a process-based topographic index model. Catena 2013, 113, 177–186. [Google Scholar]
  23. Wang, B.W.; Zhang, Z.X.; Wang, X.; Zhao, X.L.; Yi, L.; Hu, S.G. The Suitability of Remote Sensing Images at Different Resolutions for Mapping of Gullies in the Black Soil Region, Northeast China. Remote Sens. 2021, 13, 2367. [Google Scholar] [CrossRef]
  24. Dai, W.; Yang, X.; Na, J.M.; Li, J.W.; Brus, D.; Xiong, L.Y.; Tang, G.A.; Huang, X.L. Effects of DEM resolution on the accuracy of gully maps in loess hilly areas. Catena 2019, 177, 114–125. [Google Scholar] [CrossRef]
  25. Pu, L.M.; Zhang, S.W.; Wang, R.H.; Chang, L.P.; Yang, J.C. Analysis of Erosion Gully Information Extraction Based on Muti-resource Remote Sensing Images. Geogr. Geo-Inf. Sci. 2016, 32, 90–94. (In Chinese) [Google Scholar]
  26. Yan, Y.C.; Zhang, S.W.; Yue, S.P. Classification of Erosion Gullies by Remote Sensing and Spatial Pattern Analysis in Black Soil Region of Eastern Kebai. Sci. Geogr. Sin. 2007, 2, 193–199. (In Chinese) [Google Scholar]
  27. Zhang, Q.; Zhang, G.H.; Zhang, Y.; Wang, J.X.; Yu, S.W. Accuracy Analysis and Conversion Model of Gully Auto-matic Extraction based on Remote Sensing Images with Different Resolutions. Remote Sens. Technol. Appl. 2022, 37, 1217–1226. (In Chinese) [Google Scholar]
  28. Guan, Y.B.; Yang, S.T.; Zhao, C.S.; Lou, H.Z.; Chen, K.; Zhang, C.B.; Wu, B.W. Monitoring long-term gully erosion and topographic thresholds in the marginal zone of the Chinese Loess Plateau. Soil Tillage Res. 2021, 205, 104800. [Google Scholar] [CrossRef]
  29. Li, Z.; Zhang, Y.; Yang, S.; Zhu, Q.K.; Wu, J.H.; Ma, H.; He, Y.M. Error assessment of extracting morphological parameters of bank gullies by manual visual interpretation based on QuickBird imagery. Trans. Chin. Soc. Agric. Eng. 2014, 30, 179–186. (In Chinese) [Google Scholar]
  30. Yibeltal, M.; Tsunekawa, A.; Haregeweyn, N.; Adgo, E.; Meshesha, D.T.; Masunaga, T.; Tsubo, M.; Billi, P.; Ebabu, K.; Fenta, A.A.; et al. Morphological characteristics and topographic thresholds of gullies in different agro-ecological environments. Geomorphology 2019, 341, 15–27. [Google Scholar] [CrossRef]
  31. Liu, X.; Wang, C.M.; Pang, G.W.; Long, Y.Q.; Wang, L. Sensitive area simulation of ephemeral and permanent gullies based on slope-area relationship. Mt. Res. 2020, 38, 658–667. (In Chinese) [Google Scholar]
  32. Wang, R.H.; Zhang, S.W.; Pu, L.M.; Yang, J.C.; Yang, C.B.; Chen, J.; Guan, C.; Wang, Q.; Chen, D.; Fu, B.L.; et al. Gully Erosion Mapping and Monitoring at Multiple Scales Based on Multi-Source Remote Sensing Data of the Sancha River Catchment, Northeast China. ISPRS Int. J. Geo-Inf. 2016, 5, 200. [Google Scholar] [CrossRef]
  33. Yang, A.N.; Wang, C.M.; Pang, G.W.; Long, Y.Q.; Wang, L.; Cruse, R.M.; Yang, Q.K. Gully Erosion Susceptibility Mapping in Highly Complex Terrain Using Machine Learning Models. ISPRS Int. J. Geo-Inf. 2021, 10, 680. [Google Scholar] [CrossRef]
  34. Frankl, A.; Zwertvaegher, A.; Poesen, J.; Nyssen, J. Transferring Google Earth observations to GIS-software: Example from gully erosion study. Int. J. Digit. Earth 2013, 6, 196–201. [Google Scholar] [CrossRef]
  35. Yang, L.J.; Wang, C.M.; Zhang, C.M.; Pang, G.W.; Long, Y.Q.; Wang, L.; Liu, B.Y.; Yang, Q.K. Occurrence and development of newly formed gullies under extreme rainstorm conditions using remote sensing images. Trans. Chin. Soc. Agric. Eng. 2022, 38, 96–104. (In Chinese) [Google Scholar]
  36. Li, Z.; Qin, W.; Qi, Z.G.; Shang, G.F.; Ma, Q.T.; Guo, Q.K.; Yin, Z. Remote sensing analysis on gully morphology and spatial distribution in rolling hilly region and mountainous and hilly region of Northeast China. Trans. Chin. Soc. Agric. Eng. 2019, 35, 133–140. (In Chinese) [Google Scholar]
  37. Wu, J.G. Landscape Ecology Pattern, Process, Scale and Hierachy; Higher Education Press: Beijing, China, 2000; p. 107. (In Chinese) [Google Scholar]
  38. Li, Z.G.; Wang, Y.S.; Liu, X.C.; Liu, J.X. Survey methods and results of erosion gullies in black soil areas of northeastern China. Sci. Soil Water Conserv. 2013, 11, 9–13. (In Chinese) [Google Scholar]
  39. Piacentini, T.; Galli, A.; Marsala, V.; Miccadei, E. Analysis of Soil Erosion Induced by Heavy Rainfall: A Case Study from the NE Abruzzo Hills Area in Central Italy. Water 2018, 10, 1314. [Google Scholar] [CrossRef]
  40. Lou, H.Z.; Wang, P.F.; Yang, S.T.; Hao, F.H.; Ren, X.Y.; Wang, Y.; Shi, L.H.; Wang, J.; Gong, T.L. Combining and Comparing an Unmanned Aerial Vehicle and Multiple Remote Sensing Satellites to Calculate Long-Term River Discharge in an Ungauged Water Source Region on the Tibetan Plateau. Remote Sens. 2020, 12, 2155. [Google Scholar] [CrossRef]
  41. Frankl, A.; Stal, C.; Abraha, A.; Nyssen, J.; Rieke-Zapp, D.; De Wulf, A.; Poesen, J. Detailed recording of gully morphology in 3D through image-based modelling. Catena 2015, 127, 92–101. [Google Scholar] [CrossRef]
  42. Song, X.P.; Zhang, Y.; Wang, Z.Q.; Deng, J.Y.; Wang, J.X. Accuracy of gully morphological parameters extracted by UAV photogrammetry in the Loess Plateau. J. Beijing Norm. Univ. 2021, 57, 606–612. (In Chinese) [Google Scholar]
  43. Anderson, C.J. Comparing the Slope-Area Threshold for Stream Initiation in Primeval and Managed Forests of Northern Michigan. For. Sci. 2020, 66, 130–139. [Google Scholar] [CrossRef]
  44. Singh, B.M. Interpretation of satellite imagery for delineation of ravines. J. Indian Soc. Photo-Interpret. 1977, 5, 31–34. [Google Scholar] [CrossRef]
  45. Wang, C.M.; Cruse, R.M.; Gelder, B.; James, D.; Liu, X. Grid order prediction of ephemeral gully head cut position: Regional scale application. Catena 2021, 200, 105158. [Google Scholar] [CrossRef]
  46. Li, Z.; Zhang, Y.; Zhu, Q.K.; Yang, S.; Li, H.J.; Ma, H. A gully erosion assessment model for the Chinese Loess Plateau based on changes in gully length and area. Catena 2017, 148, 195–203. [Google Scholar] [CrossRef]
Figure 1. Illustration of study areas.
Remotesensing 15 04302 g001
Figure 2. Illustration of gully interpretation.
Remotesensing 15 04302 g002
Figure 3. Boxplots of gully morphology characterization index. (a) The L/W of gullies; (b) the W/D of gullies; (c) the SI of gullies. Note: L/W, gully length/gully width; W/D, gully width/gully depth; SI, the complexity of the shoulder line.
Remotesensing 15 04302 g003
Figure 4. Correlation between gully head positioning accuracy and morphology indexes. (a) Correlation between gully head point accuracy and gully width; (b) correlation between gully head point accuracy and SI index. Note: SI, the shoulder line complexity of the gully.
Remotesensing 15 04302 g004
Figure 5. The difference between gully length and width measured using RTK and images. (a) Gully length difference; (b) gully width difference. Note: UAV, Unmanned Aerial Vehicle; GE, Google Earth image.
Remotesensing 15 04302 g005
Figure 6. Correlation between gully width accuracy and gully morphological parameters. (a) Correlation between gully width accuracy and gully width; (b) correlation between gully width accuracy and gully SI index. Note: GE, Google Earth image; MAPE, the mean absolute percentage error; SI, the complexity of the gully shoulder line.
Remotesensing 15 04302 g006
Figure 7. The difference between the gully perimeter and area measured using RTK and images. (a) Gully perimeter difference; (b) gully area difference. Note: UAV, Unmanned Aerial Vehicle; GE, Google Earth image.
Remotesensing 15 04302 g007
Figure 8. The relationship between the accuracy of the gully area and gully morphological indexes. (a) Relationship between gully area accuracy and GW; (b) relationship between gully area accuracy and GA; (c) relationship between gully area accuracy and L/W; (d) relationship between gully area accuracy and SI. Note: MAPE, the mean absolute percentage error; L/W, length/width; SI, the complexity of the gully shoulder line.
Remotesensing 15 04302 g008
Table 1. The morphologies of gullies.
GL/mGW
/m
GP/mGA
/m2
GD/mL/WW/DSICSA/m2
Loess gully (n = 32) Max.109.9830.92248.202213.0713.4732.727.082.90250.97
Min.15.171.1242.1037.260.181.691.050.950.14
Mean49.6315.54128.87779.186.704.782.671.3278.42
Black soil gully (n = 7)Max.206.104.28431.48538.691.1379.2311.614.652.34
Min.45.152.09108.12114.220.3711.752.441.980.72
Mean92.882.97208.78254.310.7333.994.913.201.27
Note: GL, gully length; GW, gully width; GP, gully perimeter; GA, gully area; D, gully depth; L/W, gully length/gully width; W/D, gully width/gully depth; SI, the complexity of the gully shoulder line; CSA, the gully cross-sectional area.
Table 2. The distance between measured and interpreted gully head points.
Based on UAVBased on GE
Loess gully/m (n = 32)0.871.71
Black soil gully/m (n = 14)0.213.72
All gullies/m (n = 46)0.672.32
Note: UAV, Unmanned Aerial Vehicle; GE, Google Earth image; n, the number of samples.
Table 3. Errors of gully length and width measured using RTK and images.
NumberValue (m)MAEMSERMSENSEMAPE (%)
Gully LengthUAVLoess gully3249.670.320.170.410.990.79
Black soil gully793.020.240.110.330.990.35
All gullies3957.390.300.160.400.990.71
GELoess gully3249.821.322.801.670.993.39
Black soil gully791.862.0313.533.680.993.81
All gullies3957.371.454.732.170.993.46
Gully WidthUAVLoess gully3215.530.310.220.470.992.38
Black soil gully72.560.080.010.100.993.80
All gullies3913.200.270.180.420.992.63
GELoess gully3215.231.031.681.300.978.86
Black soil gully72.900.580.490.700.6424.05
All gullies3913.020.961.471.210.9811.59
Note: UAV, Unmanned Aerial Vehicle; GE, Google Earth image; MAE, the mean absolute error; MSE, the mean square error; RMSE, the root mean square error; NSE, the Nash–Sutcliffe efficiency coefficient; MAPE, the mean absolute percentage error.
Table 4. Errors of gully perimeter and area measured using RTK and images.
NumberValue (m)MAEMSERMSENSEMAPE (%)
Gully PerimeterUAVLoess gully32127.742.489.513.080.992.27
Black soil gully7210.082.548.212.870.991.43
All gullies39142.522.499.273.040.992.12
GELoess gully32131.456.1360.567.780.985.25
Black soil gully7211.4113.05361.9319.020.986.85
All gullies39145.817.37114.6510.710.985.53
Gully AreaUAVLoess gully32770.3017.07959.4130.970.992.72
Black soil gully7248.985.79108.6010.420.991.83
All gullies39676.7315.05806.7028.400.992.56
GELoess gully32784.1434.962229.0647.210.997.22
Black soil gully7292.6938.392722.4052.180.9415.24
All gullies39695.9335.582317.6148.140.998.66
Note: UAV, Unmanned Aerial Vehicle; GE, Google Earth image; MAE, the mean absolute error; MSE, the mean square error; RMSE, the root mean square error; NSE, the Nash–Sutcliffe efficiency coefficient; MAPE, the mean absolute percentage error.
Disclaimer/Publisher’s Note: The statements, opinions and data contained in all publications are solely those of the individual author(s) and contributor(s) and not of MDPI and/or the editor(s). MDPI and/or the editor(s) disclaim responsibility for any injury to people or property resulting from any ideas, methods, instructions or products referred to in the content.

