Communication

A Novel Approach to Predicting Urban Expansion by the Urban Scaling Law at a Single-City Scale

1
Institute of Transportation Engineering and Geomatics, Department of Civil Engineering, Tsinghua University, Beijing 100084, China
2
3S Center, Tsinghua University, Beijing 100084, China
3
Chongqing Geomatics and Remote Sensing Center, Chongqing 401147, China
*
Author to whom correspondence should be addressed.
Remote Sens. 2023, 15(17), 4326; https://doi.org/10.3390/rs15174326
Submission received: 4 June 2023 / Revised: 21 August 2023 / Accepted: 28 August 2023 / Published: 2 September 2023
(This article belongs to the Section Urban Remote Sensing)

Abstract

:
Rapid urban expansion caused by vigorous urban population growth brought up various socioeconomic and eco-environmental problems, which have important ramifications for sustainable development across the world. Along with the accelerated urbanization process, accurate and realistic prediction of urban expansion is of great importance to optimize urban planning and urban development. This study proposed a new hybrid model, which combined the urban scaling law (USL) with the ANN-CA model to predict urban expansion. To employ urban scaling law in the model, we innovatively calculated the law exponent at a single-city scale. Based on USL, we estimated urban land demand in the future by panel data regression. Finally, we added the area constraint and ecological constraint into the ANN-CA model to simulate urban expansion spatially. This frame of urban expansion has been successfully applied in Shenzhen, of which the urban land area would increase from 816.45 km2 in 2020 to 842.48 km2 in 2025. By comparing this model with the traditional prediction method, we proved its effectiveness and accuracy. Besides, we found that the scaling exponent can reflect urbanization level and distinguish overconstructed cities.

1. Introduction

Cities, home to more than 50 percent of the population in 2018 [1], have undergone rapid expansion in recent decades. Urban land area in China increased greatly from 6720 km2 in 1980 to 56,075 km2 in 2020, expanding even faster than the urban population [2]. Although cities provide extensive benefits to people’s lives, excessive urbanization has led to various problems, such as environmental degradation, social inequality, economic burdens, and health risks to human beings [3,4,5,6,7]. The goal of “Sustainable cities and communities” proposed by the UN Sustainable Development Goals (SDGs) highlights the importance of optimizing urban expansion spatially [8]. The urgency of controlling the unprecedented urban expansion rate has been well documented, making studies on the prediction of urban expansion a prevalent research project in recent decades [9,10,11,12]. Accurate and realistic prediction of urban expansion is crucial as the first step in urban planning, enabling policymakers to develop evidence-based and informed strategies to maintain urban sustainable development in both the eco-environment and socioeconomic sectors.
In modern times, satellite monitoring through remote sensing has provided ample spatiotemporal data to train models for predicting urban expansion. The procedure is typically divided into two steps: scale constraints and spatial prediction [13]. A significant body of literature has emerged around the incorporation of cellular automata (CA) with machine learning (ML) algorithms, which have proven effective in measuring, detecting, and predicting change processes. This approach has advanced in solving nonlinear characteristics and has been used to predict urban scale, analyze urban settlement patterns, track land cover changes, and assess spatial expansion. For instance, Araya and Cabral [14] conducted a study using the CA-Markov model to analyze and predict urban land use changes in Portugal by the year 2020. The results suggested that the study areas exhibited a tendency toward intensive urban growth. In a similar vein, Ouyang et al. [15] utilized a combination of the CA and system dynamics model to simulate urban development space from 2019 to 2035. The study’s findings indicated that the area of urban land would increase by 3.94–12.15% under various scenarios.
As the SDGs emphasize the importance of improving the eco-environment during urban development, several attempts have been made to adjust the urban scale by incorporating various ecological constraints into scale prediction. Surveys such as those conducted by Zhang et al. [16] proposed low-carbon management strategies to determine future urban land demand, Zhou et al. [17] added restrictions for ecological, farmland, and cultural protection into scale estimation, and Hou et al. [18] analyzed the spatial distribution of ecological corridors to calculate future urban area and avoid urban occupation. However, sustainable urban development should not only consider ecological conservation but also socioeconomic factors, as emphasized by Goal 11, “Sustainable cities and communities”. Although extensive research has been carried out on predicting urban scale under ecological-friendly scenarios, few studies emphasized the importance of considering urban interior development regulation, which includes not only the eco-environment but also socioeconomics [19]. Hence, ignoring human assistance and urban socioeconomic development restrictions in the model simulation leads to limited accuracy and reality, which makes these algorithms so far inadequate to support urban planning. To achieve sustainable development in both eco-environmental and socioeconomic aspects and present the objective regulation of the urban system, this paper combines the urban scaling law and ecological quality assessment with the ANN algorithm and CA models to predict urban expansion at a single-city scale.
Reflecting the relationship between population size and social characteristics in urban systems, urban scaling law is a theoretical framework to predict the spatial and social properties of cities, which have been observed in thousands of urban systems at different urbanization levels [20]. This regularity opens a window to the underlying mechanism and urban land dynamics of all cities [21]. The law provides a quantitative measure of scale effects and is an important tool for studying the phenomenon and inner logic during the complex urban expansion process. Although the law implies that it is possible to predict the variation of an individual city [22], previously published studies mainly focused on entire urban systems, which included many cities, to avoid mixing data for different cities [23]. Furthermore, transforming urban scaling laws from the domain of city systems to the context of individual cities presents a formidable challenge due to the inherent presence of scale effects. These laws, conventionally derived from observations spanning diverse urban landscapes, may exhibit diminished robustness and applicability when subjected to scrutiny at the scale of an individual city [20]. Urban scaling laws inherently hinge on the availability of comprehensive datasets, a resource that may be limited or incomplete when applied to a single city, particularly within the framework of long-term time series data [24,25]. Moreover, disparities in policies and urban planning strategies among cities wield a significant influence on urban development and characteristics, thereby engendering complexity in the harmonization of these factors within the scope of single-city scale research [26]. This paper overcomes these problems by theoretical calculation and approximate substitution and further applies the scaling law in a single city.
Taking Shenzhen, a megacity in China, as the study area, this paper aims to introduce and apply a new hybrid model, which employs the urban scaling law as the constraint of the ANN-CA model, to predict urban expansion. Compared with traditional simulation models, this method considered urban development regulation and nonlinear characteristics of land cover change, which makse it advanced in both statistical accuracy and realistic practice.

2. Materials and Methods

2.1. Study Area

Shenzhen, located in southern China with coordinates of 113°43′~114°38′E and 22°24′~22°52′N, is a key city within the Pearl River Delta urban agglomeration (Figure 1). Its rapid economic and social growth has propelled it to become one of the most vibrant economic hubs in China, with a Gross Domestic Product (GDP) that is superior only to Shanghai and Beijing [27]. According to the seventh national census bulletin, the permanent resident population of Shenzhen is 17,560,100, an increase of 7,136,100 compared to the sixth national census [28].
Given the shortage of suitable land resources for construction, Shenzhen has long grappled with the problem of accommodating a large population within a relatively small city. After years of intense land utilization and rapid urban expansion, the remaining land sources can no longer support Shenzhen’s boundless growth. Therefore, an intensive land-use strategy is the inevitable trend for Shenzhen’s future urban development. As the only first and second-tier city in China to have reduced land, the urban land area of Shenzhen decreased from 960.45 km2 in 2019 to 955.68 km2 in 2020. This study uses Shenzhen as a case study to provide a comprehensive and detailed reference for predicting urban expansion in similar megacities that aspire for intensive and high-quality development.

2.2. Data Collection

Previous studies have revealed that the urban scaling law is more applicable to municipal districts than the entire spatial scope of a city [29]. Therefore, the municipal districts of 293 prefectural cities serve as the basic research unit in this paper, and the urban land areas extracted from satellite images are used to characterize the scale of urban land. The urban property data used in this paper, including urbanization rate, GDP, and permanent resident population, are obtained from the China Statistical Yearbook of Urban Construction (2000–2020), the Shenzhen Statistical Yearbook (2021), and land cover dataset provided by Yang and Huang [30].
The CA model employed in this study uses spatiotemporal data that includes land use, urban impervious surface, the digital elevation model (DEM), population density, road network, water bodies, ecological conservation redline, and points of interest (POI), with detailed information presented in Table 1. Before constructing the CA model, all data were resampled to a spatial resolution of 30 m.

2.3. Methods

This paper integrates scaling and ecological constraints to model urban spatial expansion (Figure 2) accurately. Initially, we extracted urban impervious areas from spatial data and incorporated statistical data to compute the exponent β for Shenzhen and other representative cities at the individual city scale, a pivotal step in our methodology. Subsequently, we integrated this exponent into the regression model as an adjusted parameter, enabling the accurate and practical prediction of urban land area demand, thereby adhering to the scaling constraint. Concurrently, we employed the Invest model to evaluate ecological quality, establishing the ecological constraint of Shenzhen. Upon obtaining both constraints, this study utilizes the ANN-CA model. This model encompasses both driving factors (determined by transformation probability) and limiting factors that influence urban expansion. The subsequent section outlines the detailed calculation methodologies for each of these procedures.

2.3.1. Urban Scaling Law for the Single City

The urban scaling law describes a universal power-law relationship between urban properties and urban population, which can be mathematically expressed as [24].
Y = Y 0 N β
where, Y = [Y1, Y2, Y3, …, Yn] ∈ R, denotes a given urban property of a city, such as urban land in this study. N = [N1, N2, N3, …, Nn] ∈ R, denotes the urban population of the city; Y0 is a normalization constant independent of N; and β is the scaling exponent, of which the value falls into three categories. The value of β determines the scaling exponent, which falls into one of three categories: superlinear (β > 1, such as wages, which would increase per capita with city growth), linear (β = 1, such as individual water consumption, which would keep stable with city growth), and sublinear (β < 1, such as roads, cables, and urban land area, by which the volume occupied per capita decreases with city growth), respectively [36].
Although applying this law at a single-city scale can be difficult, the relationship between urban population and most urban properties characterized by the urban scaling law has been widely demonstrated in various urban systems [37,38,39]. The healthy development of a single city within an urban system should also conform increasingly to the scaling law. Therefore, the mathematical expression of the urban scaling law of a single city can be derived.
In Equation (1), the parameters Y0 and β are estimated by the least squares method based on the data collected for a city, denoted by (N, Y).
Y c , N c , β c , Y 0 _ c , s . t . Y c = Y 0 _ c N c β c
For a given urban system, there exists a unique set of eigenvectors βc = [β1, β2, β3,…,βn] ∈ R, each β denotes the scaling exponent of a given city, and Y0 = [Y0_1, Y0_2, Y0_3, …, Y0_n] ∈ R, which satisfy the Equation (2). Where, Yc is the urban property of a given city, Nc denotes the population of the given city, βc and Y0_c represent the theoretically predicted values for the given city c. This Equation indicates that for a given city c in the urban system, we can theoretically calculate the scaling exponent βc. However, due to the lack of parameters for the entire urban system, the eigenvalues cannot be calculated. Since urban scaling law characterizes the heterogeneous growth of cities, Y0 is usually considered as the size-independent parameter [40]. Hence, this paper assumed that in a given urban system, Y0_c can be replaced by Y0, the constant derived from the entire system:
Y 0 _ c = Y 0 ^
Based on the consumption expressed by Equation (3), we obtain the scaling exponent βc of a single city:
β c = ( log Y c log Y 0 ^ ) / log N c

2.3.2. Estimation of Urban Land Demand

This paper employs the panel data regression model to predict the future urban land demand. Urban land can be easily influenced and constrained by socioeconomic factors in the city. Specifically, we used the per capita GDP and urbanization rate data to calculate the per capita urban land demand [41].
C U t = a 0 + a 1 × G D P C t + a 2 × P U t + ε t
where, CU is the per capita urban land demand, PU denotes the urbanization rate, a0 is the constant, a1 and a2 represent the estimated parameters, ԑ represents the error term, and t refers to the year.
On the basis of Formulas (2) and (5), the urban land area can be expressed as follows:
Y t = Y 0 × N β t = C U t × N
Therefore, the exponent βt can be expressed by CUt.
β t = log C U t log Y 0 log N + 1
To improve the accuracy and reflect the law of urban development, this paper initially combined scaling exponent β with a regression model to reflect the sublinear relationship between urban land area and population. Empirical results have indicated that βc of urban land would gradually decrease during the urbanization process [23,42], which means that the βc,t should be less than βc,t−1. If βc,t is less than βc,t−1, prediction results accord with the law of healthy urban development, and the predicted value remains unchanged. Otherwise, a constraint should be added to the formula, which can be expressed by the Equation as follows, where CU’t denotes the per capita urban land demand that has been corrected by urban scaling law:
C U t = exp log N t log N ( t 1 ) × ( log C U t 1 log Y 0 , t 1 ) + log Y 0 , t   if   β t > β t - 1   C U t   if   β t β t - 1

2.3.3. CA-Based Hybrid Model Construction

The hybrid model proposed in this paper is based on the combination of the CA model and ANN model, which incorporates the urban scaling law and ecological constraints. First, we used ANN provided by the FLUS model [43] to obtain the suitability probability (SP) of urban land area within the study range from the first-phase land use data and various driving factors, including human activities and natural effects. An ANN configured with multiple input and output neurons typically comprises three distinct layers: an input layer, a hidden layer, and an output layer. Within the input layer, individual neurons correspond to distinct input variables, such as independent spatial variables, socioeconomic variables, and natural climate variables. Conversely, each neuron residing in the output layer corresponds specifically to a distinct land use category. The output layer’s neuron values generate representations of the probability of a particular land use category occurring within a given grid cell. Elevated neuron values signify a greater likelihood of the grid cell being associated with the target land use category. To simulate future spatial patterns in response to specified land use demands, a CA model has been developed. The CA simulation unfolds in two primary steps. First, an artificial neural network is employed to train and estimate the probability of each land use category occurring within a specific grid cell. Subsequently, an intricate self-adaptive inertia and competition mechanism is formulated to address the dynamic competition and interactions among various land use categories. Through these two successive steps, the cumulative probabilities for all land use categories within each grid cell are estimated, leading to the allocation of the dominant land use category during the CA iteration. The transformation probability determines the change of cellular states, which is composed of five parts: the overall development suitability determined by socioeconomic, geographical, and ecological factors, Plogistic; the influence of the conversion from nonurban land to urban land of different land types in the cell, Pweight; the neighborhood effect derived from nearby cells, Pneighbor; the suitability probability calculated by ANN, SP; and a stochastic factor, RA. The formula is as follows:
P value   = P logistic   × P weight   × P neighbor   × R A × S P
The hybrid model (Figure 2) uses the predicted value of urban land area by the urban scaling law with urban scaling law as a scale constraint, and the ecological protection red line provided by the government and the ecological quality evaluated by the InVEST model as ecological constraints. The process of simulating the spatial distribution of urban expansion in the hybrid model involves several steps. Firstly, the ecological protection red line is used as a rigid constraint, and the internal area is not allowed to develop into the land in the process of urban expansion simulation. Secondly, the ecological quality assessment results are ranked from levels one to five, and nonurban cells at levels four and five cannot change states to preserve the high quality of urban ecology. Thirdly, the urban land area simulated by the CA model is compared with the predicted value, and if the simulation result is less than the prediction value, the iteration of the CA model is repeated. If not, the CA model needs to exclude the cells with the lowest transformation probability to make these two values equal and then output the simulation result. Finally, the hybrid model conducts threshold tests and edge detection on the simulation results of urban expansion to obtain the final spatial distribution results of urban expansion.

3. Results

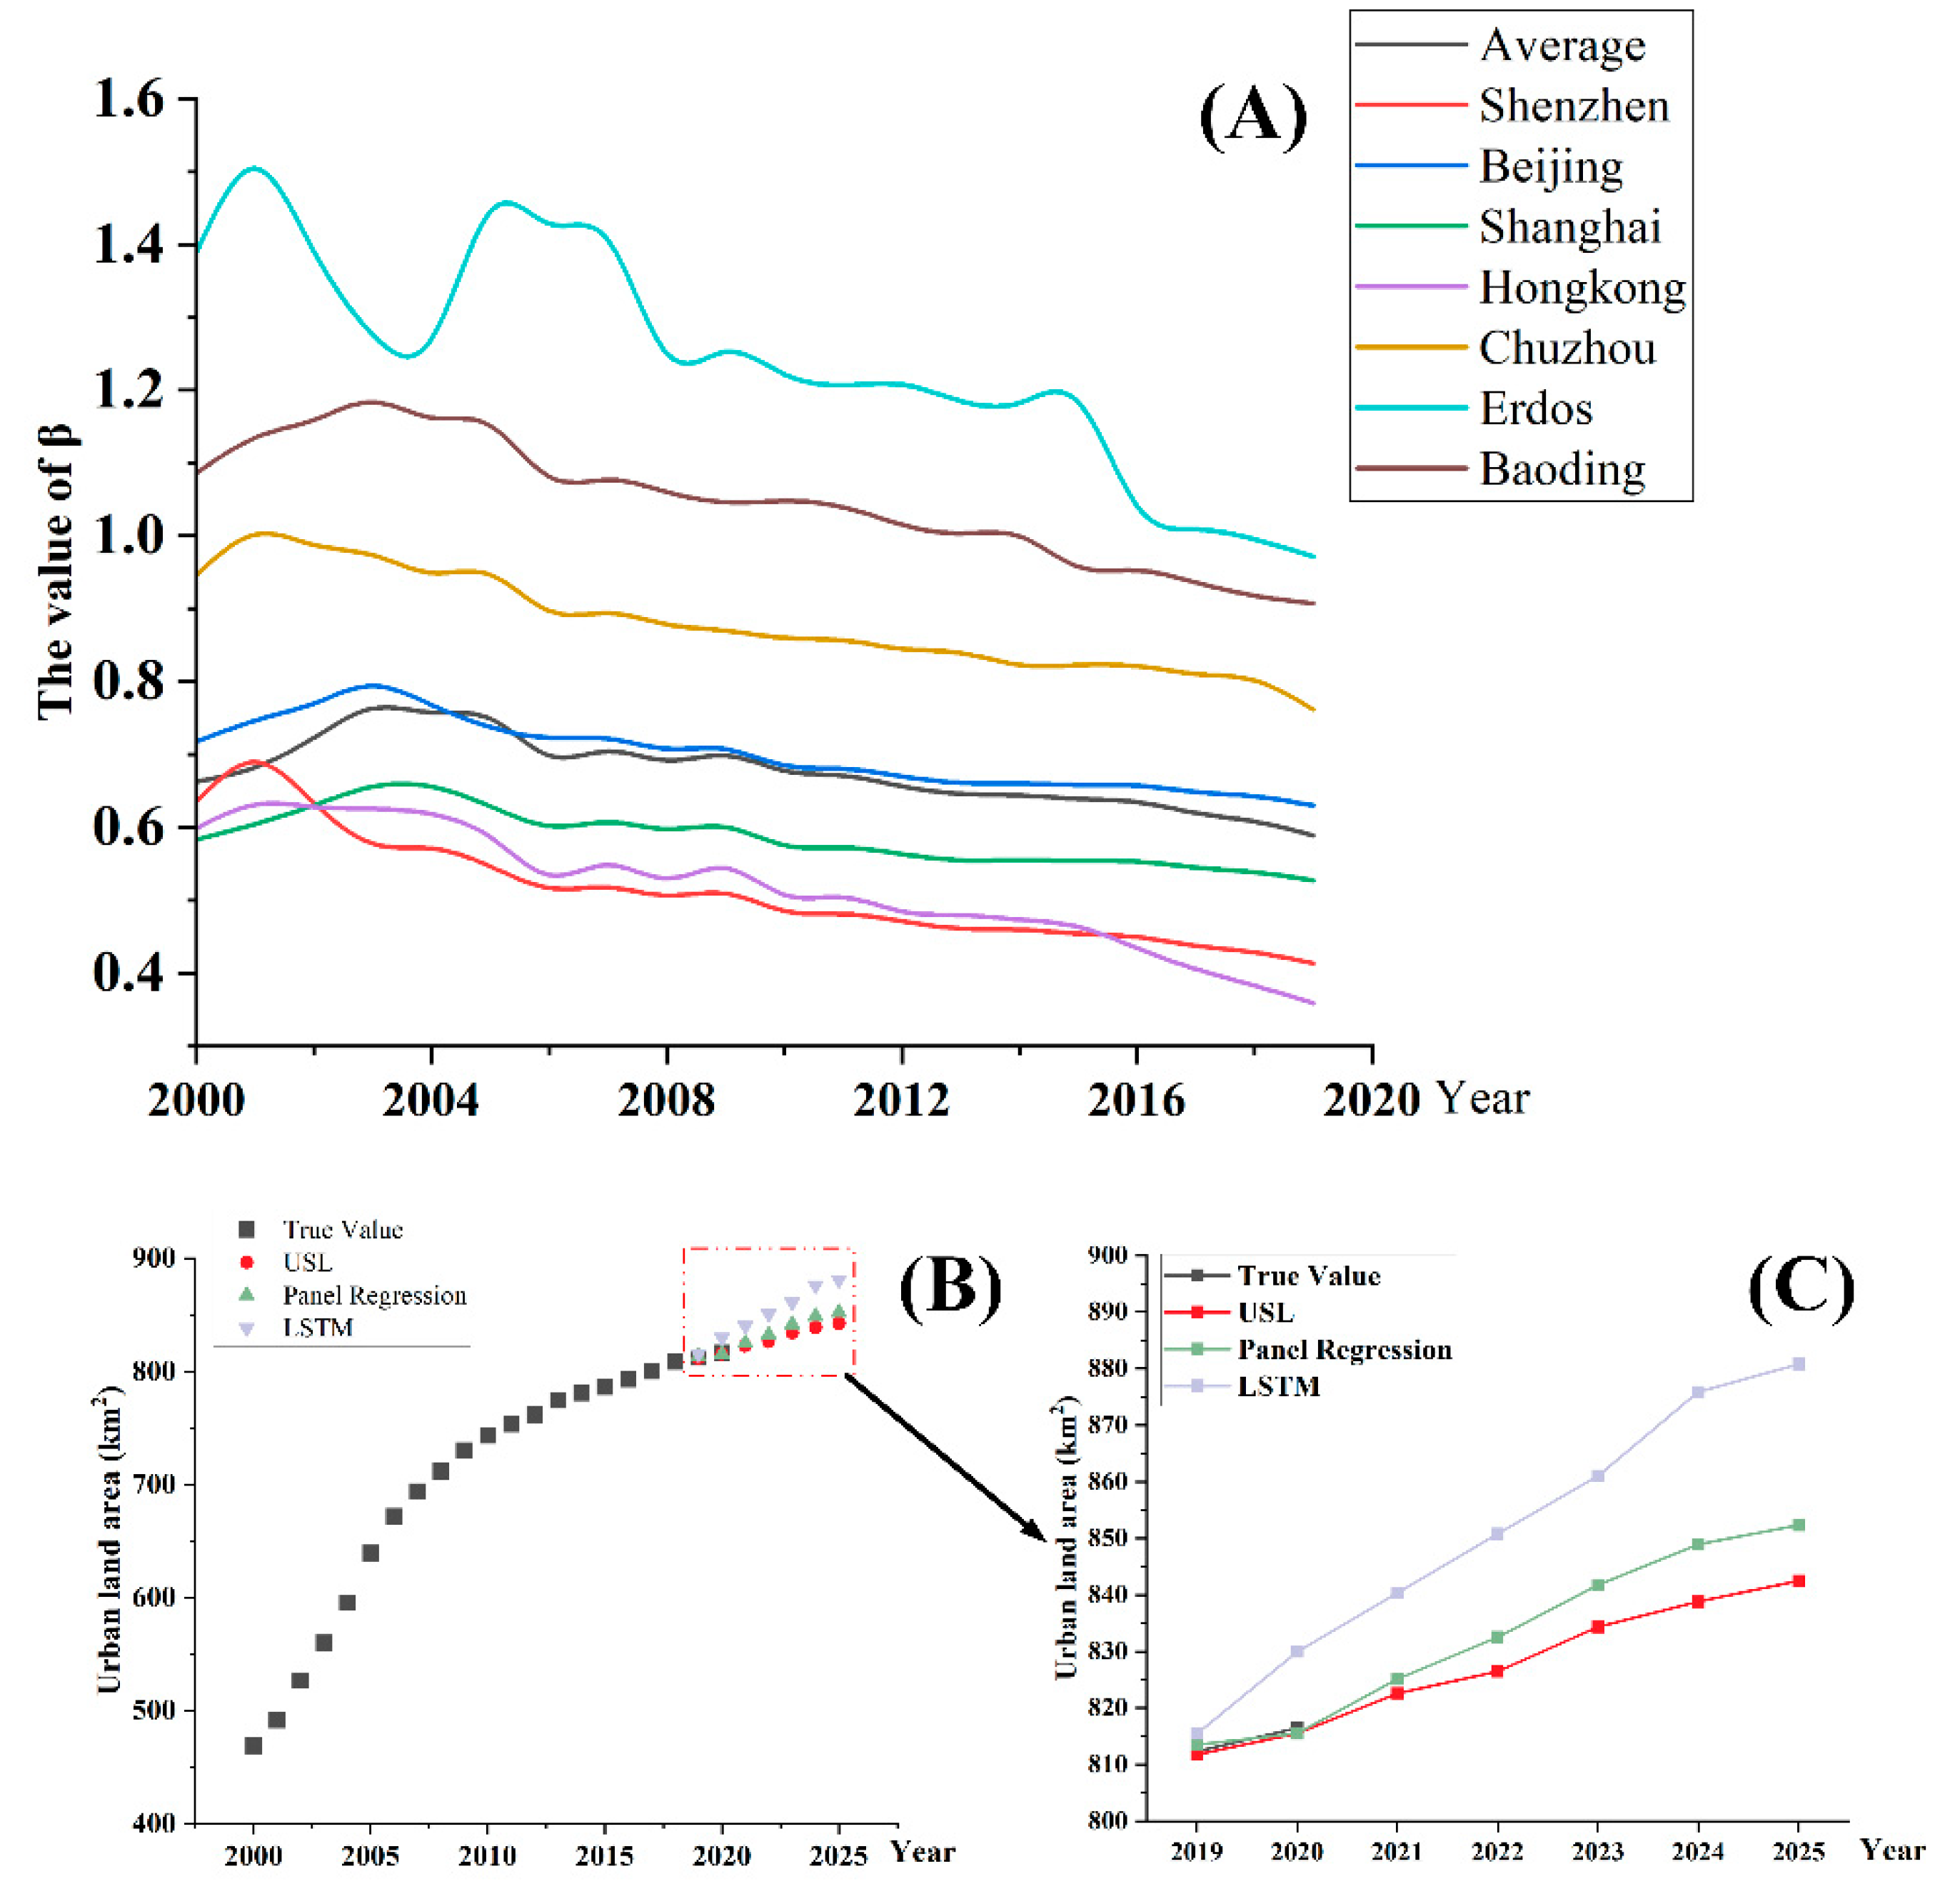
3.1. Urban Scaling Law Exponent of a Single City

This study analyzed the exponent of the urban scaling law for Chinese cities at both the national and single-city scales from 2000 to 2019. Four megacities, Beijing, Shanghai, Hong Kong, and Shenzhen, and three typical “ghost cities” [44,45], Baoding, Ordos, and Chuzhou, were selected to calculate their exponents β, to prove the effectiveness of the urban scaling law in indicating regularity and characteristics of urban expansion. The term “ghost city” originally refers to an abandoned city that has died due to resource depletion or market shift, such as Detroit in the USA [46,47]. However, the ghost city in China refers to a totally different phenomenon, which was mainly caused by an extensive newly constructed area. The ghost cities experienced urban overexpansion, excessive development, and insufficient population, resulting in a large number of idle constructions. There are several obvious characteristics of a ghost city: (1) the population density is very low compared to the normal living space; (2) the building vacancy rate in a ghost city is much higher than that of other cities; (3) as we can infer, the exponent β of a ghost city will significantly be in excess of the general level.
The variations of the exponents for different cities generally presented a downward trend from 2000 to 2019 (Figure 3), indicating that urban land use gets more intensive with urban development under restrictive urban planning policies. The curve of β_average first increased from 0.72 in 2000 to 0.76 in 2005, then kept decreasing to 0.59 in 2019. The trend suggested that, from 2001 to 2005, the speed of urban land expansion exceeded the population increase, and after that, the urban land expansion gradually slowed down compared with population growth.
The rank of β for megacities was β_Beijing (0.63 in 2019) > β_Shanghai (0.52 in 2019) > β_Shenzhen (0.41 in 2019) > β_Hong Kong (0.36 in 2019), exactly contrary with the rank of GDP density (unit: yuan per square kilometer): Beijing (0.216 billion in 2019) < Shanghai (0.602 billion in 2019) < Shenzhen (1.348 billion in 2019) < Hong Kong (2.394 billion in 2019). Figure 3 showed that despite the value of β for the three typical ghost cities decreasing obviously, they were still significantly larger than that of the average level, reaching two times, even three times, the value of megacities as well. The calculation results of both megacities and ghost cities corresponded with the theory proposed in Section 2.2 that the more intensive the urban development, the smaller the value of β. Besides, with the transformation of urban development from rapid expansion at the early stage to low-speed expansion at the relatively mature stage, the value of β will gradually decrease.

3.2. Spatial Simulation of Urban Land Expansion and Validation

The predicted results of the urban land area and the corresponding urban scaling law index from 2020 to 2025 are presented in Figure 3. After considering the constraints of the urban scaling law, the growth rate of the predicted value of the urban land area slowed down significantly, and the predicted values were much lower. From 2000 to 2025, the annual growth of urban land area gradually decreased with an obvious trend of intensive land use, which was consistent with the urban planning orientation in Shenzhen as well as the objective law of healthy urban development.
Based on the predicted value calculated by the regression model and urban scaling law, this study used the ANN-CA model to simulate future urban land expansion from 2019 to 2025 at a 30-m resolution, among which the result of 2019 was used to compare with the true urban land cover. The comparison of the simulated result and the true urban land area in 2019 (Figure 4) showed that the two maps were reasonably similar. Kappa variations and Figure of Merit (FoM) were used to investigate the detailed validation further. The accuracy of urban land use is 87.46%, the total simulation accuracy is 87.95%, the Kappa coefficient is 88.23%, and the FoM value is 0.4314. The accuracy evaluation results should be viewed objectively: on the one hand, when the Kappa coefficient is greater than 80%, the consistency of prediction results reaches an excellent level [48]. On the other hand, due to the influence of political, socioeconomic, and other factors in the actual process of urban construction, the importance of ecological factors may not be considered enough. In the process of urban expansion simulation, this paper considers the ecological rigid constraints and elastic constraints and strives to simulate a scientific urban expansion situation that takes into account both urban expansion and ecological protection. The result will be different from the actual urban construction area.
After the validation of the hybrid ANN-CA model, urban land area projection from 2020 to 2025 was performed in the same way (Figure 4). The newly expanded urban areas are mainly concentrated in Baoan District and Longgang District, which will be the main urban development areas in the future. From 2020 to 2025, the urban land areas will expand slowly and mainly be centered in certain districts. The simulation results are consistent with the main regional and urban land scale control guidelines for future urban development pointed out in Shenzhen urban planning documents [49].

4. Discussion

4.1. The Implication of Exponent β

This study proposed a more effective and precise approach for predicting urban expansion in Shenzhen by combining the urban scaling law (USL) and panel data regression model at the single city level. For applying the USL, which reflects the development regulation of the entire urban system, to predict the future development of a single city, the quantitative calculation method of the USL exponent of a single city is proposed. Different from the method of fitting the USL parameters based on the multi-year urban property data [41], this paper regards Y_0 as a standardized constant, which can be obtained by fitting the USL parameters from the data of the national urban system in the same year, and then calculates β_c by extracting the urban property data of each city. Taking four megacities: Shenzhen, Beijing, Shanghai, and Hong Kong, and three “ghost cities”: Ordos, Baoding, and Chuzhou, as examples, this study proposed the annotation of the exponent β_c. Despite the fact that the results show that β_c can be used to compare the effect of city size between different cities and analyze the development of single cities, its sociological significance and mathematical meaning still need to be further explored. In this study, we concluded that this index could be regarded as an indicator of measuring the urbanization level and the development condition.
On the one hand, the rank of the value of β for four megacities suggested that when urbanization gets more mature, the value will gradually decrease. This phenomenon can be caused by the unproportionable rate between the increase in population and urban land area. When a city passes through the phases of rapid expansion and develops into a mature stage, the increase of urban land area will inevitably slow down, which has been observed in many megacities [5,7]. In contrast, the immense socioeconomic activity and the sufficient job market attracted more and more people who immigrated from the adjacent rural area to the megacity, known as the urban siphon effect [50]. Hence, the value of β will gradually decrease until the urban population capacity gets saturated; after that, the increase of urban land expansion and population will reach the proportional speed, of which β_c is exactly the proportion rate.
On the other hand, an extremely high value of β for a single city compared with that in one urban system indicates that this city may be experiencing extensive new construction characterized by severe undercapacity. The National Development and Reform Commission of China conducted an investigation on urban construction in 2016. The result suggested that nearly 3500 new towns and districts had been planned and constructed [51], which can accommodate as many as 3.4 billion people if totally filled [52]. This unusually large number is even 2.4 times the Chinese population in 2022 (1.41 billion). Under this context, there exist a large number of new neighborhoods that feature a very low population density [53], causing the value of β for the city to be abnormally high. In other words, this is an effective index to explore the “ghost city” phenomenon.

4.2. The Comparison between USL and the Traditional Prediction Method

This study intuitively proposed a new method to calculate the USL exponent β at the single-city scale and further combined USL and the regression model to provide a new frame for predicting urban land demand. Finally, on the basis of area projection, the spatial simulation of urban land area was conducted by the ANN-CA model. To prove the effectiveness of urban scaling law in predicting the urban land area, this study applied the other two methods: (1) traditional panel data regression and (2) a long short-term model (LSTM) to recalculate the urban land demand in Shenzhen from 2019 to 2025 (Figure 3). The traditional panel data regression refers to the calculation process that excludes the correction by the USL exponent. As a time-recursive neural network, LSTM has proven that it can effectively predict land cover change, owing to the spatiotemporal characteristics of input data [54,55,56]. There are many factors influencing the scale of urban land in China, and the interaction mechanism is very complex. The advantage of a neural network model lies in its ability to mine the features and connections in complex data and its good prediction accuracy, while the disadvantage lies in the lack of interpretation of its prediction results and the high dependency on adequate data. Figure 3 indicates the predicted value by three methods and the true value extracted from the land use data for 2019 and 2020. The most obvious finding to emerge from the analysis is that the projection by LSTM was much larger than the other two methods. For example, the urban land area in 2025 projected by LSTM was 880.77 km2, while the results by the USL-regression and panel data regression method were 842.48 km2 and 852.31 km2, respectively (Figure 3). Comparing the true urban land area with the predicted results in 2019 and 2020, which are 812.30 km2 and 816.45 km2, there is an obvious discrepancy between the true value and the predicted value by the LSTM and panel data regression. However, the result predicted by USL regression is very close to the true value, with a relative error of less than 0.12%. Besides, we calculated the Kappa coefficients, FoM, and the total accuracy of simulated urban land area in 2019 of the three models (Table 2). The comparison indicated that the hybrid model performed the highest accuracy. In summary, the results calculated by traditional panel data and the LSTM model both presented an increasing gap between the real world and the prediction. A possible explanation for this might be that these two methods lack consideration of urban development regulation. Due to the city continually transforming from the initial stage with rapid expansion speed to a mature stage with low-speed construction and expansion, the annual urban land demand would decrease accordingly. Corrected by USL at the single-city scale, the diminished urban land demand could be detected and taken into consideration, which enhances the prediction accuracy and makes sure that the city keeps a healthy development trend.
Therefore, this paper introduces the urban scaling law, which can reflect the objective regulation of urban development, into the panel regression model to constrain unlimited urban expansion. The results show that the average relative error of the urban land area prediction is quite small, which is consistent with the urban expansion speed in the real world. More importantly, after considering the constraints of the urban scaling law, the growth rate of the predicted value of the urban land area slows down significantly, and the urban scaling law index decreases, which is more in line with the concept of “building a compact and intensive urban space system” pointed out in the Sustainable Development Plan of Shenzhen City (2017–2030). Compared with the simulation results of urban expansion without considering habitat quality and size constraints, adding the constraint derived from USL and the eco-environment can effectively improve the simulation accuracy of urban expansion. In addition, the new urban land pixels can avoid the areas with good habitat quality and avoid or reduce the damage of urban construction to the ecological environment. At the same time, the expansion speed and spatial distribution of the city are more consistent with the law of urban development. On the basis of urban expansion simulation, the urban development boundary of Shenzhen in 2025 can be further delimited according to the principle of centralized contiguous areas, which provides a reference for guiding the healthy development of Shenzhen.

4.3. Limitations and Future Study

This research was conducted in Shenzhen, a prototypical megacity in China. When calculating the urban scaling law (USL) exponent for an individual city, the selection of an appropriate urban system to compute the average exponent becomes pivotal. For instance, Shenzhen can be classified within the megacity system while simultaneously existing within the prefecture-level city system of China. The choice of differing urban systems introduces variations in the calculated average exponent, denoted as β0, subsequently influencing the specific value assigned to each individual city’s exponent. This aspect warrants comprehensive exploration in future inquiries. Moreover, a city’s spatial extent can be delineated by administrative boundaries, which may also correspond to its tangible morphological urban zones. It is advisable to engage in comparative analyses that encompass various statistical standards, such as divergent “city” definitions. Furthermore, the phenomenon of China’s “ghost cities” has surfaced within dynamic regions, potentially leading to an inflation of the USL exponent for a given city. Therefore, there is a noteworthy prospect for forthcoming investigations to integrate this phenomenon with the application of the USL exponent.

5. Conclusions

Recently, accurate urban expansion projection has become an important research area as it plays a crucial role in urban planning and development for policy makers. Taking Shenzhen, a megacity in China as the study area, this paper proposed a new frame to predict urban expansion. First, we overcome the difficulty in the unsuitability of urban scaling law at the single-city level and present a method to calculate the exponent β for a single city. Then we combine USL with panel data regression by mathematical derivation to calculate the urban land demand, which is more accurate as well as in line with the urban development regulation compared with the traditional method. After that, we add the size constraint and ecological constraint into the ANN model to simulate the suitability probability of urban land areas. Finally, the spatial simulation of urban land area is conducted based on the CA model. By comparing this frame with the traditional urban land projection process, the result presented a higher Kappa coefficient and FoM, with a much more accurate urban land demand prediction. In addition, we explained the meaning of exponent β at the single-city level, which can be regarded as an index for measuring the urbanization level and detecting the “ghost city”.

Author Contributions

Conceptualization, H.Y. and H.Z.; methodology, H.Y., Z.Z. and X.L.; validation, H.Y. and H.Z.; investigation, H.Y. and H.Z.; resources, H.Z.; data curation, S.W.; writing—original draft preparation, H.Y.; writing—review and editing, H.Y.; visualization, H.Y.; supervision, H.Z.; project administration, H.Z.; funding acquisition, H.Z. All authors have read and agreed to the published version of the manuscript.

Funding

This research was funded by the National Natural Science Foundation of China under Grant No. 41971379, and National Key Research and Development Program of China under Grant No. 2018YFB2100703.

Data Availability Statement

All data used in this paper is available by request.

Acknowledgments

We thank the efforts of anonymous reviewers and the editor for their valuable comments and suggestions to improve the quality of the paper.

Conflicts of Interest

The authors declare no conflict of interest.

References

  1. United Nations, Department of Economic and Social Affairs, Population Division. World Urbanization Prospects: The 2018 Revision (ST/ESA/SER.A/420); United Nations: New York, NY, USA, 2019. [Google Scholar]
  2. Seto, K.C.; Sanchez-Rodriguez, R.; Fragkias, M. The New Geography of Contemporary Urbanization and the Environment. Annu. Rev. Environ. Resour. 2010, 35, 167–194. [Google Scholar] [CrossRef]
  3. Li, Y.; Ye, H.; Sun, X.; Zheng, J.; Meng, D. Coupling Analysis of the Thermal Landscape and Environmental Carrying Capacity of Urban Expansion in Beijing (China) over the Past 35 Years. Sustainability 2021, 13, 584. [Google Scholar] [CrossRef]
  4. Lafortezza, R.; Sanesi, G. Nature-Based Solutions: Settling The issue of Sustainable Urbanization. Environ. Res. 2019, 172, 394–398. [Google Scholar] [CrossRef] [PubMed]
  5. Li, Y.; Ye, H.; Gao, X.; Sun, D.; Li, Z.; Zhang, N.; Leng, X.; Meng, D.; Zheng, J. Spatiotemporal Patterns of Urbanization in the Three Most Developed Urban Agglomerations in China Based on Continuous Nighttime Light Data (2000–2018). Remote Sens. 2021, 13, 2245. [Google Scholar] [CrossRef]
  6. Kovacs, Z.; Farkas, Z.J.; Egedy, T.; Kondor, A.C.; Szabo, B.; Lennert, J.; Baka, D.; Kohan, B. Urban Sprawl and Land Conversion in Post-Socialist Cities: The Case of Metropolitan Budapest. Cities 2019, 92, 71–81. [Google Scholar] [CrossRef]
  7. Ye, H.; Li, Z.; Zhang, N.; Leng, X.; Meng, D.; Zheng, J.; Li, Y. Variations in the Effects of Landscape Patterns on the Urban Thermal Environment during Rapid Urbanization (1990–2020) in Megacities. Remote Sens. 2021, 13, 3415. [Google Scholar] [CrossRef]
  8. Zhou, M.; Ma, Y.; Tu, J.; Wang, M. SDG-Oriented Multi-Scenario Sustainable Land-Use Simulation under the Background of Urban Expansion. Environ. Sci. Pollut. Res. 2022, 29, 72797–72818. [Google Scholar] [CrossRef]
  9. Boulila, W.; Ghandorh, H.; Khan, M.A.; Ahmed, F.; Ahmad, J. A Novel CNN-LSTM-Based Approach To Predict Urban Expansion. Ecol. Inform. 2021, 64, 101325. [Google Scholar] [CrossRef]
  10. Koko, A.F.; Han, Z.; Wu, Y.; Abubakar, G.A.; Bello, M. Spatiotemporal Land Use/Land Cover Mapping and Prediction Based on Hybrid Modeling Approach: A Case Study of Kano Metropolis, Nigeria (2020–2050). Remote Sens. 2022, 14, 6083. [Google Scholar] [CrossRef]
  11. Yussif, K.; Dompreh, E.B.; Gasparatos, A. Sustainability of Urban Expansion in Africa: A Systematic Literature Review Using the Drivers-Pressures-State-Impact-Responses (DPSIR) Framework. Sustain. Sci. 2023, 18, 1459–1479. [Google Scholar] [CrossRef]
  12. Zhao, L.; Liu, X.; Xu, X.; Liu, C.; Chen, K. Three-Dimensional Simulation Model for Synergistically Simulating Urban Horizontal Expansion and Vertical Growth. Remote Sens. 2022, 14, 1503. [Google Scholar] [CrossRef]
  13. Wang, J.; Fang, C. Growth of Urban Construction Land: Progress and Prospect. Prog. Geogr. 2011, 30, 1440–1448. [Google Scholar]
  14. Araya, Y.H.; Cabral, P. Analysis and Modeling of Urban Land Cover Change in Setubal and Sesimbra, Portugal. Remote Sens. 2010, 2, 1549–1563. [Google Scholar] [CrossRef]
  15. Ouyang, X.; Xu, J.; Li, J.; Wei, X.; Li, Y. Land Space Optimization of Urban-Agriculture-Ecological Functions in the Changsha-Zhuzhou-Xiangtan Urban Agglomeration, China. Land Use Policy 2022, 117, 106112. [Google Scholar] [CrossRef]
  16. Zhang, Y.; Liu, Y.; Wang, Y.; Liu, D.; Xia, C.; Wang, Z.; Wang, H.; Liu, Y. Urban Expansion Simulation towards Low-Carbon Development: A Case Study of Wuhan, China. Sustain. Cities Soc. 2020, 63, 102455. [Google Scholar] [CrossRef]
  17. Zhou, L.; Dang, X.; Sun, Q.; Wang, S. Multi-Scenario Simulation of Urban Land Change in Shanghai by Random Forest and CA-Markov Model. Sustain. Cities Soc. 2020, 55, 102045. [Google Scholar] [CrossRef]
  18. Hou, W.; Zhou, W.; Li, J.; Li, C. Simulation of the Potential Impact of Urban Expansion on Regional Ecological Corridors: A Case Study of Taiyuan, China. Sustain. Cities Soc. 2022, 83, 103933. [Google Scholar] [CrossRef]
  19. Aburas, M.M.; Ahamad, M.S.S.; Omar, N.Q. Spatio-Temporal Simulation and Prediction of Land-Use Change Using Conventional and Machine Learning Models: A Review. Environ. Monit. Assess. 2019, 191, 205. [Google Scholar] [CrossRef]
  20. Bettencourt, L.M.A. The Origins of Scaling in Cities. Science 2013, 340, 1438–1441. [Google Scholar] [CrossRef]
  21. Bettencourt, L.; West, G. A Unified Theory of Urban Living. Nature 2010, 467, 912–913. [Google Scholar] [CrossRef]
  22. Barthelemy, M. The Statistical Physics of Cities. Nat. Rev. Phys. 2019, 1, 406–415. [Google Scholar] [CrossRef]
  23. Alvioli, M. Administrative Boundaries and Urban Areas in Italy: A Perspective from Scaling Laws. Landsc. Urban Plan. 2020, 204, 103906. [Google Scholar] [CrossRef]
  24. Bettencourt, L.M.A.; Lobo, J.; Helbing, D.; Kuehnert, C.; West, G.B. Growth, Innovation, Scaling, and the Pace of Life in Cities. Proc. Natl. Acad. Sci. USA 2007, 104, 7301–7306. [Google Scholar] [CrossRef] [PubMed]
  25. Leitao, J.C.; Miotto, J.M.; Gerlach, M.; Altmann, E.G. Is This Scaling Nonlinear? R. Soc. Open Sci. 2016, 3, 150649. [Google Scholar] [CrossRef] [PubMed]
  26. Keuschnigg, M.; Mutgan, S.; Hedstrom, P. Urban Scaling and the Regional Divide. Sci. Adv. 2019, 5, eaav0042. [Google Scholar] [CrossRef] [PubMed]
  27. National Bureau of Statistics of China. Available online: http://www.stats.gov.cn/english/ (accessed on 1 June 2023).
  28. Statistics Bureau of Shenzhen Municipality. Available online: http://tjj.sz.gov.cn/ (accessed on 1 June 2023).
  29. Dong, L.; Wang, H.; Zhao, H. The Definition of City Boundary and Scaling Law. Acta Geogr. Sin. 2017, 72, 213–223. [Google Scholar]
  30. Yang, J.; Huang, X. The 30 M Annual Land Cover Dataset and Its Dynamics in China from 1990 To 2019. Earth Syst. Sci. Data 2021, 13, 3907–3925. [Google Scholar] [CrossRef]
  31. Gong, P.; Li, X.; Wang, J.; Bai, Y.; Cheng, B.; Hu, T.; Liu, X.; Xu, B.; Yang, J.; Zhang, W.; et al. Annual maps of global artificial impervious area (GAIA) between 1985 and 2018. Remote Sens. Environ. 2020, 236, 111510. [Google Scholar] [CrossRef]
  32. National Aeronautics and Space Administration. Alaska Satellite Facility (ASF) Data Search Vertex; Alaska Satellite Facility: Fairbanks, AK, USA, 2015; Available online: https://search.asf.alaska.edu (accessed on 1 June 2023).
  33. Pesaresi, M.; Florczyk, A.; Schiavina, M.; Melchiorri, M.; Maffenini, L. GHS-SMOD R2019A—GHS Settlement Layers, Updated and Refined REGIO Model 2014 in Application to GHS-BUILT R2018A and GHS-POP R2019A, Multitemporal (1975–1990–2000–2015)—OBSOLETE RELEASE; European Commission, Joint Research Centre (JRC): Luxembourg, 2019; Available online: http://data.europa.eu/89h/42e8be89-54ff-464e-be7b-bf9e64da5218 (accessed on 1 June 2023).
  34. OpenStreetMap Foundation. Open Street Map; Open Street Map: Cambridge, UK, 2023; Available online: https://openstreetmap.org (accessed on 1 June 2023).
  35. Shenzhen Government. Available online: http://www.sz.gov.cn/szzt2010/wgkzl/jcgk/jchgk/content/post_1319256.html (accessed on 1 June 2023).
  36. Bettencourt, L.M.A.; Lobo, J.; Strumsky, D.; West, G.B. Urban Scaling and Its Deviations: Revealing the Structure of Wealth, Innovation and Crime across Cities. PLoS ONE 2010, 5, e13541. [Google Scholar] [CrossRef]
  37. Molinero, C.; Thurner, S. How The Geometry of Cities Determines Urban Scaling Laws. J. R. Soc. Interface 2021, 18, 20200705. [Google Scholar] [CrossRef]
  38. Lei, W.; Jiao, L.; Xu, G. Understanding the Urban Scaling of Urban Land with an Internal Structure View to Characterize China’s Urbanization. Land Use Policy 2022, 112, 105781. [Google Scholar] [CrossRef]
  39. Sahasranaman, A.; Bettencourt, L.M.A. Urban Geography and Scaling of Contemporary Indian Cities. J. R. Soc. Interface 2019, 16, 20180758. [Google Scholar] [CrossRef] [PubMed]
  40. Bettencourt, L.M.A.; Yang, V.C.; Lobo, J.; Kempes, C.P.; Rybski, D.; Hamilton, M.J. The Interpretation of Urban Scaling Analysis in Time. J. R. Soc. Interface 2020, 17, 20190846. [Google Scholar] [CrossRef] [PubMed]
  41. Chen, G.; Li, X.; Liu, X.; Chen, Y.; Liang, X.; Leng, J.; Xu, X.; Liao, W.; Qiu, Y.; Wu, Q.; et al. Global Projections of Future Urban Land Expansion under Shared Socioeconomic Pathways. Nat. Commun. 2020, 11, 537. [Google Scholar] [CrossRef]
  42. Xu, G.; Xu, Z.; Gu, Y.; Lei, W.; Pan, Y.; Liu, J.; Jiao, L. Scaling Laws in Intra-Urban Systems and Over Time at the District Level in Shanghai, China. Phys. A Stat. Mech. Its Appl. 2020, 560, 125162. [Google Scholar] [CrossRef]
  43. Liu, X.; Liang, X.; Li, X.; Xu, X.; Ou, J.; Chen, Y.; Li, S.; Wang, S.; Pei, F. A Future Land Use Simulation Model (FLUS) for Simulating Multiple Land Use Scenarios by Coupling Human and Natural Effects. Landsc. Urban Plan. 2017, 168, 94–116. [Google Scholar] [CrossRef]
  44. Jin, X.; Long, Y.; Sun, W.; Lu, Y.; Yang, X.; Tang, J. Evaluating Cities’ Vitality and Identifying Ghost Cities in China with Emerging Geographical Data. Cities 2017, 63, 98–109. [Google Scholar] [CrossRef]
  45. Woodworth, M.D.; Wallace, J.L. Seeing Ghosts: Parsing China’s “Ghost City” Controversy. Urban Geogr. 2017, 38, 1270–1281. [Google Scholar] [CrossRef]
  46. Thompson, E.S.; de Beurs, K.M. Tracking the Removal of Buildings in Rust Belt Cities with Open-Source Geospatial Data. Int. J. Appl. Earth Obs. Geoinf. 2018, 73, 471–481. [Google Scholar] [CrossRef]
  47. Xie, Y.; Gong, H.; Lan, H.; Zeng, S. Examining Shrinking City of Detroit in the Context of Socio-Spatial Inequalities. Landsc. Urban Plan. 2018, 177, 350–361. [Google Scholar] [CrossRef]
  48. Landis, J.R.; Koch, G.G. Measurement of Observer Agreement for Categorical Data. Biometrics 1977, 33, 159–174. [Google Scholar] [CrossRef] [PubMed]
  49. Shenzhen Government. Shenzhen Sustainable Development Plan (2017–2030). Available online: http://www.sz.gov.cn/zfgb/2023/gb1275/content/post_10428246.html (accessed on 19 August 2023).
  50. Feng, Y.; Wang, X.; Du, W.; Liu, J.; Li, Y. Spatiotemporal Characteristics and Driving Forces of Urban Sprawl in China during 2003–2017. J. Clean. Prod. 2019, 241, 118061. [Google Scholar] [CrossRef]
  51. Chen, M.; Liu, W.; Lu, D.; Chen, H.; Ye, C. Progress of China’s New-Type Urbanization Construction since 2014: A Preliminary Assessment. Cities 2018, 78, 180–193. [Google Scholar] [CrossRef]
  52. Xinhua News Agency. Available online: http://news.xinhuanet.com/politics/2016-07/13/c_1119214482.htm (accessed on 1 June 2023).
  53. Jiang, Y.; Mohabir, N.; Ma, R.; Zhu, P. Sorting through Neoliberal Variations of Ghost Cities in China. Land Use Policy 2017, 69, 445–453. [Google Scholar] [CrossRef]
  54. Zhao, X.; Wang, P.; Gao, S.; Yasir, M.; Islam, Q.U. Combining LSTM and PLUS Models to Predict Future Urban Land Use and Land Cover Change: A Case in Dongying City, China. Remote Sens. 2023, 15, 2370. [Google Scholar] [CrossRef]
  55. Sefrin, O.; Riese, F.M.; Keller, S. Deep Learning for Land Cover Change Detection. Remote Sens. 2021, 13, 78. [Google Scholar] [CrossRef]
  56. Hochreiter, S.; Schmidhuber, J. Long Short-Term Memory. Neural Comput. 1997, 9, 1735–1780. [Google Scholar] [CrossRef]
Figure 1. The location of Shenzhen in China (Panel A), and the location of Shenzhen in Guangdong province (Panel B).
Remotesensing 15 04326 g001
Figure 2. Flowchart of the methodology.
Remotesensing 15 04326 g002
Figure 3. The β value of different cities in China is calculated by urban scaling law at a single-city scale (A) and the predicted urban land demand (B,C) by the USL method (red), panel data regression (green), and LSTM (purple).
Remotesensing 15 04326 g003
Figure 4. Spatial simulation of urban land expansion in Shenzhen. (A) The real-world urban land area in 2019. (B) Simulated urban land area in 2019. (C) Simulated urban land area in 2025. (D) Predicted urban land expansion from 2019 to 2025.
Remotesensing 15 04326 g004
Table 1. A summary of data used in research.
DataYearData TypeSpatial ResolutionSources
Land use2000–2020Raster data30 mLandsat-derived annual China land cover dataset [30]
Urban impervious surface2015, 2019Raster data30 mGlobal Artificial Impervious Areas, GAIA [31]
Digital elevation model (DEM)2015Raster data12.5 mALOS (Advanced Land Observing Satellite) [32]
Population density2015Raster data250 mGlobal Human Settlement Layer [33]
Road network2015Shapefile OSM (OpenStreetMap) [34]
Water bodies2015Shapefile OSM (OpenStreetMap) [34]
Ecological protection red line2013Shapefile Shenzhen Government [35]
POI2015Shapefile Baidu Map
Table 2. The comparison of three models in simulation accuracy of urban land area.
ModelUrban Land Area (km2)Kappa CoefficientFoMTotal Accuracy
20192025
Traditional panel data regression813.52852.3182.57%0.400681.42%
LSTM815.44880.7789.04%0.139785.57%
Hybrid model811.77842.4888.23%0.431487.95%
Disclaimer/Publisher’s Note: The statements, opinions and data contained in all publications are solely those of the individual author(s) and contributor(s) and not of MDPI and/or the editor(s). MDPI and/or the editor(s) disclaim responsibility for any injury to people or property resulting from any ideas, methods, instructions or products referred to in the content.

