1. Introduction
Floods are one of the most catastrophic natural disasters, affecting millions of people globally and resulting in significant economic and environmental damage. Traditional methods of flood monitoring, such as ground-based surveys and aerial photography, can be time-consuming, costly, and hazardous [
1]. The use of remote sensing data and computer vision techniques can provide a faster and more efficient solution for flood monitoring and damage assessment [
2].
Over the past few decades, remote sensing data has become increasingly accessible and has been widely used for monitoring and mapping both vegetation cover [
3], infrastructure objects [
4], and water bodies [
5]. Remote sensing imagery can provide a synoptic view of the flooded area, and by analyzing the image data, it is possible to estimate the extent of the flooded area. For instance, in [
6], Hernandez et al. showed how accurately flood boundaries can be assessed in real-time using unmanned aerial vehicles (UAVs). Feng et al. applied UAVs to monitor urban flood in [
7] using a random forest algorithm. The authors achieved the overall accuracy of 87.3%. In [
8], Hashemi-Beni et al. also proposed a deep learning approach for flood monitoring with processing of optical images.
Although UAV-based measurements provide detailed information about flooded areas, such observations are not always available during a disasters due to factors such as limited flight time, poor weather conditions, or logistical constraints. Satellite remote sensing is more suitable in particular cases. A growing body of research has explored the use of data from various apparatus and sensors for water body monitoring. Several satellite missions are commonly used for water body monitoring, including Terra, Aqua, Landsat, Ikonos, WorldView-1, WorldView-2, GeoEye-1, Radarsat-2, Sentinel-1, and Sentinel-2 [
9]. These missions vary in terms of spatial and spectral resolution, as well as revisit time, and are used for different purposes. For instance, low resolution data are typically used for flood alerts on a regional scale, due to large spatial coverage [
10], while higher resolution and more expensive data can be applied for precise analysis and damage assessment. In [
11], Moortgat et al. utilized commercial satellite imagery with very high spatial resolution in combination with deep neural networks to develop a hydrology application. Another source of high-resolution close-to-real-time satellite observations is Chinese GaoFen mission, which provides data for governmental and commercial organizations. Zhang et al. also demonstrated flood detection on the territory of China during the summer period using datasets collected from Chinese mission satellites GaoFen-1, GaoFen-3, GaoFen-6 and Zhuhai-1 in [
12]. Water indices based on multispectral data are also significant for flood assessment based on missions such as Sentinel-2 [
13] and Landsat imagery [
14]. In addition to the trainable models, rule-based methods are also used, such as the method proposed by Jones in [
15]. The author presented several rules for determining the water surface based on the raw values of Landsat images, as well as indices calculated on their basis. However, due to the use of rules that were investigated only based on the existing data, such an approach becomes more complicated to generalize for new satellite sensors that might be highly actual at present time. The service inspired by this approach is available in [
16].
Although solutions based on visible satellite data show high performance, they can be limited due to varying weather conditions and cloud cover [
17]. In [
18], Dong et al., demonstrate the possibility of segmenting floods on the territory of China using Sentinel-1 satellite images and convolutional neural networks. In [
19], Bonafilia et al. collected and annotated the dataset accompanied by Sentinel-1 data to map flooded areas in various geographical regions. Bai et al. show, in [
20], the potential for identifying temporarily flooded areas and permanent water bodies using the modern Boundary-Aware Salient Network (BASNet) architecture [
21], which utilizes a predict-refine architecture and a hybrid loss, allowing highly accurate image segmentation, achieving an accuracy of 76% Intersection over Union (IoU) in the above-described task. In [
22], Rudner et al. propose to implement a modern approach for segmenting flooded buildings by using data jointly from different dates and sensors of various satellites. However, the use of SAR data alone does not give results as good as the use of multi-spectrum data, and such approaches have significant limitations, for example, if there is urban development in the studied region due to re-reflections of the radar signal from the walls of buildings, objects, etc.
In addition, estimating the extent of a flood alone may not be sufficient for effective flood management. It is necessary to estimate both the extent and volume or depth of the flood. The importance of depth estimation of flooded areas is highlighted by Quinn et al. in [
23]. It is shown that depth can be used for economical loss computation. Estimating water volume during floods also holds critical significance for multiple reasons. Firstly, it provides essential inputs for hydrological models that simulate flood behavior, aiding in understanding how floodwaters propagate through watersheds. This information, combined with accurate flow rate calculations, is pivotal for assessing flood severity, designing hydraulic structures, and predicting rapid water level rises in flash floods. Moreover, precise water volume estimates contribute to real-time stream gauging, enabling timely flood monitoring and early warnings to safeguard communities. Additionally, these estimates serve as foundational data for hydrological research, advancing flood forecasting techniques and enhancing our understanding of climate change impacts on flood occurrences. Approaches for estimating water volume usually involve auxiliary topographic data. Rakwatin et al. explored spatial data acquisition and processing for flood volume calculation in [
24]. In [
25], Cohen et al. used flood maps with a Digital Elevation Model (DEM) to estimate floodwater depth for coastal and riverine regions. The approach relies on selecting the nearest boundary cell to the flooded domain and subtracting the inundated land elevation from the water elevation value [
26]. The calculated water depth is then compared with hydraulic model simulation. The authors suggest using floodwater extent maps derived from remote sensing classification. A similar approach is explored in [
27], where Budiman et al. used Sentinel-1 data and DEM to estimate flash flood volume by multiplying depth and each pixel size. However, these approaches do not involve usage of such advanced algorithms as convolutional neural networks.
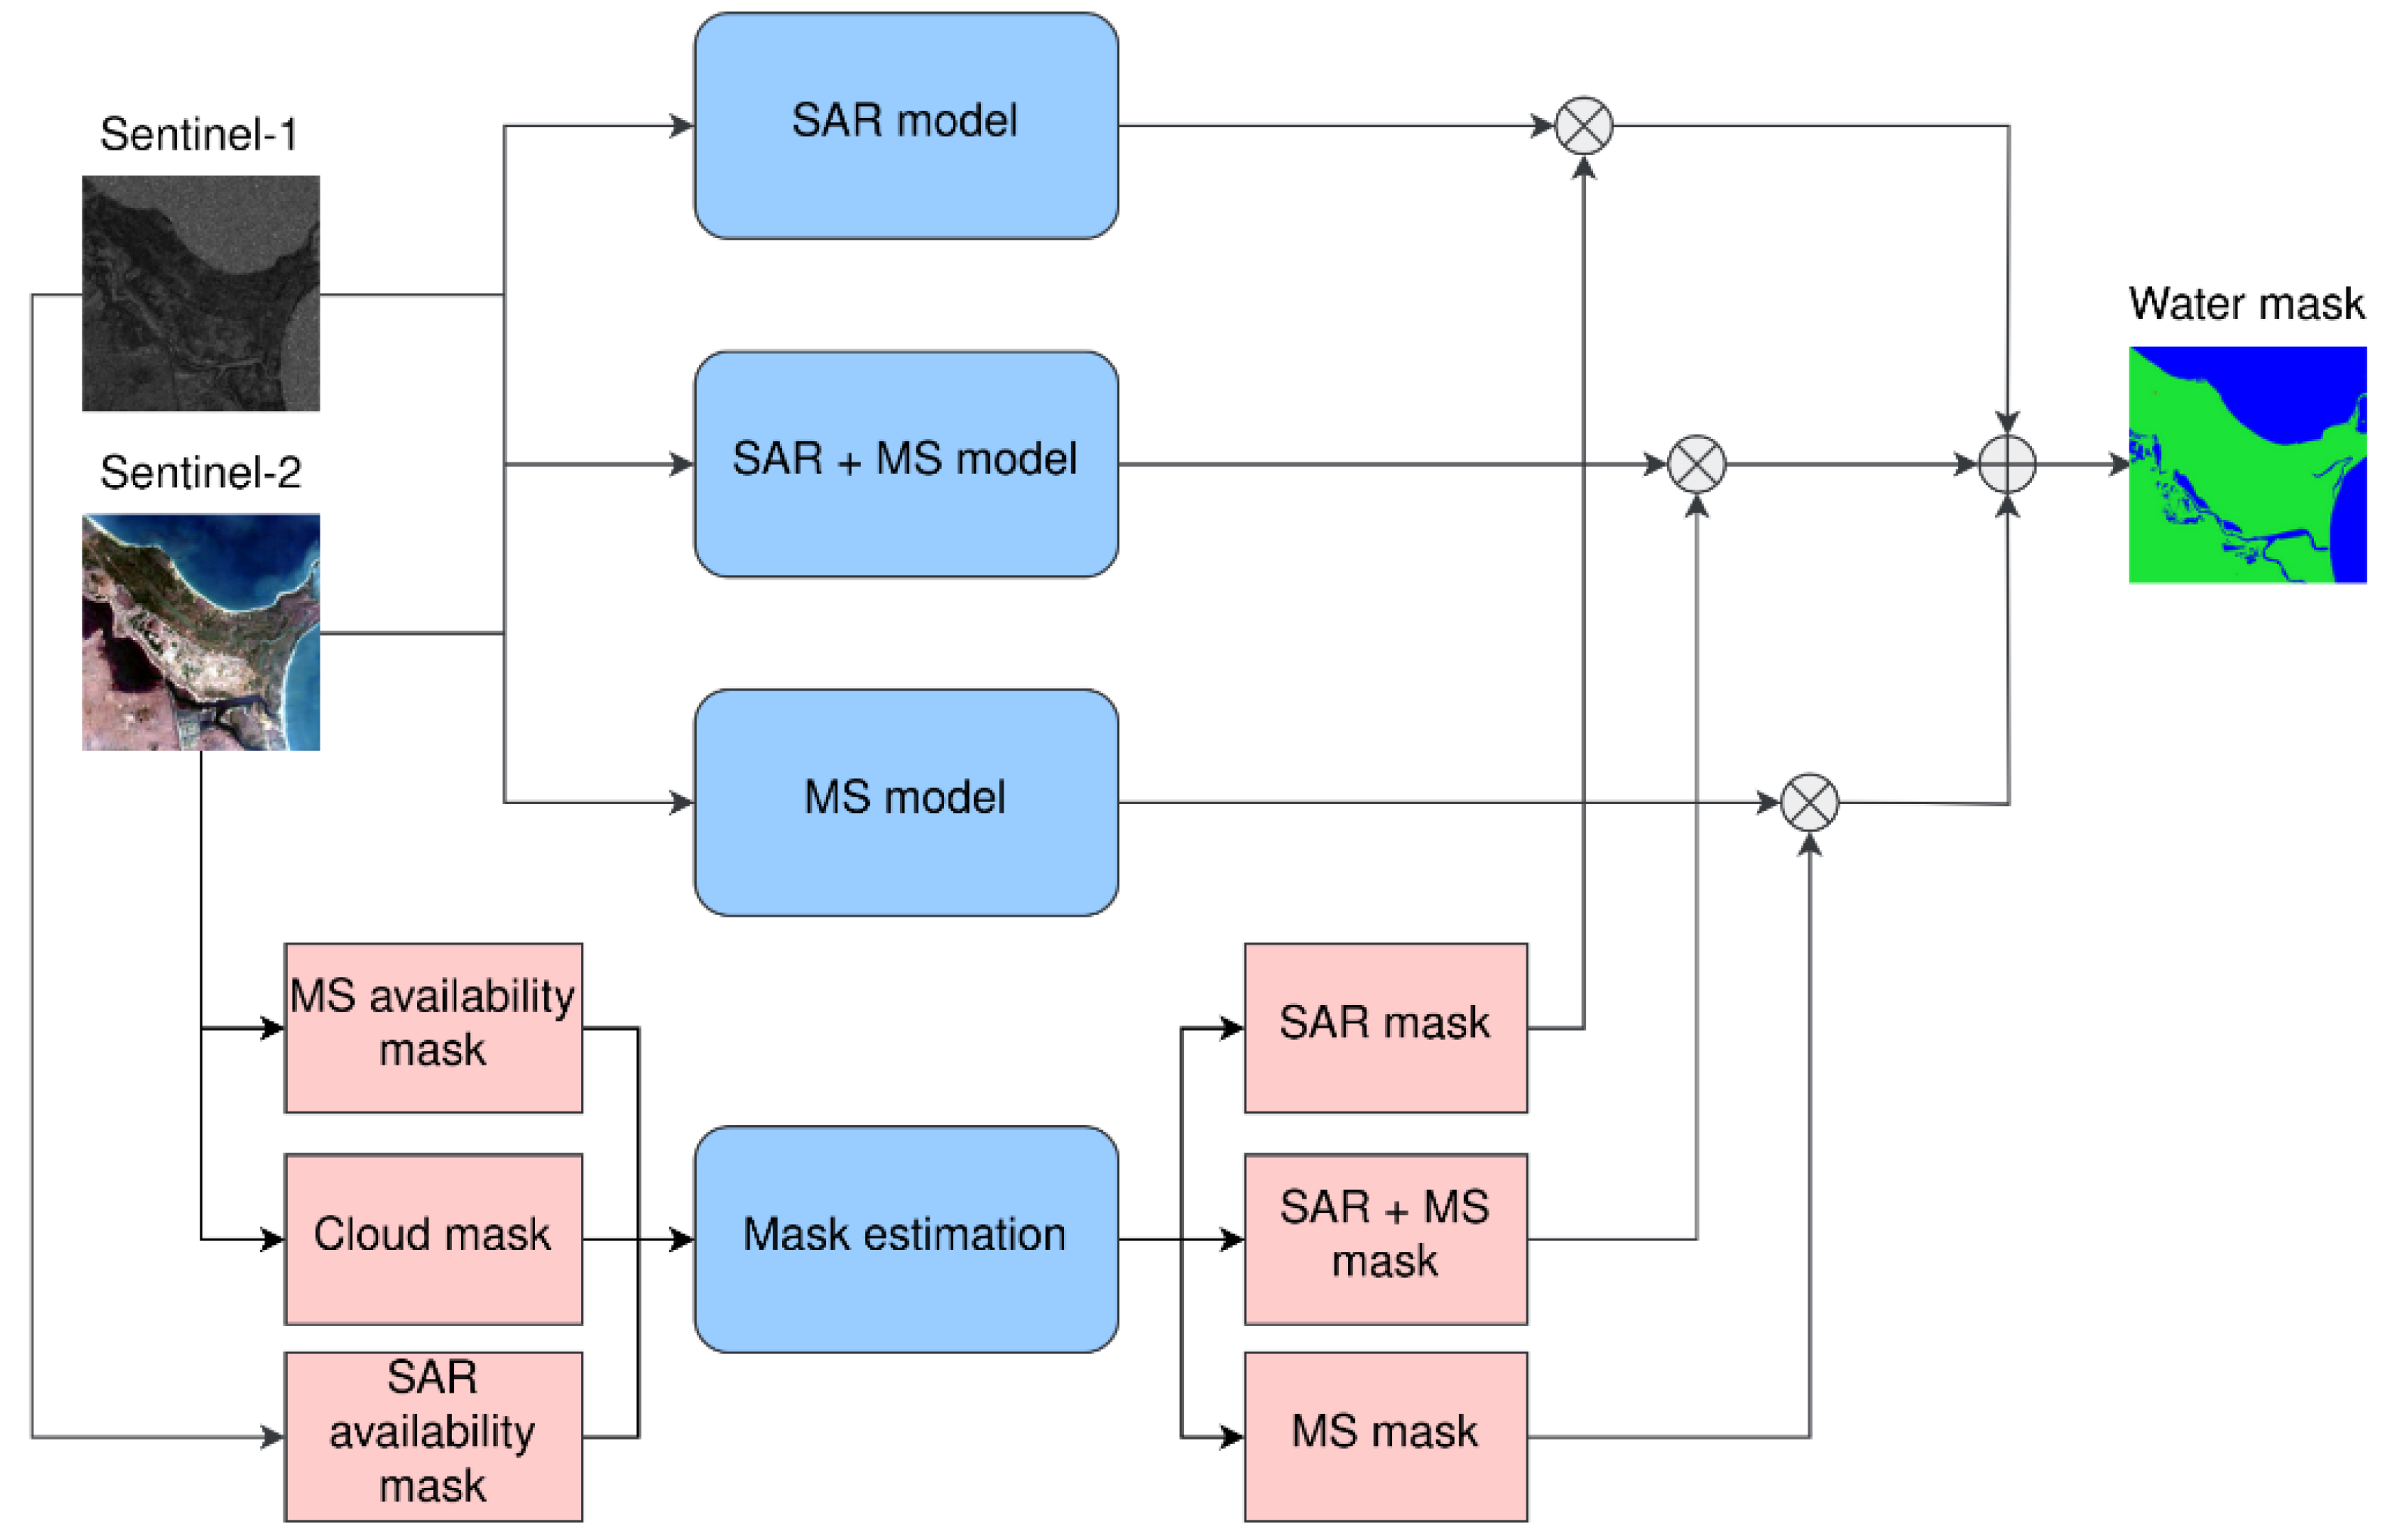
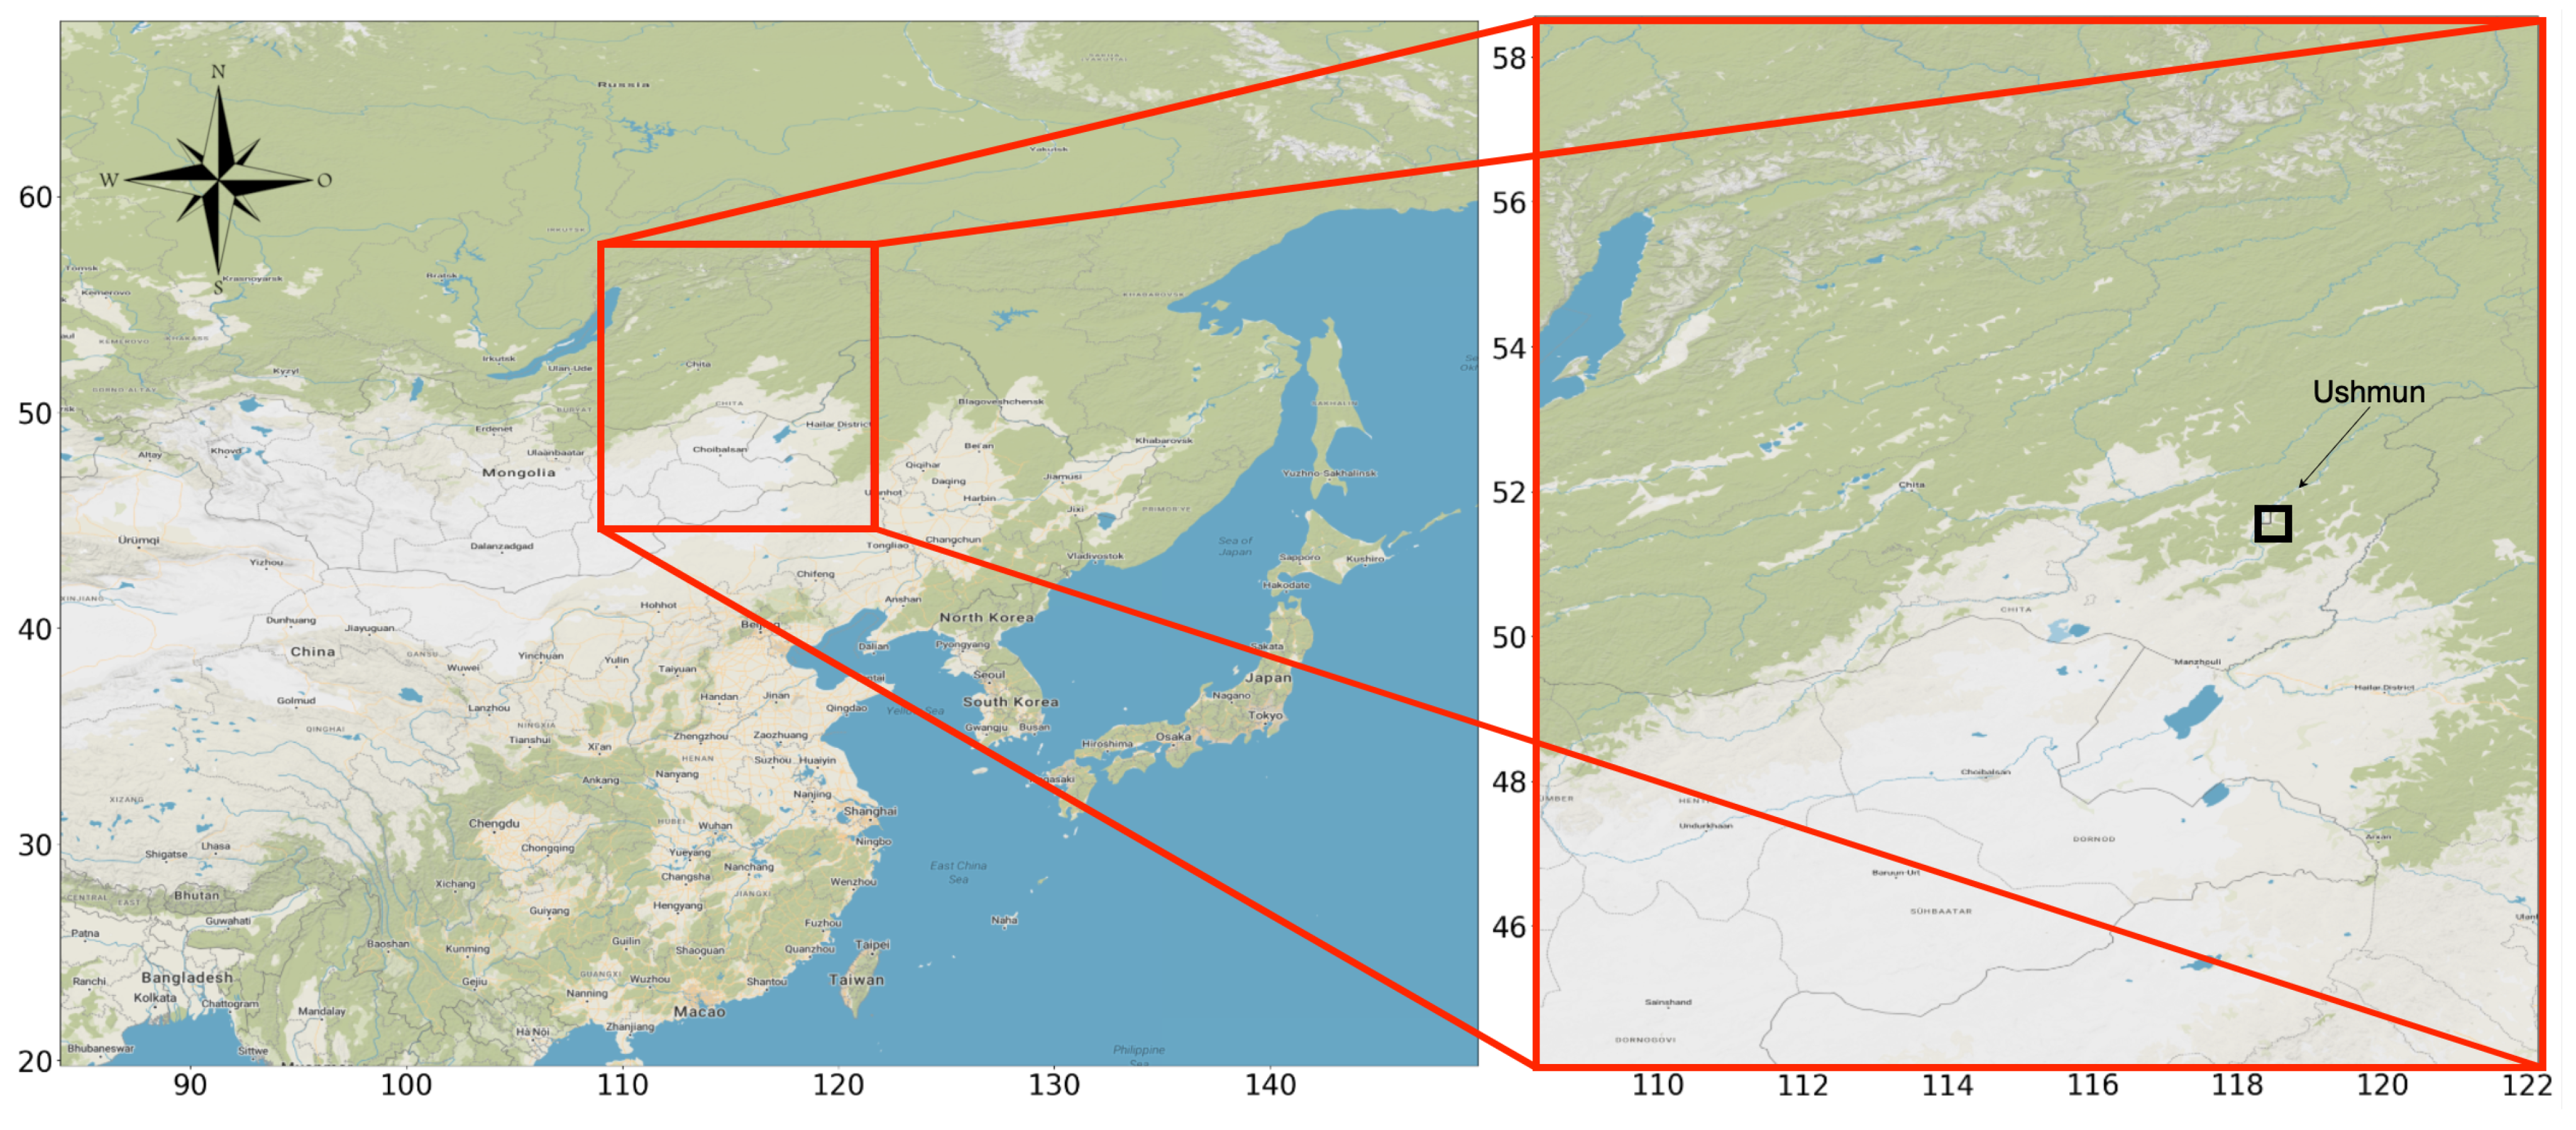
In our research, we assume that using several models that utilize different sets of input data allow us to have several options for making predictions taking into account the availability and quality of the data. Floods occur quickly, thus, such variability in models ensures relevant and more accurate results. Therefore, our objective is to design an ML-based approach for flood extent and volume monitoring that overcomes current limitations and involves several stages. To deliver both high-quality and prompt results, we combine multispectral and radar data derived from Sentinel-2 and Sentinel-1 satellites, respectively. This enables high model performance in cloudy conditions and detailed mapping on cloudless dates. Additionally, feature space selection plays a vital role in developing a robust model, so we considered different spectral indices in addition to the initial satellite bands. To create flood volume maps, we use a combination of model predictions with flood extent and DEM measurements. To evaluate the proposed methodology, we conducted experiments using various popular neural network architectures, such as U-Net, MA-Net, and DeepLabv3. We also assessed their quality on a real-life case involving a flood that occurred in Ushmun, Russia, in 2021. The annotations for this event were created manually. The main contributions of the work are the following:
We proposed a flood extension estimation pipeline based on Sentinel-1 and Sentinel-2 data that utilizes neural network technology;
We took into account possible real-life limitations such as satellite data availability and cloud coverage during flood events;
We explored different deep learning architectures and investigated feature spaces to optimize our approach;
Additionally, we developed a method for flood volume estimation that utilizes both DEM and predicted flood extent.
4. Discussion
In this study, we have developed a novel methodology for estimating flood extent and volume by employing remote sensing data gathered from Sentinel-1 and Sentinel-2 satellites. Our approach integrates multi-spectral and radar data, utilizing deep neural network algorithms to process and analyze these data. As a result, we have been able to create an effective tool for flood monitoring, delivering reliable and accurate outcomes. This has been demonstrated through our case study of the 2021 flood event in Ushmun, further reinforcing the potential of our methodology. Moreover, we can state the superiority of Sentinel-1 and Sentinel-2 combination over single data source usage, such as in [
50,
51]. We extended the original dataset described in [
19] and added multispectral images and indices that leads to higher results. Further training of the proposed models on additional relevant data might be beneficial for the northern regions. This will allow taking into account the specifics of the northern regions, where floods can be observed in the case of snow that is not fully dried. Accordingly, a more stable forecast is proposed where indices may not work properly or require additional decision rules, such as in [
15]. Our approach can also benefit from the inclusion of more sophisticated machine learning techniques, such as unsupervised learning algorithms [
52] or zero-shot learning techniques [
53]. These algorithms can help to properly uncover patterns in visual data.
In addition, one of the advantages of the proposed approach is that we have shown how to easily estimate the amount of water during floods. Such an approach, together with hydrometeorological models, will allow a full analysis of the dynamics of evolving emergencies. Previous works have already described approaches for flood water depth estimation based on DEM products. The main limitations are associated with data availability and their spatial resolution for global mapping. In [
25], the authors verified DEM measurements derived from HydroSHEDS, Multi-Error-Removed Improved-Terrain DEM (MERIT DEM) [
54], and ALOS with spatial resolutions of 90, 90, and 30 m, respectively. Another limitation is connected with spatial resolution of water bodies map. For instance, Landsat-5 can be used for water bodies mapping with the spatial resolution of only 30 m per pixel [
26]. Therefore, in our study, we focus on developing methodology for flood analysis with the spatial resolution of 10–30 m per pixel using Sentinel-1 and Sentinel-2 observations. Moreover, previous studies often leverage classification models based on threshold rules [
26], which might lead to inaccuracy in predictions. In [
27], Budiman et al. defined the range for dB values that represent flood areas on Sentinel-1 data. The authors noted the challenging of such values estimation due to similar reflectance of other surfaces. Our approach is developed to simplify flood areas mapping using convolutional neural networks that is capable of automatic spatial features extraction.
Moreover, there is potential for our methodology to be complemented with existing research on flood inundation mapping. For instance, in [
55], Nguyen et al. demonstrated a novel method for estimating flood depth using SAR data. Another important reference is study [
56], where mapping the spatial and temporal complexity of floodplain inundation in the Amazon basin using satellite data was managed. The findings reveal a complex interplay of factors influencing flood dynamics, offering valuable insights for enhancing flood volume estimation methodologies.
In addition, the methodology could be expanded to incorporate other types of data and modeling approaches. For example, the integration of hydrological models could help in predicting the temporal evolution of floods [
57]. Similarly, the inclusion of more detailed topographical data could improve the estimation of flood volumes.
There is also the possibility to expand our methodology to other regions and types of floods. For example, our approach could be adapted to study flash floods in urban areas, which pose a significant risk to human lives and infrastructure. It can be also integrated with other neural network solutions for building recognition for further damage evaluation [
58]. Knowledge of the level of water enables estimation of the number of flooded floors in buildings.
Our proposed approach allows us to work with historical data and to combine the results of models working on various subsamples of input data, focusing on real availability, within a single snapshot or region of interest. We focus specifically on Sentinel-1 and Sentinel-2 satellite images. The main advantage of these data are its high temporal resolution and free availability. The multispectral bands of the Sentinel-2 satellite enable us to compute additional indices to improve model performance. With a spatial resolution of 10 m per pixel, it addresses most practical needs. However, in some cases, a more detailed assessment may be required. When satellite images with higher spatial resolution are available, one can adjust an initial markup with lower spatial resolution to train a more precise CNN model without additional demands to annotated data [
59]. A lack of well-annotated data can be reduced by advanced approaches that generate both images and their corresponding labels or that leverage classification markup instead of semantic segmentation to automatically refine the labels for a segmentation task [
60,
61]. Our approach can be also supplemented by super-resolution techniques [
62]. Additionally, auxiliary bands can be artificially generated for high-resolution satellite images when the spectral range is narrower [
63].
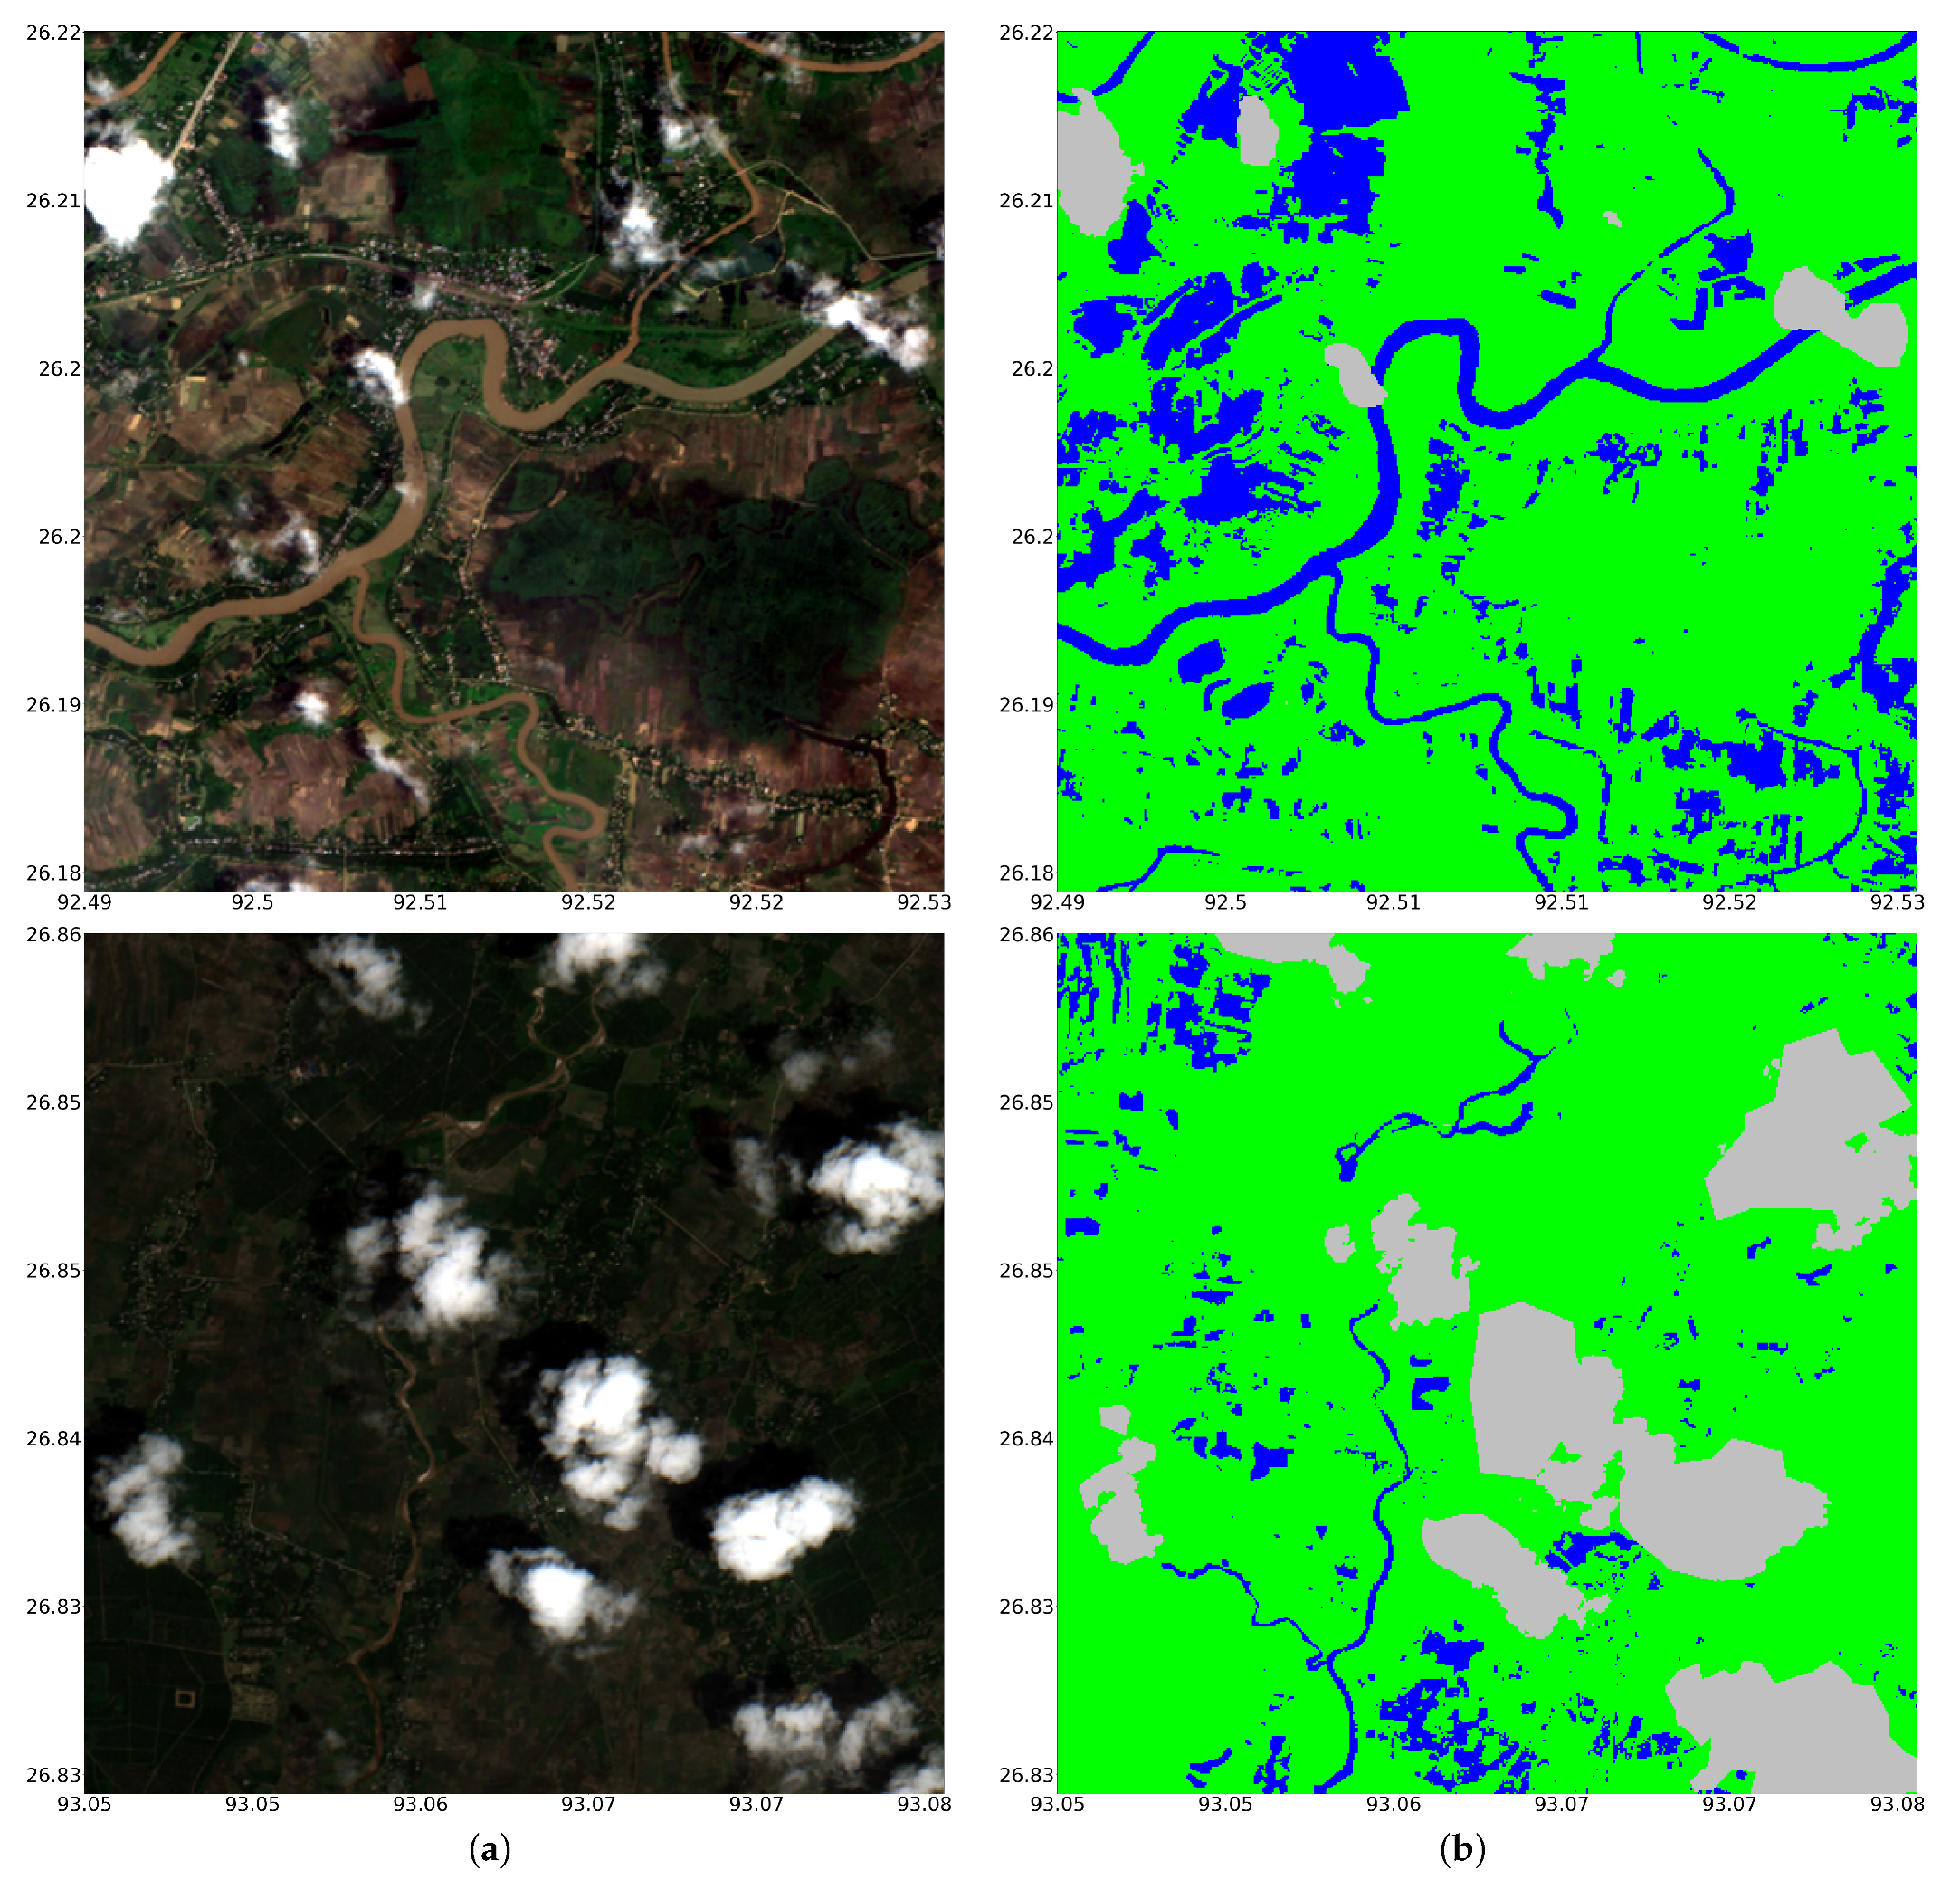
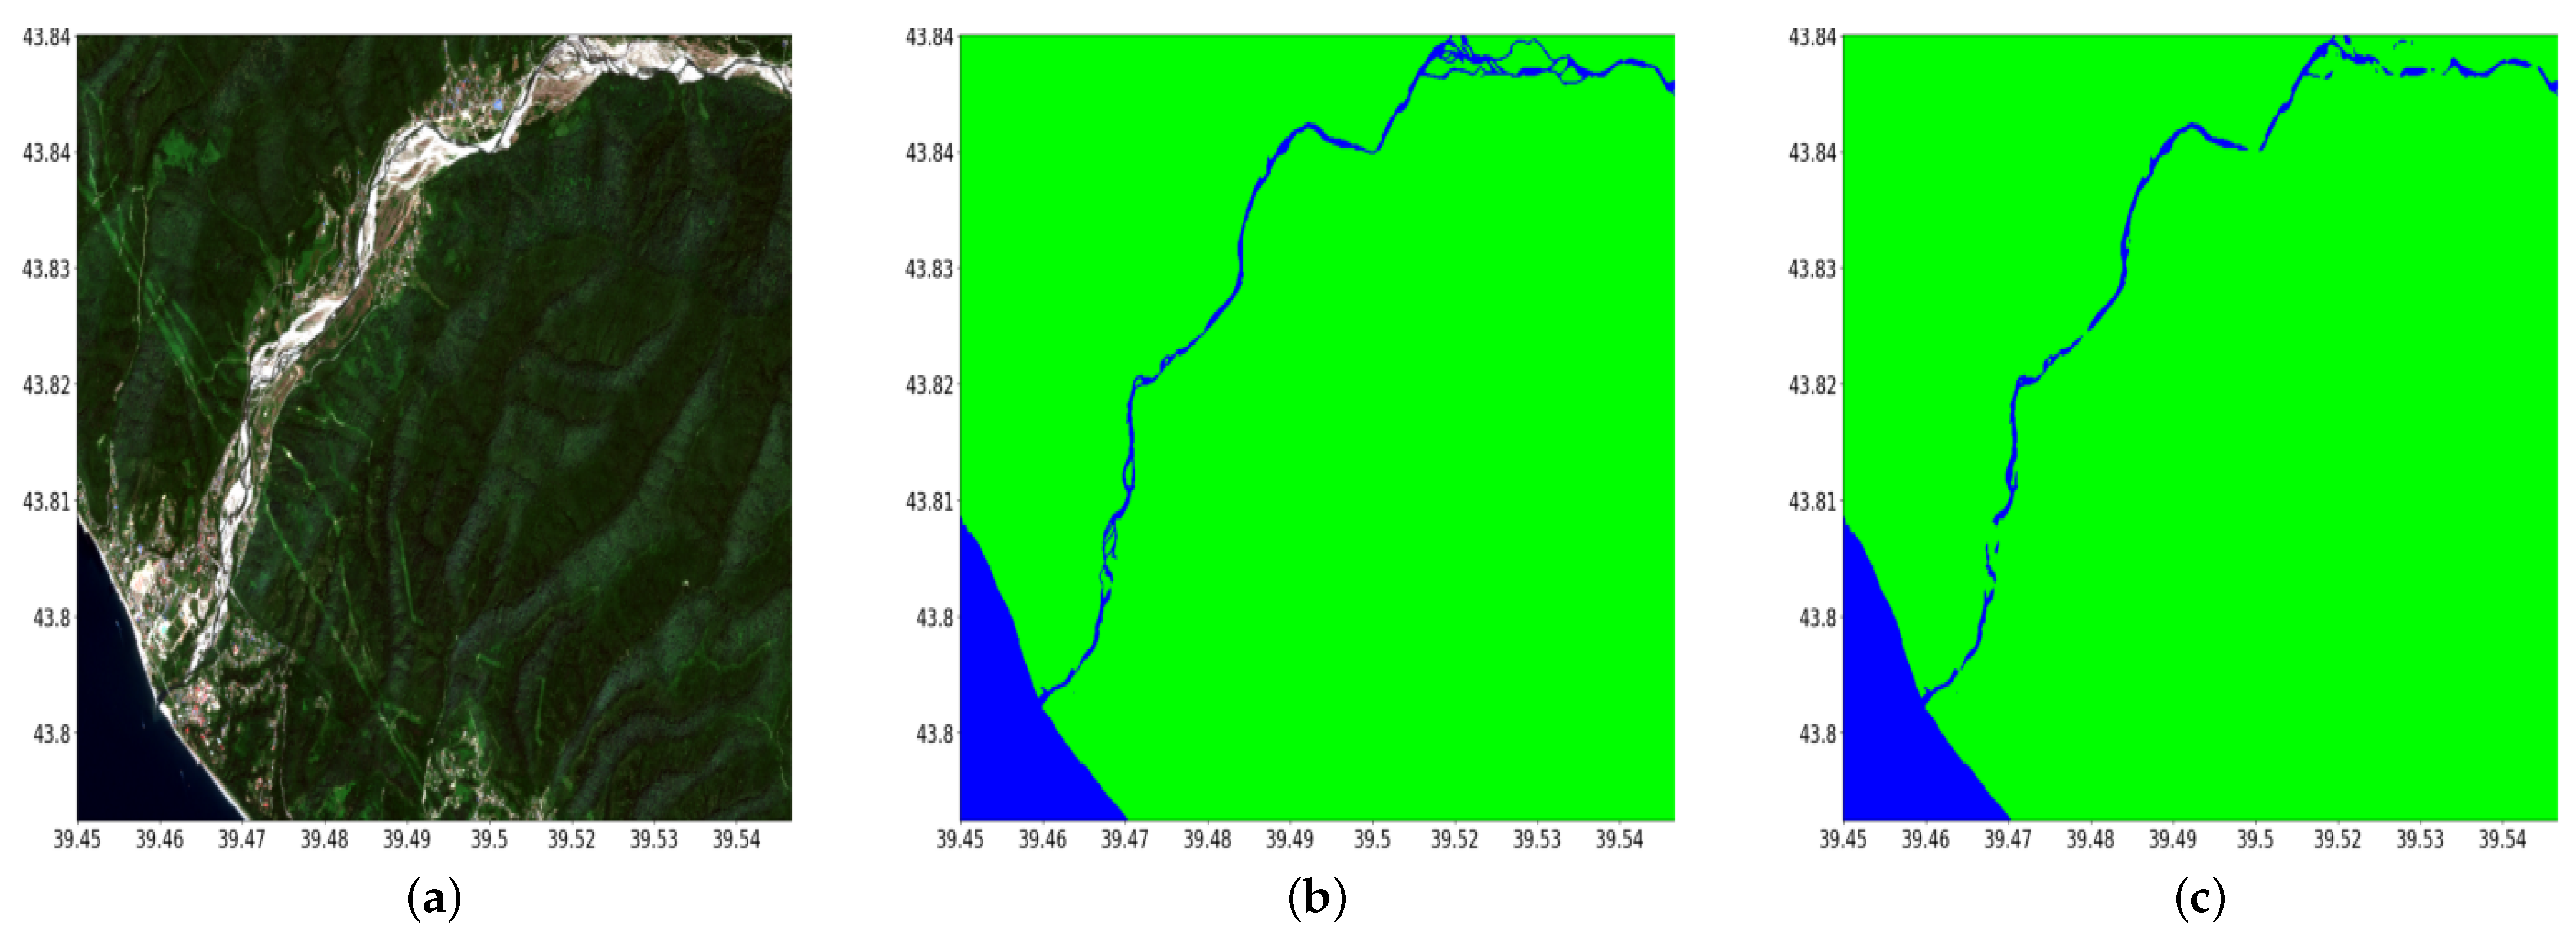
One of the advantages of the proposed approach is the ability to combine various sensors and apply corresponding models within a single region of interest, depending on the availability of imagery for that area, as well as the current weather conditions. We additionally examined the described pipeline for the cloudy date of the flood event in the town of Golovinka (Krasnodar Krai, Russian Federation) on 6 July 2021. The water body before the event is segmented using multispectral image (
Figure 9). However, for the flood event, the region is covered with clouds. Both multispectral and radar imagery are available for that date.
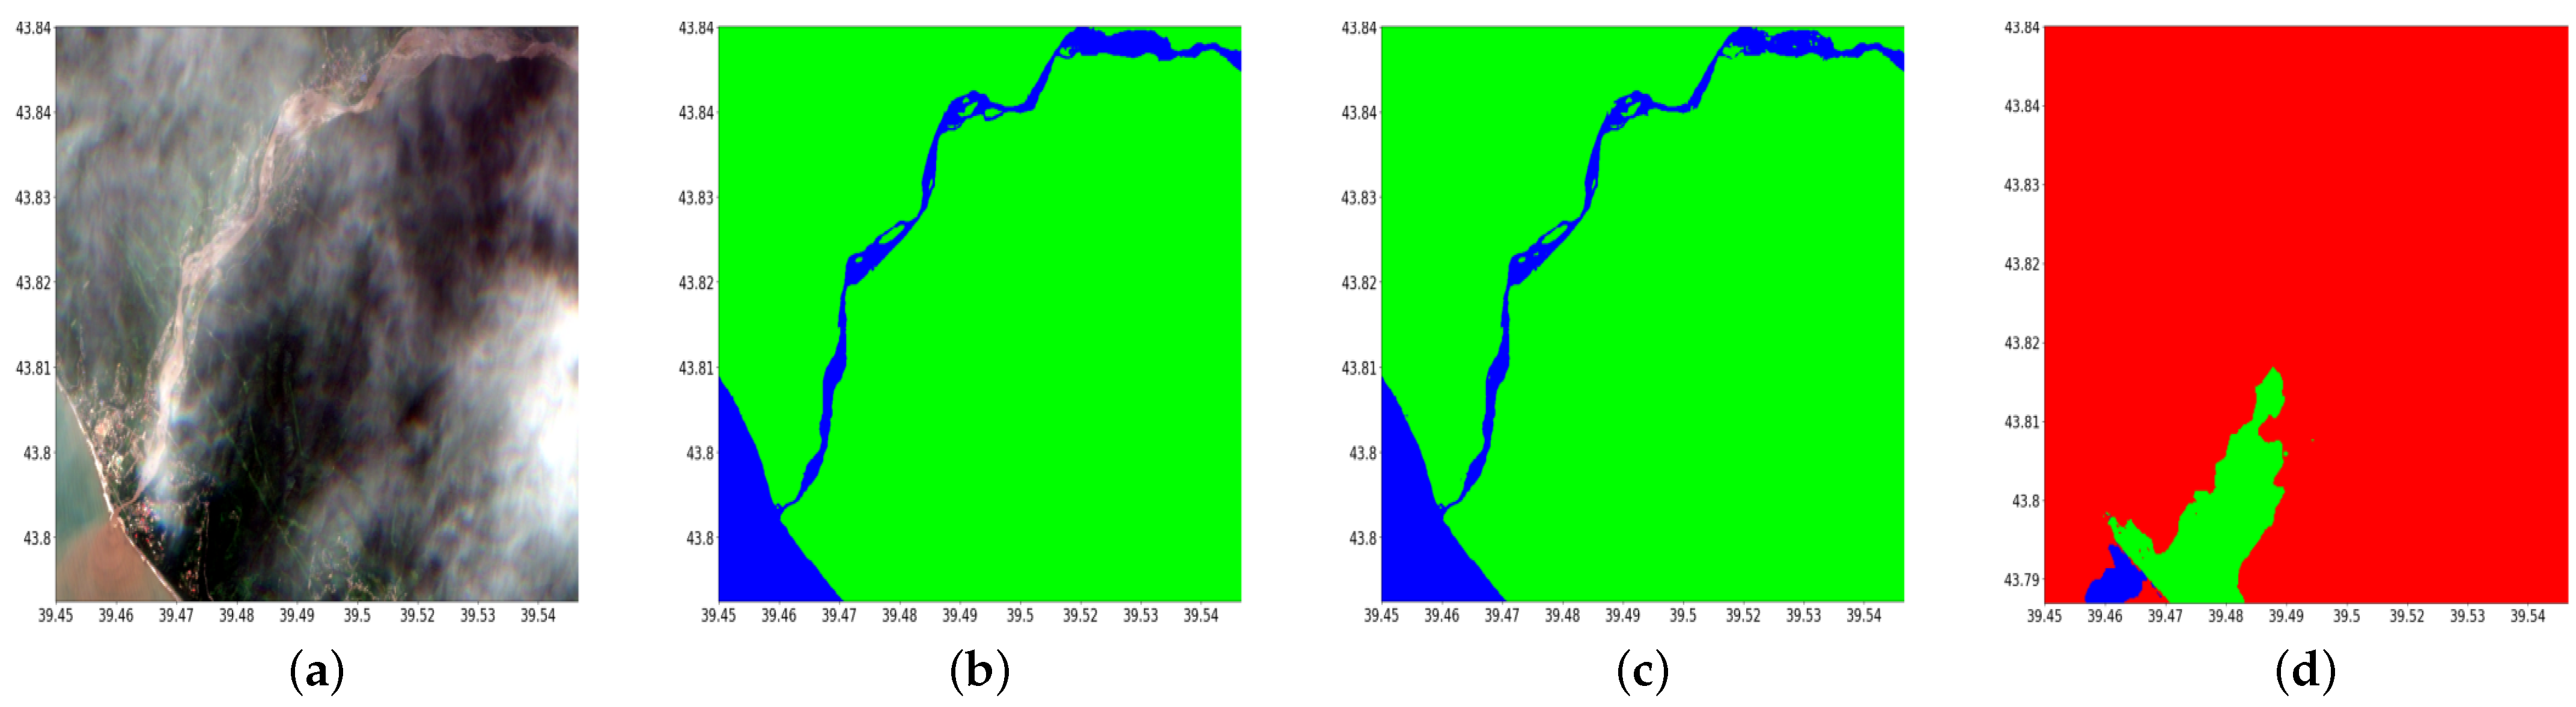
Figure 10 illustrates a case where radar observations play a crucial role for flood extent estimation. Almost the entire study area is represented with the cloud mask and cannot be used for a proper assessment based on visual bands.
Our proposed methodology introduces a promising avenue for flood monitoring using remote sensing data and deep neural networks. Future research should aim to build upon our work and the research of others, with a focus on enhancing the accuracy and speed of flood damage assessments. By doing so, it will significantly contribute to the timely response and recovery efforts in affected regions, ultimately leading to better flood risk management and mitigation strategies.
5. Conclusions
In summation, this study has proposed and implemented a novel methodology for assessing flood scenarios via the utilization of remote sensing data and advanced deep learning techniques. Our method yielded an F1-score of 0.848, not only during the flood event in Ushmun in 2021, but also beyond it. This high F1-score showcases a strong ability to accurately predict the extent of water presence during and after a flood.
Moreover, our approach was capable of approximating the flood volume in Ushmun to be about 0.0087 km3. This gives us a deeper comprehension of the flood’s magnitude and lends insights into its implications for the area involved.
The methodology we developed also leverages the combined power of Sentinel-1 and Sentinel-2 satellites. The benefit of this combination is twofold. It allows for an extended period of time coverage, making it possible to assess the onset, peak, and recession of flood events regardless of weather condition and cloud coverage. Secondly, it enhances our capacity for estimating both the extent and volume of floods, as clearly demonstrated by the Ushmun flood scenario.
The expedited and precise flood damage assessments that our method enables could significantly bolster response and recovery initiatives. By swiftly and precisely pinpointing the flood extent, decision-makers and first responders can distribute resources in a more focused and efficient manner.
Going beyond immediate disaster mitigation, the utility of this tool can also greatly aid in our understanding of flood phenomena, helping to mitigate their detrimental effects and fortifying the resilience of impacted regions. Given its ability to perform effectively under a variety of conditions, our methodology stands as a substantial contribution to the realm of flood monitoring and management.


 ,
, 


