Article

Slope-Scale Remote Mapping of Rock Mass Fracturing by Modeling Cooling Trends Derived from Infrared Thermography

1
Department of Earth and Environmental Sciences, University of Milano-Bicocca, 20126 Milano, Italy
2
Institute of Earth Sciences, University of Lausanne, 1015 Lausanne, Switzerland
*
Author to whom correspondence should be addressed.
Remote Sens. 2023, 15(18), 4525; https://doi.org/10.3390/rs15184525
Submission received: 1 August 2023 / Revised: 5 September 2023 / Accepted: 7 September 2023 / Published: 14 September 2023

Abstract

:
The reliable in situ quantification of rock mass fracturing and engineering quality is critical for slope stability, surface mining and rock engineering applications, yet it remains difficult due to the heterogeneous nature of fracture networks. We propose a method to quantify and map the slope-scale geomechanical quality of fractured rock masses using infrared thermography (IRT). We use the Mt. Gorsa quarry (Trentino, Italy) as a field laboratory to upscale a physics-based approach, which was developed in the laboratory, to in situ conditions, including the effects of fracture heterogeneity, environmental conditions and IRT limitations. We reconstructed the slope in 3D using UAV photogrammetry, characterized the rock mass quality in the field at selected outcrops in terms of the Geological Strength Index (GSI) and measured their cooling behavior through 18h time-lapse IRT surveys. With ad hoc field experiments, we developed a novel procedure to correct IRT data in outdoor environments with complex topography. This allowed for a spatially distributed quantification of the rock mass surface cooling behavior in terms of a Curve Shape Parameter (CSP). Using non-linear regression, we established a quantitative CSP-GSI relationship, which allowed for the CSP to be translated into GSI maps. Our results demonstrate the possibility of applying infrared thermography to the slope-scale mapping of rock mass fracturing based on a physics-based experimental methodology.

1. Introduction

The in situ hydro-mechanical properties of fractured rock masses, including strength, deformability, hydraulic permeability and connectivity, depend on their fracture network geometry and intensity [1,2,3,4]. These are inherited from the sequence of brittle deformation stages, which are associated with tectonic deformation, exhumation and landscape development, that affect a rock’s volume in the Earth’s crust during its geological history [5]. Fracture networks are often heterogeneous in space [6,7] and evolve in space and time as rock masses accumulate damage related to active tectonics and seismicity [8,9], landscape evolution [10], gravitational rock slope deformation of both natural and engineered slopes [11,12,13,14] or underground excavations [15,16]. Therefore, a reliable assessment of rock mass fracturing and the engineering “quality” is a fundamental step to deal with a range of surface applications, including the assessment of rock mass properties for slope stability modeling, open-pit mining and rock slope engineering [2,17,18,19], and the characterization of fractured reservoirs for water, hydrocarbon and geothermal exploitation using analogue outcrops [7,20,21,22].
The in situ characterization and quantification of rock mass fracturing is complicated due to the scale-dependent, heterogeneous and three-dimensional nature of fracture networks, resulting in a biased characterization of the fracture density and intensity of natural or engineered outcrops [23]. Statistically sound measures can be used to describe the fracture abundance depending on the considered dimension (1D, 2D or 3D) of both fractures and sampling regions [24], providing key inputs for Discrete Fracture Network modeling [25]. The in situ estimation of unbiased fracture abundance measures (e.g., volumetric fracture intensity, P32) requires geophysical imaging that usually lacks the required spatial resolution. Thus, descriptors like the surface fracture intensity (P21) are usually employed, which are biased by scale and orientation [26,27] and difficult to estimate when dealing with poor-quality, damaged or heterogeneous rock masses.
For these reasons, most practical studies leverage on the empirical description of rock mass quality provided by rating schemes like the Q-system (Q; [28,29]), the Rock Mass Rating (RMR; [30]), the Geological Strength Index (GSI [2,31,32,33]) and others. Among these schemes, the GSI is the most suitable for applications in nearly all rock masses in a wide spectrum of geological and rock damage conditions [31]. Rock mass quality indices can be estimated based on fracture network attributes derived from field surveys, 3D point clouds or Digital Outcrop Models [34,35,36], geophysical methods [33,37] and other non-destructive imaging techniques like infrared thermography [38,39,40].
Infrared thermography (IRT) is an imaging technique that allows for the measurement of the temperature of solid surfaces based on their emitted radiation in the infrared bands of the electromagnetic spectrum [41,42]. Although this technique has been widely applied in engineering for the non-destructive testing of material defects and fatigue [43,44], its application in geosciences has been mostly focused on mapping and monitoring volcanic, geomorphological and hydrological processes [39,45,46,47,48,49]. Infrared thermography (IRT) applications to rock mechanics mainly consist of the empirical correlation between the response of intact rocks to thermal perturbations depending on different parameters characterized in the laboratory (stress, water saturation, water porosity and fracture abundance; [32,50,51,52,53,54]). Some authors applied IRT to the empirical characterization of rock mass quality on the scale of small outcrops [38,39,40,55] or to the qualitative characterization of slope instabilities [39,47,49,56,57].
Recently, the authors of [54] developed a quantitative method to characterize the fracturing state of laboratory rock samples via the direct parametrization of Newton’s law of cooling on experimental cooling curves through a synthetic Curve Shape Parameter. This parameter is independent of the thermal boundary conditions but is solely related to the typical size of radiant elements (i.e., rock blocks), and shows a statistically significant correlation with standard measures of fracture abundance [24], making it suitable for predictive applications.
In this paper, we attempt to upscale the approach used in [54] to the in situ scale of an engineering slope in order to develop a practical contactless method to quantify and map the quality of fractured rock masses using infrared thermography. Such an upscaling exercise must face several practical issues potentially hampering the required sensitivity of the IRT technique, the quality of the detected signals and the predictive capability of the analysis approach. Main upscaling issues include (a) the difficult quantification of rock mass fracturing due to orientation and size biases and rock mass heterogeneity and (b) the characteristics of thermal radiation in natural environments and their effects on IRT measurements depending on the absolute temperature regime, daily excursions and the effects of solar forcing, sky radiation patterns, the atmosphere, ground reflections and topographic controls [45,58,59,60].
In this perspective, we choose the Mt. Gorsa porphyry quarry (Val di Cembra, Trentino, Italy) as a field laboratory. The area is characterized by a single rock type, but with an extremely heterogeneous distribution of rock mass fracturing due to structurally controlled slope instability mechanisms, which were studied in detail in [34]. These characteristics, alongside a lack of vegetation cover and long-term accessibility make the quarry an ideal test site to carry out an experimental study deployed in the following steps: (a) creating a UAV-based 3D reconstruction of the quarry topography; (b) performing a field characterization of the rock mass quality at selected outcrops; (c) performing time-lapse IRT measurements aimed at reconstructing the response (heating–cooling) of a significant part of the quarry face to solar thermal forcing; (d) developing a targeted methodology to correct IRT measurements for environmental effects; and (e) the in situ application of the method used in [54] and a statistical correlation analysis aimed at finding a relationship between the Curve Shape Parameter and the rock mass quality.

2. Field Laboratory: Mt. Gorsa Quarry

The Mt. Gorsa quarry is in the lower Cembra Valley (Trentino, Northern Italy), a few kilometers northeast of Trento (Figure 1a). The quarry, the morphology of which has changed significantly in the past decade, is characterized by a N-facing 250 m high benched slope, with an average slope of 35° and with benches of up to 10–15 m.
Outcropping rocks belong to a huge volcano-sedimentary succession of the Southern Alps (Athesian Volcanic Group; [61]), which are widespread between Trentino and the South Tyrol area. In the study area, the rock belongs to the Ora Formation [62], and it is made of red to grey rhyolithic ignimbrites with a homogeneous porphyritic texture (35–40% of quartz + sanidine + plagioclase + biotite; [34]) and rare lithic fragments. Although this rock type is mostly unaltered, stiff and very strong (UCS > 150 MPa), at Mt. Gorsa, the rock mass has a complex and strongly anisotropic structure (Figure 1c–e) [34] related to five major discontinuity sets (Figure 1b), namely (a) K1, which is closely spaced (average spacing of 5–15 cm), has fully persistent joints, steeply dips to SSE with a low orientation variability and is responsible for a remarkable rock mass anisotropy; (b) K2, which has persistent fractures dipping 35–40° to the N, is nearly parallel to the slope topography and characterized by spacings in the range of 0.5–2 m (outcrop scale) and up to 30 m (slope scale) (major K2 structures are associated with cataclastic bands that are up to 2 m thick); (c) K3, which has persistent fractures dipping 60° to the ENE and is associated with thick gouge materials up to 1 m thick; and (d) K4 and K5, which have NE-trending fractures that steeply dip to the NW (K4) or SE (K5), ranging in spacing from some decimeters to over 10 m.
The spatially variable characteristics of fracture intensity and persistence, and their geometrical relationships with the engineered slope, favored the onset of structurally controlled slope instability mechanisms on different scales, i.e., from the bench to the overall slope scales [34]. These mechanisms included the flexural toppling of K1 joints, block toppling on K2 basal planes and planar sliding along K2 (Figure 1b–e), as well as the progressive failure across the “rock mass bridges” forming kink bands (Figure 1b–e) and cataclastic shear bands connecting the tips of major non-persistent K2 fractures. These mechanisms led to the development of highly damaged slope domains bounded by K3 and K4 structures, and to a general decay of the rock mass strength, leading to a transition to a continuum-like fractured medium [18] that underwent major slope instability events in 2003, 2011 [34] and 2017.
These complex and widespread failure mechanisms affect the entire quarry face, but evolve differently in different sectors, thus resulting in an extremely heterogeneous pattern of rock mass fracture intensity and damage (Figure 1c–e), which was quantified in [34] in terms of the Geological Strength Index (GSI; [15,63,64]).

3. Materials and Methods

3.1. Three-Dimensional Slope Geometry: UAV Photogrammetry

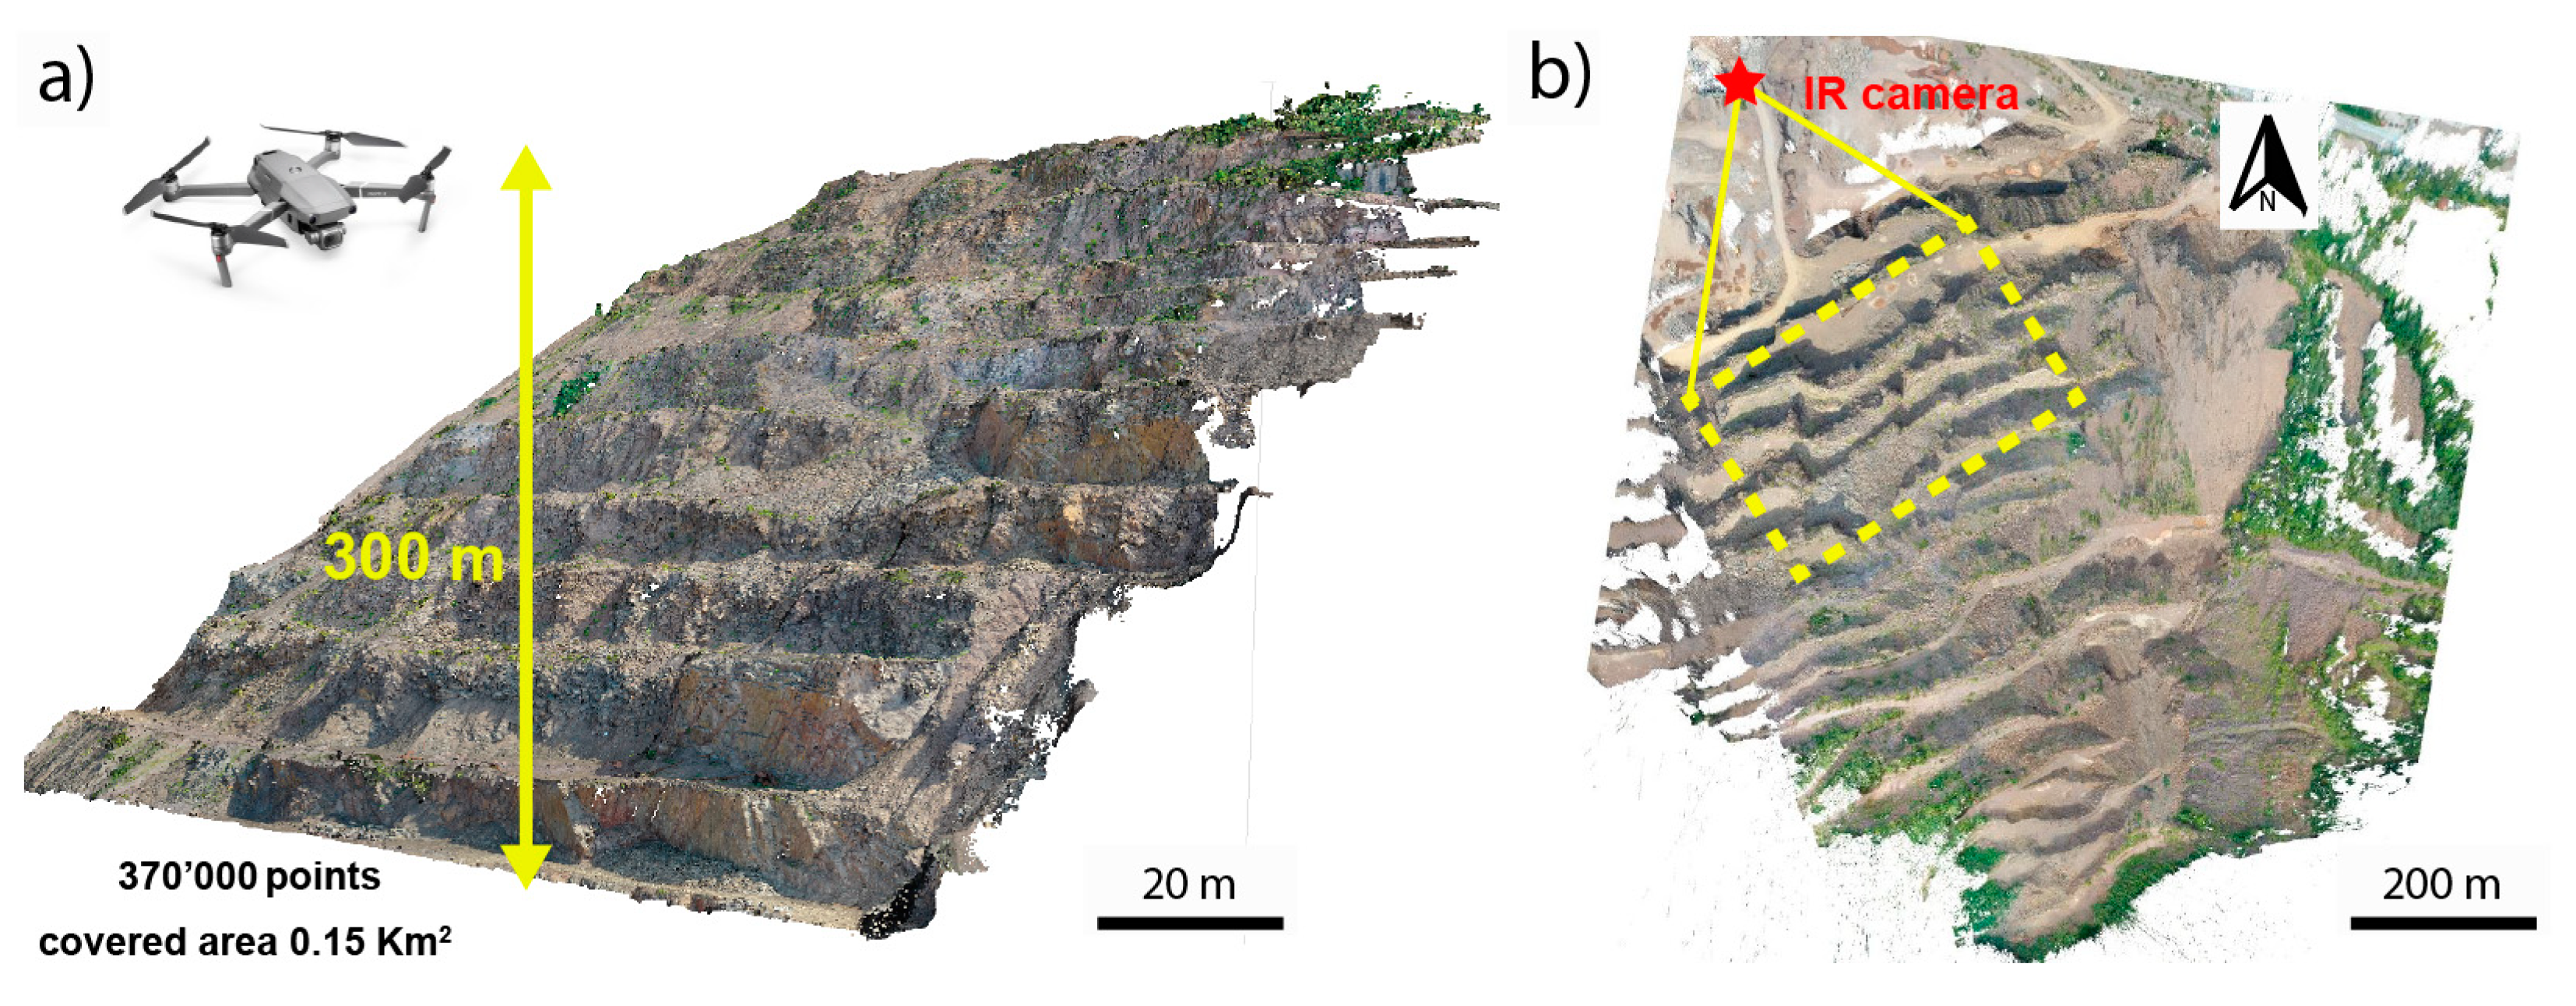
We reconstructed a detailed 3D geometry of the N-facing quarry face with a high spatial resolution using UAV-based photogrammetry. Using a DJI Mavic Pro 2 drone (DJI, Shenzhen, China), we performed a photogrammetric strip survey (Figure 2a) over a plan area of about 0.15 km2, looking at the slope with an inclined optical axis (about 55°) to maximize the optical coverage of the benched slope from 600 to 900 m a.s.l. (Figure 2a). We acquired 607 high-resolution RGB images (5472 × 3648 pixels) with an Hasseblad L1D-20c and geo-referenced them using the drone onboard GNSS. We processed the image dataset through Structure-from-Motion (SfM) photogrammetry [65,66,67] using the software Agisoft Metashape Professional 1.8.0, and obtained a 3D point cloud with an average ground resolution of 2.5 cm/pixel. The point cloud has native RGB attributes, allowing for the reconstruction of the quarry front as a Digital Outcrop Model (Figure 2a) suitable for geological and geomechanical mapping. We clipped the point to the area of interest of Figure 2 and filtered the dataset to improve the homogeneity of the nominal point spacing (about 3 cm). Finally, we computed point normals using kernel of 0.05 m to obtain a quantitative characterization of the local outcrop aspect, slope and morphology.

3.2. Rock Mass Quality: Field Characterization

Among the different rating schemes available to describe rock mass quality, we selected the modified version of the Geological Strength Index (GSI; [2,31]) proposed by Cai et al. [15]. This quantitatively relates the GSI to discontinuity spacing and block size without losing the typical versatility of the GSI, which can be applied to an extremely wide range of rock types, heterogeneity and damage conditions [31] using a widely used mono parametric approach that is intrinsically independent of the water content.
This quality index satisfies some requirements to be correlated with the thermal response detected via IRT: (a) it depends on few parameters, primarily on the fracture intensity, (b) it can be quantified for the full range of rock mass quality and (c) it can be easily mapped in a spatially distributed way.
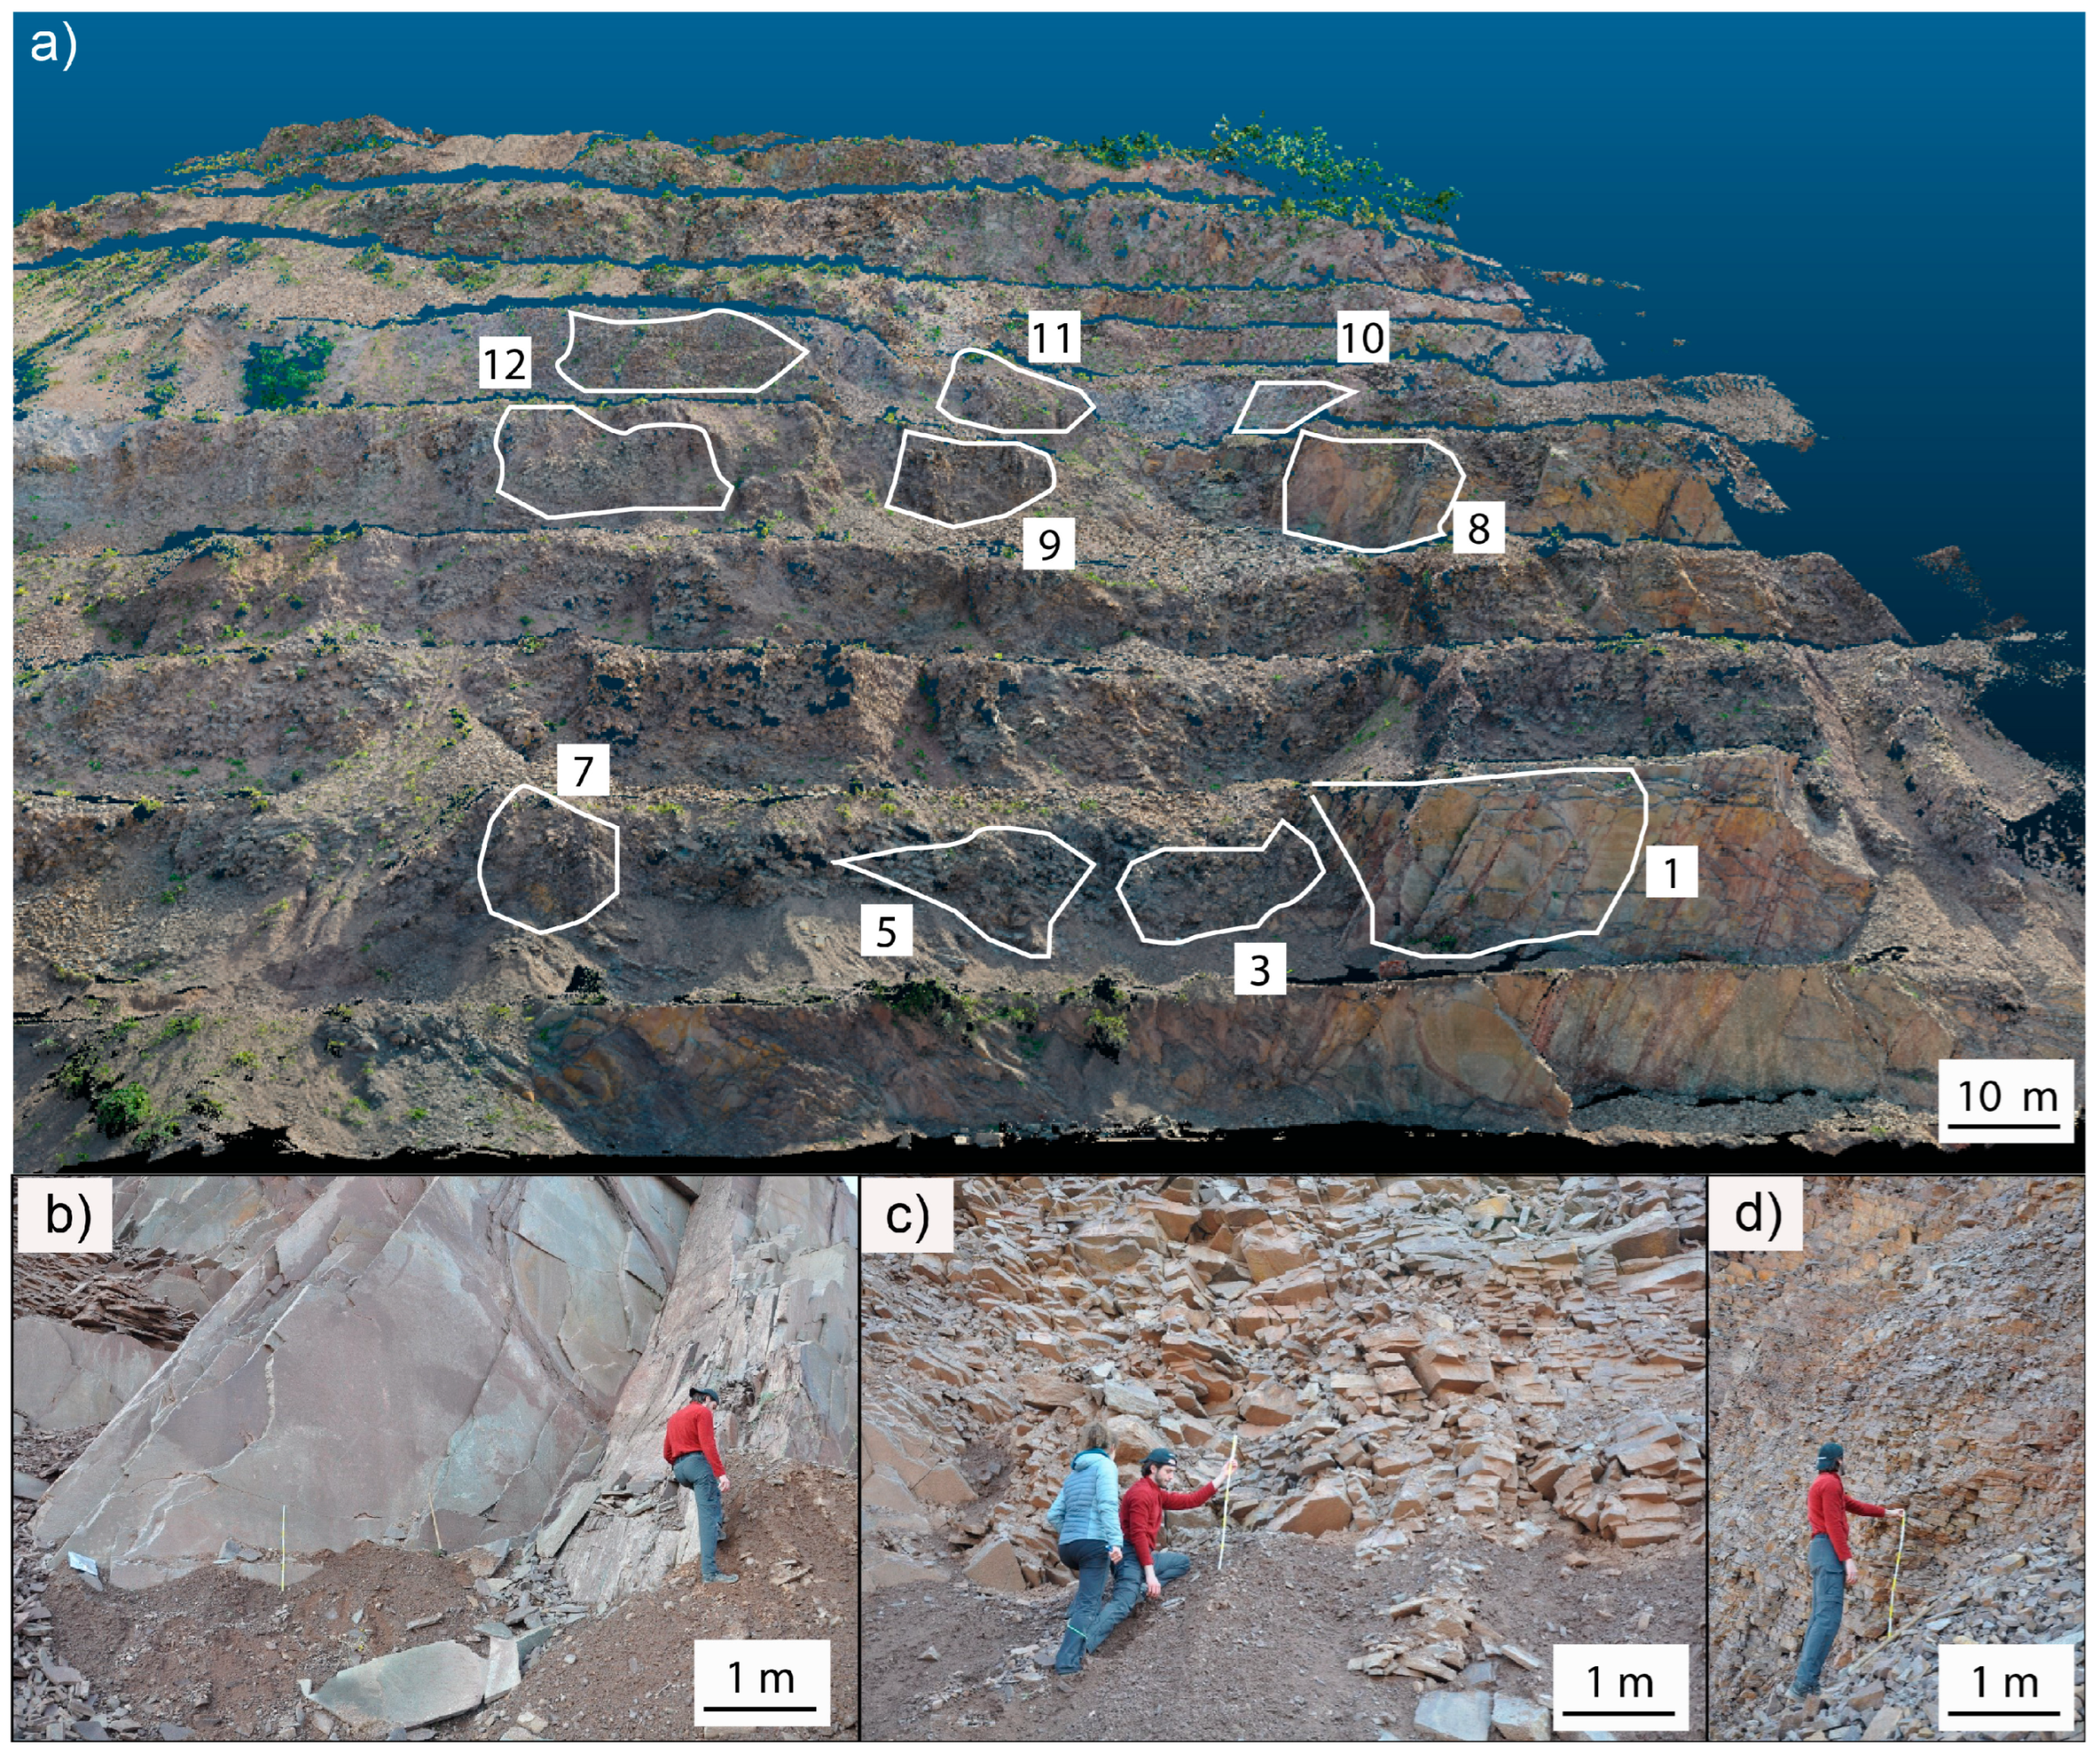
We carried out rock mass and discontinuity surveys at 10 outcrops that are safely accessible through quarry benches at different elevations (Figure 3a). These outcrops are representative of slope sectors affected in different ways by the structurally controlled instability processes reported in [34], and are thus characterized by different rock mass damage states (Figure 1 and Figure 3a). At each outcrop, we performed standard window sampling discontinuity surveys [68] in order to frame each considered rock mass domain within the slope scale structural setting and constrain the orientation, spacing, persistence, weathering conditions and intensity of inherited fractures as well as the characteristics of fractures related to damage induced by gravitational processes (Figure 3b–d). Based on these observations, we provided GSI estimates representative of the entire outcrop, quantified in ranges of 5, which, in our experience, provide the highest accuracy that is consistently achievable by trained experts [34].

3.3. Rock Mass Thermal Behavior: Infrared Thermography

In order to explore the relationships between the responses of rock masses to thermal perturbations occurring in a natural environment subjected to solar forcing with sky and local ground radiative effects, and their geomechanical qualities, we set up a campaign of IRT surveys and specifically designed field experiments.

3.3.1. IRT Basics and Environmental Controls
According to the Planck radiation law, a blackbody emits electromagnetic radiation at different wavelengths depending on its temperature. Thus, it is possible to measure the surface temperature of objects based on their emitted radiation in specific IR wavelength ranges using a technique called infrared thermography [42,69]. Modern IR thermal cameras measure the infrared radiation emitted by bodies in the spectral band of 7.5–14 mm.
The measured thermal exitance, i.e., the energy emitted from a body in the infrared band, basically depends on the surface temperature, according to [69], as follows:
J = ετσT4
where:
J is radiant exitance of the body’s surface (Wm−2);
T is surface temperature of the body (K);
σ is Stefan–Boltzman constant (Wm−2 K−4);
ε is emissivity of the surface (-);
τ is atmospheric transmittance (-).
Thermal emissivity (ε), ranging between 0 and 1, is the ratio between the amount of radiation emitted from a body’s surface and that of a blackbody at the same temperature. Thus, for a blackbody, ε = 1, while grey bodies have (ε < 1) [69,70]. For example, metals usually exhibit very low emissivity (ε < 0.1), while rocks generally have high emissivity (ε > 0.9); [71,72]. Atmospheric transmittance represents the absorptivity of the atmosphere and depends on air humidity, temperature and distance of IR thermal camera.
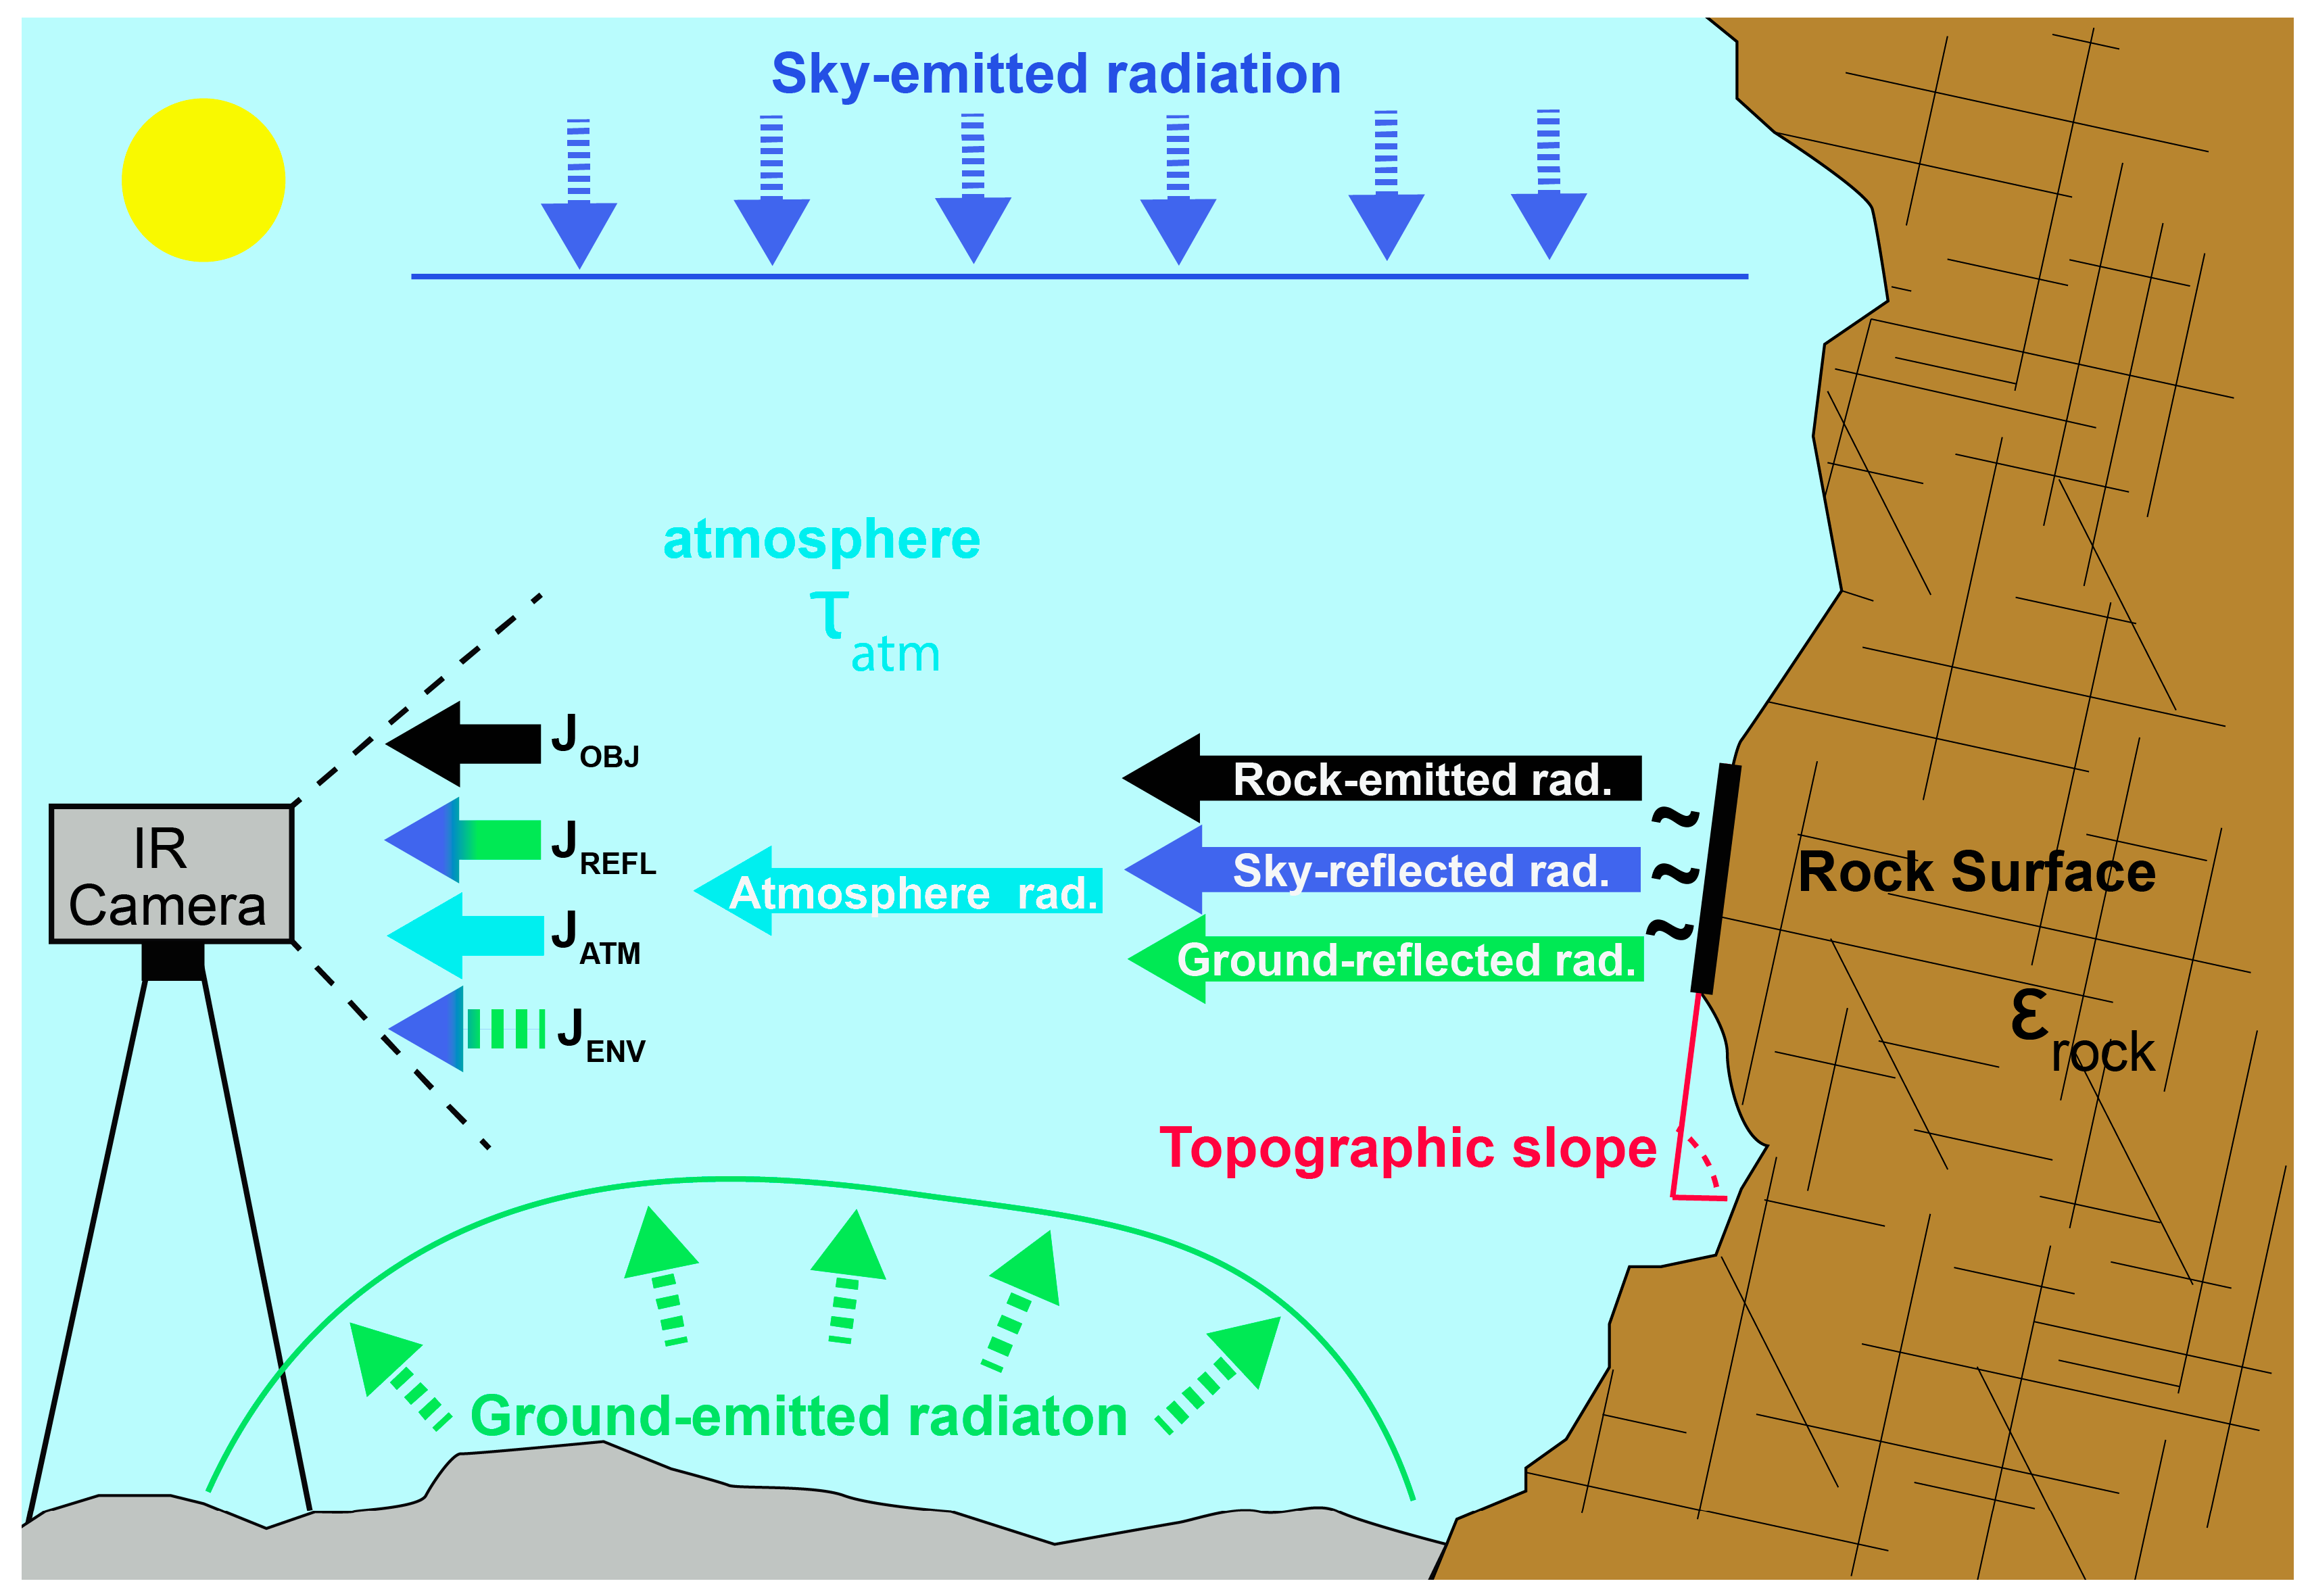
As each body with a temperature greater than the absolute zero (0 °K/−273.15 °C) emits infrared radiation, the total radiation detected using thermal cameras is the sum of different contributions from the surrounding environment that must be removed to obtain a realistic estimate of the surface temperature of target objects (Figure 4). Environmental contributions are particularly important when operating in outdoor environments, and the thermal exitance measured using the camera can be resumed as (Figure 4)
J = JOBJ + JREFL + JATM
where:
J is the total amount of radiant exitance measured using IR camera (Wm−2);
JOBJ is the radiant exitance emitted by the body’s surface (i.e., rock) (Wm−2);
JREFL is the radiant exitance contribution coming from the environment (i.e., from the sky and the surrounding ground) and reflected to the thermal camera (Wm−2);
JATM is the radiant exitance contribution from the atmosphere (Wm−2).
Figure 4. Components of the temperature signal recorded via IRT in an outdoor setting. The infrared signal recorded with a thermal camera includes different contributions that influence the measurements of the radiation emitted by rock surfaces. These contributions include (Equation (2)) the rock-emitted radiation (black arrow), the reflected infrared radiation contributions from the sky (blue arrow) and the ground from the surface to the camera (green arrow) and the atmospheric radiation (light blue arrow).
Remotesensing 15 04525 g004
The diffused contribution of the surrounding ground is neglected in the problem due to its high variability and limited influence. In fact, ground temperature is usually much more similar to that of the target object with respect to the blue sky’s temperature. By expressing the radiant exitance members of Equation (2) in terms of temperatures (Equation (1)), the target surface temperature TOBJ can be calculated as follows [58]:
TOBJ = [(T4 − (1 − ε) τTREFL4 − (1 − τ) TATM4)/ετ)]1/4
where:
TOBJ is the (kinetic) surface target temperature (K);
T is the (apparent) temperature measured by the thermal camera (K);
TREFL is the temperature contribution coming from the environment (i.e., from the sky and the surrounding ground) and reflected to the thermal camera (K);
TATM is the air temperature (K);
ε is the target emissivity (-);
τ is the transmittance of atmosphere (-).
Different contributions are modulated by the target material emissivity [69,72] and the atmospheric transmittance [45,59]. Several authors suggested that the temperature recorded with thermal cameras depends on topography [58,69,73] in outdoor conditions, where significant amounts of energy radiated by the sky and surrounding ground are reflected by the target [74]. In particular, TREFL is mostly influenced by the radiation contribution of the cold sky (Figure 4), characterized by temperature values between −65 °C and −55 °C on clear days [60,75]. This contribution appears to be stronger in flat topography, resulting in a cooler apparent temperature [74].

3.3.2. IRT Time-Lapse Survey

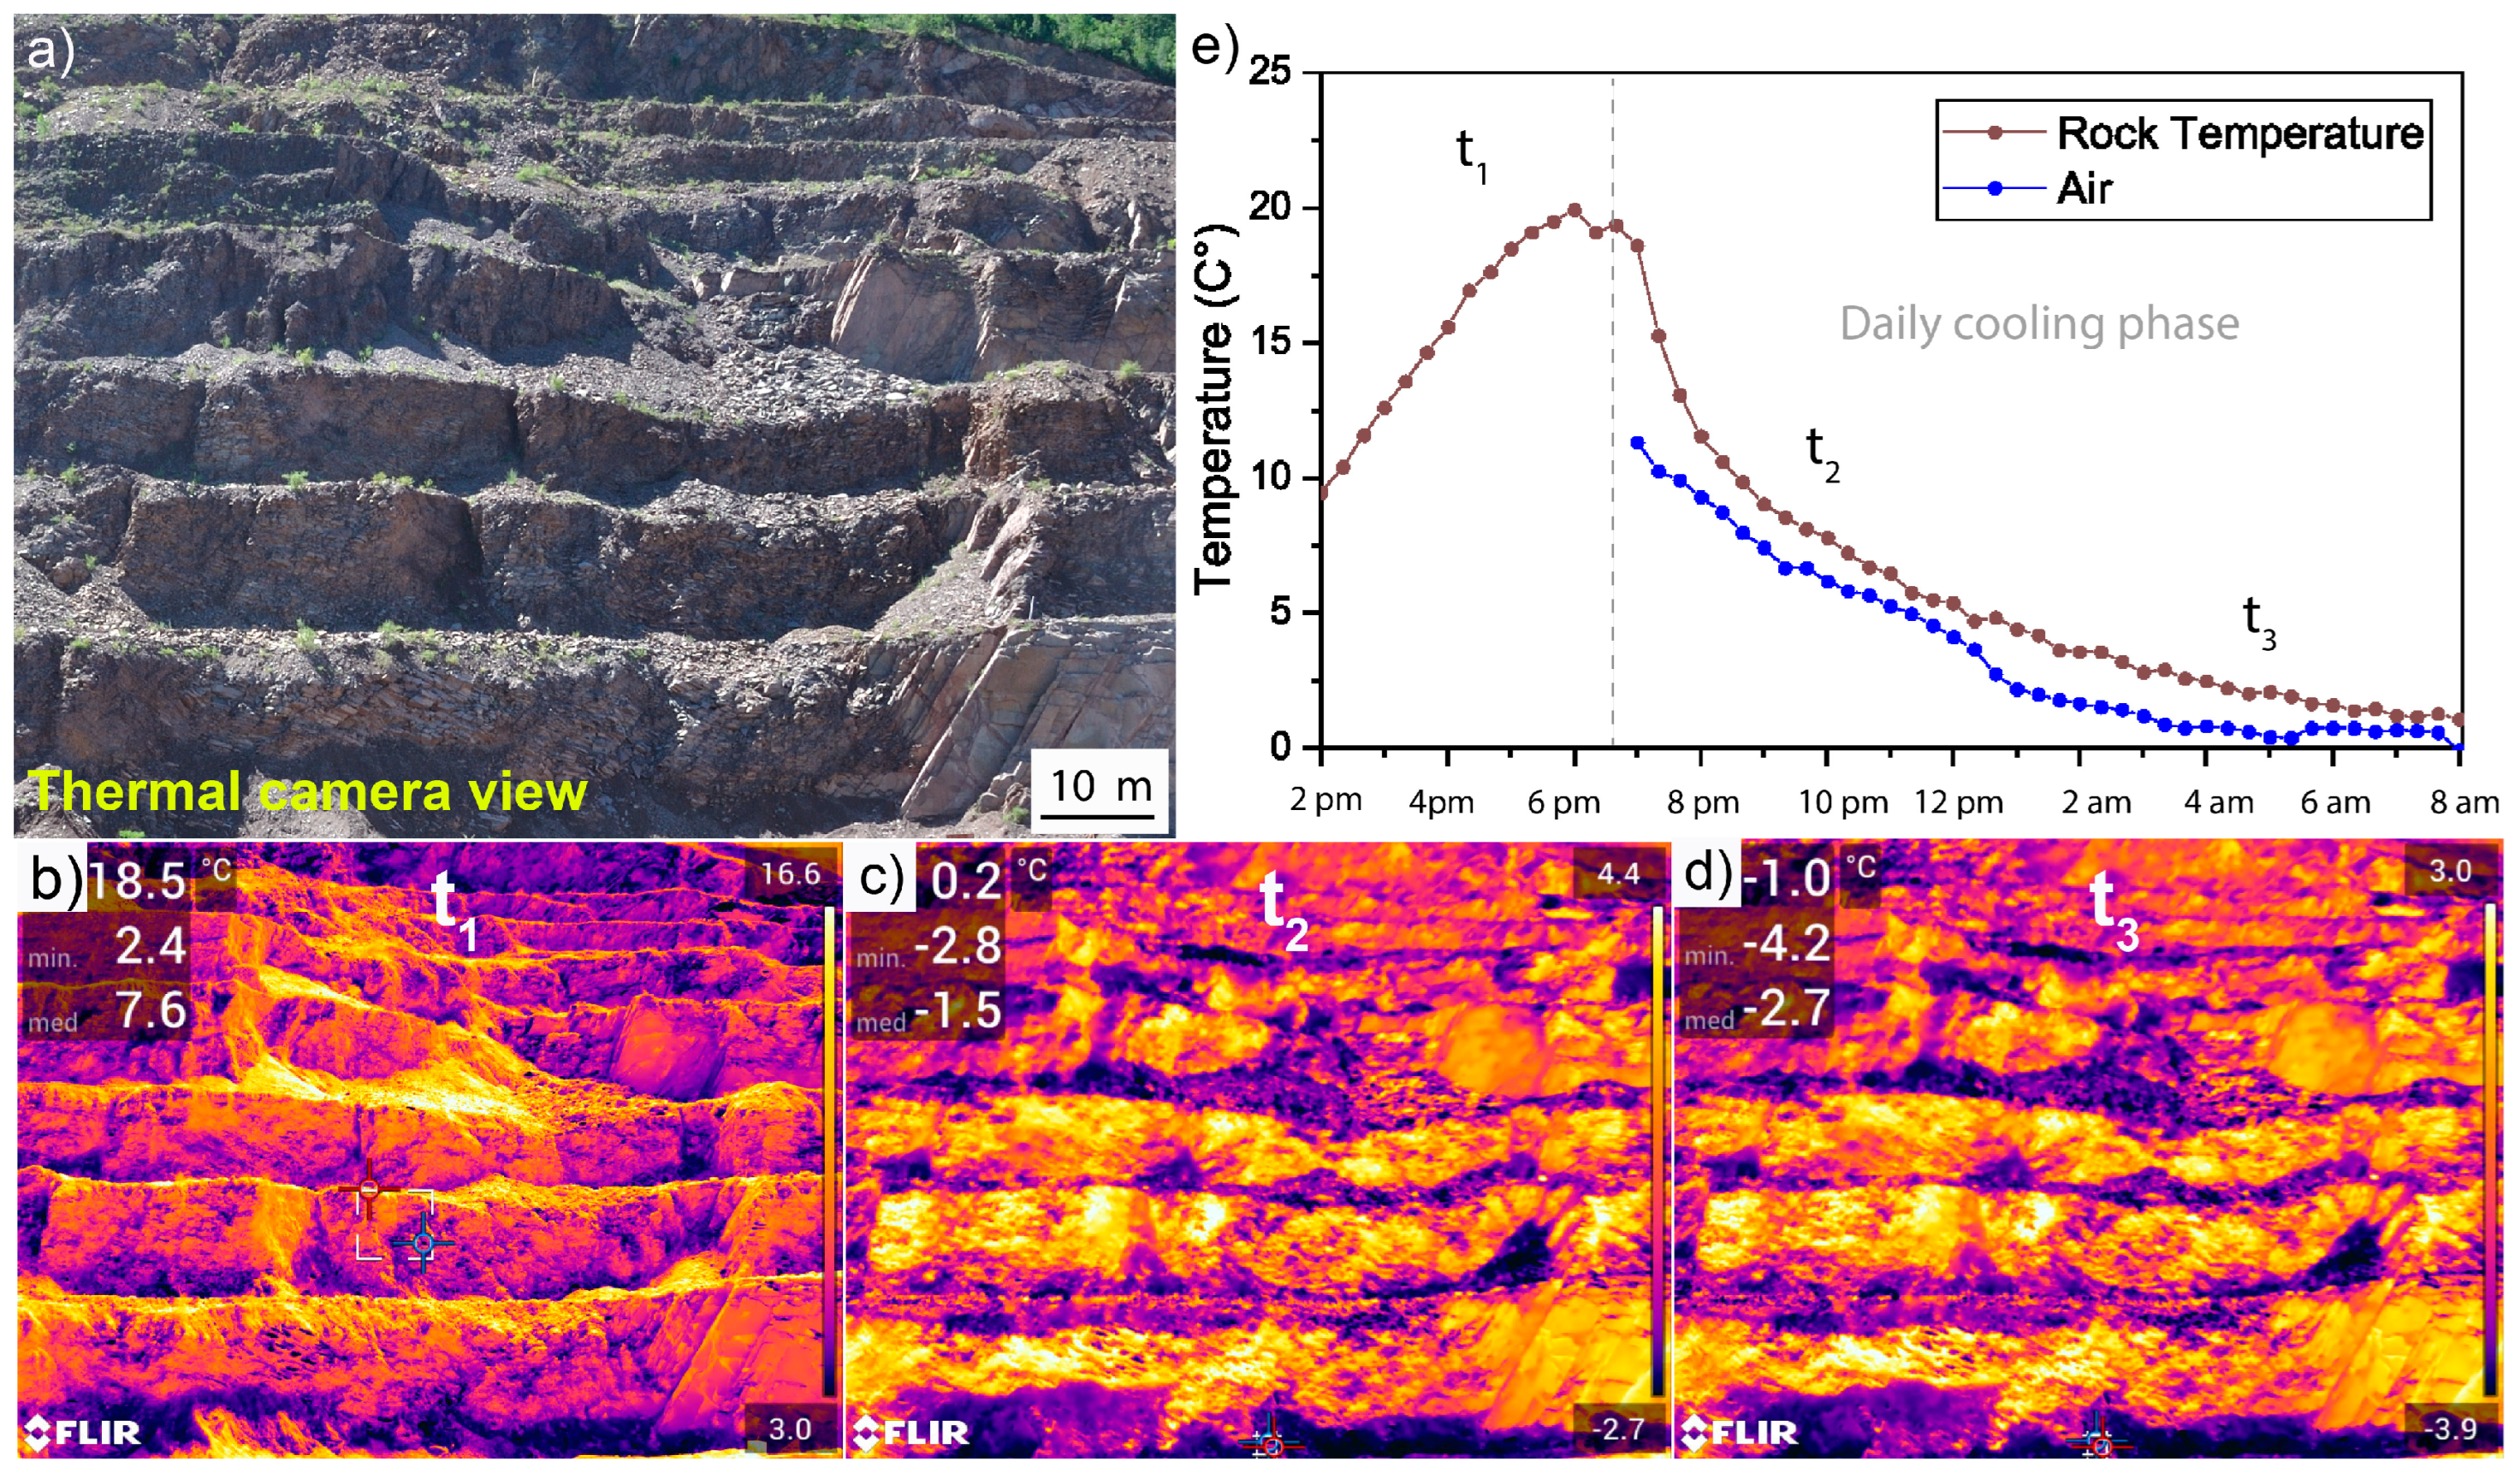
We carried out an IRT monitoring campaign investigating the area covered by the UAV survey and the characterized rock mass outcrops (Figure 2b and Figure 5a) starting from the last daily heating phase and catching the complete cooling behavior of the quarry face from sunset (stop of heating force) to sunrise (Figure 5e) on 5th April 2022. The FLIR camera station was about 200 m to 250 m (depending on topography) from the N-facing quarry front (Figure 2b) and covered a window of 74 × 56 m (Figure 2b and Figure 5a) with a ground resolution of about 7 cm/px. Surveys were carried out with a FLIR™ T1020 high-resolution LW thermal camera (FLIR, Wilsonville, OR, USA) (1024 × 768 pixels, operating in the 7–14 μm band of the IR spectrum) characterized by a measurement sensitivity within 0.02 °C and a field of view (FOV) of 28° × 21° in time-lapse mode (20 min). We acquired 57 thermograms from 2:00 p.m. to 8:00 a.m., while air temperature was registered with an Omega™ OM-91 usb logger (Omega, Biel/Bienne, Switzerland) (Figure 5b–e). Relative Humidity (RH) changed between 60% and 70% during acquisition period, and sky covering was absent.

3.3.3. IRT Correction Workflow

We set up an innovative workflow to correct the acquired thermograms accounting for the diverse contributions outlined in Section 3.3.1. The workflow included (a) standard characterization of rock emissivity, (b) experimental modeling of the dependence of the sky radiation component of reflected temperature on topography and (c) implementation of a semi-automatic tool for the correction of acquired thermograms accounting for the local rock type and topographic conditions (Figure 4, Equation (3)).
We estimated the thermal emissivity of the porphyry rock forming the Mt. Gorsa slope by calibrating its IRT signal with reference to the one of a near-blackbody material at the same temperature following the approach used in [72]. We heated an unaltered sample of Mt. Gorsa porphyry, which was collected during fieldwork (Figure 6a), in a laboratory oven up to ~70° degrees, covering a part of the surface with a black PVC tape with known emissivity (ε = 0.97), as shown in Figure 6a. After 24 h heating, allowing for a uniform temperature to be attained, we immediately acquired a thermal image of the sample (Figure 6b). We quantified the reflected radiation component TREFL using a gold panel. Since laboratory measurements were carried out from an acquisition distance of 1 m, atmosphere effects were negligible [72]. Using the software Research IR-Max™, we measured the average temperatures of the black tape (TTAPE) and the rock material (TROCK) within circular areas to avoid sample edge effects. Finally, we set the emissivity of the black tape to 0.97 and tuned the rock emissivity until it reached the same recorded temperature (TTAPE = TROCK = 68.3 °C; Figure 6b) to estimate rock emissivity (εrock = 0.95); these values were fully consistent with values reported in the literature for rocks with similar composition [71,72,74].
To investigate and incorporate possible effects of topography on the sky radiation contribution (Figure 4) of the reflected temperature component [74], we designed and carried out ad hoc field experiments (Figure 7). We wrapped a plastic sphere (diameter of 1 m) in rough aluminum foil, working as an almost perfect infrared reflector (emissivity, ε = 0.03). We placed the sphere outdoor in an open space to have full sky visibility and avoid ground reflection contributions (Figure 7a). On a day with environmental conditions like those encountered at Mt. Gorsa (season, temperature range and cloud-free sky), we placed the thermal camera 2 m apart from the sphere, looking horizontally in the equatorial plane of the sphere (Figure 7a–c), and captured thermograms at different times during the day (Figure 7c). Using the software FLIR®ResearchIR™, we extracted temperature values along a vertical profile aligned with the maximum diameter of the sphere, corresponding to an arc of circumference connecting the two poles from zenith (0°) to nadir (180°; Figure 7a–c).
As the Sky IR radiation is vertical (Figure 4), we can consider the local sphere surface inclination as representing the topographic slope (α = 0: horizontal topography). For each experiment, we consistently observed similar non-linear temperature trends from the upper pole to the lower pole (Figure 7), which was clearly an effect of reflection by different radiative contributions (Figure 4). In the lower hemisphere (α > 90), we recorded rather constant temperature values that were consistent with the ground temperature (green shaded area on graph in Figure 7b–c), while in the upper hemisphere, the temperature tended to reach the lowest values compared with the sky IR temperature [60] (−55 °C < TREFL < −60 °C; Figure 7b,c). It is clear from the experimental evidence how the sky radiation contribution increases when moving from the equatorial plane (α = 90°) toward the upper hemisphere pole (α = 0°), reaching the minimum value for TREFL = TSKY. It is important to emphasize (Figure 7b,c) that for the 0° < α < 30° dip, we also observed a zone of relative increase in the TREFL (yellow shaded area on graph in Figure 7b,c) due to an emissivity bias that was not related to the topographic slope, but with the specular radiation of the aluminum sphere, which would not affect more Lambertian materials (i.e., rocks; [69,76,77]).
The analyzed experiments thus show a strong dependence of the TREFL value on the alpha value (i.e., topographic slope), which, in reference to Equation (3), is in agreement with the phenomenon observed experimentally in [74].
We interpolated the experimental temperature values collected in all experiments in the α range between 30° and 90°, avoiding the bias (Figure 7b) by using an exponential growth function (Figure 7d). We propose a site-specific Sky-Dip Reflection Model (SDRM; Figure 7d) that relates the recorded reflected temperature component with the local inclination of a surface exposed to the sky:
SDRM = TREFL = 0.07exp(α/13) + TSKY
where:
SDRM is the Sky-Dip Reflection Model;
TSKY is the sky temperature (°C);
TREFL is the same as that defined in Equation (3) (and converted in °C);
α is the local sphere surface inclination (i.e., topographic slope) (°).
For surfaces with α > 90°, the TREFL can be considered equal to the one assumed for α = 90 based on the experimental evidence in the lower hemisphere of the ball (Figure 7c).
Model application requires associating a value of local topographic slope to every pixel in thermograms (Figure 5b–e). We used the high-resolution 3D point cloud representation of the quarry (Figure 2) to derive local values of slope dip via point normal calculations in Cloud Compare ™.
We used Agisoft Metashape Professional 1.8.0 to manually geo-reference the RGB image of the scene acquired by the thermal camera during IRT acquisitions to estimate its internal orientation parameters omega (ω), phi (ϕ) and kappa (κ), i.e., the internal orientation parameter of the camera [78] (Figure 8a). In this way, we were able to (a) transform geographic coordinates into thermal camera coordinates; (b) project the 3D point cloud on the thermal image using an undistorted reprojection model [78] within an original Matlab 2020b™ script (Figure 8a); (c) associate a topographic dip value to each pixel of each acquired thermogram (Figure 8b) and (d) obtain a map of reflected temperature to correct acquired thermograms (Figure 5b–d and Figure 8c). Map ground pixel presents an estimate range between 0.005 and 0.01 m2 in function of the distance between the different benches and the IR camera (Section 3.3.2).
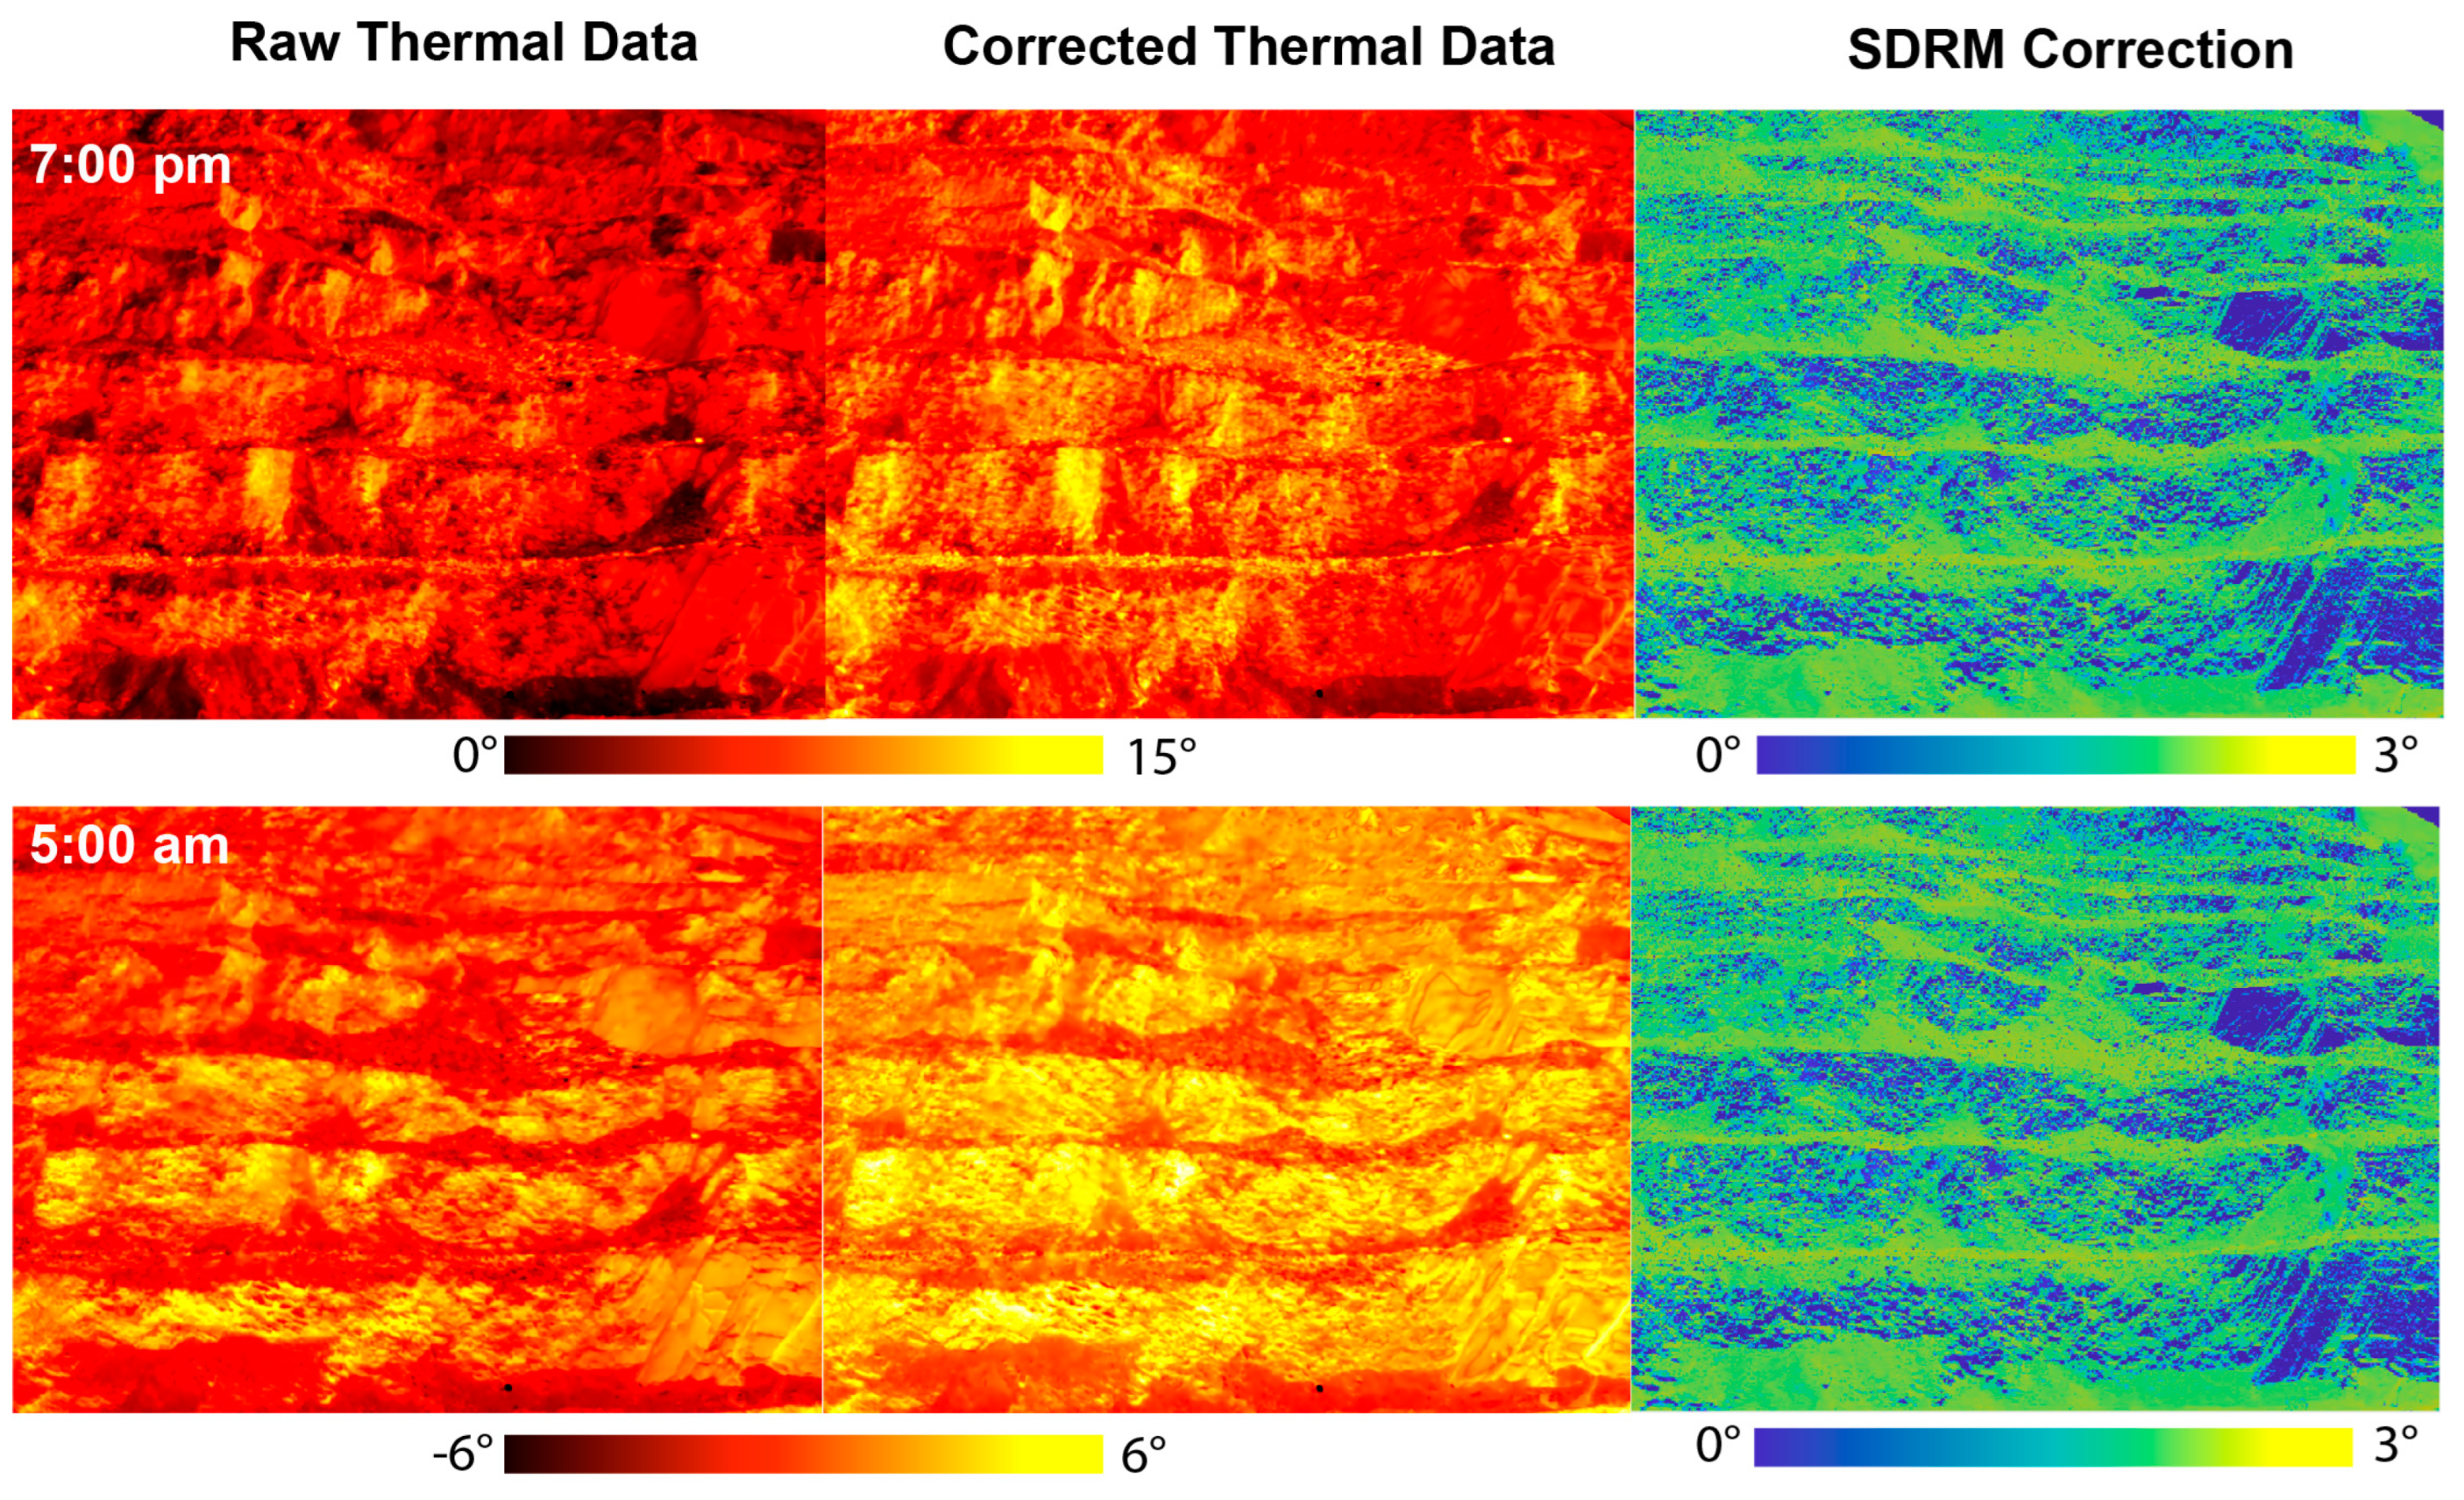
After this process, we obtained (1) a correct emissivity for the porphyry εROCK (keeping it constant during further calculations) and (2) the TREFL for each pixel of the raw thermal image. With τ = 0.94, which was representative of our environment during the acquisition [59], Equation (3) was applied in order to estimate the corrected temperature TOBJ from the raw temperature T (Figure 9).
As we can see from Figure 9, the main effect of the correction was the reduction in the “cold sky” IR-reflected temperature, and so the temperature on the most horizontal faces of the outcrops increased by up to 3 °C, while the temperature of the vertical faces remained stable, which was in accordance with the recorded temperature deviation range of the rock samples in the outdoor experiments in [74].

3.4. Rock Mass Cooling Dynamics: Curve Shape Parameter

We upscaled the approach proposed in [54] to an in situ condition to characterize the fracturing state of rocks by modeling experimental cooling curves reconstructed from IRT measurements. The authors found that fractured rocks subjected to forced heating cool faster than intact ones. They modeled experimental cooling curves using a Lumped Capacitance approach [79,80] and characterized them with a scalar Curve Shape Parameter (CSP, h−1) significantly correlated to fracture abundance measures [54].
The CSP provides a synthetic description of the shape of experimental cooling curves and was obtained by fitting the linear part of the cooling curve. CSP incorporates the thermal properties of the rock material, the boundary convective condition of the solid–air interface and, most importantly, the representative size of radiant element (i.e., rock blocks) of rock mass portion, which is correlated with fracture abundance [54].
The method is based on laboratory cooling experiments performed in indoor controlled conditions (forced heating, constant and steady thermal boundary conditions) that are usually not satisfied in situ. Moreover, the multi-scale and heterogeneous nature of in situ-fractured rock masses and the rock volumes involved in the investigation potentially affect the ability of IRT to detect cooling behaviors related to different rock mass qualities.
From the corrected thermogram stack (Section 3.3.3), for each pixel, we extracted temperature time series that capture the heating under solar forcing of different parts of the scene and the subsequent cooling (Figure 5e). For each pixel, we extracted the cooling curves related to the time period between 7:00 p.m. (after sunset) and 7:30 a.m. (just after sunrise) (Figure 10a).
To apply the methodology of [54] in field conditions, we assumed that the rock mass was made of different domains with different fracturing states, and that it continuously tended to reach a continuously changing asymptotic value that was eventually represented by the lowest air temperature reached overnight (Figure 10a). By normalizing all values of rock cooling curves using this temperature ([79,80]; Figure 10b), we could define a time window (Figure 10b) in which the cooling curves of the rock mass could be fitted using the Lumped Capacitance approach as a negative exponential law ([54,80] Figure 10b).
Then, we implemented an original MATLAB 2020b™ tool that extrapolated the CSP value for each pixel of thermogram cooling series, returning only for pixels at which the R2 goodness of fit exceeded a certain user-defined threshold (e.g., R2 > 0.85), in order to exclude the points that did not respect the assumed empirical cooling behavior reducing sources of error.
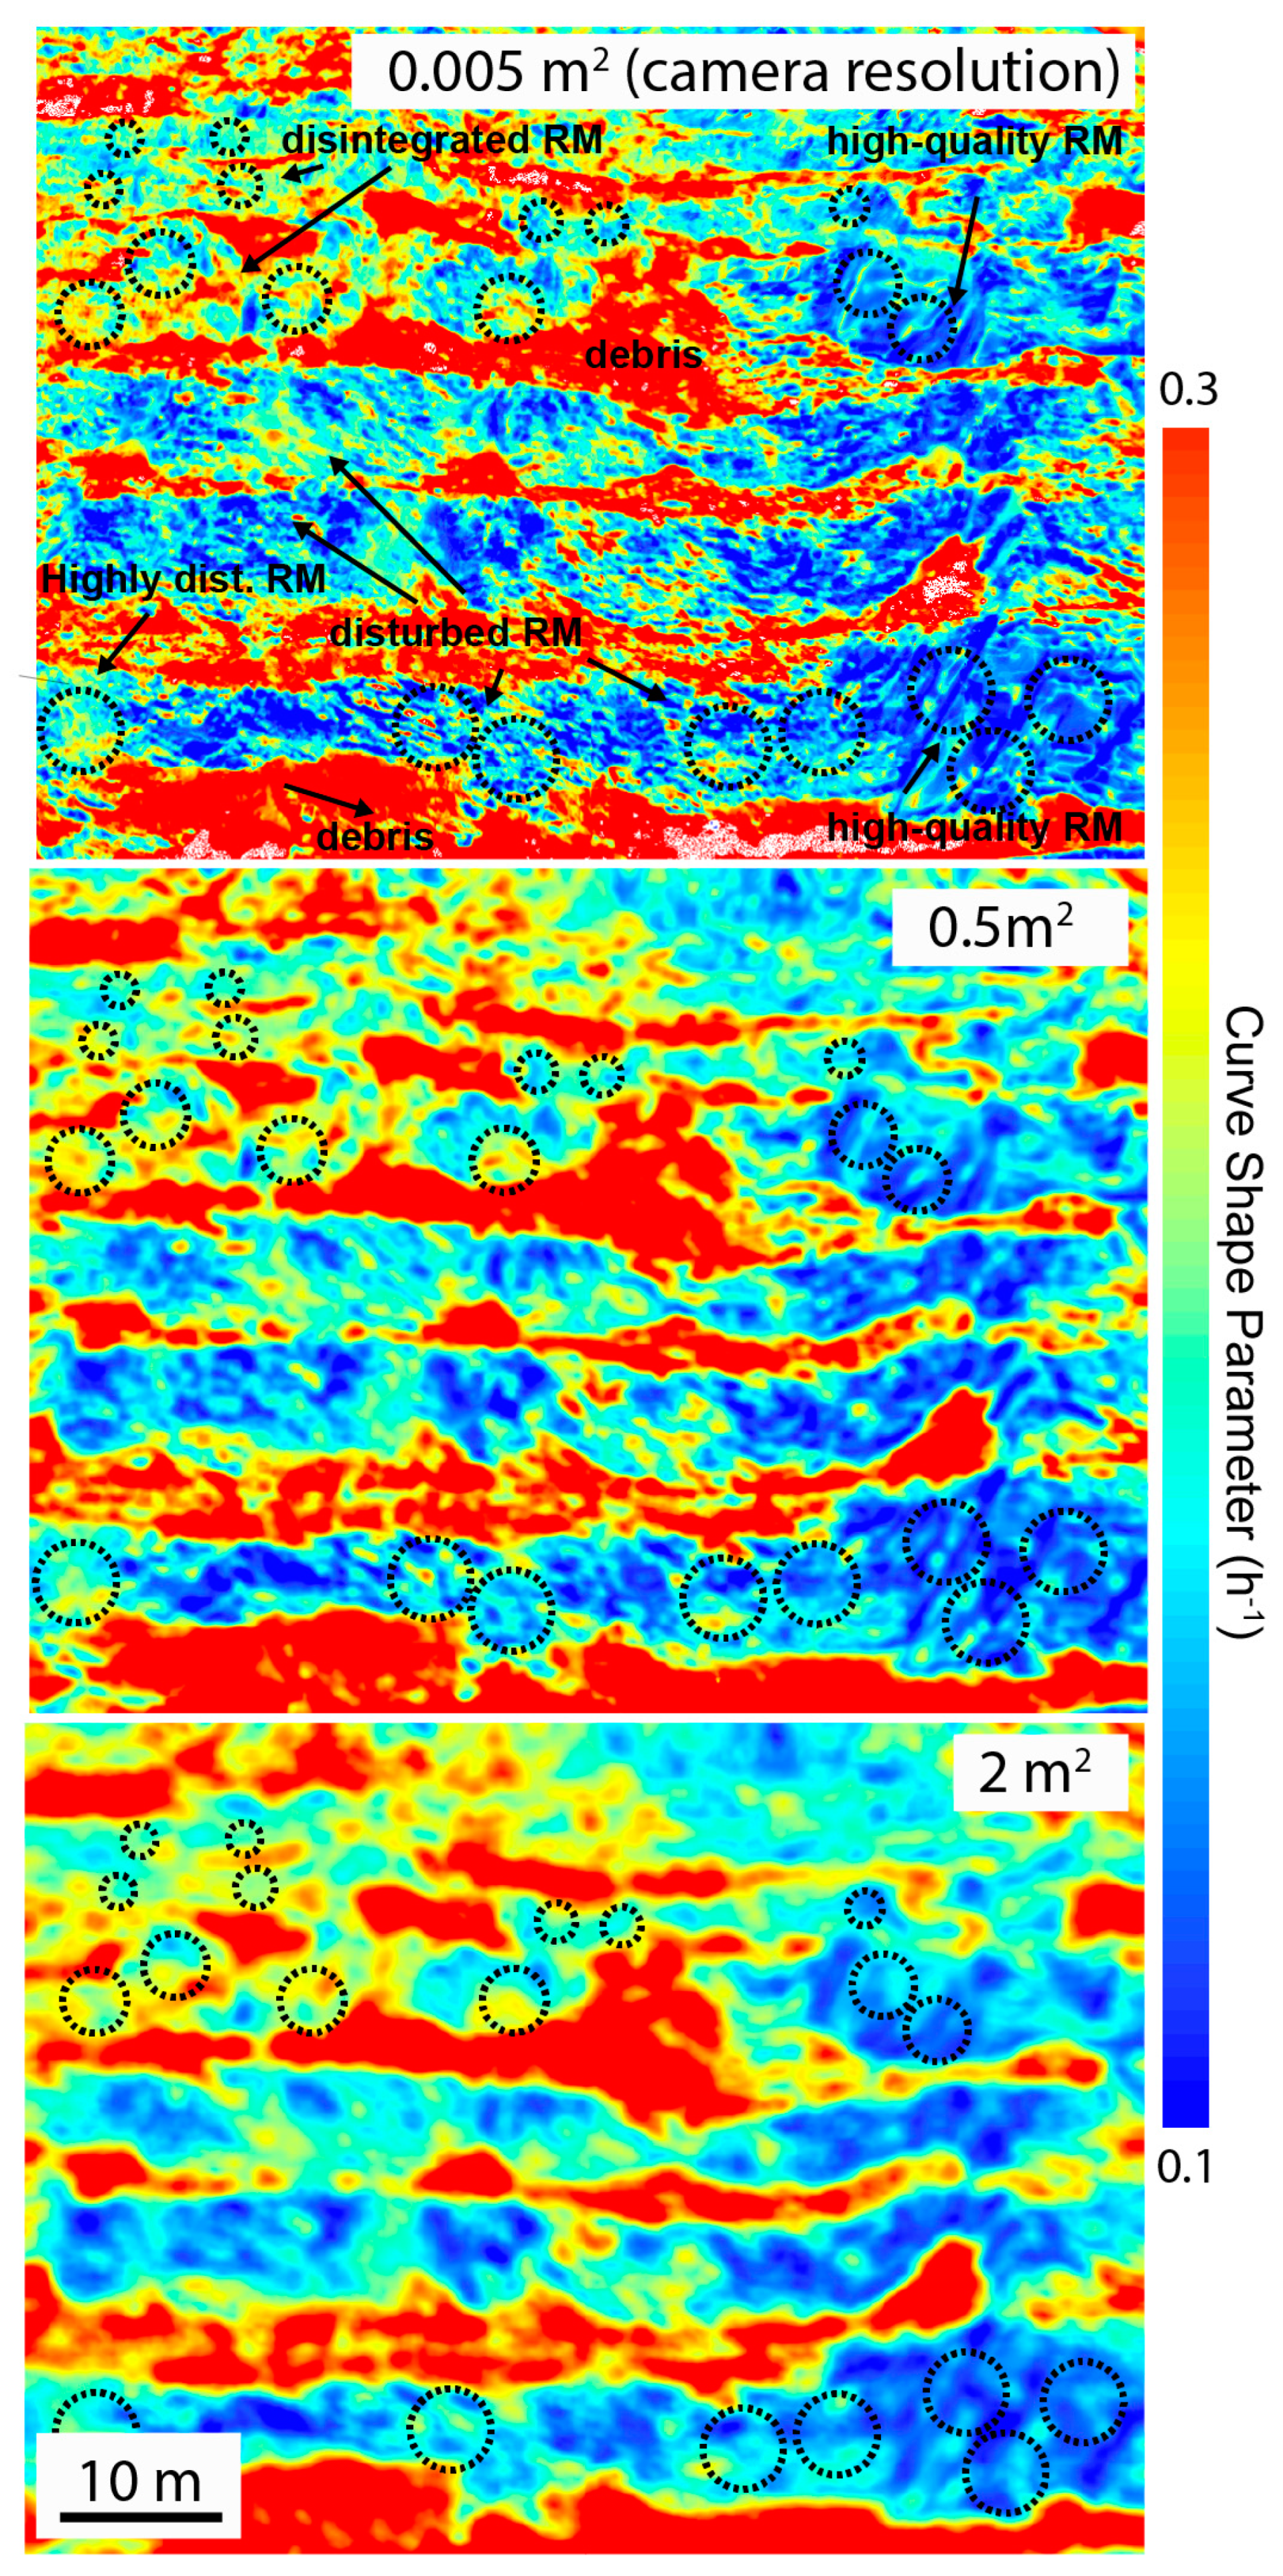
This processing allowed us to obtain CSP maps on the entire surveyed quarry face, encompassing an investigated area exceeding 80,000 m2 in a spatially distributed way (Section 4). CSP maps were obtained by processing the thermogram stack at the original spatial resolution, with an estimated ground pixel resolution of 0.005 to 0.01 m2, and then smoothed using circular moving windows with areas of 0.005, 0.5 and 2 m2, respectively, in order to test the scale dependency of the results and identify the spatial scale that allowed us to capture the “equivalent continuum” thermal response of rock masses with different qualities [54] (Figure 11).

3.5. Distributed Mapping of Rock Mass Quality: CSP-GSI Relationship

Franzosi et al. [54] found a laboratory-derived quantitative correlation between the CSP and unbiased fracturing measures like the volumetric fracture intensity (P32) and the rock porosity related to interconnected fractures open to the external boundary (P33). Since these measures cannot be obtained in in situ surface investigations, we made an attempt to correlate the obtained spatially distributed values of CSP with our field estimates of the Geological Strength Index (GSI; see Section 3.2).
We extracted CSP value populations within outcrop areas characterized in terms of GSI (Figure 3) using circular sampling windows with a radius of about one quarter of the height of the related quarry benches, making them comparable in terms of ground surface covered (Figure 12, Section 4.2). From each CSP map obtained via smoothing (Figure 11), we extracted CSP values, plotted them against the corresponding GSI range (Figure 3) and filtered out values outside the interquartile range (IQR) [81,82].
The 25th and 75th quartiles provide a measure of central tendency and moderate variability in order to reduce the impact of outliers and anomalous values on the search for correlations between CSP and GSI. To search for such correlation, we needed a fitting model that was representative of the transition of the physical–mechanical characteristics of the rock mass with respect to its structure. Previous studies [3,33] showed that for very high (GSI > 60) or very low (GSI < 30) GSI values, the mechanical properties of the rock mass tended to exhibit asymptotic behaviors corresponding to the “continuum” properties of intact rock (high GSI) or disintegrated rock masses (low GSI), respectively. A non-linear fitting model that is well suited to describe this kind of behavior is represented by a sigmoidal function (e.g., Boltzmann).

4. Results

4.1. Rock Mass Quality: Characteristics and Distribution

The in situ discontinuity surveys and rock mass assessment confirmed the strong rock mass heterogeneity reported in [34], related to Section 2, resulting in sharp changes in the rock mass quality across rock domains with a volume of tens to thousands of cubic meters, separated by narrow structural features of transition zones related to structurally controlled slope instability processes (Figure 1c,d, Figure 2b and Figure 3b–d). This peculiar geo-structural setting provides us with a variety of mono-lithologic outcrops with different rock mass qualities in a limited study area that can be captured in one IRT scene (Figure 5) representing the typical structure of an open-pit mine. The selected outcrops correspond to sections of the 10 to 16 m high vertical quarry benches with different levels of accessibility (Figure 3 and Figure 8b), which are bordered at the foot by small talus debris with a lower inclination (Figure 8b).
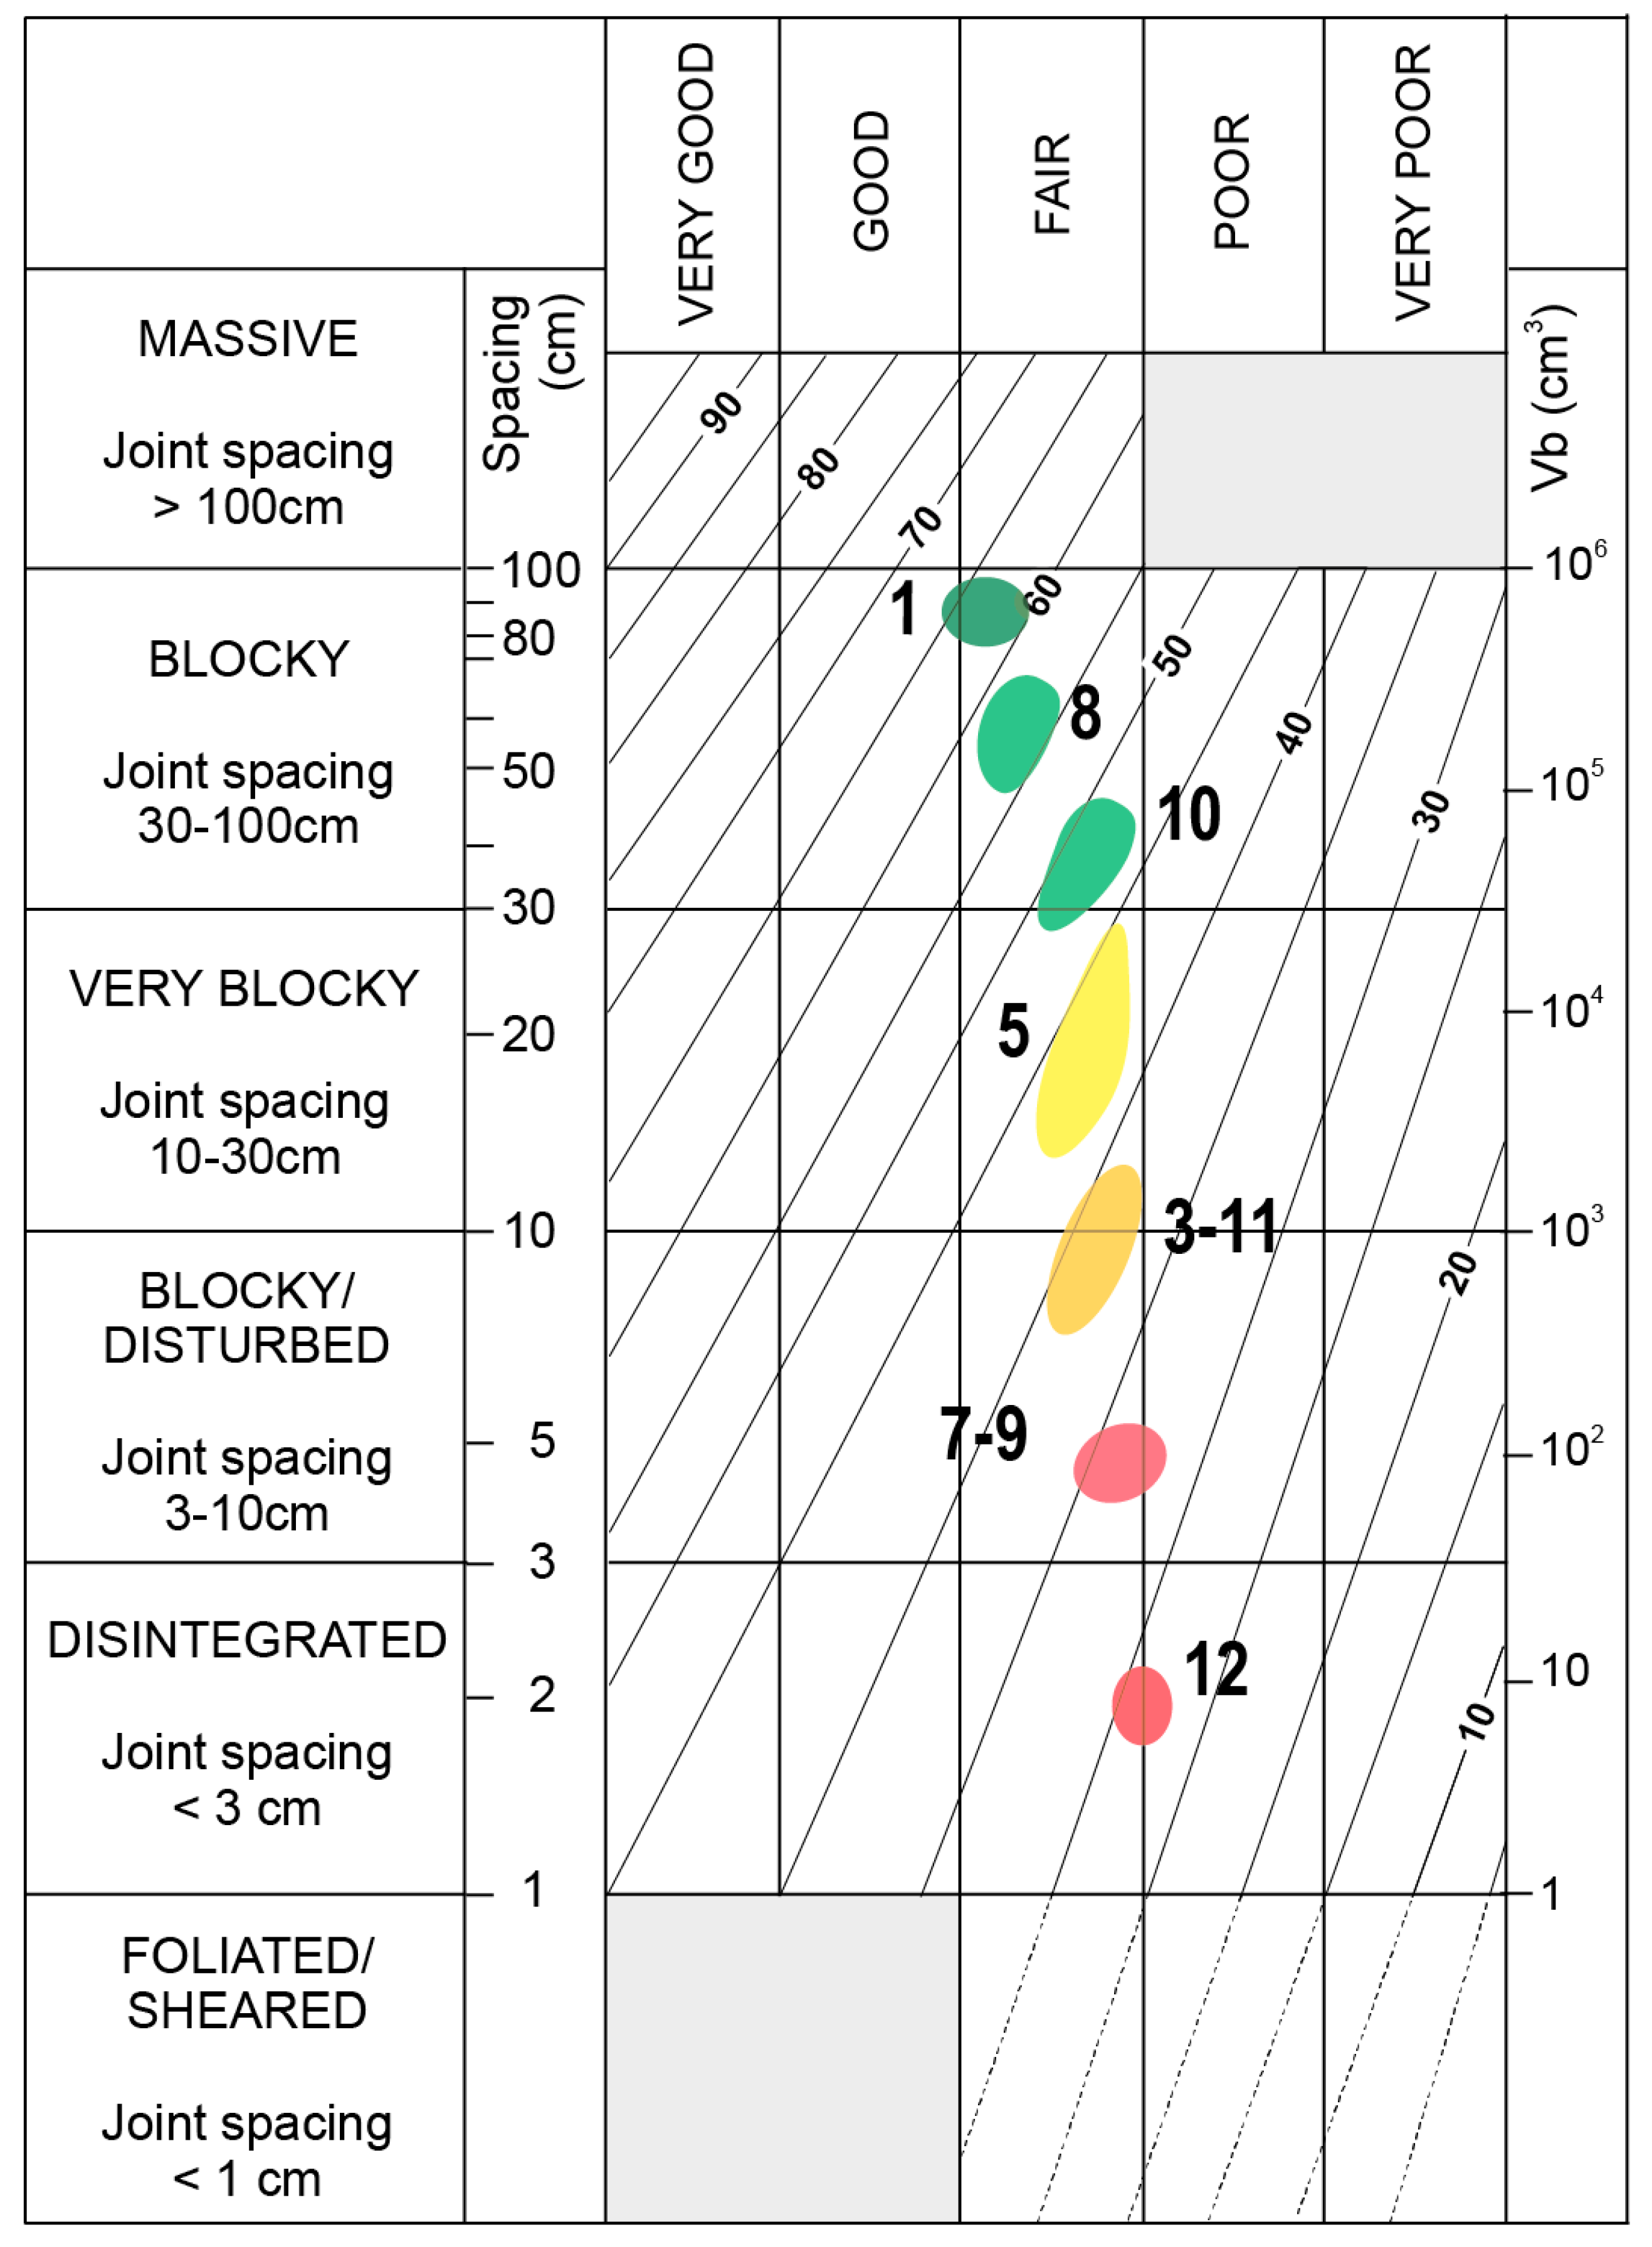
Our direct estimates of the Geological Strength Index (Figure 13), which depends on the rock mass structure, fracture density (and typical block volume) and weathering of the observed rock masses and discontinuity surfaces [15], revealed outcrops that are characterized by extremely variable rock mass qualities (Figure 3), with the GSI ranging between 25 and 65. The plot in Figure 13 shows that the values of the GSI mostly depend on the fracturing states, with a typical fracture spacing ranging between 2 and 80 cm, and depend much less on the surface weathering condition.
In fact, while we observed a rather homogeneous and superficial weathering state across the outcrops, rock fracturing is characterized by sharp variations (Figure 1c,d, Figure 2b and Figure 3b–d) from rather intact and heterogeneous rock masses (Vb from 0.1 m3 to some m3; Figure 3b and Figure 13) to highly and homogeneously fractured rock masses with a Vb as low as 10 cm3 (Figure 1d, Figure 3d and Figure 13). The estimated variability (Figure 13) of the GSI is typically higher in low–medium-quality rock masses (35 < GSI < 50) and lower in high- and very-poor-quality rock masses.

4.2. Rock Mass Cooling Dynamics

The rock mass cooling histories (Figure 5), captured at each pixel of the acquired thermal images, were corrected and characterized in terms of the CSP all over the IRT scene (Figure 10 and Figure 14). The obtained maps of the CSP provided a continuous spatially distributed description of the cooling behavior of the rock masses forming the studied sector of the Mt. Gorsa quarry face. The analysis provided a clear illustration of the heterogeneous spatial variability of the cooling dynamics across the sectors characterized by different fracturing states and rock mass qualities (Figure 14). Debris-covered areas are easily segmented (CSP values above 0.3 h−1; Figure 14) from rock mass outcrops, while outcrops with different fracturing degrees and related progressive or sharp transitions are clearly captured by the spatial patterns of the CSP. The obtained CSP map shows a general decrease in the rock quality moving from the lower right to the upper left corner of the scene (Figure 14 and Figure 15a) that corresponds to a slope sector that is heavily damaged by active rock slope deformation processes, which is in agreement with the results obtained by Agliardi et al. [34]. Smoothing processes allow for the signal to be homogenized all over the map, showing the average thermal response of the group, rather than of the individual block (Figure 11 and Figure 14).
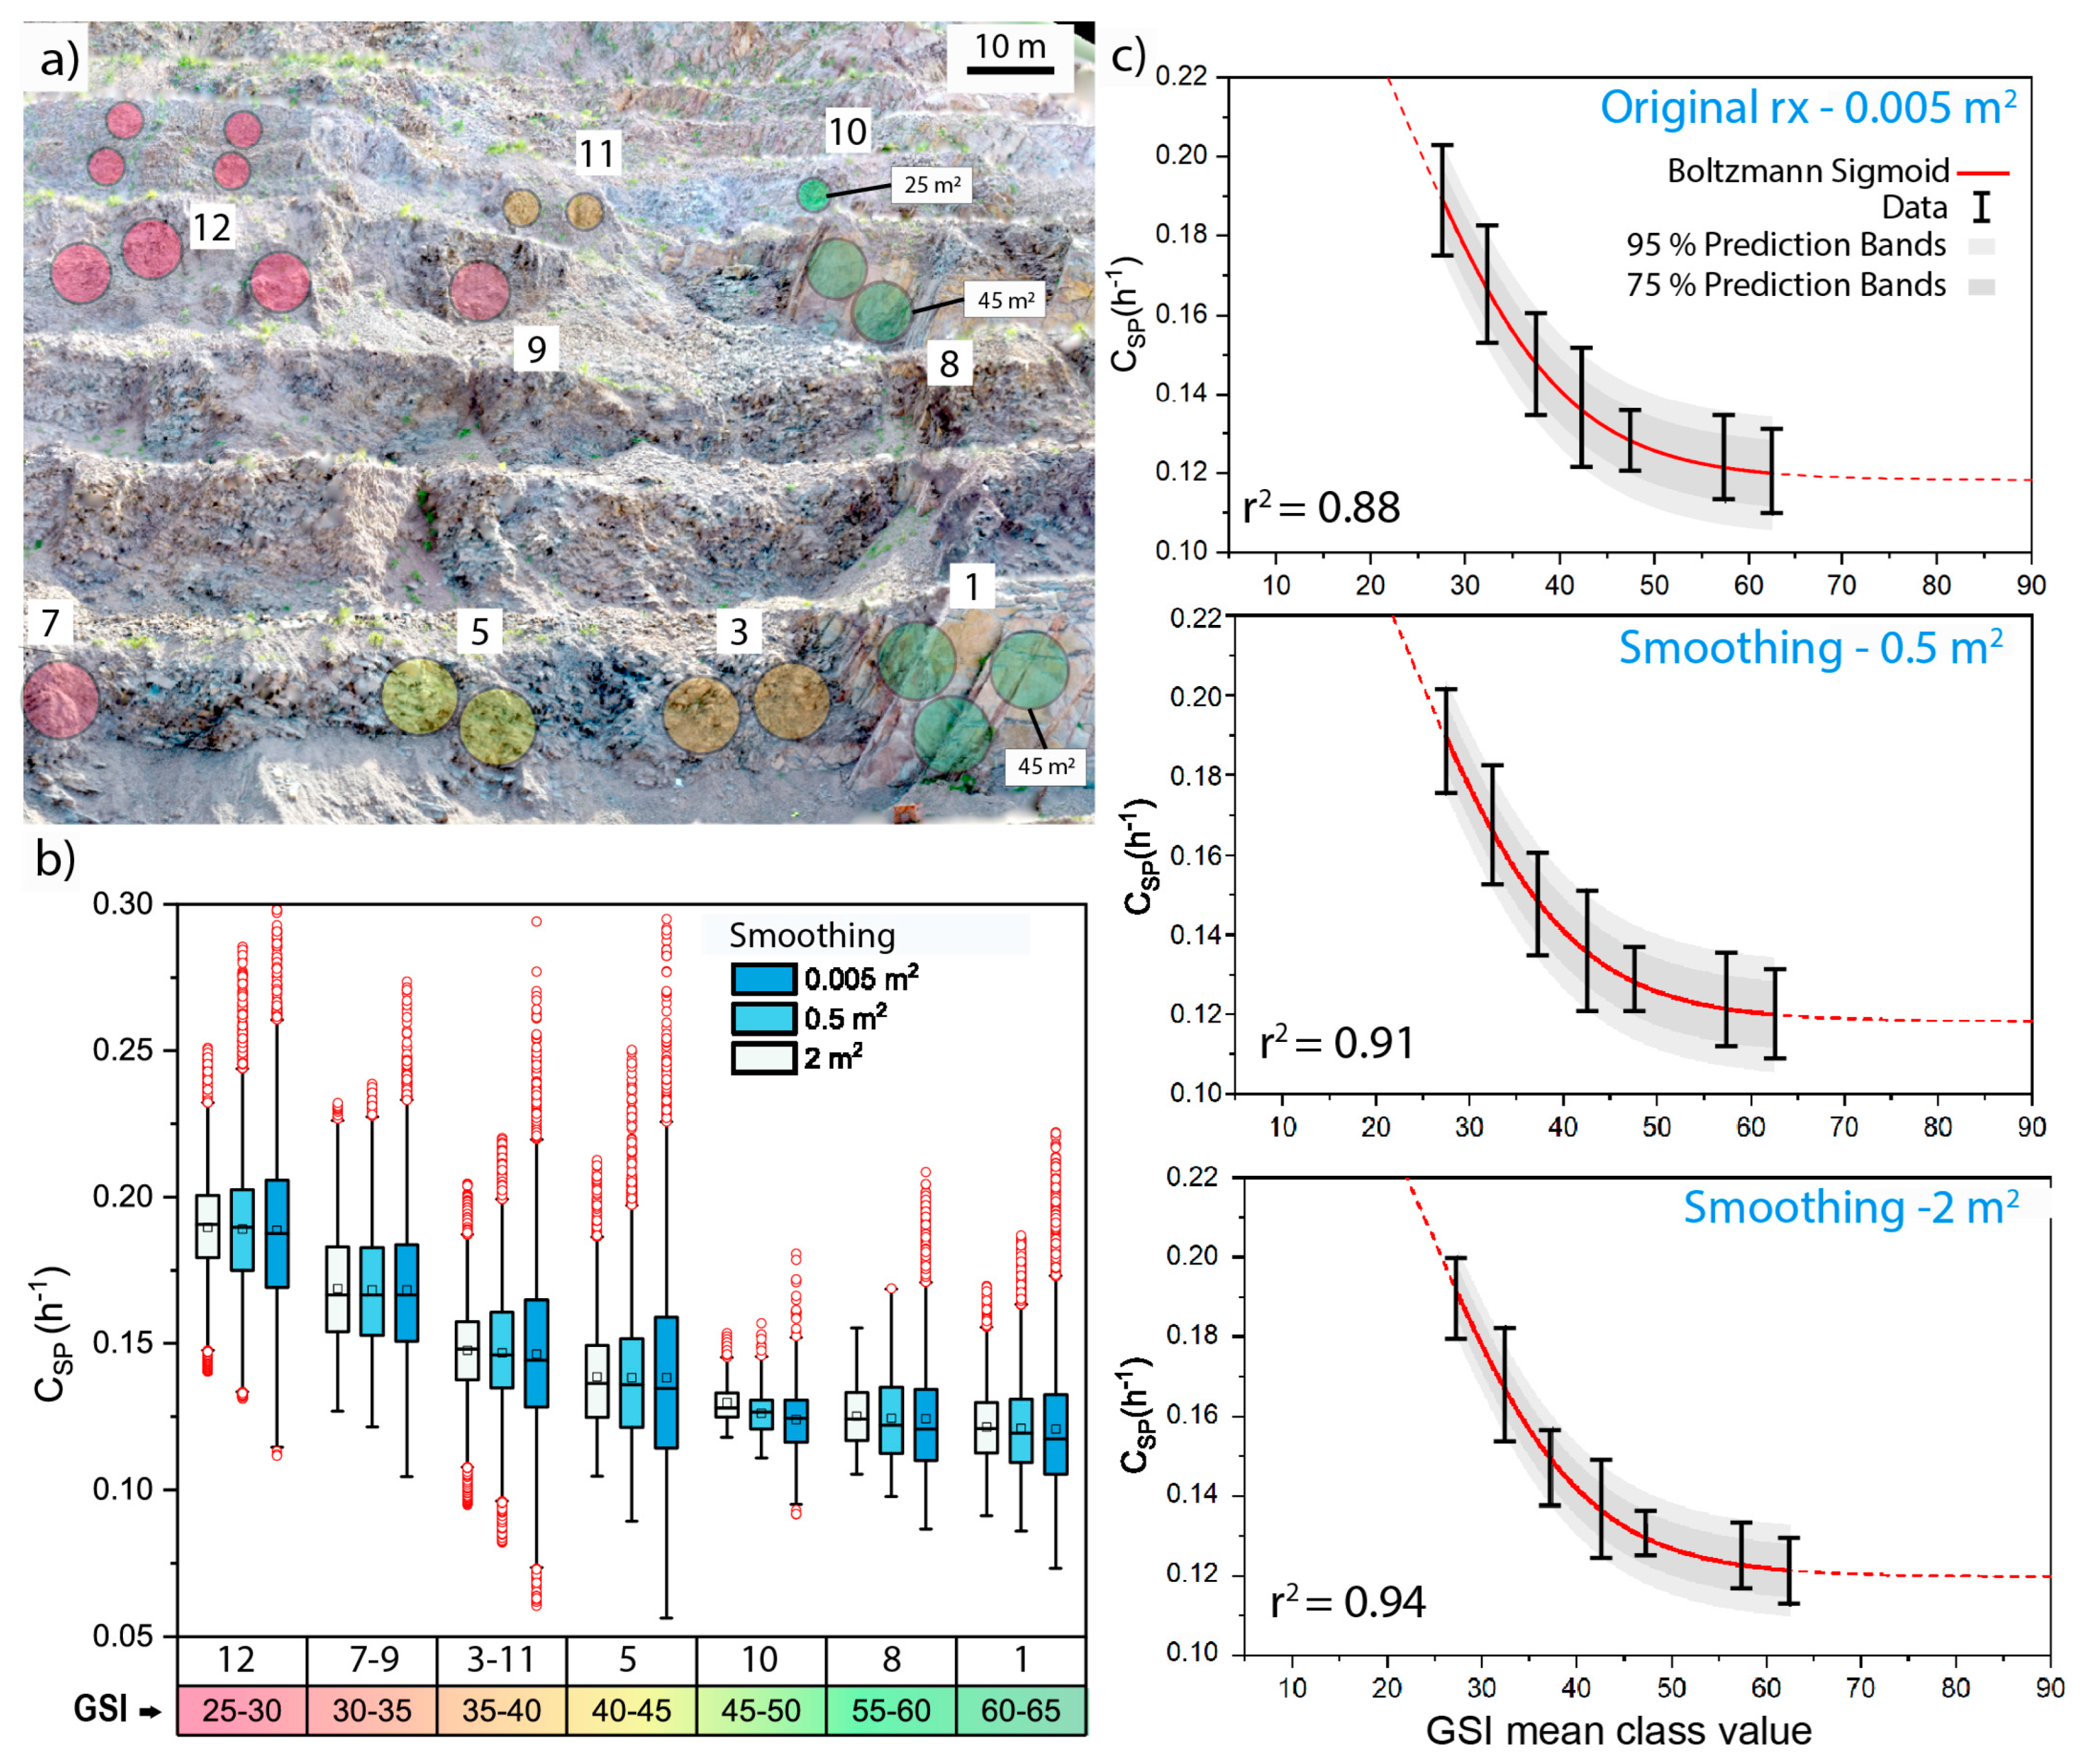
The boxplots in Figure 15b, reporting the CSP value distributions sampled for the outcrops characterized by different GSI classes for different smoothing resolutions (Figure 14), show a significant variability in the calculated CSP values (in terms of interquartile range, IQR). This variability is larger for the outcrops in rock mass sectors characterized by a wide distribution of block volumes (e.g., outcrops 5-3-11; Figure 15b), which corresponds with the intermedium GSI values (i.e., between 45 and 35). Smoothing processing clearly reduces this variability (Figure 14 and Figure 15b).
The relation suggests that CSP values increase for decreasing GSI values (Figure 15a,b), corresponding with a higher fracture intensity and lower rock mass quality classes, which is in close agreement with previous laboratory-scale findings [54].

4.3. GSI-CSP Relationship

The clear qualitative correlation between the CSP and GSI logs shown in Figure 15b motivated the search for a quantitative relationship linking the cooling behaviors of rock masses with their geomechanical qualities for practical applications. As explained in Section 3.5, we fitted a Boltzmann sigmoid function to our experimental data at different smoothing resolutions (Figure 15c).
The limits of the asymptotic values of the function were constrained through experimental measurements of the CSP values for the end members of rock mass quality in the scene captured via IRT (Figure 15a). In particular, the upper limit of the sigmoid (Figure 15c) was set to account for the CSP data corresponding to the debris accumulation zones, i.e., rock mass completely decomposed to granular soils (Section 4.2), while the lower limit was fixed following the clearly asymptotic trend of the outcrops with the highest GSI classes (Figure 15c). The CSP-GSI relationships obtained via the non-linear regression of the sigmoidal model relationships (Figure 15c) show an increasing goodness of fit (i.e., higher coefficient of determination and narrower prediction bands) for the increasingly smoothed CSP datasets that show an increment in the resolution sampling of the CSP map (Figure 11).
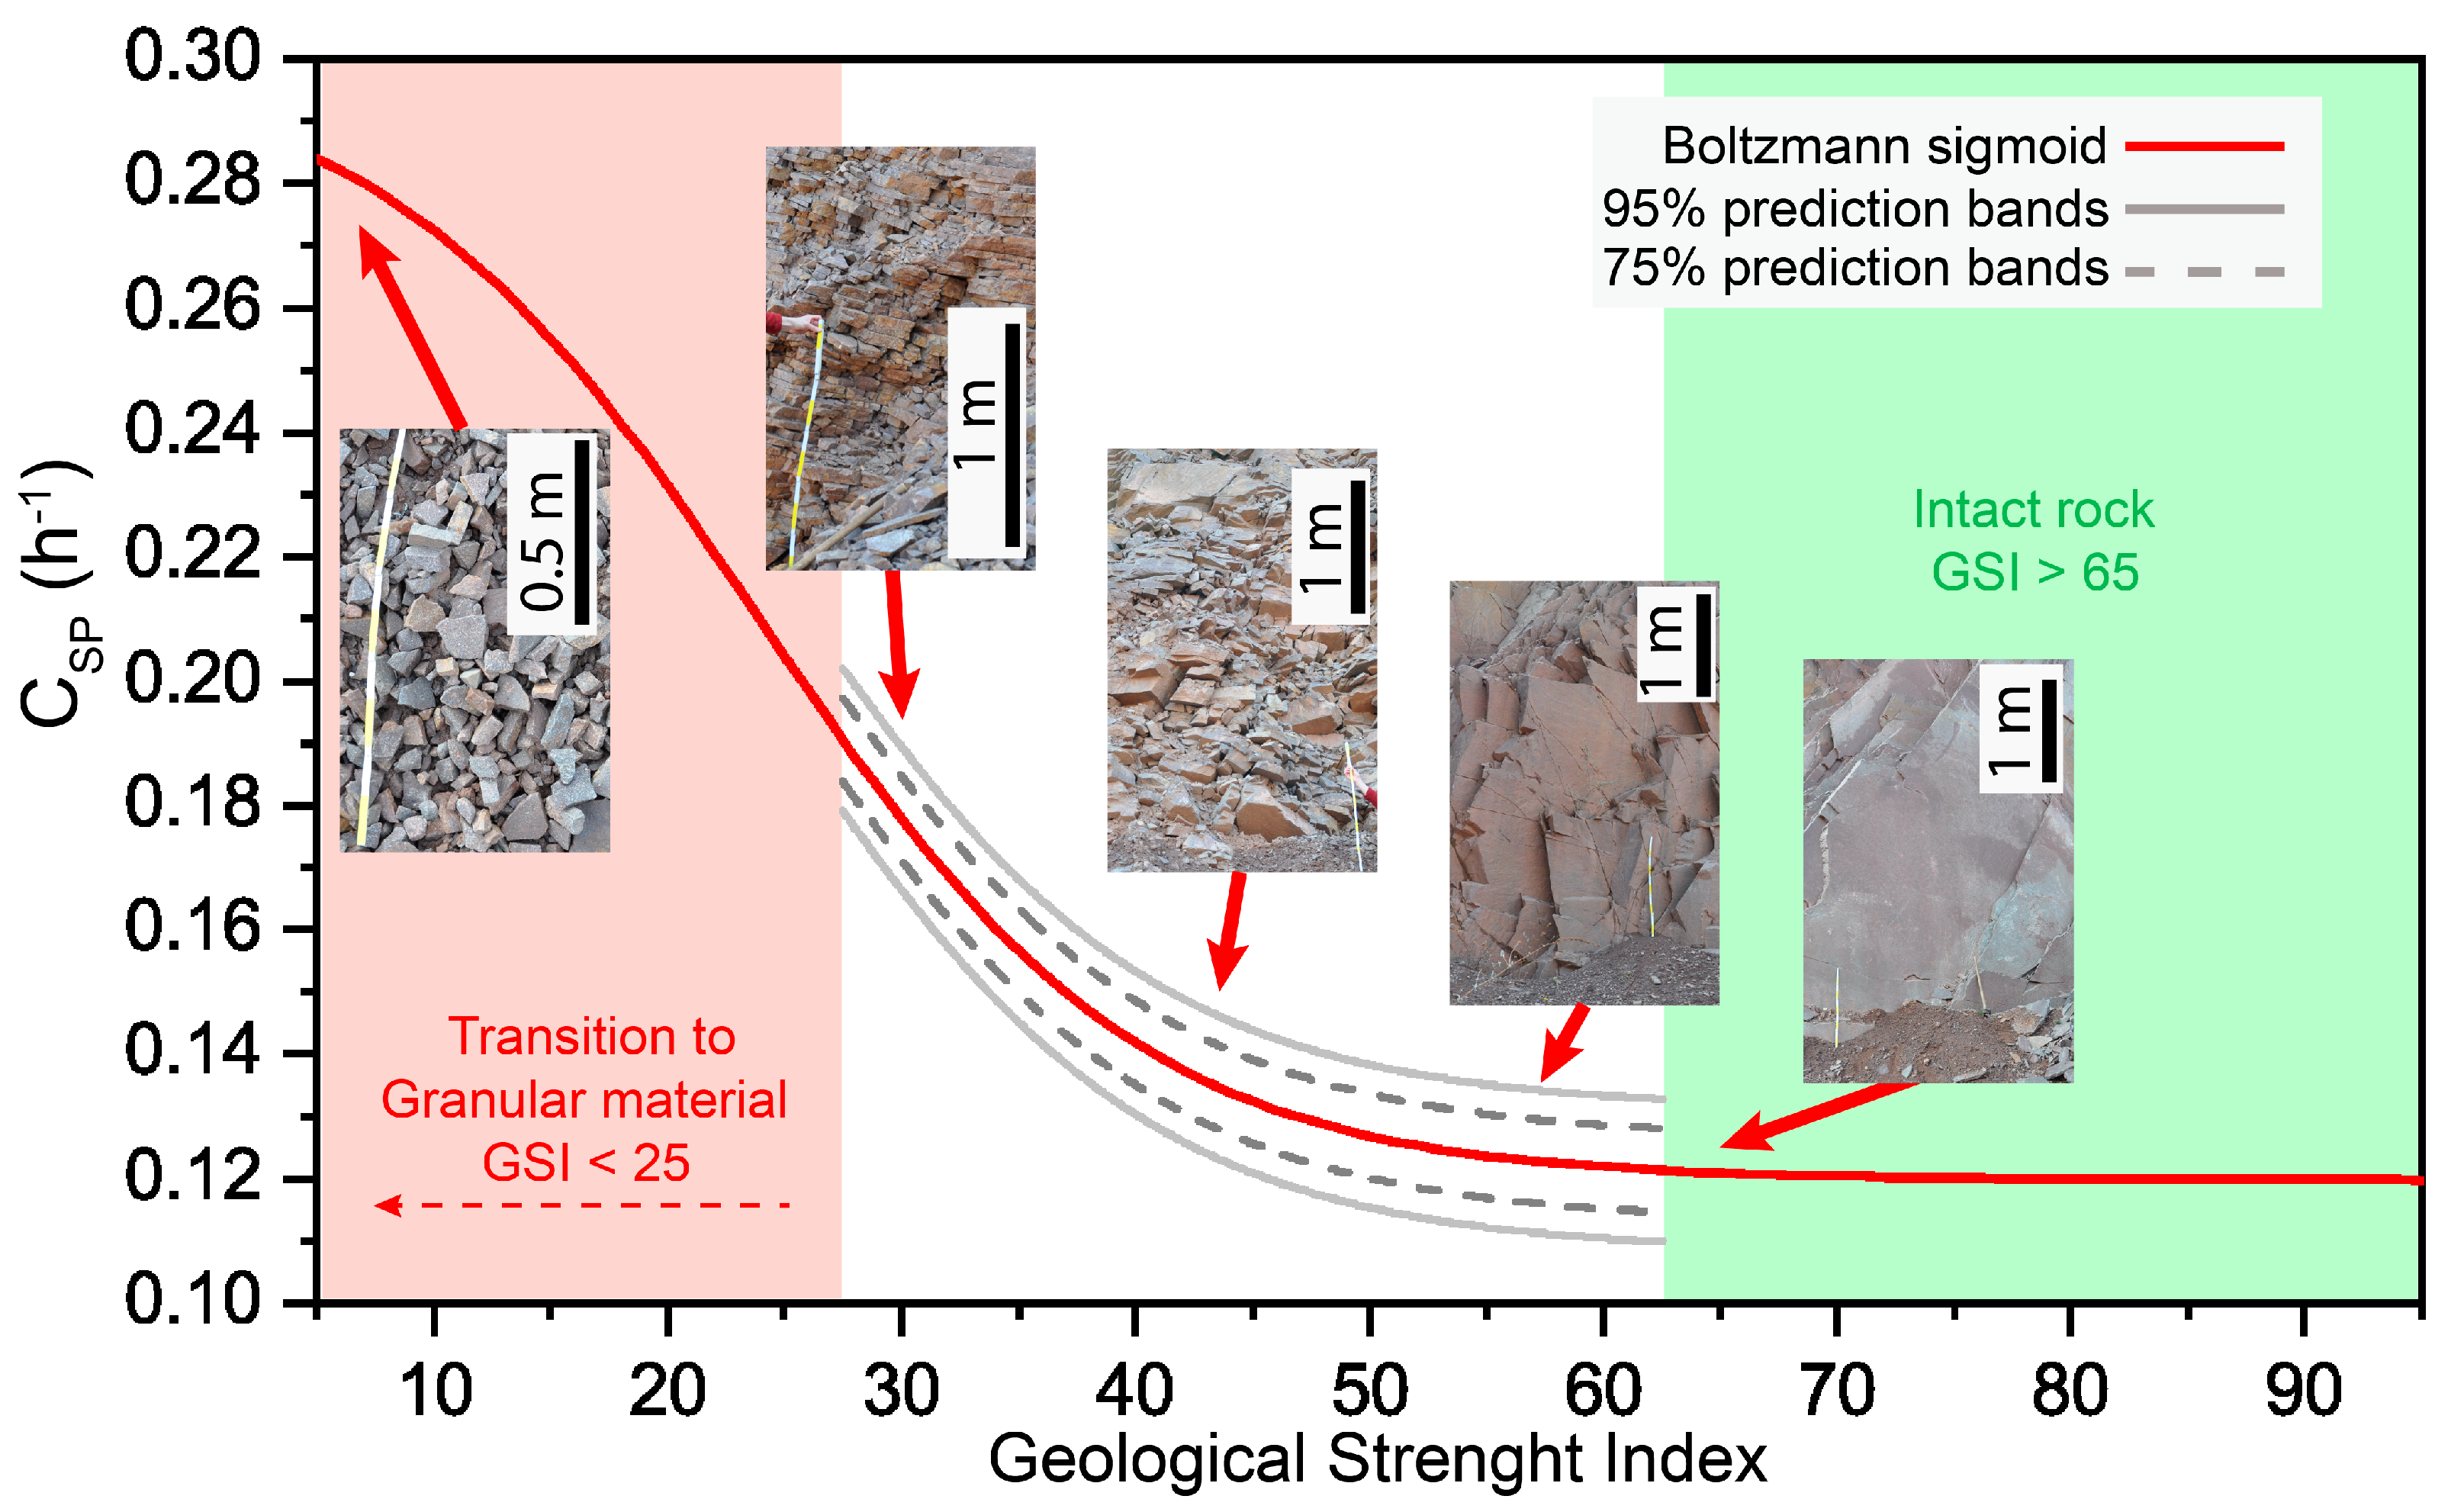
We adopted a model with the best goodness-of-fit statistics (resampling at 2 m2; Figure 15c and Figure 16) in the form of the following empirical equation:
CSP = 0.12 + 0.18/[1 + exp[(GSI − 27)/8]]
where:
CSP is the Curve Shape Parameter (h−1);
GSI is the Geological Strength Index (-).
Equation (5) represents the best-fit empirical correlation equation (Figure 16) that allows for the estimation of the local value of the GSI of a rock mass based on its cooling behavior averaged within a sampling area of 2 m2 (Figure 11, Figure 14 and Figure 15c). This value represents the most correct threshold for returning a CSP map that considers the range of block sizes in the rock mass portion and, at the same time, does not lose spatial representativeness (Figure 11). When performing the tests, the sigmoid model was fitted to the experimental data in the GSI range of 25–65 (Figure 16) and was extrapolated towards GSI values of <25 (disintegrated rock masses transitioning to granular materials, i.e., upper limit of cooling speed) and >65 (high-quality blocky rock masses passing to intact rock, i.e., lower limit of cooling speed). This relationship, characterized by the occurrence of upper and lower plateaus (Figure 16), reflects the thermal signature of a transition between “equivalent continuum” granular materials and intact rock, passing through “discontinuum” media in which the thermal behavior is controlled by discrete networks of fractures bounding radiant rock blocks of increasing size [54]. This kind of dependence of the CSP on the GSI is in close agreement with that observed in the literature for other physical parameters like the deformation modulus [15] and the P-wave velocity [33].
Figure 16. Empirical relationship between CSP and GSI values fitted with a sigmoidal function (Equation (5)) using the CSP map resampled at 2 m2 (Figure 14 and Figure 15c). The asymptotes of the model are represented by the collected data, representing the intact rock (green dashed area), and the debris, representing the last step of the transition from rock mass to granular material with a lower level of GSI (<10). In the transition zone (white area), we can observe some inset of the outcrops (Figure 3a) that clearly show the differences in the fracturing state, quality and block size.
Remotesensing 15 04525 g016
In a practical predictive perspective, the proposed empirical correlation between the CSP (i.e., the measured variable) and GSI (i.e., the variable to be predicted) is expected to be more discriminant for rock masses characterized by the GSI in the range of 25–55, i.e., the most critical to slope and mining engineering applications. Considering the width of the 75% and 95% prediction bands obtained by the non-linear regression analysis, we can expect GSI prediction accuracies within a value of 10, i.e., comparable to common field estimates [2,15,63] through the inversion of Equation (5):
GSI = 8ln[(0.18/(CSP − 0.12)) − 1] + 27
where:
CSP is the Curve Shape Parameter (h−1);
GSI is the Geological Strength Index (-).

4.4. Automated Slope Scale GSI Mapping

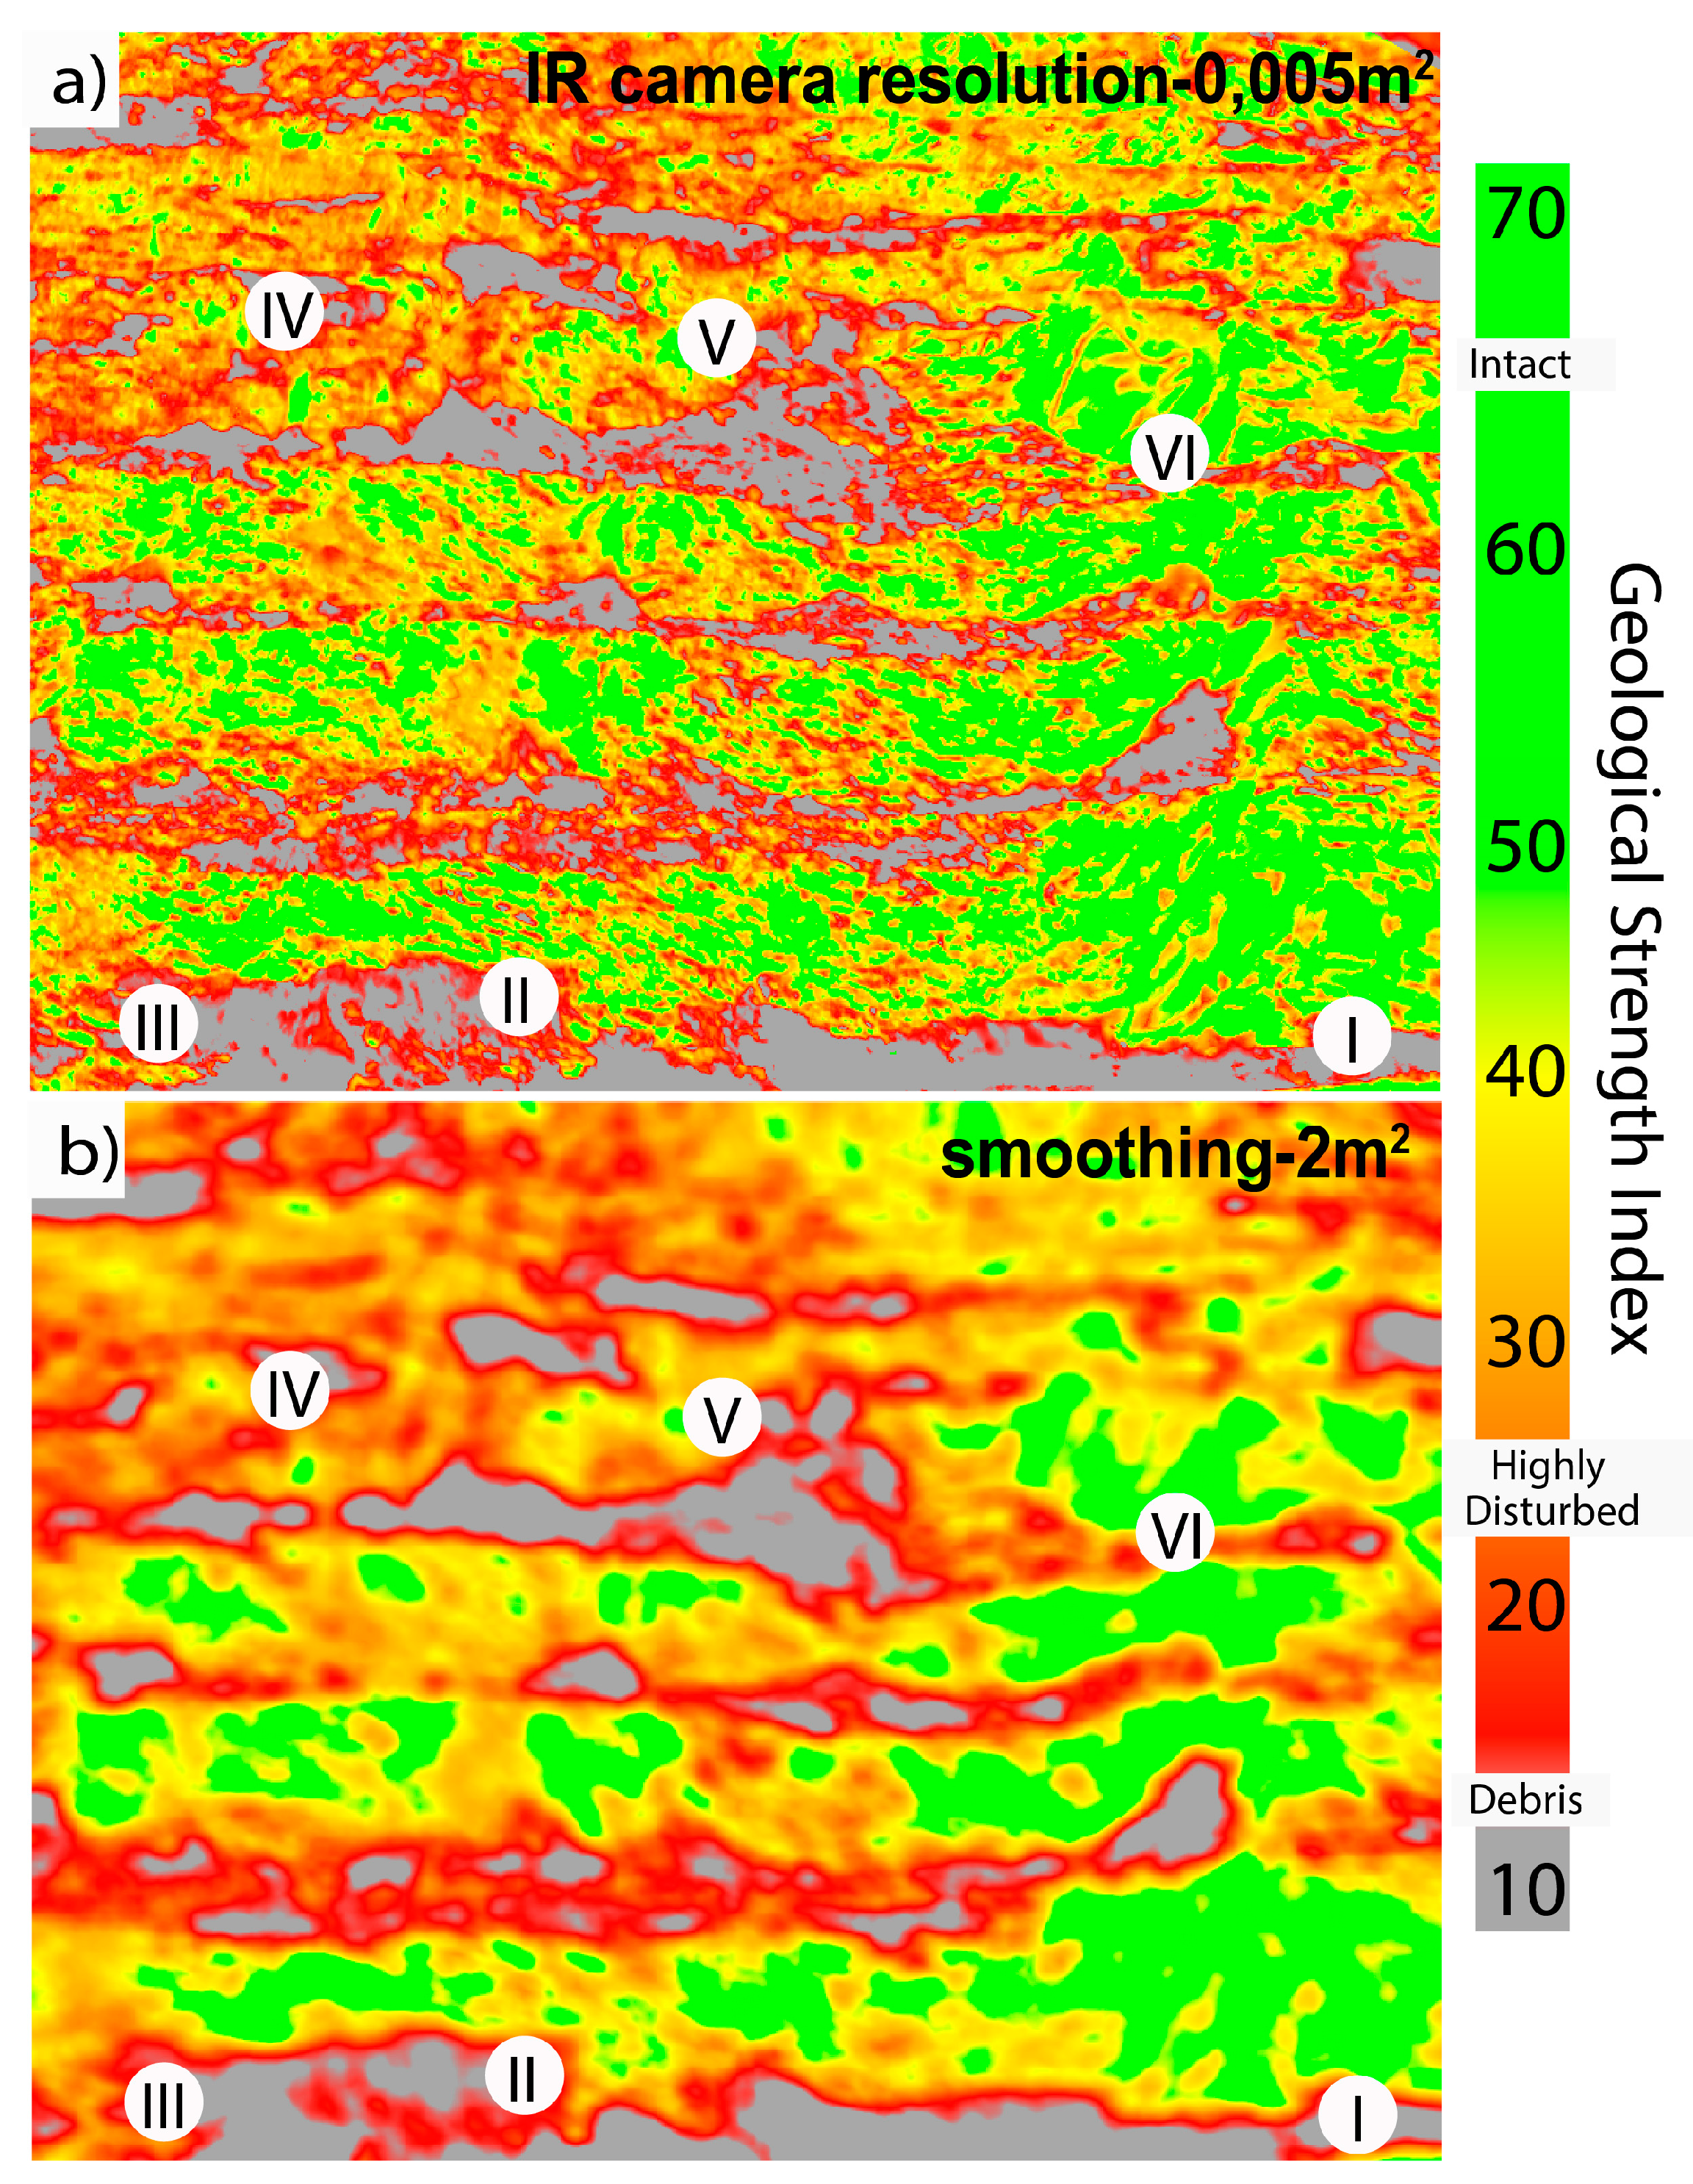
For each pixel of the smoothed CSP map, with a unit of 2 m2 (Figure 14), using Equation (6) allowed us to translate the CSP values into the corresponding GSI values, thus providing spatially distributed maps of the GSI at the slope scale (Figure 17) and different levels of prediction (Figure 16).
As can be seen in Figure 17, the debris is visibly highlighted (GSI < 15, grey band) by the outcrops of the rock mass designed by the quarry steps. This allows us to realistically predict the spatial distribution of GSI values over the wide surveyed scene. In agreement with the field observation (Figure 13, Figure 17 and Figure 18), the predicted GSI values vary in the range of 25–65. By observing the zones characterized by intermediate GSI values (e.g., II in Figure 17 and Figure 18), it is seen that the variability is greater in the areas where the distribution of the block size is the widest (Figure 13 and Figure 17a), in which the acquisition disturbances may also increase (experimental noise, 3D geometry and rock cavities). This character is strongly present in Figure 17a, but its effect is diminished when using maps subjected to homogenization through smoothing procedures (Figure 14 and Figure 17b), reaching the segmentation of sectors identified by sharp changes in the rock mass quality. Figure 17 provides a slope-scale quality mapping that is in agreement with the gravitative processes highlighted by previous studies [34], and the field evidence is shown in Figure 18.

5. Discussion and Conclusions

A reliable assessment of the rock mass structure, engineering quality and hydro-mechanical properties is a key aspect in rock slope engineering and mining applications, including the design of open-pit mines and engineered slopes, slope stability analysis and the characterization of both inherited and induced states of rock damage in slopes [2,17,18,19,34]. Starting from a robust theoretical framework and a laboratory experimental investigation, we were able to explore the potential of the innovative IRT technique in predictive studies of the fracture state of the rock mass. To achieve this, it was necessary to export the experience, theoretical aspects and experimental approach developed in the laboratory [54] to an in situ scale through the characterization of the cooling behavior of the rock mass outcrops and the development of a shape indicator (CSP) of the cooling curves as a function of fracturing.
We based our approach to the problems on a systematic, sequential solution of the main upscaling issues, including (a) the definition of suitable rock mass quality descriptors; (b) the scale effects affecting the definition of fractured rock masses as “continua” vs. “discontinua” within a given sampling region (i.e., slope sector, sampling window/outcrop and remote sensing pixel); (c) the environmental factors and disturbances controlling the applicability of infrared thermography to rock mass characterization in outdoor settings; and (d) the reconstruction and modeling of experimental cooling curves acquired in outdoor, unconstrained environmental conditions.
The correlations observed in [54] are based on quantitative descriptors of unbiased fracturing, which, by nature, are not applicable to many in situ contexts, especially the one selected in this paper. The response between rock mass fracturing and cooling behavior that has been highlighted in several pioneering papers [38,39,40] is reconnected to the average reference block size of the rock volume, which, in turn, is closely related to the intensity of fracturing in the first degree (to which the effects due to air circulation and fracture opening are secondarily added; [54]). In our study, we selected an empirical descriptor of the rock mass quality such as the GSI, which is widely used in engineering applications [15,31,63,64], is extremely versatile in different geological conditions and does not allow for systematic discontinuity surveys to be conducted on site. A strong link with the reference block size [15] is highlighted in a context characterized by an extremely homogeneous and mono-lithological level of material alteration such as the Mount Gorsa quarry [34].
The results of the surveys carried out on the accessible outcrops (Figure 3 and Figure 13) certified the wide range in GSI values of the rock mass that were already described in [34], highlighting the great influence of the intensity of the fracture network with respect to the variability of the degree of alteration of the rock material (Figure 13).
At the same time, these results show that the portions of the rock mass characterized by intermediate GSI values were characterized by blocks with rather variable sizes, which was evidence that made it necessary to adopt analysis and smoothing/sampling techniques that considered the average thermal response of the rock mass portion, both at the scale of the individual block (Figure 11) and at the scale of the benches (i.e., outcrop window; Figure 12).
In order to reduce typical disturbances on the IRT acquisition in outdoor settings, we built an experimental approach that allowed us to develop a practical surveying workflow aimed at the specific purpose (Figure 5, night time-lapse survey and extraction of cooling curves in the absence of solar forcing) of developing an innovative experimental method (Figure 7) to characterize and parameterize, in a site-specific manner, an empirical relationship (SDRM; Equation (4)) that can be used to calibrate and correct (Figure 8 and Figure 9) raw IR temperature data acquired in outdoor settings (Section 3.3).
Our method allows for the extraction and parametric modeling of corrected cooling curves and their synthetic description, and it is only dependent on the cooling paths that rock mass outcrops at different qualities follow in the same scene. The proposed methodology (Section 3.4), despite the variability of the uncontrolled environmental conditions, allow us to export the CSP approach used in [54] (Figure 10), thus maintaining the theoretical link of the thermal response with the reference block size as a direct parametrization of theory in a semi-empirical way.
Using a high resolution and an accurate camera to purify the data from the noise and parameterize the shape of the cooling curves, we demonstrated that the IRT is significantly applicable to the in situ practical characterization of the rock mass quality (Equation (6), Figure 16).
In this study, we proposed a practical workflow, from the design and execution phase of the survey to the processing and mapping phase, which stands as the basis for an operational methodology for characterizing the rock mass quality. The proposed methodology has several strengths as it is contactless (using ground-based calibration points, Figure 3 and Figure 13), physically based and spatially distributed. It allows for the analysis of the spatial patterns and temporal trends of rock mass cooling over large areas (Figure 14 and Figure 17), and automatically provides continuous maps of the CSP and GSI that are explicitly related to specific averaging spatial domains (i.e., scales). In addition, our methodology does not need a time-consuming workflow for the complete fracture network characterization (i.e., individual fracture identification and mapping, spacing analysis and the estimation of fracture density) that is required by traditional rock mass characterization even when using remotely sensed 3D point clouds.
Besides its strengths and innovative character, the approach also has limitations. The analysis only allows for a superficial assessment of the quality of the rock mass. The exposure and morphology of the site can be challenging for IRT data acquisition/processing and are only partially solved through geometric environmental corrections (Equation (4), Figure 7) and the choice of specific time windows (Figure 10). In fact, not all disturbance factors can be identified, so the discrimination of small variations in the GSI can be difficult due to experimental noise. Generally, it is important to highlight that the approach needs site-specific parameterization and can meet possible difficulties in contexts with different lithologies or strong alterations; applying our method to rock masses characterized by different lithological and physico-chemical conditions would require subdividing the study domain into homogeneous sub-domains and a careful calibration and interpretation of the results.
Given all these considerations, our methodology turns out to be reproducible at different scales and test sites, making it particularly versatile to future implementations through dataset enrichment, the strengthening of predictive relationships and the engineering of the analytical process. Our paper proposes a method, but also an innovative workflow dedicated to characterizing the quality of a rock mass, that allows for a rapid assessment of rock masses’ geomechanical properties, and it can potentially be useful in slope-stability-related risk for wide-ranging engineering problems.

Author Contributions

Conceptualization, F.F., F.A. and M.-H.D.; data curation, F.F., F.A. and C.C.; investigation, F.F., F.A. and C.C.; validation, M.J. and M.-H.D.; writing—original draft, F.F. and F.A.; writing—review and editing, M.J., M.-H.D. and F.A. All authors have read and agreed to the published version of the manuscript.

Funding

This research was partially supported by the MIUR project “Dipartimenti di Eccellenza 2018–2022, Department of Earth and Environmental Sciences, University of Milano-Bicocca” through the infrastructure GEMMA (Geo-Environmental Measuring and Monitoring from Multiple Platforms).

Data Availability Statement

The experimental datasets generated and analyzed in this study are available from the corresponding authors upon request.

Acknowledgments

We thank Roberto Garzonio for the UAV survey on the study area, Stefano Casiraghi for providing field assistance and Claudio Valle for providing the stimulating discussions on the evolution of Mt. Gorsa rock masses. We are indebted to Alberto Filippi of Porfidi Paganella and Lorenzo Stenico (So.Ge.Ca) for granting us access to the area; this work would not have been possible without their continuous support and warm hospitality. We thank Gian Marco Marmoni and two anonymous reviewers for their constructive comments.

Conflicts of Interest

The authors declare no conflict of interest.

References

  1. Oda, M.; Nemat-Nasser, S.; Konishi, J. Stress-Induced Anisotropy in Granular Masses. Soils Found. 1985, 25, 85–97. [Google Scholar] [CrossRef] [PubMed]
  2. Hoek, E.; Brown, E.T. Practical Estimates of Rock Mass Strength. Int. J. Rock Mech. Min. Sci. 1997, 34, 1165–1186. [Google Scholar] [CrossRef]
  3. Hoek, E.; Diederichs, M.S. Empirical Estimation of Rock Mass Modulus. Int. J. Rock Mech. Min. Sci. 2006, 43, 203–215. [Google Scholar] [CrossRef]
  4. Rutqvist, J.; Rinaldi, A.P.; Cappa, F.; Moridis, G.J. Modeling of Fault Activation and Seismicity by Injection Directly into a Fault Zone Associated with Hydraulic Fracturing of Shale-Gas Reservoirs. J. Pet. Sci. Eng. 2015, 127, 377–386. [Google Scholar] [CrossRef]
  5. Mandl, G. Rock Joints; Springer: Berlin/Heidelberg, Germany, 2005; ISBN 3540264574. [Google Scholar]
  6. Watkins, H.; Bond, C.E.; Healy, D.; Butler, R.W.H. Appraisal of Fracture Sampling Methods and a New Workflow to Characterise Heterogeneous Fracture Networks at Outcrop. J. Struct. Geol. 2015, 72, 67–82. [Google Scholar] [CrossRef]
  7. Bistacchi, A.; Mittempergher, S.; Martinelli, M. Digital Outcrop Model Reconstruction and Interpretation. In 3D Digital Geological Models: From Terrestrial Outcrops to Planetary Surfaces; John Wiley & Sons: Hoboken, NJ, USA, 2022; pp. 11–32. [Google Scholar]
  8. Savage, H.M.; Brodsky, E.E. Collateral Damage: Evolution with Displacement of Fracture Distribution and Secondary Fault Strands in Fault Damage Zones. J. Geophys. Res. Solid Earth 2011, 116. [Google Scholar] [CrossRef]
  9. Peacock, D.C.P.; Dimmen, V.; Rotevatn, A.; Sanderson, D.J. A Broader Classification of Damage Zones. J. Struct. Geol. 2017, 102, 179–192. [Google Scholar] [CrossRef]
  10. Ziegler, M.; Loew, S.; Moore, J.R. Distribution and Inferred Age of Exfoliation Joints in the Aar Granite of the Central Swiss Alps and Relationship to Quaternary Landscape Evolution. Geomorphology 2013, 201, 344–362. [Google Scholar] [CrossRef]
  11. Eberhardt, E.; Stead, D.; Coggan, J.S. Numerical Analysis of Initiation and Progressive Failure in Natural Rock Slopes—The 1991 Randa Rockslide. Int. J. Rock Mech. Min. Sci. 2004, 41, 69–87. [Google Scholar] [CrossRef]
  12. Crosta, G.B.; Frattini, P.; Agliardi, F. Deep Seated Gravitational Slope Deformations in the European Alps. Tectonophysics 2013, 605, 13–33. [Google Scholar] [CrossRef]
  13. Riva, F.; Agliardi, F.; Amitrano, D.; Crosta, G.B. Damage-Based Time-Dependent Modeling of Paraglacial to Postglacial Progressive Failure of Large Rock Slopes. J. Geophys. Res. Earth Surf. 2018, 123, 124–141. [Google Scholar] [CrossRef]
  14. Spreafico, M.C.; Sternai, P.; Agliardi, F. Paraglacial Rock-Slope Deformations: Sudden or Delayed Response? Insights from an Integrated Numerical Modelling Approach. Landslides 2021, 18, 1311–1326. [Google Scholar] [CrossRef]
  15. Cai, M.; Kaiser, P.K.; Uno, H.; Tasaka, Y.; Minami, M. Estimation of Rock Mass Deformation Modulus and Strength of Jointed Hard Rock Masses Using the GSI System. Int. J. Rock Mech. Min. Sci. 2004, 41, 3–19. [Google Scholar] [CrossRef]
  16. Martino, J.B.; Chandler, N.A. Excavation-Induced Damage Studies at the Underground Research Laboratory. Int. J. Rock Mech. Min. Sci. 2004, 41, 1413–1426. [Google Scholar] [CrossRef]
  17. Pine, R.J.; Harrison, J.P. Rock Mass Properties for Engineering Design. Q. J. Eng. Geol. Hydrogeol. 2003, 36, 5–16. [Google Scholar] [CrossRef]
  18. Wyllie, D.C.; Mah, C. Rock Slope Engineering; CRC Press: Boca Raton, FL, USA, 2004; ISBN 0415280001. [Google Scholar]
  19. Brideau, M.-A.; Yan, M.; Stead, D. The Role of Tectonic Damage and Brittle Rock Fracture in the Development of Large Rock Slope Failures. Geomorphology 2009, 103, 30–49. [Google Scholar] [CrossRef]
  20. Dershowitz, W.; Miller, I. Dual Porosity Fracture Flow and Transport. Geophys. Res. Lett. 1995, 22, 1441–1444. [Google Scholar] [CrossRef]
  21. Gischig, V.S.; Giardini, D.; Amann, F.; Hertrich, M.; Krietsch, H.; Loew, S.; Maurer, H.; Villiger, L.; Wiemer, S.; Bethmann, F. Hydraulic Stimulation and Fluid Circulation Experiments in Underground Laboratories: Stepping up the Scale towards Engineered Geothermal Systems. Geomech. Energy Environ. 2020, 24, 100175. [Google Scholar] [CrossRef]
  22. Martinelli, M.; Bistacchi, A.; Mittempergher, S.; Bonneau, F.; Balsamo, F.; Caumon, G.; Meda, M. Damage Zone Characterization Combining Scan-Line and Scan-Area Analysis on a Km-Scale Digital Outcrop Model: The Qala Fault (Gozo). J. Struct. Geol. 2020, 140, 104144. [Google Scholar] [CrossRef]
  23. Edelbro, C. Evaluation of Rock Mass Strength Criteria. Ph.D. Thesis, Luleå Tekniska Universitet, Luleå, Sweden, 2004. [Google Scholar]
  24. Dershowitz, W.S.; Herda, H.H. Interpretation of Fracture Spacing and Intensity. In Proceedings of the 33rd US Symposium on Rock Mechanics (USRMS), Santa Fe, NM, USA, 3–5 June 1992. [Google Scholar]
  25. Jing, L.; Stephansson, O. Fundamentals of Discrete Element Methods for Rock Engineering: Theory and Applications; Elsevier: Amsterdam, The Netherlands, 2007; ISBN 0080551858. [Google Scholar]
  26. Zhang, L.; Einstein, H.H. Estimating the Mean Trace Length of Rock Discontinuities. Rock Mech. Rock Eng. 1998, 31, 217–235. [Google Scholar] [CrossRef]
  27. Mauldon, M.; Dunne, W.M.; Rohrbaugh, M.B., Jr. Circular Scanlines and Circular Windows: New Tools for Characterizing the Geometry of Fracture Traces. J. Struct. Geol. 2001, 23, 247–258. [Google Scholar] [CrossRef]
  28. Barton, N.; Lien, R.; Lunde, J. Engineering Classification of Rock Masses for the Design of Tunnel Support. Rock Mech. 1974, 6, 189–236. [Google Scholar] [CrossRef]
  29. Palmstrom, A.; Broch, E. Use and Misuse of Rock Mass Classification Systems with Particular Reference to the Q-System. Tunn. Undergr. Space Technol. 2006, 21, 575–593. [Google Scholar] [CrossRef]
  30. Bieniawski, Z.T. Classification of Rock Masses for Engineering: The RMR System and Future Trends. In Rock Testing and Site Characterization; Elsevier: Amsterdam, The Netherlands, 1993; pp. 553–573. [Google Scholar]
  31. Marinos, P.; Hoek, E. GSI: A Geologically Friendly Tool for Rock Mass Strength Estimation. In Proceedings of the ISRM International Symposium, Melbourne, Australia, 19–24 November 2000. [Google Scholar]
  32. Cai, X.; Zhou, Z.; Tan, L.; Zang, H.; Song, Z. Water Saturation Effects on Thermal Infrared Radiation Features of Rock Materials During Deformation and Fracturing. Rock Mech. Rock Eng. 2020, 53, 4839–4856. [Google Scholar] [CrossRef]
  33. Agliardi, F.; Sapigni, M.; Crosta, G.B. Rock Mass Characterization by High-Resolution Sonic and GSI Borehole Logging. Rock Mech. Rock Eng. 2016, 49, 4303–4318. [Google Scholar] [CrossRef]
  34. Agliardi, F.; Crosta, G.B.; Meloni, F.; Valle, C.; Rivolta, C. Structurally-Controlled Instability, Damage and Slope Failure in a Porphyry Rock Mass. Tectonophysics 2013, 605, 34–47. [Google Scholar] [CrossRef]
  35. Li, X.; Chen, Z.; Chen, J.; Zhu, H. Automatic Characterization of Rock Mass Discontinuities Using 3D Point Clouds. Eng. Geol. 2019, 259, 105131. [Google Scholar] [CrossRef]
  36. Bistacchi, A.; Mittempergher, S.; Martinelli, M.; Storti, F. On a New Robust Workflow for the Statistical and Spatial Analysis of Fracture Data Collected with Scanlines (or the Importance of Stationarity). Solid Earth 2020, 11, 2535–2547. [Google Scholar] [CrossRef]
  37. Barton, N. Fracture-Induced Seismic Anisotropy When Shearing Is Involved in Production from Fractured Reservoirs. J. Seism. Explor. 2007, 16, 115. [Google Scholar]
  38. Teza, G.; Marcato, G.; Castelli, E.; Galgaro, A. IRTROCK: A MATLAB Toolbox for Contactless Recognition of Surface and Shallow Weakness of a Rock Cliff by Infrared Thermography. Comput. Geosci. 2012, 45, 109–118. [Google Scholar] [CrossRef]
  39. Mineo, S.; Pappalardo, G.; Rapisarda, F.; Cubito, A.; Di Maria, G. Integrated Geostructural, Seismic and Infrared Thermography Surveys for the Study of an Unstable Rock Slope in the Peloritani Chain (NE Sicily). Eng. Geol. 2015, 195, 225–235. [Google Scholar] [CrossRef]
  40. Pappalardo, G.; Mineo, S.; Zampelli, S.P.; Cubito, A.; Calcaterra, D. InfraRed Thermography Proposed for the Estimation of the Cooling Rate Index in the Remote Survey of Rock Masses. Int. J. Rock Mech. Min. Sci. 2016, 83, 182–196. [Google Scholar] [CrossRef]
  41. Maldague, X. Theory and Practice of Infrared Technology for Nondestructive Testing; John Wiley & Sons: Hoboken, NJ, USA, 2001. [Google Scholar]
  42. Vollmer, M.; Mollmann, K.P. Advanced Methods in IR Imaging. In Infrared Thermal Imaging: Fundamentals, Research and Applications; John Wiley & Sons: Hoboken, NJ, USA, 2010. [Google Scholar]
  43. Clark, M.R.; McCann, D.M.; Forde, M.C. Application of Infrared Thermography to the Non-Destructive Testing of Concrete and Masonry Bridges. NDT E Int. 2003, 36, 265–275. [Google Scholar] [CrossRef]
  44. Ibarra-Castanedo, C.; Sfarra, S.; Klein, M.; Maldague, X. Solar Loading Thermography: Time-Lapsed Thermographic Survey and Advanced Thermographic Signal Processing for the Inspection of Civil Engineering and Cultural Heritage Structures. Infrared Phys. Technol. 2017, 82, 56–74. [Google Scholar] [CrossRef]
  45. Spampinato, L.; Calvari, S.; Oppenheimer, C.; Boschi, E. Volcano Surveillance Using Infrared Cameras. Earth-Science Rev. 2011, 106, 63–91. [Google Scholar] [CrossRef]
  46. Moran, M.S. Thermal Infrared Measurement as an Indicator of Plant Ecosystem Health. In Thermal Remote Sensing in Land Surface Processes; CRC Press: Boca Raton, FL, USA, 2004; pp. 256–282. ISBN 0429210515. [Google Scholar]
  47. Teza, G.; Marcato, G.; Pasuto, A.; Galgaro, A. Integration of Laser Scanning and Thermal Imaging in Monitoring Optimization and Assessment of Rockfall Hazard: A Case History in the Carnic Alps (Northeastern Italy). Nat. Hazards 2015, 76, 1535–1549. [Google Scholar] [CrossRef]
  48. Frodella, W.; Gigli, G.; Morelli, S.; Lombardi, L.; Casagli, N. Landslide Mapping and Characterization through Infrared Thermography (IRT): Suggestions for a Methodological Approach from Some Case Studies. Remote Sens. 2017, 9, 1281. [Google Scholar] [CrossRef]
  49. Guerin, A.; Jaboyedoff, M.; Collins, B.D.; Derron, M.H.; Stock, G.M.; Matasci, B.; Boesiger, M.; Lefeuvre, C.; Podladchikov, Y.Y. Detection of Rock Bridges by Infrared Thermal Imaging and Modeling. Sci. Rep. 2019, 9, 13138. [Google Scholar] [CrossRef]
  50. Song, Z.; Zhang, Q.; Zhang, Y.; Wang, J.; Fan, S.; Zhou, G. Abnormal Precursory Information Analysis of the Infrared Radiation Temperature (IRT) before Sandstone Failure. KSCE J. Civ. Eng. 2021, 25, 4173–4183. [Google Scholar] [CrossRef]
  51. Mineo, S.; Pappalardo, G. The Use of Infrared Thermography for Porosity Assessment of Intact Rock. Rock Mech. Rock Eng. 2016, 49, 3027–3039. [Google Scholar] [CrossRef]
  52. Mineo, S.; Pappalardo, G. InfraRed Thermography Presented as an Innovative and Non-Destructive Solution to Quantify Rock Porosity in Laboratory. Int. J. Rock Mech. Min. Sci. 2019, 115, 99–110. [Google Scholar] [CrossRef]
  53. Mineo, S.; Caliò, D.; Pappalardo, G. UAV-Based Photogrammetry and Infrared Thermography Applied to Rock Mass Survey for Geomechanical Purposes. Remote Sens. 2022, 14, 473. [Google Scholar] [CrossRef]
  54. Franzosi, F.; Casiraghi, S.; Colombo, R.; Crippa, C.; Agliardi, F. Quantitative Evaluation of the Fracturing State of Crystalline Rocks Using Infrared Thermography. Rock Mech. Rock Eng. 2023, 56, 6337–6355. [Google Scholar] [CrossRef]
  55. Grechi, G.; Fiorucci, M.; Marmoni, G.M.; Martino, S. 3D Thermal Monitoring of Jointed Rock Masses through Infrared Thermography and Photogrammetry. Remote Sens. 2021, 13, 957. [Google Scholar] [CrossRef]
  56. Baroň, I.; Bečkovský, D.; Míča, L. Application of Infrared Thermography for Mapping Open Fractures in Deep-Seated Rockslides and Unstable Cliffs. Landslides 2014, 11, 15–27. [Google Scholar] [CrossRef]
  57. Frodella, W.; Fidolini, F.; Morelli, S.; Pazzi, V. Application of Infrared Thermography for Landslide Mapping: The Rotolon DSGDS Case Study. Rend. Online Soc. Geol. Ital. 2015, 35, 144–147. [Google Scholar] [CrossRef]
  58. Flir Corporation. User’s Manual FLIR T10xx Series. Available online: https://www.red-current.com/images/User_Manuals/FLIR_T10xx_User_Manual.pdf (accessed on 31 July 2023).
  59. Minkina, W.; Klecha, D. Atmospheric Transmission Coefficient Modelling in the Infrared for Thermovision Measurements. J. Sensors Sens. Syst. 2016, 5, 17–23. [Google Scholar] [CrossRef]
  60. Kelsey, V.; Riley, S.; Minschwaner, K. Atmospheric Precipitable Water Vapor and Its Correlation with Clear-Sky Infrared Temperature Observations. Atmos. Meas. Tech. 2022, 15, 1563–1576. [Google Scholar] [CrossRef]
  61. Rottura, A.; Bargossi, G.M.; Caggianelli, A.; Del Moro, A.; Visona, D.; Tranne, C.A. Origin and Significance of the Permian High-K Calc-Alkaline Magmatism in the Central-Eastern Southern Alps, Italy. Lithos 1998, 45, 329–348. [Google Scholar] [CrossRef]
  62. ISPRA. Carta Geologica d’Italia—1:50.000 Progetto CARG: Modifiche Ed Integrazioni Al Quaderno n. 1/1992. Serv. Geol. d’Italia Quad. Ser. III 2009, 12. Available online: https://www.isprambiente.gov.it/contentfiles/00002800/2880-q12-fasc-iii.pdf (accessed on 31 July 2023).
  63. Hoek, E.; Marinos, P.; Benissi, M. Applicability of the Geological Strength Index (GSI) Classification for Very Weak and Sheared Rock Masses. The Case of the Athens Schist Formation. Bull. Eng. Geol. Environ. 1998, 57, 151–160. [Google Scholar] [CrossRef]
  64. Hoek, E.; Brown, E.T. The Hoek–Brown Failure Criterion and GSI–2018 Edition. J. Rock Mech. Geotech. Eng. 2019, 11, 445–463. [Google Scholar] [CrossRef]
  65. Westoby, M.J.; Brasington, J.; Glasser, N.F.; Hambrey, M.J.; Reynolds, J.M. ‘Structure-from-Motion’Photogrammetry: A Low-Cost, Effective Tool for Geoscience Applications. Geomorphology 2012, 179, 300–314. [Google Scholar] [CrossRef]
  66. Wilkinson, M.W.; Jones, R.R.; Woods, C.E.; Gilment, S.R.; McCaffrey, K.J.W.; Kokkalas, S.; Long, J.J. A Comparison of Terrestrial Laser Scanning and Structure-from-Motion Photogrammetry as Methods for Digital Outcrop Acquisition. Geosphere 2016, 12, 1865–1880. [Google Scholar] [CrossRef]
  67. Francioni, M.; Simone, M.; Stead, D.; Sciarra, N.; Mataloni, G.; Calamita, F. A New Fast and Low-Cost Photogrammetry Method for the Engineering Characterization of Rock Slopes. Remote Sens. 2019, 11, 1267. [Google Scholar] [CrossRef]
  68. International Society for Rock Mechanics Commission on Standardization of Laboratory and Field Tests: Suggested Methods for the Quantitative Description of Discontinuities in Rock Masses. Int. J. Rock Mech. Min. Sci. Geomech. Abstr. 1978, 15, 319–368. [CrossRef]
  69. Vollmer, M.; Möllmann, K.-P. Fundamental of Infrared Thermal Imaging. In An Automated Irrigation System Using Arduino Microcontroller; John Wiley & Sons: Hoboken, NJ, USA, 2018; pp. 2–6. ISBN 9781493990047. [Google Scholar]
  70. Hillel, D. Environmental Soil Physics: Fundamentals, Applications, and Environmental Considerations; Elsevier Science: Amsterdam, The Netherlands, 2014; ISBN 0080544150. [Google Scholar]
  71. Fiorucci, M.; Marmoni, G.M.; Martino, S.; Mazzanti, P. Thermal Response of Jointed Rock Masses Inferred from Infrared Thermographic Surveying (Acuto Test-Site, Italy). Sensors 2018, 18, 2221. [Google Scholar] [CrossRef]
  72. Mineo, S.; Pappalardo, G. Rock Emissivity Measurement for Infrared Thermography Engineering Geological Applications. Appl. Sci. 2021, 11, 3773. [Google Scholar] [CrossRef]
  73. Shannon, H.R.; Sigda, J.M.; Van Dam, R.L.; Hendrickx, J.M.H.; McLemore, V.T. Thermal Camera Imaging of Rock Piles at the Questa Molybdenum Mine, Questa, New Mexico. In Proceedings of the 2005 National Meeting of the American Society of Mining and Reclamation, Breckenridge, CO, USA, 19–23 June 2005. [Google Scholar]
  74. Sass, O.; Bauer, C.; Fruhmann, S.; Harald, S.; Kropf, F.; Gaisberger, C. Infrared Thermography Monitoring of Rock Faces Potential and Pitfalls. Geomorphology 2023, 439, 108837. [Google Scholar] [CrossRef]
  75. Martin, M.; Berdahl, P. Characteristics of Infrared Sky Radiation in the United States. Sol. Energy 1984, 33, 321–336. [Google Scholar] [CrossRef]
  76. Howell, I. Fabrication of High Refractive Index, Periodic, Composite Nanostructures for Photonic and Sensing Applications. Ph.D. Thesis, University of Massachusetts Amherst, Amherst, MA, USA, 2018. [Google Scholar]
  77. Ferreira, R.A.M.; Pottie, D.L.; Dias, L.H.C.; Filho, B.J.C.; Porto, M.P. A Directional-Spectral Approach to Estimate Temperature of Outdoor PV Panels. Sol. Energy 2019, 183, 782–790. [Google Scholar] [CrossRef]
  78. Agisoft LLC. Photoscan Professional Edition; Agisoft: St. Petersbg, FL, USA, 2018. [Google Scholar]
  79. Vollmer, M. Newton’s Law of Cooling Revisited. Eur. J. Phys. 2009, 30, 1063. [Google Scholar] [CrossRef]
  80. Bergman, T.L.; Bergman, T.L.; Incropera, F.P.; Dewitt, D.P.; Lavine, A.S. Fundamentals of Heat and Mass Transfer; John Wiley & Sons: Hoboken, NJ, USA, 2011; ISBN 0470501979. [Google Scholar]
  81. Turkey, J.W. Exploratory Data Analysis; Pearson: London, UK, 1977; Volume 2. [Google Scholar]
  82. Whaley, D.L., III. The Interquartile Range: Theory and Estimation. Master’s Thesis, East Tennessee State University, Johnson City, TN, USA, 2005. [Google Scholar]
Figure 1. Mt. Gorsa quarry settings. (a) Front view of the quarry face, with the IRT acquisition window (yellow dashed line) and UAV survey (purple-dashed line) outlined. (b) Stereoplot representative of the rock mass structure described in [34]. (c,d) Field examples of fracturing mechanisms related to the gravitational reactivation of inherited fracture sets, namely flexural toppling of K1 joints, block toppling on K2 basal planes and planar sliding along K2 fractures. (e) Resulting fracture damage.
Remotesensing 15 04525 g001
Figure 2. Three-dimensional slope geometry. (a) Oblique view from NW of the slope point cloud, reconstructed via SfM using the photos acquired with DJI Mavic Pro 2. In the studied quarry sector, (b) the IR-camera (red star) was placed at the base of the slope, 200 m above the first bench.
Remotesensing 15 04525 g002
Figure 3. Rock mass quality. (a) The 10 accessible outcrops on which we carried out in situ rock mass surveys and quality designation using GSI. The outcrops are located on 3 different quarry benches and distributed over the IRT survey window (Figure 1a), showing a significant variability in damage state ((b) outcrop 1, (c) outcrop 5 and (d) outcrop 9) and block size distribution. A clear transition from “discontinuous” to “equivalent continuous” rock masses can be observed at outcrops characterized by low (b) to very high (d) fracturing.
Remotesensing 15 04525 g003
Figure 5. IRT survey at Mt. Gorsa quarry on 5th April 2022. (a) RGB picture of the IRT acquisition window (Figure 1a). The recorded high-resolution thermograms (bd) showed generally clear signals (e), meaning there were stable sky conditions (no cloud cover) during all the experiments (brown cooling curve extract on outcrop 7; rock temperature generally reaches the maximum temperature due to the solar forcing of 20 °C and a minimum above 2 °C). The cooling phase was started just after sunset (e).
Remotesensing 15 04525 g005
Figure 6. Experimental setup to test the emissivity of the porphyry rock forming Mt. Gorsa (a). Rock emissivity was tuned by fitting the temperature recorded in the red circle (TROCK) to the one recorded in the black one (TTAPE), with emissivity set to 0.97 (PVC tape) (b).
Remotesensing 15 04525 g006
Figure 7. (a) Experimental characterization of the sky radiation’s reflected temperature contribution. The conceptual scheme in (b) explains what is observed experimentally from the vertical profiles in (c), where the different contributions and effects (yellow–blue–green panel) that the angle of view of the sky and ground radiation have on the different tilt ranges of a surface are separated. The sector (d) between 90° and 30° inclination turns out to be the most affected, according to the empirical experimental relationship, and is fitted and defined as the Sky-Dip Reflection Model (SDRM, Equation (4)).
Remotesensing 15 04525 g007
Figure 8. The scheme proposed in (a) shows the workflow to reproject the points of the 3D cloud onto the focal plane of the thermograms (Figure 5b–d), generating a slope map (b) for each pixel that corresponds to the IRT window of the measurements on the quarry slope (Figure 1a). Through the use of the SDRM (Equation (4)), it was possible to generate (c) a map of the reflected IR temperature at each point.
Remotesensing 15 04525 g008
Figure 9. Examples of the application of the correction (Equation (4)) to thermograms acquired at different times during the IRT measurement campaign (Figure 5). As expected from the experimental evidence (Figure 7), the difference between the raw and corrected temperature data increases the more the inclination of the in-square surface tends to show low values (horizontal), with correction peaks of up to 3 °C, which can be important in the ranges obtained in our analyses (Figure 5e).
Remotesensing 15 04525 g009
Figure 10. (a) Example of a rock cooling curve (brown dotted line) extracted at the quarry face from the series of acquired thermograms, and related measurements of ambient temperature (blue dotted line) reaching the asymptote overnight. (b) By normalizing the temperature values and plotting them on a logarithmic scale, it is possible to observe the time window (grey dashed panel) in which the distribution takes on a negative exponential trend (red line) that can synthetically describe the cooling history of the rock mass sector considered when using CSP.
Remotesensing 15 04525 g010
Figure 11. The CSP maps were spatially smoothed from the original resolution (IR camera resolution, blue circle) toward higher resolutions (blue circle, white circle); the homogenization of the data would return a signal that was more representative of the behavior of the average distribution of blocks in a domain, rather than of the individuals, and reduce the experimental noise associated with the 3D morphology of the slope.
Remotesensing 15 04525 g011
Figure 12. The CSP value for the sampled outcrops (Figure 3a) was obtained using an approach that considers the representative size of a domain that is understood as a circular area with a diameter equal to ½ of the height of the 3 main steps, generating windows (black circles) that are comparable with shape and real surfaces.
Remotesensing 15 04525 g012
Figure 13. Abacus of GSI according to the version in [15] and the values assigned to outcrops numbered according to Figure 3 that clearly show the wide range of rock mass quality along the slope. The variability of block size increases in the portions of the rock mass characterized by intermediate GSI values (3-11-5), while it diminishes for very high or very low values; the degree of alteration remains homogeneous for the observed outcrops classified in the “fair” range.
Remotesensing 15 04525 g013
Figure 14. CSP maps calculated with MATLAB™ and smoothed (Figure 11) at different resolutions. Mapping the CSP allowed us to evaluate the value for each analyzed outcrop (Figure 12) and establish correlations with the GSI values. CSP values that fall outside the statistical reliability range set for the regression (R2 > 0.85) are few and are only associated with debris-covered areas, where the measurement error may increase. Dashed circles correspond to sampling area in Figure 12.
Remotesensing 15 04525 g014
Figure 15. (a) Circular windows used to extract CSP values for each outcrop; (b) boxplots of the CSP value distributions on each outcrop classified by GSI range (GSI range = 5; box = IQR 25–75%; whiskers = 1.5 IQR; red dots = outliers). (c) CSP data were filtered in the IQR (25–75%) and CSP-GSI relationship fitted with sigmoidal function for each smoothed CSP map resolution (red line = Boltzmann sigmoid; dark grey area = 75% prediction band; lightgrey area = 75% prediction band; r2 = determination coefficient).
Remotesensing 15 04525 g015
Figure 17. The figure shows the GSI maps, at the slope scale of the quarry, obtained by applying Equation (6) to the CSP maps (Figure 14) at different resolutions. In (a,b), a clear distinction between the debris at the foot of the steps and the rock mass outcrops can be observed. Using the insets (I–VI in reference to Figure 18), the mapped GSI values can be compared with the reference quality sectors.
Remotesensing 15 04525 g017
Figure 18. Examples of outcrops of the slope covered by the analyses clearly show the wide quality range of the material, which varies from extremely intact (I,VI) to strongly disturbed and damaged (III,V), reaching the appearance of disintegrated material (IV). In this transition, the rock mass exhibits strongly discontinuous sectors characterized by a wide variability in block size (II).
Remotesensing 15 04525 g018
Disclaimer/Publisher’s Note: The statements, opinions and data contained in all publications are solely those of the individual author(s) and contributor(s) and not of MDPI and/or the editor(s). MDPI and/or the editor(s) disclaim responsibility for any injury to people or property resulting from any ideas, methods, instructions or products referred to in the content.