Article

Using Wavelet Coherence to Aid the Retrieval of Volcanic SO2 from UV Spectra

by
Charlotte Barrington
1,2,*,
Benoit Taisne
1,2 and
Fidel Costa
1,2,3
1
Earth Observatory of Singapore, Nanyang Technological University, Singapore 639798, Singapore
2
Asian School of the Environment, Nanyang Technological University, Singapore 639798, Singapore
3
Institut de Physique du Globe de Paris, Université Paris Cité, CNRS, 75238 Paris, France
*
Author to whom correspondence should be addressed.
Remote Sens. 2023, 15(18), 4532; https://doi.org/10.3390/rs15184532
Submission received: 25 April 2023 / Revised: 1 September 2023 / Accepted: 12 September 2023 / Published: 14 September 2023
(This article belongs to the Section Atmospheric Remote Sensing)

Abstract

:
Changes in the emission rate of volcanic sulphur dioxide (SO 2 ) are crucial parameters for identifying volcanic unrest and forecasting the eruptive activity. Ground-based ultraviolet (UV) remote sensing provides a near continuous record of the SO 2 emission rate, with Differential Optical Absorption Spectroscopy (DOAS) being the preferred method for quantifying SO 2 absorption from recorded spectra. However, retrieving accurate column amounts of SO 2 using DOAS requires a complex fitting procedure that relies on user expertise for selecting suitable fit parameters and visually inspecting the fit results. We explore an alternative approach that exploits the well-defined spatial frequencies present in sky-scattered UV spectra. We use wavelet coherence to compare UV spectra recorded with calibration cells of known SO 2 concentration in the wavelength–spatial frequency plane. Our findings reveal that the Magnitude-Squared Wavelet Coherence (MSWC) is inversely proportional to the SO 2 concentration, suggesting that this relationship could be used to quantify volcanic SO 2 in natural spectra. To validate this approach, we analyze UV spectra recorded by scanning-DOAS instruments from the Network of Volcanic and Atmospheric Change (NOVAC) at Masaya volcano, Nicaragua, and Soufrière Hills volcano, Montserrat. We observe a favourable comparison between the MSWC values we calculate and the slant column densities (SCDs) of SO 2 obtained using the DOAS and iFit algorithms, respectively. We demonstrate the MSWC to be a robust indicator of SO 2 which may potentially serve as a proxy for differential SCDs of volcanic SO 2 . The straightforward computation of the wavelet coherence between spectra offers an efficient means to identify spectra which contain the signature of the volcanic plume and an objective approach to validate results obtained using traditional fitting routines.

Graphical Abstract

1. Introduction

Changes in the emission rate and composition of volcanic gases have been shown to track the progressive depressurization of the magma ascent, allowing us to detect changes before magma arrives to the surface [1,2]. Owing to the solubility behavior of sulphur in volcanic systems, the emission rate of sulphur dioxide (SO 2 ) provides important information about processes occurring at a shallow depth (<5 km depth) [3], and changes in the SO 2 emission rate remains one of the primary parameters used to establish volcanic unrest and forecast eruptive activity [4,5,6,7,8]. Ground-based remote sensing using ultraviolet (UV) spectrometers is one of the only ways to obtain a near continuous record of volcanic plume gas, specifically targeting SO 2 due to its low ambient atmospheric concentration and distinct absorption in the UV region [9,10,11,12]. These spectrometers are typically placed at safe distances from the volcano and thus enable continuous monitoring throughout episodes of intense eruptive activity [11,13]. Scanning instruments, such as those belonging to the global Network of Volcanic and Atmospheric Change (NOVAC), record spectra as they scan the horizon during daylight hours and as a result, several thousand spectra may be recorded daily at any one volcano [11,14]. Variations in the prevailing wind patterns, and therefore, changes in the position of the volcanic plume, along with periods of weak degassing, mean that not all of these spectra will contain the distinctive absorption signature of the volcanic plume. Moreover, owing to the underestimation of SO 2 which may occur when the plume is positioned far from the instrument, e.g., [15,16,17], scans where the plume is overhead are typically favored. Only once the spectra are analyzed can unsuitable scans be discarded, including those which do not record a (near) complete cross section of the plume [14]. As the availability of spectroscopic measurements continues to increase, there is a need for techniques to efficiently analyze large datasets of UV spectra recorded at active volcanoes.
The favoured method for quantifying SO 2 from UV spectra is Differential Optical Absorption Spectroscopy (DOAS), a technique based on the Beer–Lambert–Bouguer law [18,19,20], which relates the attenuation of light to properties of the material through which it has travelled [21]. To quantify the absorption by SO 2 using DOAS, the differential absorption, between a reference and a measurement spectrum, is related to the absorption coefficient for SO 2 , which is described by its absorption cross section [22] (Figure 1a). However, differences between the two spectra stem not only from the absorption attributed to SO 2 , but also from an array of instrumental artifacts and Radiative Transfer Effects (RTEs). These RTEs include the absorption caused by other trace gas species along the light path, as well as atmospheric scattering processes [15,21,23]. In order to separate the absorption attributed to SO 2 from the RTEs, a complex fitting procedure is used [21]. Prior to the fitting process corrections for instrumental effects, including stray light, fluctuations in the quantum efficiency of the spectrometer, and its dark current, are required [21,24,25,26]. The slant column density (SCD) of SO 2 that is derived, corresponds to the SO 2 fit coefficient that yields the smallest fitting residuals. Hence, there is a potential for overfitting the spectra, potentially resulting in inaccurate SCDs of SO 2 [25,27]. Expertise is therefore necessary, not only for the selection of suitable fit parameters, but also to visually inspect the fit results. Since it is not known prior to the analysis which spectra contain the absorption signature due to SO 2 , spectra recorded by the Network of Volcanic and Atmospheric Change (NOVAC) are analyzed using a reference spectrum recorded at the zenith. To overcome the possibility that this ‘sky’ reference already contains the absorption signature of SO 2 , a ‘contamination offset’ is later applied. Prior knowledge as to which spectra do not contain the absorption signature of the volcanic plume would greatly assist in selecting suitable reference spectra. Moreover, the capability to identify high-quality spectra without requiring a complex fitting routine would simplify the process of selecting spectra for testing novel approaches. This would be particularly valuable in targeting the retrieval of additional trace gas species, such as bromine monoxides (BrO) and (OClO), which are typically present in the volcanic plume at much lower concentrations [26,28,29].
Here, we explore an alternative approach which exploits the distinctive spatial frequencies present in sky-scattered UV spectra [30]. We use wavelet coherence to compute the Magnitude-Squared Wavelet Coherence (MSWC) between recorded spectra. While wavelet coherence traditionally measures the correlation between two signals in the time-frequency domain, e.g., [31,32,33,34,35,36,37,38], its efficiency in analyzing non-stationary signals means it is also well-suited to analysing UV spectra in the wavelength–spatial frequency domain. Differential absorption by SO 2 results in detectable variations in the MSWC, which correspond to the distinct spatial frequency signature of SO 2 (Figure 1b), implying that the MSWC may be used as a proxy for differential slant column densities (SCDs) of volcanic SO 2 . In this study, we introduce a straightforward computation of the wavelet coherence as a valuable tool for analysing UV spectra, offering:
  • An efficient way to identify spectra which contain the signature of the volcanic plume.
  • An objective means to validate results obtained using traditional fitting routines that typically necessitate a visual inspection of the fit results.
Figure 1. (a) The absorption cross section of SO 2 at 293 K [22] convolved to match the lower resolution of typical instruments used for ground-based remote sensing of volcanic plumes [39]. (b) The spatial frequency signature of SO 2 absorption is described as the real value of the continuous wavelet transform of the SO 2 absorption cross section shown in panel (a) and is computed using the MATLAB ‘CWT’ function [40] with analytic Morlet and sampling frequency ( F s ) of 0.07 λ /channel [30]. Data occupying the cone of influence (which are potentially affected by edge-effect artifacts) have been removed.
Remotesensing 15 04532 g001

2. Materials and Methods

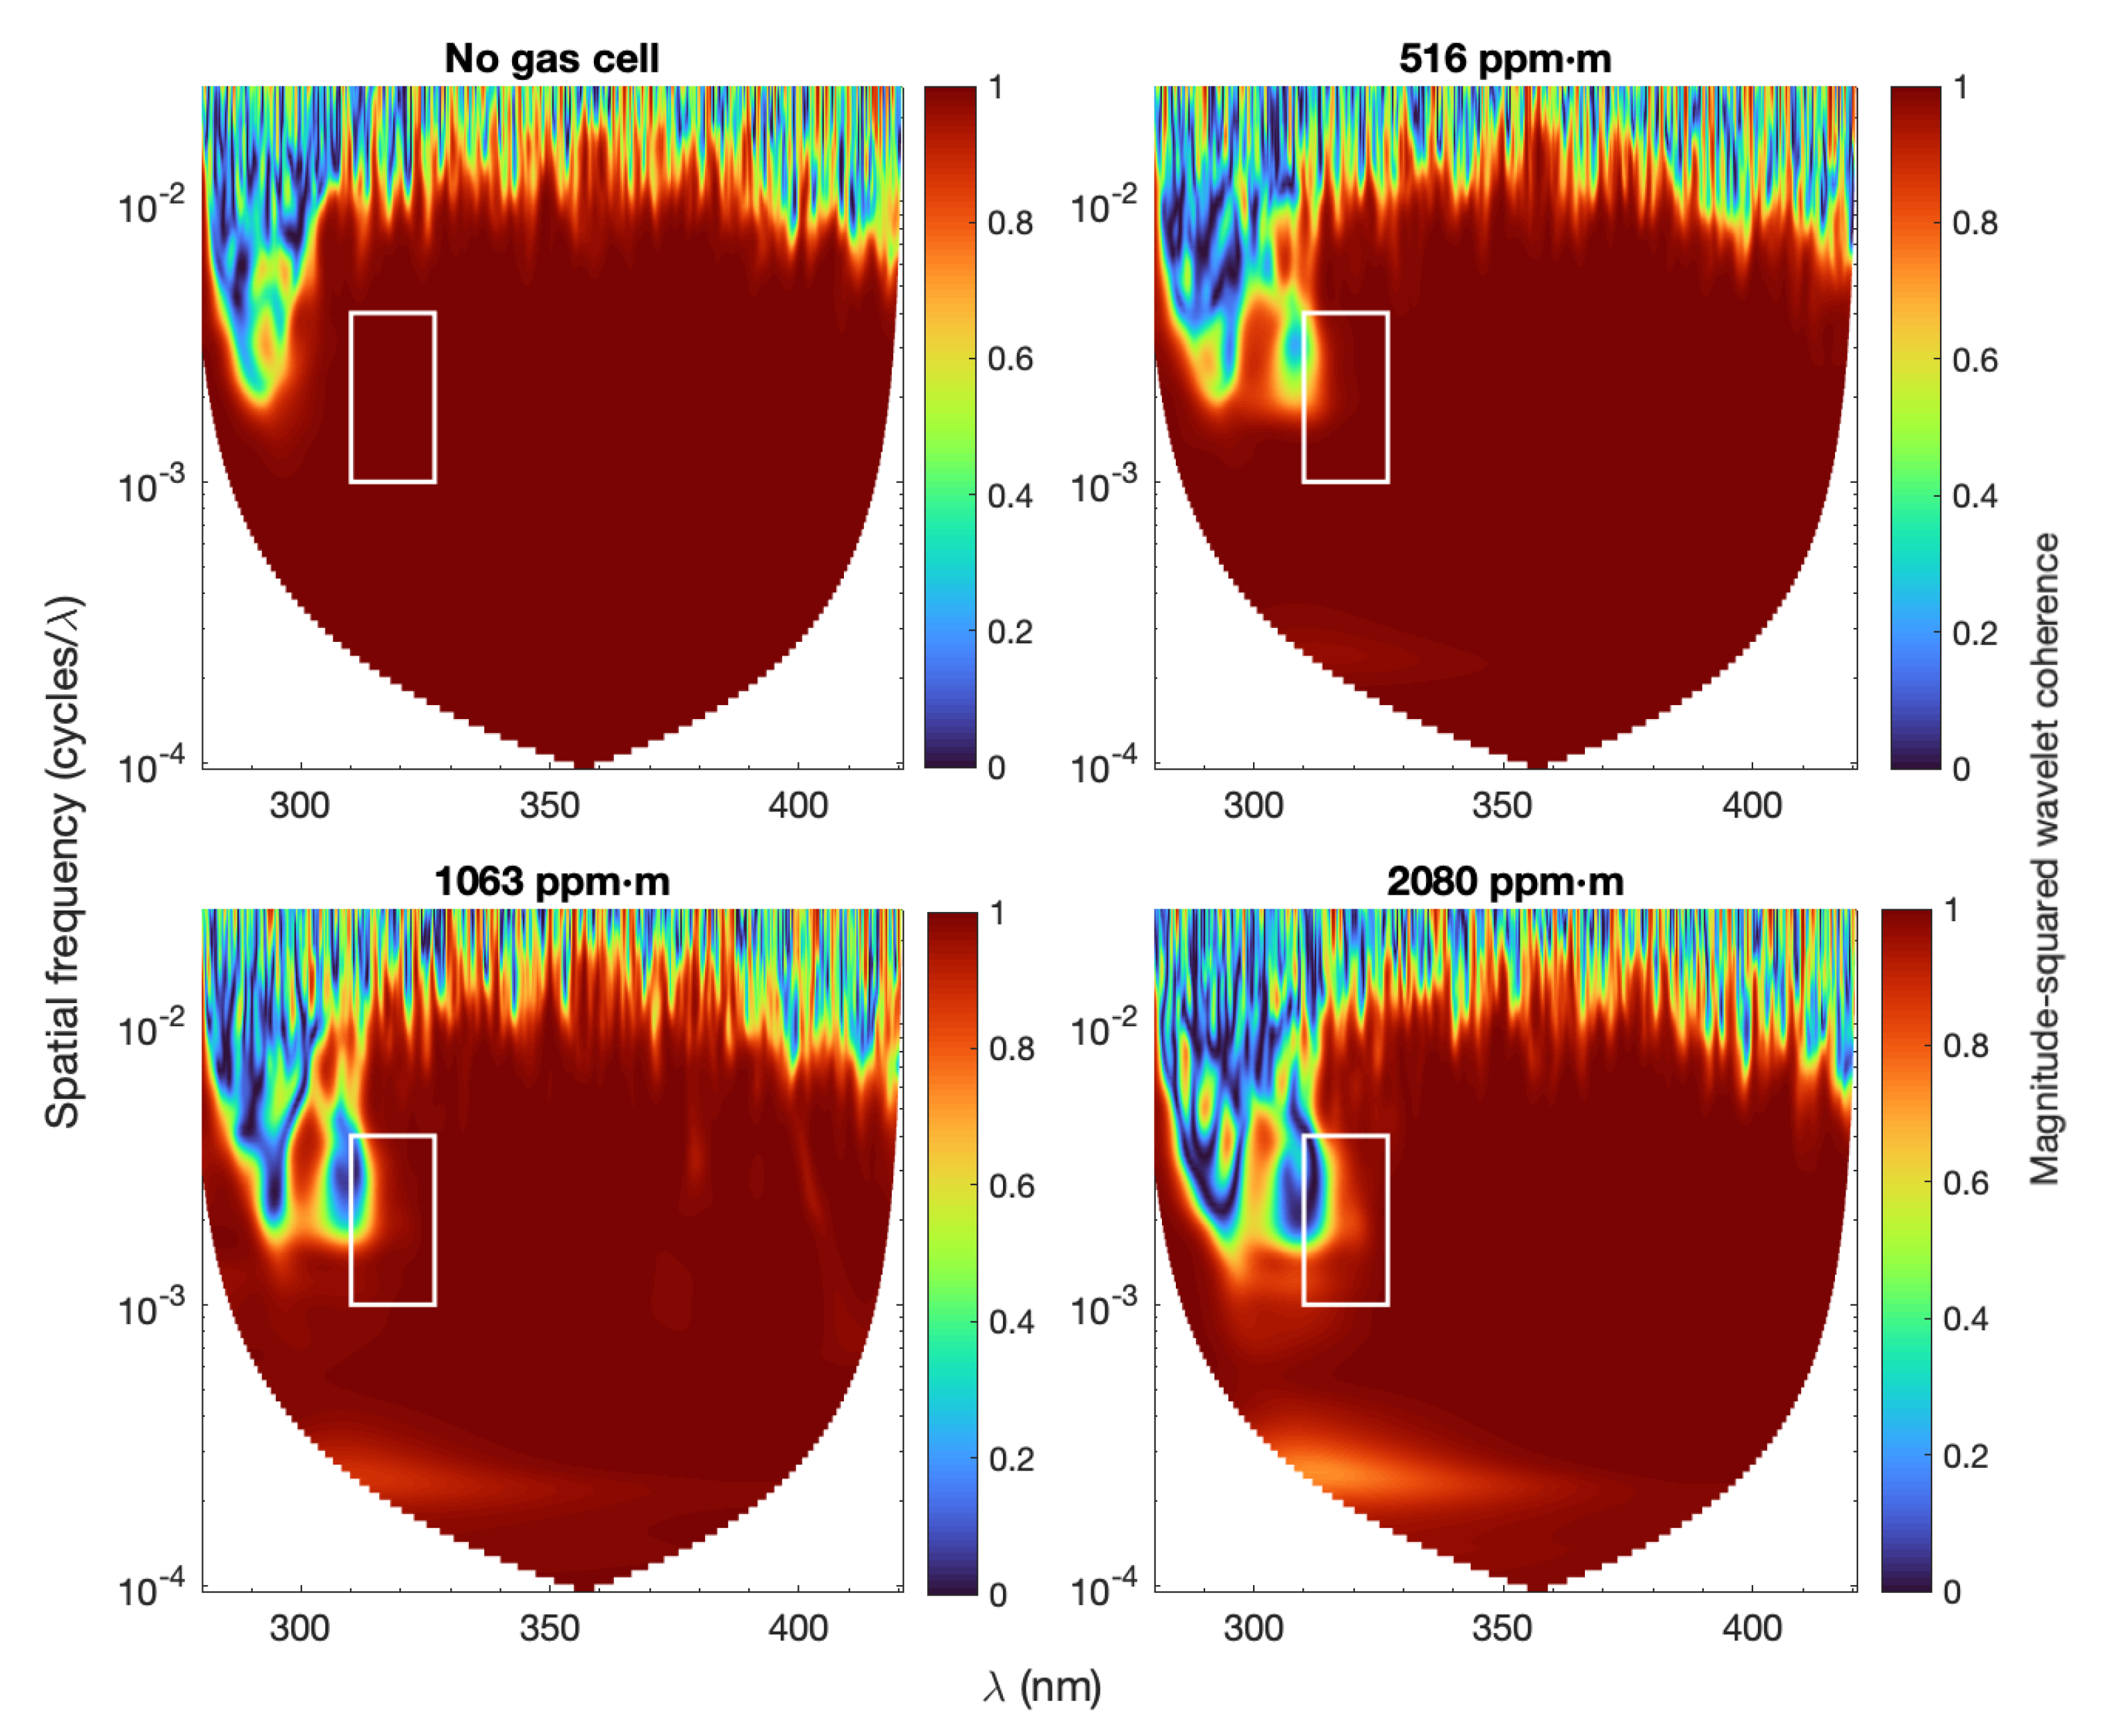
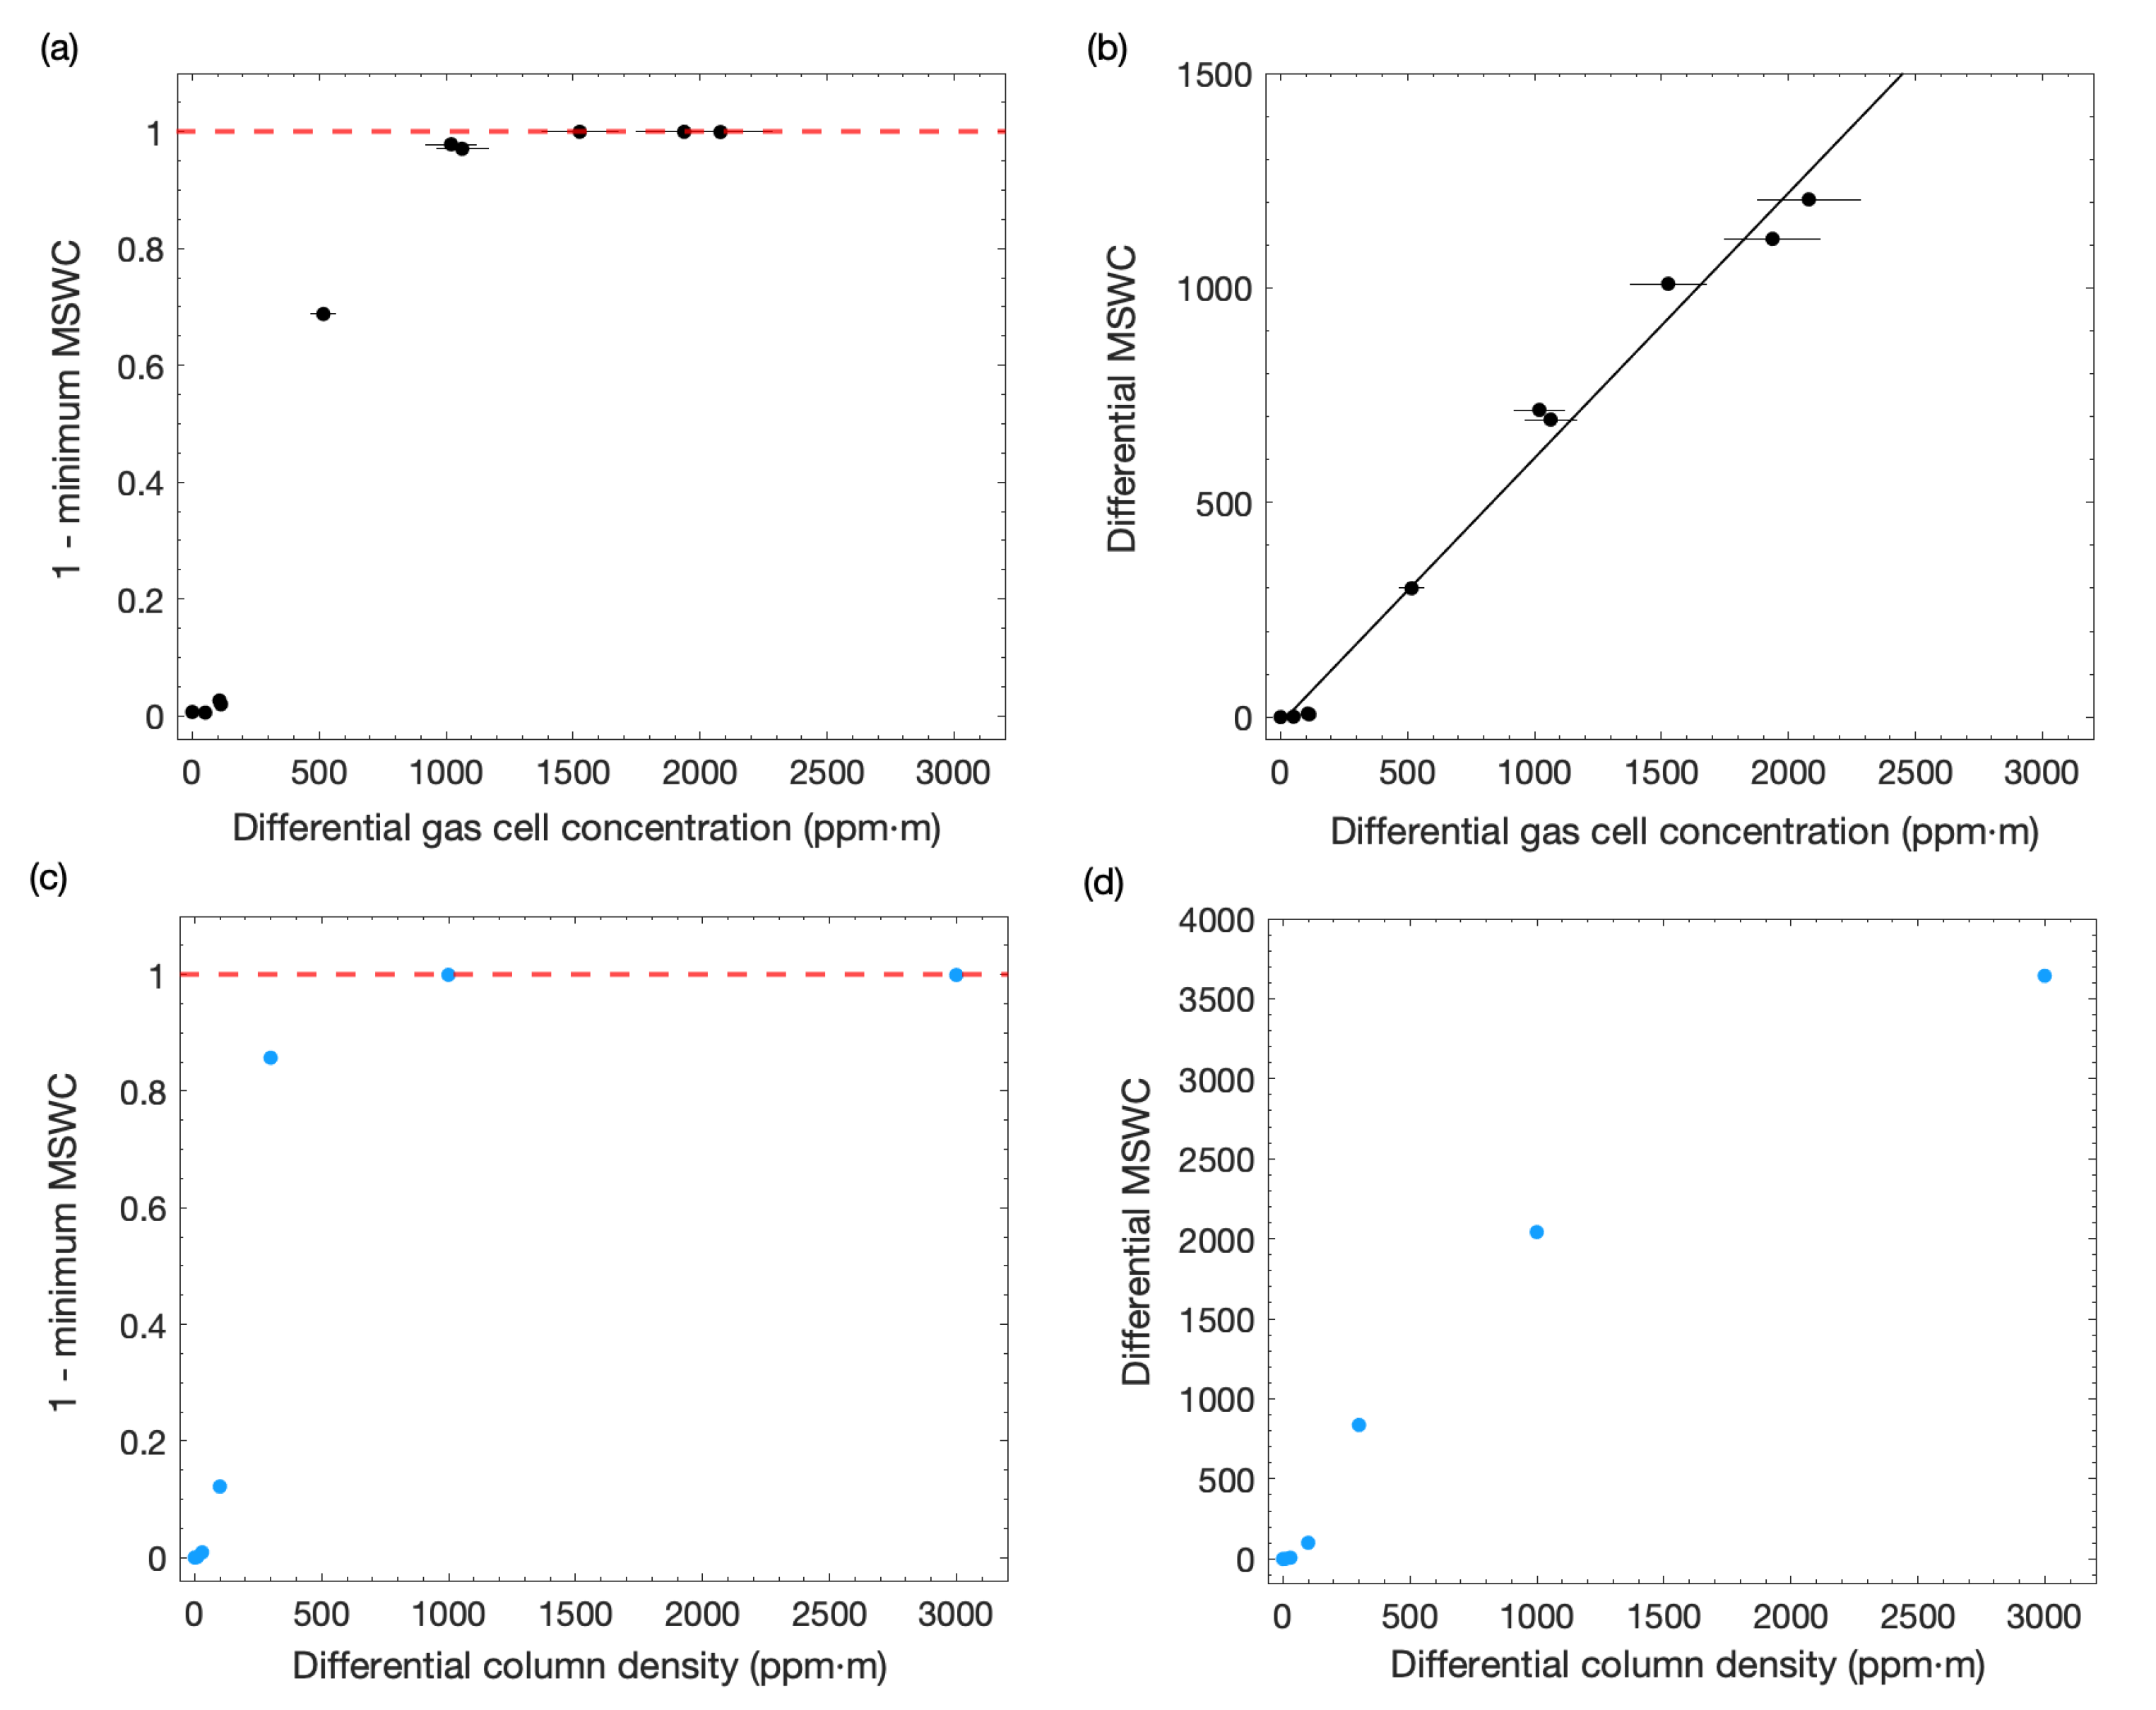
2.1. Magnitude-Squared Wavelet Coherence (MSWC)

Although UV spectra of sunlight scattered in the atmosphere vary in intensity, they are dominated by strong Fraunhofer lines. These occur at specific wavelengths, and when spectra are viewed in the frequency domain, the observed Fraunhofer lines have the same spatial frequency signature. We demonstrate this by calculating the Magnitude-Squared Wavelet Coherence (MSWC) of two measured Fraunhofer spectra recorded with a zenith viewing angle (Figure 2). We determine the MSWC using the MATLAB [40] ‘wavcoherence’ function and defining an approximate sampling frequency ( F s ) of 0.07 cycles/ λ . F s is defined as the wavelength range of the spectrometer (in nm) divided by the number of spectrometer channels, which enables spatial frequency to be determined in units of cycles/ λ [30]. Figure 2c shows the MSWC which is a measure of the correlation between the two spectra as a function of spatial frequency. A MSWC value of 1 indicates that the two spectra correspond perfectly to one another and a MSWC value of 0 means that the spectra do not share common characteristics in the spatial frequency domain. The resulting MSWC is close to 1 for spatial frequencies less than ∼1 · 10 2 cycles/ λ between ∼300 and ∼380 nm, indicating that the two spectra are very similar in spatial frequency content within this wavelength range. Higher spatial frequencies, where the MSWC varies considerably across all wavelengths, represents the inherent variability of the photon flux [21]. The reduced MSWC at wavelengths < 305 nm is due to the absorption by ozone (O 3 ) [41], which acts to reduce the intensity of light reaching the spectrometer such that noise dominates the signal at this range [21]. At the spatial frequencies which correspond to the narrowband absorption structures of SO 2 (Figure 1b), the MSWC is 1 at wavelengths longer than ∼310 nm, suggesting that in the absence of changes to the absorption by SO 2 in the light path, spectra are expected to be uniform at spatial frequencies of ∼2.5 · 10 3 cycles/ λ .
The absorption cross section of SO 2 (Figure 1) suggests that in the presence of SO 2 absorption, we can expect changes to the narrowband and broadband spatial frequencies contained in the recorded Fraunhofer spectra, as a function of wavelength. We compute the MSWC between a measured Fraunhofer spectra and that recorded with a SO 2 gas cell in its field of view (Figure 3). The two spectra in Figure 3a have different overall intensities, caused by the broadband absorption by SO 2 (and any reduction in transmittance caused by the Pyrex gas cell). When we look at the MSWC between the two spectra (Figure 3c), we observe a clear reduction in the MSWC in the wavelength range of SO 2 absorption (300–320 nm). This reduction in the MSWC is centred at the spatial frequency corresponding to the narrow band absorption lines of SO 2 (∼2.5 · 10 3 cycles/ λ , Figure 1b). Outside the predominant wavelength range of SO 2 absorption, there is no change to the MSWC at these spatial frequencies. We note a slight reduction in the MSWC at lower spatial frequencies, which relates to the broadband absorption of SO 2 , and is not typically used to quantify SO 2 from UV spectra [21].
A greater absorption by SO 2 causes an increase in the depth (or amplitude) of the differential absorption lines (Figure 1) between the measurement spectrum and the reference [18,21]. According to the Beer–Lambert–Bouguer law, the absorption by SO 2 is directly proportional to its concentration in the light path. A greater absorption by SO 2 will cause an increase in the amplitude of the absorption lines, whereby a greater differential absorption by SO 2 is expected to result in a lower correlation between spectra and a quantifiable change in the MSWC. We therefore expect a progressive reduction in the MSWC which corresponds to the spatial frequencies and wavelength range indicated by the the SO 2 cross section (Figure 1). To test this hypothesis, we compute the MSWC between the same Fraunhofer spectrum at a zenith, and a series of spectra with gas cells of increasing SO 2 concentration in the field of view (Figure 4). The reduction in the MSWC appears to be proportional to the concentration of SO 2 in the gas cell (Figure 4). The observed decrease in the MSWC is centred at ∼310 nm and corresponds to a spatial frequency of ∼2.5 · 10 2 cycles/ λ , which coincides with the spatial frequency signature of SO 2 (Figure 1b). At a gas cell concentration of 1063 ppm·m, the minimum MSWC reaches 0, indicating that the two spectra are completely distinct when viewed in the spatial frequency domain. We note that the reduction in MSWC at lower spatial frequencies, due to the broadband absorption by SO 2 (Figure 4), also appears to increase with the increasing SO 2 concentration of the gas cell.

2.2. Spectral Analysis

Since we are interested only in the differential absorption signature due to SO 2 , we consider the MSWC values to be within a small extraction window (the white box in Figure 4), where we observe a reduction in the MSWC due to SO 2 . In Figure 2, we demonstrated that the spatial frequencies contained in UV spectra of sunlight scattered in the atmosphere are largely uniform at spatial frequencies <1 · 10 2 cycles/ λ in the wavelength range of SO 2 absorption. At spatial frequencies <4 · 10 3 cycles/ λ however, the MSWC was exactly 1; therefore, it represents a better upper spatial frequency limit for isolating the change in MSWC caused by the SO 2 absorption. To eliminate the influence from broadband signals, including those caused by atmospheric scattering [15,16], we exclude spatial frequencies below those which correspond to the narrow band absorption lines of SO 2 and define a fixed extraction window to consider MSWC values between the spatial frequencies of 1 to 4 · 10 3 cycles/ λ only. We consider wavelengths between 310.0 and 326.8 nm, where the characteristics of the sky-scattered UV spectra are highly uniform, but where the changes in the MSWC due to the narrow band absorption of SO 2 are visible. By extracting the MSWC starting at 310 nm, we incorporate only the right side of the loosely concentric reduction in MSWC, which corresponds to the absorption by SO 2 (Figure 4). This choice of extraction window incorporates the wavelength range typically used to retrieve SCDs of SO 2 from UV spectra, e.g., [14].
We again plot the MSWC between the same Fraunhofer spectrum at a zenith and a series of spectra with gas cells of increasing SO 2 concentration in the field of view, but look only at those MSWC values within the extraction window (Figure 5). We use gas cells with SO 2 concentrations ranging from 51 to 2080 ppm·m ( ± 10 % relative) which represent SO 2 slant column densities (SCDs) between ∼1 · 10 17 and ∼5 · 10 18 molec/cm 2 (where 1 ppm·m ≈ 2.5 · 10 15 molec/cm 2 at 20 °C and 1 atm). The MSWC values between 1 to 4 · 10 3 cycles/ λ and 310.0–326.8 nm are dependent on the SO 2 concentration of the gas cell. For gas cell concentrations up to 113 ppm·m SO 2 , the mean MSWC within the extraction window is equal to 0.997 (min = 0.999, max = 0.098), and only a very slight reduction in the MSWC is observed for the highest spatial frequencies at ∼310 nm. This suggests that the differential absorption due to SO 2 between the ‘clear-sky’ spectrum and that recorded with the 113 ppm·m SO 2 gas cell does not cause any obvious changes in the spatial frequency content between 310.0 and 326.8 nm. This may be the case if the absorption signature due to the presence of SO 2 is visible only outside the wavelength range and spatial frequency limits used to define the extraction window, or because there is no differential absorption, implying an atmospheric concentration ∼113 ppm·m SO 2 . Since the absorption signature of SO 2 (Figure 1) tells us that SO 2 absorbs at the specific range of the extraction window, we suggest that at very low concentrations, any changes in the recorded spectrum, due to the presence of SO 2 , are buried in the solar spectrum, and the spatial frequency signature of the spectra remains unchanged, or these changes are not identified by the wavelet coherence algorithm. For gas cell concentrations >113 ppm·m however, there is a clear decrease in the MSWC. This change in the MSWC is apparent as a reduction in its number value close to ∼310 nm but also spatially, with a reduction in the MSWC visible over a greater area of the extraction window. Interestingly however, the MSWC values, which are close to 0 when the SO 2 gas cell concentration is ∼1000 (at ∼310 nm and ∼3 · 10 3 cycles/ λ ), start to increase for higher gas cell concentrations; at 1526 ppm·m, the MSWC value at ∼310 nm and ∼3 · 10 3 cycles/ λ has increased to ∼0.2 (Figure 5). This suggests that the deviation in the spatial frequency content of the spectra, caused by the narrowband absorption of SO 2 , is not linear across all wavelengths.
To validate the correlation between the MSWC within the defined extraction window and the SO 2 concentration of the gas cell, we plot both the minimum MSWC and the differential MSWC against the gas cell concentration (Figure 6). We first consider the minimum MSWC, which is subtracted from 1 in order to show a more intuitive trend. As depicted in Figure 6a, an increase in the SO 2 concentration of the gas cell leads to a greater reduction in the minimum MSWC. To account for the minimum MSWC value reaching 0 at gas cell concentrations of ∼1000 ppm·m, we additionally evaluate the differential MSWC (Figure 6b). The differential MSWC is defined as the absolute value of the total MSWC after subtracting the sum of the MSWC between two ‘clear-sky’ Fraunhofer spectra (Figure 5). The differential MSWC is essentially a measure of the total MSWC but is reported as the differential MSWC in order to show a more intuitive trend. The differential MSWC enables us to describe the change in MSWC beyond the ‘saturation’ limit and indicated by the dashed line in Figure 6a. We also analyze a series of synthetic spectra with assumed column densities ranging from 2.5 × 10 15 to 7.5 × 10 19 molecules SO 2 /cm 2 (Figure 6c,d). These synthetic spectra, kindly provided by Dr. Christoph Kern, were generated according to the Beer–Lambert–Bouguer law by multiplying the SO 2 cross section [43] with an assumed column density and multiplying by −1. The exponential was taken and multiplied by the solar reference spectrum [44] before being convolved to match the lower optical resolution of spectrometers typically used for the ground-based remote sensing of volcanic plumes (∼0.5 nm FWHM).
Once a change in the coherence becomes apparent, we observe a linear correlation between the concentration of SO 2 in the gas cell (Figure 6b) or the assumed column density (Figure 6d), and the differential MSWC within the defined extraction window. Although the minimum MSWC reaches 0 at around ∼1000 ppm·m SO 2 (Figure 6a,c), the differential MSWC maintains its linearity beyond this ‘saturation level’, up to gas cell concentrations of ∼2000 ppm·m (Figure 6b). This range aligns with the SO 2 SCDs typically reported for volcanic plumes [26,45,46]. At high SO 2 column densities, the differential MSWC appears to deviate from the linear trend (Figure 6d), which is likely attributed to a significant portion of the extraction window reaching the minimum MSWC (Figure S2).

2.3. Application to Spectra of Volcanic Plumes

The NOVAC (Network of Volcanic and Atmospheric Change) is the largest instrument network for monitoring volcanic gases, with a total of 100 instruments installed across 42 volcanoes [47]. The NOVAC instrument itself consists of a telescope fiber-coupled to an S2000 spectrometer from Ocean Optics Inc. with 2400 lines/mm grating and a 50 µm slit (see Galle et al. [11] for a full description). The recorded spectra have an optical resolution of ∼0.6 nm over the wavelength range of 280–420 nm; to limit stray light, these instruments also incorporate a band-pass filter (Hoya U330) to block UV at wavelengths >360 nm [11]. These instruments scan the horizon at steps of ∼3.6° and record 51 measurement spectra at elevation angles between −90 and 90° from the zenith [11]. Each full instrument scan starts with the recording of a ‘sky’ spectrum at the zenith. This ’sky’ spectrum subsequently serves as the Fraunhofer reference during the Differential Optical Absorption Spectroscopy (DOAS) retrieval process, yielding the differential slant column density (SCD) of SO 2 for each measurement spectrum. The reported (absolute) SCDs of SO 2 are obtained by applying an offset, which fixes the lowest differential SCD to zero, in an effort to account for any SO 2 absorption recorded in the ’sky’ spectrum.
We used three full instrument scans recorded by the NOVAC to determine whether the volcanic plume could be identified from the MSWC. Our methodology was applied to a full instrument scan recorded by one of these instruments installed at Soufriere Hills volcano (SHV), Montserrat, as well as two full instrument scans recorded by an instrument located at Masaya volcano (Nicaragua). We initially computed the MSWC between two ‘clear-sky’ spectra recorded at the Earth Observatory of Singapore (EOS): one captured at the zenith and the other at an elevation angle of 60° from the zenith. The MSWC within the extraction window was close to 1 (Supplementary Material S2); thus, we opted to utilize the NOVAC spectra recorded at an elevation angle of 61° from the zenith as the reference spectrum for calculating the MSWC across each of the 51 measurement spectra. We approximated F s based on the number of spectrometer channels and approximate wavelength range of the spectrometer (0.07 λ /channel) to define the spatial frequency in units of cycles/ λ . In order to define the limits of the extraction window, wavelength–channel information was approximated for spectra at SHV (by comparing the spectra to a high resolution solar reference), and, for Masaya, it was taken from a Hg-spectrum recorded with the same spectrometer [30]. We note that the extraction window needs only to be approximated when the minimum MSWC is used, since (in the presence of differential SO 2 absorption) the minimum MSWC is expected to always occur close to 310 nm (e.g., Figure 4 and Figure 5), where the SO 2 absorption is strongest (Figure 1). Since we are now concerned with areas of low coherence, we change the color scheme used for the figures in Section 3 as well as Figures S4 and S5. Areas marked in white are those where MSWC values exceed 0.9, indicating a high degree of similarity between the reference and measurement spectra. Areas within the extraction window that are dark red now indicate low coherence and signify absorption due to SO 2 and thereby the presence of the volcanic plume.

3. Results

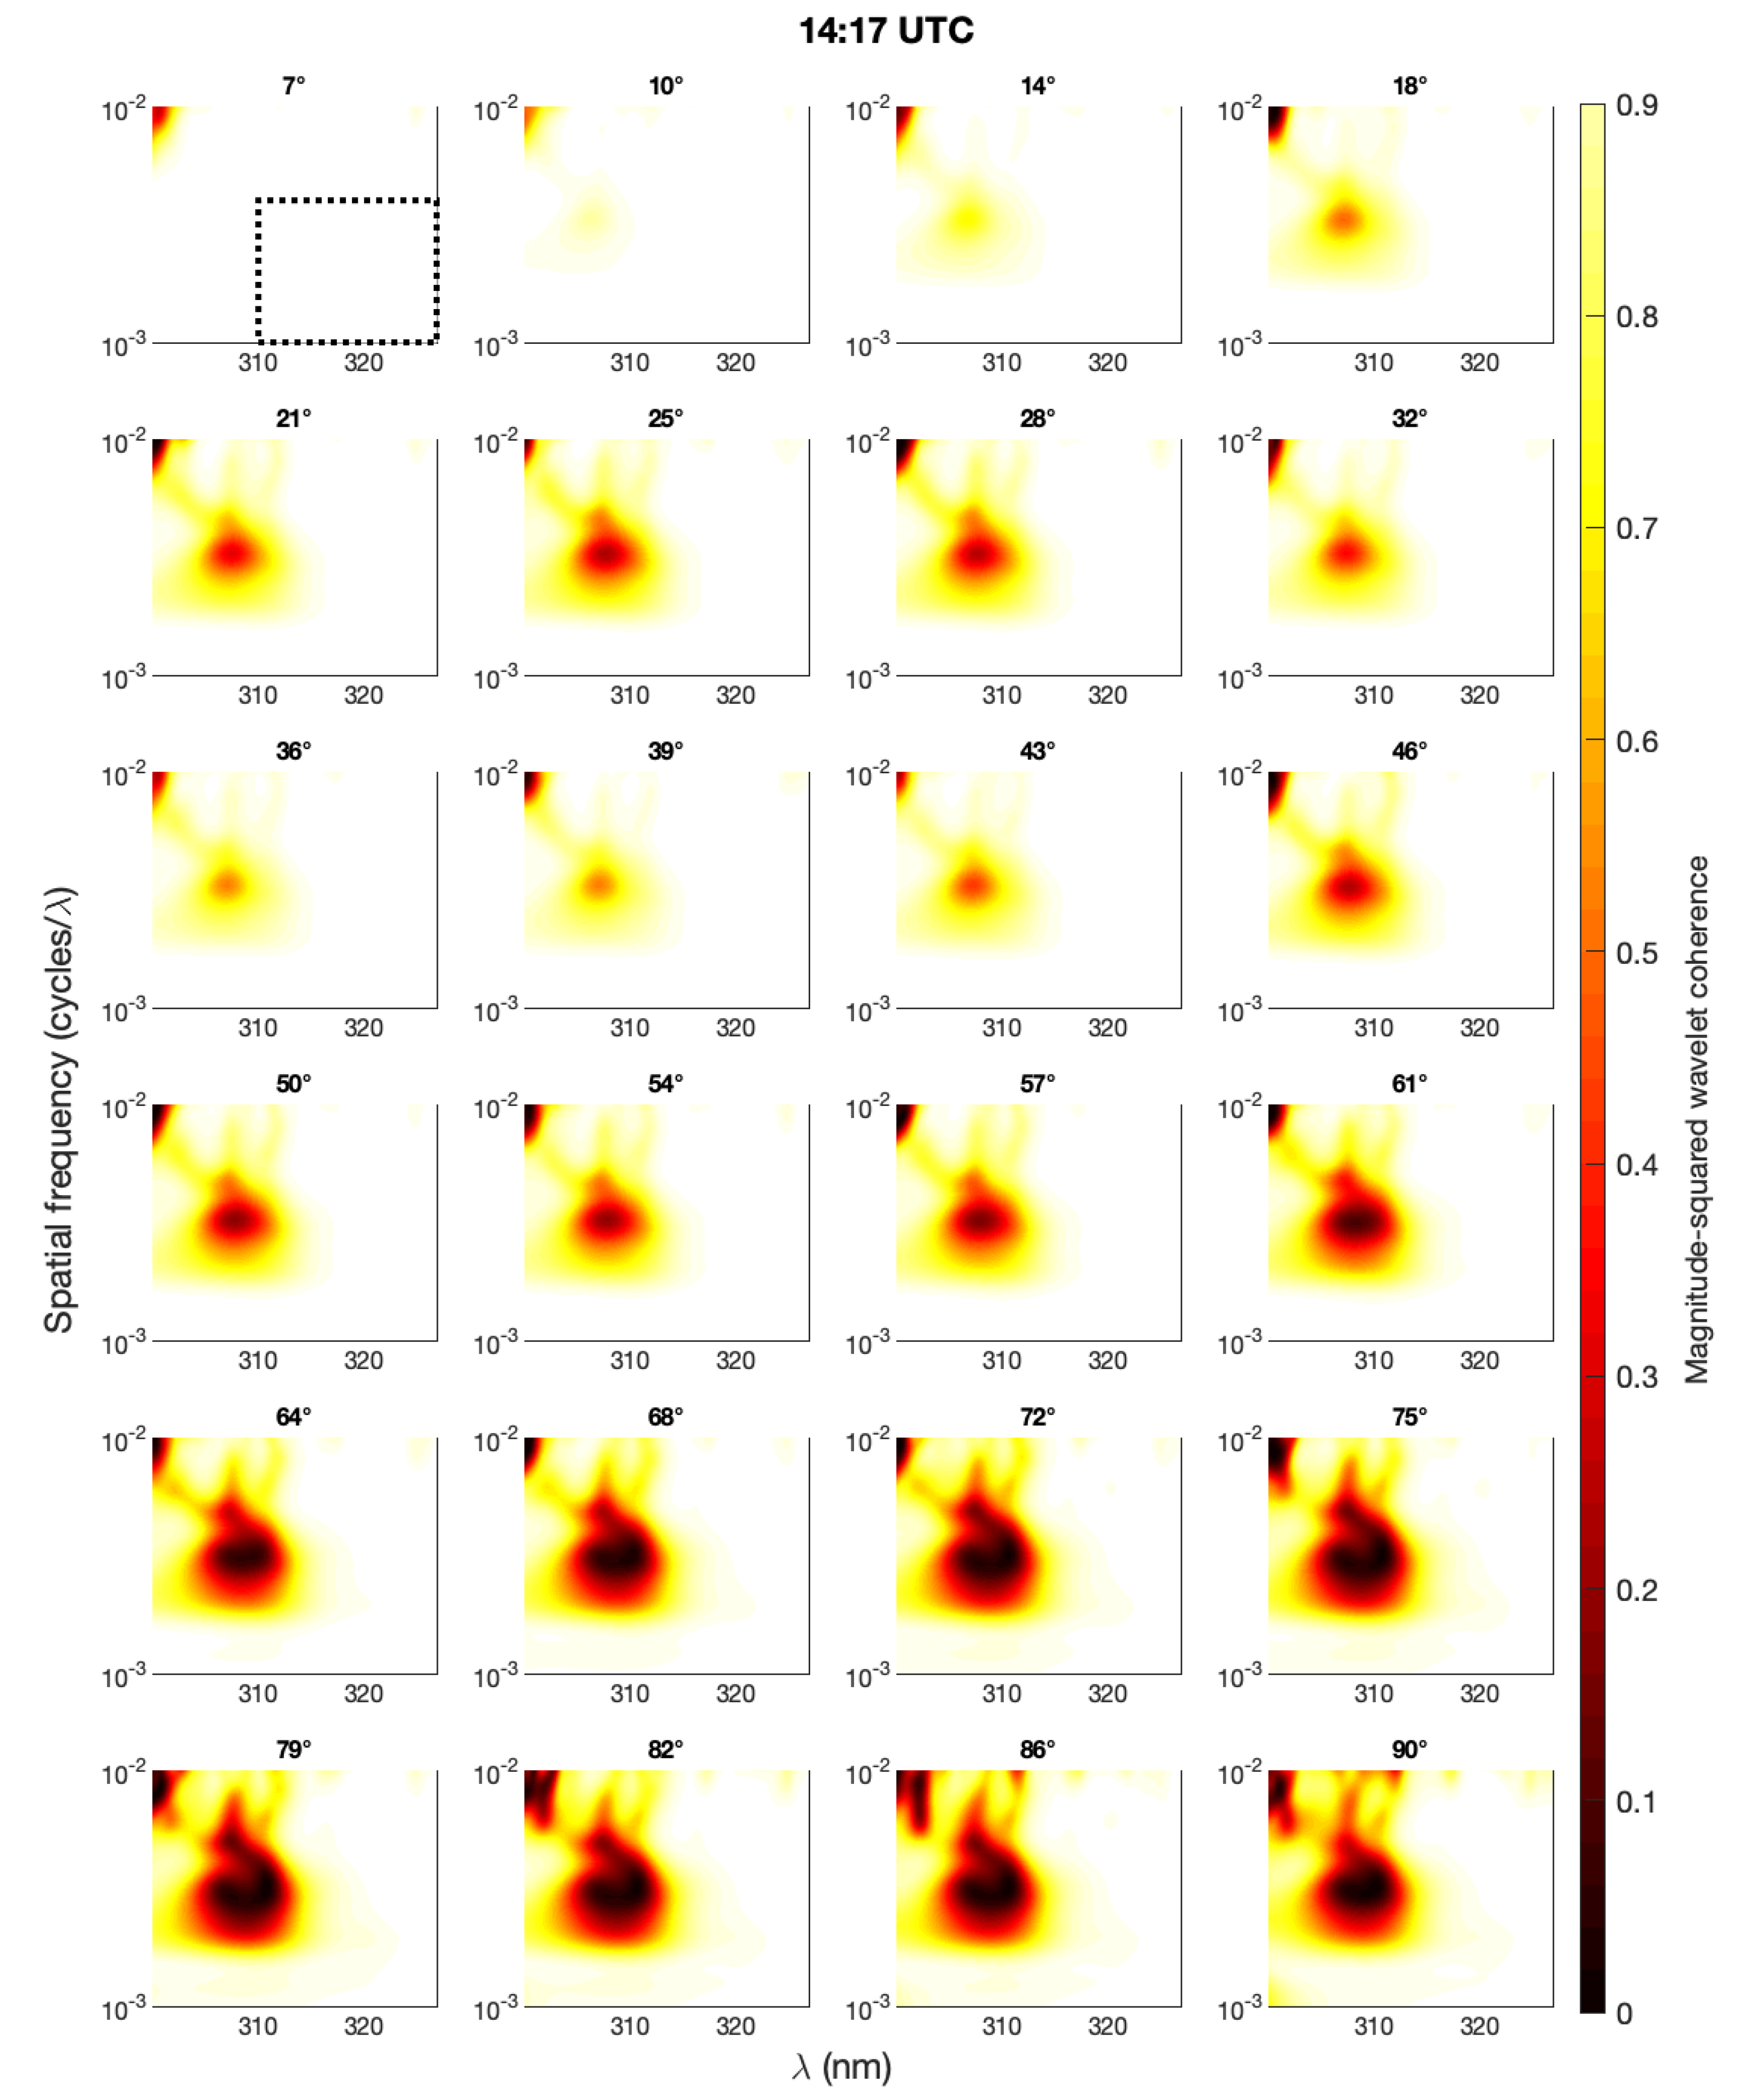
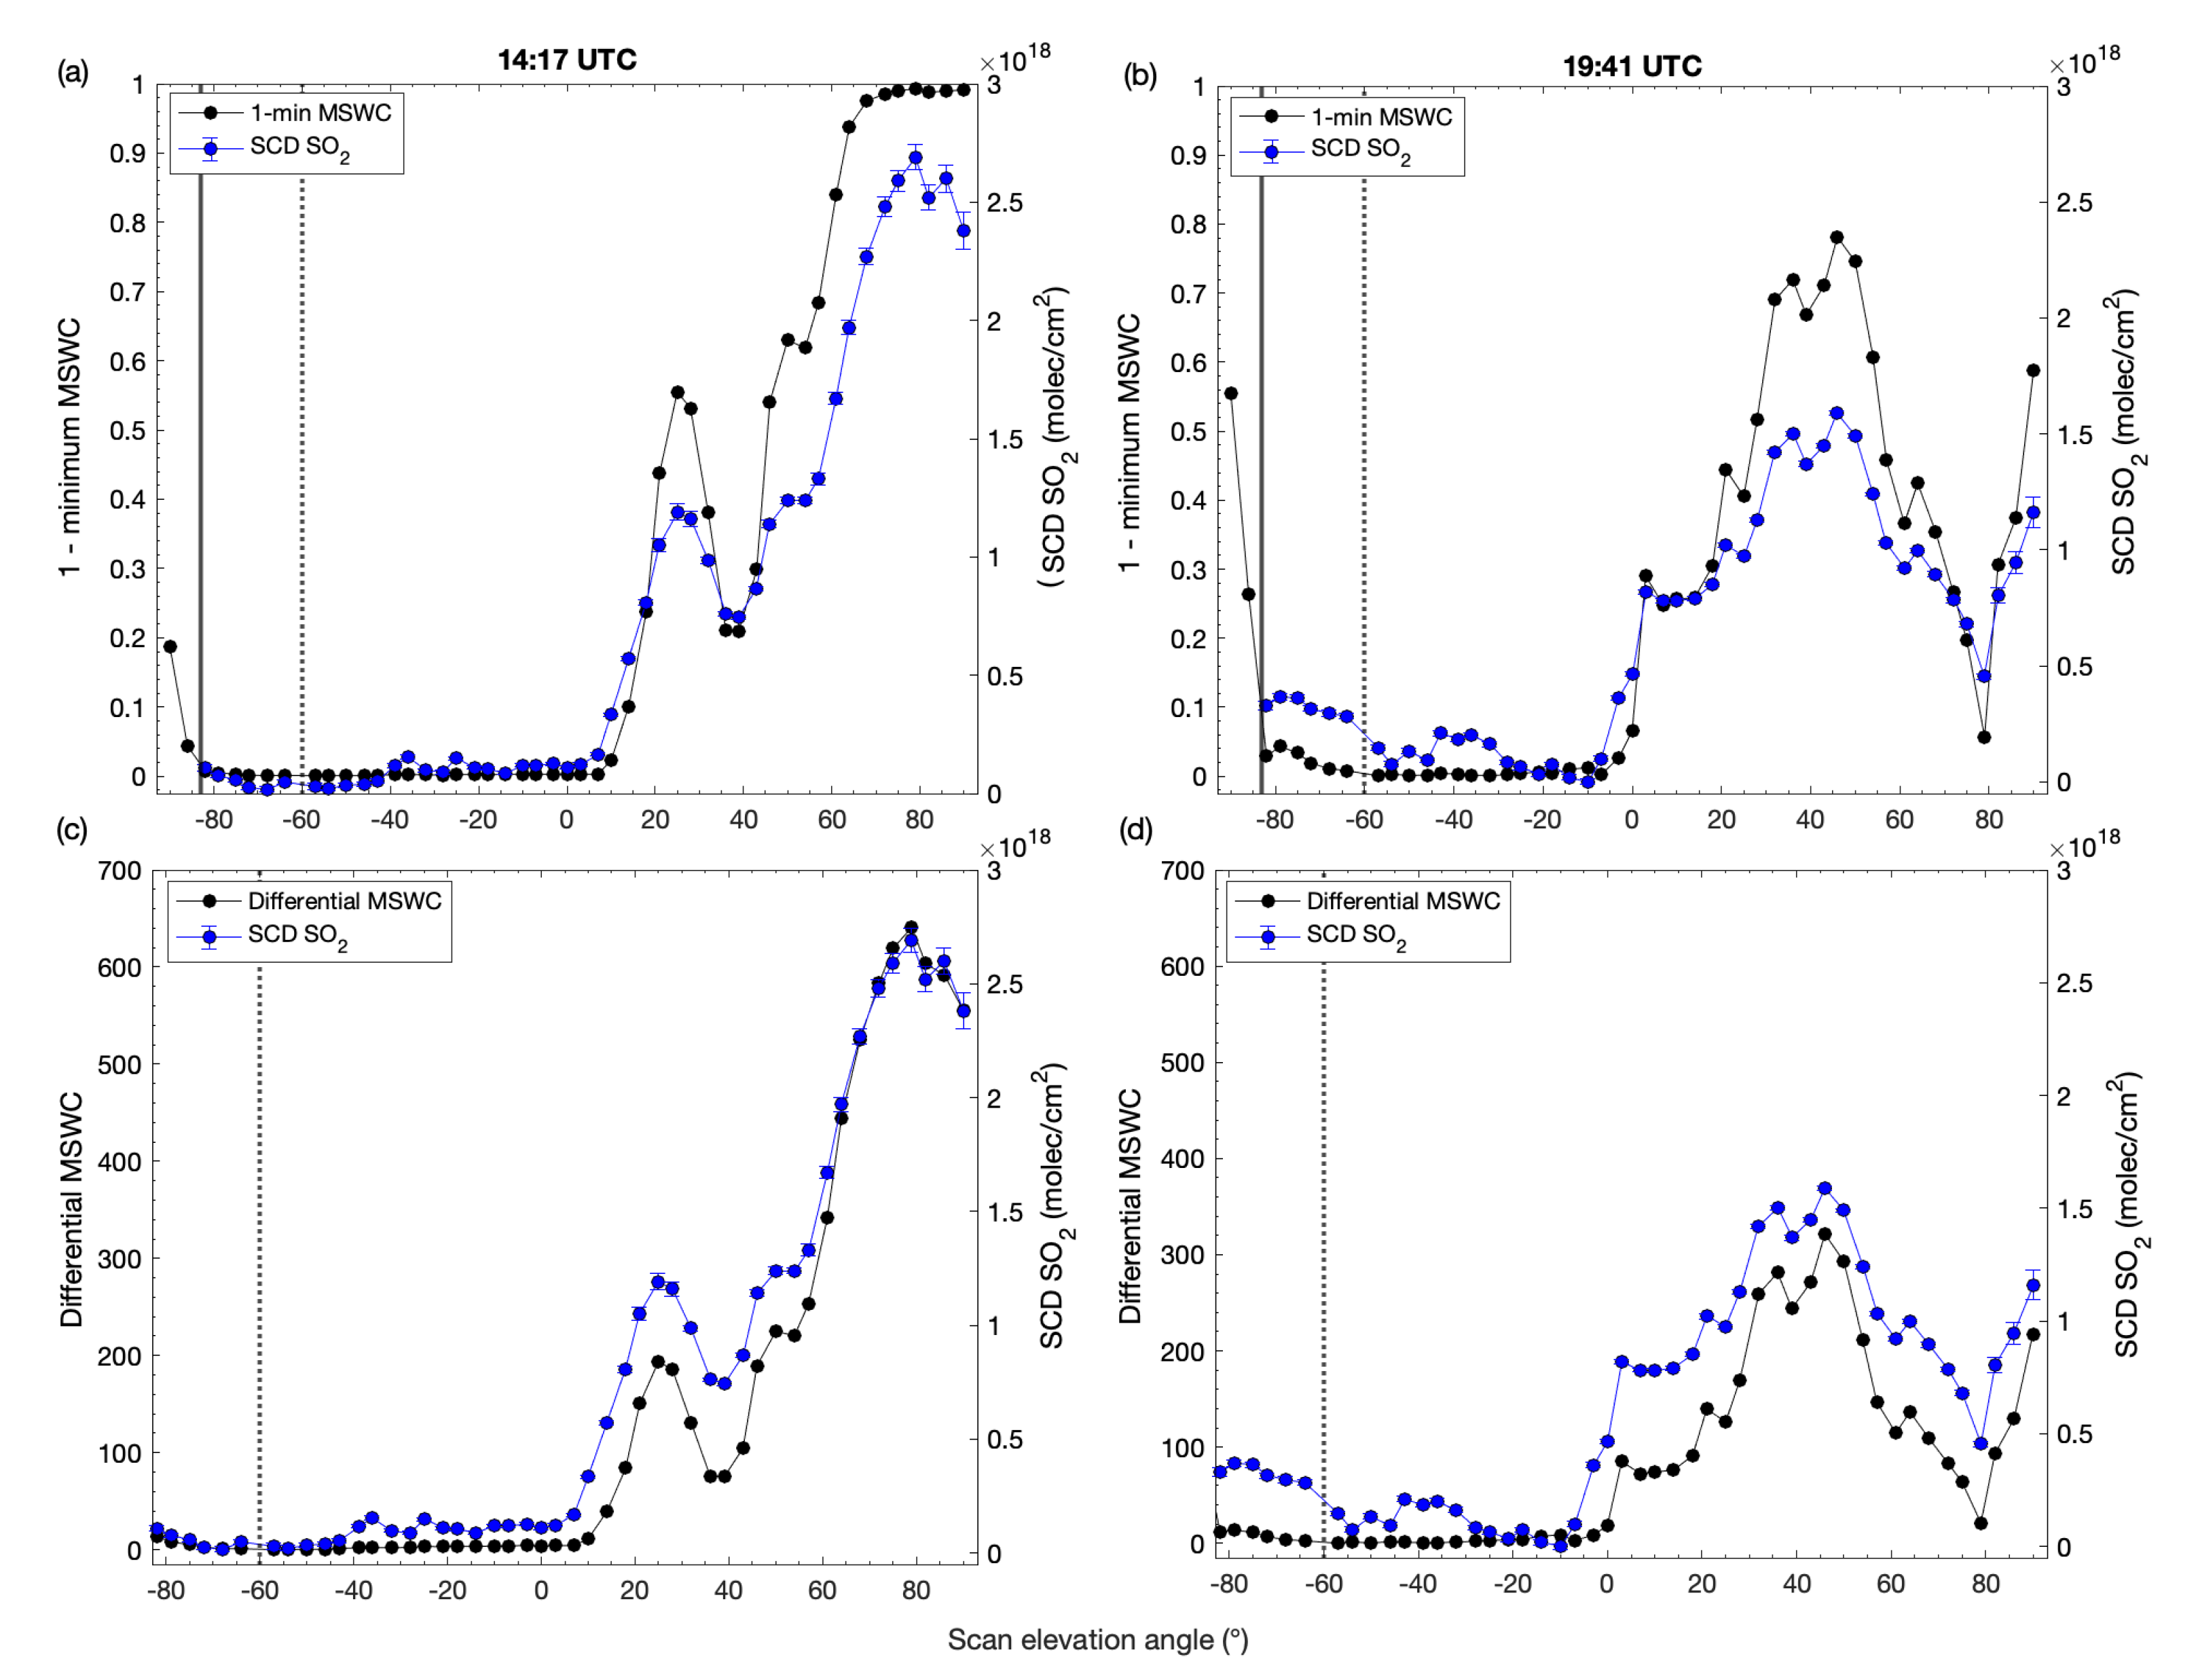
3.1. Soufriere Hills Volcano

The analysis of spectra from SHV yields MSWC values > 0, enabling a comparison between the minimum MSWC within the extraction window and SCDs of SO 2 , as determined by iFit (Figure 7, [25]). iFit is an intensity-based algorithm which fits the measured spectra to a high-resolution solar reference spectrum [25], thus providing absolute SCDs of SO 2 . Both the minimum MSWC and iFit determine the maximum SO 2 absorption within the scan at an angle of −79° from the zenith, showing a comparable profile that we interpret as the absorption signature of the volcanic plume (spectra recorded at elevation angles −35 to −90° from the zenith in Figure 7). We note that the relative changes in MSWC and iFit results appear to compare well, with a similar trend observed in the plume profiles at around 60° from the zenith. At scan elevation angles beyond −80° from the zenith, the MSWC shows an opposing trend compared to the SCDs reported by iFit (Figure 7). This appears to be caused by a low MSWC signal originating from outside the extraction window and is unrelated to the differential absorption by SO 2 (Figure S4, Supplementary Material S3) and is probably due to long atmospheric light paths (and therefore low measured intensities) at high elevation angles, e.g., [48,49], which cause differences in the spatial frequency content of recorded spectra. When we consider spectra with elevation angles from −80° to 90° from zenith, there is a good agreement between the MSWC and the SCDs of SO 2 reported by iFit (Figure 7b). However, the profile which we infer to be the volcanic plume is narrower in the MSWC than implied by the iFit analysis. This discrepancy is likely caused by the minimal change in MSWC at very low SO 2 concentrations (Figure 6), where SO 2 absorption is indistinguishable from the Fraunhofer spectrum, giving the appearance that the plume is confined to a much more restricted field of view. The minimum MSWC value at SHV is ∼0.35, which is well below the saturation limit of 1 (Figure 6a). It is therefore not necessary to consider the differential MSWC between spectra. Figure 7 shows a maximum column density of ∼8.5 · 10 17 molec/cm 2 , as indicated by iFit. The corresponding 1-minimum MSWC is ∼0.35, which, according to the analysis of the reference spectra (Figure 6a), corresponds to ∼340 ppm·m or 8.5 · 10 17 molec/cm 2 (assuming 1 ppm·m ≈ 2.5 · 10 15 molec/cm 2 at 20 °C and 1 atm, [50]) and implies that the minimum MSWC serves as a reliable proxy for estimating the SO 2 absorption.

3.2. Masaya Volcano

We plot the MSWC for spectra recorded at Masaya volcano on 14 March 2019 at 14:17 UTC, which reveal distinct low coherence signals (Figure 8). The corresponding analysis for the instrument scan at 19:41 UTC can be found in Supplementary Material S3 (Figure S5). Notably, both of these instrument scans exhibit the characteristic signal of SO 2 absorption. In the scan conducted at 14:17 UTC, the SO 2 absorption signal becomes apparent at 10° from zenith, peaking at ∼25° and again at ∼80° from the zenith, where large areas of the extraction window have an MSWC value of 0 (Figure 8). Although we might expect changes in atmospheric conditions to influence the MSWC, we observe a zone of low coherence centered at 310 nm (Figure 8). This zone of low coherence is limited to the spatial frequency scales which correspond to SO 2 absorption (Figure 1b), rather than indiscriminate changes in the MSWC. We intentionally depict the MSWC for wavelength and spatial frequency ranges that are broader than the extraction window, to demonstrate that the spectra otherwise remain highly correlated in the spatial frequency domain. Since the minimum MSWC in the extraction window reaches 0, we compare both the minimum MSWC as well as the differential MSWC, from both instrument scans, to the normalized SO 2 fit coefficients derived using DOAS (Figure 9). SCDs of SO 2 obtained by DOAS use the ‘sky’ spectrum recorded at the zenith as the Fraunhofer reference and a variable wavelength fitting routine to avoid saturation at high SO 2 concentrations. This involves shifting the retrieval window to longer wavelengths so that SO 2 is evaluated at optical depths below 5% [51]. The trend in the MSWC for spectra recorded at Masaya volcano appears to compare well with SO 2 SCDs obtained by DOAS. We discarded spectra with elevation angles greater than −80° from the zenith, since the DOAS analyses revealed an obstructed field of view in the first two measurement spectra (elevation angles −90 and −86°), resulting in low MSWC values (Figure 9a,b). Minimum MSWC values in the 14:17 UTC instrument scan correspond well with DOAS-derived SCDs of SO 2 . However, the ‘saturation effect’ is evident in spectra at scan elevation angles exceeding 65° from the zenith. Based on the MSWC of spectra obtained from gas cells with a known SO 2 concentration, we anticipate this ‘saturation effect’ to occur at ∼3 · 10 18 molec/cm 2 of SO 2 (assuming 1 ppm·m ≈ 2.5 · 10 15 molec/cm 2 at 20 °C and 1 atm [50]), which is reflected in the SO 2 SCDs returned by DOAS (Figure 9a). The differential MSWC tracks the relative absorption by SO 2 for SCDs in the order of several 10 18 molec/cm 2 (Figure 9c). The maximum differential MSWC is 640 (Figure 9c), which, based on the analysis of the reference spectra, suggests ∼1025 ppm·m (Figure 6b) or ∼2.6 × 10 18 molec/cm 2 [50], suggesting that the MSWC may be used as a robust means to estimate column densities of volcanic SO 2 . While the MSWC values derived from analyzing the instrument scan at 19:41 UTC align closely with DOAS-determined SO 2 SCDs, this is not the case for the relative changes in MSWC (Figure 9b,d). In the 14:17 UTC scan, neither the reference spectra employed for the MSWC determination (at −61° from the zenith) nor the ‘sky’ spectrum used in DOAS analyses appear to contain the signature of the volcanic plume; this seems not to be the case for the 19:41 UTC scan. The DOAS-determined SCDs of SO 2 are normalized DOAS fit coefficients determined using a ‘sky’ spectrum recorded at zenith. To retrieve the MSWC, we used the spectrum recorded at an elevation angle −61° as the reference; therefore, any differential SO 2 absorption between the two respective reference spectra will result in discrepancies between the ‘plume profiles’ presented in Figure 9. We note that for spectra which appear not to contain the signature of the volcanic plume, there is very little variation in the MSWC returned, implying that the spectrum captured at −61° from the zenith serves as an appropriate reference.

4. Discussion

Wavelet coherence provides a measure of correlation between two spectra in the wavelength–spatial frequency domain. The depth of the differential SO 2 absorption lines increases proportionally with the concentration of SO 2 , and these absorption features cause deviations in the otherwise uniform spatial frequencies that characterize UV spectra of scattered sunlight. The MSWC enables us to visualize these changes as a function of spatial frequency and wavelength, and therefore enables us to isolate the MSWC which corresponds to absorption by SO 2 . When SO 2 is present in the light path at concentrations of several 10 17 molec/cm 2 , the reduction in the MSWC (between 310.0 and 326.8 nm and spatial frequencies of 1 to 4 · 10 3 cycles/ λ ) surpasses any changes observed in the MSWC between ’clear-sky’ spectra. The minimum MSWC may therefore be used to track relative changes in SO 2 absorption. When applied to spectra recorded by the NOVAC at Soufriere Hills and Masaya volcanoes, the minimum MSWC provides a good proxy for volcanic SO 2 , comparing well with the relative changes in SCDs obtained using iFit [25] (SHV) and DOAS (Masaya volcano) algorithms (Figure 7 and Figure 9). Although the MSWC provides a measure of the differential absorption due to SO 2 , it does not identify which of the two spectra contains the absorption signature of the volcanic plume. However, we show that in the absence of SO 2 absorption, the MSWC values are >0.9, in the extraction window we consider, and thus suitable reference spectra may be easily inferred, assuming that more than one spectrum in each full instrument scan contains SO 2 at column densities below ∼2–2.5 · 10 17 molec/cm 2 . Minimum MSWC values consistently surpass 0.9 for SO 2 column densities below ∼2 to 2.5 · 10 17 molec/cm 2 , which represents the detection limit of our approach.
There is a clear advantage to using only the minimum MSWC to identify spectra which record the absorption signature of the volcanic plume. We show that the minimum MSWC in the extraction window is consistently centred at 310 nm (Figure 5), where the SO 2 absorption is strongest (Figure 1). As a result, knowledge of the spectrometer’s exact wavelength–channel alignment is not necessary. Although the approach appears to provide a robust comparison with SCDs of SO 2 , it is not yet clear how the MSWC scales with the slant column density of SO 2 . To determine the extent to which the minimum MSWC alone may be used as a proxy for differential SCDs of SO 2 , we plot 1-minimum MSWC against iFit-reported SCDs of SO 2 [25] and those obtained using DOAS [51] (Figure 10). The comparison between SHV SCDs and the scan at 14:17 UTC from Masaya volcano reveals a linear trend between the minimum MSWC and SO 2 SCDs. This is not the case for the Masaya scan at 19:41 UTC, where although there is an apparent linear trend at low SO 2 SCDs up to ∼5 · 10 17 molec/cm 2 , the rest of the data show little correlation (Figure 10a). Despite the good spatial agreement between the datasets (Figure 9b), the poor correlation for the 19:41 UTC scan (Figure 10a) implies differences in the SO 2 absorption recorded in the respective reference spectra. To address this and establish a more constrained relationship, we chose to exclude this particular scan from further evaluation (Supplementary Material S5). To provide a first approximation of the linear trend between the minimum MSWC and SO 2 SCD, we plot the least-square best fit of the relationship between minimum MSWC and SO 2 SCD for the spectra recorded at SHV and the scan recorded at 14:17 UTC at Masaya volcano (Figure 10b). Since we are only concerned with SO 2 SCDs detectable using the minimum MSWC approach, and those below the ‘saturation level’, we excluded SCDs at very low and high SO 2 concentrations. Differences in the trends between the two volcanoes reflect the unquantified errors in the MSWC but also the choice of the reference spectrum. Notably, the iFit approach [25] employs a solar reference spectrum from the literature, in contrast to DOAS-derived SO 2 SCDs that invoke a ‘contamination offset’ which attempts to account for any SO 2 absorption recorded in the ‘sky spectrum.’ The trend illustrated in Figure 10b suggests that the minimum MSWC may be used to retrieve differential SCDs of volcanic SO 2 in the order of ∼3 to 14 · 10 17 molec/cm 2 from UV spectra recorded by the NOVAC. We test the influence of sampling frequency on the MSWC by computing the wavelet coherence between two spectra with the same wavelength range but a reduced number of spectral channels, which suggests that the approach is also applicable to other UV spectrometers which are characterized by lower sampling frequencies (Supplementary Material S6).
As illustrated in Section 2 and demonstrated in Figure 9a, the minimum MSWC is expected to approach 0 when the differential absorption by SO 2 is ∼3 · 10 18 molec/cm 2 (or ∼1000 ppm·m). To approximate the differential SCDs of SO 2 beyond this limit, we use the differential MSWC, which describes the total reduction in coherence within the extraction window. In this case, knowledge of the wavelength–channel alignment, as well as the resolution of the spectrometer, is more important, in order to accurately define the extraction window and exclude changes in the MSWC which are unrelated to SO 2 absorption. Nevertheless, it is worth noting that for large differential SCDs of SO 2 , the MSWC values immediately adjacent to the defined extraction window are unlikely to impact the differential MSWC by any significant amount (e.g., Figure 8). A deviation in the wavelength–channel alignment often occurs due to temperature-induced effects and irregular calibration of ground-based instruments [21,52,53]. For this reason, it is often necessary to first compare the recorded spectra with a solar reference and include a shift parameter in the fitting routine to correct for potential misalignments in the measurement spectrum [21,52]. We use the MATLAB function ‘wavcoherence’ [40] to determine the MSWC between spectra (Section 2). This function also provides the Wavelet Cross-Spectrum (WCS) as a by-product. The WCS describes the localized, relative phase between two signals and is commonly used to determine whether signals in one time series are in-phase with those in another, e.g., [32,54,55]. In our case, the returned WCS offers insight into the phase relationship between the spatial frequencies contained in UV spectra as a function of wavelength, which may be exploited to determine the relative ‘lag’ or shift between measured spectra (Supplementary Material S7).
SCDs of SO 2 obtained using traditional fitting algorithms are highly dependent on the wavelength range used for the analysis; this choice of analysis window can yield differences in the order of several 10 17 molec/cm 2 in SO 2 SCDs [15,25,27,56]. This variability holds significant implications not only for reported SO 2 emission rates but also for determining the relative quantities of SO 2 and halogen oxides [27,57]. To quantify the strong absorption by SO 2 , shorter wavelengths are typically excluded from the retrieval window; however, selecting an optimal wavelength range remains an ongoing challenge for accurately quantifying SO 2 from UV spectra [27,51,56,58]. The choice of retrieval window is often influenced by the expected or measured concentration of SO 2 . In certain instances, the same spectra might undergo multiple evaluations using different wavelength ranges before arriving at a definitive SCD [27,30,57].
In Figure 9, the presented SCDs of SO 2 have been derived through a sophisticated algorithm that shifts the retrieval range to longer wavelengths until SO 2 is evaluated at optical densities <5%, e.g., [51]. The same algorithm was used to determine SO 2 from the reference spectra recorded with gas cells of a known SO 2 concentration [30]. Notably, all DOAS fits encompassed varying lower fit range thresholds: 310 nm (for gas calibration cells containing 0, 107, and 113 ppm·m SO 2 ); 311.97 or 314 nm (for gas calibration cells of 516 ppm·m SO 2 ); 314.33 or 316.27 (for gas calibration cells of 1019 and 1063 ppm·m SO 2 ); and 316.37 or 319.02 (for gas calibration cells of 1526 and 1937 ppm·m SO 2 ). A lower wavelength fit range of 319.02 nm was employed for all spectra recorded with gas calibration cells containing 2080 ppm·m SO 2 . These specific wavelength limits correspond to MSWC values of approximately 0.8 (as indicated in Figure 5). This implies that the MSWC can serve as a valuable tool for selecting suitable wavelength range(s) for SO 2 retrievals from UV spectra. This is demonstrated in Figure 5, whereby gas cell concentrations of ∼2000 ppm·m SO 2 exhibit an increasing trend in MSWC values at ∼310 nm compared to those at ∼1000 ppm·m, implying that the greater narrowband absorption by SO 2 can lead to greater correlation between spectra in the wavelength–spatial frequency domain. Despite this non linearity at ∼310 nm, the extension of the low MSWC zone indicates the possibility to use higher wavelengths in order to quantify the strong absorption by SO 2 (Figure 5). The MSWC not only changes with the wavelength but the increased SO 2 absorption also broadens the spatial frequency of the MSWC signal (Figure 8). This likely results from the widening of absorption bands at high SCDs of SO 2 . Thus, the MSWC could serve as a tool to visualize the limitations of the Beer–Lambert–Bouguer law when applied to the UV remote sensing of volcanic plumes, offering an opportunity to aid the selection of the appropriate wavelength range(s) for SO 2 quantification through traditional methods and also to determine spatial frequency limits when quantifying SO 2 using the spatial frequency of its absorption signature [30].

5. Conclusions

Since the spatial frequencies contained in sky-scattered UV spectra remain largely uniform, relative changes in the amplitude of the narrowband SO 2 absorption structures can be visualized as a region of low coherence. In this study, we established the Magnitude-Squared Wavelet Coherence (MSWC) as a robust indicator of SO 2 absorption. Beyond this threshold, the differential MSWC maintains linearity up to column densities of at least 5 · 10 18 molec/cm 2 . To validate our approach, we compared the relative changes in MSWC derived from NOVAC spectra at Soufriere Hills and Masaya volcanoes with slant column densities (SCDs) of SO 2 determined using the iFit [25] and DOAS [51] algorithms, respectively. Results demonstrated that a straightforward computation of wavelet coherence can provide an independent and objective means to verify results returned by more complex fitting routines. This objectivity could be particularly attractive to non-experts, rather than relying on the visual inspection of fit results. Furthermore, our approach offers an efficient means to identify spectra which contain the distinctive SO 2 absorption signature, and therefore instrument scans which capture a cross section of the volcanic plume. Nonetheless, similar to conventional DOAS algorithms, the selection of a suitable reference spectrum remains necessary to ensure that the MSWC reflects absolute SO 2 quantities. Our method does not require precise knowledge of the spectrometer’s resolution or wavelength–channel assignment but the latter can be found by taking the phase of the wavelet cross spectrum, which is also returned by the algorithm (see Supplementary Material S7). This MSWC-based approach not only serves as a proxy for differential SCDs of SO 2 , but also shows potential for characterizing radiative transfer effects (RTE) which affect measurements of SO 2 by UV remote sensing (Supplementary Material S4). We seek to refine the relationship between MSWC and differential SCDs of SO 2 to determine with what accuracy differential SCDs of SO 2 may be determined from the MSWC alone, offering the potential to eliminate the need for complex fitting algorithms and paving the way for a simple yet accurate method to quantify SO 2 from UV spectra.

Supplementary Materials

The following Supplementary Material can be downloaded at: https://www.mdpi.com/article/10.3390/rs15184532/s1, Supplementary Material S1: Synthetic Spectra; Supplementary Material S2: Scan Elevation Angle; Supplementary Material S3: Results; Supplementary Material S4: Wavelet Coherence of Spectra Recorded at Masaya Volcano; Supplementary Material S5: MSWC and Relationship to SCDs of SO2 Supplementary Material S6: Relationship with spectral resolution; Supplementary Material S7: Phase Shift.

Author Contributions

C.B. provided the initial concept, recorded and analyzed the reference spectra, wrote the code and produced the original manuscript. B.T. and F.C. provided direction for this research and reviewed the manuscript drafts. All authors have read and agreed to the published version of the manuscript.

Funding

This research was supported by the Earth Observatory of Singapore via its funding from the National Research Foundation Singapore and the Singapore Ministry of Education under the Research Centres of Excellence initiative. This work comprises EOS contribution number 521.

Data Availability Statement

UV spectra recorded at the Earth Observatory of Singapore used in this study can be found at https://doi.org/10.21979/N9/SFYGSB. Spectra from the NOVAC network at Masaya belongs to the Instituto Nicaraguense de Estudios Territoriales (INETER) and may be accessed with their permission, according to their internal policies for data administration. A user-friendly MATLAB code is provided at: https://github.com/cbarrington22/Wavcoh (accessed on 24 April 2023) which enables the analysis of UV spectra using the outlined approach, together with the original codes used to produce the results presented in this manuscript.

Acknowledgments

We wish to thank V. Burgos for their assistance recording UV spectra at the Earth Observatory of Singapore and the Instituto Nicaraguense de Estudios Territoriales (INETER) for granting us permission to use spectra acquired at Masaya volcano. Special thanks to C. Kern for providing the synthetic spectra and preforming the DOAS analyses. We thank B. Esse for kindly sharing the iFit results and spectra recorded at Soufriere Hills Volcano, and the Montserrat Volcano Observatory (MVO) for granting us the permission to use this spectra. We would like to thank M. Edmonds and S. Carn for their valuable feedback as well as four anonymous reviewers whose insightful comments and suggestions enhanced the quality of this manuscript.

Conflicts of Interest

The authors declare no conflict of interest.

References

  1. Edmonds, M.; Oppenheimer, C.; Pyle, D.; Herd, R.; Thompson, G. SO2 emissions from Soufrière Hills Volcano and their relationship to conduit permeability, hydrothermal interaction and degassing regime. J. Volcanol. Geotherm. Res. 2003, 124, 23–43. [Google Scholar] [CrossRef]
  2. Aiuppa, A.; Giudice, G.; Gurrieri, S.; Liuzzo, M.; Burton, M.; Caltabiano, T. Total volatile flux from Mount Etna. Geophys. Res. Lett. 2008, 35, L24302. [Google Scholar] [CrossRef]
  3. Spilliaert, N.; Allard, P.; Métrich, N.; Sobolev, A. Melt inclusion record of the conditions of ascent, degassing, and extrusion of volatile-rich alkali basalt during the powerful 2002 flank eruption of Mount Etna (Italy). J. Geophys. Res. Solid Earth 2006, 111, B04203. [Google Scholar] [CrossRef]
  4. Sutton, A.; Elias, T.; Gerlach, T.; Stokes, J. Implications for eruptive processes as indicated by sulfur dioxide emissions from Kılauea Volcano, Hawaii, 1979–1997. J. Volcanol. Geotherm. Res. 2001, 108, 283–302. [Google Scholar] [CrossRef]
  5. Kazahaya, K.; Shinohara, H.; Uto, K.; Odai, M.; Nakahori, Y.; Mori, H. Gigantic SO2 emission from Miyakejima volcano, Japan, caused by caldera collapse. Geology 2004, 32, 425–428. [Google Scholar] [CrossRef]
  6. Burton, M.; Caltabiano, T.; Murè, F.; Salerno, G.; Randazzo, D. SO2 flux from Stromboli during the 2007 eruption: Results from the FLAME network and traverse measurements. J. Volcanol. Geotherm. Res. 2009, 182, 214–220. [Google Scholar] [CrossRef]
  7. Hidalgo, S.; Battaglia, J.; Arellano, S.; Sierra, D.; Bernard, B.; Parra, R.; Kelly, P.; Dinger, F.; Barrington, C.; Samaniego, P. Evolution of the 2015 Cotopaxi eruption revealed by combined geochemical and seismic observations. Geochem. Geophys. Geosyst. 2018, 19, 2087–2108. [Google Scholar] [CrossRef]
  8. Battaglia, J.; Hidalgo, S.; Bernard, B.; Steele, A.; Arellano, S.; Acuña, K. Autopsy of an eruptive phase of Tungurahua volcano (Ecuador) through coupling of seismo-acoustic and SO2 recordings with ash characteristics. Earth Planet. Sci. Lett. 2019, 511, 223–232. [Google Scholar] [CrossRef]
  9. Edmonds, M.; Herd, R.; Galle, B.; Oppenheimer, C. Automated, high time-resolution measurements of SO2 flux at Soufri re Hills Volcano, Montserrat. Bull. Volcanol. 2003, 65, 578–586. [Google Scholar] [CrossRef]
  10. McGonigle, A.; Oppenheimer, C.; Hayes, A.; Galle, B.; Edmonds, M.; Caltabiano, T. Sulphur dioxide fluxes from Mount Etna, Vulcano, and Stromboli measured with an automated scanning ultraviolet spectrometer. J. Geophys. Res. Solid Earth 2003, 108, 2455. [Google Scholar] [CrossRef]
  11. Galle, B.; Johansson, M.; Rivera, C.; Zhang, Y.; Kihlman, M.; Kern, C.; Lehmann, T.; Platt, U.; Arellano, S.; Hidalgo, S. Network for Observation of Volcanic and Atmospheric Change (NOVAC)—A global network for volcanic gas monitoring: Network layout and instrument description. J. Geophys. Res. 2010, 115, 05304. [Google Scholar] [CrossRef]
  12. Wilkes, T.; Pering, T.; McGonigle, A.; Willmott, J.; Bryant, R.; Smalley, A. The PiSpec: A Low-Cost, 3D-Printed Spectrometer for Measuring Volcanic SO2 Emission Rates. Front. Earth Sci. 2019, 7, 65. [Google Scholar] [CrossRef]
  13. McGonigle, A. Measurement of volcanic SO2 fluxes with differential optical absorption spectroscopy. J. Volcanol. Geotherm. Res. 2007, 162, 111–122. [Google Scholar] [CrossRef]
  14. Arellano, S.; Galle, B.; Apaza, F.; Avard, G.; Barrington, C.; Bobrowski, N.; Bucarey, C.; Burbano, V.; Burton, M.; Chacón, Z.; et al. Synoptic analysis of a decade of daily measurements of SO2; emission in the troposphere from volcanoes of the global ground-based Network for Observation of Volcanic and Atmospheric Change. Earth Syst. Sci. Data 2021, 13, 1167–1188. [Google Scholar] [CrossRef]
  15. Kern, C.; Deutschmann, T.; Vogel, L.; Wöhrbach, M.; Wagner, T.; Platt, U. Radiative transfer corrections for accurate spectroscopic measurements of volcanic gas emissions. Bull. Volcanol. 2010, 72, 233–247. [Google Scholar] [CrossRef]
  16. Mori, T.; Mori, T.; Kazahaya, K.; Ohwada, M.; Hirabayashi, J.; Yoshikawa, S. Effect of UV scattering on SO2 emission rate measurements. Geophys. Res. Lett. 2006, 33, 17315. [Google Scholar] [CrossRef]
  17. Varnam, M.; Burton, M.; Esse, B.; Kazahaya, R.; Salerno, G.; Caltabiano, T.; Ibarra, M. Quantifying Light Dilution in Ultraviolet Spectroscopic Measurements of Volcanic SO2 Using Dual-Band Modeling. Front. Earth Sci. 2020, 8, 528753. [Google Scholar] [CrossRef]
  18. Beer. Bestimmung der Absorption des Rothen Lichts in Farbigen Flüssigkeiten. Ann. Der Phys. 1852, 162, 78–88. [Google Scholar] [CrossRef]
  19. Bouguer, P. Essai d’Optique, sur la Gradation de la Lumière; Claude Jombert: Paris, France, 1729. [Google Scholar]
  20. Lambert, I. Photometria Sive de Mensura et Gradibus Luminis, Colorum et Umbrae; Eberhard Klett: Augsberg, Germany, 1760. [Google Scholar] [CrossRef]
  21. Platt, U.; Stutz, J. Differential Optical Absorption Spectroscopy: Principles and Applications; Springer: Berlin/Heidelberg, Germany, 2008. [Google Scholar]
  22. Bogumil, K.; Orphal, J.; Homann, T.; Voigt, S.; Spietz, P.; Fleischmann, O.C.; Vogel, A.; Hartmann, M.; Kromminga, H.; Bovensmann, H.; et al. Measurements of molecular absorption spectra with the SCIAMACHY pre-flight model: Instrument characterization and reference data for atmospheric remote-sensing in the 230–2380 nm region. J. Photochem. Photobiol. A Chem. 2003, 157, 167–184. [Google Scholar] [CrossRef]
  23. Kern, C.; Deutschmann, T.; Werner, C.; Sutton, A.; Elias, T.; Kelly, P. Improving the accuracy of SO2 column densities and emission rates obtained from upward-looking UV-spectroscopic measurements of volcanic plumes by taking realistic radiative transfer into account. J. Geophys. Res. Atmos. 2012, 117, D20302. [Google Scholar] [CrossRef]
  24. Davis, Z.Y.W.; McLaren, R. Recommendations for spectral fitting of SO2 from miniature multi-axis differential optical absorption spectroscopy (MAX-DOAS) measurements. Atmos. Meas. Tech. 2020, 13, 3993–4008. [Google Scholar] [CrossRef]
  25. Esse, B.; Burton, M.; Varnam, M.; Kazahaya, R.; Salerno, G. iFit: A simple method for measuring volcanic SO2 without a measured Fraunhofer reference spectrum. J. Volcanol. Geotherm. Res. 2020, 402, 107000. [Google Scholar] [CrossRef]
  26. Lübcke, P.; Bobrowski, N.; Arellano, S.; Galle, B.; Garzón, G.; Vogel, L. BrO/SO2 molar ratios from scanning DOAS measurements in the NOVAC network. Solid Earth 2014, 5, 409–424. [Google Scholar] [CrossRef]
  27. Vogel, L.; Sihler, H.; Lampel, J.; Wagner, T.; Platt, U. Retrieval interval mapping: A tool to visualize the impact of the spectral retrieval range on differential optical absorption spectroscopy evaluations. Atmos. Meas. Tech. 2013, 6, 275–299. [Google Scholar] [CrossRef]
  28. Donovan, A.; Tsanev, V.; Oppenheimer, C.; Edmonds, M. Reactive halogens (BrO and OClO) detected in the plume of Soufrière Hills Volcano during an eruption hiatus. Geochem. Geophys. Geosyst. 2014, 15, 3346–3363. [Google Scholar] [CrossRef]
  29. Gliß, J.; Bobrowski, N.; Vogel, L.; Pöhler, D.; Platt, U. OClO and BrO observations in the volcanic plume of Mt. Etna—Implications on the chemistry of chlorine and bromine species in volcanic plumes. Atmos. Chem. Phys. 2015, 15, 5659–5681. [Google Scholar] [CrossRef]
  30. Barrington, C.; Costa Rodriguez, F.; Taisne, B. Exploiting the Frequency Signature of Trace Gas Absorption: A New Model to Quantify SO2 from UV Spectra of Volcanic Plumes. In AGU Fall Meeting Abstracts; AGU Fall Meeting: New Orleans, LA, USA, 2021; Volume 2021, p. V41A-03. [Google Scholar]
  31. Sadiki, A.T.; Kyambikwa, A.M.; Namogo, D.B.; Diomi, L.N.; Munguiko, O.M.; Balezi, G.M.; Sifa, L.L.; Nzamu, S.M.; Mashagiro, N.; Balagizi, C.M.; et al. Analysis of the Seismicity Recorded before the May 22, 2021 Eruption of Nyiragongo Volcano, Democratic Republic of the Congo. J. Volcanol. Seismol. 2023, 17, 246–257. [Google Scholar] [CrossRef]
  32. Grinsted, A.; Moore, J.C.; Jevrejeva, S. Application of the cross wavelet transform and wavelet coherence to geophysical time series. Nonlinear Process. Geophys. 2004, 11, 561–566. [Google Scholar] [CrossRef]
  33. Ghaderpour, E.; Mazzanti, P.; Mugnozza, G.S.; Bozzano, F. Coherency and phase delay analyses between land cover and climate across Italy via the least-squares wavelet software. Int. J. Appl. Earth Obs. Geoinf. 2023, 118, 103241. [Google Scholar] [CrossRef]
  34. Zhou, Z.; Liu, S.; Ding, Y.; Fu, Q.; Wang, Y.; Cai, H.; Shi, H. Assessing the responses of vegetation to meteorological drought and its influencing factors with partial wavelet coherence analysis. J. Environ. Manag. 2022, 311, 114879. [Google Scholar] [CrossRef]
  35. Sarfraz, M.; Naseem, S.; Mohsin, M.; Bhutta, M.S. Recent analytical tools to mitigate carbon-based pollution: New insights by using wavelet coherence for a sustainable environment. Environ. Res. 2022, 212, 113074. [Google Scholar] [CrossRef] [PubMed]
  36. Wang, Y.; Liu, S.; Chen, J.; Zhou, Z.; Shi, H. Investigating the spatiotemporal variations of extreme rainfall and its potential driving factors with improved partial wavelet coherence. Front. Environ. Sci. 2022, 10, 951468. [Google Scholar] [CrossRef]
  37. Fattah, M.A.; Morshed, S.R.; Kafy, A.A.; Rahaman, Z.A.; Rahman, M.T. Wavelet coherence analysis of PM2. 5 variability in response to meteorological changes in South Asian cities. Atmos. Pollut. Res. 2023, 14, 101737. [Google Scholar] [CrossRef]
  38. Wang, T.; Song, C.; Chen, X. Clarifying the relationship between annual maximum daily precipitation and climate variables by wavelet analysis. Atmos. Res. 2023, 2023, 106981. [Google Scholar] [CrossRef]
  39. Kraus, S. DOASIS: A Framework Design for DOAS; Shaker: Duren, Germany, 2006. [Google Scholar]
  40. MathWorks. MATLAB; The MathWorks Inc.: Natick, MA, USA, 2021. [Google Scholar]
  41. Gorshelev, V.; Serdyuchenko, A.; Weber, M.; Chehade, W.; Burrows, J.P. High spectral resolution ozone absorption cross-sections – Part 1: Measurements, data analysis and comparison with previous measurements around 293 K. Atmos. Meas. Tech. 2014, 7, 609–624. [Google Scholar] [CrossRef]
  42. Ocean Insight. OceanView; Ocean Insight: Orlando, FL, USA, 2019. [Google Scholar]
  43. Vandaele, A.; Hermans, C.; Fally, S. Fourier transform measurements of SO2 absorption cross sections: II. J. Quant. Spectrosc. Radiat. Transfer. 2009, 110, 2115–2126. [Google Scholar] [CrossRef]
  44. Chance, K.; Kurucz, R. An improved high-resolution solar reference spectrum for earth’s atmosphere measurements in the ultraviolet, visible, and near infrared. J. Quant. Spectrosc. Radiat. Transfer. 2010, 111, 1289–1295. [Google Scholar] [CrossRef]
  45. Dinger, F.; Bobrowski, N.; Warnach, S.; Bredemeyer, S.; Hidalgo, S.; Arellano, S.; Galle, B.; Platt, U.; Wagner, T. Periodicity in the BrO/SO2 molar ratios in the volcanic gas plume of Cotopaxi and its correlation with the Earth tides during the eruption in 2015. J. Geophys. Res. Solid Earth 2018, 9, 247–266. [Google Scholar] [CrossRef]
  46. Warnach, S.; Bobrowski, N.; Hidalgo, S.; Arellano, S.; Sihler, H.; Dinger, F.; Lübcke, P.; Battaglia, J.; Steele, A.; Galle, B.; et al. Variation of the BrO/SO2 molar ratio in the plume of Tungurahua Volcano between 2007 and 2017 and its relationship to volcanic activity. Front. Earth Sci. 2019, 7, 132. [Google Scholar] [CrossRef]
  47. NOVAC Project. NOVAC Database. 2020. Available online: https://novac.chalmers.se/ (accessed on 24 April 2023).
  48. Lübcke, P.; Lampel, J.; Arellano, S.; Bobrowski, N.; Dinger, F.; Galle, B.; Garzón, G.; Hidalgo, S.; Chacón Ortiz, Z.; Vogel, L.; et al. Retrieval of absolute SO2 column amounts from scattered-light spectra: Implications for the evaluation of data from automated DOAS networks. Atmos. Meas. Tech. 2016, 9, 5677–5698. [Google Scholar] [CrossRef]
  49. Dinger, F.; Kleinbek, T.; Dörner, S.; Bobrowski, N.; Platt, U.; Wagner, T.; Ibarra, M.; Espinoza, E. SO2 and BrO emissions of Masaya Volcano from 2014–2020. Atmos. Chem. Phys. 2021, 21, 9367–9404. [Google Scholar] [CrossRef]
  50. Vaughan Chair, W.M. Remote Sensing Terminology. J. Air Waste Manag. Assoc. 1991, 41, 1489–1493. [Google Scholar] [CrossRef]
  51. Kern, C. Spectroscopic Measurements of Volcanic Gas Emissions in the Ultra-Violet Wavelength Region. Doctoral Dissertation, Heidelberg University, Heidelberg, Germany, 2009. [Google Scholar]
  52. Platt, U.; Marquard, L.; Wagner, T.; Perner, D. Corrections for zenith scattered light DOAS. Geophys. Res. Lett. 1997, 24, 1759–1762. [Google Scholar] [CrossRef]
  53. Beirle, S.; Sihler, H.; Wagner, T. Linearisation of the effects of spectral shift and stretch in DOAS analysis. Atmos. Meas. Tech. 2013, 6, 661–675. [Google Scholar] [CrossRef]
  54. Whitcher, B.; Guttorp, P.; Percival, D.B. Wavelet analysis of covariance with application to atmospheric time series. J. Geophys. Res. Atmos. 2000, 105, 14941–14962. [Google Scholar] [CrossRef]
  55. Stockwell, R.G.; Lowe, R.P.; Mansinha, L. Localized cross-spectral analysis with phase-corrected wavelets. In Wavelet Applications III; Szu, H.H., Ed.; SPIE: Bellingham, WA, USA, 1996; Volume 2762, pp. 557–564. [Google Scholar] [CrossRef]
  56. Bobrowski, N.; Kern, C.; Platt, U.; Hörmann, C.; Wagner, T. Novel SO2 spectral evaluation scheme using the 360–390 nm wavelength range. Atmos. Meas. Tech. 2010, 3, 879–891. [Google Scholar] [CrossRef]
  57. Fickel, M.; Delgado Granados, H. On the use of different spectral windows in DOAS evaluations: Effects on the estimation of SO2 emission rate and mixing ratios during strong emission of Popocatépetl volcano. Chem. Geol. 2017, 462, 67–73. [Google Scholar] [CrossRef]
  58. Theys, N.; De Smedt, I.; van Gent, J.; Danckaert, T.; Wang, T.; Hendrick, F.; Stavrakou, T.; Bauduin, S.; Clarisse, L.; Li, C.; et al. Sulfur dioxide vertical column DOAS retrievals from the Ozone Monitoring Instrument: Global observations and comparison to ground-based and satellite data. J. Geophys. Res. Atmos. 2015, 120, 2470–2491. [Google Scholar] [CrossRef]
Figure 2. The narrowband structure of sky-scattered UV spectra is dominated by strong Fraunhofer lines. (a) Two Fraunhofer spectra recorded under the same measurement conditions at the Earth Observatory of Singapore (EOS) on 27 January 2022 at 10.15 am (the overlapping black and red lines). Both spectra were recorded with a zenith viewing angle and show (b) small differences in intensity. (c) The Magnitude-Squared Wavelet Coherence (MSWC) between the two spectra, where 1 indicates that the two spectra are well-correlated. The MSWC is obtained using ‘wavcoherence’ function in MATLAB [40] using F s input (0.07 λ /channel) and default analytic Morlet wavelet. Data occupying the cone of influence (which is potentially affected by edge-effect artifacts) has been removed. Both spectra were acquired using OceanView [42] and recorded using a FLAME-S UV spectrometer with ILX-511B Sony detector, combined with 2400 lines/mm grating and 50 µm slit (∼0.5 nm FWHM—full width at half maximum).
Remotesensing 15 04532 g002
Figure 3. Absorption lines due to the presence of SO 2 result in a change in the spatial frequencies contained in the Fraunhofer spectra. (a) A ‘clear-sky’ Fraunhofer spectrum recorded with a zenith viewing angle (black) shown in Figure 2 and a spectrum recorded with a gas cell with 2080 ppm·m of SO 2 in its field of view (red). Both spectra were recorded at EOS on 27 January 2022 at 10.15 am using a FLAME-S UV spectrometer with ILX-511B Sony detector, combined with 2400 lines/mm grating and 50 µm slit (∼0.5 nm FWHM) and acquired using OceanView [42]. (b) The spectra have different measured intensities which may be viewed as a (c) reduction in the MSWC between the two spectra. The MSWC is obtained using ‘wavcoherence’ function in MATLAB [40] using F s input (0.07 λ /channel) and default analytic Morlet wavelet. Data occupying the cone of influence have been removed.
Remotesensing 15 04532 g003
Figure 4. The MSWC between a ‘clear-sky’ Fraunhofer spectrum and spectra recorded with a gas cell of known SO 2 concentration in the field of view. Gas cell concentration is displayed on top of each subplot. All spectra were recorded with a zenith viewing angle. The MSWC was obtained using ‘wavcoherence’ function in MATLAB [40] using F s input (0.07 λ /channel) and default analytic Morlet wavelet. Data occupying the cone of influence has been removed. The white box indicates the fixed extraction window referred to in subsequent sections and plotted in Figure 5.
Remotesensing 15 04532 g004
Figure 5. The MSWC between a ‘clear-sky’ Fraunhofer spectrum and spectra recorded with gas cell of increasing SO 2 concentration in the field of view. The MSWC is plotted for the extraction window shown in Figure 4 which has a wavelength range of 310.0 to 326.8 nm and spatial frequency range of 1 · 10 3 to 4 · 10 3 cycles/ λ . Gas cell concentration is displayed above each subplot. All spectra were recorded with a zenith viewing angle. The mean MSWC between two ‘clear-sky’ Fraunhofer spectra (top-left panel) is 0.998 (standard deviation 8.23 · 10 4 ) and the sum of the MSWC is 5.44 · 10 3 .
Remotesensing 15 04532 g005
Figure 6. MSWC appears proportional to SO 2 absorption. (a) The minimum MSWC subtracted from one and (b) the differential MSWC, against gas cell SO 2 concentration for spectra recorded at EOS on 27 January 2022 at 10.15 am using a FLAME-S UV spectrometer with ILX-511B Sony detector, combined with 2400 lines/mm grating and 50 µm slit (∼0.5 nm FWHM) and acquired using OceanView [42]. (c) The minimum MSWC subtracted from one and (d) the differential MSWC, against the assumed column density of synthetic spectra. The column densities of the synthetic spectra are converted to ppm·m, where ppm·m ≈ 2.5 · 10 15 molec/cm 2 at 20 °C and 1 atm. The differential MSWC is calculated as the absolute value of the total MSWC after subtracting the sum of MSWC between two ‘clear-sky’ Fraunhofer spectra (5.44 · 10 3 for recorded spectra and 5.45 · 10 3 for synthetic spectra). The horizontal error bars represent gas cell concentration uncertainties (±10% relative). In panels (a,c), the red dashed line marks the maximum value that is possible, where the minimum MSWC equals 0, referred to as the ‘saturation limit’. A dotted line in panel (b) represents the least-squares line, derived using the MATLAB function ‘isline’ [40]. This line is omitted from panel (d) due to the observed nonlinear trend at high SO 2 column densities.
Remotesensing 15 04532 g006
Figure 7. Minimum MSWC from spectra recorded at SHV on 16 May 2019 at 14:28 UTC. One minus the minimum MSWC in the extraction window is displayed and compared to the SCD of SO 2 determined by iFit for (a) all scan elevation angles and (b) scan elevation angles −79 to 90° from zenith. Note the change in y-axis limits between panels (a,b). SCDs of SO 2 are reported in standard units of molec/cm 2 , where 1 ppm·m ≈ 2.5 · 10 15 molec/cm 2 at 20 °C and 1 atm [50]. The solid vertical line in panel (a) indicates the cut off scan elevation angles shown in panel (b), and the dotted line in panel (a) indicates the elevation angle of the reference spectrum used. Vertical error bars indicate SO 2 fit error [25]. iFit data were kindly provided by Dr. Ben Esse. The MSWC for spectra recorded at scan angles between −90 and 90° from zenith are included in Supplementary Material S3.
Remotesensing 15 04532 g007
Figure 8. Wavelet coherence of spectra recorded at Masaya volcano on 14 March 2019 at 14:17 UTC. The MSWC was computed using the spectrum recorded at −61° from zenith as the reference (not depicted). White colour signifies an MSWC > 0.9, denoting high coherence between the measurement and reference spectra. Dark red shading indicates regions of low coherence and includes changes in the absorption signal due to SO 2 . Black denotes an MSWC of 0, implying no correlation between the two spectra in the wavelength–spatial frequency domain. The MSWC is shown for a greater wavelength and spatial frequency range compared to the extraction window, marked by the dotted black line in the initial plot. The scan elevation angle corresponding to each spectrum is indicated above its respective plot. Data from scan elevation angles of 7° and 90° from zenith are shown. We assign wavelength information using an Hg spectrum recorded with the same spectrometer. Further details, including MSWC values for all spectra recorded in the 14:17 UTC instrument scan at Masaya across various wavelength ranges and spatial frequencies, can be found in Supplementary Material S4.
Remotesensing 15 04532 g008
Figure 9. MSWC from spectra recorded at Masaya volcano on 14 March 2019 at (a,c) 14:17 UTC and (b,d) 19:41 UTC. The plot displays one minus the minimum MSWC within the extraction window, compared to the normalized SCD of SO 2 as determined by DOAS for (a,b) all scan elevation angles. SCDs of SO 2 are expressed in standard units of molec/cm 2 , where 1 ppm·m ≈ 2.5 · 10 15 molec/cm 2 at 20 °C and 1 atm [50]. (c,d) The differential MSWC is shown for scan elevation angles −82 to 90° from zenith. The differential MSWC is defined as the absolute total value of the MSWC within the extraction window, after subtracting the maximum sum of MSWC returned by the analysis. The solid vertical line in panels (a,b) indicate the cutoff scan elevation angles as shown in panels (c,d), while the dotted vertical lines in panels (a,b) indicate the elevation angle of the reference spectrum. Vertical error bars represent the SO2 fit error [21]. The DOAS analysis, kindly performed by Dr. Christoph Kern, identified that the field of view was obstructed in the first two spectra (at elevation angles −90 and −86°), and thus they have been excluded from the DOAS results.
Remotesensing 15 04532 g009
Figure 10. Relationship between the minimum MSWC and SCD of SO2. (a) One minus the minimum MSWC in the extraction window is displayed, compared to the SCD of SO2 determined by iFit at SHV and normalized SCD of SO2 at Masaya volcano determined by DOAS (taken from Figure 7b and Figure 9a,b). Vertical lines indicate the SO2 SCD determined by iFit (red, SHV) and DOAS (blue and cyan, Masaya) for the reference spectrum used to determine the wavelet coherence (spectra at elevation angle −61° from zenith). (b) The linear part of the relationship between the MSWC and SCD of SO2 is shown in panel (a). Trend lines represent the linear model (dotted line) and estimate of the 95% prediction level (solid lines) determined using MATLAB’s ‘polyfit’ and ‘polyval’ functions [40]. For selection criteria and the linear model’s estimate of 95% prediction level for Masaya scan at 19:41 UTC, please refer to Supplementary Material S5. Horizontal error bars indicate SO2 fit error from iFit and DOAS, respectively.
Remotesensing 15 04532 g010
Disclaimer/Publisher’s Note: The statements, opinions and data contained in all publications are solely those of the individual author(s) and contributor(s) and not of MDPI and/or the editor(s). MDPI and/or the editor(s) disclaim responsibility for any injury to people or property resulting from any ideas, methods, instructions or products referred to in the content.

