


Exploiting Remote Sensing Imagery for Vehicle Detection and Classification Using an Artificial Intelligence Technique
 , and
, and
Abstract
:1. Introduction
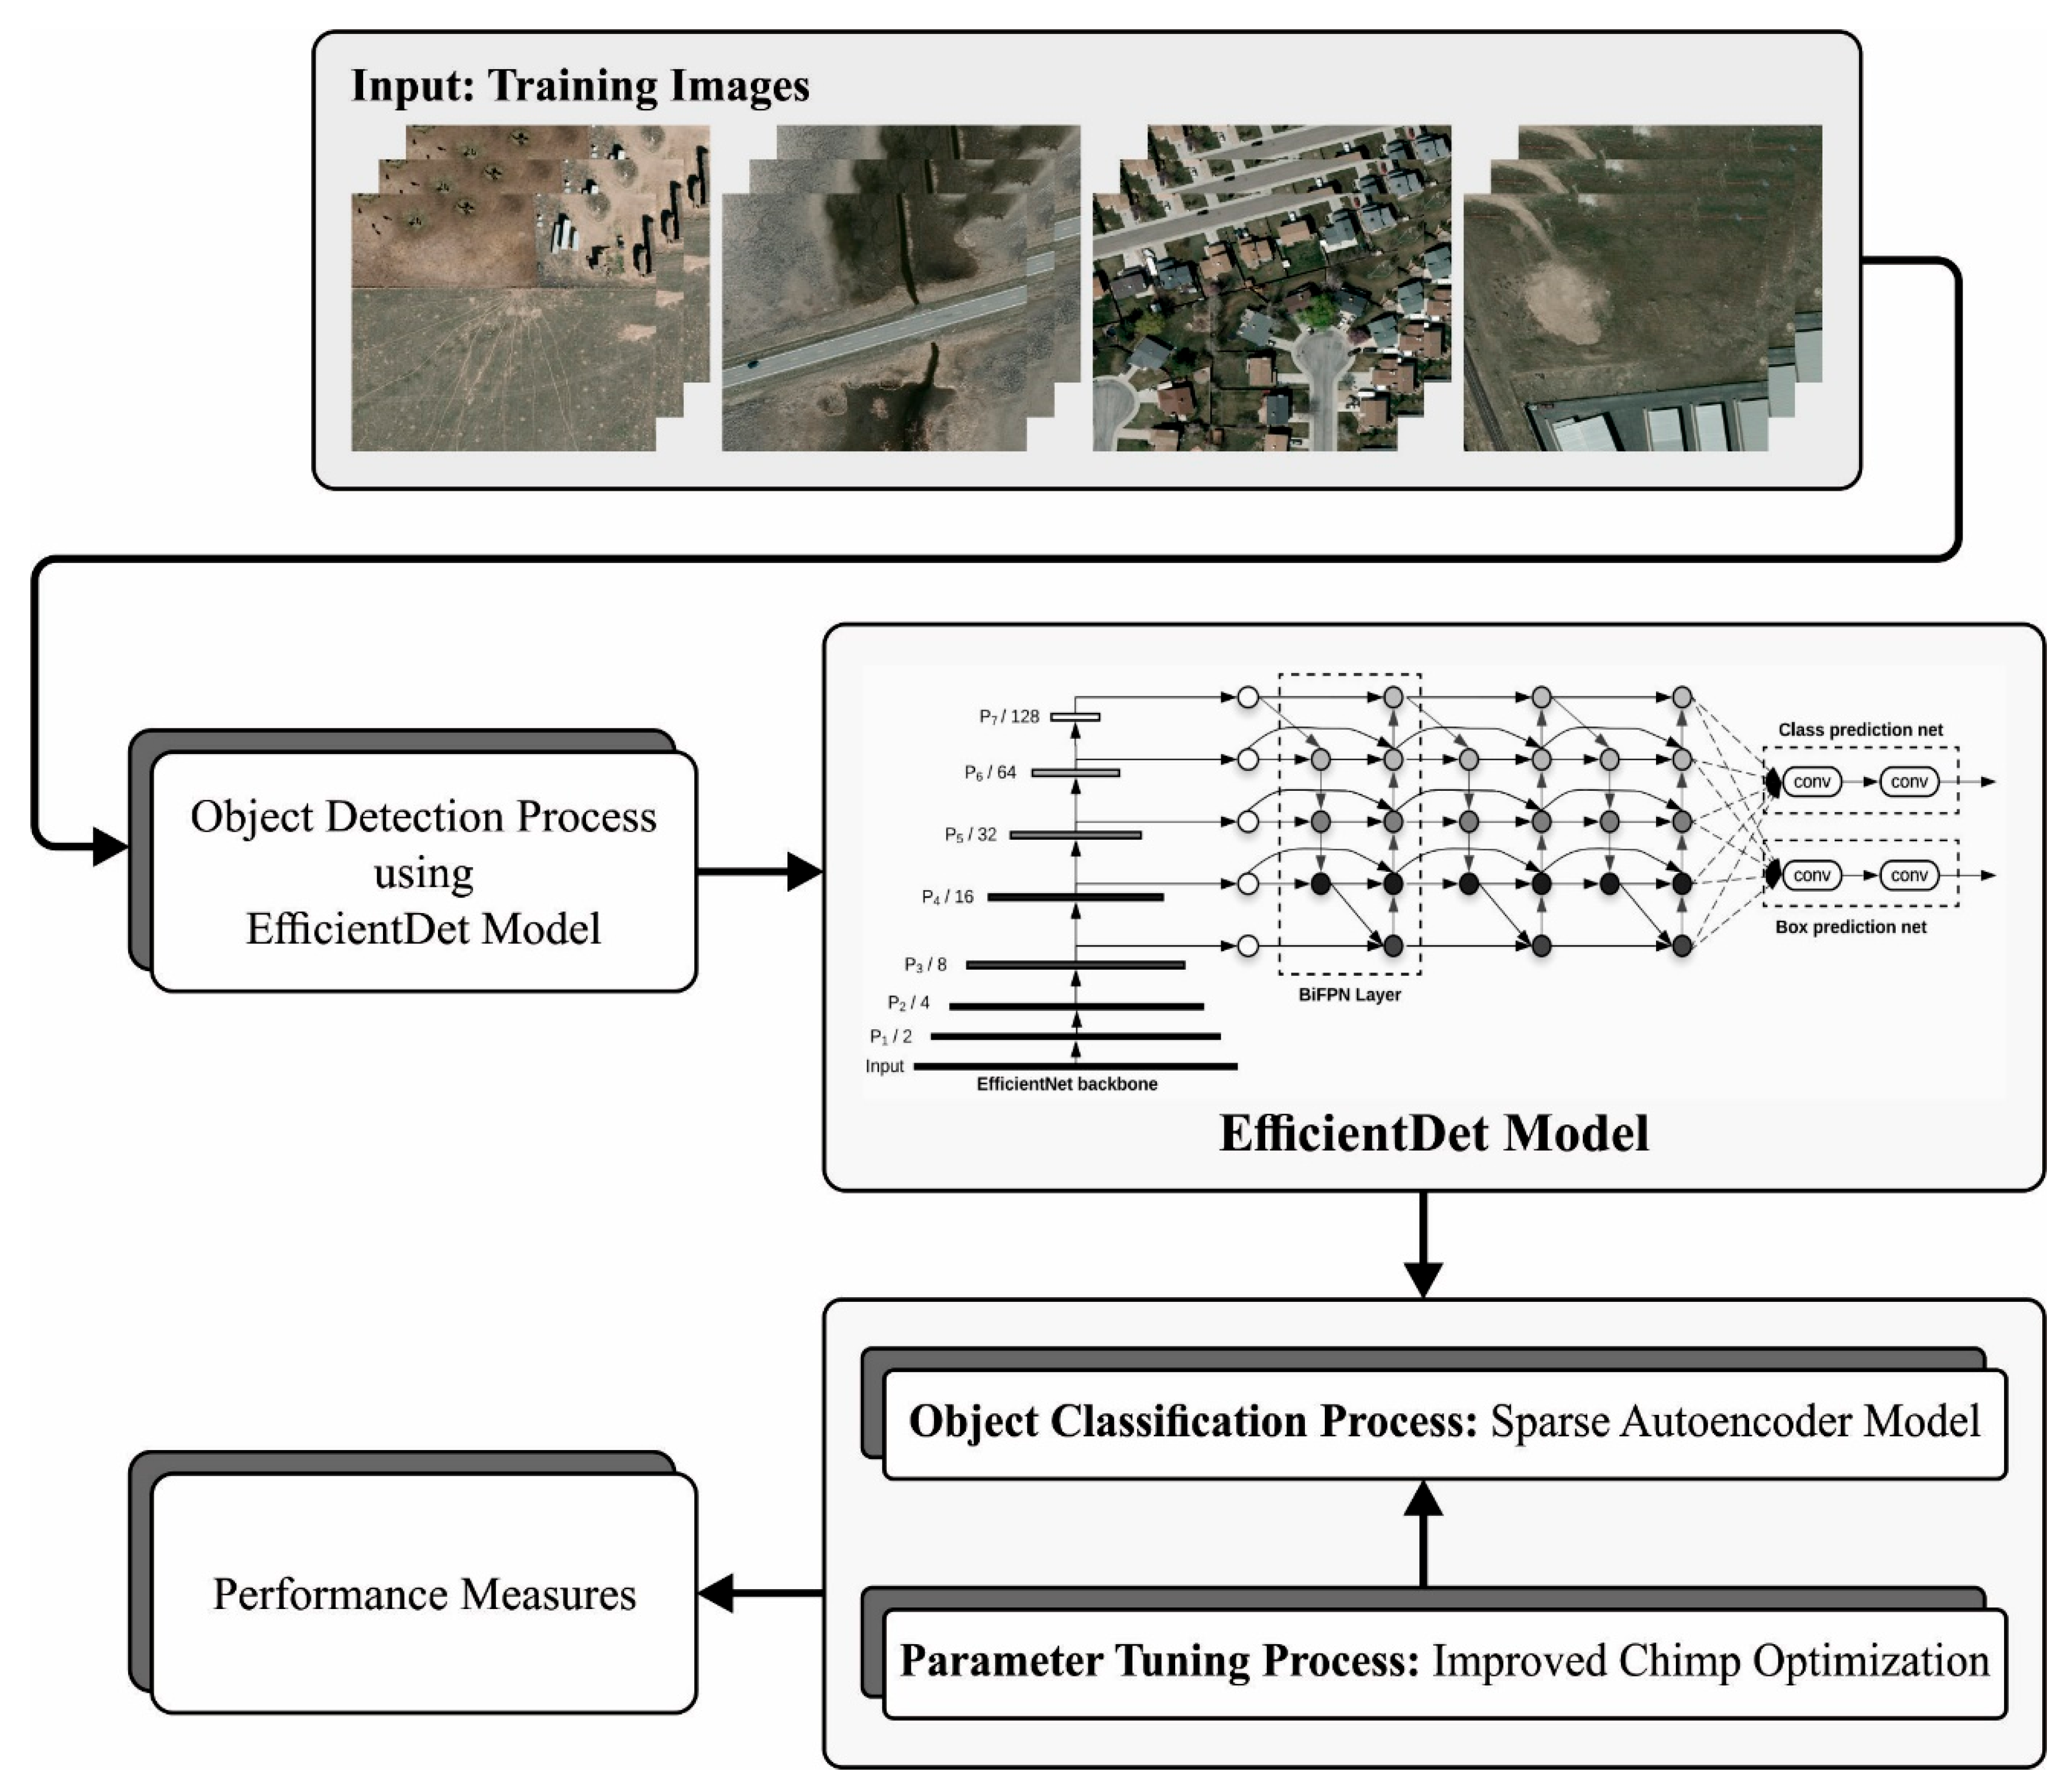
- An intelligent ICOA-DLVDC technique comprising an EfficientDet object detector, SAE classification, and ICOA-based hyperparameter tuning for RSI has been presented, and to the best of our knowledge, the proposed model will not be found in the literature;
- SAE is able to learn informative and discriminative features with the reduction of the data dimensionality, which is helpful in handling large and complex remote sensing datasets;
- The integration of the EfficientNet object detector with SAE classification can significantly accomplish enhanced generalization and adaptability over various RSI datasets;
- Hyperparameter optimization of the SAE model using the ICOA algorithm using cross-validation helps to boost the predictive outcome of the ICOA-DLVDC model for unseen data.
2. Related Works
3. The Proposed Model
3.1. Stage I: Object Detector
3.2. Stage II: Classification Model
4. Results and Discussion
5. Conclusions
Author Contributions
Funding
Data Availability Statement
Conflicts of Interest
References
- Wang, Y.; Peng, F.; Lu, M.; Asif Ikbal, M. Information Extraction of the Vehicle from High-Resolution Remote Sensing Image Based on Convolution Neural Network. Recent Adv. Electr. Electron. Eng. (Former. Recent Pat. Electr. Electron. Eng.) 2023, 16, 168–177. [Google Scholar]
- Anusha, C.; Rupa, C.; Samhitha, G. Region-based detection of ships from remote sensing satellite imagery using deep learning. In Proceedings of the 2nd International Conference on Innovative Practices in Technology and Management (ICIPTM), Gautam Buddha Nagar, India, 23–25 February 2022; IEEE: New York, NY, USA, 2022; Volume 2, pp. 118–122. [Google Scholar]
- Chen, Y.; Qin, R.; Zhang, G.; Albanwan, H. Spatial-temporal analysis of traffic patterns during the COVID-19 epidemic by vehicle detection using planet remote-sensing satellite images. Remote Sens. 2021, 13, 208. [Google Scholar] [CrossRef]
- Wang, L.; Shoulin, Y.; Alyami, H.; Laghari, A.A.; Rashid, M.; Almotiri, J.; Alyamani, H.J.; Alturise, F. A novel deep learning—based single shot multibox detector model for object detection in optical remote sensing images. Geosci. Data J. 2022, 1–15. [Google Scholar] [CrossRef]
- Ghali, R.; Akhloufi, M.A. Deep Learning Approaches for Wildland Fires Remote Sensing: Classification, Detection, and Segmentation. Remote Sens. 2023, 15, 1821. [Google Scholar] [CrossRef]
- Karnick, S.; Ghalib, M.R.; Shankar, A.; Khapre, S.; Tayubi, I.A. A novel method for vehicle detection in high-resolution aerial remote sensing images using YOLT approach. Multimed. Tools Appl. 2022, 109, 1–16. [Google Scholar]
- Wang, B.; Xu, B. A feature fusion deep-projection convolution neural network for vehicle detection in aerial images. PLoS ONE 2021, 16, e0250782. [Google Scholar] [CrossRef]
- Wang, J.; Teng, X.; Li, Z.; Yu, Q.; Bian, Y.; Wei, J. VSAI: A Multi-View Dataset for Vehicle Detection in Complex Scenarios Using Aerial Images. Drones 2022, 6, 161. [Google Scholar] [CrossRef]
- Safarov, F.; Temurbek, K.; Jamoljon, D.; Temur, O.; Chedjou, J.C.; Abdusalomov, A.B.; Cho, Y.I. Improved Agricultural Field Segmentation in Satellite Imagery Using TL-ResUNet Architecture. Sensors 2022, 22, 9784. [Google Scholar] [CrossRef]
- Momin, M.A.; Junos, M.H.; Mohd Khairuddin, A.S.; Abu Talip, M.S. Lightweight CNN model: Automated vehicle detection in aerial images. Signal Image Video Process. 2022, 17, 1–9. [Google Scholar] [CrossRef]
- Ahmed, I.; Ahmad, M.; Chehri, A.; Hassan, M.M.; Jeon, G. IoT Enabled Deep Learning Based Framework for Multiple Object Detection in Remote Sensing Images. Remote. Sens. 2022, 14, 4107. [Google Scholar] [CrossRef]
- Chen, J.; Hong, H.; Song, B.; Guo, J.; Chen, C.; Xu, J. MDCT: Multi-Kernel Dilated Convolution and Transformer for One-Stage Object Detection of Remote Sensing Images. Remote. Sens. 2023, 15, 371. [Google Scholar] [CrossRef]
- Qiu, Z.; Bai, H.; Chen, T. Special Vehicle Detection from UAV Perspective via YOLO-GNS Based Deep Learning Network. Drones 2023, 7, 117. [Google Scholar] [CrossRef]
- Tian, Z.; Huang, J.; Yang, Y.; Nie, W. KCFS-YOLOv5: A High-Precision Detection Method for Object Detection in Aerial Remote Sensing Images. Appl. Sci. 2023, 13, 649. [Google Scholar] [CrossRef]
- Ye, Y.; Ren, X.; Zhu, B.; Tang, T.; Tan, X.; Gui, Y.; Yao, Q. An Adaptive Attention Fusion Mechanism Convolutional Network for Object Detection in Remote Sensing Images. Remote. Sens. 2022, 14, 516. [Google Scholar] [CrossRef]
- Xiaolin, F.; Fan, H.; Ming, Y.; Tongxin, Z.; Ran, B.; Zenghui, Z.; Zhiyuan, G. Small object detection in remote sensing images based on super-resolution. Pattern Recognit. Lett. 2022, 153, 107–112. [Google Scholar] [CrossRef]
- Javadi, S.; Dahl, M.; Pettersson, M.I. Vehicle Detection in Aerial Images Based on 3D Depth Maps and Deep Neural Networks. IEEE Access 2021, 9, 8381–8391. [Google Scholar] [CrossRef]
- Wu, Y.; Zhang, K.; Wang, J.; Wang, Y.; Wang, Q.; Li, X. GCWNet: A Global Context-Weaving Network for Object Detection in Remote Sensing Images. IEEE Trans. Geosci. Remote. Sens. 2022, 60, 1–12. [Google Scholar] [CrossRef]
- AlDahoul, N.; Karim, H.A.; De Castro, A.; Tan, M.J.T. Localization and classification of space objects using Effi-cientDet detector for space situational awareness. Sci. Rep. 2022, 12, 21896. [Google Scholar] [CrossRef]
- Akila, S.M.; Imanov, E.; Almezhghwi, K. Investigating Beta-Variational Convolutional Autoencoders for the Un-supervised Classification of Chest Pneumonia. Diagnostics 2023, 13, 2199. [Google Scholar] [CrossRef]
- Chen, Q.; He, Q.; Zhang, D. UAV Path Planning Based on an Improved Chimp Optimization Algorithm. Axioms 2023, 12, 702. [Google Scholar] [CrossRef]
- Razakarivony, S.; Jurie, F. Vehicle detection in aerial imagery: A small target detection benchmark. J. Vis. Commun. Image Represent. 2016, 34, 187–203. [Google Scholar] [CrossRef]
- Rottensteiner, F.; Sohn, G.; Jung, J.; Gerke, M.; Baillard, C.; Benitez, S.; Breitkopf, U. The ISPRS Benchmark on Urban Object Classification and 3D Building Reconstruction. ISPRS Ann. Photogramm. Remote Sens. Spat. Inf. Sci. 2012, 1, 293–298. [Google Scholar] [CrossRef]
- Ahmed, M.A.; Althubiti, S.A.; de Albuquerque, V.H.C.; dos Reis, M.C.; Shashidhar, C.; Murthy, T.S.; Lydia, E.L. Fuzzy wavelet neural network driven vehicle detection on remote sensing imagery. Comput. Electr. Eng. 2023, 109, 108765. [Google Scholar] [CrossRef]


| Class | No. of Instances |
|---|---|
| Car | 1340 |
| Truck | 300 |
| Van | 100 |
| Pickup Car | 950 |
| Boat | 170 |
| Camping Car | 390 |
| Other | 200 |
| Plane | 47 |
| Tractor | 190 |
| Total Instances | 3687 |
| Class | No. of Instances |
|---|---|
| Car | 1990 |
| Truck | 33 |
| Van | 181 |
| Pickup Car | 40 |
| Total Instances | 2244 |
| Labels | MCC | ||||
|---|---|---|---|---|---|
| Training Phase (70%) | |||||
| Car | 98.91 | 98.62 | 98.41 | 98.51 | 97.66 |
| Truck | 99.38 | 96.21 | 96.21 | 96.21 | 95.87 |
| Van | 99.88 | 96.97 | 98.46 | 97.71 | 97.65 |
| Pickup Car | 99.26 | 97.77 | 99.40 | 98.58 | 98.09 |
| Boat | 99.46 | 94.78 | 93.16 | 93.97 | 93.69 |
| Camping Car | 99.34 | 95.70 | 98.16 | 96.91 | 96.56 |
| Other | 99.38 | 97.76 | 90.97 | 94.24 | 93.99 |
| Plane | 99.65 | 96.67 | 78.38 | 86.57 | 86.88 |
| Tractor | 99.61 | 95.45 | 96.92 | 96.18 | 95.98 |
| Average | 99.43 | 96.66 | 94.45 | 95.43 | 95.15 |
| Testing Phase (30%) | |||||
| Car | 98.83 | 98.98 | 97.74 | 98.36 | 97.45 |
| Truck | 99.55 | 94.68 | 100.00 | 97.27 | 97.06 |
| Van | 99.73 | 94.44 | 97.14 | 95.77 | 95.64 |
| Pickup Car | 99.28 | 97.95 | 99.31 | 98.62 | 98.14 |
| Boat | 99.46 | 97.96 | 90.57 | 94.12 | 93.91 |
| Camping Car | 99.64 | 96.72 | 100.00 | 98.33 | 98.15 |
| Other | 99.55 | 94.74 | 96.43 | 95.58 | 95.34 |
| Plane | 99.82 | 100.00 | 80.00 | 88.89 | 89.36 |
| Tractor | 99.64 | 100.00 | 93.33 | 96.55 | 96.43 |
| Average | 99.50 | 97.27 | 94.95 | 95.94 | 95.72 |
| VEDAI Dataset | |
|---|---|
| Methods | Accuracy (%) |
| ICOA-DLVDC | 99.50 |
| CSOTL-VDCRS | 98.07 |
| LeNet Model | 79.74 |
| AlexNet Model | 88.98 |
| VGG-16 Model | 94.46 |
| Labels | MCC | ||||
|---|---|---|---|---|---|
| Training Phase (70%) | |||||
| Car | 99.11 | 99.35 | 99.64 | 99.50 | 95.55 |
| Truck | 99.87 | 91.30 | 100.00 | 95.45 | 95.49 |
| Van | 99.43 | 96.77 | 96.00 | 96.39 | 96.08 |
| Pickup Car | 99.68 | 100.00 | 84.85 | 91.80 | 91.96 |
| Average | 99.52 | 96.86 | 95.12 | 95.79 | 94.77 |
| Testing Phase (30%) | |||||
| Car | 99.41 | 99.67 | 99.67 | 99.67 | 97.00 |
| Truck | 100.00 | 100.00 | 100.00 | 100.00 | 100.00 |
| Van | 99.70 | 98.21 | 98.21 | 98.21 | 98.05 |
| Pickup Car | 99.70 | 85.71 | 85.71 | 85.71 | 85.56 |
| Average | 99.70 | 95.90 | 95.90 | 95.90 | 95.15 |
| Methods | Accuracy (%) |
|---|---|
| ICOA-DLVDC | 99.70 |
| CSOTL-VDCRS | 98.67 |
| LeNet Model | 94.54 |
| AlexNet Model | 95.86 |
| VGG-16 Model | 89.54 |
Disclaimer/Publisher’s Note: The statements, opinions and data contained in all publications are solely those of the individual author(s) and contributor(s) and not of MDPI and/or the editor(s). MDPI and/or the editor(s) disclaim responsibility for any injury to people or property resulting from any ideas, methods, instructions or products referred to in the content. |
© 2023 by the authors. Licensee MDPI, Basel, Switzerland. This article is an open access article distributed under the terms and conditions of the Creative Commons Attribution (CC BY) license (https://creativecommons.org/licenses/by/4.0/).
Share and Cite
Alajmi, M.; Alamro, H.; Al-Mutiri, F.; Aljebreen, M.; Othman, K.M.; Sayed, A. Exploiting Remote Sensing Imagery for Vehicle Detection and Classification Using an Artificial Intelligence Technique. Remote Sens. 2023, 15, 4600. https://doi.org/10.3390/rs15184600
Alajmi M, Alamro H, Al-Mutiri F, Aljebreen M, Othman KM, Sayed A. Exploiting Remote Sensing Imagery for Vehicle Detection and Classification Using an Artificial Intelligence Technique. Remote Sensing. 2023; 15(18):4600. https://doi.org/10.3390/rs15184600
Chicago/Turabian StyleAlajmi, Masoud, Hayam Alamro, Fuad Al-Mutiri, Mohammed Aljebreen, Kamal M. Othman, and Ahmed Sayed. 2023. "Exploiting Remote Sensing Imagery for Vehicle Detection and Classification Using an Artificial Intelligence Technique" Remote Sensing 15, no. 18: 4600. https://doi.org/10.3390/rs15184600
APA StyleAlajmi, M., Alamro, H., Al-Mutiri, F., Aljebreen, M., Othman, K. M., & Sayed, A. (2023). Exploiting Remote Sensing Imagery for Vehicle Detection and Classification Using an Artificial Intelligence Technique. Remote Sensing, 15(18), 4600. https://doi.org/10.3390/rs15184600