Article

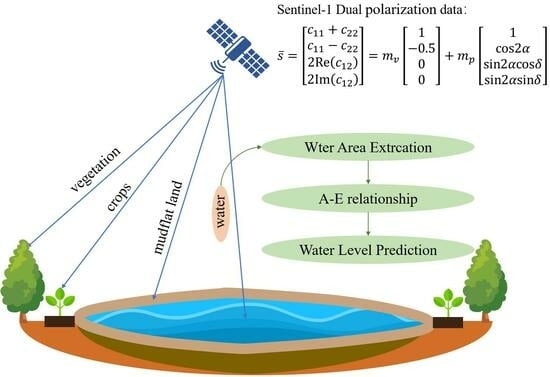
Water Area Extraction and Water Level Prediction of Dongting Lake Based on Sentinel-1 Dual-Polarization Data Decomposition

1
School of Geosciences and Info-Physics, Central South University, Changsha 410083, China
2
College of Civil Engineering, Central South University of Forestry and Technology, Changsha 410004, China
3
Hunan Key Laboratory of Remote Sensing Monitoring of Ecological Environment in Dongting Lake Area, Hunan Natural Resources Affairs Center, Changsha 410004, China
*
Author to whom correspondence should be addressed.
Remote Sens. 2023, 15(19), 4655; https://doi.org/10.3390/rs15194655
Submission received: 21 August 2023 / Revised: 17 September 2023 / Accepted: 21 September 2023 / Published: 22 September 2023
(This article belongs to the Topic Hydrology and Water Resources Management)

Abstract

:
The Sentinel-1 imaging radar mission provides a short revisit-time, continuous all-weather, and day-and-night imagery at the C-band, which brings opportunities for the dynamic extraction of lake water areas. For wetland-type lakes, it is difficult to distinguish between the water, submerged plants, and mudflats at the edge of a lake, which leads to difficulty in recognizing the water edge of a lake and affects the accuracy of lake water area extraction. In this paper, a water area extraction and water level prediction algorithm based on Sentinel-1 dual-polarization data decomposition is proposed to solve the problem. We can accurately extract lake water through generalized Stokes polarization decomposition. At the same time, we can verify the accuracy of water area extraction by establishing the water area and in situ water level elevation (A–E) relationship, and predicting the water level according to the calculated water area. In this study, dual-polarization Sentinel-1 time series SAR data covering the Dongting Lake wetland from 2018 to 2022 are used to verify the proposed water area extraction algorithm and establish the A–E relationship of the East Dongting Lake basin. The results show that the generalized Stokes decomposition parameters are very sensitive to the water boundary, and the R2 of the water area and the water level can reach 0.98 by using the piecewise linear function. It confirms the accuracy of the water area inversion, which is of extremely important significance for the high-precision monitoring of the water area of Dongting Lake with long-term Sentinel-1 data. Meanwhile, the predicted lake water level acquired using the A–E relationship established in this paper is compared with the field water level, with an RMSE of 0.4857 m and R2 of 0.9930. This means that the water level derived using the method in this study is quite compatible with the field observations, which provides a good idea for the water level monitoring of lakes lacking hydrological monitoring stations.

Graphical Abstract

1. Introduction

As a vital part of the terrestrial ecosystem, lakes play an important role in flood storage, drought prevention, ecological balance, climate regulation, and water quality improvement [1,2]. Dongting Lake, an important regulation and storage lake in the Yangtze River Basin, has a strong flood storage capacity and important ecological value [3]. In recent years, due to the impact of global climate change and human activities, the area of Dongting Lake surface water bodies has been drastically reduced, the regulation and storage functions have been significantly reduced, and the ecological environment has deteriorated [4,5,6,7]. Therefore, the comprehensive and dynamic monitoring of Dongting Lake on a large scale is of great importance. Water surface area and water level are two key indicators that reflect changes in a lake’s water status, which requires timely and accurate monitoring [8,9].
Remote sensing technology is usually used to extract a lake’s water area and lake monitoring [10,11,12,13,14]. Traditional optical remote sensing water area extraction algorithms including the single-band thresholding method, the spectral analysis method, and the multiband method have been able to achieve the rapid and accurate extraction of lake water bodies [14,15,16,17,18,19,20,21]. However, optical remote sensing technology cannot penetrate clouds to obtain surface information in bad weather, and thus cannot meet the requirements of the real-time dynamic monitoring of lakes [22]. Synthetic aperture radar (SAR) technology has all-time as well as all-weather imaging and strong penetrating abilities, and can identify water bodies as well as wetlands under vegetation canopies, which is conducive to the accurate extraction of lakes’ water areas [23]. Polarimetric synthetic aperture radar (PolSAR) has a clearer physical interpretation of the measured radar data, which has unique advantages in target classification [24]. In 2014, the European Space Agency (ESA) launched the Copernicus Sentinel-1 satellite to continuously provide free SAR data with a 6-day repeat cycle to the public, which brings opportunities and challenges for the large-scale long-term monitoring of lake dynamics [25].
At present, increasingly more researchers are using Sentinel-1 SAR time series wide-width data to extract water bodies [26]. Since the Sentinel-1 satellite provides dual-polarized data, the methods for extracting water areas by using Sentinel-1 images include two types: single-polarization and dual-polarization information extraction methods. For the single-polarization information extraction method, a VV-polarized SAR image is mainly used because of its sensitivity to water information [27]. Zhang et al. selected the VV polarization mode of Sentinel-1 and used the field ratio method for threshold segmentation, after which they then realized the dynamic change monitoring of two glacial lakes in the Qinghai–Tibet Plateau region [28]. Wang et al. obtained inundation frequency maps of Poyang Lake and Dongting Lake based on the VV backscattering coefficient of Sentinel-1 by using the Google Earth Engine platform [29]. However, the single-polarization information is susceptible to noise, the threshold is determined incorrectly, and the extracted water area is not accurate [27]. The dual-polarization lake water information extraction method weakens the influence of noise, and it can be divided into two categories: one is to directly couple the information of the VV and VH images through a machine learning method, and the other is to extract the water area by using the single-channel polarization information separately and then fuse the two single-channel extraction results. Twele et al. proposed an automated processing chain based on Sentinel-1 based on VV and VH backscattering coefficients and realized the dynamic monitoring of floods at two flood points on the border between Greece and Turkey [27]. Binh et al. combined the VH and VV backscattering coefficients of Sentinel-1 to achieve surface water extraction of the Mekong River in Cambodia and Vietnam using a neural network [30]. Amitrano et al. proposed a high-precision and rapid flood mapping method based on the texture and amplitude information of Sentinel-1 data [31]. Liang et al. proposed a local threshold method for Sentinel-1 data, which realized the rapid delineation of water extent during flood events by combining VV and VH polarized water extent maps after threshold segmentation [32]. The above methods are used to realize the combination of VH and VV polarization information in a mathematical way, without considering the physical meaning of the polarization information. For the polarimetric SAR data, polarimetric decomposition can provide a physical interpretation of the scene by expressing the radar response as a combination of responses from canonical scattering elements [33]. For wetland-type lakes, the water edge is usually difficult to define due to the existence of submerged vegetation and mudflats. We consider the full use of the dual-polarization information from the physical perspective and propose a Stokes dual-polarization decomposition model for lake water area extraction. The method can distinguish the water body at the edge of a lake from the surrounding submerged vegetation and mudflats.
In this paper, dual-polarization decomposition parameters obtained from Sentinel-1 SAR images from 2018 to 2022 with clear physical information are used to extract the water area of Dongting Lake, realize the dynamic monitoring of the lake, and establish an accurate water area–water level relationship to predict the realized water level. Firstly, the generalized-model-based Stokes decomposition [34] is performed to enhance the discrimination between water and lake edge objects, and the effectiveness of water area extraction is realized. Secondly, the Otsu threshold segmentation method [35] is used to segment the polarization decomposition parameters. The morphological filtering method [36] is used for post-processing of the binary segmentation image to eliminate the interference of non-lake water bodies and accurately extract the water area of Dongting Lake. Finally, the functional relationship between the water area of East Dongting Lake and the water level of Chenglingji station is established to verify the accuracy of the water area extraction and predict the vacant water level data.

2. Materials and Methods
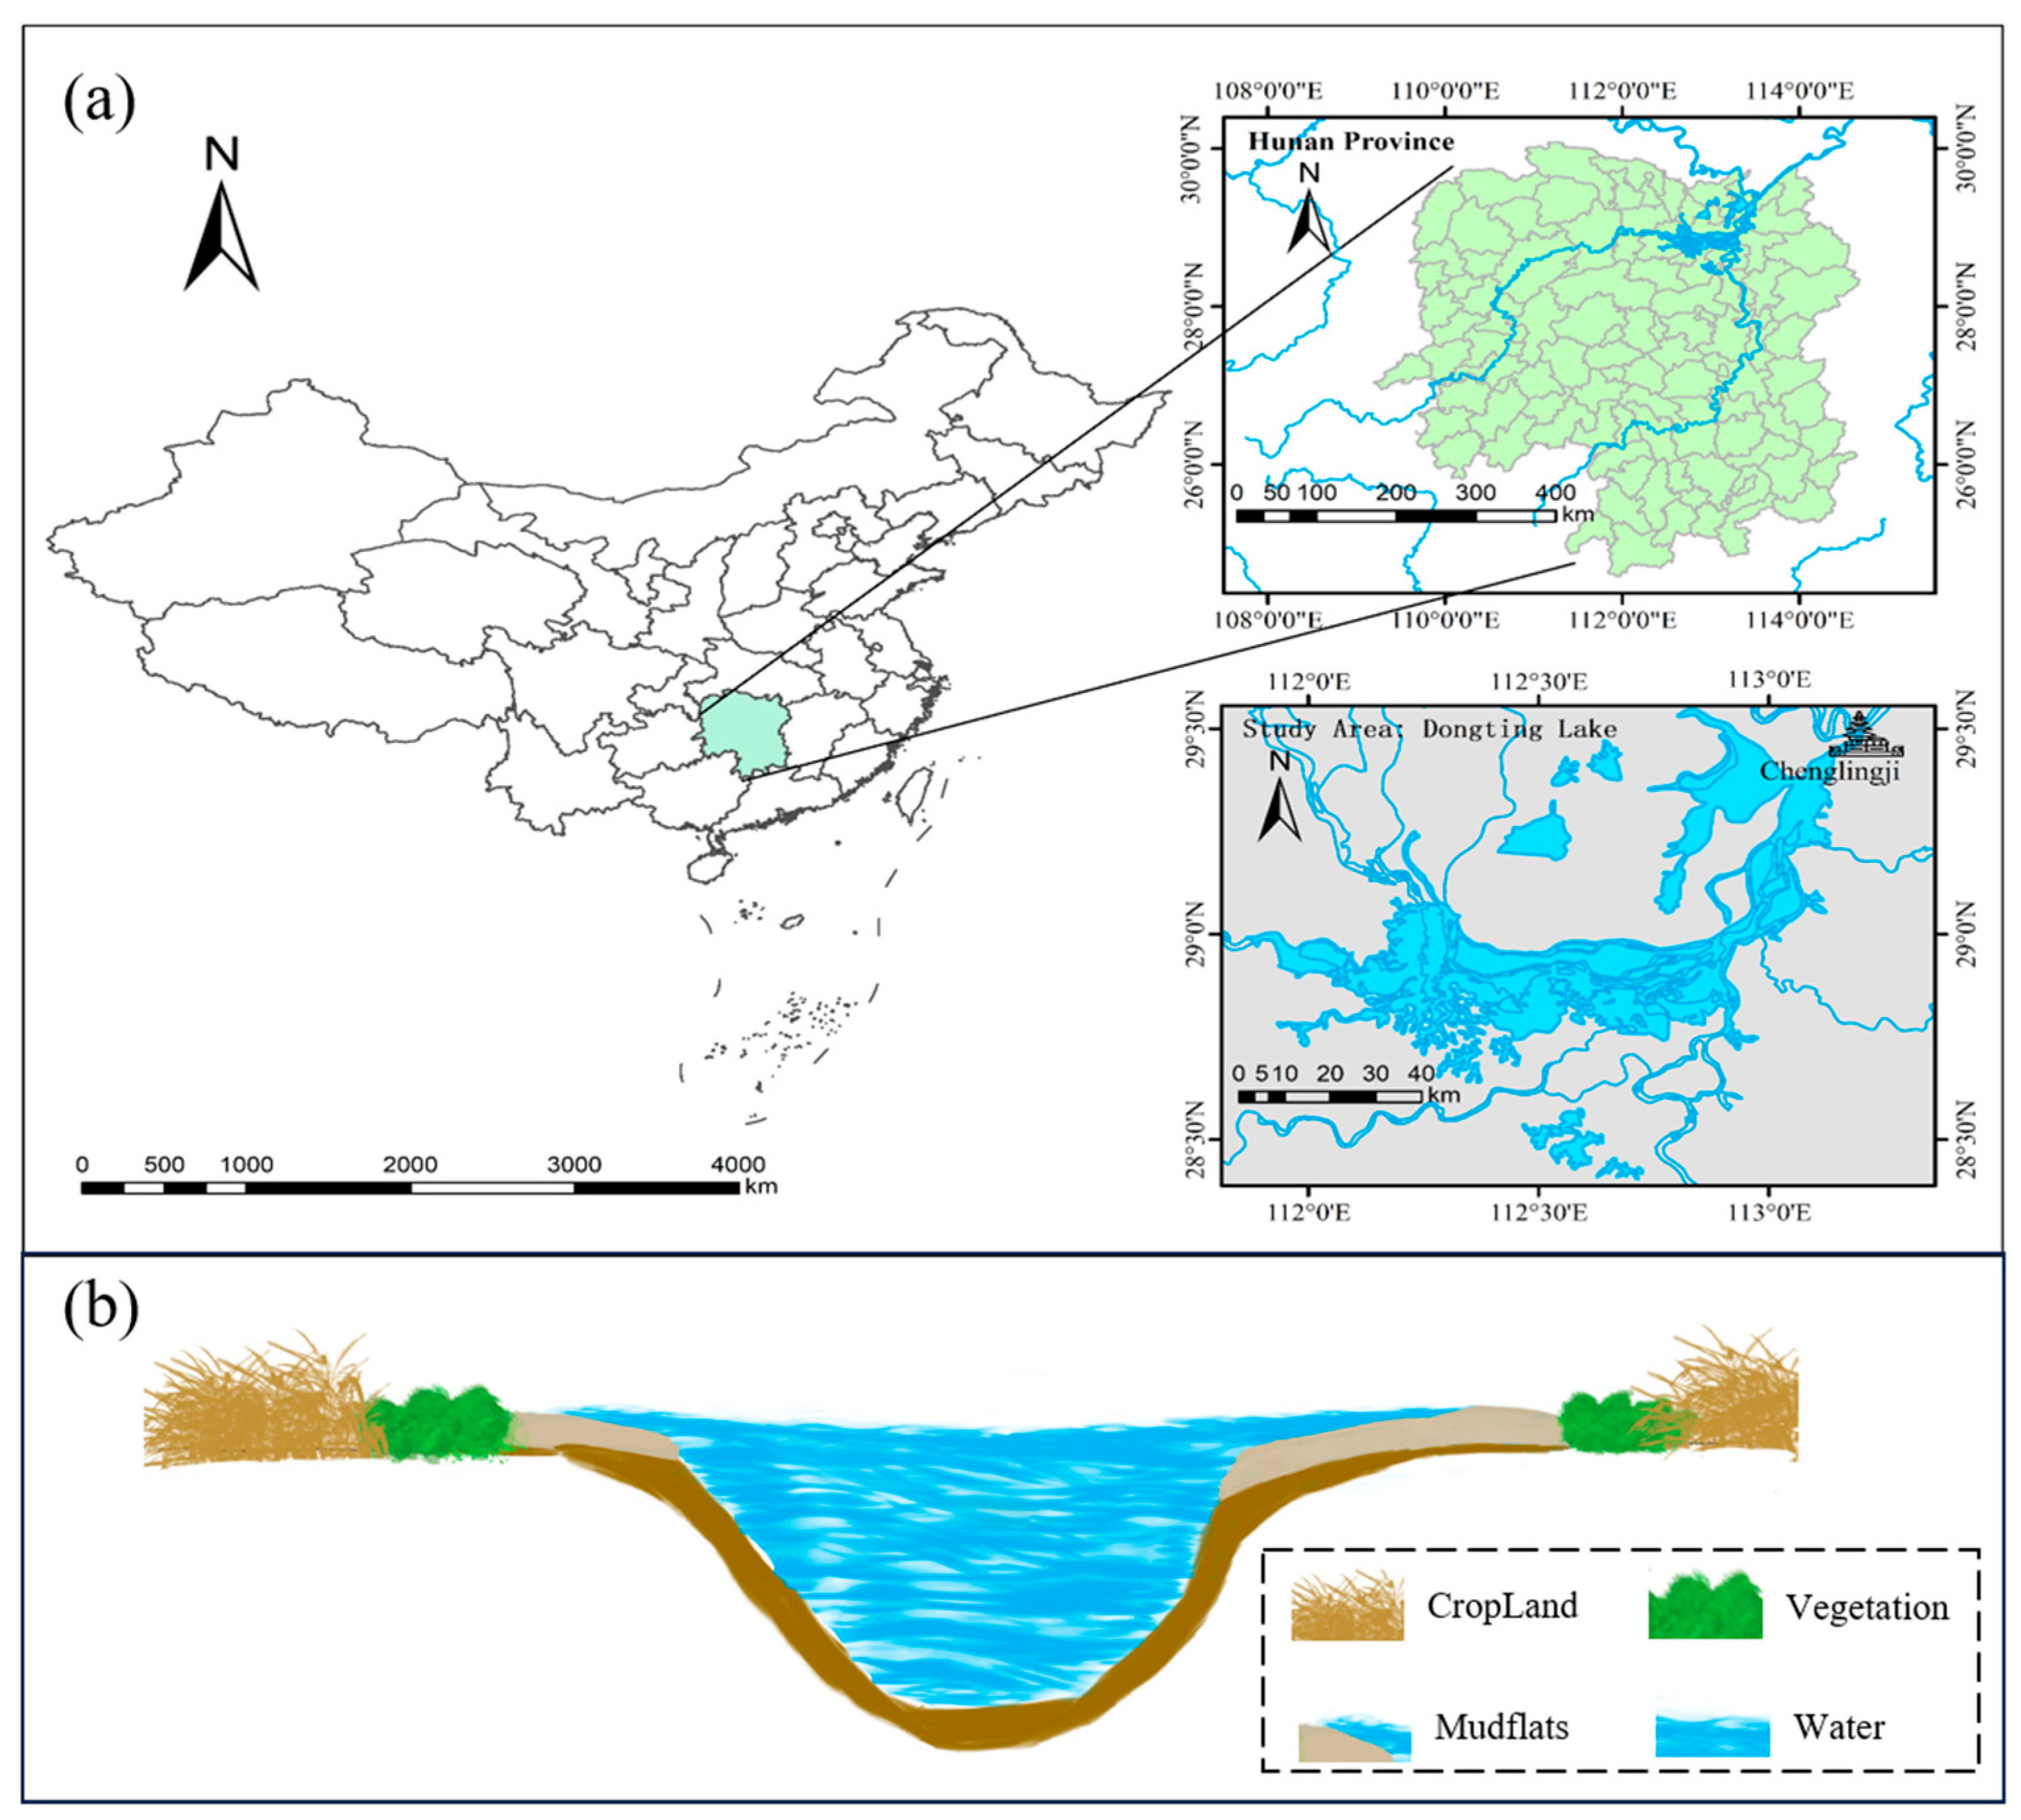
2.1. Study Area

The Dongting Lake wetland is used to verify the proposed method. Dongting Lake with an area of about 2740 km2 as shown in Figure 1a is the second largest freshwater lake in China; it is located in the northeast of Hunan Province and on the south bank of the Jingjiang River (approximately 27°39′ to 29°50′N and 111°19′ to 113°34′E) in the middle reaches of the Yangtze River.
The whole lake area consists of East Dongting Lake, West Dongting Lake, and South Dongting Lake. Several rivers are connected to the primary body of water, and the water flows into the Yangtze River at the northeastern exit near Chenglingji. The Chenglingji Hydrological Observatory is located in the northeast of Dongting Lake and it can monitor the water level in the East Dongting Lake area [37,38,39]. The Dongting Lake basin belongs to the subtropical monsoon climate. The mean annual temperature is 16.8 °C, the frost-free period is about 270 days, and the annual precipitation is about 1200 mm. In the wet season, the water level rises and the water surface expands. More than 50 percent of the rainfall is from April to June. The water level of Dongting Lake starts to rise in April, reaches its peak in July–August, and then gradually decreases in the dry season from November to March of the following year [3].
The Dongting Lake wetland is a wetland ecosystem with the coexistence of lakes and artificial and natural vegetation, which is dominated by poplar moss and reed, respectively [40]. Figure 1b shows the profile diagram of the Dongting Lake wetland drawn based on Google Earth images and field research on Dongting Lake. As shown in Figure 1b, in the Dongting Lake wetland region, farmland areas with large amounts of rice and complex and extensive types of woodlands are distributed in the transition interval, and bare mudflats, as well as submerged plants, are distributed at the edge of the lake. As a result, the wetland of Dongting Lake presents a symmetrical distribution of farmland, artificial forest, natural forest, mudflat land, and lake water.

2.2. Data

2.2.1. SAR Data

Sentinel-1 Earth observation satellite was launched by ESA’s Copernicus program to acquire medium–high-resolution radar images in all weather conditions and monitor the land and ocean surface environments. In April 2014, ESA launched the Sentinel-1A satellite, and in April 2016, the Sentinel-1B satellite was gradually launched. Each satellite orbits the Earth once every 12 days, and the revisit period of the binary system is 6 days [41]. Sentinel-1 is a C-band radar imaging system, including four imaging modes, namely the SM (strip map), IW (interferometric wide swath), EW (extra-wide swath), and WV (wave) modes. The WV polarization mode is single-polarization (HH/VV), and the other three polarization modes are dual-polarization (HH + HV/VV + VH) [42]. Sentinel-1 satellite SAR images can be freely downloaded from the European Space Agency’s data-sharing website (https://scihub.copernicus.eu/dhus/) (accessed on 7 May 2022).
In this paper, a total of 120 ascending dual-polarization (VV + VH) SLC images of Sentinel-1A acquired from January 2018 to June 2022 are used to conduct the observation of Dongting Lake. The resolutions of the dual-polarization SAR images are 2.33 m in the range direction and 13.96 m in the azimuth direction. Also, we select 8 landscape images obtained in 2017 for subsequent verification.

2.2.2. Optical Image Data

Sentinel-2 is a high-resolution multispectral imaging satellite that carries a multispectral Imager (MSI). Sentinel-2 missions include Sentinel-2A (launched in June 2015) and Sentinel-2B (launched in March 2017), it covers 13 bands with a high spatial resolution of 10 m, and the revisit period of the binary system is 5 days [29,30]. Sentinel-2 images can also be freely downloaded from the European Space Agency’s data-sharing website (https://scihub.copernicus.eu/dhus/) (accessed on 6 June 2022). In this study, a Sentinel-2 optical image obtained on 12 February 2018 is selected for comparative analysis.

2.2.3. Water Level Data

The water level data provided by the Chenglingji Hydrological Observation Station are used to verify the accuracy of water extraction and establish the A–E relationship between water level and water area in this paper. The Chenglingji Station is located in the east of Dongting Lake and has been monitoring the water level since January 2001. The observed water level data can roughly reflect the change in water level in the East Dongting Lake basin and be downloaded from the website (http://hunan.gov.cn/) (accessed on 6 September 2022). According to the acquisition time of Sentinel-1 SAR data, 109 instances of valid water level data can be used in the experiment after screening, and 8 instances of water level data are used for verification. There are also 11 empty water level data points, which are missed usually due to the failure of the monitoring instrument or not updating in time of the data.

2.3. Methodology

The workflow of the method in this paper is shown in Figure 2, which can be divided into four parts: data preprocessing, polarization decomposition, water area extraction, and water level prediction. Sentinel-1 SAR images are preprocessed through track correction, thermal noise removal, multilooking, filtering, and terrain correction [43]. Polarization decomposition is the key part of this paper. In this part, a Stokes polarization decomposition method is mainly used to decompose the dual-polarization data, and the unique advantages of polarization decomposition parameters for water area extraction are analyzed. The key water area extraction algorithms part mainly includes an Otsu threshold segmentation algorithm, morphological processing, median filtering, and connectivity domain removal. In the last part, the water area and water level data of East Dongting Lake are fitted to establish the A–E relationship, and then the water level is predicted.

2.3.1. Data Preprocessing

In this study, we use the SNAP (Sentinel Application Platform) 9.0.0 software issued by ESA (https://sentinel.esa.int/web/sentinel/toolboxes/sentinel-1) for Sentinel-1 data preprocessing. The Sentinel-1 data pretreatment process is shown in Figure 2 [43]. In the preprocessing process, a Sentinel-1 SLC (Single Look Complex) image is input to obtain the preprocessed image with a resolution and size of 13.93 m and 9158 × 11,142 pixels, respectively. Also, a 2 × 2 covariance matrix (C2) (VH + VV) is obtained.
The specific preprocessing steps are as follows: apply orbit-file, Terrain Observation with Progressive Scans SAR (TOPSAR)-split, thermal-noise-removal, radiometric-calibration, TOPSAR-Deburst, subset (to select an excerpt of the whole image according to the geographical range of the study area), Polarimetric-Matrix (formation of the C2 matrix), multilook (1 × 4), polarimetric-speckle-filtering (4 × 20 boxcar), and Terrain-Correction (geocoding) [34].

2.3.2. Stokes Decomposition

Water area extraction using single-polarization channel information is susceptible to noise and has unclear physical meaning, which leads to the inaccurate calculation of water area. Therefore, we make full use of Sentinel-1 dual-polarization information and consider the interpretation of water. Polarimetric target decomposition can represent the average scattering energy as the sum of independent elements, thus separating different scattering mechanisms in the polarimetric signature [33]. In 2022, Lucio et al. proposed a generalized-model-based decomposition method for dual-polarization SAR data. This method can decompose any Stokes vector into partially polarized wave (volume scattering) components and polarized wave components [34]. For the original SLC image, an average C2 matrix is generated according to the energy of the two polarized channels, which can be processed by SNAP software.
C 2 = E H T E V T E H T * E V T * = c 11 c 12 c 12 * c 22
where the symbol T denotes H polarization or V polarization, which is chosen in this study, and E denotes the preprocessed binary complex vector.
After obtaining the C2 matrix, the Stokes vector represented by the power measurement value can be constructed, which provides the data basis for the subsequent polarization decomposition:
s ¯ = s 1 s 2 s 3 s 4 = c 11 + c 22 c 11 c 22 2 R e c 12 2 I m c 12
According to the classical Stokes vector theory, any Stokes vector can be decomposed into polarized and nonpolarized parts [44]. In the SAR data polarization decomposition model, any model-based decomposition is the sum of the volume scattering model and one or more residual terms of rank 1, so the Stokes vector can be modeled into three parts, (1) volume scattering terms; (2) a polarization term; and (3) a noise term:
s ¯ = m v s ¯ v + m s s ¯ p + n s ¯ n
Since the noise is removed in the preprocessing process, the Stokes vector can be modeled as a volume scattering part and a polarization scattering part. The volume scattering model is obtained by assuming the particle type is a dipole. Volume scattering models can be used to describe the scattering between the microwave signal and the vegetation canopy:
s ¯ = m v 1 ± 0.5 0 0 + m p 1 c o s 2 α s i n 2 α c o s δ s i n 2 α s i n δ
where the symbol in the volume scattering model is taken as + when the polarization combination is HH + HV and − when the polarization combination is VV + VH; in this study, the combination of VV + VH is chosen. m v represents the energy of the volume scattering part, m p represents the energy of the polarization scattering part, and α and δ represent the two angles related to the amplitude and phase of the polarization state, respectively.
There are four unknown parameters to be solved in the Stokes dual-polarization decomposition model. For the Sentinel-1 dual-polarized SAR data, we can obtain the volume scattering energy   m v , the polarization scattering energy m p , and the two angle parameters according to Equation (4). We pay more attention to the two polarization scattering energy parameters m v and m p with certain physical significance.

2.3.3. Otsu Threshold Segmentation Algorithm

Based on the Stokes decomposition parameters, the maximum interclass variance method proposed by Otsu et al. [35] is adopted to extract the water area. Otsu’s method is a globally optimal adaptive threshold algorithm and has been widely used in the classification of binary thresholds [35]. According to the gray value of the image, an image is divided into a background class and a target class using the Otsu threshold segmentation algorithm. Then, the classification is realized by maximizing the variance between the two classes and reducing the probability of incorrect classification. Specifically, by assuming a threshold value of Th, all pixels of an image are divided into two categories: C1 (less than Th) and C2 (greater than Th). The interclass variance σ2 of the two classes is expressed as follows:
σ 2 = p 1 m 1 m G 2 + p 2 m 2 m G 2
where m 1 represents the mean gray value of water class pixels, m 2 represents the mean gray value of non-water class pixels in this study, and p 1 and p 2 represent the probability that a pixel is classified as water class and non-water class, respectively.
When the gray difference between the target category and the background is larger, the effect of the Otsu threshold segmentation method is improved. In other words, the gray distribution histogram of the image shows obvious peak and valley characteristics, and the greater the difference between the peak and valley value, the better the effect. In this paper, we use the Otsu threshold segmentation method to the combination form of two polarization parameters, m p and m v , obtained through Stokes polarization decomposition for the identification and extraction of water bodies. The histogram distribution of the normalized energy index is then analyzed. As shown in Figure 3f, the histogram of the combination of the two polarization decomposition parameters has more obvious bimodal characteristics, and the difference between the peak and valley values is very large, which is beneficial to extract the water part by using Otsu threshold segmentation; in other words, it is easy to extract the water body from the image.
As shown in Figure 4, the threshold segmentation of the Stokes decomposition parameters is performed in two steps: gray-level image conversion and Otsu threshold segmentation. Firstly, the RGB image synthesized by the generalized Stokes polarization decomposition parameters is converted to a gray-level image. Then, the RGB image synthesized by the parameters of generalized Stokes polarization decomposition is converted to a grayscale image. The specific steps of this process are to convert the polarization decomposition parameters, mp, mv, and mp/mv, to synthesize RGB images in the form of three bands (refer to Lucio et al. [34], this way of RGB image synthesis can distinguish ground objects), and then mathematically convert the three-dimensional matrix of RGB into two-dimensional gray images. This step aims to combine the polarization decomposition parameters to facilitate the subsequent threshold segmentation processing. Secondly, the Otsu threshold segmentation method is applied to the converted gray level image, and a rough binary segmentation image as shown in Figure 4c can be obtained.

2.3.4. Morphological Operation and Filtering

In Figure 4c, many non-lake water bodies such as ponds, reservoirs, and water in farmland will remain and the water bodies’ results are rough by using the Otsu threshold segmentation method. In this study, we use morphological operation, median filtering, and connectivity domain removal to post-process the water segmentation binary map to extract the lake water area of the target. The processing flow is shown in Figure 5.
The mathematical morphology proposed by Matheron and Serra uses structural elements for the morphological processing of interesting objects in images to extract target objects or regions [36]. The basic operations of mathematical morphology include expansion, corrosion, open operation, and close operation. The expansion can combine the fractured targets, which is conducive to the whole extraction. Corrosion can eliminate some small, meaningless points. Open operation refers to the first corrosion and then expansion, its role is to eliminate fewer structural elements of the part, and it will not change the target shape profile. Closed operation refers to the expansion before corrosion, and its role is to smooth the boundary of the object, fill the hole inside the object, connect the adjacent object, and not change the area of the object [36]. The smooth water extraction results can be obtained in a good manner by using closed operation. As shown in Figure 5b, the first step involves applying a morphological closing operation to eliminate noise points generated through threshold segmentation and achieve a smoother lake edge, resulting in an improved segmentation result. The purpose of this step is to eliminate the noise caused by inaccurate threshold segmentation.
In the median filtering method, the gray value of each pixel is set to the median gray value of all pixels in a neighborhood window of the point [45]. As shown in Figure 5c, the median filter is used to smooth the water body, and the purpose of this step is to eliminate the influence of noise from the water extract result.
Connected component removal aims to mainly find the connected component of a target, remove the relatively small noise area in the target image, and retain the main water area. As shown in Figure 5d, for the broken water bodies around the lake and the water bodies detected in the farmland, a certain area threshold is set to eliminate the connected areas with small areas and obtain the final water extraction results. The purpose of this step is to screen a reasonable water range of Dongting Lake. After median filtering and connected domain removal, smoother water body extraction results can be obtained.

3. Results and Discussion

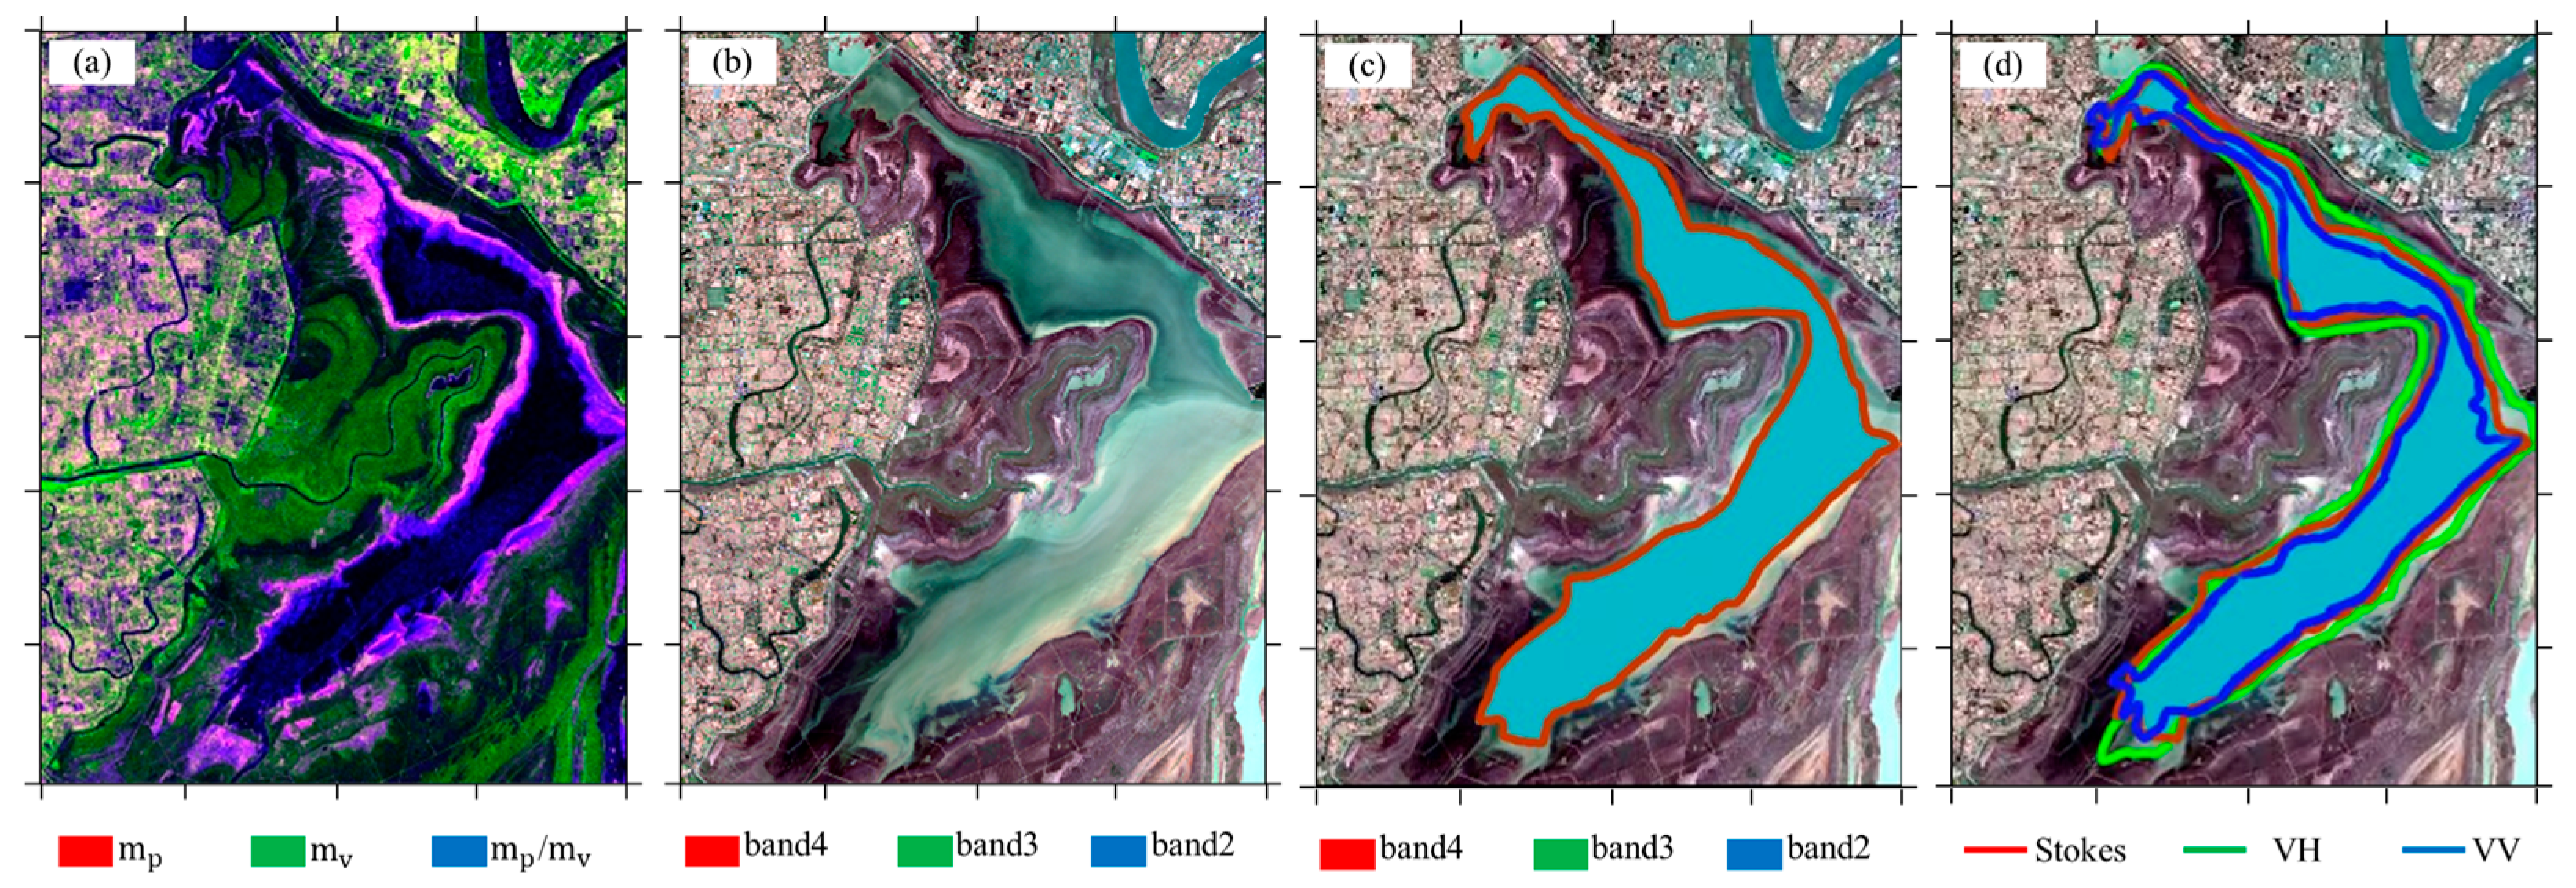
3.1. Polarization Decomposition of Dongting Lake

In this paper, Stokes polarization decomposition is used to process the Sentinel-1 preprocessed C2 matrix, and the decomposition parameters are presented in the form of RGB composite maps. As an example, a Sentinel-1A RGB image with an acquisition time of 11 February 2018 is shown in Figure 4a. The overall color of the whole image is green, indicating that volume scattering is the main type of scattering mechanism in the Dongting Lake basin. The water part mainly presents dark tones, indicating that the energy of the water body is low, and both scattering mechanisms of polarization decomposition contribute weakly. It is worth noting that we find a purple color region around the water body in Figure 4a. Purple indicates that the polarization scattering energy in this region is very strong, and it should be mainly surface scattering. According to the profile of Dongting Lake, this area is initially determined to be mudflat land. This area is necessary to analyze because it is closely related to the definition of the water boundary.
To further analyze the polarization decomposition characteristics of lake edge features, the section of East Dongting Lake located at the upper-left corner of Figure 4a is selected as the key research object. We choose an RGB composite image of the Sentinel-1 Stokes polarization decomposition and the Sentinel-2 optical image acquired one day apart (11 February 2018 and 12 February 2018) for comparative analysis, as shown in Figure 6. By comparing the images, it can be seen that the Stokes decomposition map shows obvious features of ground object distributions, including farmland, forest land, mudflat land, and water areas (from left to right), which is consistent with the profile diagram of the Dongting Lake wetland in Figure 1b.
To facilitate the subsequent study of the relationship between water area and water level, the calculation of water area does not take into account the dry mudflat at the edge of the lake and only considers the pure water area of the lake. The Stokes decomposition method can distinguish various types of surface features, especially mudflats, and waters, which helps extract water area. As shown in Figure 6a, mudflat land shows a purple color, because the mudflat is relatively rough and mainly scattered by surface, which can be characterized as a single scattering mechanism. Therefore, its polarized scattering energy is strong. The calm water surface presents a dark tone; due to the smooth surface, specular reflection occurs; and the echo signal is generally weak. Vegetation is presented as green in the image, because the main surface objects in the woodland are moss, reeds, and poplars, whose cover is too dense, and the main scattering mechanism in this area is the volume scattering generated by the vegetation canopy. The crops have the rich color in the image because the main crop type in the field area is rice and the rice in different fields has different growth cycle states. There are mixed scattering mechanisms in this area, including the volume scattering of rice, the surface scattering of bare land, and the dihedral angle scattering between rice stalks and the ground.
As shown in Figure 6c, the final extracted water outline is superimposed on the optical image. We can find that the water contour extracted by using Stokes parameters is smaller than the visually interpreted contour on the optical image, and it surrounds the edge of the lake. Through the actual investigation, we find that there are many embankments and mudflats intermittently covered by water in the lake. In Figure 6d, the order of water extraction area size is VH, Stokes, and VV, namely, the contour extracted using the Stokes method is between VV and VH.
To further analyze the ability of Stokes decomposition parameters to extract lake water, we select five different ground objects (water bodies, buildings, crops, forests, and bare land) to analyze H-A-α decomposition parameters [46], VH-VV backscattering coefficients, and Stokes decomposition parameters based on a generalized model [34]. As shown in Figure 7a, all types of ground object scattering features are mixed, which indicates that H-A-α decomposition is not sensitive to the discrimination of ground objects in this region. In Figure 7b, the backscattering coefficient can be used to identify water bodies, especially the VV backscattering coefficient. But there exists a certain mixture between water bodies and bare ground. In Figure 7c, we find that Stokes decomposition based on a generalized model has unique advantages in extracting water categories. m v is a key parameter in distinguishing the scattering energy of water, and the distance between the m v scattering energy of water and other ground objects is about 10 dB. In other words, the Stokes decomposition parameters based on the generalized model have better discriminative power and are used to distinguish water bodies from other ground objects in this research.
We comprehensively consider the optical image and SAR image obtained on 11 February 2018, and, on this basis, manually draw samples and use a confusion matrix to evaluate the classification accuracy of the water body and non-water body. The results are shown in Table 1. Stokes polarization decomposition has the highest accuracy in extracting the water body, and the classification accuracy can reach 0.9915, which is higher than the accuracy of 0.9868 by using the VV band and 0.9680 by using the VH band. It can be seen that the proposed method has a small improvement in the extraction of water bodies compared with the traditional method, but the physical meaning is clearer.
Above all, from the results of polarization decomposition, the Stokes decomposition parameters have a good ability to identify the edge of the lake water body, and the adoption of the Stokes decomposition parameters can clearly distinguish vegetation, water bodies, and mudflat land, which plays a key role in the accurate extraction of the subsequent water area.

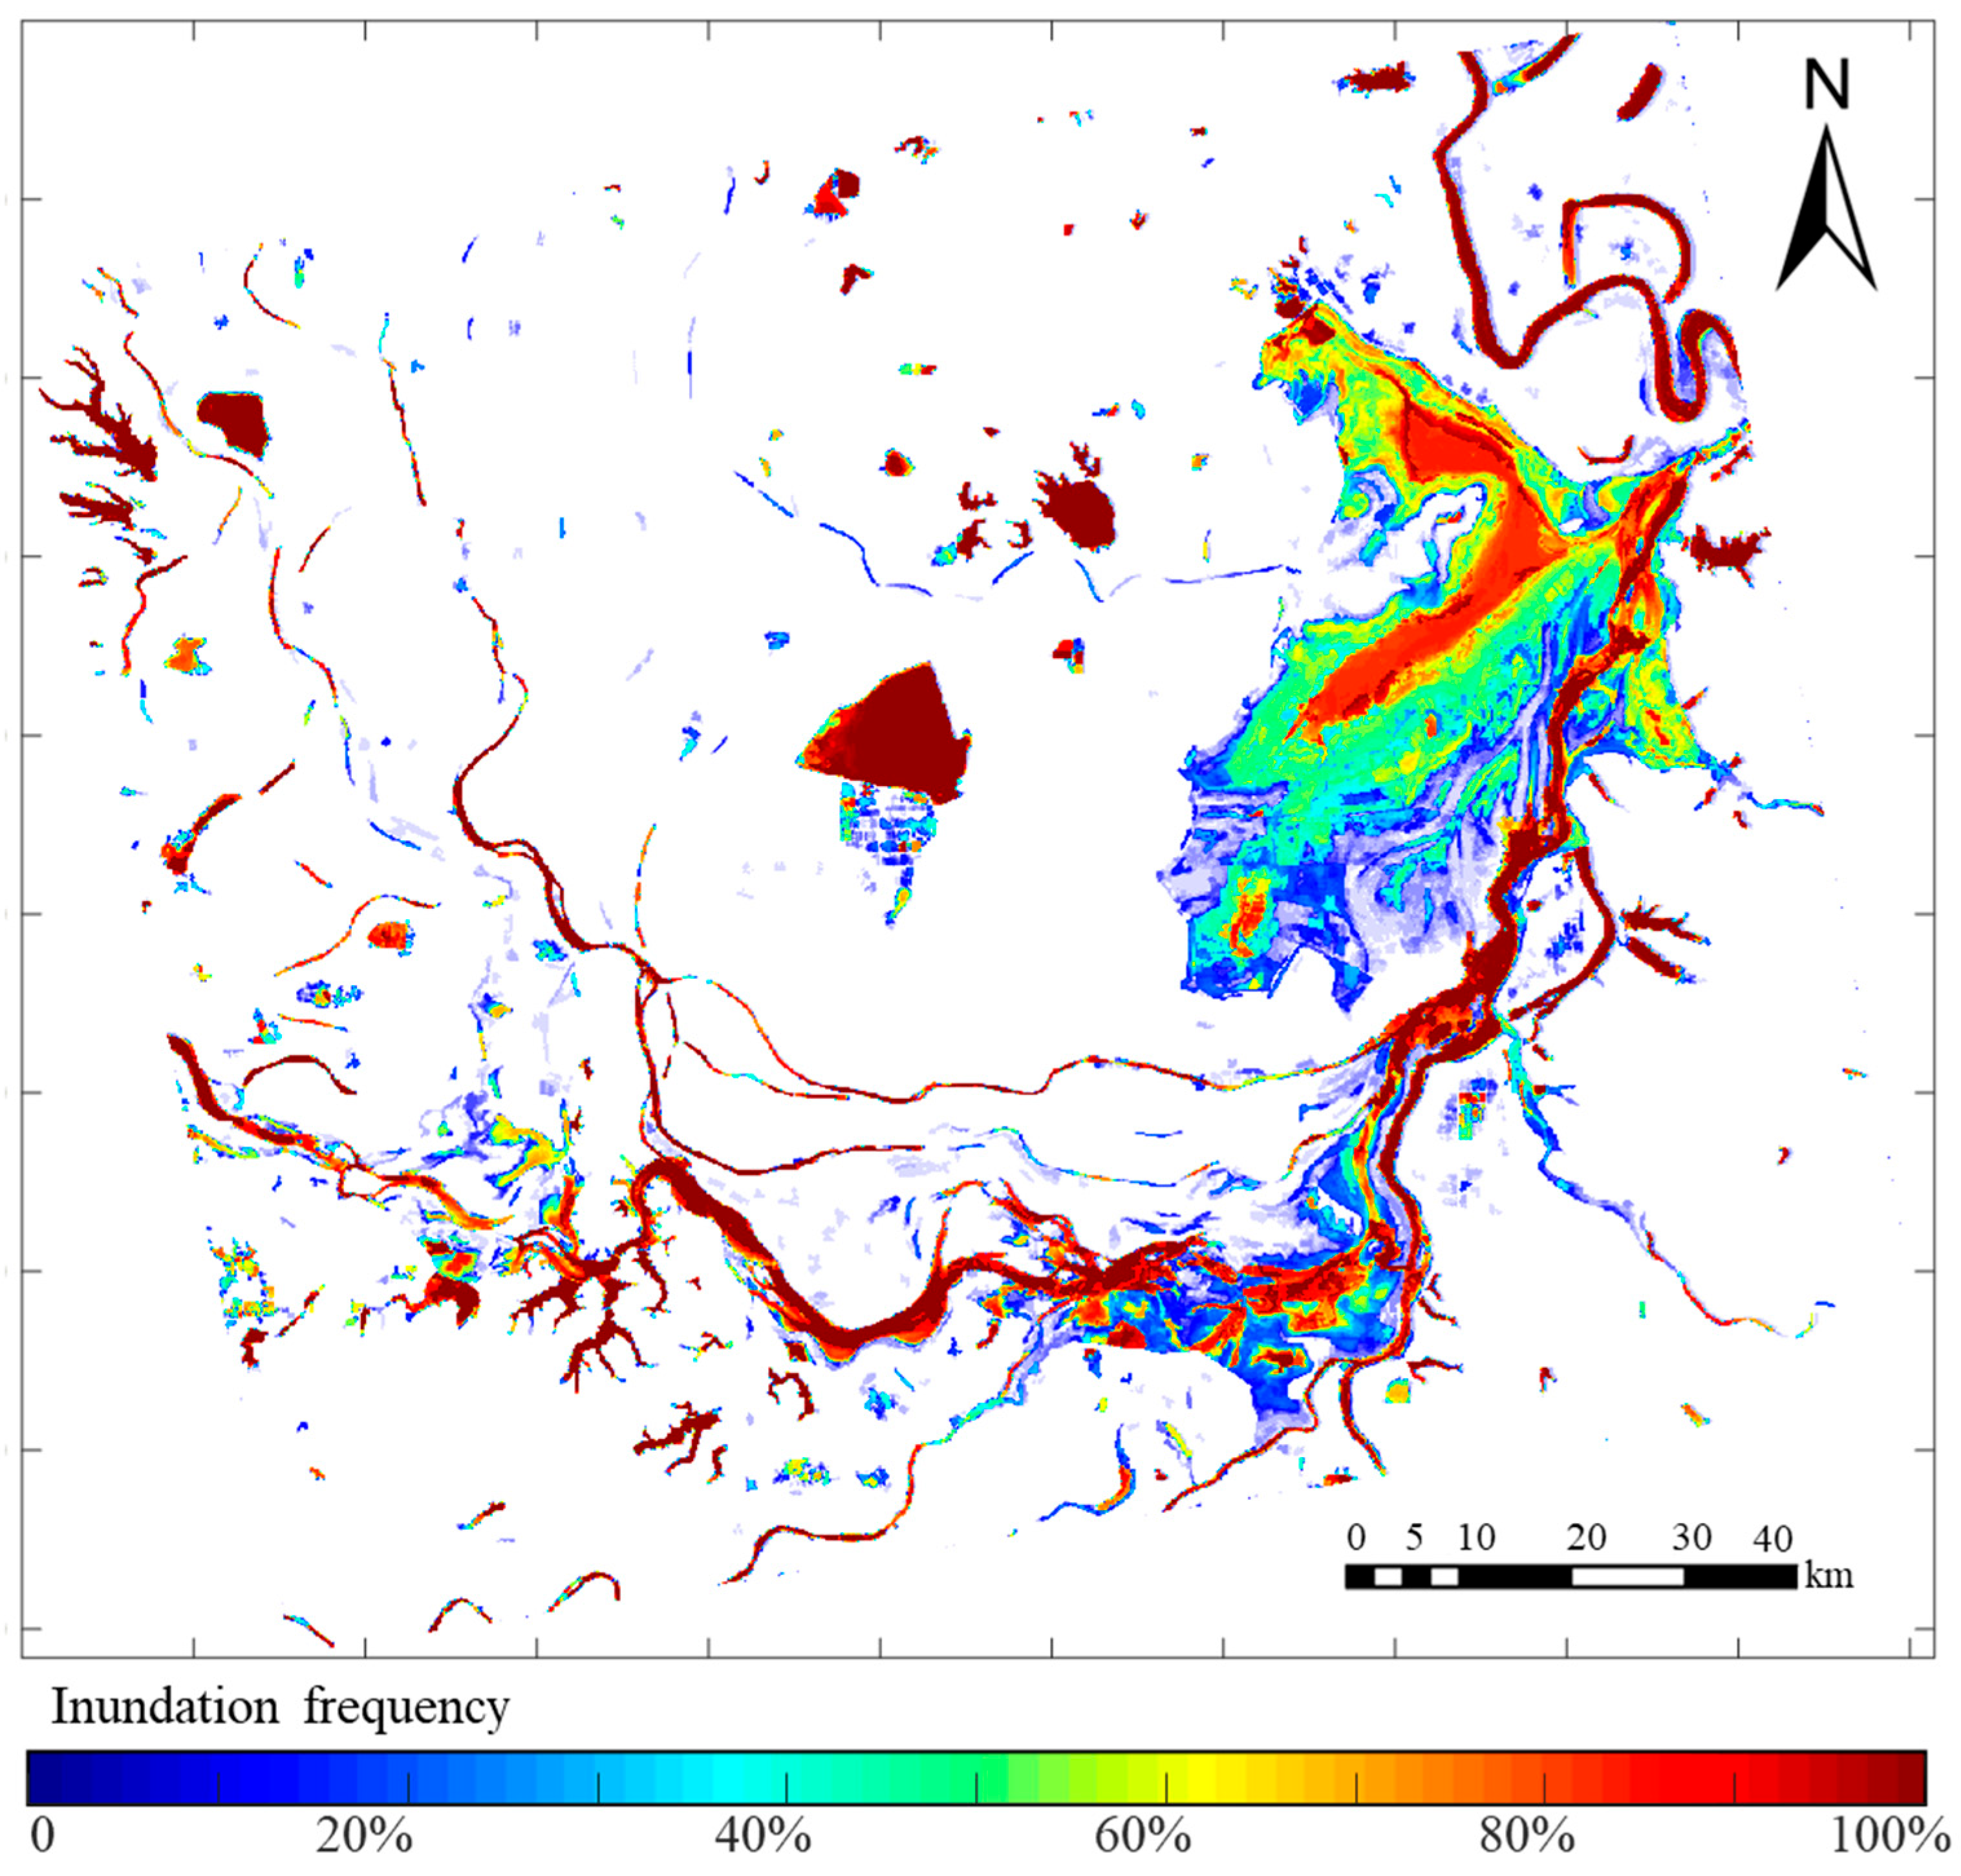
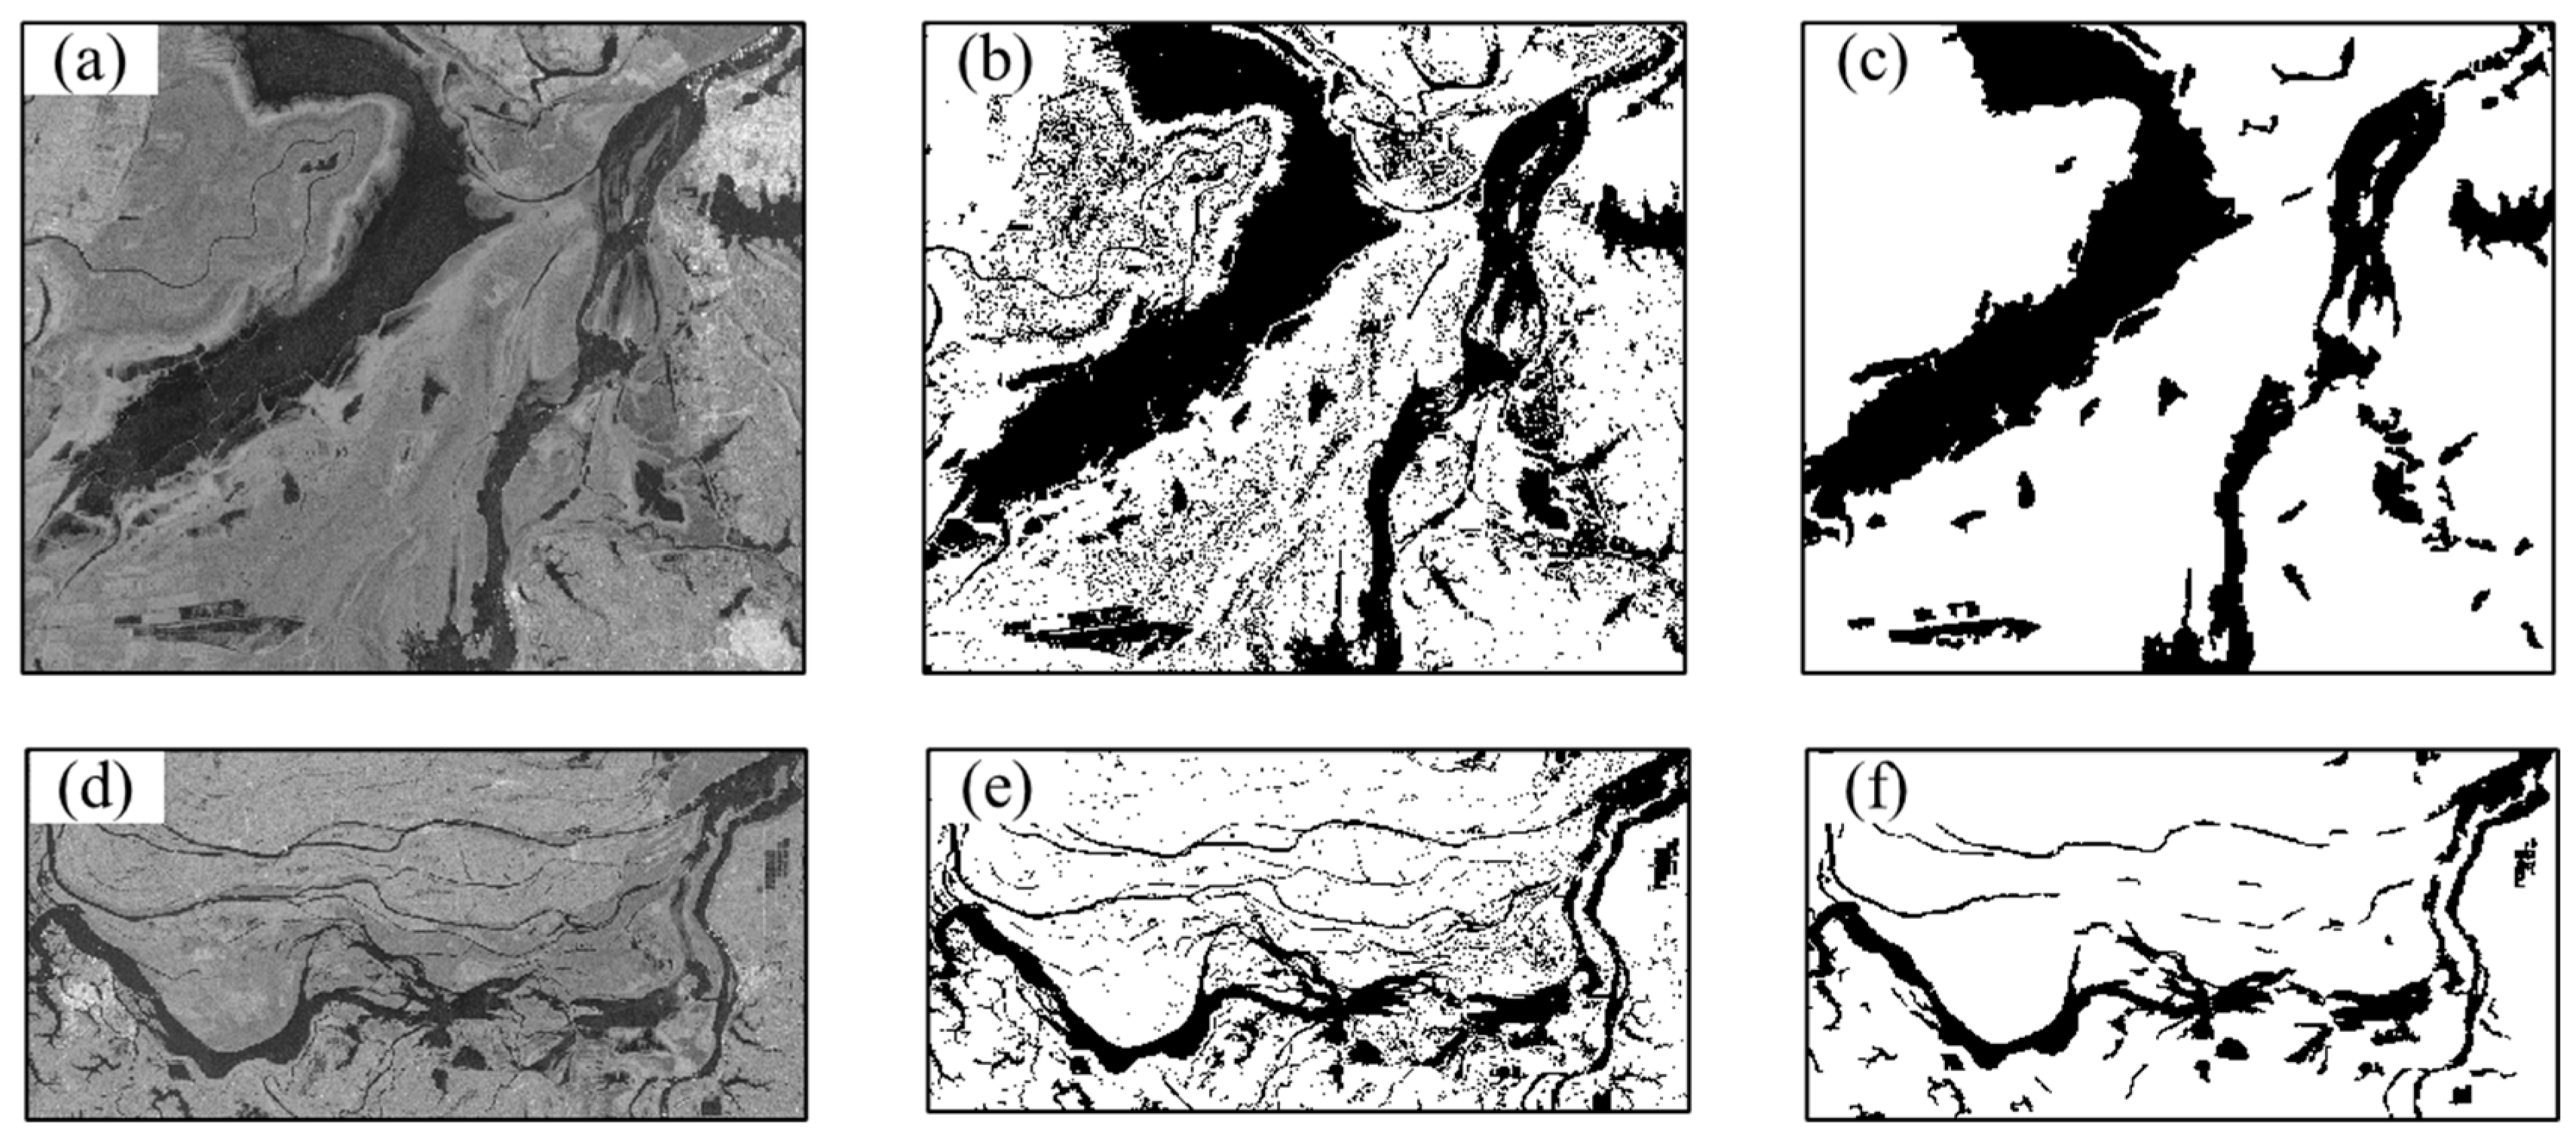
3.2. Dongting Lake Water Area Extraction

The dynamic Dongting Lake water area based on Sentinel-1 data from 2018 to 2022 is obtained using the proposed method. Due to the large amount of data, the water frequency map is used to concisely represent the dynamic changes in the Dongting Lake waters, as shown in Figure 8.
As shown in Figure 8, we can see that both the tributaries and the main lake of Dongting Lake are shown in red, indicating that there is water all year round. In the East Dongting Lake area, we find a very interesting phenomenon; the edge of the lake shows a gradual color, and the innermost part of the lake is red, indicating that the inner lake is covered with water all year round. Gradually, the edges of the lake turn orange, and the mudflats are gradually covered by water due to seasonal changes in the lake. Then, gradually, the edge of the lake becomes green, this part of the area is mainly low shrubs, and the drowning frequency is about 50%, indicating that it will be completely submerged for half a year, which is in line with the seasonal change of river swelling. In the outermost circle, the lake’s edge is blue, indicating that a small portion of farmland is flooded during periods of high water. This is consistent with the profile of Dongting Lake wetland in Figure 1b, and the result reconfirms the need to analyze the lake margin and indirectly reflects the advantages of Stokes decomposition.
Figure 9 shows the variation curve of the Dongting Lake basin area over time. According to the curve, the minimum water area of Dongting Lake is 570.91 km2, the maximum is 2587.92 km2, and the average water area is 1124.27 km2. In the past five years, it is obvious that the overall water area of Dongting Lake in 2018, 2019, and 2021 is relatively small. In 2020, the overall water area of Dongting Lake is largest, which coincides with the historical hydrological data and the climate of more rainfall and a longer flood season in 2020 [29]. As observed from Figure 9, the changes in the Dongting Lake water area present obvious seasonal rules where the water area presents an increasing trend in the first half of the year and a decreasing trend in the second half of the year. The water area increases slowly from January to May, reaches its peak in August, drops sharply from September to December, and drops to the minimum value of the whole year. Generally, Dongting Lake is in the dry period in winter and the wet period in summer. From January to March, the area of Dongting Lake is unchanged, and the smallest in the whole year. The water area starts to increase slowly from March to May. From May, the water area of Dongting Lake increases sharply and reaches the maximum of the whole year in July and August when the wet season comes. Since September, the water area of Dongting Lake gradually decreases and reaches the minimum in December. This seasonal change is the general rule of the water area in a year, while the Dongting Lake basin area will also be biased every year due to other factors (for example, rainfall).

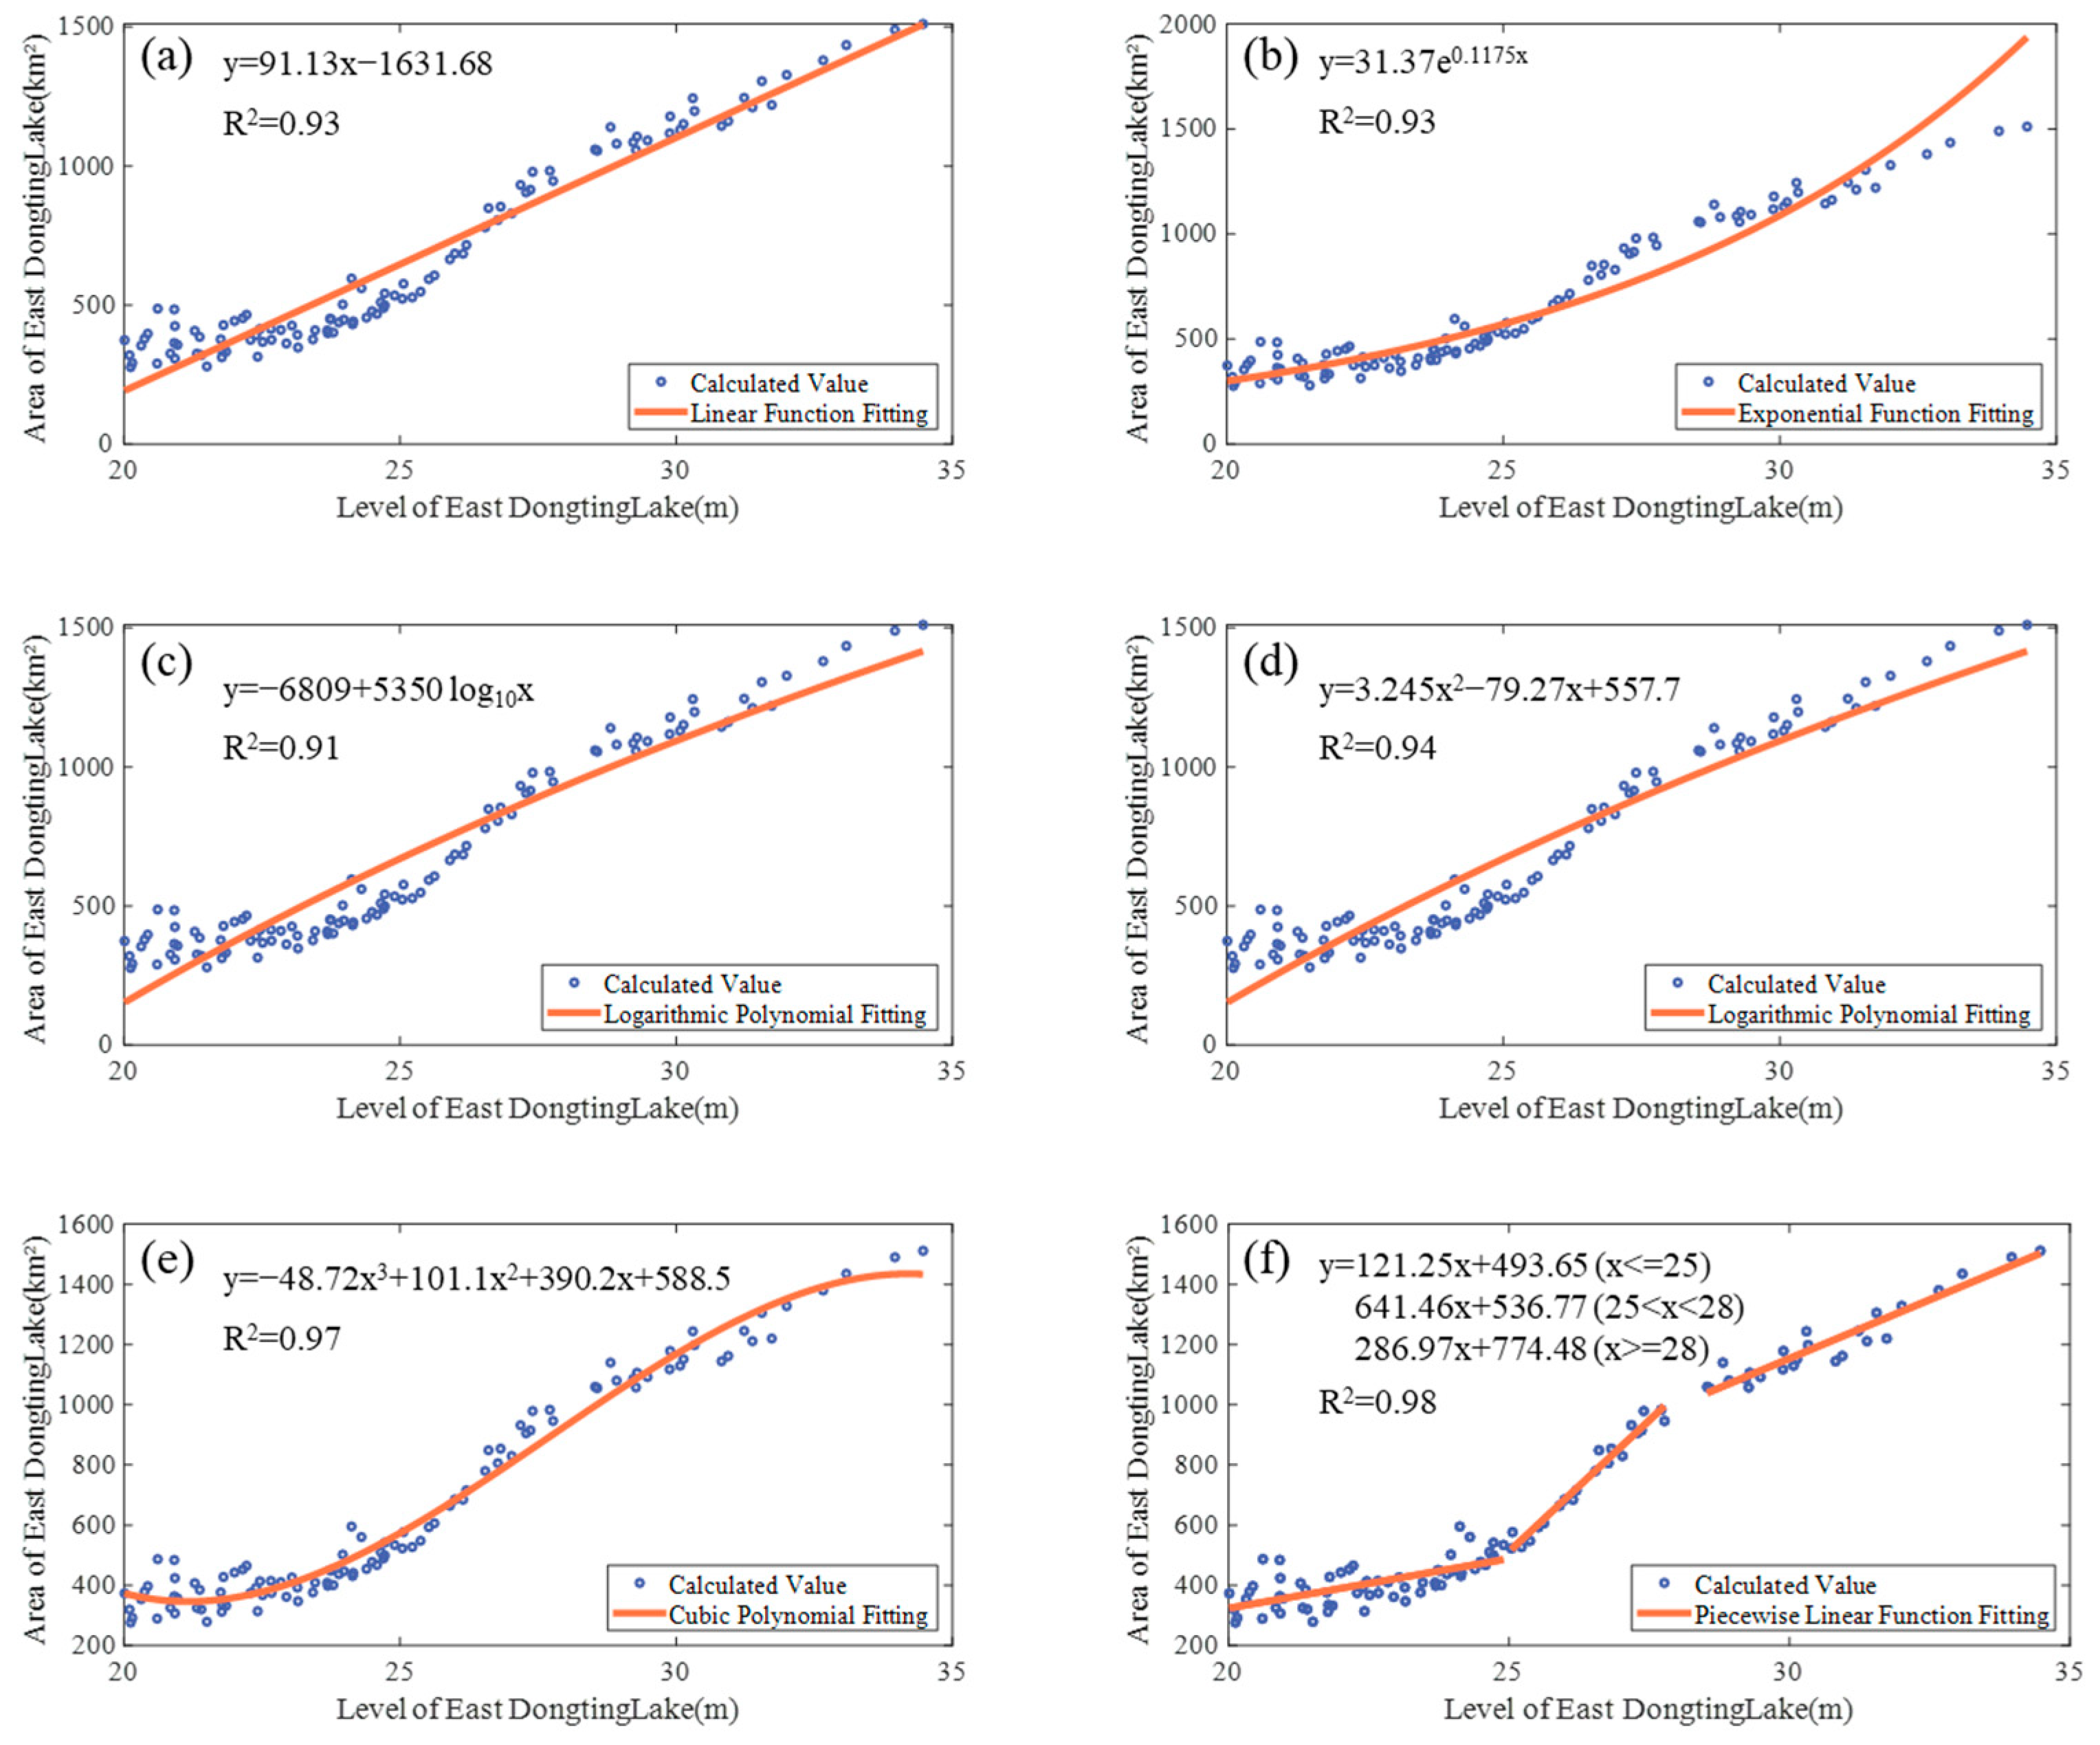
3.3. Relation between Area and Water Level of East Dongting Lake

The relationship between water area and water level height is one of the indicators describing the change in the water situation in a lake area, and the accurate expression of the relationship is of great significance to the protection of the ecological environment and policy-making in a lake area [3]. According to the vector file of the East Dongting Lake basin drawn manually, the area within the East Dongting Lake region is calculated. The relationship between the acquired water area and the screened water level of East Dongting Lake provided by the Chenglingji Water Level Observation Station is established and shown in Figure 10. Through statistical analysis, the average water level of East Dongting Lake is 22.81 m and the average water area of East Dongting Lake is 660.02 km2. The highest water level of East Dongting Lake is 34.47 m and the largest water area of East Dongting Lake is 1511.35 km2. The minimum water level is 20.01 m and the minimum area is 276.56 km2. According to the curve in Figure 10, the water area of East Dongting Lake has a high consistency with the variation trend in water level, which indirectly confirms the correctness of the calculation of the water level area of Dongting Lake, and further confirms the effectiveness of extracting lake water by using the Stokes polarization decomposition parameters.
As seen from Figure 10, when the water area is larger and the water level is higher, the closer the two curves are, the more obvious the relationship between them is. However, when the water area is small, the water level curve is usually lower than the water area curve and the fitting of the two is not ideal. This is usually due to the small water area in the dry season, the main part is unclear, and it is difficult to distinguish the water body from the background by using the global threshold segmentation method. In the wet season, the water area of the lake covers a large area, the main part of the image is clear, and it is easy to distinguish from the background. We discuss this issue in detail in the following section.
The relationship between the water level and the water area of Dongting Lake has been studied by many scholars [47,48,49,50,51,52,53,54,55,56,57]. The regression function model is mainly used to describe the correlation between the water area and water level elevation. Due to the different calculation methods for the water area and the different states of Dongting Lake at different times, it is impossible to use the same model to express the water level and water area. Therefore, according to the experimental data, we need to choose the most accurate regression relationship to describe the relationship between the water area and water level elevation of East Dongting Lake. In this paper, we draw the scatter plot of the water area and water level data of East Dongting Lake and adopt several common function models (including linear function, exponential function, logarithmic function, quadratic polynomial, cubic polynomial, and piecewise linear function) to fit the water level and water area of East Dongting Lake. The fitting curves of each function model are shown in Figure 11. The experimental data scatter is denser in the low-water area region, while it is more discrete in the high-water area region. To obtain a more accurate function model, we should pay more attention to the fitting of the low-water area. According to the fitting curve, all six regression models can achieve a better fitting effect on the whole. For the low-water-level data interval, the polynomial model and piecewise linear function have a better fitting effect, and the overall deviation is small. Using a linear function model will lead to the overestimation of the water area. Using an exponential function model, the water area will be both overestimated and underestimated in different-water-level-data intervals. Using a logarithmic function model will also produce the overestimation phenomenon. In general, both the cubic polynomial model and piecewise linear function model can achieve a good fitting effect. Since the water level and area of the lake are affected by the topography of the riparian, we think that the piecewise linear function describes the A–E relationship more appropriately.
The functional relationship expression and the corresponding correlation coefficient R2, obtained by using different functional models, are shown in Table 2. Above them, the piecewise linear function has the highest correlation coefficient R2 of 0.98 and the lowest RMSE of 47.81 km2, which can provide a reliable A–E model. The water level data can not only be used as the initial data of the water level prediction model but can also be used to verify the accuracy of water area extraction. Through the established A–E relationship, we can also indirectly illustrate the reliability of the water area extraction method.
Yi et al. used a small amount of water level data of Dongting Lake and water area data calculated via a TM image to carry out linear regression fitting and obtained an R2 of 0.95 [53]. Song et al. used a MODIS NDVI index model to extract water bodies and used quadratic polynomials to fit the relationship between the water level and water area of Dongting Lake, and the R2 was 0.91 [54]. Du et al. extracted the water body area by using the NDVI and RVI based on MODIS data, established the relationship between the water level and water body area of Dongting Lake by using a stepwise multiple regression method, and obtained the highest R2 of 0.97 [55]. Ke et al. extracted the water area of Dongting Lake by using Terra/MODIS L1B remote sensing data and studied the water area and water level by using a rope curve, and the R2 was 0.94 [56]. Wang et al. used quintic polynomials to study the water level of East Dongting Lake while the water area was calculated by 97 Landsat images, and the R2 was 0.97 [57].
The proposed method uses a piecewise linear function model to fit the water level elevation and water area, and the R2 can reach 0.98, which is higher than the existing method [53,54,55,56,57]. From a data point of view, most of the existing methods use optical images to calculate the lake water area. Optical images find it difficult to penetrate clouds and fog, and the number of reliable images obtained is small, resulting in fewer data fitting parameter functions and the inaccuracy of fitting results. We choose 120 instances of Sentinel-1 SAR data to calculate the lake water area, with the idea being that more abundant data result in more reliable fitting results. From the perspective of the method, this paper makes full use of dual-polarization information, interprets the surface features from the perspective of polarization decomposition, and can better distinguish the lake water area from the edge surface features as well as calculate the lake water area more accurately.
According to the fitting in Figure 11 and the correlation results in Table 2, the piecewise linear function model has the highest accuracy and the best fitting effect among all of the fitting models. Therefore, we intend to use this model to describe the relationship between water level and water area of East Dongting Lake (A–E model), which can be used to fill in and forecast the water level data. The fitting quintic model expression is as follows:
y = 121.25 x + 493.65 , x 25 641.46 x + 536.77 , 25 < x < 28 286.97 x + 774.48 , x 28
where x represents the water level of East Dongting Lake after standardization, the standardization process of which is x = ( x 0 25.14 ) / 3.677 ; and y represents the water area of East Dongting Lake.

3.4. The Predicted Water Area and Water Level

For the piecewise linear function model constructed using the proposed method, to prove the effectiveness of the A–E relationship, we choose eight-scene Sentinel-1 SAR data from 2017, use the proposed method to calculate the water area of East Dongting Lake, and choose the A–E relationship established in this paper to predict the water level. The comparison with the measured water level data is shown in Table 3.
From Table 3, the RMSE between the predicted water level and measured water level data is 0.4857 m, and the R2 is 0.9930. The results show that the A–E relationship established in this paper is reliable, and the accurate establishment of the A–E relationship can be used to monitor the water level of the lakes lacking hydrological observation stations.
As the observation interval of a hydrological observation station is 1 day, water level data are often missing due to the failure of detection instruments, extreme climate, and other problems. In this paper, there are a large number of instances of missing water level data during the 5-year time series observation time. Combined with the acquisition time of SAR images, there are 11 instances of data with normal SAR image acquisition but missing water level data. For the vacant water level data of the Chenglingji Observation Station, the water area of East Dongting Lake at the same time is calculated based on SAR images, and the piecewise linear function model obtained using the above fitting method is used to predict it. The prediction results of the 11 instances of vacant water level data are shown in Table 4.

3.5. Method Performance Analysis

This study makes full use of dual-polarization data information and improves the ability to identify water bodies based on Stokes polarization decomposition theory. The advantages of the proposed method have been described in the previous sections, and in this section, we focus more on the disadvantages of the method. Due to the simplicity of the water area segmentation algorithm and the singleness of the water area extraction algorithm, the proposed water area extraction method needs further research.

3.5.1. Water Body Segmentation Algorithm

In terms of the water segmentation algorithm, since it has been verified that the polarization decomposition parameters have good recognition ability for water bodies, and gray images combined with polarization decomposition parameters have obvious bimodal characteristics, this paper does not evaluate too much the water segmentation algorithm and chooses the most convenient and widely used Otsu threshold segmentation algorithm. The defect of the threshold extraction algorithm is that the segmentation results are relatively broken and there is too much noise. Therefore, it is usually necessary to further process the results after threshold segmentation. In this paper, we choose morphological processing, median filtering, connected domain removal, and other methods. When various post-treatment methods are used to remove the surrounding non-lake water, the water extraction results are smooth, but the continuity of the lake water is sacrificed.
Figure 12 shows the water extraction results of the East Dongting Lake region and South Dongting Lake region on 11 February 2018. Figure 12a–c, respectively, show the grayscale of the combined parameters of polarization decomposition, the image after Otsu threshold segmentation, and the final water extraction results after post-processing of the East Dongting Lake. On the whole, the water area extraction result of East Dongting Lake is good, and it can clearly distinguish the water body of the lake from that of the small river, which plays a good role in the calculation of the water area of the whole lake.
Figure 12d–f, respectively, show the grayscale of the combined parameters of polarization decomposition, the image after Otsu threshold segmentation, and the final water extraction results after post-processing of South Dongting Lake. According to Figure 12d and the basic situation of the Dongting Lake basin described above, South Dongting Lake is also a wetland with the coexistence of farmland and forest land. The Dongting Lake basin is rich in water resources and has many tributaries, and the farmland is mainly dominated by rice fields. It can be seen that Otsu threshold segmentation can distinguish the water body from the background, and the extraction of water bodies within the region is relatively accurate. However, water in farmland, water in small rivers, and noise have a great impact on the extraction results of lake water bodies. As shown in Figure 12e, we can see that in addition to the lake water body itself, there is a lot of little noise around. Figure 12f shows the final results of water extraction from South Dongting Lake after morphological processing, median filtering, connectivity domain removal, and other operations. According to the results, the final extracted lake water body is smooth, and the main part of the whole lake is well distinguished, but continuity is missing in some areas, especially in the small river tributaries, such as the upper part of the image. There will be intermittent broken water.
The water area of Dongting Lake mainly comes from the area of the lake body and main rivers. The surrounding small rivers have a wide distribution range and complex shape, and the water area of this part can be ignored. Therefore, although the method in this paper has certain limitations, it has little influence on the calculation of the water area of Dongting Lake. It is worth noting that if it is necessary to obtain the dynamic changes in the rivers around Dongting Lake, the method proposed in this paper will achieve a relatively poor effect.

3.5.2. Water Area Extraction

From the verification results of the water level data, the water area extracted using the method in this paper is relatively accurate, but in a few cases, the water area will be underestimated (Figure 10: the blue curve is lower than the red curve), and there is a large difference between the water area of Dongting Lake in the wet season and the dry season. Figure 13 shows the comparison of water yield extraction results of Dongting Lake in 2019 during the wet season and the dry season. In the wet season, the water yield is more accurate. When it is located in the dry period, there is a large error in the water extraction junction in the wet period. In the wet season, the water area is relatively large, and the threshold value is easily distinguishable from the surrounding background. However, in the dry season, the water body shrinks, and the water area accounts for only a small part, which will lead to poor differentiation between the water body part and the background during threshold segmentation, to inaccurate threshold extraction, and to difficult identification of the water body part, thus affecting the accuracy of water area extraction.
It is worth noting that the extraction of the water area of the dry period is inaccurate, mainly referring to the dry period of special drought, and in a normal year, it may only be a specific period, but not most of the period. Therefore, we can use the water area calculated in this paper to estimate the water level. For the part where the water area is underestimated, we need to consider using the local threshold method to extract the water area and expand the separation degree of water bodies and backgrounds in subsequent studies.

4. Conclusions

Based on the Sentinel-1 VV + VH dual-polarimetric SAR data from 2018 to 2022, a Stokes polarization decomposition method based on a generalized model is used to decompose SAR images into a volume scattering part and a polarization scattering part. The Otsu threshold segmentation method and morphological method are used to obtain more accurate dynamic extraction results of the Dongting Lake water area. By analyzing the relationship between water level and water area, the relationship model of water level elevation and water area is determined, and the vacant water level data are predicted.
(1)
As for the Stokes polarization decomposition method, this paper proves that it has a certain classification ability in the Dongting Lake wetland and can distinguish water from other types of ground objects. At the edge of Dongting Lake, this method makes full use of Sentinel-1 SAR data polarization information and can clearly distinguish between dry mudflats and lake water, which is of great significance for the accurate extraction of water areas.
(2)
For the extraction of the water area of Dongting Lake, this paper combines Otsu threshold segmentation, morphological processing, and connected domain removal methods to obtain accurate and reliable water extraction results and realize the long-term dynamic monitoring of the Dongting Lake area. The Otsu threshold segmentation algorithm has a good effect on the segmentation of the Stokes polarization decomposition parameters and can obtain a binary segmentation map of water quickly and easily. The interference of other small water areas can be eliminated through morphological filtering and connected domain removal. For areas with more clouds and rain, SAR data can make up for the shortage of optical images and obtain accurate water areas, to realize the dynamic monitoring of lake areas.
(3)
For the relationship between the water area and water level of East Dongting Lake, this paper uses several different functional models to describe the relationship between them and finds that the piecewise linear function model can better fit the water area and water level of East Dongting Lake (R2 = 0.98). At the same time, we use the measured water level data to verify the obtained function model. It is found that the RMSE of the water level predicted by the model is 0.4857 m, and the R2 is 0.9930, which further confirms the reliability of the A–E relationship constructed using the method in this paper and provides a good idea for the water level monitoring of lakes lacking hydrological observation stations.

Author Contributions

Conceptualization, Q.S.; methodology, Q.S.; software, Q.S.; validation, Q.S. and R.Z.; formal analysis, Q.S., H.F., and Y.L.; investigation, Q.S. and Y.L.; resources, R.Z.; data curation, Q.S.; writing—original draft preparation, Q.S.; writing—review and editing, R.Z., H.F., J.Z., and Y.L.; visualization, Q.S.; supervision, R.Z. and H.F.; project administration, R.Z., H.F., J.Z., and Y.L; funding acquisition, Q.S., R.Z., H.F., J.Z., and Y.L. All authors have read and agreed to the published version of the manuscript.

Funding

This research was supported in part by the Open Topic Foundation of Hunan Key Laboratory of Remote Sensing Monitoring of Ecological Environment in the Dongting Lake area (grant no. DTH Key Lab.2021-012). This study was also supported in part by the National Natural Science Foundation of China (grant nos. 42104016, 42330717, 62207032, 42074016), the Fundamental Research Funds for the Central Universities of Central South University (grant no. 2023ZZTS0471), and the introduction of the talent research start-up fund of the Central South University of Forestry and Technology (grant no. 2021YJ010).

Data Availability Statement

No new data were created or analyzed in this study. Data sharing does not apply to this article.

Acknowledgments

The Sentinel-1 A and Sentinel-2 A satellite images were provided by the Copernicus mission of the European Space Agency. The reference water surface levels were provided by the Hunan Key Laboratory of Remote Sensing Monitoring of Ecological Environment in the Dongting Lake area.

Conflicts of Interest

The authors declare no conflict of interest.

References

  1. Allen, M.R.; Ingram, W. Constraints on future changes in climate and the hydrologic cycle. Nature 2002, 419, 224–232. [Google Scholar] [CrossRef] [PubMed]
  2. Lehner, B.; Döll, P. Development and validation of a global database of lakes, reservoirs and wetlands. J. Hydrol. 2004, 296, 1–22. [Google Scholar] [CrossRef]
  3. Ding, X.; Li, X. Monitoring of the water-area variations of Lake Dongting in China with ENVISAT ASAR images. Int. J. Appl. Earth Obs. Geoinf. 2011, 13, 894–901. [Google Scholar] [CrossRef]
  4. Smith, L.C.; Sheng, Y.; MacDonald, G.M.; Hinzman, L.D. Disappearing Arctic Lakes. Science 2005, 308, 1429. [Google Scholar] [CrossRef]
  5. Vörösmarty, C.J.; Green, P.; Salisbury, J.; Lammers, R.B. Global Water Resources: Vulnerability from Climate Change and Population Growth. Science 2000, 289, 284–288. [Google Scholar] [CrossRef] [PubMed]
  6. Woolway, R.; Kraemer, B.; Lenters, J.; Merchant, C.; Oreilly, C.; Sharma, S. Global lake responses to climate change. Nat. Rev. Earth Environ. 2020, 1, 388–403. [Google Scholar] [CrossRef]
  7. Wilby, R.; Battarbee, R.; Kernan, M.; Wade, A. A Review of the Potential Impacts of Climate Change on Surface Water Quality. Hydrol. Sci. J. 2009, 54, 101–123. [Google Scholar] [CrossRef]
  8. Zhang, G.Q.; Xie, H.J.; Kang, S.C.; Yi, D.H.; Ackley, S.F. Monitoring lake level changes on the Tibetan Plateau using ICESat altimetry data (2003–2009). Remote Sens. Environ. 2011, 115, 1733–1742. [Google Scholar] [CrossRef]
  9. Gao, H.L. Satellite remote sensing of large lakes and reservoirs: From elevation and area to storage. Wiley Interdiscip. Rev. Water 2015, 2, 147–157. [Google Scholar] [CrossRef]
  10. Palmer, S.C.J.; Kutser, T.; Hunter, P.D. Remote sensing of inland waters: Challenges, progress and future directions. Remote Sens. Environ. 2015, 157, 1–8. [Google Scholar] [CrossRef]
  11. Liang, K.; Li, Y. Changes in Lake Area in Response to Climatic Forcing in the Endorheic Hongjian Lake Basin, China. Remote Sens. 2019, 11, 3046. [Google Scholar] [CrossRef]
  12. Aslam, R.W.; Shu, H.; Yaseen, A.; Sajjad, A.; Abidin, S.Z.U. Identification of time-varying wetlands neglected in Pakistan through remote sensing techniques. Environ. Sci. Pollut. Res. 2023, 30, 74031–74044. [Google Scholar] [CrossRef]
  13. Bishop-Taylor, R.; Sagar, S.; Lymburner, L.; Alam, I.; Sixsmith, J. Sub-Pixel Waterline Extraction: Characterising Accuracy and Sensitivity to Indices and Spectra. Remote Sens. 2019, 11, 2984. [Google Scholar] [CrossRef]
  14. Yu, L.; Liu, T. The Impact of Artificial Wetland Expansion on Local Temperature in the Growing Season—The Case Study of the Sanjiang Plain, China. Remote Sens. 2019, 11, 2915. [Google Scholar] [CrossRef]
  15. Frazier, P.S.; Page, K.J. Water body detection and delineation with Landsat TM data. Photogramm. Eng. Remote Sens. 2000, 66, 1461–1467. [Google Scholar] [CrossRef]
  16. Berthon, J.F.; Zibordi, G. Optically black waters in the northern Baltic Sea. Geophys. Res. Lett. 2010, 37, L09605. [Google Scholar] [CrossRef]
  17. Fisher, A.; Flood, N.; Danaher, T. Comparing Landsat water index methods for automated water classification in eastern Australia. Remote Sens. Environ. 2016, 175, 167–182. [Google Scholar] [CrossRef]
  18. McFeeters, S.K. The use of the Normalized Difference Water Index (NDWI) in the delineation of open water features. Int. J. Remote Sens. 1996, 17, 1425–1432. [Google Scholar] [CrossRef]
  19. Xu, H. Modification of normalised difference water index (NDWI) to enhance open water features in remotely sensed imagery. Int. J. Remote Sens. 2006, 27, 3025–3033. [Google Scholar] [CrossRef]
  20. Pei, Y. A Study on Information Extraction of Water System in Semi-arid Regions with the Enhanced Water Index (EWI) and GIS Based Noise Remove Techniques. Remote Sens. Inf. 2007, 6, 62–67. [Google Scholar] [CrossRef]
  21. Feyisa, G.L.; Meilby, H.; Fensholt, R.; Proud, S. Automated Water Extraction Index: A New Technique for Surface Water Mapping Using Landsat Imagery. Remote Sens. Environ. 2014, 140, 23–35. [Google Scholar] [CrossRef]
  22. Markert, K.N.; Chishtie, F.A.; Anderson, E.R.; Saah, D.S.; Griffin, R.E. On the merging of optical and SAR satellite imagery for surface water mapping applications. Results Phys. 2018, 9, 275–277. [Google Scholar] [CrossRef]
  23. Brisco, B.; Touzi, R.; van der Sanden, J.J.; Charbonneau, F.; Pultz, T.J.; D’Iorio, M. Water resource applications with RADARSAT-2-a preview. Int. J. Digit. Earth 2008, 1, 130–147. [Google Scholar] [CrossRef]
  24. Shen, G.Z.; Guo, H.D.; Liao, J.J. Object oriented method for detection of inundation extent using multi-polarized synthetic aperture radar image. J. Appl. Remote Sens. 2008, 2, 23512. [Google Scholar] [CrossRef]
  25. Tsyganskaya, V.; Martinis, S.; Marzahn, P. Flood Monitoring in Vegetated Areas Using Multitemporal Sentinel-1 Data: Impact of Time Series Features. Water 2019, 11, 1938. [Google Scholar] [CrossRef]
  26. Westerhoff, R.S.; Kleuskens, M.P.H.; Winsemius, H.C.; Huizinga, H.J.; Brakenridge, G.R.; Bishop, C. Automated global water mapping based on wide-swath orbital synthetic-aperture radar. Hydrol. Earth Syst. Sci. 2013, 17, 651–663. [Google Scholar] [CrossRef]
  27. Twele, A.; Cao, W.; Plank, S.; Martinis, S. Sentinel-1-based flood mapping: A fully automated processing chain. Int. J. Remote Sens. 2016, 37, 2990–3004. [Google Scholar] [CrossRef]
  28. Zhang, B.; Liu, G.X.; Zhang, R.; Fu, Y.; Liu, Q.; Cai, J.L.; Wang, X.W.; Li, Z.L. Monitoring Dynamic Evolution of the Glacial Lakes by Using Time Series of Sentinel-1A SAR Images. Remote Sens. 2021, 13, 1313. [Google Scholar] [CrossRef]
  29. Wang, Z.R.; Xie, F.; Ling, F.; Du, Y. Monitoring Surface Water Inundation of Poyang Lake and Dongting Lake in China Using Sentinel-1 SAR Images. Remote Sens. 2022, 14, 3473. [Google Scholar] [CrossRef]
  30. Binh, P.D.; Prigent, C.; Aires, F. Surface Water Monitoring within Cambodia and the Vietnamese Mekong Delta over a Year, with Sentinel-1 SAR Observations. Water 2017, 9, 366. [Google Scholar] [CrossRef]
  31. Amitrano, D.; Di Martino, G.; Iodice, A.; Riccio, D.; Ruello, G. Unsupervised Rapid Flood Mapping Using Sentinel-1 GRD SAR Images. IEEE Trans. Geosci. Remote Sens. 2018, 56, 3290–3299. [Google Scholar] [CrossRef]
  32. Liang, J.Y.; Liu, D.S. A local thresholding approach to flood water delineation using Sentinel-1 SAR imagery. ISPRS J. Photogramm. 2020, 159, 53–62. [Google Scholar] [CrossRef]
  33. Cloude, S.R.; Pottier, E. A review of target decomposition theorems in radar polarimetry. IEEE Trans. Geosci. Remote Sens. 1996, 34, 498–518. [Google Scholar] [CrossRef]
  34. Mascolo, L.; Cloude, S.R.; Lopez-Sanchez, J.M. Model-Based Decomposition of Dual-Pol SAR Data: Application to Sentinel-1. IEEE Trans. Geosci. Remote Sens. 2022, 60, 1. [Google Scholar] [CrossRef]
  35. Otsu, N. A Threshold Selection Method from Gray-Level Histograms. IEEE Trans. Syst. Man Cybern. 1979, 9, 62–66. [Google Scholar] [CrossRef]
  36. Serra, J.P.F. Image Analysis and Mathematical Morphology; International Biometric Society: Washington, DC, USA, 1983; Volume 39, pp. 536–537. [Google Scholar] [CrossRef]
  37. Du, Y.; Xue, H.P.; Wu, S.J.; Ling, F.; Xiao, F.; Wei, X.H. Lake area changes in the middle Yangtze region of China over the 20th century. J. Environ. Manag. 2011, 92, 1248–1255. [Google Scholar] [CrossRef]
  38. Zhang, J.Q.; Xu, K.Q.; Yang, Y.H.; Qi, L.H.; Hayashi, S.; Watanabe, M. Measuring water storage fluctuations in Lake Dongting, China, by Topex/Poseidon satellite altimetry. Environ. Monit. Assess. 2006, 115, 23–37. [Google Scholar] [CrossRef]
  39. Yuan, Y.; Zeng, G.; Liang, J.; Huang, L.; Hua, S.; Li, F.; Zhu, Y.; Wu, H.; Liu, J.; He, X.; et al. Variation of water level in Dongting Lake over a 50-year period: Implications for the impacts of anthropogenic and climatic factors. J. Hydrol. 2015, 525, 450–456. [Google Scholar] [CrossRef]
  40. Zhao, S.Q.; Fang, J.Y. Impact of impoldering and lake restoration on land-cover changes in Dongting Lake area, Central Yangtze. AMBIO 2004, 33, 311–315. [Google Scholar] [CrossRef]
  41. ESA. Sentinel-1 Technical Guides. Available online: https://sentinel.esa.int/web/sentinel/technical-guides/sentinel-1-sar (accessed on 2 July 2022).
  42. Torres, R.; Snoeij, P.; Geudtner, D.; Bibby, D.; Davidson, M.; Attema, E.; Potin, P.; Rommen, B.; Floury, N.; Brown, M.; et al. GMES Sentinel-1 mission. Remote Sens. Environ. 2012, 120, 9–24. [Google Scholar] [CrossRef]
  43. Mascolo, L.; Lopez-Sanchez, J.M.; Cloude, S.R. Thermal Noise Removal from Polarimetric Sentinel-1 Data. IEEE Geosci. Remote Sens. Lett. 2022, 19, 4009105. [Google Scholar] [CrossRef]
  44. Hajnsek, I.; Desnos, Y.-L. Polarimetric Synthetic Aperture Radar Principles and Application: Principles and Application; Springer: Cham, Swizerland, 2021. [Google Scholar] [CrossRef]
  45. Hamza, A.B.; Luque-Escamilla, P.L.; Martínez-Aroza, J.; Román-Roldán, R. Removing Noise and Preserving Details with Relaxed Median Filters. J. Math. Imaging Vis. 1999, 11, 161–177. [Google Scholar] [CrossRef]
  46. Cloude, S.; Pottier, E. An entropy based classication scheme for land applications of polarimetric SAR. Geosci. Remote Sens. IEEE Trans. 1997, 35, 68–78. [Google Scholar] [CrossRef]
  47. Liu, Y.; Jiang, C.; Long, Y.; Deng, B.; Jiang, J.; Yang, Y.; Wu, Z. Study on the Water Level–Discharge Relationship Changes in Dongting Lake Outlet Section over 70 Years and the Impact of Yangtze River Backwater Effect. Water 2023, 15, 2057. [Google Scholar] [CrossRef]
  48. Peng, D.Z.; Xiong, L.H.; Guo, S.L.; Shu, N. Study of Dongting Lake area variation and its influence on water level using MODIS data. Hydrol. Sci. J. 2005, 50, 31–44. [Google Scholar] [CrossRef]
  49. Duan, Z.; Bastiaanssen, W.G.M. Estimating water volume variations in lakes and reservoirs from four operational satellite altimetry databases and satellite imagery data. Remote Sens. Environ. 2013, 134, 403–416. [Google Scholar] [CrossRef]
  50. Lv, J.; Peng, J.H.; Zhang, D.Z.; Zhao, H.; Li, B. Application of Robust Estimation Method in Study of Relationship Between Lake’s Water Area and Water Level. J. Indian Soc. Remote Sens. 2018, 46, 1595–1603. [Google Scholar] [CrossRef]
  51. Kuraji, K.; Saito, H. Long-Term Changes in Relationship between Water Level and Precipitation in Lake Yamanaka. Water 2022, 14, 2232. [Google Scholar] [CrossRef]
  52. Wu, J.; Zhang, Q.; Li, Y.; Xu, C.-Y.; Ye, X. Spatial-temporal variations of stage-area hysteretic relationships in large heterogeneous lake–floodplain systems. J. Hydrol. 2023, 620, 129507. [Google Scholar] [CrossRef]
  53. Yi, L.; Li, X.; Mei, J. Studying on the relation of the area, the volume and the water of Dongting lake and evaluating about the ability to modulate and store the flood water. Hunan Geol. 2000, 19, 267–270. [Google Scholar]
  54. Song, Q. Study on the relationship between area and water level of Dongting Lake based on MODIS remote sensing images. Water Sav. Irrig. 2011, 20, 20–23. [Google Scholar]
  55. Du, T.; Xiong, L.; Yi, F.; Xiao, Y.; Song, Q. Relation of the water area of dongting lake to the water levels of hydrological stations based on modis images. Resour. Environ. Yangtze Basin 2012, 21, 756–765. [Google Scholar]
  56. Ke, W.; Chen, C.; Ji, H.; Chen, M.; Liu, Y. The rope relationship between the water surface area of Dongting Lake and the water level of Chenglingji. J. Lake Sci. 2017, 29, 753–764. [Google Scholar] [CrossRef]
  57. Wang, S.; Luo, J.; Chen, Z. Study on Relationship Between Water Level and Water Area Based on Google Earth Engine. Comput. Syst. Appl. 2021, 30, 238–245. [Google Scholar] [CrossRef]
Figure 1. Overview of the study area. (a) The study area of Dongting Lake is located in Hunan Province, China. (b) The Schematic diagram of the Dongting Lake wetland profile. The blue color represents the water of Dongting Lake.
Remotesensing 15 04655 g001
Figure 2. Overall methodological workflow for Dongting Lake surface area extraction and water level prediction. The red color indicates the important steps that are presented in detail in the following sections.
Remotesensing 15 04655 g002
Figure 3. The frequency distribution histograms of sigma coefficients and polarization decomposition parameters. (a) The VH sigma coefficient, (b) the VV sigma coefficient, (c) the VV/VH sigma coefficient, (d) the m p polarization parameters, (e) the m v polarimetric parameters, and (f) the normalized energy histogram of the combination of the two parameters.
Remotesensing 15 04655 g003
Figure 4. The binary diagram of water body segmentation is obtained from the Stokes decomposition parameters. (a) The Stokes-parameters-combined RGB image, (b) gray image transformed from RGB Stokes image, and (c) the rough binary segmentation image. The black at the edge indicates the blank value.
Remotesensing 15 04655 g004
Figure 5. The final Dongting Lake water extraction process from the simple water segmentation binary image. (a) The rough binary segmentation image, (b) the image processed through morphological operation, (c) the image processed through median filtering, and (d) the image processed through connected domain removal.
Remotesensing 15 04655 g005
Figure 6. The Stokes polarization decomposition synthesis and optical image comparison of East Dongting Lake region. (a) Sentinel-1 Stokes polarization decomposition RGB composite image; (b) Sentinel-2 true color composite image of East Dongting Lake; (c) the final extracted water on top of the Sentinel-2 optical image, where the red color represents the water outline and the blue color represents the water bodies; and (d) the lake outline extracted using Stokes, VV, and VH method in the same period. On the optical image, the red line represents the water outline using Stokes method, the green line represents the VH method, and the blue line represents the VV method.
Remotesensing 15 04655 g006
Figure 7. Distribution of polarization parameters of different ground features. (a) The distribution of five ground features in H-A-α parameters, (b) the VH-VV-VH/VV backscattering coefficient, and (c) the Stokes polarization parameters spaces.
Remotesensing 15 04655 g007
Figure 8. The inundation frequency distribution map of Dongting Lake was generated from all the 119 Sentinel-1 SAR observations during 2018–2022. Colors ranging from blue to red indicate inundation frequency, with closer to blue indicating less inundation and closer to red indicating more frequent inundation.
Remotesensing 15 04655 g008
Figure 9. The water area change curve of Dongting Lake. The blue line shows the water area change curve for 2018, dark green for 2019, light green for 2020, orange for 2021, and red for 2022.
Remotesensing 15 04655 g009
Figure 10. Variation curves of water area and water level in East Dongting Lake. The blue curve shows the change in water area over time and the red curve shows the change in water level over time.
Remotesensing 15 04655 g010
Figure 11. Fitting curve of the water level and water area in East Dongting Lake. The blue scatter represents the water area corresponding to the lower water level elevation at the same time, and the red curve represents the A–E relationship curve fitted via the regression function.
Remotesensing 15 04655 g011
Figure 12. Results of water extraction from East Dongting Lake and South Dongting Lake. (a) The grayscale map of normalized polarization decomposition parameters of East Dongting Lake, (b) the binary graph after Otsu threshold segmentation of East Dongting Lake, (c) the water area extraction result through post-processing of East Dongting Lake, (d) the grayscale map of normalized polarization decomposition parameters of South Dongting Lake, (e) the binary graph after Otsu threshold segmentation of South Dongting Lake, and (f) the water area extraction result through post-processing of South Dongting Lake.
Remotesensing 15 04655 g012
Figure 13. Comparison of Dongting Lake water extraction results in the wet season and the dry season: 12 July 2019 and 7 August 2019 indicate the wet season, and 16 October 2019 and 15 December 2019 indicate the dry season.
Remotesensing 15 04655 g013
Table 1. Accuracy comparison of Stokes parameters and traditional methods (VV band or VH band) for water body extraction.
MethodsACCPPVTPRTNRF1 Score
VV band0.98680.98340.97590.99210.9839
VH band0.96800.92420.98170.96140.9715
Stokes parameters0.99150.99200.98180.99620.9889
Table 2. Correlation between water level and water area under different functional relationships.
Type of FunctionFunctional Relation ExpressionR2RMSE (km2)
Linear y = 91.13 x 1631.68 0.9389.13
Exponential y = 31.37 e 0.1175 x 0.93738.49
Logarithmic y = 6809 + 5350 log 10 x 0.9155.13
Quadratic polynomial y = 3.245 x 2 79.27 x + 557.7 0.9477.32
Cubic polynomial y = 48.72 x 3 + 101.1 x 2 + 390.2 x + 588.5 0.9755.92
Piecewise Linear y = 121.25 x + 493.65 , x 25 641.46 x + 536.77 , 25 < x < 28 286.97 x + 774.48 , x 28 0.9845.72
Note: x in the linear function and multinomial fitting is the normalized water level, mean = 25.14, std = 3.677. The RMSE is measured in km2.
Table 3. The water level data are predicted using the A–E relationship and the real water level data.
TimeWater Area (km2)Predicted Water Level (m)Measured Water Level (m)
17 April 2017574.936625.358825.49
4 June 2017765.319726.450126.43
10 July 20171410.770333.292932.98
3 August 2017953.484627.528727.85
8 September 2017870.935227.055527.11
14 October 20171057.762828.769828.36
7 November 2017630.248925.675824.92
13 December 2017365.782821.262320.30
The RMSE of the predicted water level data is 0.4857 m, and the R2 is 0.9930.
Table 4. The vacant water level data are predicted by using a piecewise linear function model.
TimeWater Area (km2)Predicted Water Level (m)
2 November 2018432.350123.2810
14 November 2018451.622423.8655
26 November 2018474.284424.5527
8 December 2018491.959725.0887
20 December 2018383.667521.8047
10 March 2022398.912722.2670
22 March 2022406.782922.5057
3 April 2022458.463524.0729
15 April 2022497.806725.2661
9 May 2022956.102727.5437
2 June 20221227.976729.1022
Disclaimer/Publisher’s Note: The statements, opinions and data contained in all publications are solely those of the individual author(s) and contributor(s) and not of MDPI and/or the editor(s). MDPI and/or the editor(s) disclaim responsibility for any injury to people or property resulting from any ideas, methods, instructions or products referred to in the content.

