Article

Impacts of Direct Assimilation of the FY-4A/GIIRS Long-Wave Temperature Sounding Channel Data on Forecasting Typhoon In-Fa (2021)

1
Key Laboratory of Numerical Modeling for Tropical Cyclone of the China Meteorological Administration, Shanghai Typhoon Institute, Shanghai 200030, China
2
CMA Earth System Modeling and Prediction Centre, Beijing 100081, China
*
Author to whom correspondence should be addressed.
Remote Sens. 2023, 15(2), 355; https://doi.org/10.3390/rs15020355
Submission received: 8 November 2022 / Revised: 28 December 2022 / Accepted: 3 January 2023 / Published: 6 January 2023

Abstract

:
In this paper, the Advanced Weather Research Forecast model (WRF-ARW) is used to investigate the potential impacts of assimilating the FengYun-4A (FY-4A) Geostationary Interferometric Infrared Sounder (GIIRS) long-wave temperature sounding channel data on the prediction of Typhoon In-Fa (2021). In addition, a series of data assimilation experiments are conducted to demonstrate the added value of the FY-4A/GIIRS data assimilation for typhoon forecasts. It is shown that the higher spectral resolution and broader coverage of GIIRS radiance data can positively impact the model analysis and forecasts with larger temperature and moisture increments at the initial time of simulations, thus producing a better simulation for the typhoon’s warm core aloft, vortex wind structure, and spiral rainfall band. Moreover, the assimilation of the GIIRS data can also lead to better storm steering flows and, consequently, better typhoon track forecasts. Overall, the assimilation of FY-4A/GIIRS temperature sounding channel data shows some added values to improve the track and storm structure forecasts of Typhoon In-Fa.

Graphical Abstract

1. Introduction

In the past two decades, satellite data assimilation has played an essential role in improving the forecast skills of numerical weather prediction (NWP), particularly since the 1990s, when satellite data began to be assimilated directly [1,2,3]. Radiance observations from satellite sounders can provide three-dimensional atmospheric temperature and water vapor information. Currently, improving NWP accuracy by assimilating satellite sounding data has become a major concern for many operational NWP centers around the world [4]. In addition, satellite data has become more and more critical as the resolution of NWP models continues to increase [5].
Hyperspectral infrared sounders can measure radiation in thousands of spectrally narrow bands, which can provide atmospheric temperature and water vapor information, as well as other atmospheric compositions, with higher accuracy and vertical resolution than previous low-spectral-resolution infrared sounders such as the High Resolution Infrared Sounder (HIRS). Since the 2000s, several hyperspectral infrared sounders onboard polar-orbiting satellites have been developed, including the Atmospheric Infrared Sounder (AIRS) onboard the National Aeronautics and Space Administration (NASA) Earth Observing System (EOS) polar-orbiting Aqua platform [6,7], the Infrared Atmospheric Sounder Interferometer (IASI) onboard the European Meteorological Operational satellites [8], the Cross-track Infrared Sounder (CrIS) onboard the Suomi National Polar-Orbiting Partnership (Suomi NPP) and National Oceanic and Atmospheric Administration (NOAA-20) satellites [9], and the Hyperspectral Infrared Atmospheric Sounder (HIRAS) onboard the Chinese polar-orbiting satellites FY-3D and FY-3E [10,11]. The observations from these sounders have been widely assimilated into global and regional NWP models. Several previous studies showed that assimilating hyperspectral infrared sounding data from the polar-orbiting satellites had a significant positive impact on improving the forecast skills of the operational global NWP systems [12,13,14,15,16]. Moreover, more observations from hyperspectral infrared sounders have been used in regional model simulations and can positively affect the forecasts of rainfall and tropical cyclone tracks [17,18,19]. However, the effects of these infrared sounding data on regional model simulations are not well studied due to the limited data coverage and low temporal resolutions of these satellite sounding data (generally only twice a day over the same location from a single satellite).
On 11 December 2016, China launched the new-generation geostationary meteorological satellite Fenyun-4A (FY-4A). The Geostationary Interferometric Infrared Sounder (GIIRS) onboard the FY-4A satellite is the first hyperspectral infrared sounder operating in a geostationary orbit, complementing the infrared sounders in polar orbit [20]. This sounder has provided observations with higher spatio-temporal resolutions throughout China. The spectral range for the GIIRS to measure the atmospheric infrared radiation is 700–2250 cm−1, with a spectral resolution of 0.625 cm−1, covering the long-wave infrared band (LWIR, 700–1130 cm−1, 689 channels) and the middle-wave infrared band (MWIR, 1650–2250 cm−1, 961 channels). Compared with polar-orbiting hyperspectral infrared sounders (such as the CrIS and IASI), the FY-4A/GIIRS has a higher scanning frequency and a broader scanning coverage. The instrument can scan the entire country of China in 2 h, with a spatial resolution of 16 km at the nadir point. The GIIRS onboard the Fenyun-4B (FY-4B) satellite launched in June 2021 covers a slightly broader spectral range (680–2250 cm−1) than the FY-4A/GIIRS and has a markedly higher spatial resolution of 12 km [21]. Additionally, the European Organization for the Exploitation of Meteorological Satellites (EUMETSAT) plans to launch its next-generation geostationary satellite, MTG (Meteosat Third Generation), in 2023. The advanced Infrared Sounder (IRS) onboard this platform is expected to provide high spatio-temporal resolution (4 km and 30 min) observations for extreme weather monitoring and forecasting in Europe and Africa [22]. Overall, with the advantages of broader data coverage and higher spatio-temporal resolution, the hyperspectral infrared sounders onboard geostationary satellites are expected to be a suitable data resource for high-impact weather monitoring and forecasting.
Tropical cyclone (TC) forecasts highly depend on the accuracy of the initial conditions (atmospheric dynamics and thermal field structures) in NWP models. Due to the lack of conventional observations over the oceans, advanced satellite sounder measurements have become a promising data source for monitoring TCs. Proper assimilation of these data would contribute to improving TC forecasts. For example, Li et al. (2009) demonstrated the importance of high spatial and hyperspectral infrared sounding data for hurricane track and intensity forecasts by assimilating the Atmospheric Infrared Sounder (AIRS) retrieved sounding data [18]. Wang et al. (2016) indicated that assimilating CrIS clear-sky radiances can improve TC track forecasts [19].
The FY-4A/GIIRS data have been operationally assimilated in the China Meteorological Administration-Global Forecasting System (CMA-GFS) since the end of 2018, which indicated that assimilating FY-4A/GIIRS temperature channel data can improve the forecasts of temperature and wind profiles in East Asia [23,24]. However, the potential impact of assimilating FY-4A/GIIRS data in regional NWP models on numerical simulations remains unclear. In this study, by comparing the analyses and forecasts with and without the FY-4A/GIIRS observation assimilation, we investigate the potential benefits of directly assimilating FY-4A/GIIRS brightness temperature data for improving Typhoon In-Fa forecasts.
The remainder of this paper is organized as follows: Section 2 briefly describes the FY-4A/GIIRS data and the data used for model verification, case selection, and experiment design. Section 3 describes the details of quality control and bias correction. Section 4 discusses the results of assimilating the FY-4A/GIIRS data. The main conclusions are shown in Section 5.

2. Data, Models and Experiment Design

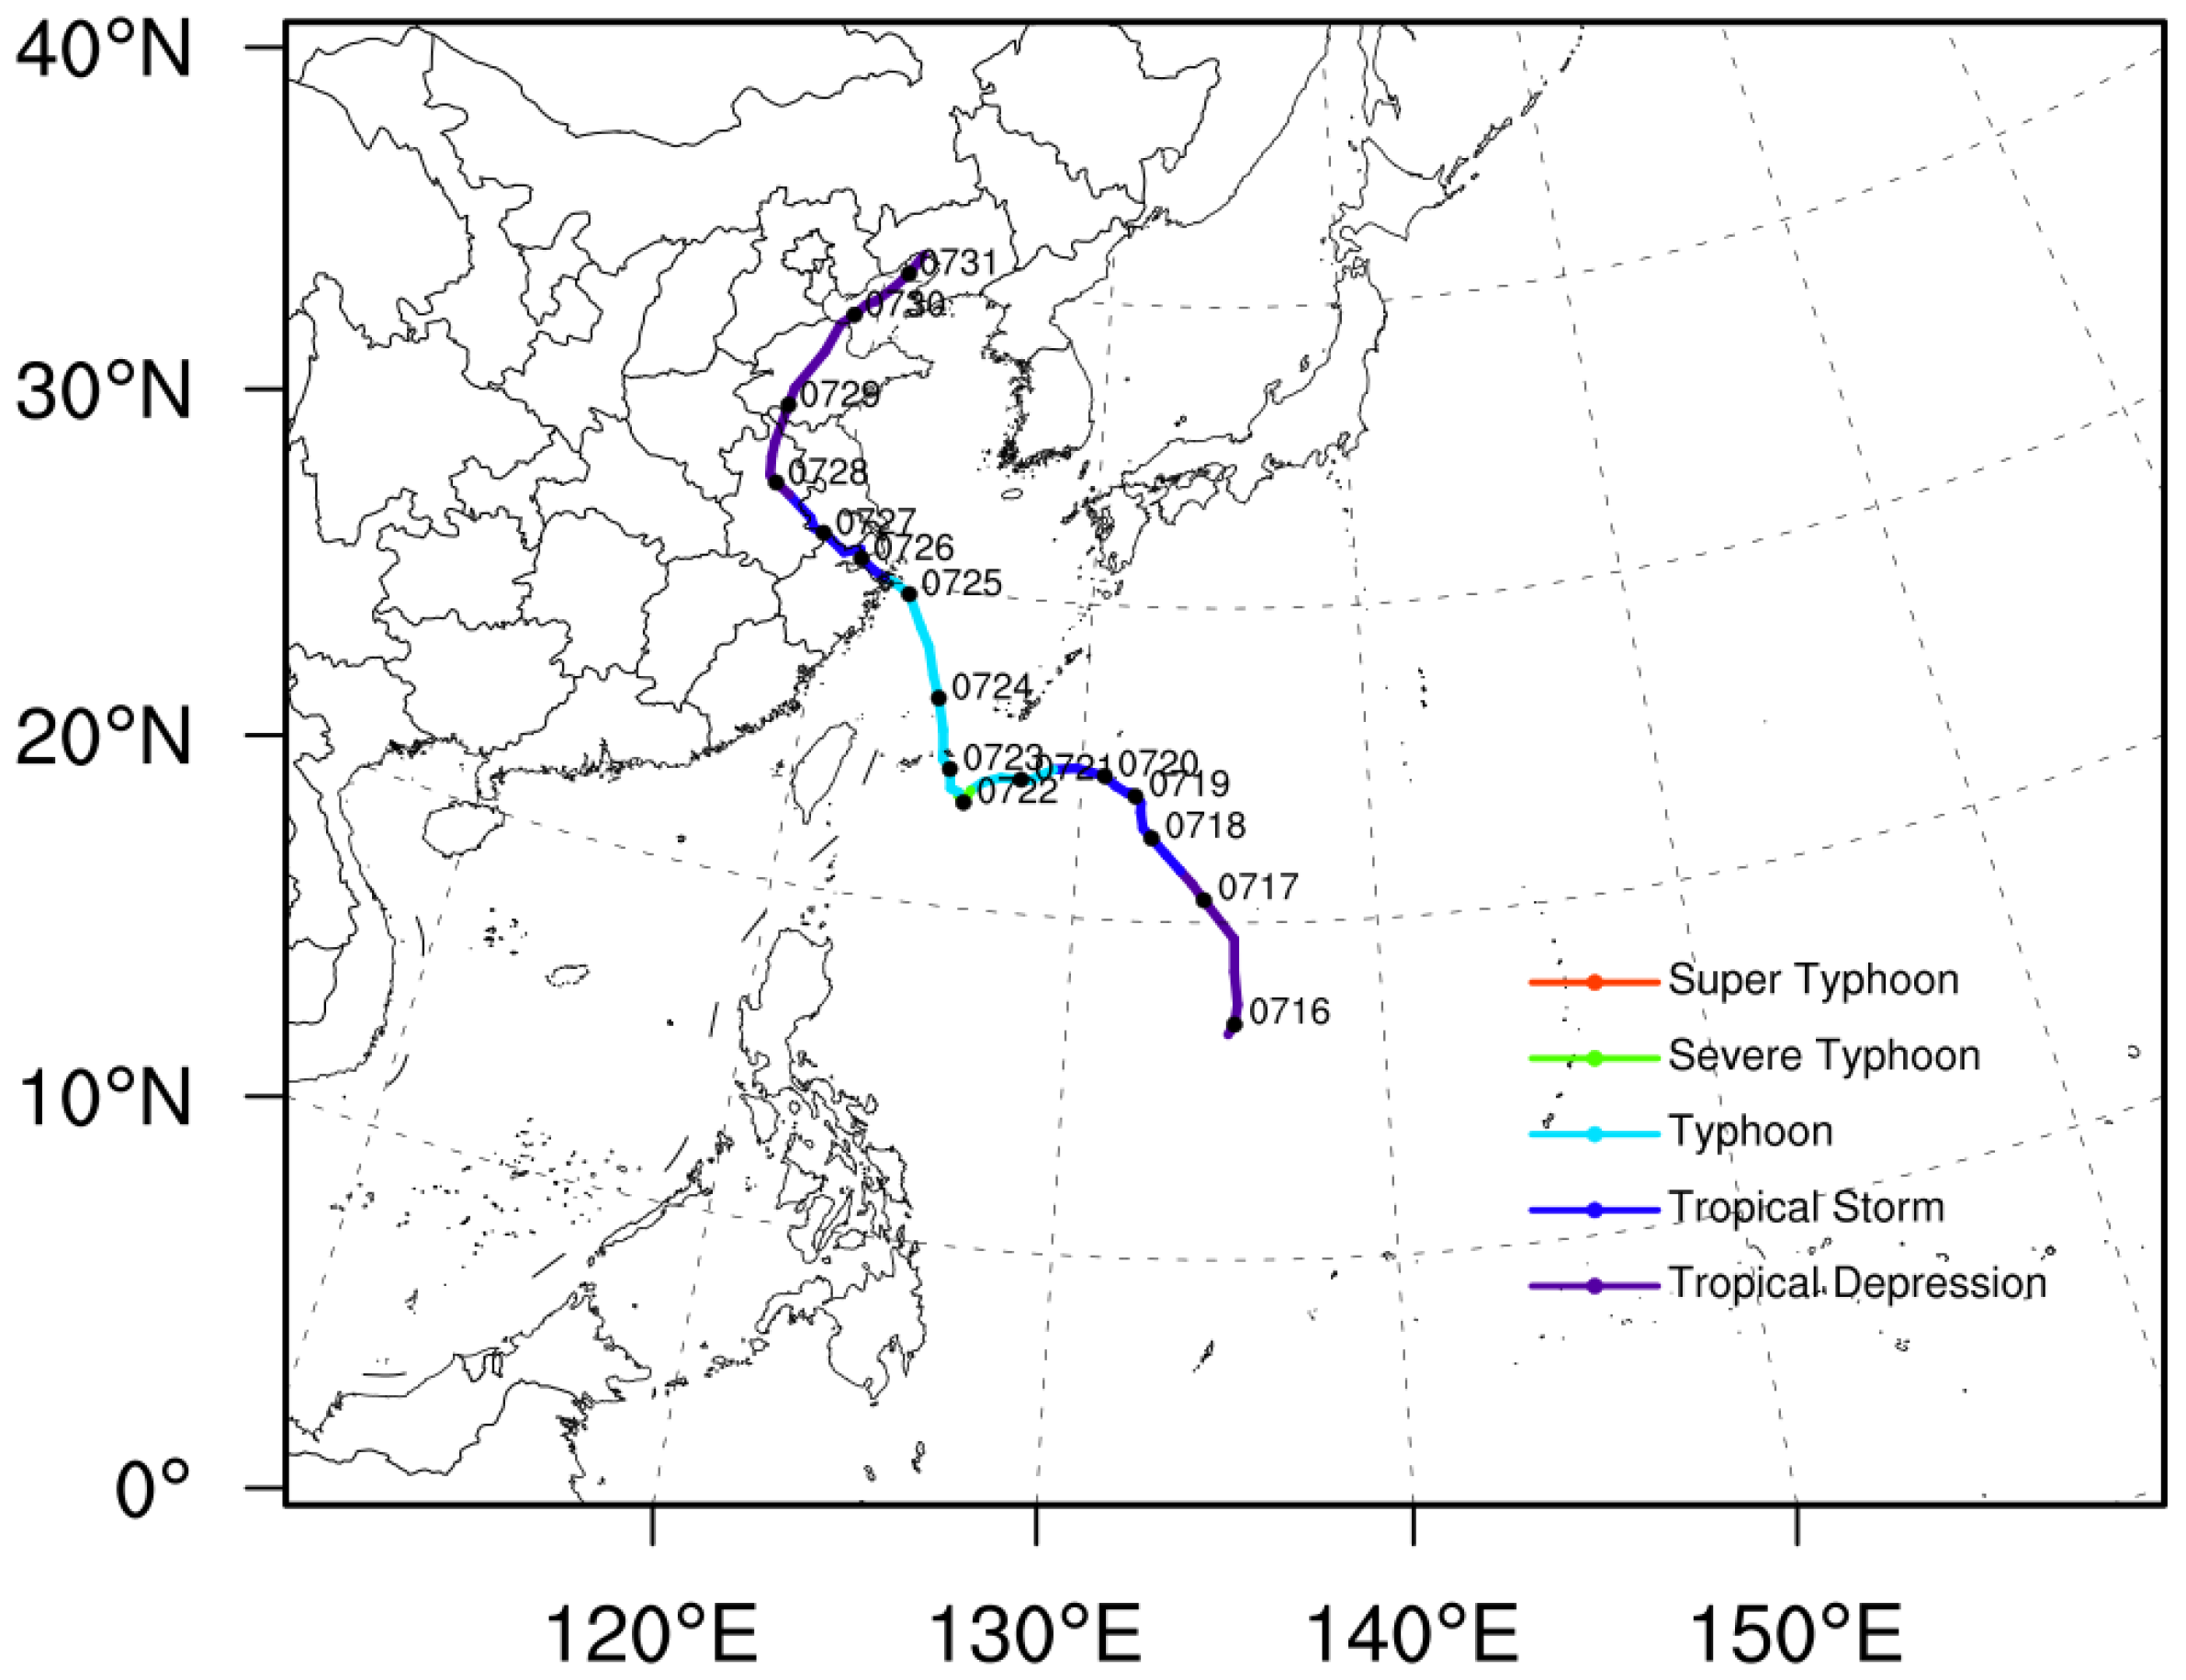
2.1. Case Description

Typhoon In-Fa initially formed as a tropical storm in the northwest Pacific Ocean on 18 July 2021 (Figure 1), and it gradually intensified into a typhoon on 21 July. Around noon on 25 July, this typhoon landed on the coast of Zhoushan City, Zhejiang Province, with an intensity of 35 m s−1 and 968 hPa, which is the strongest typhoon landing in China in 2021. On 26 July, it made landfall again in the coastal area of Pinghu City, Zhejiang Province, becoming the strongest typhoon to land in Zhejiang Province twice on record. Typhoon In-Fa remained on land for a long time, then gradually moved northward, weakened into an extratropical cyclone, and eventually dissipated on the night of July 30. Typhoon In-Fa caused a total of 4.82 million people to be affected and direct economic losses of 13.2 billion yuan. In this study, the period from 1200 UTC on 19 July 2021 to 0000 UTC on 22 July 2021 (storm intensification stage) is selected for numerical simulations.

2.2. Data

2.2.1. FY-4A/GIIRS Observations

FY-4A/GIIRS observations include information in the LWIR and MWIR middle infrared bands. In this study, we focused only on assimilating the LWIR channel data, which mainly characterizes the vertical structure of atmospheric temperature from the surface to the upper troposphere. Figure 2 shows the vertical distribution of the weighting function peaks for channels 1–230 in the GIIRS LWIR band and the channels actively used in the Grid-point Statistical Interpolation (GSI) data assimilation system. These actively assimilated channel data provide high-resolution atmospheric temperature information from the surface up to more than 200 hPa.

2.2.2. ERA5 Data

ERA5 is the fifth generation of the European Centre for Medium-Range Weather Forecasts (ECMWF) reanalysis of the global climate and weather for the past 4 to 7 decades. ERA5 is produced using 4D-Var data assimilation and model forecasts in CY41R2 of the ECMWF Integrated Forecast System (IFS). The ERA5 dataset provides hourly data on surface and upper-air parameters at 0.25° degrees, with global resolution from the surface reaching up to 1 Pa. In this study, the ERA5 hourly data on pressure levels were used for model verification [25].

2.2.3. GPM Precipitation Data

In this study, NASA’s Level 3 Integrated Multi-Satellite Retrievals for GPM (IMERG) gridded product was used for model verification. It has a horizontal resolution of 0.1° degrees and is updated every 30 min from 60° N–60° S. The IMERG combines precipitation measurements from 9 international satellites: GPM, GCOM-W1, NOAA-18, NOAA-19, DMSP F-16, DMSP F-17, DMSP F-18, Metop-A, and Metop-B [26].

2.3. WRF Model and GSI Data Assimilation System

The Advanced Research version of the Weather Research and Forecasting model (WRF-ARW version 3.8.1, [27]) from the National Center for Atmospheric Research (NCAR) and the Grid-point Statistical Interpolation (GSI) analysis system version 3.7 [28,29,30] from the National Centers for Environmental Prediction (NCEP) were used in this study. The WRF-ARW was adopted as the forecast model with a horizontal grid size of 760 × 600, a 9 km grid spacing, and 51 vertical levels from the surface to 10 hPa. The model domain is shown in Figure 1. The 0.5° × 0.5° 6 h real-time forecast data from the NCEP Global Forecast System (GFS) were used to initialize the WRF model. The NCEP GFS forecasts provide boundary conditions for the simulations of the WRF model. Physical parameterization schemes selected in the WRF model include the Thompson microphysics scheme [31], the Yonsei University planetary boundary layer scheme [32], the short- and longwave radiation schemes of the Rapid Radiative Transfer Model for General Circulation Models (RRTMG, [33]), and the Noah land-surface model scheme [34]. The cumulus parameterization schemes were not used.
The model grid selected in the GSI analysis system is the same as that of the WRF model. In this research, we used the three-dimensional variational (3DVAR) data assimilation method to assimilate different types of observations. To avoid conducting data assimilation twice, the NCEP GFS 6 h forecast data were used as the first guess (or background) field of the GSI analysis system. For directly assimilating satellite radiance data, the Advanced Radiative Transfer Modeling System (ARMS) [35] was employed as an observation operator to assimilate the FY-4A/GIIRS brightness temperature based on the atmospheric profile inputs. The ARMS is mainly being developed for accelerating the use of Chinese FengYun (FY) satellite data in NWP systems, and it has flexible interfaces with different NWP systems.

2.4. Experiment Design

In order to investigate the impact of the FY-4A/GIIRS data assimilation on Typhoon In-Fa forecasts, two data assimilation and forecast experiments were conducted twice daily, at 0000 UTC and 1200 UTC, from 1200 UTC on 19 July 2021 to 0000 UTC on 22 July 2021, respectively. A total of 6 assimilation cycles were conducted in this study. For each experiment, the observations were assimilated at the analysis time and followed by a 72 h model forecast. The control experiment (EXP_CTRL) was set to assimilate the clear-sky radiances from the Advanced Microwave Sounding Unit-A (AMSU-A) on several different satellite platforms (NOAA-n15/18/19, METOP-A/B). The AMSU-A channels 1–11 and 15 were selected for data assimilation, and the channels 12–14 were set by default not to be assimilated in the GSI because their weighting function peaks were above the WRF model maximum (10 hPa). A 6 h assimilation window was applied to assimilate more AMSU-A data in the model domain. In the GIIRS data assimilation experiment (EXP_GIIRS), the observed brightness temperatures from the FY-4A/GIIRS LWIR channels were assimilated together with all the data assimilated in the EXP_CTRL. Since the GIIRS scanned the entire China region within 2 h, only data within ±1 h were used for the data assimilation to avoid data duplication. The channel selection of GIIRS basically followed the method in Yin et al. (2019) [36], using only a subset of channels, as shown in Figure 2. Channels 39–67 in the LWIR band were not used due to high noise and contamination. Furthermore, some channels that exhibited large noise and systematic discontinuities between dwells were also excluded [22]. For the AMSU-A data assimilation and for the GSI, default observation errors were used during data assimilation; for the FY-4A GIIRS data assimilation, the statistics of one-week observations-minus-background under clear-sky conditions were used as observation errors. The static background error covariance matrix (BE) was employed in this study. Since the current GSI analysis system does not include a module for GIIRS data assimilation, extra efforts were taken to add the GIIRS data assimilation option to the GSI system. The details of quality control and bias correction for the FY-4A/GIIRS data assimilation are discussed in the next section.

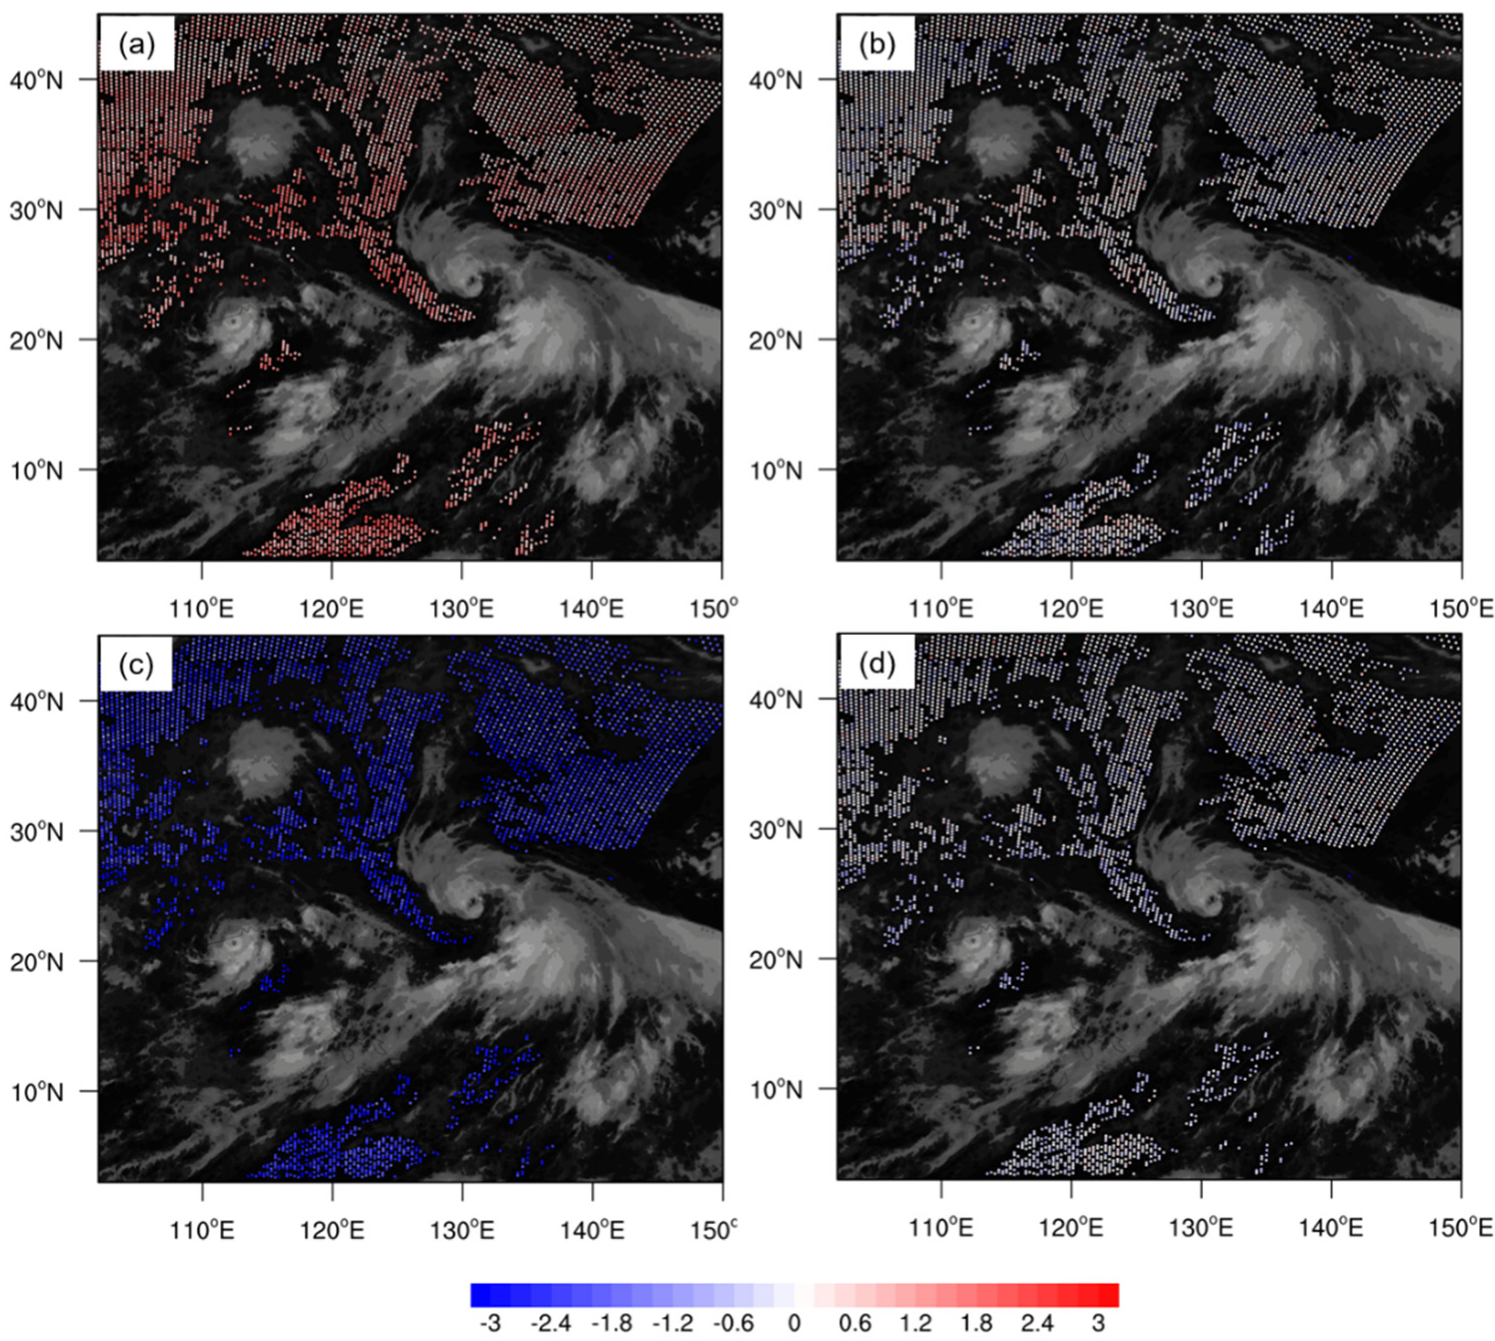
3. Quality Control and Bias Correction

Quality control is a crucial step for satellite radiance data assimilation. It is well known that both infrared measurements and simulations are highly sensitive to clouds. To avoid the influence of clouds on data assimilation, we assimilated only the observations under clear-sky conditions in this research. The cloud detection algorithm developed by McNally and Watts [37] has been adopted for cloud detection of FY-4A/GIIRS data, and it also has been used for cloud detection of other GSI hyperspectral infrared sounders, such as the IASI and ARIS. This method selects the clear channels for data assimilation by detecting the tops of clouds at a specific height. At that height of the clouds, the channel whose transmittance from the top of the atmosphere to this specific height level is less than a predefined value is regarded as a clear channel, and the data from this channel were further used for data assimilation.
Moreover, a series of quality control procedures were conducted to remove the radiance observations with poor data quality. Firstly, the observed brightness temperature with observation-minus-simulation (O−B) deviations greater than three times the observation errors was roughly checked, and the observations outside the model domain were rejected. Secondly, observations with a satellite zenith angle larger than 70° were excluded to avoid large errors in radiative transfer simulations. Because of the overlaps between the FY-4A/GIIRS adjacent fields of view, the first field of regard (FOR) (1, 33, 65, 97) and last FOR (32, 64, 96, 128) scan lines of each field of view were excluded to avoid data redundancy. In addition, the data were further thinned to a resolution of 30 km to reduce the impact of spatial correlation.
Bias correction is another essential step in satellite data assimilation. An enhanced variational bias correction scheme [38] was adopted in this study and was used to perform the bias correction of airmass and scan angle to obtain both angle-dependent and airmass-dependent components in data assimilation. The bias correction scheme for FY-4A/GIIRS radiance data is similar to that for the CrIS data in GSI. The air-mass predictors included a global offset, a zenith angle term, a cloud liquid water term, and two terms related to the lapse rate. The scan angle predictors included a simple fourth-order polynomial function of scan angle. For infrared radiance data assimilation, the cloud liquid water term was set to 0. The coefficients of the predictors were updated simultaneously with the model state variables. The total bias correction was obtained by a linear combination of these selected predictors.
For variational data assimilation, both background and observations were assumed to be unbiased. Therefore, observational biases (observation-minus-background, O−B) followed a Gaussian unbiased error distribution after quality control and bias correction. Figure 3 presents the spatial distributions of the O−B values with and without bias correction for GIIRS channels 3 and 16, respectively. Note that only the GIIRS observations that passed the quality control procedures are shown. The brightness temperature from the FY-4A/Advanced Geosynchronous Radiation Imager (AGRI) 10.7 µm infrared channel at 0000 UTC on 20 July 2021 was used as the background. The quality control results indicate that the observations contaminated by clouds were excluded and only those in clear-sky areas were retained, suggesting that the quality control scheme for the FY-4A/GIIRS data was effective. Without bias correction, there were large warm O−B biases in channel 3 (Figure 3a) and large cold biases in channel 16 (Figure 3c). After bias correction, the large biases were improved in both channels (Figure 3b,d), and the mean values of O−B values were closer to 0. Specifically, the mean O−B bias for channel 3 was obviously reduced from 1.094 to 0.121, and the standard deviation decreased from 0.518 to 0.503. For channel 16, the mean O−B bias was reduced from −2.131 to −0.699, and the standard deviation decreased from 0.796 to 0.381. The observations used for data assimilation were closer to the unbiased ones after bias correction. This result demonstrates that the bias correction scheme performs well in FY-4A/GIIRS data assimilation.

4. Results

4.1. Impact on Analysis

Figure 4 shows the comparison of the average deviations between the observed and simulated FY-4A/GIIRS brightness temperature before the GIIRS data assimilation (observation-minus-background, O−B values) and after (observation-minus-analysis, O−A values). The results indicate that the O−A values were lower than the O−B values for most channels, implying that the GIIRS brightness temperature simulated by using the analysis field as atmospheric profile input was closer to the measurements. This suggests that the data assimilation method was applied properly.
The analysis increment represents the changes in the model’s initial conditions caused by assimilating new observations, which eventually led to a large difference in model forecasts. Figure 5 presents the analysis increment of the temperature and specific humidity fields at model level 17 at the initial time of 0000 UTC on 20 July 2021 in different experiments. It was found that the noticeable analytical adjustments were mainly constrained within the AMSU-A and GIIRS scanning coverage. Assimilating the AMSU-A data influenced the simulations in ocean areas considerably. The assimilation of additional FY-4A/GIIRS data can result in large analysis increments in both ocean and land areas and larger adjustments to the model’s initial field. Generally, the analysis increments are larger for the EXP_GIIRS (Figure 5b,e) and relatively smaller for the EXP_CTRL (Figure 5a,d).
To further investigate the effect of data assimilation on the initial conditions of models, we used the mean absolute difference (MAD) values averaged in the model domain to reflect the adjustment amplitude of different model variables in each data assimilation experiment, and the statistic results are presented in Figure 6. Obviously, the RMSE values of the temperature, water vapor mixing ratio, and wind field for the EXP_GIIRS were all larger than those for the EXP_CTRL. For both water vapor and wind fields, the adjustment trends for the initial model conditions in the vertical direction were generally consistent in the EXP_CTRL and EXP_GIIRS. However, for the temperature field, the adjustment of these two experiments was different at different model levels. The large adjustments appear in model levels 10–40 (from 896 hPa to 100 hPa), which correspond to the troposphere and lower stratosphere.

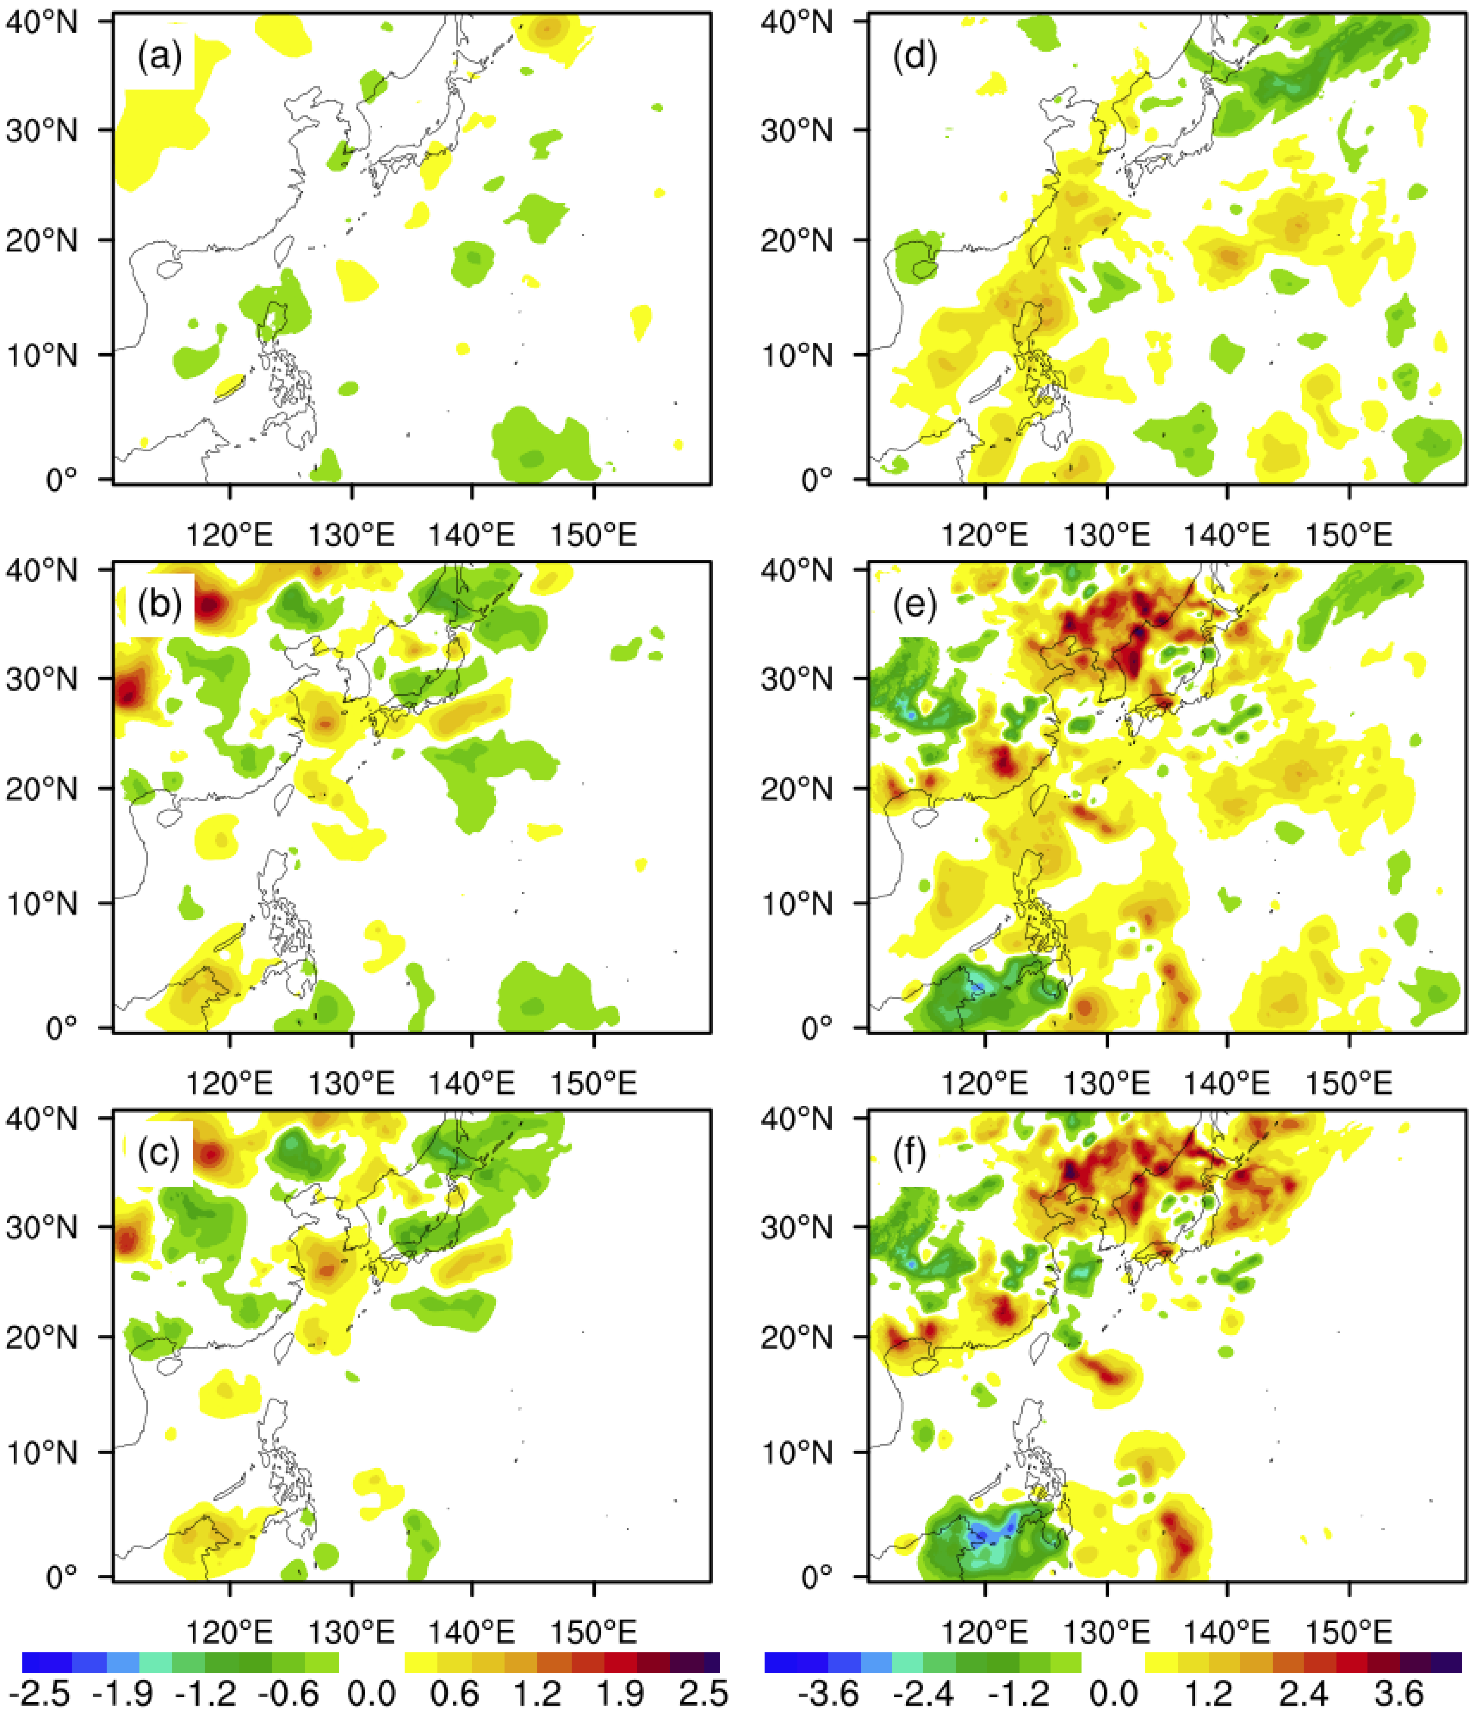
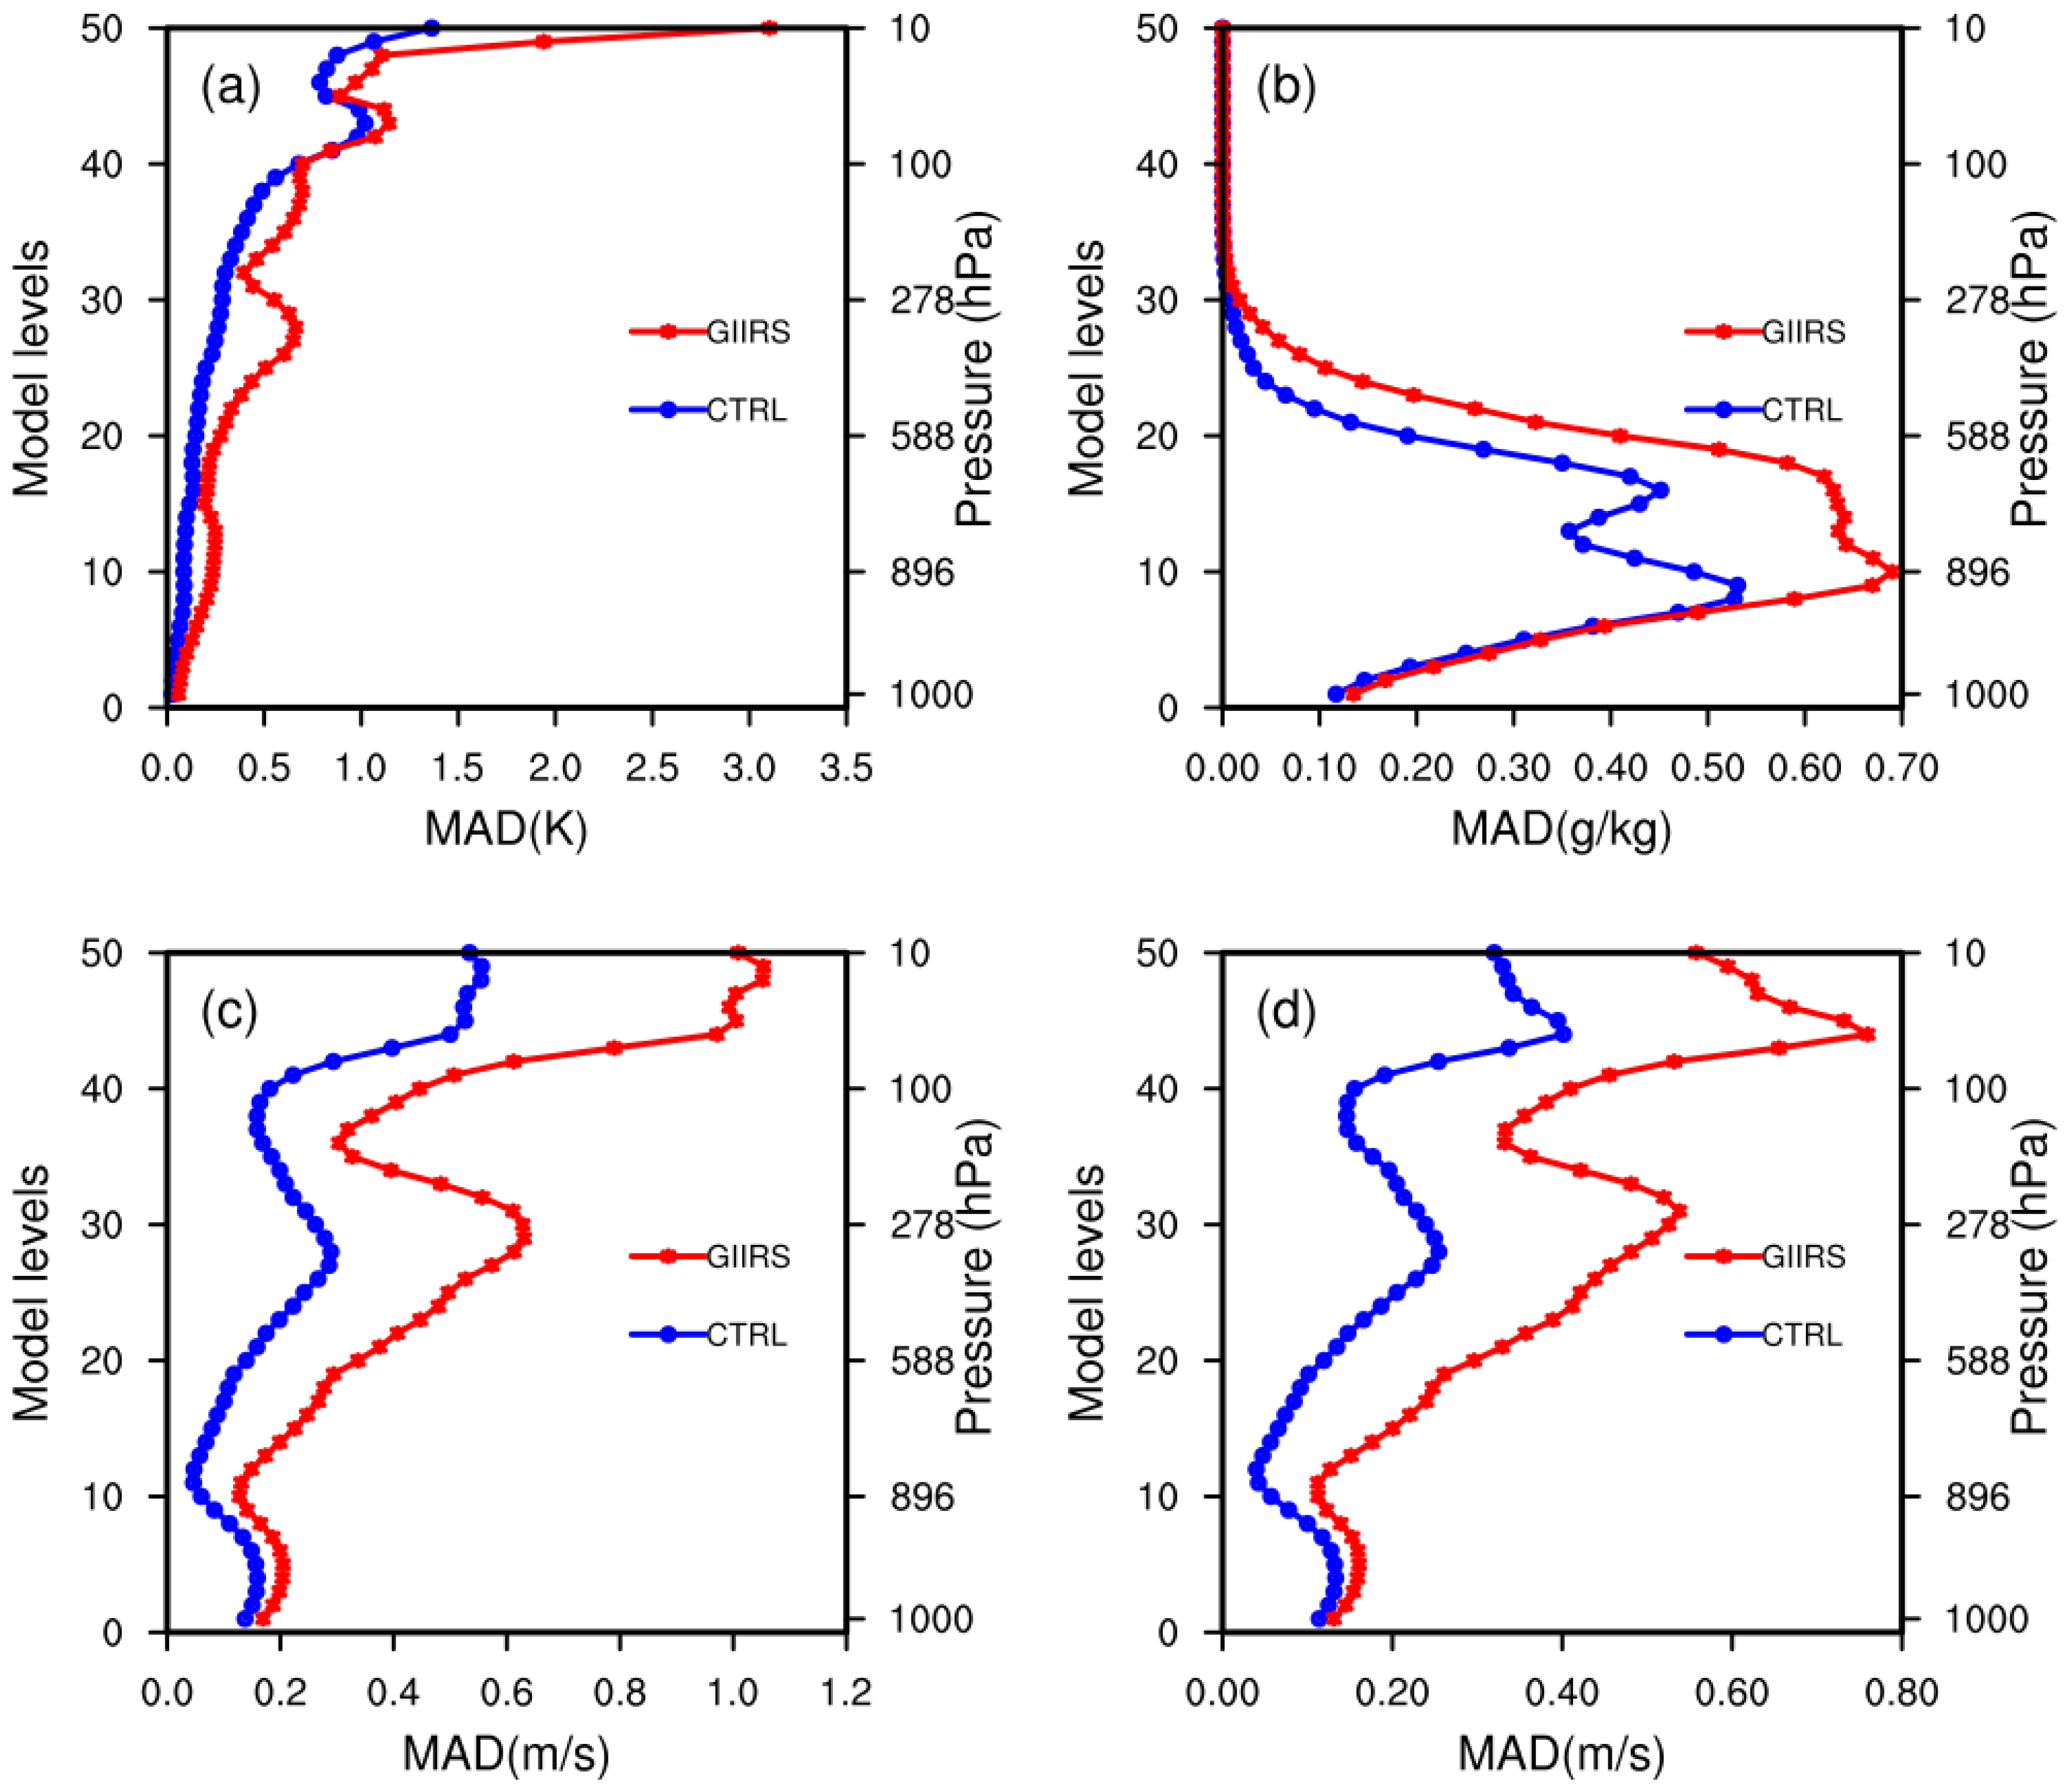
4.2. Impact on Forecasts

Figure 7 shows the radius-height cross-section of the temperature anomalies for the EXP_CTRL and EXP_GIIRS at 1800 UTC on 21 July and 0000 UTC on 22 July 2021 compared with the ECMWF ERA5 reanalysis. The temperature anomalies were calculated relative to the azimuthally and radially averaged temperature within a 900 km radius (100 grid points in the model domain). The simulations from both experiments had a warmer inner core compared with the ERA5 analysis data (Figure 7b,c,e,f). At 1800 UTC on July 21 (42 h forecasts), the temperature anomalies for the EXP_CTRL and EXP_GIIRS had the same magnitude, but the heights of the maximum temperature anomalies were different for the two data assimilation experiments. The warm core structure simulated by the EXP_GIIRS was closer to the results of the ERA5 reanalysis data. After 6 h (0000 UTC on 22 July 2021), the storm strengthened, and the height of the maximum temperature anomaly rose (Figure 7a,d). The assimilation of the GIIRS data produced a better simulation of Typhoon In-Fa’s warm core aloft during the intensity change (Figure 7c,f).
The comparison of the vortex structure simulated in the EXP_CTRL and EXP_GIIRS is presented in Figure 8. As shown in the ERA5 reanalysis (Figure 8a,d), the storm tangential wind structure changed noticeably from 1800 UTC on 21 July 2021 to 0000 UTC on 22 July, and the peak of the tangential wind in the storm inner-core area was similar, but the height of the strong tangential wind in the inner-core area shifted upward. Since both simulation experiments reproduced a warmer inner core (Figure 7), the simulated tangential wind was stronger than that of the ERA5 reanalysis data. The simulations of the EXP_GIIRS reproduced the variation of the vortex structure well (Figure 8c,f) compared with the simulations of the EXP_CTRL.
The improvement of assimilating FY-4A/GIIRS into Typhoon In-Fa intensity forecasts can also be verified by the comparison of central sea level pressure (CSLP) forecasts. As shown in Figure 11b, the simulated CSLP of EXP_GIIRS is closer to the best track compared with the EXP_CTRL.
In order to further investigate the impact of the additional GIIRS data assimilation on the TC forecasts, we compared the composite radar reflectivity forecasts from the EXP_CTRL and EXP_GIIRS with the hourly rainfall rate measurements from the Global Precipitation Measurement (GPM) satellite. At 1800 UTC on 21 July 2021, the circulation structure near the storm center showed an asymmetric structure, and the heavy rainfall mainly appeared west and south of the storm center (Figure 9e). For the EXP_GIIRS, the simulated storm structure was apparently closer to the GPM observations (Figure 9c). In addition, the locations of the simulated heavy rainfall, as shown by strong radar echoes, were more consistent with the GPM observations. At 0000 UTC on 22 July 2021, the asymmetric structure of the circulation near the storm center was further strengthened, and the heavy rainfall areas were mainly distributed south of the storm center (Figure 9f). Compared with the EXP_CTRL (Figure 9b), the EXP_GIIRS reproduced the rain band structure well (Figure 9d). Additionally, the simulated heavy rainfall areas were mainly distributed south of the storm center, closer to the GPM observations.
The comparison of the 6 h accumulated rainfall forecasts from the EXP_CTRL and EXP_GIIRS with the GPM 6 h accumulated rainfall measurements (Figure 10) indicates that both experiments overestimated the rainfall near the storm center. At 1800 UTC on 21 July 2021, the heavy rainfall (>120 mm) areas were mainly located south and west of the storm center (Figure 10e). The simulations from the EXP_CTRL showed a strong, heavy rain band around the storm center, and the pattern of this rain band was different from the GPM observations (Figure 10a). The results from EXP_GIIRS presented an asymmetric rain band structure; the location and intensity of the heavy rain band (>120 mm) simulated by the EXP_GIIRS were closer to the observations (Figure 10c). Thus, it can be concluded that assimilating the FY-4A/GIIRS data can improve the storm rain band structure simulation. Similar results can be obtained at 0000 UTC on 22 July 2021.
The movement of tropical cyclones is mainly influenced by the large-scale environment [39,40] and the β-effect caused by the Earth’s Coriolis force [41]. To understand how the GIIRS data assimilation affects storm track forecasts, we calculated and compared the steering flows for the EXP_CTRL and the EXP_GIIRS. The calculation method for steering flows refers to Carr et al. (1990) and Niu et al. (2021) [42,43]. In this study, the steering flow is defined as the average of the mean wind flows within 500 km of the storm center. Figure 11a displays the comparison of the storm tracks simulated in the EXP_CTRL and EXP_GIIRS with the best track data from 0000 UTC on 20 July 2021 to 0000 UTC on 23 July 2021. The best track data indicates that the movement direction of the storm turned to the north at 0600 UTC on 22 July 2021 (52 h forecasts). The results of the EXP_GIIRS showed a better track forecast compared with the EXP_CTRL. Figure 11c,d show the mean wind flows, the wind speed, and the calculated steering flows from the 52 h forecasts of the EXP_CTRL and EXP_GIIRS at 0600 UTC on 22 July 2021. Obviously, the direction of the steering flows simulated in the EXP_CTRL was westward, while it was northward in the EXP_GIIRS. Thus, the storm moved northward for the simulation of the EXP_GIIRS. This result suggests that the assimilation of FY-4A/GIIRS data affects the large-scale environment and the TC circulation simulation, eventually leading to changes in the steering flow of the storm itself.
Moreover, we compared the typhoon track forecasts of the EXP_CTRL and EXP_GIIRS at six different initial time (Figure 12) and analyzed the corresponding track forecast errors (Figure 13). The track errors (D) were calculated by the distances between the model simulations ( φ 1 , λ 1 ) and the best tracks ( φ 2 , λ 2 ) as follows:
D = R cos 1 ( sin φ 1 sin φ 2 + cos φ 1 cos φ 2 cos ( λ 1 λ 2 ) )
where R represents the radius of the earth, φ and λ are the latitude and longitude, respectively. Generally, the EXP_GIIRS performed better than the EXP_CTRL. The FY-4A/GIIRS data assimilation had a remarkable positive impact on track forecasts in most cases, especially for the forecast leading time of 36–72 h. In some experiments, the track forecast errors of EXP_GIIRS were larger than EXP_CTRL at a forecasting leading time of 18 h (Figure 13a–d), which resulted in a statistical analysis showing that the EXP_GIIRS had a negative effect on track forecast for the forecast leading time of 18 h (Figure 14b); the reasons for this need to be further studied.
The mean track errors calculated by averaging the track errors of six different initial times from Figure 13 are shown in Figure 14. In general, the EXP_GIIRS performed better in the track forecast with a leading time of 36–72 h; there was no significant improvement from the initial time to the 30 h forecasts by the EXP_GIIRS compared with that by the EXP_CTRL. The mean track errors with the forecast leading time of 36–72 h by the EXP_GIIRS decreased by approximately 12%.

5. Conclusions

In this study, we investigated the potential impact of the FY-4A/GIIRS LWIR channel data assimilation on the numerical simulations of Typhoon In-Fa in a regional model. A GIIRS data assimilation option was added to the GSI system for the FY-4A/GIIRS data assimilation. Two numerical data assimilation experiments were conducted to examine the added value of the FY-4A/GIIRS data assimilation for high-impact weather forecasts in regional models. Compared with other polar-orbiting hyperspectral resolution infrared sounders, the GIIRS provided more detailed information on the vertical temperature and water vapor structures with broader data coverage, facilitating improved regional model analysis and forecasts. The results suggest that assimilating FY-4A/GIIRS radiance data brings larger temperature and water vapor increments at the initial time of simulations, which can improve the simulations of the TC’s warm core, vortex structure, and rain band structure. The FY-4A/GIIRS data assimilation affected the large-scale environment and the TC circulation forecasts. The modification of the synoptic-scale environment eventually led to changes in the steering flows of the storm itself, thus causing a change in the movement direction of the storm and improving the storm track forecasts. Overall, the assimilation of the FY-4A/GIIRS hyperspectral LWIR data showed a certain added value for improving the track and structure forecasts of Typhoon In-Fa.
This study demonstrates the benefits of the FY-4A/GIIRS data assimilation for improving forecasts by regional models. The present study represents only the preliminary results of the FY-4A/GIIRS data assimilation in a regional model. More refinements are needed to further retain the advantages of the FY-4A/GIIRS data assimilation, such as carrying out more numerical experiments for the assimilation of FY-4A/GIIRS data with longer assimilation cycles to obtain more robust results and quantitatively evaluating the storm structure over a longer time period. Ongoing research will focus on cycling data assimilation based on hybrid data assimilation methods (such as the Hybrid-3DEnVar method) to further improve data analysis and forecast accuracy. Furthermore, since the FY-4B/GIIRS has similar spectral coverage and higher data quality compared with the FY-4A/GIIRS, whose observations will be used to perform the FY-4B/GIIRS radiance data assimilation in regional model systems, the potential impact of the FY-4B/GIIRS observation assimilation on high-impact weather forecasts will be discussed in future work.

Author Contributions

Conceptualization, L.Z.; Data curation, L.Z. and Z.N.; Formal analysis, L.Z. and Z.N.; Funding acquisition, L.Z.; Investigation, L.Z. and Z.N.; Methodology, L.Z. and P.D.; Project administration, W.H. and F.W.; Resources, W.H. and F.W.; Writing—original draft, L.Z.; Writing—review & editing, Z.N., F.W. and J.Z. All authors have read and agreed to the published version of the manuscript.

Funding

This work was supported by the National Key R&D Program of China (Grant No. 2021YFB3900400), the Natural Science Foundation of China Project (Grant No. 42175166), the Fengyun Application Pioneering Project (FY-APP) (Grant No. FY-APP-2021.0205), the Shanghai Sailing Program (Grant No. 21YF1456800), and the Research Program from the Science and Technology Committee of Shanghai (Grant No. 19dz1200101).

Data Availability Statement

The Fengyun satellite data are collected from the National Satellite Meteorological Center China Meteorological Administration (http://www.nsmc.org.cn/ (accessed on 2 June 2022)); the ERA5 data are collected from the Climate Data Store (CDS)(https://www.ecmwf.int/en/forecasts/datasets/reanalysis-datasets/era5 (accessed on 2 October 2022)); the GFS data are collected from the National Centers for Environmental Information (NCEI) (https://www.ncei.noaa.gov/products/weather-climate-models/global-forecast (accessed on 2 June 2022)); the GPM rainfall rate data are collected from the National Aeronautics and Space Administration (NASA) (Data|NASA Global Precipitation Measurement Mission).

Acknowledgments

The authors would like to thank all reviewers and editors for their comments on this paper.

Conflicts of Interest

The authors declare no conflict of interest.

References

  1. Eyre, J.R.; English, S.J.; Forsythe, M. Assimilation of satellite data in numerical weather prediction. Part I: The early years. Q. J. R. Meteorol. Soc. 2020, 146, 49–68. [Google Scholar] [CrossRef]
  2. Eyre, J.R.; Bell, W.; Cotton, J.; English, S.J.; Forsythe, M.; Healy, S.B.; Pavelin, E.G. Assimilation of satellite data in numerical weather prediction. Part II: Recent years. Q. J. R. Meteorol. Soc. 2022, 148, 521–556. [Google Scholar] [CrossRef]
  3. Li, J.; Geer, A.; Okamoto, K.; Otkin, J.; Liu, Z.Q.; Han, W.; Wang, P. Satellite all-sky infrared radiance assimilation: Recent progress and future perspectives. Adv. Atmos. Sci. 2021, 39, 9–21. [Google Scholar] [CrossRef]
  4. Menzel, W.P.; Schmit, T.J.; Zhang, P.; Li, J. Satellite-based atmospheric infrared sounder development and applications. Bull. Am. Meteorol. Soc. 2018, 99, 583–603. [Google Scholar] [CrossRef]
  5. Geer, A.; Bormann, N.; Lonitz, K.; Weston, P.; Forbes, R.; English, S. Recent progress in all-sky radiance assimilation. ECMWF Newsl. 2019, 8, 20–25. [Google Scholar]
  6. Aumann, H.H.; Chahine, M.T. AIRS/AMSU/HSB on the Aqua mission: Design, science objectives, data products, and processing systems. IEEE Trans. Geosci. Remote Sens. 2003, 41, 253–264. [Google Scholar] [CrossRef] [Green Version]
  7. Chahine, M.T. AIRS: Improving weather forecasting and providing new data on greenhouse gases. Bull. Am. Meteorol. Soc. 2006, 87, 911–926. [Google Scholar] [CrossRef] [Green Version]
  8. Hilton, F. Hyperspectral Earth observation from IASI. Bull. Am. Meteorol. Soc. 2012, 93, 347–370. [Google Scholar] [CrossRef]
  9. Han, Y. Suomi NPP CrIS measurements, sensor data record algorithm, calibration and validation activities, and record data quality. J. Geophys. Res.-Atmos. 2013, 118, 12734–12748. [Google Scholar] [CrossRef]
  10. Yang, T.H.; Hu, X.Q.; Xu, H.L.; Wu, C.Q.; Qi, C.L.; Gu, M.J. Radiation Calibration Accuracy Assessment of FY-3D Hyper-spectral Infrared Atmospheric Sounder Based on Inter-Comparison. Acta Opt. Sin. 2019, 39, 377–387. [Google Scholar]
  11. Zhang, C.; Qi, C.; Yang, T.; Gu, M.; Zhang, P.; Lee, L.; Xie, M.; Hu, X. Evaluation of FY-3E/HIRAS-II Radiometric Calibration Accuracy Based on OMB Analysis. Remote Sens. 2022, 14, 3222. [Google Scholar] [CrossRef]
  12. Le Marshall, J.; Jung, J.; Derber, J.; Chahine, M.; Treadon, R.; Lord, S.J.; Goldberg, M.; Wolf, W.; Liu, H.C.; Joiner, J.; et al. Improving global analysis and forecasting with AIRS. Bull. Am. Meteorol. Soc. 2006, 87, 891–894. [Google Scholar] [CrossRef]
  13. McNally, A.P.; Watts, P.D.; Smith, J.A.; Engelen, E.; Kelly, G.A.; Thépaut, J.-N.; Matricardi, M. The assimilation of AIRS radiance data at ECMWF. Q. J. R. Meteorol. Soc. 2006, 132, 935–957. [Google Scholar] [CrossRef] [Green Version]
  14. Hilton, F.; Atkinson, N.C.; English, S.J.; Eyre, J.R. Assimilation of IASI at the Met Office and assessment of its impact through observing system experiments. Q. J. R. Meteorol. Soc. 2009, 135, 495–505. [Google Scholar] [CrossRef]
  15. Smith, A.; Atkinson, N.; Bell, W.; Doherty, A. An initial assessment of observations from the Suomi-NPP satellite: Data from the cross-track infrared sounder (CrIS). Atmos. Sci. Lett. 2015, 16, 260–266. [Google Scholar] [CrossRef]
  16. Eresmaa, R.; Letertre-Danczak, J.; Lupu, C.; Bormann, N.; McNally, A.P. The assimilation of Cross-track Infrared Sounder radiances at ECMWF. Q. J. R. Meteorol. Soc. 2017, 143, 3177–3188. [Google Scholar] [CrossRef]
  17. Lin, H.; Weygandt, S.S.; Benjamin, S.G.; Hu, M. Satellite radiance data assimilation within the Hourly Updated Rapid Refresh. Weather Forecast. 2017, 32, 1273–1287. [Google Scholar] [CrossRef]
  18. Li, J.; Liu, H. Improved hurricane track and intensity forecast using single field-of-view advanced IR sounding measurements. Geophys. Res. Lett. 2009, 36, L11813. [Google Scholar] [CrossRef]
  19. Wang, P.; Li, J.; Li, Z.; Lim, A.H.N.; Li, J.; Schmit, T.J.; Goldberg, M.D. The impact of Cross-track Infrared Sounder (CrIS) cloud-cleared radiances on Hurricane Joaquin (2015) and Matthew (2016) forecasts. J. Geophys. Res.-Atmos. 2017, 122, 13201–13218. [Google Scholar] [CrossRef] [Green Version]
  20. Yang, J.; Zhang, Z.Q.; Wei, C.Y.; Lu, F.; Guo, Q. Introducing the new generation of Chinese geostationary weather satellites, Fengyun-4. Bull. Am. Meteorol. Soc. 2017, 98, 1637–1658. [Google Scholar] [CrossRef]
  21. Ni, Z.; Qi, C.; Li, L.; Yang, L. Introduction of FY4B GIIRS and its application prospect. In Proceedings of the 23rd International TOVS Study Conference (ITSC-23), Flagstaff, AZ, USA, 24–30 June 2021. [Google Scholar]
  22. Dussarrat, P.; Burrows, C. Preparing for the exploitation of MTG-S IRS in NWP using FY-4A GIIRS observations. ECMWF Tech. Memo. 2022, 899. [Google Scholar] [CrossRef]
  23. Han, W. Assimilation of FY-4A data in GRAPES. In Proceedings of the 15th Asia Oceania Geosciences Society Annual Meeting, Honolulu, HI, USA, 3–8 June 2018. [Google Scholar]
  24. Yin, R.; Han, W.; Gao, Z.; Li, J. Impact of High Temporal Resolution FY- 4A Geostationary Interferometric Infrared Sounder (GIIRS) Radiance Measurements on Typhoon Forecasts: Maria (2018) case with GRAPES Global 4D-Var Assimilation system. Geophys. Res. Lett. 2021, 48, e2021GL093672. [Google Scholar] [CrossRef]
  25. Hersbach, H.; Bell, B.; Berrisford, P.; Hirahara, S.; Horányi, A.; Muñoz-Sabater, J.; Nicolas, J.; Peubey, C.; Radu, R.; Schepers, D.; et al. Complete ERA5 from 1979: Fifth Generation of ECMWF Atmospheric Reanalyses of the Global Climate. Copernicus Climate Change Service (C3S) Data Store (CDS). 2017. Available online: https://www.ecmwf.int/en/forecasts/datasets/reanalysis-datasets/era5 (accessed on 2 October 2022).
  26. Huffman, G.J.; Stocker, E.; Bolvin, D.; Nelkin, E.; Tan, J. GPM IMERG Final Precipitation L3 Half Hourly 0.1 Degree × 0.1 Degree V06; Goddard Earth Sciences Data and Information Services Center (GES DISC): Greenbelt, MD, USA, 2019. [Google Scholar]
  27. Skamarock, W.C.; Klemp, J.B.; Dudhia, J.; Gill, D.O.; Barker, D.; Duda, M.G.; Huang, X.Y.; Wang, W.; Powers, J.G. A description of the Advanced Research WRF version 3 (No. NCAR/TN-475+STR). Univ. Corp. Atmos. Res. 2008. [Google Scholar] [CrossRef]
  28. Wu, W.-S.; Purser, R.J.; Parrish, D.F. Three-Dimensional Variational Analysis with Spatially Inhomogeneous Covariances. Mon. Weather Rev. 2002, 130, 2905–2916. [Google Scholar] [CrossRef]
  29. Kleist, D.T.; Parrish, D.F.; Derber, J.C.; Treadon, R.; Wu, W.-S.; Lord, S. Introduction of the GSI into the NCEP Global Data Assimilation System. Weather Forecast. 2009, 24, 1691–1705. [Google Scholar] [CrossRef] [Green Version]
  30. Hu, M.; Ge, G.; Zhou, C.; Stark, D.; Shao, H.; Newman, K.; Beck, J.; Zhang, X. Grid-Point Statistical Interpolation (GSI) User’s Guide Version 3.7. Developmental Testbed Center. 2018. 149p. Available online: https://dtcenter.org/community-code/gridpoint-statistical-interpolation-gsi/documentation (accessed on 2 May 2022).
  31. Thompson, G.; Field, P.R.; Rasmussen, R.M.; Hall, W.D. Explicit Forecasts of Winter Precipitation Using an Improved Bulk Microphysics Scheme. Part II: Implementation of a New Snow Parameterization. Mon. Weather Rev. 2008, 136, 5095–5115. [Google Scholar] [CrossRef]
  32. Hong, S.-Y.; Noh, Y.; Dudhia, J. A new vertical diffusion package with an explicit treatment of entrainment processes. Mon. Weather Rev. 2006, 134, 2318–2341. [Google Scholar] [CrossRef] [Green Version]
  33. Iacono, M.J.; Delamere, J.S.; Mlawer, E.J.; Shephard, M.W.; Clough, S.A.; Collins, W.D. Radiative forcing by long–lived greenhouse gases: Calculations with the AER radiative transfer models. J. Geophys. Res. 2008, 113, D13103. [Google Scholar] [CrossRef]
  34. Ek, M.B.; Mitchell, K.E.; Lin, Y.; Rogers, E.; Grunmann, P.; Koren, V.; Gayno, G.; Tarpley, J.D. Implementation of Noah land surface model advances in the National Centers for Environmental Prediction operational mesoscale Eta model. J. Geophys. Res. 2003, 108, 8851. [Google Scholar] [CrossRef]
  35. Weng, F.; Yu, X.; Duan, Y. Advanced Radiative Transfer Modeling System (ARMS): A New-Generation Satellite Observation Operator Developed for Numerical Weather Prediction and Remote Sensing Applications. Adv. Atmos. Sci. 2020, 37, 131–136. [Google Scholar] [CrossRef] [Green Version]
  36. Yin, R.; Han, W.; Gao, Z.; Wang, G. A study on longwave infrared channel selection based on estimates of background errors and observation errors in the detection area of FY-4A. Acta Meteorol. Sin. 2019, 77, 898–910. (In Chinese) [Google Scholar] [CrossRef]
  37. McNally, A.P.; Watts, P.D. A cloud detection algorithm for high-spectral-resolution infrared sounders. Q. J. R. Meteorol. Soc. 2003, 129, 3411–3423. [Google Scholar] [CrossRef]
  38. Zhu, Y.; Derber, J.; Collard, A.; Dee, D.; Treadon, R.; Gayno, G.; Jung, J.A. Enhanced Radiance Bias Correction in the National Centers for Environmental Prediction’s Gridpoint Statistical Interpolation Data Assimilation System. Q. J. R. Meteorol. Soc. 2014, 140, 1479–1492. [Google Scholar] [CrossRef]
  39. Holland, G.J. Tropical cyclone motion: Environmental interaction plus a beta effect. J. Atmos. Sci. 1983, 40, 328–342. [Google Scholar] [CrossRef]
  40. Chan, J.C. The physics of tropical cyclone motion. Annu. Rev. Fluid Mech. 2005, 37, 99–128. [Google Scholar] [CrossRef]
  41. Smith, R.K.; Ulrich, W.; Dietachmayer, G. A numerical study of tropical cyclone motion using a barotropic model. I: The role of vortex asymmetries. Q. J. R. Meteorol. Soc. 1990, 116, 337–362. [Google Scholar] [CrossRef]
  42. Carr, L.E., III.; Elsberry, R.L. Observational evidence for predictions of tropical cyclone propagation relative to environmental steering. J. Atmos. Sci. 1990, 47, 542–546. [Google Scholar] [CrossRef]
  43. Niu, Z.; Zhang, L.; Dong, P.; Weng, F.; Huang, W. Impact of Assimilating FY-3D MWTS-2 Upper Air Sounding Data on Forecasting Typhoon Lekima (2019). Remote Sens. 2021, 13, 1841. [Google Scholar] [CrossRef]
Figure 1. The model domain (the best track for Typhoon In-Fa every 24 h from 16 July 2021 to 31 July 2021). Different line colors represent the intensity evolution of Typhoon In-Fa.
Remotesensing 15 00355 g001
Figure 2. Weighting Function (WF) peaks (blue dotted curve) for FY-4A/GIIRS LWIR channels 1–230; red markers indicate the channels actively assimilated in GSI system.
Remotesensing 15 00355 g002
Figure 3. Spatial distribution of O−B without (left panel) and with (right panel) bias corrections for FY-4A/GIIRS channels 3 (a,b) and 16 (c,d) at 0000 UTC on 20 July 2021. The backgrounds are the brightness temperature of FY-4A/AGRI 10.7 µm IR channel at 0000 UTC on 20 July 2021. The darker the color, the higher the brightness temperature, i.e., it is a clear-sky area, and vice versa. Only GIIRS observations that passed the QC process are shown.
Remotesensing 15 00355 g003
Figure 4. Area-averaged deviations (units: K) between simulated and observed FY-4A/GIIRS brightness temperature before (black) and after (red) GIIRS data assimilation. The x−axis represents the number of FY-4A channels assimilated in data assimilation.
Remotesensing 15 00355 g004
Figure 5. Analysis increments of temperature (units: K, left panel) and specific humidity (units: g/kg, right panel) for EXP_CTRL (a,d) and EXP_GIIRS (b,e) at model level 17 at the initial time of 0000 UTC on 20 July 2021. (c) represents the differences between (a,b), (f) represents the differences between (d,e). This figure shows the analysis increments from EXP_CTRL (upper) and EXP_GIIRS (middle) as well as the difference in analysis increments between these two experiments (bottom).
Remotesensing 15 00355 g005
Figure 6. Mean absolute difference (MAD) between analysis and background fields of vertical profiles of the (a) temperature (units: K), (b) water vapor mixing ratio (units: g/kg), (c) U (units: m/s), and (d) V (units: m/s) wind component of EXP_CTRL (blue) and EXP_GIIRS (red) at the initial time of 0000 UTC on July 20, 2021.
Remotesensing 15 00355 g006
Figure 7. Radius-height cross-section of temperature anomalies (shaded, units: K) from ERA5 reanalysis (a,d), EXP_CTRL (b,e) and EXP_GIIRS (c,f) at 1800 UTC on July 21 (left panel) and 0000 UTC on 22 July 2021 (right panel). The x−axis represents the model grid sizes. The anomaly is calculated based on the average value of the typhoon center within 100 model grids. The model is initiated at 0000 UTC on 20 July 2021.
Remotesensing 15 00355 g007
Figure 8. Radius-height cross-section of tangential wind (units: m/s) from ERA5 reanalysis (a,d), EXP_CTRL (b,e), and EXP_GIIRS (c,f) at 1800 UTC on 21 July (left panel) and 0000 UTC on 22 July 2021 (right panel). The x−axis represents the model grid sizes.
Remotesensing 15 00355 g008
Figure 9. The composite radar reflectivity (shaded, units: DBZ) and surface wind field (vector, units: m/s) forecasts from EXP_CTRL (a,b) and EXP_GIIRS (c,d), and the GPM satellite hourly rainfall rate measurements (e,f, units: mm/h) at 1800 UTC on 21 July (left panel) and 0000 UTC on 22 July 2021 (right panel).
Remotesensing 15 00355 g009
Figure 10. The 6 h accumulated rainfall (units: mm) forecasts from EXP_CTRL (a,b) and EXP_GIIRS (c,d), and the GPM 6 h accumulated rainfall measurements (e,f, units: mm) at 1800 UTC on 21 July (left panel) and 0000 UTC on 22 July 2021 (right panel).
Remotesensing 15 00355 g010
Figure 11. (a) The best track (black) and the track forecasts (b) the central sea level pressure (CSLP, units: hPa) forecasts from EXP_CTRL (blue) and EXP_GIIRS (red) from 0000 UTC on 20 July to 0000 UTC on 23 July 2021, with the model initialization time at 0000 UTC on 20 July 2021. The mean wind flow, wind speed (shaded), and the calculated steering flow (solid circle with black arrow) from the 52 h forecasts of the (c) EXP_CTRL and (d) EXP_GIIRS at 0600 UTC on 22 July 2021.
Remotesensing 15 00355 g011aRemotesensing 15 00355 g011b
Figure 12. The best track (black) and the track forecasts of EXP_CTRL (blue) and EXP_GIIRS (red) with the model initialization times at 1200 UTC (left panel) and 000 UTC (right panel) from 19 to 22 July 2021. (a) model initialized at 1200 UTC on 19 July, (b) model initialized at 0000 UTC on 20 July, (c) model initialized at 1200 UTC on 20 July, (d) model initialized at 0000 UTC on 21 July, (e) model initialized at 1200 UTC on 21 July, (f) model initialized at 0000 UTC on 22 July.
Remotesensing 15 00355 g012
Figure 13. The track forecast errors (units: km) of EXP_CTRL (blue) and EXP_GIIRS (red) with the model initialization times at 1200 UTC (left) and 0000 UTC (right) from 19 to 22 July 2021. The x–axis represents the forecast lead times (units: hour).
Remotesensing 15 00355 g013
Figure 14. (a) Mean track forecast errors (units: km) among six different initial times from Figure 12 and (b) mean track forecast improvement (%) relative to the EXP_CTRL (blue) for EXP_GIIRS (red). The x-axis represents the forecast lead times (units: hour).
Remotesensing 15 00355 g014
Disclaimer/Publisher’s Note: The statements, opinions and data contained in all publications are solely those of the individual author(s) and contributor(s) and not of MDPI and/or the editor(s). MDPI and/or the editor(s) disclaim responsibility for any injury to people or property resulting from any ideas, methods, instructions or products referred to in the content.

